Embed Size (px)
Citation preview

FACULTY OF BIOSCIENCE ENGINEERING
Interuniversity Programme
Master of Science in Food Technology (IUPFOOD)
Effect of structural modification of citrus and sugar beet
pectins on emulsifying capacity
Promoter: Prof. Dr. Ir. Marc Hendrickx Dissertation presented in fulfillment
Co-promoter: Dr. Ir. Stefanie Christiaens of the requirements for the degree of
Department for of Microbial and Molecular Systems Master of Science in Food Technology
Centre for Food and Microbial Technology
Gladys Kontoh
September 2015

This dissertation is part of the examination and has not been corrected for eventual errors
after presentation. Use as a reference is only permitted after consulting the promoter,
stated on the front page.

FACULTY OF BIOSCIENCE ENGINEERING
Interuniversity Programme
Master of Science in Food Technology (IUPFOOD)
Effect of structural modification of citrus and sugar beet
pectins on emulsifying capacity
Promoter: Prof. Dr. Ir. Marc Hendrickx Dissertation presented in fulfillment
Co-promoter: Dr. Ir. Stefanie Christiaens of the requirements for the degree of
Department for of Microbial and Molecular Systems Master of Science in Food Technology
Centre for Food and Microbial Technology
Gladys Kontoh
September 2015

i
ACKNOWLEDGEMENT
First and foremost, I would like to thank the Almighty God for his immerse grace, mercy and
protection throughout my research and Masters programme at large.
I would like to express my profound gratitude to my promoter, Prof. Dr. Ir. Marc Hendrickx
for his counsel, encouragement and guidance throughout the period of my research. In
addition I am thankful for the resources and time he invested into this research.
I would also like to thank my co-promoter, Dr. Ir. Stefanie Christiaens deeply for her
encouragement, advice and guidance during the research.
To my daily supervisor Clare Kyomugasho I express my heartfelt gratitude for her patience,
time, encouragement, advice and guidance throughout my research work. From her selfless
dedication to work, I profoundly learnt more on the need be dedicated in all that one carries
out in order to be very successful.
I am extremely grateful to all the staff of the Laboratory of Food Technology for the daily
support and encouragement. I also want to thank the Laboratory of Soft Matter, Rheology
and Technology (SMaRT) for the assistance with the viscosity analysis.
I would like to thank VLIR-UOS for the scholarship granted to me to pursue this Masters
programme.
Lastly, I want to thank my classmates, the Ghanaian students’ community in KU Leuven and
UGent, my family and friends for the love, support and encouragement throughout the
successful completion of my research and Masters programme.

ii
ABSTRACT
Pectin is a functional food ingredient extracted from the cell wall of several fruits and
vegetables and is used to improve the rheology of food products. Pectin, particularly from
sugar beet has been reported to possess emulsifying properties mainly due to its high
protein and acetylation content. However, due to its poor gelling ability, this pectin has not
been commercialized. On the other hand, the emulsifying potential of the commercialized
pectins such as citrus and apple pectin has not been extensively explored. This research
therefore is aimed at exploring the emulsifying potential of structurally modified commercial
citrus pectin in comparison to structurally modified sugar beet pectin.
To achieve this objective, commercial citrus pectin (CP) and sugar beet pectin (SBP) were
structurally modified by the action of carrot pectin methylesterase. Characterization of the
structure of the resulting pectin revealed that four levels of degree of methylesterification
(DM) of pectin including 16%, 35%, 65% and 95%, and two levels of DM (35% and 60%) were
obtained in CP and SBP, respectively. SBP exhibited a lower galacturonic acid content, higher
content of pectin-related neutral sugars, higher molar mass, higher amount of ferulic acid,
higher acetylation and protein content compared to CP. Exploring the flow behavior
revealed that the apparent viscosity of the pectin solutions increased with DM and pectin
concentration but decreased with pH. Furthermore, CP of low DM exhibited a shear thinning
behavior. Microscopy and particle size distribution studies revealed that CP of high DM and
SBP were better adsorbed onto the oil droplet surfaces compared to the low DM CP
samples. During storage of the emulsions, in general stability of both CP and SBP increased
with increasing pectin concentration and homogenization pressure but decreased with
increasing storage temperature, pH and DM of pectin. SBP emulsions were more stable than
CP for a given DM. For CP, low DM samples were more stable and probably stability of CP
was more dependent on the pectin concentration as well as the viscosity of solutions. For
pectin-protein emulsions explored in this study, the added protein did not improve stability.
In general, SBP samples portrayed better emulsifying and stabilizing capacity than citrus
pectin samples and this may be attributed to their structural differences.

iii
TABLE OF CONTENTS
ACKNOWLEDGEMENT ............................................................................................................................... i
ABSTRACT ................................................................................................................................................. ii
TABLE OF CONTENTS ............................................................................................................................... iii
LIST OF FIGURES ...................................................................................................................................... vi
LIST OF TABLES ...................................................................................................................................... viii
LIST OF ABBREVIATIONS AND SYMBOLS ................................................................................................. ix
GENERAL INTRODUCTION ....................................................................................................................... xi
CHAPTER 1 ............................................................................................................................................... 1
1 PECTIN ............................................................................................................................................. 1
1.1 Pectin structure ....................................................................................................................... 1
1.1.1 Homogalacturonan .......................................................................................................... 2
1.1.2 Rhamnogalacturonan I .................................................................................................... 3
1.1.3 Rhamnogalacturonan II ................................................................................................... 5
1.1.4 Xylogalacturonan ............................................................................................................. 6
1.1.4. Arabinogalacturonan I and II ........................................................................................... 7
1.2 Macrostructure of pectin ........................................................................................................ 7
1.3 Pectin interactions ................................................................................................................ 10
1.3.1 Pectin-pectin interactions ............................................................................................. 10
1.3.2 Pectin-protein interactions ........................................................................................... 10
1.3.3 Electrostatic interactions of pectin ............................................................................... 11
1.3.4 Pectin-oil interactions ................................................................................................... 12
CHAPTER 2 ............................................................................................................................................. 13
2 PECTIN MODIFICATION ................................................................................................................. 13
2.1 Enzymatic modification ......................................................................................................... 13
2.1.1 Pectin methylesterase ................................................................................................... 14
2.1.2 Polygalacturonase ......................................................................................................... 16
2.1.3 Acetylesterase ............................................................................................................... 17
2.1.4 Side chain modifying enzymes ...................................................................................... 18

iv
2.2 Chemical modification ........................................................................................................... 19
2.2.1 Saponification ................................................................................................................ 19
2.2.2 β-elimination ................................................................................................................. 20
2.2.3 Acid hydrolysis ............................................................................................................... 20
CHAPTER 3 ............................................................................................................................................. 22
3 PECTIN FUNCTIONALITY ................................................................................................................ 22
3.1 Emulsifying capacity .............................................................................................................. 22
3.2 Stabilizing and thickening capacity ....................................................................................... 25
3.3 Gelation ................................................................................................................................. 26
CHAPTER 4 ............................................................................................................................................. 29
4 MATERIALS AND METHODS .......................................................................................................... 29
4.1 Overview of the experimental setup .................................................................................... 29
4.2 Modification of pectin by the action of PME ........................................................................ 31
4.2.1 Extraction and purification of carrot PME..................................................................... 31
4.2.2 PME activity measurement ........................................................................................... 32
4.2.3 Demethylesterification of pectin .................................................................................. 33
4.3 Characterization of commercial citrus and sugar beet pectin. ............................................. 33
4.3.1 Determination of the degree of methylesterification ................................................... 34
4.4 Determination of emulsifying/stabilizing properties of citrus and sugar beet pectin .......... 35
4.4.1 Microscopy .................................................................................................................... 35
4.4.2 Viscosity determination ................................................................................................ 36
4.4.3 Ultra-high pressure homogenization of emulsions ....................................................... 37
4.4.4 Measurement of particle size distribution .................................................................... 38
CHAPTER 5 ............................................................................................................................................. 41
5 RESULTS AND DISCUSSION ............................................................................................................ 41
5.1 Pectin characterization.......................................................................................................... 41
5.1.1 Evaluation of degree of methylesterification ................................................................ 41
5.1.2 Characterization of other pectin structural properties ................................................. 43
5.2 Viscosity of pectin solutions .................................................................................................. 46

v
5.2.1 Effect of DM and pH on the viscosity of pectin solutions ............................................. 46
5.2.2 Effect of pectin concentration on the viscosity of pectin solutions .............................. 48
5.2.3 Effect of DM and pH on the viscous behavior of pectin solutions at varying shear rates
48
5.2.4 Impact of pectin concentration on the viscous behavior of pectin solutions at varying
shear rates ..................................................................................................................................... 49
5.3 Microscopy and particle size distribution of the ultra-turaxed emulsions ........................... 50
5.3.1 Adsorption of pectin onto the oil droplet surface (emulsifying potential of pectin) .... 51
5.4 Emulsion stability study ........................................................................................................ 58
5.4.1 Effect of DM and pH on stability of ultra-high pressure homogenized emulsions before
and after storage ........................................................................................................................... 59
5.4.2 Effect of pectin concentration on stability of ultra-high pressure homogenized
emulsion before and after storage ............................................................................................... 66
5.4.3 Effect of pressure on stability of ultra-high pressure homogenized emulsions before
and after storage ........................................................................................................................... 71
5.4.4 Effect of storage temperature on stability of ultra-high pressure homogenized
emulsions ...................................................................................................................................... 74
6 GENERAL CONCLUSION ................................................................................................................. 78
REFERENCES .............................................................................................................................................. i

vi
LIST OF FIGURES
Figure 1.1: The primary structure of homogalacturonan methylesterified at C-6 and O-acetylated at
the O-2 or O-3. ........................................................................................................................................ 2
Figure 1.2: A schematic representation of the structural features of RG-I. (a) Linear galactan, (b)
arabinogalactan I, (c) branched arabinan and (d) hypothesized branched arabinan with galactan
decorations.............................................................................................................................................. 4
Figure 1.3: Two monomeric units of RG-II cross linked by a borate 1:2 diol ester. The ‘R’ represents
the oligoglucose linked to 3’ of the apiose residues. .............................................................................. 6
Figure 1.4: Schematic representation of (A) the traditional model, (B) the RG-I backbone model, and
(C) the “living thing-like” model ............................................................................................................. 9
Figure 1.5: A schematic representation of calcium-pectin cross linkages forming an “egg box
structure”. ............................................................................................................................................. 12
Figure 2.1: A schematic representation of the chemical and enzymatic conversion reactions of pectin
and possible routes for tailored quality parameters. ........................................................................... 21
Figure 3.1: A schematic representation of emulsifying mechanisms. .................................................. 24
Figure 3.2: A schematic view of the gelation of LM pectin by calcium ions. ........................................ 27
Figure 4.1: A schematic overview of experimental setup. .................................................................... 30
Figure 4.2: A Titrino (718 STAT model). ................................................................................................ 32
Figure 4.3: Fourier transform infrared spectrophotometer. ................................................................ 34
Figure 4.4: An FT-IR spectrum of citrus pectin. ..................................................................................... 35
Figure 4.5: Light and fluorescence microscope equipped with Olympus XC 50 digital camera and
epifluorescence illumination. ................................................................................................................ 36
Figure 4.6: A stress-controlled rheometer. ........................................................................................... 37
Figure 4.7: A Laser diffraction particle size analyzer (LS). ..................................................................... 39
Figure 4.8: A schematic overview of the various emulsifying capacity study plan. .............................. 40
Figure 5.1: Estimated DM (%) of citrus and sugar beet pectin after different incubation periods. Error
bars represent standard deviations of differently incubated batches. ................................................ 42
Figure 5.2: Viscosity (log) of the pectin solutions at different pHs at varying shear rates (log). .......... 49
Figure 5.3: Viscosity (log) of solutions with different pectin concentrations at varying shear rates
(log). ...................................................................................................................................................... 50
Figure 5.4: Fluorescence microscopy images of citrus and sugar beet pectin emulsions at pH 4.2 and
pH 6.2. Scale bar = 500 µm.................................................................................................................... 53

vii
Figure 5.5: PSD of citrus and sugar beet pectin emulsions of 0.5% pectin at (A) pH 4.2 and (B) pH 6.2.
............................................................................................................................................................... 54
Figure 5.6: Fluorescence microscopy images of citrus and sugar beet pectin emulsions at different
pectin concentrations. Scale bar = 500 µm. .......................................................................................... 55
Figure 5.7: PSD plots of citrus and sugar beet pectin emulsions at pH 4.2 with (A) 0.1 % and (B) 1%
pectin concentrations. .......................................................................................................................... 56
Figure 5.8:Particle size distribution curves of citrus and sugar beet pectin-emulsions at different pHs
before storage. Homogenization pressure = 250 bar. .......................................................................... 60
Figure 5.9: (A) Emulsion stability study images of homogenized pectin emulsions (0.5% pectin) at
different pHs after two weeks of storage at 35 °C. Homogenization pressure = 250 bar. ................... 61
Figure 5.10: Particle size distribution curves of citrus and sugar beet pectin-protein emulsions at
different pHs before storage. Homogenization pressure = 250 bar. .................................................... 63
Figure 5.11:(A) Emulsion stability images of homogenized pectin and pectin-protein emulsions at
different pHs after two weeks of storage at 35 °C. Homogenization pressure = 250 bar. ................... 65
Figure 5.12: Particle size distribution curves of citrus and sugar beet pectin emulsions at different
pectin concentrations before storage. Homogenization pressure = 500 bar. ...................................... 67
Figure 5.13: (A) Emulsion stability study images of homogenized pectin emulsions at different pectin
concentrations after two weeks of storage at 35 °C. Homogenization pressure = 500 bar. ................ 68
Figure 5.14: Particle size distribution plots of pectin-protein emulsions of citrus and sugar beet pectin
of 0.1% pectin and 0.1% protein concentrations at pH of 3.0 before and after storage.
Homogenization pressure = 500 bar. .................................................................................................... 70
Figure 5.15: Particle size distribution plots of the pectin emulsions of citrus and sugar beet pectin at
different homogenization pressures for a given pH and pectin concentration before storage. .......... 71
Figure 5.16: (A) Emulsion stability study images (after two weeks) of pectin emulsions homogenized
at different pressures and stored at 35 °C. ........................................................................................... 72
Figure 5.17: Particle size distribution plots of the pectin-protein emulsions of citrus and sugar beet
pectin at different homogenization pressures for a given pH and pectin concentration before storage.
............................................................................................................................................................... 74
Figure 5.18: (A) Emulsion stability study images of homogenized pectin-emulsions of citrus and sugar
beet pectin at different pHs after two weeks of storage at 4 °C and 35 °C. Homogenization pressure =
500 bar. ................................................................................................................................................. 75

viii
LIST OF TABLES
Table 5.1: A summary of the results of characterization of pectin structural elements. ..................... 43
Table 5.2: Apparent viscosity of citrus and sugar beet pectin solutions at a constant shear rate (5 s-1).
............................................................................................................................................................... 47

ix
LIST OF ABBREVIATIONS AND SYMBOLS Ara arabinose
BSA bovine serum albumin
CP citrus pectin
Da Dalton
DAc degree of acetylation
DM degree of methylesterification
FT-IR Fourier transform infrared spectroscopy
g gram
GalA galacturonic acid
HG homogalacturonan
HM high methylesterified
HP high-pressure
h hour
I intensity
kDa kilo Dalton
LM low methylesterified
M molarity
mg milligram
min minute
mL milliliter
mm millimeter
MM molar mass
MWCO molecular weight cut-off
Nsm-2 Newton second per meter square
PG polygalacturonase
pH hydrogen potential
pI isoelectric point

x
PIDS polarization intensity differential scattering
pKa acid dissociation constant
PME pectin methylesterase
ppm parts per million
PSD particle size distribution
RG-I rhamnogalacturonan-I
RG-II rhamnogalacturonan-II
Rha rhamnose
rpm revolution per minute
s second
SBP sugar beet pectin
w week
w/v weight per volume
XGA xylogalacturonan
°C degrees celsius
µL microliter
µm micrometer
α-Afase α-arabinofuranosidase
β-Gal β-galactosidase

xi
GENERAL INTRODUCTION
Over the years, food processors and researchers have been exploring the use of alternative
food processing techniques as well as the use of natural additives to improve the structural
and functional properties of fruit and vegetable-based products. As such, natural polymers
such as pectin are extracted from the cell wall of citrus and apple fruit for use in several
applications including gelling and stabilization. Some researchers have also pointed to the
potential commercial use of pectin in emulsification applications for texture-improvement.
In emulsion applications, synthetic emulsifiers and protein are commonly used. However,
with increasing demand for healthy and safe foods, natural polymers (such as pectin) could
be explored as potential emulsifiers to replace the synthetic ones.
It is reported that pectin has agained attention for its potential use as an emulsifier due to its
protein and acetyl content. The emulsifying capacity of pectin is believed to be attributed to
the presence of residual protein moieties that form complexes with the pectin within food
matrices such as oil-pectin-water emulsions. The complexes formed lower the surface
tension of the adsorbed oil droplets as well as increase the repulsive forces among the oil
droplets leading to enhanced emulsification (Zaidel et al, 2013; Leroux et al, 2003). In this
context, only sugar beet pectin has been explored due to its protein moieties as well as high
degree of acetylation. However, this pectin still receives less commercialization due to its
poor gelling ability. Therefore, a few research studies have proposed the potential use of
commercial pectins (for example citrus pectin) for emulsification. Although emulsification is
promoted by high DAc, protein moieties, high molar mass and high neutral sugar content,
studies by Akhtar et al. (2002) proposed that citrus pectin with a low acetyl content, a low
molecular weight of about 60 - 70 kgmol-1 and high DM exhibits good emulsifying properties
(Leroux et al., 2003). As such, the emulsification was attributed to the presence of methyl
groups. Furthermore, Schmidt et al. (2015) and Verrijssen et al. (2014) have also reported
that DM influences the emulsifying potential of pectin.
This research was therefore aimed at investigating the effect of pectin structure particularly,
the degree of methylesterification (DM) of pectin from different sources on the emulsifying

xii
and emulsion stabilizing capacity of pectin. To achieve this goal, watery solutions of citrus
pectin as well as sugar beet pectin were incubated for predetermined periods in presence of
carrot pectin methylesterase (carrot PME) to obtain pectin with different DMs. The resulting
pectin samples were characterized for their DM as well as other structural properties.
Furthermore, the viscous behavoir of the watery pectin solutions was established. Oil-pectin
emulsions were then prepared using watery-pectin solutions at different pHs by (ultra-
turaxing) ultra-high pressure homogenization. In addition, pectin-protein emulsions were
included. Selected emulsion properties were examined before and during storage in order to
establish the emulsifying as well as the emulsion stabilizing potential of the pectin therein.
Fluorescence microscopy performed in presence of flourescently labelled pectin allowed for
visualization of the adsorbing property of the pectin onto oil droplets. The microscopy
results were complimented by examination of the particle size distribution (PSD). The ultra-
high pressure homogenized emulsions were stored at different temperatures for up to eight
weeks to establish the emulsion stabilizing potential of the pectin. More insight into the
emulsifying and stabilizing capacity of the pectin was achieved by obtaining images of the
stored emulsions as well as measuring their PSD during storage.
This research is divided into six chapters. The first three chapters focus on the literature
review of the subject of study. Chapter 1 gives an overview of the pectin structure, its
macromolecular structure as well as various interactions of pectin. Chapter 2 focuses on the
possible pectin modifications during processing of plant-based food products. In Chapter 3,
the functionalities of pectin as a food ingredient are discussed. Chapter 4 emphasizes the
materials and methods used in this research while in Chapter 5, the results are presented
and discussed. Finally, the last chapter (Chapter 6) relays the general conclusions of the
study as well as recommendations for future work.
1
CHAPTER 1
1 PECTIN
Pectin is a family of complex heterogeneous polysaccharides which form the major
component of plant cell walls (Leroux et al., 2003; Willats et al., 2006). In dicotyledonous
plants pectin constitutes about 35% of the primary cell walls with cellulose, hemicellulose
and protein forming approximately 30%, 30% and 5%, respectively (Thakur et al., 1997). As
fruits and vegetables comprise mainly of parenchyma cells, pectin is the predominant
polysaccharide present (Van Buggenhout et al., 2009). This polysaccharide can be
commercially extracted from plant materials including citrus peel, apple pomace and sugar
beet pulp for use in several food applications (Thakur et al., 1997). Particularly, pectin is
widely used as a food additive in gelling, stabilizing and emulsifying applications. Extracted
pectin is also used in other industries including the pharmaceutical industry in the
manufacture of membranes for ultracentrifugation and electrodialysis, in making
biodegradable drinking straws and in waste management (Thakur et al., 1997). Furthermore,
pectin possesses several health benefits such as acting as dietary fiber as well as lowering
cholesterol and serum glucose levels. It is also believed that pectin possesses anti-cancer
activities in addition to being used in the removal of toxic solid waste such as strontium and
lead from the human body (Seymour and Knox, 2002; Willats et al., 2006; Fuchs, 2004;
Walter, 1991).
Therefore, with increasing demand for safe, healthy and convenient foods, functional
ingredients such as pectin have become vital in ensuring customer satisfaction (Willats et al.,
2006). As such, researchers are more and more attempting to gain greater insight into pectin
structure as well as its functionality.
1.1 Pectin structure
Pectin consists primarily of D-galacturonic acid residues which are linked through α-(1-4)
glycosidic linkages and usually comprise ≥ 65% galacturonic acid (GalA) residues (Walter,
1991; Willats et al., 2006). Pectin structure is composed of three major polysaccharides;

2
homogalacturonan (HG), rhamnogalacturonan I (RG-I) and rhamnogalacturonan II (RG-II).
These polysaccharides are believed to be covalently linked together forming the complex
pectin macrostructure. Other pectic polysaccharides including, xylogalacturonan (XGA),
arabinogalactan I (AG-I) and arabinogalactan II (AG-II) may be present (Voragen et al., 2009).
1.1.1 Homogalacturonan
Homogalacturonan is the most abundant pectic polysaccharide constituting approximately
60% of the total pectin in plant cell walls. Homogalacturonan (HG) is made up of a backbone
of α-1-4-linked GalA residues and the number of GalA residues constituting this HG
backbone may vary from one source to another (Voragen et al., 2009). For instance, in citrus,
sugar beet and apple pectin, the HG backbone comprises of 72 to 100% GalA residues
(Voragen et al., 2009). HG may be methylesterified at C-6 and/or O-acetylated at the O-2
and/or O-3 as shown in Figure 1.1.
Figure 1.1: The primary structure of homogalacturonan methylesterified at C-6 and O-acetylated at
the O-2 or O-3 (Ridley et al., 2001).

3
The degree of methylesterification (DM) indicates the extent to which the carboxyl groups
present on HG exist as methyl esters while the degree of acetylation (DAc) shows the extent
to which GalA residues are substituted with acetic acid at the O-2 and/ O-3 positions. Both
the DM and the DAc of pectin may vary depending on the method of extraction and the type
of plant source (Leroux et al., 2003; Thakur et al., 1997; Voragen et al., 2009). For example,
the DM of extracted citrus pectin and sugar beet pectin may be as high as 72% and 54%,
respectively. On the other hand, the DAc of citrus and sugar beet pectin varies between 1.4-
1.6% and 30-35%, respectively (Leroux et al., 2003; Voragen et al., 2003; Walter, 1991).
Based on the DM, pectin is classified into two groups; high methylesterified pectin (HM)
which possesses a DM ≥ 50% and low methylesterified (LM) pectin which exhibits a DM ≤
50%. In the food industry particularly in gelling applications, both HM and LM pectins are
explored. HM pectins are applied in gelling of food systems in the presence of sugars and
acids whereas LM pectins form gels in the presence of divalent ions such as calcium
(Vithanage et al., 2010; Walter, 1991). In addition to DM, the distribution of methyl esters on
the GalA residues is important especially in gelling applications. The distribution of methyl
esters on GalA residues of HG may vary both intra-molecularly (within a pectin molecule)
and inter-molecularly (within various pectin molecules). Intra-molecularly, methyl ester
groups can be distributed in a random or block wise manner. In random distribution the
methyl esters are spread out over the pectin backbone while in the block wise distribution
non methylesterified GalA residues are interspersed with segments that may be completely
methylesterified (Seymour and Knox, 2002). For gelling applications, blocks of more than ten
non methylesterified GalA residues yield pectin that is more sensitivity to Ca2+ cross linking,
which is important in gelation of pectin-based products (Voragen et al., 2009).
1.1.2 Rhamnogalacturonan I
Rhamnogalacturonan I is made up of repeating units of α-(1→2)-linked rhamnose and α-
(1→4)-linked GalA residues. The number of repeating disaccharide units may vary from one
source to another. In citrus pectin, the homogeneous backbone of Rhamnogalacturonan I
(RG-I) has been found to comprise of about 15 to 40 repeating units of [→2] –α-L-Rha-(1-4)-

4
α-D-GalA-(1→) compared to approximately 80 repeating units in sugar beet pectin (Yapo,
2011a). RG-I constitutes approximately 23% of the pectic polysaccharides and has an
average molecular weight of about 200 kDa (Mcneil et al., 1980; Yapo, 2011a).
The rhamnose residues of RG-I backbone are substituted at the O-4 position with polymeric
side chains of mainly galactans and arabinans as shown in Figure 1.2. The arabinans mostly
form short helical chains of 5-linked arabinofuranosyl (Araf) units with their degree of
branching depending on the source and method of isolation of the RG-I. Arabinogalactan I
(AG-I) and Arabinogalactan II (AG-II) are also reported as common polymeric side chains of
RG-I (Coenen et al., 2007; Seymour and Knox, 2002; Yapo, 2011b).
Figure 1.2: A schematic representation of the structural features of RG-I. (a) Linear galactan, (b)
arabinogalactan I, (c) branched arabinan and (d) hypothesized branched arabinan with galactan
decorations (ØBro et al., 2004).
These side chains are believed to play an important role in the texture of fruits and
vegetables. For instance, during ripening the degradation of side chains arabinan and
galactan that are covalently joined to RG-I is believed to influence firmness leading to
softening of the plant tissues (Coenen et al., 2007; Pedrolli et al., 2009; Yapo, 2011a). During

5
processing the loss of side chains due to rupture of fruits and vegetables may increase the
solubility of the pectin (Alistair et al., 2014).
The GalA residues of RG-I are generally not methylesterified because RG-I is not degraded by
β-elimination. Nonetheless, it has been reported that RG-I fractions of flax contain
approximately 40% methyl esters (Voragen et al., 2009). On the other hand, the GalA
residues of the RG-I backbone can be acetylated at the O-2 and /or O-3 positions (Yapo,
2011a).
1.1.3 Rhamnogalacturonan II
Rhamnogalacturonan II is the most complex and conserved pectic polysaccharide structure
constituting about 10% of the pectin polymer (Mohnen, 2008). This polysaccharide is made
up of (1→4)-linked-α-D-GalA units with four well-defined side chains. Two structurally
distinct disaccharides as well as two structurally distinct oligosaccharides at the penultimate
and the non-reducing end of the GalA backbone, respectively (Yapo, 2011c). These side
chains have rare sugar residues such as apiose, aceric acid, 3-deoxy-manno-2-octulosonic
acid (KDO) and 3-deoxy-lyxo-2-heptulosaric acid (DHA) (Seymour and Knox, 2002; Voragen et
al., 2009). The (1→4)-linked-α-D-GalA units of rhamnogalacturonan II (RG-II) may be
methylesterified at the C-6 position. RG-II can also complex with boron to form 1:2 borate-
diol ester between OH-2 and OH-3 of apiofuran residues in each RG-II unit as shown in
Figure 1.3 (Ridley et al., 2001; Voragen et al., 2009). This complex formation occurs in muro
and results in formation of a dimer. Borate cross linked RG-II dimers have been observed in
some plants including sugar beet pulp and radish roots (Ridley et al., 2001; Yapo, 2011c).
Formation of the 1:2 borate-diol ester dimer is promoted by the presence of di- and tri-
valent cations such as Ca2+, Zn2+, Fe2+ and Fe3+ but is inhibited at pH below 5.0 (Dronnet et
al., 1996).

6
Figure 1.3: Two monomeric units of RG-II cross linked by a borate 1:2 diol ester. The ‘R’ represents
the oligoglucose linked to 3’ of the apiose residues (Ridley et al., 2001).
The role of the borate cross linkage may be observed during changes in normal plant growth
and development especially when the plant is deficient of boric acid. Boron-deficient plants
are observed to have highly leaky plasma membrane, dying out of growing tips as well as
high levels of toxic O2 due to impairments of major defense systems of the plants (Cakmak
and Romheld, 1997).
1.1.4 Xylogalacturonan
Xylogalacturonan is a pectic polysaccharide formed when HG is substituted with β-D-xylose -
(1→3) single units linked to the O-3 position of the GalA moieties (Voragen et al., 2009).
Depending on the plant source about 25 to 75% of the GalA moieties may be substituted
with xylose, with the residues possibly being methylesterified (Voragen et al., 2009; Yapo,
2011b). Xylogalacturonan (XGA) is commonly found in the storage tissues of reproductive
organs but has also been identified in non-reproductive organs such as roots, stems and
leaves (Zandleven et al., 2007). Sources of XGA include citrus pectin, apple pectin and red
bean cotyledons (Yapo, 2011b).

7
1.1.4. Arabinogalacturonan I and II
Arabinogalacturonan I and II are substituted pectic polysaccharides of mainly RG-I with
average lengths ranging from 45 to 50 residues (Voragen et al., 2003).
Arabinogalacturonan I is made up of 1,4 linked β-D-GalA backbone with α-L-Arabinofuranose
(Araf) residues that may be attached to O-3 position of the galactose residues.
Arabinogalacturonan I (AG-I) forms part of the ‘hairy’ regions of the unsubstituted pectic
polysaccharide, HG. The AG-I backbone may be terminated at the non reducing end resulting
in α-L-Ara (1→4) linkage (Voragen et al., 2009).
Arabinogalacturonan II on the other hand comprises of a 1,3 linked β-D-GalA backbone with
short side chains of α-L-Araf-(1→6)-[ β-D-GalA (1→6)]n (n = 1,2, or 3). The side chains of α-L-
Araf-(1→6) can be substituted with α-L-Araf-(1→3) residues (Vincken et al., 2003; Voragen,
et al., 2009). This substituted polysaccharide is believed to be mainly associated with
proteins referred to as the arabinogalactan proteins (AGPs). The protein part is rich in amino
acids proline/hydroxyproline, alanine, serine and threonine (Voragen et al., 2009).
1.2 Macrostructure of pectin
Owing to the complexity of the pectin macrostructure, several models have been proposed
to define how pectic components are linked. Two generally accepted models and a new
hypothetical model have been defined. The first two models are the traditional model
proposed by De Vries and the RG-I backbone model (Coenen et al., 2007; Ridley et al., 2001;
Voragen et al., 2009). In these models, the three major pectic polymers; HG, RG-I and RG-II
are believed to be covalently inter-linked to each other to form the pectin complex
macrostructure (Voragen et al., 2009). However, due to some limitations of the
aforementioned models a new hypothetical model, the “living thing-like” model was
proposed by Yapo, (2011b). In this model, the previous models are both accounted for. First,
the macromolecular pectin-complex structure will be addressed by discussing the key
models and then the new hypothetical model will be explained.

8
The traditional model suggests alternating smooth (HG) and hairy (RG-I and RG-II) regions
that are joined end to end as shown in Figure 1.4-A. This model is suggested as the structural
model of cell wall pectin regardless of the pectin source (Voragen et al., 2009; Yapo, 2011a).
The RG-I backbone model proposed by Vincken et al. (2003) on the other hand comprises HG
and XGA as side chains of the RG-I backbone as shown in Figure 1.4-B (Ridley et al., 2001). In
this model, the HG may be linked to the rhamnose residues of RG-I (Voragen et al., 2009). As
such, the macromolecular structure is completely of a “hairy-type” with the side chains
drawn perpendicularly to the RG-I backbone in different directions. In contrast to the
traditional model, this model solely has the RG-I as the backbone of the pectin polymer and
RG-II present is linked to the HG side chains (Yapo, 2011b).
Finally, reports of the structural arrangements of pectin being more complex than the two
aforementioned models allowed the proposal of a new model (Yapo, 2011b). The “living
thing-like” model proposed by Yapo, (2011b) suggests that the pectin macrostructure
backbone is composed of two linear HG polymers and one RG-I core having both XGA
polymers and neutral sugars such as arabinan, galactan and arabinogalactan as side chains
as shown in Figure 1.4-C. In this “living thing-like” model, the HG blocks may be oriented
horizontally or vertically depending on the resilience of their linkages ((1→2)-linked- α-L-Rha
units) to the RG-I core. Blocks of RG-II are linearly connected to the HG blocks. The linkage
between HG blocks and RG-I blocks forms the roots of the complex pectin macrostructure
(Yapo, 2011b).

9
Figure 1.4: Schematic representation of (A) the traditional model, (B) the RG-I backbone model, and
(C) the “living thing-like” model (Willats et al., 2006; Yapo, 2011b).
C

10
1.3 Pectin interactions
Being the major component of the middle lamella of plant cell walls, pectin influences the
texture of plant tissue. This may be attributed to the visco-elastic and cross linked network
properties of pectin (Thakur et al., 1997; Walter, 1991). As such, the use of pectin in various
plant-based products as a stabilizer and/or emulsifier is mainly due to its ability to interact
internally as well as with other food components. These interactions may include pectin-
pectin, pectin-protein, electrostatic interactions of pectin and pectin-oil interactions.
1.3.1 Pectin-pectin interactions
Pectin-pectin interactions involve the complexation of individual structural elements
through covalent linkages as observed in the macrostructure of pectin. Pectin-pectin
interactions are also believed to be associated with hydrogen bonding or hydrophobic
interactions. In hydrogen bonding, the existence of oxygen and hydroxyl functional groups
on the pectin chain increases the possibility of bonding to take place on the chain (Turgeon
et al., 2007). In addition, the methyl ester groups on the pectin chain influence the
interfacial forces of attraction between pectin molecules (Walter 1991; Turgeon et al., 2007).
Pectin-pectin interactions are explored in the food industry for improving the stability and
texture of fruit and vegetable products.
1.3.2 Pectin-protein interactions
Pectin is also believed to interact with protein through pectin-protein interactions. In intact
tissues it is suggested that proteins such as hydroxyproline-rich (HRGRs) proteins in the
primary cell wall are ionically bound to pectin (Leroux et al., 2003; Neirynck et al., 2007).
These proteins constitute about 10 to 20% of dry weight of plant cell walls and are made up
of three major groups; proline-rich proteins (PRPs), arabinogalactan-proteins (AGPs) and
extensins (Kieliszewski and Shpak, 2001). Pectin-protein interactions within the plant cell
walls play vital roles including protection against pathogens, cell maturation and cell
expansion. On the other hand, within a food matrix such as fruit juice, pectin-protein
interactions are believed to occur through electrostatic linkages and are largely influenced
by pH (Dickinson, 2003). If electrostatic forces of attraction between the negatively charged

11
pectin and positively charged protein arise below the isoelectric point (pI) of protein,
protein-pectin complexes are formed. The isoelectric point is the pH at which the protein
carries no net charge. Such complexes greatly influence the stability and texture of foods
(Dickson and Bergenstahl, 2004; Neirynck et al., 2007; Turgeon et al., 2007). However, when
both protein and pectin carry the same charge thermodynamic incompatibility may occur
leading to phase separation between the two components (Neirynck et al., 2007). Therefore,
in processing these mechanisms are explored to promote or inhibit pectin-protein
interactions in order to attain desired attributes.
Pectin-protein interactions may for instance be explored in emulsion stabilization where
presence of low protein-pectin ratios can stabilize the emulsion against oil coalescence by
coating the entire oil droplet surface. This results in formation of a thick macromolecular
multilayer which provides both electrostatic and steric effect on the emulsion stability
(Dickinson and James, 2000; Gancz et al., 2005). In addition, the pectin modifies the physical
properties of the continuous phase by increasing the viscosity which in turn extends the
shelf life of the emulsion. Actions of both protein and pectin have been reported to prevent
flocculation, coalescence and creaming (Gancz et al., 2005).
1.3.3 Electrostatic interactions of pectin
Pectin also interacts with other structural elements such calcium ions through electrostatic
interactions which plays a vital role in texture determination. Ions such as Ca2+ tend to form
insoluble ionic cross linkages by bridging between two carboxyl groups of two adjacent
chains of pectin (Thakur et al., 1997; Walter, 1991) to form what is known as “an egg box”
structure (shown in Figure 1.5). This calcium-pectin cross linking is important in preventing
loss of texture in fruits and vegetables as well as in gelation and the ability of pectin to form
such cross linkages influences its use in food applications. In gelling applications, LM pectins
gel by cross linking divalent ions such as calcium ions and are mainly used to produce low
calorie jellies while HM pectins gel in the presence of sugars are used to produce mainly
fruits preserves (Walter, 1991).

12
Figure 1.5: A schematic representation of calcium-pectin cross linkages forming an “egg box
structure” (Voragen et al., 2009).
1.3.4 Pectin-oil interactions
In food processing, interactions of pectin with oil may be important especially in emulsion
systems. In oil-in-water emulsions where oil is the discontinuous phase and water is the
continuous phase, complexes may arise due to attractive forces imparting either a positive
or negative impact. The presence of pectin in these emulsions below the isoelectric point of
soybean oil (pH ≤ 4) may result in pectin molecules adsorbing to the surfaces of the cationic
oil droplets until the droplets become saturated with pectin (Iwanaga et al., 2008). The
complete adsorption by pectin increases the electrostatic and steric repulsion between the
oil droplets as well as decreases the weak attractive forces such as Van der Waals (Gancz et
al., 2005; Iwanaga et al., 2008). In addition, pH and ionic strength of pectin-oil/water
emulsions are believed to influence the magnitude of electrical charges on the oil droplets
and pectin. As a result, the level of adsorption by the pectin greatly influenced by these two
factors (Guzey and McClements, 2007).
Generally, extrinsic factors such as pH, temperature and salt concentration may have a
significant influence on all the above mentioned interactions (Gharsallaoui et al., 2010;
Turgeon et al., 2007).

13
CHAPTER 2
2 PECTIN MODIFICATION
The modification of the pectin structure is observed as early as during growth through to
during softening of fruits and vegetables where the cell wall pectin undergoes solubilization
and depolymerization (Manrique and Lajolo, 2002). These modifications of pectin may cause
textural changes in fruits or vegetables. The texture of a fruit or vegetable can be defined as
“the sensory and functional manifestation of the structural, mechanical, and surface
properties of foods detected through the senses of vision, hearing, touch, and kinaesthetic”.
This quality parameter (texture) greatly influences consumer acceptability and is therefore
of great concern to food processors (Duvetter et al., 2009). During processing, in an attempt
to preserve, transform or create structure/texture of food systems pectin may also undergo
changes (Duvetter et al., 2009). Of great importance are the changes due to enzymatic and
chemical modifications which could lead to alterations in the functionality of the pectin in
the system (Thakur et al., 1997; Willats et al., 2006). To this extent, desired attributes can be
obtained by controlled processing to promote favorable modifications of the pectin
structure (Kurita et al., 2008).
In the subsequent sections, enzymatic and chemical modifications of pectin will be discussed
with more emphasis on the enzymatic modifications.
2.1 Enzymatic modification
Enzymatic degradation of pectin is mainly catalyzed by pectinases, a family of enzymes that
degrade the pectic polysaccharide leading to for instance its depolymerization and
demethylesterification (Duvetter et al., 2009). Pectinases are generally from microorganism
and plant sources. These enzymes are substrate specific acting on HG, rhamnogalacturonan I
(RG-I) or the rhamnogalacturonan II (RG-II) side chains (Duvetter et al., 2009). Pectinases
such as hydrolases and lyases act on the GalA chain of HG thereby splitting the bonds
between two monosaccharide units resulting in depolymerization of the pectin. On the other
hand, other types of pectinases such as esterases remove the methyl, acetyl and feruloyl

14
esters on the chain giving rise to demethylesterified, deacetylated and deferuloylated pectic
polymers (Duvetter et al., 2009). Pectinases are used in several food applications as well as
in other applications such as degumming of jute for the textile industry application and in
waste treatment (Pedrolli et al., 2009).
Generally, HG degrading enzymes are well known and they include pectin methylesterase
(PME), polygalacturonase (PG) and pectin lyase (Pedrolli et al., 2009). In addition, some
important side chain degrading enzymes such as endo-galactanase, endo-arabinase, β-
galactosidase and α-arabinofuranosidase have been identified (Numan et al., 2006).
In food processing, common preparation steps and treatments such as crushing, thermal and
high pressure treatments play vital roles in pectin conversion reactions. These reactions may
denature pectinases completely or partially resulting in decreased pectin conversions. On
the other hand, these processing steps may improve the catalytic action of the pectinases,
thereby increasing the level of pectin conversions. The action of these enzymes may for
instance increase the clarity and yield of fruit juices by about 90%. As a result, in plant-based
food products optimum application is required to produce products with desired textural
and other quality parameters (Duvetter et al., 2009).
In this research, backbone modifying enzymes including PME, PG and Acetylesterase as well
as side chain modifying enzymes (β-galactosidase and α-arabinofuranosidase) will be
discussed.
2.1.1 Pectin methylesterase
Pectin methylesterase (PME) is an enzyme responsible for demethylesterification of the
pectic chain (Pedrolli et al., 2009). The methyl esters at C-6 of GalA chain are hydrolyzed
releasing methanol and hydronium ion (H3O+) (Duvetter et al., 2009) as shown in Figure 2.1.
PME catalyzes the demethylesterification reaction by specifically acting on the
methylesterified carboxyl group adjacent to a non methylesterified carboxyl group of
preferably a partially methylesterified pectin. In this context, high methylesterified (HM)
pectin is the preferred substrate of PME (Walter, 1991). PME has been shown not to

15
completely demethylesterify the pectin but stops at a certain level of methylesterification. In
addition, the extent of demethylesterification of pectin by PME depends on the variety of
the fruit or vegetable, its pectin content and the amount of active PME (Walter, 1991).
PME can be classified as plant PME or microbial PME depending on its origin. Although the
molar mass of these PMEs ranges from 25 to 54 kDa, it has been shown that these PMEs
exhibit different properties. Studies show that microbial PMEs of fungal origin are more
resistant to chemical substances and have an isoelectric point (pI) and optimum pH within
the acidic range (mostly between 4 and 9) while plant PMEs have optimal pH in the alkaline
range (mostly between 6 and 8) (Duvetter et al., 2009; Walter, 1991). As such, the optimal
pH for PME action may strongly depend on the origin of the PME. Furthermore, plant and
microbial PME differ by the mode of action. Plant PME demethylesterifies pectin in a linear
manner resulting in blocks of free carboxyl groups. On the contrary, microbial PME can act in
a blockwise or random manner leading to blockwise or random distribution of
methylesterified GalA residues. Therefore, the pattern in which pectin has been
demethylesterified can affect its functional properties such as gelling and thickening (Fraeye
et al., 2010; Duvetter et al., 2009).
Generally, PMEs have optimum activity within a specific range during thermal treatment.
Thermal treatment increases the catalytic activity of PME but at higher temperatures (≥ 60
°C) inactivation of the enzyme may occur. For example, optimum catalytic PME activity can
be achieved at neutral pH and 55 °C in tomato based-products (Duvetter et al., 2009).
Similarly, PME in carrot tissue is activated at temperatures ranging from 50 °C to 60 °C.
Therefore, most PMEs are thermo-labile such that below 70 °C they can be easily
inactivated. Studies on the kinetic behavior of PME revealed the presence of at least two
isoforms of PME; a thermo-resistant isoform co-existing with a thermo-labile one. In contrast
to being thermo-labile most PMEs are barotolerant. PMEs from plums and carrot are
moderately sensitive to pressure (≥ 600 MPa) while tomato PME is highly pressure tolerant
(≥ 1 GPa) (Duvetter et al., 2009).

16
Other factors such as salt concentration and presence of cations also affect PME activity. In
fact, cations increase PME activity but are not needed for the activity to proceed (Walter,
1991). Furthermore, protein inhibitors such as glycoprotein PME inhibitor (PMEI) from kiwi
fruit may be applied if inactivation of PME is desired. This inhibitor binds to PME through
non covalent linking to form a reversible complex (Duvetter et al., 2009).
2.1.2 Polygalacturonase
Polygalacturonase is a family of pectin degrading enzymes which hydrolyze the α-1-4-
glycosidic linkages of polygalacturonic acid giving rise to D-galacturonate (Pedrolli et al.,
2009). This enzyme requires demethylesterified pectin as a substrate and studies show that
PG activity decreases with increasing degree of methylesterification (Duvetter et al., 2009;
Pedrolli et al., 2009). During pectin modification, PG is believed to act synergistically with
other backbone modifying enzymes such as PME (Kurita et al., 2008). Two types of
polygalacturonase (PG) are generally known; exo-PG (which removes uronic acid residues
from the non reducing end of pectin chain) and endo-PG which randomly cleaves the α-1-4-
glycosidic linkages along the HG chain to produce oligogalacturonate. The random cleaving
of pectin by endo-PG is more likely to contribute significantly to pectin depolymerization
(Walter, 1991). Endo-PG may also act synergistically with other enzymes such as cellulase to
solubilize pectic polysaccharides from plant cell walls, such as apple cell walls (De Vries et al.,
1982). Presence of inhibitors such as PG-inhibiting protein may stall the activity of endo-PG.
Due to the growing interest for use of pectinases in texture engineering of fruits and
vegetables, the nature and role of these enzymes are more and more explored. Research on
PG has shown that the enzyme exists in different isoforms in ripe tomato fruit; PG1 and PG2.
PG1 is made up of a single polypeptide chain and exhibits a molecular mass of 100 kDa
whereas PG2 is composed of heterologous polypeptide chains with molecular mass of 45
kDa (Visser and Voragen, 1996). These isoforms of PG are known to differ in substrate
specificity, kinetic parameters and optimum pH (Duvetter et al., 2009; Pedrolli et al., 2009).
PG activity is influenced by factors such as temperature, pH and salt concentration. With
respect to temperature sensitivity, reports on crude tomato extracts indicate the presence

17
of thermo-labile and thermo-stable fractions of PG. The different PG isoforms identified
using the first-order kinetics revealed that PG1 is more thermo-stable than PG2. The
difference in heat stability between the two isoforms is reported to be related to the
presence of a heat-stable glycoprotein called β-subunit. The presence of β-subunit in PG2
can convert PG2 to an enzyme-like PG1 in vitro which is heat-stable at 65 °C for 5 min. It
could also retain about 50% of its activity even after heat treatment at 85 °C for 5 min
(Duvetter et al., 2009; Pedrolli et al., 2009). Furthermore, PG is a pressure-labile enzyme.
Tomato PG is for instance readily inactivated at 500 MPa even in the absence of high
temperature treatment. As such, the catalytic action of pure tomato PG decreases
significantly with increasing pressure (Duvetter et al., 2009).
As earlier mentioned, PG is used in several food applications including in clarification of
juices and in products where low viscosity is important. For example, in apple juice
application, PG activity may result in a 62% reduction of the juice viscosity (Pedrolli et al.,
2009).
2.1.3 Acetylesterase
Acetylesterase is a pectin backbone modifying enzyme that specifically hydrolyzes the acetyl
esters present at the O-2 and/ O-3 positions. This enzyme removes the acetyl groups of the
1-hydroxypyren-3, 6, 8-trisulphonic acid trisodium salt and 3, 5-diaacetoxy-cyclopent-1-ene.
The presence of acetyl groups has been reported to influence gelation properties of pectin.
In fact, in sugar beet pectin, hydrolysis of just a part of the acetyl esters present may lead to
a significant improvement in gelation properties of the pectin (Searle-van Leeuwen, 1992;
Leroux et al., 2003; Williamson, 1991). In addition, acetylesterase has optimum pH and
temperature of 5.5 and 40 °C, respectively (Searle-van Leeuwen et al., 1992).
Generally, the degree of acetylation depends on the pectin source as is seen with sugar beet
pectin being highly acetylated compared to citrus pectin (Williamson, 1991).

18
2.1.4 Side chain modifying enzymes
2.1.4.1 β-galactosidase
β-galactosidase is known to be one of the major side chain degrading enzyme present during
ripening. This enzyme plays a vital role in the removal of galactose from galactose-containing
side chains like arabinagalactan and galactan by hydrolyzing galactose from p-nitrophenyl-β-
D-galactoside and non reducing end of galactan. The removal of these side chains may lead
to an increase in the solubility of pectin as well as cross linking of pectin. Studies into
transgenic tomato fruits have shown significant reduction of β-galactosidase activity in
firmer transgenic tomatoes compared to ripen transgenic ones. This shows the susceptibility
of firmer fruits to β-galactosidase activity and as such this enzyme plays a vital role in fruit
ripening (Esteban et al., 2003; Van Buggenhout et al., 2009). Galactosidases have generally
been reported to exist in different isoforms such as β-gal-A, β-gal-B, β-gal-C and β-gal-D
(Walter, 1991; Warmerdam et al., 2013).
Factors influencing β-galactosidase activity include temperature, pressure and pH. Studies
have revealed that β-galactosidase is temperature sensitive with complete thermal
inactivation being achieved at 60 °C for 5 min. On the other hand, β-gal in tomato puree can
be gradually inactivated after a 10 min treatment at pressures 300 – 800 MPa (Houben et al.,
2012).
2.1.4.2 α-arabinofuranosidase
α-arabinofuranosidase is a side chain degrading enzyme that catalyzes the hydrolysis of the
terminal non reducing end of α-L-arabinofuranosides arabinan, α-L-1,2-, α-L-1,3- and α-L-1,5-
arabinofuranosyl residues (Dalia et al., 2002; Kaji and Yoshihara, 1971). α-
arabinofuranosidase (α-Afase) also hydrolyzes arabinose-containing polysaccharides by
splitting arabinofuranose moieties at O-5, O-2 and/or O-3 as single substituents of xylans,
arabinans and xylo-oligomers (Dalia et al., 2002). Controlling the action of this enzyme is
crucial due to the negative impact of some side chains on the structural and functional
properties of the plant cell wall. Furthermore, during processing these side chains can for
instance interfere with cation-mediated pectin cross linking thus affecting pectin

19
functionality (Numan and Bhosle, 2006). α-Afase also plays an important role in the
complete degradation of xylan by acting interdependently with other hemicellulases (Dalia
et al., 2002; Rasmussen et al., 2001).
Similar to other enzymes, α-Afase is also influenced by extrinsic factors such as temperature,
pressure and pH. α-Afase is temperature sensitive with residual activity of the enzyme in
tomato puree of 50% and 6% when the enzyme is subjected to heat treatments of 45 °C and
60 °C, respectively. On the contrary, α-Afase is pressure tolerant. Subjecting the enzyme to a
high pressure of about 800 MPa for 10 min did not inactivate it (Houben et al., 2012). In
addition, the optimum pH for α-Afase ranges from 4 to 4.8 whereas a pH of 3.0 inactivates
the enzyme (Houben et al., 2012; Numan et al.,2006; Rasmussen et al.,2001).
In food applications, α-Afase is used in processes such as clarification of juices, enhancement
of the digestion of animal feed and also in the natural improvement of bread (Numan and
Bhosle, 2006; Wijesundera et al., 1989).
2.2 Chemical modification
During food processing several treatments are performed in order to preserve, improve and
maintain quality attributes. These treatments usually involve application of heat. Thermal
treatment of fruits and vegetables such as pasteurization, blanching and cooking may cause
softening partly due to membrane disruption and due to pectin conversions. These changes
in pectin structure may be attributed to enzymatic as well as chemical reactions such as
depolymerization or demethylesterification (Renard et al, 2002; Van Buggenhout, et al.,
2009). Of these reactions, the chemical reactions of common occurrence include acid
hydrolysis, saponification and β-elimination.
2.2.1 Saponification
Saponification is a chemical demethylesterification of pectin at the C-6 position of the GalA
residues under alkaline or mild acidic conditions at approximately pH ≥ 5 (Jolie et al., 2012).
This reaction occurs randomly and results in a statistical distribution of the non
methylesterified and methylesterified GalA residues on the pectin backbone (Renard and

20
Thibault, 1996).The rate of saponification is affected by factors such as pH, temperature,
pressure and the amount of esters present on the HG chain. At elevated temperatures and
increasing pH, saponification is accelerated as it is initiated by hydroxyl ions. Furthermore,
increasing pressure increases the rate of saponification (Jolie et al., 2012).
2.2.2 β-elimination
β-elimination is a chemical depolymerization reaction that proceeds on the uronic acids of
pectin which possess a glycosidic linkage on C-4 in the β-position of the carboxyl group at C-5
position. The reaction involves the breakdown of the pectin polymer resulting in the
formation of a double bond between C-4 and C-5 of the pectin polymer chain (De Roeck et
al., 2009; Sila et al., 2006). β-elimination is promoted by a high DM and it infers that high DM
pectin is more easily degraded compared to LM pectin (Williams, 2011). In fact, decreasing
the degree of methylesterification of the pectin may decrease the susceptibility of the pectin
to β-elimination. Therefore, controlling the methyl ester content of pectin greatly influences
the rate of β-elimination (Kurita et al., 2008; Sila et al., 2009). β-elimination is more
temperature sensitive than saponification. At high temperatures a strong acceleration in β-
elimination than in saponification is observed. As such β-elimination is proposed as the main
cause of thermal softening in plant-based foods (Sila et al., 2009; De Roeck et al., 2009).
Other factors such as monovalent salts, pH and PME activity are reported to influence β-
elimination. The presence of monovalent salts or increasing the pH, increase the rate of β-
elimination (Sila et al., 2009; Van Buggenhout et al., 2009).
2.2.3 Acid hydrolysis
Acid hydrolysis is a chemical reaction which involves the protonation of the glycosidic
oxygen and subsequently a rate-linking unimolecular heterolysis of the conjugates acid.
Addition of water results in the formation of a reducing end on the glycosidic chain (Jolie et
al., 2012) and as such promotes acid hydrolysis. Acid hydrolysis leads to chemical
depolymerization of pectin and occurs during thermal processing of food systems with pH <
3.0. Acid hydrolysis proceeds on demethylesterified pectins and as such LM pectins are more

21
susceptible to acid hydrolysis (Hellín et al., 2005; Sila et al., 2009; Van Buggenhout et al.,
2009).
During thermal treatment of plant based foods, acid hydrolysis of pectin is not likely to occur
since the pH of most plant based systems is above pH 3.0. As the pH increases, the rate of
acid hydrolysis decreases (Van Buggenhout et al., 2009).
Figure 2.1: A schematic representation of the chemical and enzymatic conversion reactions of pectin
and possible routes for tailored quality parameters (Sila et al., 2009).

22
CHAPTER 3
3 PECTIN FUNCTIONALITY
Pectin extracted from major sources such as apple pomace and citrus peels is widely used as
a gelling, stabilizing, thickening and emulsifying agent in the production of several products
including sauces, yoghurts, jams and jellies (Thakur et al., 1997; Kuuva et al., 2003; Willats et
al., 2006). Over the years, sugar beet pectin has also been under consideration as a potential
commercial pectin source. However, due to its poor gelling properties, sugar beet pectin is
minimally used (Kuuva et al., 2003). In this chapter, the functional properties of pectin will
be addressed with emphasis on the emulsifying property of pectin.
3.1 Emulsifying capacity
Emulsification is the process by which two immiscible substances are mixed together to
produce a desired product. As two substances are not always miscible (naturally or
thermodynamically incompatible), surface tension breaking components are often used to
break the interfacial surface tension between these two substances. In the case of water and
oil mixture, emulsifiers such as proteins are used and emulsification is an important
functional property of food polymers such as proteins (Akhtar et al., 2002). A food emulsion
is therefore a colloid with one substance dispersed in another which is the continuous phase
(Mirhosseini et al., 2008) as shown in Figure 3.1. In food applications, two classes of
emulsifying agents are identified; small-molecular surfactants such as sucrose esters and
lecithin and macro-molecular emulsifiers, mainly proteins (Dickinson, 2003).
A good emulsifier must be amphiphilic such that it ably adsorbs and adheres to the sufficient
and accessible hydrophobic molecules present in the hydrocolloid. Furthermore, a good
emulsifier must possess the ability to lower the tension at the interface both substantially
and rapidly when present at the concentrations typically used during emulsification
(Dickinson, 2003). As such, an ideal emulsifier should be of low molecular weight and should
solubilize in the aqueous continuous phase (Surh et al., 2006). This serves as the basis for the
extensive use of protein as an emulsifier in food applications.

23
For effective formulation of emulsions, both a good emulsifier and a good stabilizer are
required. Therefore, to achieve both emulsification and stabilization protein and
polysaccharides may be used together. In fact, Surh et al. (2006) suggests that pectin and
proteins can be used in emulsions and may complex leading to improved stability of the
polysaccharide present in oil-in-water (o/w) emulsions. The solubility and stability of protein
as such may increase due to its interaction with polysaccharides in emulsions of pectin-
protein complexes (Neirynck et al., 2004). This unique complexation may be due to
similarities and differences between protein and polysaccharides including emulsifying or
thickening capacity, temperature sensitivity, conformation of chain, etc. In most
applications, proteins are mainly used for their emulsifying or foaming capacity whereas
polysaccharides are used due to their thickening and water holding capacity (Neirynck et al.,
2004). This could be attributed to polysaccharide being predominantly of hydrophilic
characteristics rendering little surface activity at oil-water interfaces (Akhtar et al., 2002).
Moreover, the emulsifying potential of pectin is mainly attributed to the presence of protein
moieties which facilitate adsorption on the oil droplet surfaces. When the pectin
concentration is high enough the surface of more than one emusion oil droplet may be
adsorbed onto by the pectin molecules causing bridging flocculation. However, at high pH
(above the pI of protein) most of the pectin does not approach the oil droplet surface due to
charge repulsion between the protein and pectin molecules (Gancz et al, 2005; Gharsallaoui
et al., 2010). This leads to pronounce phase separation of the oil droplets to the surface of
the oil-water mixture.

24
Figure 3.1: A schematic representation of emulsifying mechanisms (Schuchmann and Schubert,
2003).
In general, emulsion stabilization has been shown to occur through mechanisms such as
steric stabilization and electrostatic stabilization. Steric stabilization being the repulsive
forces present when a polymeric emulsifier interacts with oil droplets by the emulsifier
anchoring onto the surface of the droplets with hydrophilic segments protruding into the
continuous phase hindering the droplets from aggregating. Electrostatic stabilization on the
other hand exists when an ionic surfactant and oil droplets interact as is the case in oil-water
emulsions (McClements, 1998).
Even in presence of emulsifiers and stabilizers some emulsions are still susceptible to
destabilization. In emulsion instability, four main destabilization mechanisms are known;
flocculation, creaming, coalescence and Ostwald ripening. Flocculation occurs when there
are attractive forces between the droplets where individual droplets come together to form
floc-like structures. Creaming on the other hand is where droplets rise to the top of the
emulsion due to the influence of buoyancy or applied centripetal force. In cases where
droplets form and grow into larger droplets over-time, this is referred to as coalescence.
Lastly, Ostwald ripening is a destabilization mechanism in which smaller droplets diffuse into

25
larger ones through a continuous phase (Dickinson, 2003; Klein et al., 2010; Neirynck et al.,
2004; Surh et al., 2006; Voorhees, 1985).
3.2 Stabilizing and thickening capacity
Pectin can be used to stabilize food products such as fruit juices and beverages, acidified
milk drinks and yoghurts (Akhtar et al., 2002; Willats et al., 2006). As a hydrocolloid, pectin
modifies the rheology of the food systems in terms of flow behavior (viscosity) and the
mechanical solid properties (texture) (Milani and Maleki, 2012). When used in emulsion
formulations stabilizers ensure “long-term” emulsion stability (Dickinson, 2003). Therefore,
emulsion stability is the ability of an emulsion to resist changes in its properties such as
particle or droplet size distribution and state of aggregation over time (Dickinson, 2003).
The stabilizing capacity of a polysaccharide is attributed to its ability to modify the viscosity
of the aqueous continuous phase. In contrast, stabilizing capacity of the hydrocolloid such as
protein is due to its ability to adsorb to the protective layers at oil-water interfaces such that
the rheology and stability of the oil droplets are influenced (Surh et al., 2006). These
properties of protein enable it to play both emulsifying and stabilizing roles in the emulsion
formulation (Dickinson, 2003).
For a stabilizer to be effective, it must possess four distinct characteristics;
i. It must have a certain level of hydrophobic trait that can permanently retain it to the
interfacial surface.
ii. It must completely cover the interfacial surface.
iii. It must predominantly have hydrophilic part within an aqueous medium.
iv. The stabilizing polymer must carry charged groups needed for the net repulsive
electrostatic interaction between the surfaces of the particles. This normally
occurs at low ionic strength (Dickinson, 2003).
Besides use in emulsions stabilizers are of great importance in other food systems such as
beverages. Beverages are oil-in-water emulsions usually prepared by reconstituting or
diluting pre-processed concentrates. Due to these unique characteristics of this class of

26
emulsions, a high degree of stability is required in both states (Klein et al., 2010; Mirhosseini
et al., 2008).
The ability of pectin to thicken systems is observed as involving nonspecific entanglement of
conformational disordered polymer chains due to polymer-solvent interaction. Within dilute
dispersions the individual molecules freely move whereas in concentrated systems the
molecules gradually come into contact with one another until the movement is restricted.
This process of transitioning from free to entangled or restricted network of molecules is
referred to as thickening.(Milani and Maleki, 2012). Thickening generally depends on the
chemical composition of pectin, its concentration, the food system in which it is used as well
as the pH and temperature of the food system (Akhtar et al., 2002; Fissore et al., 2009;
Milani and Maleki, 2012). Furthermore, the molecular mass which affects the hydrodynamic
size of pectin molecules significantly influences the viscosity of food systems. For instance,
linear–stiff molecules and highly flexible polymers of the same molecular mass exhibit
differences in viscosity, with linear–stiff molecules imparting a higher viscosity to a food
system. One of the most common food systems in which pectin is used as a thickening agent
is Ketchup (Milani and Maleki, 2012).
3.3 Gelation
The gelling ability of pectin is one of the major properties for which it finds use in food
applications (Williams, 2011). Pectin forms viscoelastic solutions and structured networks at
certain conditions and is as such used in jams, jellies and marmalades production (Akhtar et
al., 2002). Gels are generally formed at specific conditions and the process usually involves
heating and cooling steps. Gelling capacity of pectin is influenced by the DM of the pectin,
the distribution of non methylesterified GalA units as well as degree of acetylation.
Furthermore, extrinsic factors such as pH, temperature, concentration and divalent ions
influence the gelling process. In this context, pectin can for instance be classified based on
gelling time and temperature as rapid set, medium rapid set and slow set pectin at a given
constant cooling rate (Thakur et al., 1997; Williams, 2011).

27
Depending on the DM of pectin gelation and stabilization occurs through different
mechanisms. Gels of HM pectin are formed and stabilized by hydrophobic and hydrogen
bonds while gels of LM pectin are formed and stabilized by electrostatic bonds. In gelation of
LM pectin an important mechanism the “egg-box model”, in which negatively charged
carboxyl groups of pectin react with calcium ions (Ca2+) is employed as shown in Figure 3.2.
(Kuuva et al., 2003; Thakur et al., 1997). The reaction creates a zig-zag network of two GalA
units. Within the cage spaces of the zig-zag network are calcium-bound ions similar to an egg
box, hence the name ‘egg box model” (Williams, 2011). Gelation through this mechanism is
influenced by the DM, distribution of the free carboxyl groups on the GalA chains as well as
the sensitivity of pectin to the ions (Thakur et al., 1997). The amount of Ca2+ needed for the
gelling process increases with ionic strength and pH, and decreasing soluble solids. By adding
Ca2+ to pectin sols calcium bridges are formed and as a result the viscosity of the sols
increases. Despite the positive effect of the calcium binding, the interaction may cause
flocculation in the presence of excess calcium. In pectin with a high degree of acetylation
(for example sugar beet pectin), the presence of more acetyl groups reduces calcium
sensitivity thus preventing gelling (Leroux et al., 2003).
Figure 3.2: A schematic view of the gelation of LM pectin by calcium ions (“egg box model) (Williams,
2011).

28
On the other hand, gelation of HM pectin involves the cross linking of two or more pectin
molecules to form junction zones which are stabilized by hydrogen bonds and hydrophobic
interactions between the methyl ester groups. The hydrophobic interactions occur due to
unfavorable interactions between polar and non polar methyl ester groups (McClements,
1998). This mechanism of gelation is promoted by high sugar concentrations (55%) and a low
pH (2.8 - 3.4). The size and thermodynamic stability of the junction zones may also depend
on the affinity of the two methyl ester groups (Pedrolli et al., 2009; Thakur et al., 1997;
Willats et al., 2006). Other factors such as solute (sugar), temperature, gel strength and rate
of the formation of the gel affect the magnitude of hydrophobic interaction (Thakur et al.,
1997).
Citrus and apple pectin are mostly used in gelling applications. Sugar beet pectin on the
other hand exhibits poor gelling abilities mainly due to its high degree of acetylation.
However, the action of enzymes such as α-arabinofuranosidases (α-Afases) and acetyl
esterases may improve the gelling ability of sugar beet pectin. α-Afase removes some
arabinose residues rendering the feruloyl groups more available to take part in calcium cross
linking (Kuuva et al., 2003).

29
CHAPTER 4
4 MATERIALS AND METHODS
4.1 Overview of the experimental setup
To achieve the objectives of this study various materials and methods were used. First,
watery solutions were prepared from high methylesterified commercial citrus pectin and
subsequently incubated for predetermined periods in the presence of plant pectin
methylesterase (PME). This was aimed at creating pectin with different structure particularly
in terms of the degree of methylesterification (DM). Commercial sugar beet pectin samples
modified in a similar manner were also obtained from the Laboratory of Food Technology,
KU Leuven and used in this study.
After modification, the pectin samples were characterized for their DM, DAc, protein
content, neutral sugars, molar mass, GalA content and ferulic acid content. Furthermore, the
emulsifying and stabilizing capacities of the pectin were evaluated. Finally, an attempt was
made to establish the link between the structure of citrus and sugar beet pectin and their
emulsifying capacity.
This chapter elaborates on the materials and methods used in this research. An overview of
the experimental setup is shown in Figure 4.1.

30
Citrus pectin
(0 min, 4 min, 35 min & 30 h)
Production of pectin
with different DMs
High DM commercial citrus and sugar beet pectin
Incubation (30 °C) in the presence of carrot PME
Sugar beet pectin
(0 min & 24 h)
Lyophilization
Dialysis (for 48 h)
pH adjusted to 4.5, followed by heat treatment of samples
at 85 °C for 4 min, cooled and pH adjustment to 6.0
Structurally modified citrus and sugar beet samples
Citrus and sugar pectin characterization Emulsifying capacity
DM
DAc Neutral sugars
Molar mass
GalA content
Ferulic acid
content
Protein content
Microscopy study Viscosity
study
Emulsifying stability study
Particle size distribution (PSD)
Characterization and
emulsifying capacity
study Emulsifying parameters
DM, pH, pectin concentration,
homogenization pressure
(HPH), temperature, presence
of protein & storage time
Figure 4.1: A schematic overview of experimental setup.

31
4.2 Modification of pectin by the action of PME
Commercial citrus pectin (DM ~ 95) was purchased from Sigma-Aldrich (Belgium) and
encoded as CP 0 min. CP 0 min served as the starting material for the production of the different
structurally modified citrus pectin samples. The PME used in the structural modification of
pectin was extracted from carrots (Daucus carota, cv. Nantes) purchased from a local
supplier.
4.2.1 Extraction and purification of carrot PME
PME was extracted from carrots (Daucus carota, cv. Nantes) of Belgian origin. Fresh carrots
were peeled, cut into one cm2 and frozen with liquid nitrogen. Thereafter, the frozen pieces
were ground using a mixer (Grindomix GM 200, Retsch, Germany) and allowed to thaw prior
to extraction of PME. The extraction and purification of PME was based on the method
described by Jolie et al. (2009). After thawing the ground carrot pieces, puree was obtained.
The puree was then washed with demineralized water (1:0.6 w/v), filtered through a cheese
cloth and the pellet obtained thereafter was washed with demineralized water. The
extraction of crude PME from the final pellet was then carried out at 4 °C using 0.2 M Tris-
HCl buffer (pH 8.0) containing 1 M NaCl (1:1.3 w/v). The suspension was rotated end over
end. After an overnight extraction the suspension was filtered through a cheese cloth. To the
filtrate obtained 30% ammonium sulphate was added and the solution was rotated end over
end at 4 °C. After 30 min the solution was centrifuged (11000 rpm, 15 min) and 80%
ammonium sulphate was added to the supernatant. The solution was rotated end over end
for a second time for 30 min at 4 °C. After a second centrifugation (11000 rpm, 40 min) the
pellet containing the crude PME was recovered and suspended in 20 mM Tris-HCl (pH 7.0).
The crude PME was frozen with liquid nitrogen and stored at -80 °C.
The purification was carried out by affinity chromatography where the PME was separated
based on a reversible reaction which forms a 1:1 non covalent complex between the PME
and a specific ligand. The crude PME was bound to kiwi PME inhibitor (PMEI) that was
covalently coupled to NHS-activated Sepharose Fast Flow matrix. The PME-PMEI-sepharose
gel was packed into a column (XK16, GE Healthcare) for PME purification using an Akta prime

32
system. After a preliminary washing of the packed column with 2 mM potassium phosphate
(pH 6.0) containing 0.5 M NaCl to remove any impurities especially other proteins, PME was
eluted with 50 mM NaCO3 (pH 9.85) containing 1 M NaCl. The eluted fractions (which
contained PME) were pooled and desalted in the Vivaspin 20 centrifugal filters (Sartorius,
France) using 10 mM sodium phosphate buffer (pH 6.5). The concentrated purified carrot
PME was then dissolved in 10 mM Na-phosphate (pH 6.5) and frozen with liquid nitrogen
prior to being stored at -80 °C until further use.
4.2.2 PME activity measurement
For the measurement of PME activity, apple pectin solution (0.35%, pH 6.5) containing 0.117
M NaCl was prepared and a titrino (718 STAT Titrino, Metrohm) as shown in Figure 4.2 was
used. Approximately 30 mL of apple pectin solution was filled into the titrino vessel and the
pH of the pectin solution was adjusted to 7.0. PME was then added to the pectin solution
and by the action of the PME, a drop in pH was observed. This was due to an increase in non
methylesterified carboxylic groups (negatively charged) making the solution more acidic. As
such, 0.1 M NaOH was continuously introduced into the vessel to neutralize the ions
(Moustacas et al., 1991). The amount of NaOH consumed in the titration was then used to
estimate the PME activity. The PME was expressed in units, with 1 unit representing micro
mols of carboxyl groups released per time min by the PME (Dashek, 1997).
Figure 4.2: A Titrino (718 STAT model).

33
4.2.3 Demethylesterification of pectin
High methylesterified commercial citrus pectin (DM ~ 95) was demethylesterified at 30 °C
for predetermined periods. First, watery solutions of 0.8% w/v pectin (CP 0 min) in 0.1 mM Na-
phosphate (pH 7.0) were prepared. A predetermined volume of purified PME was then
added (15 U of purified PME was added to 25 mL of the pectin solution), mixed with the
solution and incubated in a water bath at 30 °C for periods of 4 min, 35 min and 30 h. At the
end of the incubation periods the pectin solutions were immediately cooled to room
temperature and the pH adjusted to 4.5 using HCl. This pH adjustment rendered the pectin
less susceptibility to β-elimination during a subsequent PME inactivation step at 85 °C for 4
min (Ngouémazong et al., 2011). The solutions were rapidly cooled in an ice bath and the pH
was adjusted to 6.0 using 0.1 M NaOH. This ensured that the pH was above the pKa of pectin
(3.5–4.1) (Kyomugasho et al., 2015b), in order to completely ionize all the non
methylesterified carboxylic groups and facilitate the measurement of DM by FT-IR (cf.
section 4.3.1) (Ravanat and Rinaudo, 1980). The solutions were then transferred into dialysis
membranes (molecular weight cut off (MWCO) = 12-14 kDa) and dialyzed against
demineralized water for 48 h. This step ensured the complete removal of ions and salts that
may be present in the solution. The dialyzed solutions were lyophilized and stored in a
desiccator over P2O5 at room temperature. For all further experiments the lyophilized
samples served as the citrus pectin starting material.
Two sugar beet pectin samples; a sample that was not incubated and a sample incubated
with PME at 30 °C for 24 h were obtained from the Laboratory of Food Technology, KU
Leuven.
4.3 Characterization of commercial citrus and sugar beet pectin.
Structural and chemical properties of pectin such as the DM, the DAc, the degree of
feruloylation, protein content, GalA content and neutral sugars of the demethylesterified
samples were characterized. The molar mass and viscous behavior of the samples were also
determined. Apart from the determination of the DM of lyophilized citrus pectin samples

34
and the viscous behavior of the solutions, the rest of the characterization was carried out by
another party at the Laboratory of Food Technology, KU Leuven.
4.3.1 Determination of the degree of methylesterification
The DM of citrus pectin was determined using Fourier transform infrared spectroscopy (FT-
IR) (Shimadzu IR Affinity-1, Kyoto, Japan) with LabSolutions infrared software (Figure 4.3).
First, a background measurement was performed by measuring the transmittance of air (no
samples) to correct for interferences due to moisture and CO2 in the atmosphere
(Kyomugasho et al., 2015a).
Figure 4.3: Fourier transform infrared spectrophotometer.
A part of the lyophilized sample was firmly pressed to remove any entrapped air and to
create a smooth surface, and was placed on the sample holder of the FT-IR. The
transmittance of the sample was then measured at wavenumbers of 4000 cm-1 to 400 cm-
1.at 4 cm-1 resolution. Approximately 100 scans were run per sample to reduce the noise to
signal ratio and the scans were integrated to obtain spectra mean values (Kyomugasho et al.,
2015a). Spectra processing started with converting the transmittance spectra into the
absorbance spectra using in-built software. Within the spectra the peaks of interest for DM
determination occur at 1600-1630 cm-1 (due to the stretching vibrations of carboxylic ions,
COO‾) and 1740 cm-1 (due to the stretching vibrations of methyl ester carbonyl group, C=O)
(Manrique and Lajolo, 2002) as shown in Figure 4.4. Based on the ratio of intensity (I) at the

35
aforementioned peaks the DM was determined as;
From a standard calibration curve built by plotting known DMs (%) of standard pectin
samples against the results obtained from FT-IR (ratio of intensities), the DM was estimated.
Triplicate measurements were performed for each sample.
Figure 4.4: An FT-IR spectrum of citrus pectin (Manrique and Lajolo, 2002).
4.4 Determination of emulsifying/stabilizing properties of citrus and sugar beet
pectin
4.4.1 Microscopy
Emulsions of pectin samples with different DMs were prepared by mixing pectin solutions
with olive oil. Pectin (1%, 0.5% or 0.1% w/v) was dissolved in 0.1 M citrate buffer at different
pHs (pH 3.0, 4.2 and 6.2) and 5% olive oil (w/v) as well as predetermined amounts of labelled
pectin were added (Figure 4.8). As the degree of labelling varied with the DM of pectin,
amounts resulting in the same degree of labelling were predetermined. Labelling pectin with
a fluorescent label took place by a chemical reaction of the reactive label with hydroxyl

36
groups on the pectin chain (Tromp et al., 2004). The labelled pectin was obtained from the
Laboratory of Food Technology, KU Leuven.
Thereafter, the pectin solutions were ultra-turaxed for 15 min at 9500 rpm using a mixer
(Ultra-turax T-25, Janke and Kunkel, Germany). One part of the emulsion was used in the
measurement of particle size distribution while the second part was immediately visualized
under both light and fluorescent microscopy using an Olympus BX-51 (Olympus, Optical Co.
Ltd, Tokyo, Japan) microscope equipped with Olympus XC 50 digital camera and
epifluorescence illumination (X-CiteR Fluorescence Illumination, Series 120Q, EXFO Europe,
Hants UK) as shown in Figure 4.5. Approximately 20 µL of the emulsion was transferred onto
a glass slide, a cover slide as placed over it and the sample was visualized using objectives of
10x and 40x magnification. For fluorescence microscopy the images were obtained at a
wavelength of 603 nm.
Figure 4.5: Light and fluorescence microscope equipped with Olympus XC 50 digital camera and
epifluorescence illumination.
4.4.2 Viscosity determination
The viscosity of the pectin solutions (1%, 0.5% or 0.1% w/v) and pectin solutions with added
bovine serum albumin (BSA) (0.1% w/v) at different pHs was measured using a stress

37
controlled rheometer (MCR 501, Anton Paar, Graz, Austria) with Rheopus software (Figure
4.6). The measurements were performed at 20 °C.
Viscosity being the tendency of a fluid to resist flow is best determined from the resistance
to rotational speed of doubled walled cup which is proportional to the shear stress in the
solutions (Rao, 2013). The couette method with double walled cup geometry was as such
used. First the resistance to flow was measured at a constant shear rate to establish
apparent viscosity of the samples. Then different shear rates were applied with 0.1 s-1 to 100
s-1 applied to the 1% solutions and 1 s-1 to 100 s-1 applied to both 0.5% and 0.1% solutions..
Each decade measurement was approximately 10 min.
Figure 4.6: A stress-controlled rheometer.
Approximately 4 mL of the pectin solution was filled drop wise into the double walled cup
until the gap was completely covered to avoid air bubbles and interference of the signal. The
solution was then sheared at the mentioned shear rates and the resistance to shear was
used to calculate the viscosity. Evaporation was considered negligible due to the short
duration of each test. The viscosity values were plotted against and shear rate to ascertain
the flow behavior of the solutions when subjected to particular shear rates.
4.4.3 Ultra-high pressure homogenization of emulsions
Pectin solutions (1%, 0.5% or 0.1% w/v) as well as pectin solutions (0.1% w/v) with added
protein (BSA) were prepared at different pHs and 5% olive oil was added as mentioned
earlier in section 4.4.1. The solutions were ultra-turaxed (15 min, 9500 rpm) using a mixer

38
(Ultra-turax T-25, Janke and Kunkel, Germany) and then homogenized at 4 °C under ultra-
high pressures of 250, 500 and 1000 bar. One part of the homogenized sample was
transferred into three 10 mL tubes for storage at 4 °C, 20 °C and 35°C for up to 8 weeks.
During the storage time images were taken at intervals for visualization of any emulsion
destabilization. The second part of the homogenized emulsion was used for determination
of the particle size distribution.
4.4.4 Measurement of particle size distribution
The particle size distribution (PSD) of the ultra-turaxed and homogenized emulsions was
analyzed using a laser diffraction particle size analyzer (Beckman Coulter In, LS 13 320,
Miami, Florida, USA) equipped with a Universal Liquid Module and LS 13 320 software as
shown in Figure 4.7. The Universal Liquid Module (i.e. the sample-handling module) delivers
particles without discriminating their sizes to the sensing zone, avoids possible air bubbles
introduced as well as disperses and circulates the particle better. The LS 13 320 software on
the other hand measures the PSD based on the pattern of light scattered by the particles (oil
droplets) within the sample. The scattering pattern of each particle is characterized by its
size and the sum of the patterns scattered by each constituent particle in the sample.
Particles between 0.04 µm and 2000 µm can be detected.
For measurement, the sample was pumped into the measuring cell of the tank filled with
buffer of appropriate pH. The LS 13 320 laser light with a wavelength of 750 nm as the
illuminating source and a secondary tungsten-halogen light source for the Polarization
Intensity Differential Scattering (PIDS). The light source projects through a set of filters that
transmit three wavelengths: 450 nm, 600 nm and 900 nm, with the light being scattered by
the particles in the sample. A plot of the volume fraction as a function of particle diameter
was used to determine the PSD of different fractions.

39
Figure 4.7: A Laser diffraction particle size analyzer (LS).

40
Characterized samples
Citrus pectin (CP0 min, CP4 min, CP35 min, CP30 h)
Sugar beet pectin (SBP0 min, SBP24 h)
+ (1%, 0.5% or 0.1 pectin w/v)
+ (Citrate buffer: pH 3.0, 4.2 or 6.2)
+ (5% olive oil)
(1%, 0.5%, 0.1 pectin w/v)
(Citrate buffer: pH 3.0, 4.2 and 6.2)
Viscosity study
+ (Labelled pectin)
Ultra-turaxed (15 min, 9500 rpm)
Microscopy study (Light & Fluorescent) PSD
+ BSA protein - BSA protein
Ultra-turaxed (15 min, 9500 rpm)
Ultra-high pressure homogenization
(250 bar, 500 bar or 1000 bar)
PSD (Before &
after storage
Storage
(4°C, 20°C, 35°C)
Emulsifying
stability study
NO BSA
Figure 4.8: A schematic overview of the various emulsifying capacity study plan.

41
CHAPTER 5
5 RESULTS AND DISCUSSION
The results obtained from the various experiments carried out in this research are presented
and discussed in this chapter. First, results from the action of PME on both the high
methylesterified (HM) citrus and sugar beet pectin will be discussed, followed by results of the
microscopy examination and viscosity measurement. In the last step, results of particle size
distribution (PSD) and stability images will be shown. Finally, an attempt will be made to
establish a link between the structural changes (specifically in the degree of methylesterification
(DM)) and the emulsifying as well as emulsion stabilizing capacity of the citrus and sugar beet
pectin.
5.1 Pectin characterization
5.1.1 Evaluation of degree of methylesterification
The results obtained for the degree of methylesterification (DM) of the pectin samples after
incubation for different periods in presence of carrot PME are shown in Figure 5.1. The DM of
the starting citrus pectin (CP) and sugar beet pectin (SBP) were 95% and 60%, respectively. For
CP, incubation periods of 4 min, 35 min and 30 h resulted in DMs of 65%, 35% and 16%,
respectively. On the other hand, the SBP sample incubated for 24 h exhibited a DM of 35%.
From the results, increasing the incubation period gave rise to pectin with a lower DM, pointing
to the fact that for longer incubation periods, demethylesterification by carrot PME significantly
decreased the DM of the pectin. Similar results of decreasing DM with increasing incubation
periods were reported by Fraeye et al. (2007). It can be observed that in order to obtain a DM of
35% in sugar beet pectin, an incubation period of 24 h was used compared to 35 min for citrus
pectin. The longer time for SBP may be attributed to the presence of a relatively high number of
acetyl groups compared to citrus pectin, which could interfere with the demethylesterification
process. Studies suggest that acetyl groups exert steric effects on both the ‘smooth’ and ‘hairy’
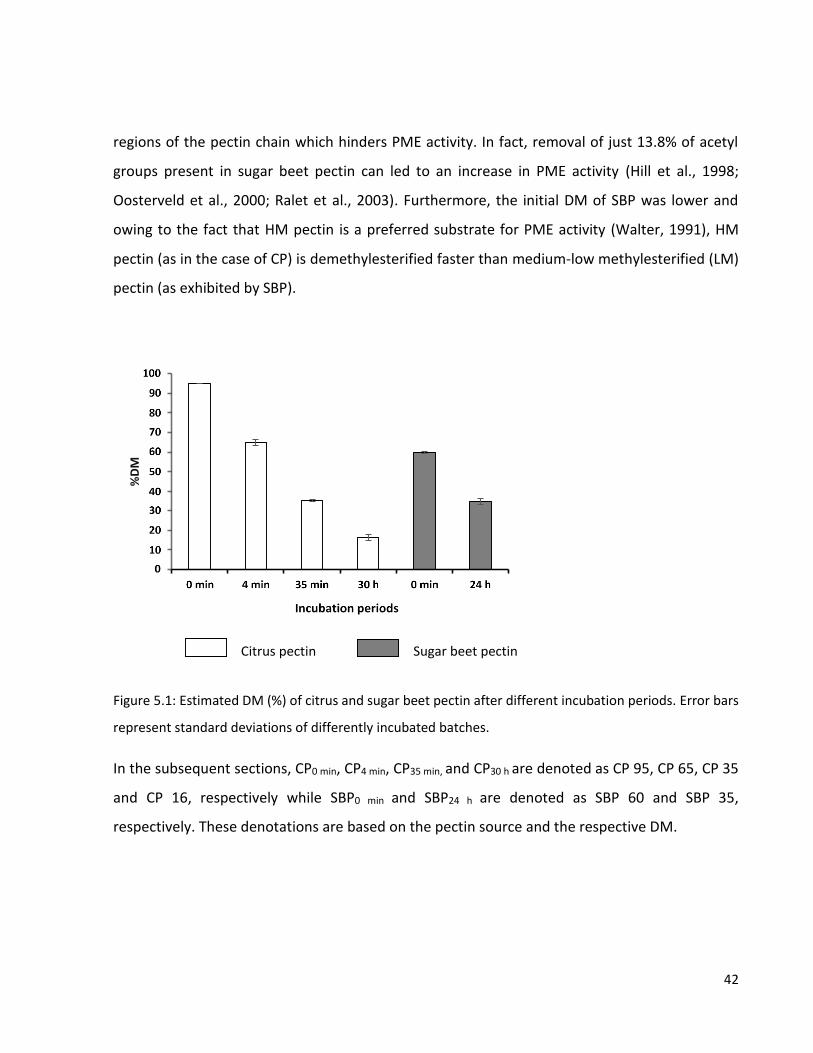
42
regions of the pectin chain which hinders PME activity. In fact, removal of just 13.8% of acetyl
groups present in sugar beet pectin can led to an increase in PME activity (Hill et al., 1998;
Oosterveld et al., 2000; Ralet et al., 2003). Furthermore, the initial DM of SBP was lower and
owing to the fact that HM pectin is a preferred substrate for PME activity (Walter, 1991), HM
pectin (as in the case of CP) is demethylesterified faster than medium-low methylesterified (LM)
pectin (as exhibited by SBP).
Citrus pectin Sugar beet pectin
Figure 5.1: Estimated DM (%) of citrus and sugar beet pectin after different incubation periods. Error bars
represent standard deviations of differently incubated batches.
In the subsequent sections, CP0 min, CP4 min, CP35 min, and CP30 h are denoted as CP 95, CP 65, CP 35
and CP 16, respectively while SBP0 min and SBP24 h are denoted as SBP 60 and SBP 35,
respectively. These denotations are based on the pectin source and the respective DM.

43
5.1.2 Characterization of other pectin structural properties
The results of the characterization of various pectin structural elements in both citrus and sugar
beet pectin samples were obtained from the Laboratory of Food Technology, KU Leuven and are
presented in Table 5.1. In general, between citrus pectin samples no differences in protein
content, degree of feruloylation, degree of acetylation (DAc), molar mass, galacturonic acid
(GalA) and neutral sugars were observed. Similarly, sugar beet pectin samples exhibited
comparable structural properties. Therefore, for each pectin source averages of the results are
presented.
Table 5.1: A summary of the results of characterization of pectin structural elements.
Structural elements Citrus pectin Sugar beet pectin
Protein content (%) 1.6 ± 0.03 3.5 ± 0.08
Degree of feruloylation (%) 0.7 ± 0.03 3.3 ± 0.14
Degree of acetylation (%) 2.5 ± 0.29 20.7 ± 0.52
Molar mass (kDa) 43.0 ± 1.27 778.0 ± 20.68
Pectin-related sugars (mg/g pectin)
Galacturonic acid 730.5 ± 21.16 550.1 ± 21.0
Galactose 48.5 ± 1.05 95.7 ± 0.84
Arabinose 1.3 ± 0.38 28.5 ± 0.55
Rhamnose 8.8 ± 0.46 53.5 ± 0.71
Glucose 4.4 ± 0.46 6.8 ± 0.86
Xylose 4.9 ± 0.85 3.0 ± 0.42
Mannose 1.7 ± 0.26 4.2 ± 0.23
Fucose 0.2 ± 0.06 0.8 ± 0.06
44
5.1.2.1 Protein content
The protein content of pectin is reported to have a great influence on the emulsifying capacity
of pectin. Therefore, it was important to establish the protein of the samples and this was
estimated by measuring the nitrogen content of the pectin using a Thermo Scientific FLASH
4000 N. From the results, the sugar beet pectin had a higher average protein content (3.5%)
compared to citrus pectin (1.6%) as shown in Table 5.1. As suggested in other studies, sugar
beet pectin naturally has high protein content compared to citrus pectin hence its preference in
food application as an emulsifier. The protein contents obtained were slightly lower than those
reported by Schmidt et al. (2015) (4.7% and 2.8% protein reported for sugar beet and citrus
pectin, respectively).
5.1.2.2 Degree of feruloylation
The amount of ferulic acid in pectin is believed to effectively influence adsorption of pectin on
to oil droplet surfaces (Siew and Williams, 2008). The ferulic acid content of the pectin samples
was measured by a colorimetric method. The results showed about 0.7% and 3.3% ferulic acid
content in citrus and sugar beet pectin, respectively (Table 5.1). Within the pectin chain, ferulic
acid ester cross link arabinose on the C-2, C-3 or C-5 while on the C-6 with galactose, which may
enhance the pectin’s gelling capacity in food applications (Levigne et al., 2002; Yapo, 2011a). In
addition, ferulic acid is reported to be present in RG-I of sugar beet and can lead to cross linking
of two or more RG-I polymers to form dehydrodiferulates (Yapo, 2011a).
5.1.2.3 Degree of acetylation
The acetylation content of the pectin samples was determined colorimetrically and showed a
higher amount of acetyl groups in sugar beet pectin than in citrus pectin on average, 20.7% and
2.5%, respectively (Table 5.1). This is in agreement with reports by Leroux et al. (2003) where
acetyl groups content of 16–35% and 1.4–1.6% were obtained in sugar beet and citrus pectin,
respectively. Naturally, the different sources exhibit varying amounts of DAc. Although, acetyl
groups are believed to hinder PME activity as well as interfere during cross linking in gelation

45
applications, their presence is proven to enhance emulsifying potential in both sugar beet and
citrus pectin (Leroux et al., 2003). The results showed that the SBP samples had higher ferulc
acid and neutral sugars contents than the CP samples.
5.1.2.4 Molar mass distribution
High-performance size-exclusion chromatography (HPSEC) was used for estimation of the molar
mass distribution. According to Leroux et al. (2003) and Williams et al. (2005), an effective
emulsifier must have approximately 70 kDa molar mass. The results obtained for molar mass of
sugar beet pectin were much higher whereas the molar mass of citrus pectin was closer to the
reported value (70 kDa).
5.1.2.5 Sugar content (Galacturonic acid and neutral sugars)
The galacturonic acid (GalA) content was determined colorimetrically and the results obtained
showed in general high galacturonic acid contents. This is due to the fact that GalA is the
primary backbone sugar of pectin. A higher average GalA content was obtained for citrus pectin
(730 mg/g pectin) compared to sugar beet pectin (550 mg/g pectin). These differences may be
due to the source as suggested by Thakur et al. (1997).
For the neutral sugars, generally the different DMs of sugar beet pectin had on average higher
galactose (95.7 mg/g pectin), arabinose (28.5 mg/g pectin) and rhamnose (53.5 mg/g pectin)
contents compared to citrus pectin (48.5 mg galactose /g pectin, 1.3 mg arabinose/g pectin and
8.8 mg rhamnose/g pectin). The significant amounts of rhamnose suggest a higher contribution
of RG-I in SBP. Furthermore, higher amounts of arabinose and galactose in SBP indicate more
“hairy” regions of pectin (Akhtar et al., 2002). Other neutral sugars including, xylose, mannose
and fucose were present in small amounts with fucose recording the least amount in both
pectin sources.
From the results of pectin characterization, it can be concluded that pectin from citrus was
more linear but exhibited a lower degree of acetylation, less protein and lower molar mass

46
compared to sugar beet pectin. After pectin characterization, the viscosity of watery pectin
solutions was determined and subsequently pectin-emulsions and pectin-protein emulsions
were prepared and examined for emulsifying properties.
5.2 Viscosity of pectin solutions
To gain insight into the rheological behavior of the pectin samples in solution, results obtained
for the flow behavior of the pectin solutions are discussed. The logarithm (log) of the viscosity
(Ns.m-2) was plotted as a function of time (s) in order to determine the apparent viscosity of the
pectin solutions at steady state. Results of the apparent viscosities of the pectin solutions are
shown in Table 5.2. More information on rheological behavior of the pectin solutions was
established by plotting the log of apparent viscosities (Ns.m-2) against shear rate (s-1) (Figures
5.2 and 5.3).
5.2.1 Effect of DM and pH on the viscosity of pectin solutions
Results obtained at constant shear rate (5 s-1) exhibited a decrease in apparent viscosity as the
DM of pectin increased at any given pH and pectin concentration as shown in Table 5.2. Both CP
and SBP showed similar trends. For instance, in citrus pectin solutions (0.5% w/v) at pH 3.0, the
apparent viscosity values decreased from 93.6 x 10⁻⁴ Ns.m-2 for CP 16 to 23.3 x 10⁻⁴ Ns.m-2 for CP
95. SBP samples also showed a decrease in apparent viscosity from 77.3 x 10⁻⁴ Ns.m-2 for SBP 35
to 32.6 x 10⁻⁴ Ns.m-2 for SBP 60.
When the pH was increased to 4.2 and 6.2, the viscosity of both CP and SBP samples decreased
except for CP 95 which was more or else constant with increasing pH. As pH increases, repulsion
increases, therefore limiting pectin interactions within the aqueous solution. For the lower DMs,
as pH increases more COO‾ groups are charged leading to more repulsion thus less chances of
entanglement to create a dense network. It was also suggested by Fraeye et al. (2010) that as
pH decreases protonation of carboxyl groups is accompanied by a transition of pectin from a
two-fold to a three-fold conformation with the three-fold helices probably cross linking mainly
by hydrogen bonds. Such complexation may have been strong enough in the lower DMs thus

47
giving some resistance to unfolding hence the higher viscosity. On the other hand for CP 95,
irrespective of pH increase the number of chargeable groups is too low therefore no build up in
repulsion is attained leading to a constant viscosity (Axelos et al., 1991).
Table 5.2: Apparent viscosity of citrus and sugar beet pectin solutions at a constant shear rate (5 s-1).
pH 3.0
DM Viscosity (Ns m-2) @ 5 s-1shear rate
0.1% 0.5% 1%
CP 16 18.6 x 10⁻⁴ 93.6 x 10⁻⁴ 632 x 10-4
CP 35 15.4 x 10⁻⁴ 52.1 x 10⁻⁴ 206 x 10-4
CP 65 15.5 x 10⁻⁴ 40.5 x 10⁻⁴ 163 x 10-4
CP 95 15.2 x 10⁻⁴ 23.3 x 10⁻⁴ 38.8 x 10⁻⁴
SBP 35 18.6 x 10⁻⁴ 77.3 x 10⁻⁴ 445 x 10-4
SBP 60 14.8 x 10⁻⁴ 32.6 x 10⁻⁴ 107 x 10-4
pH 4.2
CP 16 16.7 x 10⁻⁴ 59.0 x 10⁻⁴ 284 x 10-4
CP 35 18.0 x 10⁻⁴ 39.9 x 10⁻⁴ 178 x 10-4
CP 65 15.3 x 10⁻⁴ 41.4 x 10⁻⁴ 158 x 10-4
CP 95 13.9 x 10⁻⁴ 24.6 x 10⁻⁴ 48.1 x 10⁻⁴
SBP 35 18.0 x 10⁻⁴ 53.9 x 10⁻⁴ 224 x 10-4
SBP 60 20.0 x 10⁻⁴ 37.2 x 10⁻⁴ 116 x 10-4
pH 6.2
CP 16 14.0 x 10⁻⁴ 26.6 x 10⁻⁴ 105 x 10-4
CP 35 14.2 x 10⁻⁴ 19.6 x 10⁻⁴ 100 x 10-4
CP 65 15.2 x 10⁻⁴ 26.4 x 10⁻⁴ 96.5 x 10⁻⁴
CP 95 15.3 x 10⁻⁴ 27.0 x 10⁻⁴ 45.1 x 10⁻⁴
SBP 35 19.8 x 10⁻⁴ 43.0 x 10⁻⁴ 142.0 x 10⁻⁴
SBP 60 17.5 x 10⁻⁴ 40.1 x 10⁻⁴ 111.0 x 10⁻⁴
In general, the LM pectins exhibited higher apparent viscosities than HM pectins of each pectin
source (Table 5.2).
Comparing the viscosities of citrus and sugar beet pectin solutions with a similar DM (SBP 35
and CP 35), SBP 35 had higher viscosity than CP 35. For instance CP 35 and SBP 35 solutions
(0.5%w/v) at pH 3.0 had apparent viscosities of 52.1 x 10⁻⁴ Ns m-2 and 77.3 x 10⁻⁴ Ns m-2,
respectively. This may be due to the higher acetyl content in sugar beet pectin than in citrus
pectin (cf. Table 5.1) where the acetyl groups may have increased the solubility of pectin in the

48
aqueous medium by lowering the hydrophobicity of the pectin (Gou et al., 2012). This improves
pectin-solvent interactions as well as increases the ability of pectin to modify the viscosity of the
aqueous medium (Surh et al., 2006). In addition, the presence of more neutral sugars in SBP
compared to CP may have also improved SBP’s hydrophilic nature owing to the hydroxyl groups
of neutral sugars side chains protruding into the aqueous medium (Akhtar et al., 2002).
5.2.2 Effect of pectin concentration on the viscosity of pectin solutions
At a given pH, the apparent viscosity of pectin solutions increased significantly with increasing
pectin concentration (Table 5.2). This is in agreement with the findings of Einhorn-Stoll et al.
(2005) where increasing pectin concentration increased viscosity irrespective of the DM. In
addition, as solutions of high pectin concentrations are more concentrated than those of lower
pectin concentrations, the pectin molecules in the former tend to gradually come into contact
with one another until their movement is restricted leading to an enhancement in viscosity of
the solution (Milani and Maleki, 2012).
5.2.3 Effect of DM and pH on the viscous behavior of pectin solutions at varying shear rates
Examining the behavior of pectin under varying shear rates showed that increasing shear rate at
a given pH had an influence on the viscous behavior of different DMs of the various pectin
solutions. Looking at the trends of 1% citrus pectin concentrations at pH 3.0, the viscosities of
CP 16 and CP 35 decreased with increasing shear rate (Figure 5.2). On the other hand, the
viscosities of CP 65 and CP 95 were only slightly influenced by increasing shear rate. Similarly,
the sugar beet pectin samples, SBP 35 and SBP 60, both exhibited slight influence with
increasing shear rate. Similar trends were observed at both pH 4.2 and pH 6.2 (Figure 5.2) and
the influence of shearing increased with increasing pH especially for pH 6.2. The decrease in
may be due to the loss in the network of the entanglements present in the LM citrus pectin
samples (CP 16 and CP 35) due to the increase in the applied force (Surh et al., 2006).
Furthermore, owing to the fact that the molecules of the more viscous solutions orient
perpendicular to the surface of the spindle surface, faster rotation destroys the structure of the

49
solution. Thus, LM pectins depict more shear thinning flow properties than the HM pectin
solutions (Rao, 2013; Saha and Bhattacharya, 2010) structure of the solution.
Figure 5.2: Viscosity (log) of the pectin solutions at different pHs at varying shear rates (log).
5.2.4 Impact of pectin concentration on the viscous behavior of pectin solutions at varying
shear rates
At any given pH (for example pH 3.0) increasing the pectin concentration from 0.1% to 1%,
resulted in more shear thinning behavior of the pectin solutions (Figure 5.3). Similar
observations were made at pH 4.2 and pH 6.2 except that a more shear thinning behavior was
observed as the pH increased. The lower pectin concentrations (dilute solutions) may probably
have formed very few entanglements (if any) that freely dispersed in the solution. As a result,
increasing the stress on the sample did not bring a significant decrease in viscosity (Milani and
Maleki, 2012). On the other hand, for the higher pectin concentrations owing to the several
entanglements formed, increasing stress significantly decreases their viscosity as their stiff
entanglements were gradually destroyed (Milani and Maleki, 2012; Rao, 2013).

50
Figure 5.3: Viscosity (log) of solutions with different pectin concentrations at varying shear rates (log).
In conclusion, the LM citrus pectin solutions may be viewed as pseudo-non Newtonian fluids at
higher pectin concentrations owing to their shear thinning behavior i.e. decreasing viscosity as
shear rate. In addition, at a lower shear rate such fluids are more viscous compared to at a
higher shear rate (Marcotte et al., 2001; Rao, 2013). On the other hand, at the lowest pectin
concentration, pectin solutions from both soures could be viewed as Newtonian (Saha and
Bhattacharya, 2010).
5.3 Microscopy and particle size distribution of the ultra-turaxed emulsions
Microscopy examination was carried out to investigate the emulsifying capacity of the pectin,
i.e. degree of adsorption of the pectin to the oil droplet surface. To facilitate this, different pHs
were used; pH 3.0 slightly below pKa value of pectin (3.5-4.10) (Kyomugasho et al., 2015b), pH
4.2 which is approximately the pKa value of pectin and pH 6.2 which is above pKa value of
pectin. Additionally, pH 3.0 and 4.2 are below the pI of protein (specifically pH 4.7 for BSA)
(Peng et al., 2005) while pH 6.2 is above the pI value of protein. As such, interactions between
partially positive protein and negatively charged pectin would be expected around pH 4.2

51
whereas electrostatic repulsion between pectin and protein would be expected at pH 6.2 (Surh
et al., 2006).
Results of particle size distribution (PSD) of the emulsions at pH 4.2 and 6.2 as well as results of
fluorescence microscopy examinations are presented here.
5.3.1 Adsorption of pectin onto the oil droplet surface (emulsifying potential of pectin)
This was evaluated by ultra-turaxing watery pectin solutions in presence of olive oil followed by
microscopy examination of the emulsions as well as measurement of the PSD. Ultra-turaxed
samples were preferred as droplet sizes were easily viewed under the microscopy. In the case of
homogenized samples, the droplets were too small to facilitate this examination. However, after
storage microscopy examination of these samples was carried out.
5.3.1.1 Effect of DM and pH on adsorption of pectin onto the oil droplet surface (O/W emulsions)
From Figure 5.4 it can be observed that in citrus pectin emulsions at pH 4.2, the droplet sizes
decreased with increasing DM. In this case, at 0.5% pectin, CP 16 exhibited the largest droplet
size while CP 95 depicted the least droplet size. This was in agreement with studies by Verrijssen
et al. (2014) with HM pectin showing smaller droplet sizes compared to LM pectin. It is
suggested that the presence of more methyl groups in HM pectin partake in hydrophobic
interactions that sufficiently reduce the interfacial tension between the oil/water interface
which improves the emulsifying potential of HM pectin hence the smaller particle sizes (Van
Buren, 1991). On the other hand, for LM pectin presence of few methylester groups limited
hydrophobic interactions thus the larger droplets observed.
When the pH of the solutions was increased to 6.2, a similar trend of droplet size increasing
with decreasing DM was observed but with the droplets at this pH being slightly bigger than at
pH 4.2. In the case of CP 16 this was more pronounced. A possible explanation may be that at
pH 6.2 which is above the pKa of pectin, charge repulsion between the pectin molecules
coupled with the limited hydrophobic interactions (due to few methylester groups) may have

52
reduced the ability of pectin to approach the oil droplets giving rise to larger droplet sizes
(Aronson and Petko, 1993; Verheul and Roefs, 2004).
In the case of SBP, similar observations were made, with smaller sizes observed for SBP 60
compared to SBP 35 which can be attributed to methyl ester groups. Furthermore, comparing
CP and SBP of approximately similar DMs (SBP 35 and CP 35 in Figure 5.4) slightly smaller
droplets were seen for SBP at pH 6.2. Perhaps this can be attributed to the higher protein and
acetyl content of sugar beet pectin. The acetyl groups provide a level of steric hindrance while
the protein ably reduces the interfacial surface tension of the oil droplets facilitating effective
adsorption of the pectin (Dickinson, 2010; Ralet et al., 2003; Surh et al., 2006) thus allowing
formation of smaller droplets in SBP 35. The higher molar mass and and neutral sugars may
have facilited the greater adsorption in SBP. In addition, studies by Siew and Williams, (2008)
suggested that fractions of the adsorbed pectin are rich in ferulic acid. As such, SBP’s higher
ferulic acid content may have also enhanced its adsorption onto the oil droplet surfaces.
To gain more insight into the results observed in the microscopy examination, particle size
distribution was measured as mentioned earlier. From PSD results, it can be observed that
bimodal (two peaks) and multimodal (more than two peaks) distributions were obtained.
According to Trotta et al. (2001) this is expected if only a centripetal force such as ultra-turaxing
is applied. This results in non-homogenously distributed droplets in emulsions. PSD plots of CP
16 to CP 95 confirmed the observation of microscopy examination, with peak maxima shifting
more to the left with increasing DM indicating lower particle size as shown in Figure 5.5A and
5.5B. A similar trend was seen for the emulsions at pH 6.2 (Figure 5.5B).

53
pH 4.2 (0.5%) pH 6.2 (0.5%)
CP 16
500 µm
CP 35
500 µm
500 µm 500 µm
500 µm
CP 65
500 µm
500 µm
500 µm 500 µm
CP 95
SBP 35
SBP 60
pH 4.2 (0.5%) pH 6.2 (0.5%)
500 µm 500 µm
500 µm500 µm
Figure 5.4: Fluorescence microscopy images of citrus and sugar beet pectin emulsions at pH 4.2 and pH 6.2. Scale bar = 500 µm.

54
B A
Figure 5.5: PSD of citrus and sugar beet pectin emulsions of 0.5% pectin at (A) pH 4.2 and (B) pH 6.2.
Generally, comparing citrus and sugar beet pectin emulsions of a similar DM, it can be observed
that the PSD of CP 35 was larger than that of SBP 35 (Figure 5.5A and 5.5B). The higher amount
of acetyl groups and protein content in sugar beet as compared to citrus pectin may have
accounted for the differences since smaller droplet sizes suggests better emulsifying capacity of
pectin. The explanation for the results of PSD is similar to that of microscopy results.
5.3.1.2 Effect of pectin concentration on adsorption of pectin onto the oil droplet surface
In citrus pectin, increasing the pectin concentration resulted in an increase in droplet size. For
instance in citrus pectin emulsions of CP 16 at pH 4.2, the oil droplet sizes increased with
increasing pectin concentration as shown in Figure 5.6. Results of PSD confirmed this result with
the curve of 1% pectin concentration shifting more to the right compared to emulsions with

55
0.1% pectin 1% pectin
CP 16
500 µm
pH 4.2
CP 35
CP 65
CP 95
SBP 35
SBP 60
500 µm 500 µm
500 µm 500 µm
500 µm 500 µm 500 µm
500 µm 500 µm
500 µm 500 µm
500 µm 500 µm
Figure 5.6: Fluorescence microscopy images of citrus and sugar beet pectin emulsions at different pectin
concentrations. Scale bar = 500 µm.

56
A B
Figure 5.7: PSD plots of citrus and sugar beet pectin emulsions at pH 4.2 with (A) 0.1 % and (B) 1% pectin
concentrations.
0.1% pectin, indicating larger average particle sizes for 1% concentration as shown in Figure
5.7A and 5.7B. A similar trend was observed for CP 35 and CP 65 except CP 95 which decreased
in droplet size with increasing pectin concentration (Figure 5.7A and 5.7B). At a higher pectin
concentration, probably more repulsion of the pectin molecules occurs thus larger oil droplets
formed. With increasing pectin concentration, aggregate-like structures were observed at pH
4.2 in the rest of the DMs except DM 95. This may be attributed to the low electrostatic
repulsion forces between the pectin and oil droplets causing a decrease in the steric effect.
Therefore, several droplets may have come together through interactions of the polymer at
their surfaces leading to bridging flocculation hence the aggregate-like structures formed
(Doublier et al., 2000; Guzey and McClements, 2007). In addition, as suggested by Gharsallaoui
et al. (2010), at very high pectin concentration the surface of more than one droplet may be
adsorbed by the pectin molecules causing bridging flocculation. It is also possible that at a high

57
concentration, pectin forms a thick macromolecular multilayer (Dickinson and James, 2000;
Huang et al., 2001) thus the larger particle sizes.
In addition, the sugar beet pectin samples also showed an increase in droplet size with
increasing pectin concentration at pH 4.2 (Figure 5.6). Oil droplet aggregation at pH 4.2
especially in the 1% pectin emulsions of both SBP 35 and SBP 60 was probably due to the
concetraction effect causing bridging flocculation and low repulsion coupled with pectin-protein
interactions. At this pH protein is positively charged and pectin slightly negatively charged and
therefore their interaction may have enhanced the likelihood of aggregation occurring. On the
other hand, for both SBP 35 and SBP 60 at pH 6.2, no droplet aggregation was observed when
the pectin concentration was increased from 0.1 to 1%. This may be due to repulsion between
the negatively charged pectin molecules or between pectin and protein molcules at this pH
(Williams et al., 2004).
The PSD plots also showed differences in the patterns of the different pectin concentrations at
pH 4.2 (Figure 5.7). The PSD curves of the SBP emulsions shifted to the right (showing increased
particle sizes) as the concentration of pectin in the emulsions increased from 0.1% to 1%. In
addition, SBP 35 emulsions with 1% pectin depicted a multimodal distribution compared to
bimodal distribution by SBP 60 (Figure 5.7B). This was probably due to aggregate formation as
seen from the microscopy images where SBP 35 showed more aggregation than SBP 60 (Figure
5.6).
In conclusion, at a particular pH and pectin concentration the droplet sizes of both CP and SBP
pectin emulsions increased with decreasing DM. Increasing the pH to a pH above the pKa of
pectin and pI of protein led to an increase in the droplet sizes of the lower DMs. Furthermore,
the droplet sizes of the emulsions increased with increasing pectin concentration. Finally, sugar
beet pectin emulsions exhibited smaller particle sizes compared to citrus pectin samples of a
similar DM. It can be observed that CP samples of high DM and SBP samples were better
adsorbed on to the oil droplet surfaces than low DM pectin samples of CP.

58
5.4 Emulsion stability study
For this section, emulsions were prepared by ultra-high pressure homogenization.
Homogenization of the emulsions was aimed at producing emulsions of smaller droplet sizes for
greater stability (Williams et al., 2004). The homogenized emulsions containing pectin of
different DMs were analyzed for particle size distribution (PSD) before and during storage. For
end of storage results, images of emulsions as well as results of PSD at the highest storage
temperature (35 °C) will be shown as the changes in emulsion stability (if any) would be more
prominent at this temperature. This is based on the hypothesis that reactions in a food system
increase when the kinetic energy of the system increases leading to an increase in the thermal
energy of oil droplets. As such, droplet collisions increases due to loss of electrostatic repulsion
which renders the system unstable (Freitas and Müller, 1998). For interpretation of the PSD
plots, denotations d10, d50, d90 and D [4,3] are used, with d10, d50 and d90 representing the
particle diameter that 10%, 50% and 90% of the particles in the emulsion are smaller than,
respectively. In this research d90 of the PSD, will be explored. In addition, the pattern of PSD
measurements depicted will be described as monomodal, bimodal or multimodal depending on
the number of peaks either one, two or more peaks, respectively.
Immediately after homogenization all samples were physically similar and therefore to establish
differences or similarities in the emulsions, PSD was used.
After storage at temperatures of 4 °C, 20 °C and 35 °C for up to eight weeks, the effect of
several properties including pH, pectin concentration, applied homogenization pressure, added
protein, storage time and storage temperature on emulsion stability were examined. The results
obtained are presented and discussed below. Furthermore, the possible destabilization
mechanisms occuring during storage were investigated through microscopy examinations of the
emulsions.

59
5.4.1 Effect of DM and pH on stability of ultra-high pressure homogenized emulsions before
and after storage
A) Pectin emulsions
Before storage, for example, in citrus pectin emulsions of 0.5% pectin concentrations at pH 3.0
(Figure 5.8), it can be seen that the PSD of CP 16, CP 35 and CP 65 emulsions depicted similar
monomodal distributions of almost the same average particle size with slight differences in
%volume fraction. On the other hand, the PSD of CP 95 emulsions shifted more to the right
suggesting larger average particle diameter compared to the other citrus pectin emulsions. This
may be attributed to the very low amount of carboxylic groups in CP 95 thus no pectin
interactions occur (Axelos et al., 1991). Owing to this, the non-adsorbed oil droplets may have
aggregated or coalesced leading to final droplets of large sizes. (Axelos et al., 1991; Rao, 2013).
In the case of SBP, pectin emulsion of both SBP 35 and SBP 60 displayed similar PSD patterns of
monomodal distribution at pH 3.0 as shown in Figure 5.8.
When the pH was increased to 4.2 and 6.2, in citrus pectin-emulsions it could be observed that
as the DM increased from CP 16 to CP 95 PSD curves changed from monomodal to a multimodal
distribution with CP 16 shifting towards the right (large average droplet sizes) while CP 95
shifted to the left (towards smaller droplet sizes) as shown in Figure 5.8. In CP 95, perhaps due
to the low carboxylic groups that were charged, increasing the pH may not have led to any build
up in repulsion hence pectin molecules approach each other leading to the observed smaller
droplet sizes (Axelos et al., 1991). Furthermore, probably the high methyl groups in CP 95 may
have sufficiently decreased the interfacial tension through hydrophobic interactions resulting in
smaller average droplet sizes (Van Buren, 1991; Verrijssen et al., 2014).

60
Before storage
Figure 5.8:Particle size distribution curves of citrus and sugar beet pectin-emulsions at different pHs
before storage. Homogenization pressure = 250 bar.
After two weeks of storage, it can be observed from Figure 5.9A that for CP, stability was higher
in the low DM samples. Furthermore, the stability images showed a decrease in emulsion
stability with increasing pH (Figure 5.9A). For instance at pH 3.0, CP 16, CP 35, were still slightly
stable while CP 65 and CP 95 were visibly less stable. These changes became more pronounced
as pH increased (more clear phase separation) (Figure 5.9A). From the microscopy examination,
phase separation at pH 6.2 was mainly due to aggregation whereas coalescence was observed
at pH 4.2. As suggested by Gancz et al. (2005) and Gharsallaoui et al. (2010), at higher pH (above
the pKa of pectin) there is charge repulsion between the pectin molecules leading to larger
droplet sizes because of the limited compactness between the pectin molecules. This may have
led to greater degree of separation at the higher pH. On the other hand, in the case of SBP, both
emulsions appeared to exhibit less phase separation compared to the citrus pectin-emulsions
(Figure 5.9A). Sugar beet pectin’s higher protein and ferulic acid contents (cf. Table 5.1) than
citrus pectin may have accounted for its great emulsifying as well as stabilizing effect as
suggested by Leroux et al. (2003) and Siew and Williams, (2008). Furthermore, it is reported that
highly branched sugar beet pectin improves long term emulsion stability by covering the oil

61
effectively as well as the hydroxyl groups of the side chains improving the hydrophilic nature of
the pectin (Akhtar et al., 2002; Jung and Wicker, 2012).
2 W at 35 °C
35 ° C
pH 3.0
pH 4.2
pH 6.2
CP 16 CP 35 CP 65 CP 95 SBP 35 SBP 60
Figure 5.9: (A) Emulsion stability study images of homogenized pectin emulsions (0.5% pectin) at
different pHs after two weeks of storage at 35 °C. Homogenization pressure = 250 bar.

62
0
2
4
6
8
0.01 0.1 1 10 100 1000
%V
olu
me
Particle diameter (µm)
0.5% pectin - pH 3.0
0
2
4
6
8
0.01 0.1 1 10 100 1000
%V
olu
me
Particle diameter (µm)
0.5% pectin - pH 6.2
0
2
4
6
8
0.01 0.1 1 10 100 1000
%V
olu
me
Particle diameter (µm)
0.5% pectin - pH 4.2
After storage
Figure 5.9: (B) Particle size distribution patterns of citrus and sugar beet pectin emulsions at different
pHs after two weeks of storage. Homogenization pressure = 250 bar.
As the pH increased to 4.2 and 6.2, all the partcile size in CP emulsions shifted towards larger
average particle sizes. A similar trend of increasing average particle size as pH increased was
observed in the sugar beet pectin samples (Figure 5.9B). Loss of electrostatic repulsions and/or
steric hindrance may have occurred during the storage period leading to loss of emulsion
stability (Guzey and McClements, 2007; Lopez-Sanchez and Farr, 2012)
B) Pectin-protein emulsions
Before storage, for pectin-protein emulsions (pectin emulsions with added BSA protein),
generally for CP pectin-protein emulsions, an increase in average particle size was observed
compared to pectin emulsions of CP (results not shown). As the DM increased from CP 16 to CP
95, monomodal and bimodal PSD was observed (Figure 5.10). At pH 3.0, the PSD of the CP 16
pectin-protein emulsion shifted to the right indicating larger particles while CP 95 shifted more
to the left indicating the least average particle diameter (Figure 5.10). Pectin around its pKa has
about 50% chargeable COO‾ groups which decrease as pH decreases hence being weakly
charged. For CP 95 probably the methyl groups are responsible for smaller size. As such, CP 16

63
with few methyl groups showed larger sizes. For low DMs, considering that at this pH, ionisation
of carboxylic groups is limited repulsions is less, therefore molecules can approach each other
may have led to pectin-protein interactions through associative ionic bonding of the few weakly
charged carboxylic groups (Lopes da Silva et al., 1994). This may have led to aggregation or
coalescence of droplets resulting in larger measured droplet sizes (Axelos et al., 1991; Dickinson,
2003). On the other hand, despite the presence of added protein in CP 95 emulsions, no
influence of protein was observed because of the very low chargeable carboxylic groups present
in CP 95 which did not seem to effectively initiate pectin-protein interactions (Axelos et al.,
1991; Dickinson, 1998; Kar and Arslan, 1999).
In the case of pectin-protein emulsions at pH of 3.0 prepared with SBP, SBP 60 shifted more to
the left depicting the smaller particle sizes compared to SBP 35 (Figure 5.10). But as the pH
increased to 4.2, SBP 35 shifted to the left with significant decrease in %volume fraction
compared to SBP 60 as shown in Figure 5.10. This could be explained by interactions between
the protein and the high number of carboxylic groups in the LM pectin (SBP 35) than in the HM
0
2
4
6
8
10
0.1 1 10 100 1000
%V
olu
me
Particle diameter (µm)
0.1 % - pH 3.0
0
2
4
6
8
10
0.1 1 10 100 1000
%V
olu
me
Particle diameter (µm)
0.1% - pH 4.2
0
2
4
6
8
10
0.1 1 10 100 1000
%V
olu
me
Particle diameter (µm)
0.1% - pH 6.2
Before storage
Figure 5.10: Particle size distribution curves of citrus and sugar beet pectin-protein emulsions at different
pHs before storage. Homogenization pressure = 250 bar.

64
pectin (SBP 60) there by forming a thick protective layer around the oil droplets which led to
larger droplet sizes (Akhtar et al., 2002). As the pH was further increased to 6.2, both samples
exhibited similar PSD patterns implying possible negligible influence of DM at this pH. In
addition, probably the carboxylic groups of SBP 60 also got fully charged at pH 6.2, which is
above the pKa of pectin. Strong repulsive forces of almost equal magnitude between strongly
negative pectin and negatively charged protein within both samples at this pH may account for
the similar PSD patterns observed (Surh et al., 2006).
In the case of pectin-protein emulsions in relation to the influence of pH, after two weeks of
storage at pH 3.0, although the addition of protein resulted in some degree of phase separation
in the CP 16 pectin-protein emulsion compared to the CP 16 pectin emulsions (Figure 5.11A), a
‘slight’ improvement in stability was observed in CP 65 and CP 95 pectin-protein emulsions
compared to their pectin-emulsions (Figures 5.11A). These observations were supported by the
PSD plots, where CP 16 demonstrated larger particles compared to the CP 65 and CP 95 (Figure
5.11B).
At low pH such as pH 3.0, HM pectins are more susceptible to hydrogen bonds and hydrophobic
interactions (example with protein) between the methyl ester groups which leads to
stabilization of the food system. On the other hand, LM pectins form strong electrostatic bonds
through cross linking with increasing ionic strength and pH (Thakur et al., 1997; Williams, 2011).
Furthermore, when the pH was increased from 4.2 to pH 6.2, for the low DMs of both CP and
SBP a slight “improvement” in stability could be proposed. Interestingly, at pH 6.2 all the citrus
pectin-protein emulsions appeared similar (from the stability images) (Figure 5.11A). This was
supported by the PSD plots which showed similar monomodal distribution patterns as well as
similar average sizes compared to bimodal and multimodal distributions of their pectin-
emulsions as shown in Figure 5.11B. Probably pectin-protein emulsions had all fully destabilized
hence the similar poor stabilities observed.

65
35 °C pectin emulsions (0.1%)
pH 4.2 pH 6.2 pH 4.2 pH 6.2
CP 16
CP 65
CP 95
SBP 35
SBP 60
35 °C pectin-protein emulsions (0.1%)
pH 3.0pH 3.0
Figure 5.11:(A) Emulsion stability images of homogenized pectin and pectin-protein emulsions at
different pHs after two weeks of storage at 35 °C. Homogenization pressure = 250 bar.

66
0
2
4
6
8
10
0.1 1 10 100 1000
%V
olu
me
Particle diameter (µm)
0.1% - pH 3.0 (pectin-protein emulsions)
0
2
4
6
8
10
0.1 1 10 100 1000
%V
olu
me
Particle diameter (µm)
0.1% - pH 4.2 (pectin-protein emulsions)
0
2
4
6
8
10
0.1 1 10 100 1000
%V
olu
me
Particle diameter (µm)
0.1% - pH 6.2 (pectin-protein emulsions)
After storage
Figure 5.11: (B) Particle size distribution curves of citrus and sugar beet pectin and pectin-protein
emulsions at different pHs after two weeks of storage. Homogenization pressure = 250 bar.
Regarding sugar beet pectin-protein emulsions, the stability of SBP35 was lowest at pH 3.0 but
as pH increased, less phase seperation was observed. At low pH, possibly the high number of
methyl groups of SBP 60 ensured less phase seperation than in the case of SBP 35. Less
creaming is observed in pectin-protein emulsions compared to pectin-emulsions of SBP. At pH
4.2, the interaction between pectin and protein probably provides some degree of stability
while at pH 6.2 stability can be attributed to repulsion forces.
5.4.2 Effect of pectin concentration on stability of ultra-high pressure homogenized
emulsion before and after storage
A) Pectin emulsions
Before storage, at a given homogenization pressure and pH, for CP emulsions average particle
sizes decreased with increasing pectin concentration for high DMs while for the low DM and a
slight increase in particle size may be suggested. Looking at Figure 5.12, CP 16 at 250 bar
attained a monomodal distribution with increasing pectin concentration from 0.1% to 1%. In
addition, a slight shift of PSD of droplets to the right was observed, indicating increasing droplet

67
size. CP 35 emulsions showed similar trends (Figure 5.12). On the other hand, the PSD of CP 65
and CP 95 shifted more to the left showing lower particle sizes.
For the sugar beet pectin emulsions, as the pectin concentration increased from 0.1% to 1%,
SBP 60 attained a monomodal distribution suggesting more uniformly dispersed droplets in the
emulsions as shown in Figure 5.12. SBP 35 remained monomodal in particle distribution with
increasing pectin concentration and increasing %volume fraction. Comparing the sugar beet
pectin samples to the citrus pectin samples, PSD of SBP did show prominent shifts with
increasing pectin concentration (Figure 5.12).
0
2
4
6
8
10
0.01 0.1 1 10 100 1000
%V
olu
me
Particle diameter (µm)
0.1% pectin - pH 4.2
0
2
4
6
8
10
0.01 0.1 1 10 100 1000
%V
olu
me
Particle diameter (µm)
0.5% pectin - pH 4.2
0
2
4
6
8
10
0.01 0.1 1 10 100 1000
%V
olu
me
Particle diameter (µm)
1% pectin - pH 4.2
Before storage
Figure 5.12: Particle size distribution curves of citrus and sugar beet pectin emulsions at different pectin
concentrations before storage. Homogenization pressure = 500 bar.
After two weeks of storage, it was observed that increasing the pectin concentration of pectin
emulsions from 0.1% to 1% showed increase in the stability of the emulsions irrespective of the
pH and DM. As can be seen from images in Figure 5.13A, pectin-emulsions at 0.1% showed a
greater degree of separation compared to those at 1%. The phase separation of 0.1% emulsions
was as a result of oil droplet growth due to coalescence as seen from the microscopy

68
examinations after storage (results not shown). For CP separation became more prominent with
increasing DM and emulsions of SBP were still more stable at 0.5% (Figure 5.13A). From Figure
5.13B, the PSD plots showed that the different pectin concentrations of the pectin emulsions
exhibited bimodal and multimodal distributions. Nonetheless, the 1% pectin concentration
emulsions showed the best stabilization (Figure 5.13A). Probably in these emulsions sufficient
covering of the oil droplets enhances emulsion stability, higher pectin concentration is required
for such a phenomenon (Leroux et al., 2003). This supports the observation of increased
2 W at pH 4.2
35 ° C
0.1%
0.5%
1%
CP 16 CP 35 CP 65 CP 95 SBP 35 SBP 60
Figure 5.13: (A) Emulsion stability study images of homogenized pectin emulsions at different pectin
concentrations after two weeks of storage at 35 °C. Homogenization pressure = 500 bar.

69
After storage
Figure 5.13: (B) Particle size distribution curves of citrus and sugar beet pectin emulsions at different
pectin concentrations after storage. Homogenization pressure = 500 bar.
stability as concentration of pectin increased. It is likely that the higher viscosities depicted by
high pectin concentration solutions gave rise to stable matrices which resisted environmental
conditions and might have enhanced the stability (Saha and Bhattacharya, 2010). This was
affirmed from the viscosity results of the pectin solutions where apparent viscosity increased
with increasing pectin concentration at a given DM and pH as shown in Figure 5.3 and Table 5.2.
In general, it can be observed that the 0.1% emulsions were relatively unstable at the different
conditions.
B) Pectin-protein emulsions
Regarding the pectin-protein emulsions before storage, the PSD of CP 16 pectin-protein
emulsions shifted more to the right showing an increase in particle size compared to CP 16
pectin emulsions (results not shown). The presence of protein may have enhanced pectin-
protein interactions especially in the LM pectin, CP 16, leading to thick protective layers of
protein and pectin around the droplets which resulted in overall droplets of larger sizes (Guzey
and McClements, 2007) or even aggregation. On the other hand, PSD of CP 65 and CP 95 pectin-

70
protein emulsions shifted more to the left compared to their pectin emulsions even after
storage as shown in Figure 5.14. This maybe attributed to the low amount of carboxylic groups
in the HM pectins resulting in limited pectin-protein interactions especially in CP 65 whereas in
CP 95 probably no interactions may have occurred (Axelos et al., 1991; Gancz et al., 2005; Rao,
2013). Similarly, for the sugar beet pectin-protein emulsions, SBP 35 shifted more to the right
compared to its pectin emulsions, while SBP 60 shifted more to the left towards the smaller
particle sizes compared to larger particle sizes of its pectin emulsions (even after storage as
shown in Figure 5.14). Owing to the high amount of carboxylic groups present in SBP 35, pectin-
protein interactions were enhanced and may have led to a thick layer around the oil droplets
hence the larger sizes measured (Siew and Williams, 2008) or aggregation of droplets may have
cause the larger observed size.
0
2
4
6
8
10
0.1 1 10 100 1000
%V
olu
me
Particle diameter (µm)
0.1 % - pH 3.0 (pectin-protein emulsions)
0
2
4
6
8
10
0.1 1 10 100 1000
%V
olu
me
Particle diameter (µm)
0.1% - pH 3.0 (pectin-protein emulsions)
After storageBefore storage
Figure 5.14: Particle size distribution plots of pectin-protein emulsions of citrus and sugar beet pectin of
0.1% pectin and 0.1% protein concentrations at pH of 3.0 before and after storage. Homogenization
pressure = 500 bar.
After storage, the pectin-protein emulsions generally depicted an increase in droplet size at a
given pectin concentration of 0.1% (Figure 5.14).

71
5.4.3 Effect of pressure on stability of ultra-high pressure homogenized emulsions before
and after storage
A) Pectin emulsions
Before storage, the impact of pressure on PSD of the CP emulsions of different DMs showed a
shift of PSD towards the smaller particle sizes (to the left) as pressure increased (Figure 5.15). As
the homogenization pressure increased from 250 to 1000 bar, the sugar beet pectin emulsions
also showed similar trends with average particle sizes decreasing with increasing pressure
(Figure 5.15). The lower pressures applied probably resulted in final droplet sizes of larger sizes
due to the time for droplet-droplet coalescence or aggregation being shorter than the sufficient
time required for adsorption of the pectin while at higher applied pressure, rapid stabilization of
the droplets against coalescence was attained (Surh et al., 2006; Williams et al., 2004). For the
sugar beet pectin emulsions a slight increase in average droplet size was noticed with
decreasing applied pressure. The higher ferulic acid and protein content in sugar beet pectin
compared to citrus pectin may have enhanced SBP adsorption onto the droplet surface (Akhtar
et al., 2002; Siew and Williams, 2008; Yuan et al., 2008).
0
2
4
6
8
10
0.01 0.1 1 10 100 1000
% V
olu
me
Particle diameter (µm)
0.5% pectin - pH 4.2
250 bar
0
2
4
6
8
10
0.01 0.1 1 10 100 1000
% V
olu
me
Particle diameter (µm)
0.5% pectin - pH 4.2
500 bar
0
2
4
6
8
10
0.01 0.1 1 10 100 1000
% V
olu
me
Particle diameter (µm)
0.5% pectin - pH 4.2
1000 bar
Before storage
Figure 5.15: Particle size distribution plots of the pectin emulsions of citrus and sugar beet pectin at
different homogenization pressures for a given pH and pectin concentration before storage.

72
CP 16
0.5%
CP 35 CP 65 CP 95 SBP 35 SBP 602 weeks pH 4.2
at 35 °C250 500 1000 bar 250 500 1000 bar 250 500 1000 bar 250 500 1000 bar 250 500 1000 bar 250 500 1000 bar
Figure 5.16: (A) Emulsion stability study images (after two weeks) of pectin emulsions homogenized at different pressures and stored at 35 °C.
After storage
Figure 5.16 (B): Particle size distribution patterns of citrus and sugar beet pectin emulsions at different homogenization pressures after storage.

73
Regarding the pectin emulsions stability after storage, the stability of pectin-emulsions
increased with increasing pressure as shown in Figure 5.16A after two weeks of storage.
Emulsions at 250 bar exhibited a higher degree of separation compared to those at 1000 bar
(especially in the low DM CP emulsions). For the 1% emulsions, microscopy examination
revealed that separation of homogenized emulsions at 250 bar and 1000 bar was due to
coalescence and aggregation, respectively. The initial PSD of the emulsions homogenized at
1000 bar was small, owing to this and the fact that the 1% pectin solutions used to prepare
these emulsions were more viscous, probably movement was limited thus less collision of
droplets. For CP-emulsions, when the DM increased from 16 to 95, decreasing stability was
observed (Figure 5.16A). This observation was complimented by the PSD plots which
depicted larger average particle sizes of emulsions at 250 bar compared to those at 1000 bar
with greater %volume of the emulsions at 1000 bar (Figure 5.16B). As smaller droplets are
more likely to be stable compared to larger ones, emulsions homogenized at 1000 bar were
more stable.
B) Pectin-protein emulsions
A similar influence of pressure was observed for the pectin-protein emulsions of both pectin
types, with decreasing average particle size as the applied homogenization pressure
increased as shown in Figure 5.17. In addition, owing to pressure-induced unfolding of
protein molecules and further biopolymer-biopolymer interactions in the presence of
polysaccharides such as pectin, could have strongly influenced adsorption of the pectin onto
the oil droplets surface hence the formation of smaller droplet sizes as pressure increased
(Dickinson and James, 2000).
After storage, both pectic-protein emulsions of both pectin sources depicted slight increase
in droplet size as shown in Figure 5.17.

74
0
2
4
6
8
10
12
0.1 1 10 100 1000
%V
olu
me
Particle diameter (µm)
0.1% - pH 3.0
250 bar
0
2
4
6
8
10
12
0.1 1 10 100 1000%
Vo
lum
eParticle diameter (µm)
0.1% - pH 3.0
1000 bar
Before storage
Figure 5.17: Particle size distribution plots of the pectin-protein emulsions of citrus and sugar beet
pectin at different homogenization pressures for a given pH and pectin concentration before storage.
5.4.4 Effect of storage temperature on stability of ultra-high pressure homogenized
emulsions
A) Pectin-emulsions
Looking at the stability images of any given DM, pectin concentration or pH (citrus pectin
emulsions), faster phase separation was observed at the highest storage temperature (35 °C)
compared to the lower temperatures (20 °C and 4 °C) after two weeks of storage (Figure
5.18A). The emulsions at the lowest temperature exhibited a lower degree of phase
separation. Higher temperatures increase the thermal energy of the whole emulsion system
leading to loss of entanglement of the conformational structure of the viscous emulsion (Kar
and Arslan, 1999; Milani and Maleki, 2012). Owing to this, oil droplets will easily diffuse
through the solution and come more in contact with each other leading to creaming or
coalescence or aggregation, all which are mechanisms that may cause emulsion
destabilization (Rao, 2013). Furthermore, at 35 °C for the citrus pectin emulsions, slightly less
phase separation was observed at pH 4.2 compared to that at pH 6.2. On the other hand, the
sugar beet pectin emulsions appeared more stable at the different pHs (Figure 5.18A). In
relation to the PSD plots, the PSD patterns only shifted slightly to the right indicating only

75
4 °C (0.5%)
2 W
pH 4.2
pH 6.2
35 °C (0.5%)
2W
pH 4.2
pH 6.2
CP 16 CP 65 CP 95 SBP 35 SBP 60CP 35
Figure 5.18: (A) Emulsion stability study images of homogenized pectin-emulsions of citrus and sugar
beet pectin at different pHs after two weeks of storage at 4 °C and 35 °C. Homogenization pressure =
500 bar.

76
After storage
Figure 5.18: (B) Particle size distribution curves of the pectin-emulsions of citrus and sugar beet
pectin at different pHs after two weeks of storage at 35 °C. Homogenization pressure = 500 bar.
slight increase in particle size while the citrus pectin emulsions depicted an increase in
%volume fraction and average particle size after storage (Figure 5.18B).
B) Pectin-protein emulsions
Similarly, the pectin-protein emulsions depicted phase separation in both pectin types after
storage under the highest storage temperature (35 °C) with more pronounced separation in
the citrus pectin samples. PSD plots also affirmed this with sugar beet and citrus pectin-
protein emulsions of similar DMs showing a shift to the right (towards the larger particle
sizes).
Generally, from the citrus and sugar beet pectin emulsions stability study, increasing pectin
concentration increased the stability of emulsions at a given DM and pH. Emulsion stability
also increased with increasing homogenization pressure accompanied by decreasing DM. On
the other hand, high temperature as well as with prolonged storage periods promoted
emulsion destabilization. Regarding the pectin emulsions, CP 16 showed the best stability for
the CP samples whereas both SBP samples depicted approximately similar stabilities.
Addition of protein in the preparation of protein-pectin emulsions did not exert any
improvement in stability of both CP and SBP samples.

77
In conclusion, the sugar beet pectin samples exhibited less physical separation, hence
greater stability than the citrus pectin samples. This may be due to structural differences in
these pectin sources. The better emulsifying and stabilizing effects of SBP may be attributed
its high acetyl and protein content in addition to high degree of branching (neutral sugars)
and polymerization (Jung and Wicker, 2012). SBP was still a better emulsifier than CP with
lower neutral sugar content. The poor emulsifying and stabilizing properties of CP are
probably due to low molecular weight, low protein and low acetylation content, low neutral
sugars content as well as low ferulic acid content.

78
6 GENERAL CONCLUSION
Extracted pectin is important in the food industry owing to its ability to improve structural
and functional properties of plant-based products. Its health benefits make it an even more
preferred functional food ingredient in several applications aimed at producing safe, healthy
and convenient foods. Although extracted pectin is mainly used in gelling, thickening and
stabilizing applications, the potential use of this polysaccharide as an emulsifying agent has
gained attention from some researchers and is the basis of this research.
The objective of this research was to investigate the effect of pectin structure on the
emulsifying capacity as well as the emulsion stabilizing capacity of citrus and sugar beet
pectins.
Commercially available citrus and sugar beet pectins with degrees of methylesterification
(DM) of 95% and 60%, respectively were structurally modified by incubating their watery
solutions for different periods in presence of carrot pectin methylesterase (PME). For citrus
pectin, the DMs of the resulting pectin were DM 65%, DM 35% and DM 16%, denoted as CP
16, CP 35 and CP 65, respectively. In the case of sugar beet pectin, a DM of 35% (denoted as
SBP 35) was obtained. The starting pectins (DM 95% and DM 60%, for CP and SBP,
respectively) were included as controls and denoted as CP 95 and SBP 60. Subsequent
characterization of various pectin structural properties (protein content, degree of
acetylation, degree of feruloylation, galacturonic acid, neutral sugars and molar mass)
revealed that no differences in these properties were exhibited by pectin samples from the
same source. Investigation of the emulsifying and emulsion stabilizing potential of the pectin
samples showed variations.
When considering the possible stabilizing capacity of both pectin types, the viscosity of the
pectin solutions plays an important role. Therefore, the apparent viscosity of the pectin
solutions was measured and results showed that it decreased as the DM of pectin increased
at any given pH and pectin concentration. CP 95 remained more or less constant with
increasing pH. By increasing the pectin concentration a significant increase in apparent
viscosity of the solutions was observed. High pectin concentrations being more concentrated
79
led to restricted movement within the solution and this enhanced the viscosity of the
solution. LM pectin solutions (CP 16 and CP 35) exhibited a shear thinning behavior which
was more pronounced as pH increased. Possibly, the loss in the network entanglement in LM
citrus pectin led to the significant influence of increasing shear rate on the viscosity of the
pectin solutions. The HM citrus pectin as well as the sugar beet pectin solutions exhibited
more or less a Newtonian behavior. Comparing the viscosities of the citrus and sugar beet
pectin solutions of a similar DM, i.e. CP 35 to SBP 35, SBP 35 showed a higher viscosity than
CP 35. Probably, acetyl groups which can lower the hydrophobicity of pectin leading to an
increase in the solubility of pectin facilitated the modification of the viscosity of the aqueous
medium.
Considering that the emulsifying potential can is attributed to the ability of an emulsifier (in
this case pectin) to adsorb onto the oil droplet surface in an emulsion, adsorbing capacity
was examined. For the citrus pectin samples, pectin with the lowest DM (CP 16) depicted the
largest droplet sizes as compared to CP 95 which had the smallest droplet sizes. A similar
trend was observed in SBP emulsions. Increasing pectin concentration increased the droplet
sizes in both CP and SPB emulsions. In citrus pectin, high DM pectin exhibited better
emulsifying potential than low DM pectin. Finally, the sugar beet pectin emulsions generally
depicted smaller droplet sizes compared to citrus pectin emulsions of a similar DM. Based on
the smaller droplet sizes of sugar beet pectin emulsions, this pectin type showed better
emulsifying properties than citrus pectin emulsions since the strong adsorption of a better
emulsifier gives rise to smaller droplets.
Stability studies on the emulsions prepared with watery pectin solutions showed that
stability increasing with decreasing storage temperature (35 °C, 20 °C and 4 °C). Results at 35
°C were presented in detail and these represent stability studies under accelerated
conditions. Before storage of citrus and sugar pectin emulsions, the initial droplet
size/particle size increased with increasing DM, pH as well as pectin concentration. In
addition, increasing homogenization pressure decreased the particle sizes of the pectin
emulsions at a given pectin concentration and pH. Storage temperature significantly

80
influenced the emulsion stability with a high degree of phase separation being observed at
35 °C compared to the lower temperatures 20 °C and 4 °C with sugar beet pectin emulsions
appearing more stable than the citrus pectin emulsions. The increase in thermal energy of
the whole system (emulsion) due to the high temperature may have caused greater degree
of phase separation. Similar trends were observed in the pectin-protein emulsions of both
pectin types prior to storage.
In general, although high DM pectin was better adsorbed onto the oil droplet surfaces at the
start of storage, it did not exhibit good emulsion stabilizing properties during storage.
Instead, it was the low DM pectin that exhibited better stabilizing properties. On the other
hand, sugar beet pectin samples portrayed better emulsifying and stabilizing capacity than
the citrus pectin samples as seen from images, microscopy and particle size distribution.
Although the presence of higher neutral sugars in sugar beet is reported to reduce its
thickening, gelling and stabilizing effects. Perhaps, the effect of high molecular weight, high
acetyl groups as well as high protein content was more effective than the downside of high
neutral sugars, leading to better emulsifying and stabilizing potential of sugar beet pectin.
Stabilization of the sugar beet pectin emulsions was further improved by increasing the
concentration of the emulsifier (pectin), reducing pH and increasing the homogenization
pressure.
It can thus be concluded that pectin structure influences the emulsifying and stabilizing
capacity of pectin.
This research presented relevant information on the effect of some processing parameters
on the functionality of citrus and sugar beet pectins. It also established some functional
properties with specific processing parameters which can form a basis for optimization of
some emulsion-based foods.
i
REFERENCES
Akhtar, M., Dickinson, E., Mazoyer, J., Langendorff, V., 2002. Emulsion stabilizing properties of depolymerized pectin. Food Hydrocoll. 16, 249–256. doi:10.1016/S0268-005X(01)00095-9
Alistair, M.S., Glyn, O.P., Peter, A.W., 2014. Food polysaccharides and their applications. CRC Press, Florida, pp. 357–364.
Aronson, M.P., Petko, M.F., 1993. Highly Concentrated Water-in-Oil Emulsions: Influence of Electrolyte on Their Properties and Stability. J. Colloid Interface Sci. 159, 134–149. doi:10.1006/jcis.1993.1305
Axelos, M.A. V, Lefebvre, J., Qiu, C.G., Rao, M.A., 1991. Rheology of pectin dispersions and gels, in: Walter, R.. (Ed.), The Chemistry and Technology of Pectin. Academic Press, San Diego, pp. 227–230.
Cakmak, I., Romheld, V., 1997. Boron deficiency-induced impairments of cellular functions in plants. Plant Soil 193, 71–83.
Coenen, G.J., Bakx, E.J., Verhoef, R.P., Schols, H.A., Voragen, A.G.J., 2007. Identification of the connecting linkage between homo- or xylogalacturonan and rhamnogalacturonan type I. Carbohydr. Polym. 70, 224–235. doi:10.1016/j.carbpol.2007.04.007
Dalia, S., Valery, B., Dmitry, S., Gilead-Gropper, S., Timor, B., Gil, S., Yuval, S., 2002. The identification of the acid–base catalyst of α-arabinofuranosidase from Geobacillus stearothermophilus T-6, a family 51 glycoside hydrolase. FEBS Lett. 514, 163–167. doi:10.1016/S0014-5793(02)02343-8
Dashek, W. V., 1997. Methods in Plant Biochemistry and Molecular Biology. CRC Press.
De Roeck, A., Duvetter, T., Fraeye, I., Van der Plancken, I., Sila, D.N., Loey, A. Van, Hendrickx, M., 2009. Effect of high-pressure/high-temperature processing on chemical pectin conversions in relation to fruit and vegetable texture. Food Chem. 115, 207–213.
De Vries, J.A., Rombouts, F.M., Voragen, A.G.J., Pilnik, W., 1982. Enzymic degradation of apple pectins. Carbohydr. Polym. 2, 25–33. doi:10.1016/0144-8617(82)90043-1
Dickinson, E., 2010. Flocculation of protein-stabilized oil-in-water emulsions. Colloids Surf. B. Biointerfaces 81, 130–40. doi:10.1016/j.colsurfb.2010.06.033
Dickinson, E., 2003. Hydrocolloids at interfaces and the influence on the properties of dispersed systems. Food Hydrocoll. 17, 25–39. doi:10.1016/S0268-005X(01)00120-5

ii
Dickinson, E., 1998. Stability and rheological implications of electrostatic milk protein–polysaccharide interactions. Trends Food Sci. Technol. 9, 347–354. doi:10.1016/S0924-2244(98)00057-0
Dickinson, E., James, J.D., 2000. Influence of high-pressure treatment on β-lactoglobulin – pectin associations in emulsions and gels. Food Hydrocoll. 14, 365–376.
Dickson, E., Bergenstahl, B., 2004. Food colloids: Proteins, lipids and polysaccharides. Woodhead Publising Limited, Cambridge.
Doublier, J.-L., Garnier, C., Renard, D., Sanchez, C., 2000. Protein–polysaccharide interactions. Curr. Opin. Colloid Interface Sci. 5, 202–214. doi:10.1016/S1359-0294(00)00054-6
Dronnet, V.M., Renard, C.M.G.C., Axelos, M.A.V., Thibault, J.-F., 1996. Characterisation and selectivity of divalent metal ions binding by citrus and sugar-beet pectins. Carbohydr. Polym. 30, 253–263. doi:10.1016/S0144-8617(96)00107-5
Duvetter, T., Sila, D.N., Van Buggenhout, S., Jolie, R., Van Loey, A., Hendrickx, M., 2009. Pectins in processed fruit and vegetables: Part I-Stability and catalytic activity of pectinases. Compr. Rev. Food Sci. Food Saf. 8, 75–85. doi:10.1111/j.1541-4337.2009.00070.x
Einhorn-Stoll, U., Ulbrich, M., Sever, S., Kunzek, H., 2005. Formation of milk protein–pectin conjugates with improved emulsifying properties by controlled dry heating. Food Hydrocoll. 19, 329–340. doi:10.1016/j.foodhyd.2004.07.005
Esteban, R., Dopico, B., Muñoz, F.J., Romo, S., Martín, I., Labrador, E., 2003. Cloning of a Cicer arietinum beta-galactosidase with pectin-degrading function. Plant Cell Physiol. 44, 718–725.
Fissore, E.N., Matkovic, L., Wider, E., Rojas, A.M., Gerschenson, L.N., 2009. Rheological properties of pectin-enriched products isolated from butternut (Cucurbita moschata Duch ex Poiret). LWT - Food Sci. Technol. 42, 1413–1421. doi:10.1016/j.lwt.2009.03.003
Fraeye, I., Deroeck, a, Duvetter, T., Verlent, I., Hendrickx, M., Vanloey, a, 2007. Influence of pectin properties and processing conditions on thermal pectin degradation. Food Chem. 105, 555–563. doi:10.1016/j.foodchem.2007.04.009
Fraeye, I., Duvetter, T., Doungla, E., Van Loey, A., Hendrickx, M., 2010. Fine-tuning the properties of pectin–calcium gels by control of pectin fine structure, gel composition and environmental conditions. Trends Food Sci. Technol. 21, 219–228. doi:10.1016/j.tifs.2010.02.001

iii
Freitas, C., Müller, R.H., 1998. Effect of light and temperature on zeta potential and physical stability in solid lipid nanoparticle (SLN®) dispersions. Int. J. Pharm. 168, 221–229. doi:10.1016/S0378-5173(98)00092-1
Fuchs, N.K., 2004. Modified citrus pectin (MCP): A super nutraceutical. Basic Health Publications, Inc., North Bergen.
Gancz, K., Alexander, M., Corredig, M., 2005. Interactions of high methoxyl pectin with whey proteins at oil / water interfaces at acid pH. J. Agric. Food Chem. 53, 2236–2241.
Gharsallaoui, A., Yamauchi, K., Chambin, O., Cases, E., Saurel, R., 2010. Effect of high methoxyl pectin on pea protein in aqueous solution and at oil/water interface. Carbohydr. Polym. 80, 817–827. doi:10.1016/j.carbpol.2009.12.038
Gou, J.-Y., Miller, L.M., Hou, G., Yu, X.-H., Chen, X.-Y., Liu, C.-J., 2012. Acetylesterase-Mediated Deacetylation of Pectin Impairs Cell Elongation, Pollen Germination, and Plant Reproduction. Plant Cell 24, 50–65. doi:10.1105/tpc.111.092411
Guzey, D., McClements, D.J., 2007. Impact of electrostatic interactions on formation and stability of emulsions containing oil droplets coated by beta-lactoglobulin-pectin complexes. J. Agric. Food Chem. 55, 475–85. doi:10.1021/jf062342f
Hellín, P., Ralet, M.-C., Bonnin, E., Thibault, J-F., 2005. Homogalacturonans from lime pectins exhibit homogeneous charge density and molar mass distributions. Carbohydr. Polym. 60, 307–317. doi:10.1016/j.carbpol.2005.01.017
Hill, C. a. S., Jones, D., Strickland, G., Cetin, N.S., 1998. Kinetic and Mechanistic Aspects of the Acetylation of Wood with Acetic Anhydride. Holzforschung 52, 623–629. doi:10.1515/hfsg.1998.52.6.623
Houben, K., Jamsazzadeh Kermani, Z., Van Buggenhout, S., Jolie, R.P., Van Loey, A.M., Hendrickx, M.E., 2012. Thermal and high-pressure stability of pectinmethylesterase, polygalacturonase, β-galactosidase and α-arabinofuranosidase in a tomato Matrix: Towards the creation of specific endogenous enzyme populations through processing. Food Bioprocess Technol. 6, 3368–3380. doi:10.1007/s11947-012-0984-5
Huang, X., Kakuda, Y., Cui, W., 2001. Hydrocolloids in emulsions: Particle size distribution and interfacial activity. Food Hydrocoll. 15, 533–542. doi:10.1016/S0268-005X(01)00091-1
Iwanaga, D., Gray, D., Decker, E.A., Weiss, J., McClements, D.J., 2008. Stabilization of soybean oil bodies using protective pectin coatings formed by electrostatic deposition. J. Agric. Food Chem. 56, 2240–2245.

iv
Jolie, R.P., Christiaens, S., De Roeck, A., Fraeye, I., Houben, K., Van Buggenhout, S., Van Loey, A.M., Hendrickx, M.E., 2012. Pectin conversions under high pressure: Implications for the structure-related quality characteristics of plant-based foods. Trends Food Sci. Technol. 24, 103–118. doi:10.1016/j.tifs.2011.11.003
Jung, J., Wicker, L., 2012. Laccase mediated conjugation of sugar beet pectin and the effect on emulsion stability. Food Hydrocoll. 28, 168–173. doi:10.1016/J.FOOHYD.2011.12.021
Kaji, A., Yoshihara, O., 1971. Properties of purified α-L-arabinofuranosidase from Corticium rolfsii. Biochim. Biophys. Acta 250, 367–371. doi:10.1016/0005-2744(71)90193-8
Kar, F., Arslan, N., 1999. Characterization of orange peel pectin and effect of sugars, l-ascorbic acid, ammonium persulfate, salts on viscosity of orange peel pectin solutions. Carbohydr. Polym. 40, 285–291. doi:10.1016/S0144-8617(99)00063-6
Kieliszewski, M.J., Shpak, E., 2001. Synthetic genes for the elucidation of glycosylation codes for arabinogalactan-proteins and other hydroxyproline-rich glycoproteins. Cell. Mol. Life Sci. 58, 1386–1398.
Klein, M., Aserin, A., Svitov, I., Garti, N., 2010. Enhanced stabilization of cloudy emulsions with gum Arabic and whey protein isolate. Colloids Surf. B. Biointerfaces 77, 75–81. doi:10.1016/j.colsurfb.2010.01.008
Kurita, O., Fujiwara, T., Yamazaki, E., 2008. Characterization of the pectin extracted from citrus peel in the presence of citric acid. Carbohydr. Polym. 74, 725–730. doi:10.1016/j.carbpol.2008.04.033
Kuuva, T., Lantto, R., Reinikainen, T., Buchert, J., Autio, K., 2003. Rheological properties of laccase-induced sugar beet pectin gels. Food Hydrocoll. 17, 679–684. doi:10.1016/S0268-005X(03)00034-1
Kyomugasho, C., Christiaens, S., Shpigelman, A., Van Loey, A.M., Hendrickx, M.E., 2015a. FT-IR spectroscopy, a reliable method for routine analysis of the degree of methylesterification of pectin in different fruit- and vegetable-based matrices. Food Chem. 176, 82–90. doi:10.1016/j.foodchem.2014.12.033
Kyomugasho, C., Willemsen, K., Christiaens, S., Van Loey, A.M., Hendrickx, M.E., 2015b. Pectin-interactions and in vitro bioaccessibility of calcium and iron in particulated tomato-based suspensions. Food Hydrocoll. 49, 164–175. doi:10.1016/j.foodhyd.2015.03.011
Leroux, J., Langendorff, V., Schick, G., Vaishnav, V., Mazoyer, J., 2003. Emulsion stabilizing properties of pectin. Food Hydrocoll. 17, 455–462. doi:10.1016/S0268-005X(03)00027-4

v
Levigne, S., Ralet, M.-C., Thibault, J.-F., 2002. Characterisation of pectins extracted from fresh sugar beet under different conditions using an experimental design. Carbohydr. Polym. 49, 145–153. doi:10.1016/S0144-8617(01)00314-9
Lopes da Silva, J.A., Gonçalves, M.P., Rao, M.A., 1994. Influence of temperature on the dynamic and steady-shear rheology of pectin dispersions. Carbohydr. Polym. 23, 77–87. doi:10.1016/0144-8617(94)90031-0
Lopez-Sanchez, P., Farr, R., 2012. Power Laws in the Elasticity and Yielding of Plant Particle Suspensions. Food Biophys. 7, 15–27. doi:10.1007/s11483-011-9238-8
Manrique, G.D., Lajolo, F.M., 2002. FT-IR spectroscopy as a tool for measuring degree of methyl esterification in pectins isolated from ripening papaya fruit. Postharvest Biol. Technol. 25, 99–107. doi:10.1016/S0925-5214(01)00160-0
Marcotte, M., Taherian Hoshahili, A.R., Ramaswamy, H.S., 2001. Rheological properties of selected hydrocolloids as a function of concentration and temperature. Food Res. Int. 34, 695–703. doi:10.1016/S0963-9969(01)00091-6
McClements, D.J., 1998. Food Emulsions: Principles, Practice, and Techniques. CRC Press.
Mcneil, M., Darvill, A.G., Albersheim, P., 1980. Structure of plant cell walls. Rhamnogalacturonan I, a structurally complex pectic polysaccharide in the walls of suspension-cultured sycamore cells. Plant Physiol. 66, 1128–1134.
Milani, J., Maleki, G., 2012. Hydrocolloids in food industry 2, 17–20.
Mirhosseini, H., Tan, C. P., Arezou, A., Hamid, N.S.A., Salmah, Y., Chern, B.H., 2008. Influence of pectin and CMC on physical stability, turbidity loss rate, cloudiness and flavor release of orange beverage emulsion during storage. Carbohydr. Polym. 73, 83–91. doi:10.1016/j.carbpol.2007.11.002
Mohnen, D., 2008. Pectin structure and biosynthesis. Curr. Opin. Plant Biol. 11, 266–277. doi:10.1016/j.pbi.2008.03.006
Moustacas, a M., Nari, J., Borel, M., Noat, G., Ricard, J., 1991. Pectin methylesterase, metal ions and plant cell-wall extension. The role of metal ions in plant cell-wall extension. Biochem. J. 279 ( Pt 2, 351–354.
Neirynck, N., Van der Meeren, P., Gorbe, B.S., Dierckx, S., Dewettinck, K., 2004. Improved emulsion stabilizing properties of whey protein isolate by conjugation with pectins. Food Hydrocoll. 18, 949–957. doi:10.1016/j.foodhyd.2004.03.004

vi
Neirynck, N., Van der Meeren, P., Lukaszewicz-Lausecker, M., Cocquyt, J., Verbeken, D., Dewettinck, K., 2007. Influence of pH and biopolymer ratio on whey protein–pectin interactions in aqueous solutions and in O/W emulsions. Colloids Surfaces A Physicochem. Eng. Asp. 298, 99–107. doi:10.1016/j.colsurfa.2006.12.001
Ngouémazong, D.E., Tengweh, F.F., Duvetter, T., Fraeye, I., Van Loey, A., Moldenaers, P., and, Hendrickx, M., 2011. Quantifying structural characteristics of partially de-esterified pectins. Food Hydrocoll. 25, 434–443. doi:10.1016/j.foodhyd.2010.07.015
Numan, M.T., Bhosle, N.B., 2006. Alpha-L-arabinofuranosidases: the potential applications in biotechnology. J. Ind. Microbiol. Biotechnol. 33, 247–60. doi:10.1007/s10295-005-0072-1
ØBro, J., Harholt, J., Scheller, H. V., Orfila, C., 2004. Rhamnogalacturonan I in Solanum tuberosum tubers contains complex arabinogalactan structures. Phytochemistry 65, 1429–38. doi:10.1016/j.phytochem.2004.05.002
Oosterveld, A., Beldman, G., Searle-van Leeuwen, M.J.F., Voragen, A.G.J., 2000. Effect of enzymatic deacetylation on gelation of sugar beet pectin in the presence of calcium. Carbohydr. Polym. 43, 249–256. doi:10.1016/S0144-8617(00)00174-0
Pedrolli, D.B., Monteiro, A.C., Gomes, E., Carmona, E.C., 2009. Pectin and pectinases: Production, characterization and industrial application of microbial pectinolytic enzymes. Open Biotechnol. J. 3, 9–18. doi:10.2174/1874070700903010009
Peng, Z.G., Hidajat, K., Uddin, M.S., 2005. Selective and sequential adsorption of bovine serum albumin and lysozyme from a binary mixture on nanosized magnetic particles. J. Colloid Interface Sci. 281, 11–7. doi:10.1016/j.jcis.2004.08.086
Ralet, M.C., Crépeau, M.J., Buchholt, H.C., Thibault, J.F., 2003. Polyelectrolyte behaviour and calcium binding properties of sugar beet pectins differing in their degrees of methylation and acetylation. Biochem. Eng. J. 16, 191–201. doi:10.1016/S1369-703X(03)00037-8
Rao, A., 2013. Rheology of Fluid, Semisolid, and Solid Foods: Principles and Applications, 3rd ed. Springer, Geneva, New York.
Rasmussen, C.V., Hanne, B.H, Åse, H., and Lone, M.L., 2001. pH-, temperature- and time-dependent activities of endogenous endo-β-D-xylanase, β-D-xylosidase and α-L-arabinofuranosidase in extracts from ungerminated rye (Secale cereale L.) grain. J. Cereal Sci. 34, 49–60. doi:10.1006/jcrs.2000.0376

vii
Ravanat, G., Rinaudo, M., 1980. Investigation on oligo- and polygalacturonic acids by potentiometry and circular dichroism. Biopolymers 19, 2209–2222. doi:10.1002/bip.1980.360191206
Renard, C.M.G.C., Thibault, J.-F., 1996. Degradation of pectins in alkaline conditions: kinetics of demethylation. Carbohydr. Res. 286, 139–150. doi:10.1016/0008-6215(96)00056-0
Renard, D., Valle, G.D. Popineau, Y., 2002. Plant biopolymer science: food and non-food applications. Royal Society of Chemistry, Manchester.
Ridley, B.L., Neill, M. A. O., A., Mohnen, D., 2001. Petcins: structure, biosynthesis and oligogalacturonide-related signaling. Phytochemistry 57, 929–967.
Saha, D., Bhattacharya, S., 2010. Hydrocolloids as thickening and gelling agents in food: a critical review. J. Food Sci. Technol. 47, 587–97. doi:10.1007/s13197-010-0162-6
Schmidt, U.S., Schmidt, K., Kurz, T., Endreß, H.-U., Schuchmann, H.P., 2015. Pectins of different origin and their performance in forming and stabilizing oil-in-water-emulsions. Food Hydrocoll. 46, 59–66. doi:10.1016/j.foodhyd.2014.12.012
Schuchmann, B.H.P., Schubert, H., 2003. Full Papers Product Design in Food Industry Using the Example of Emulsification 3, 67–76.
Searle-van Leeuwen, M.J.F., Van den Broek, L.A.M., Schols, H.A., Beldman, G., Voragen, A.G.J., 1992. Rhamnogalacturonan acetylesterase: a novel enzyme from Aspergillus aculeatus, specific for the deacetylation of hairy (ramified) regions of pectins. Appl. Microbiol. Biotechnol. 38, 347–349. doi:10.1007/BF00170084
Seymour, G.B., Knox, J.P., 2002. Pectins and their manipulation. Blackwell Publishing Ltd, Oxford.
Siew, C.K., Williams, P.A., 2008. Role of protein and ferulic acid in the emulsification properties of sugar beet pectin. J. Agric. Food Chem. 56, 4164–71. doi:10.1021/jf073358o
Sila, D.N., Van Buggenhout, S., Duvetter, T., Fraeye, I., De Roeck, A., Van Loey, A., Hendrickx, M., 2009. Pectins in processed fruits and vegetables: Part II-Structure-function relationships. Compr. Rev. Food Sci. Food Saf. 8, 86–104. doi:10.1111/j.1541-4337.2009.00071.x
Sila, D.N., Smout, C., Elliot, F., Van Loey, A., and Hendrickx, M., 2006. Non-enzymatic depolymerization of carrot pectin : Toward a better understanding of carrot texture during thermal processing. J. Food Sci. 71.

viii
Surh, J., Decker, E., McClements, D., 2006. Influence of pH and pectin type on properties and stability of sodium-caseinate stabilized oil-in-water emulsions. Food Hydrocoll. 20, 607–618. doi:10.1016/j.foodhyd.2005.07.004
Thakur, B.R., Singh, R.K., Handa, A.K., Rao, M.A., 1997. Chemistry and uses of pectin — A review. Crit. Rev. Food Sci. Nutr. 37(1), 47–73.
Tromp, R.H., de Kruif, C.G., van Eijk, M., Rolin, C., 2004. On the mechanism of stabilisation of acidified milk drinks by pectin. Food Hydrocoll. 18, 565–572. doi:10.1016/j.foodhyd.2003.09.005
Trotta, M., Gallarate, M., Pattarino, F., Morel, S., 2001. Emulsions containing partially water-miscible solvents for the preparation of drug nanosuspensions. J. Control. Release 76, 119–128. doi:10.1016/S0168-3659(01)00432-1
Turgeon, S.L., Schmitt, C., Sanchez, C., 2007. Protein–polysaccharide complexes and coacervates. Curr. Opin. Colloid Interface Sci. 12, 166–178. doi:10.1016/j.cocis.2007.07.007
Van Buggenhout, S., Sila, D.N., Duvetter, T., Van Loey, A., Hendrickx, M., 2009. Pectins in processed fruits and vegetables: Part III-Texture engineering. Compr. Rev. Food Sci. Food Saf. 8, 105–117. doi:10.1111/j.1541-4337.2009.00072.x
Van Buren, J.P., 1991. No Title, in: Walter, R.H. (Ed.), The Chemistry and Technology of Pectin. Academic Press, San Diego, pp. 1–18.
Verheul, M., Roefs, S.P.F.M., 2004. Food Colloids: Proteins, Lipids and Polysaccharides. Elsevier.
Verrijssen, T. a J., Balduyck, L.G., Christiaens, S., Van Loey, A.M., Van Buggenhout, S., Hendrickx, M.E., 2014. The effect of pectin concentration and degree of methyl-esterification on the in vitro bioaccessibility of ??-carotene-enriched emulsions. Food Res. Int. 57, 71–78. doi:10.1016/j.foodres.2014.01.031
Vincken, J., Schols, H.A., Oomen, R.J.F.J., Mccann, M.C., Ulvskov, P., Voragen, A.G.J., Visser, R.G.F., 2003. If homogalacturonan were a side chain of rhamnogalacturonan I . Implications for cell wall architecture. Plant Physiol. 132, 1781–1789. doi:10.1104/pp.103.022350.in
Visser, J., and Voragen, A.G.J., 1996. Pectins and Pectinases. Elsevier, Amsterdam.
Vithanage, C.R., Grimson, M.J., Wills, P.R., Harrison, P., A., Smith, B.G., 2010. Rheological and structural properties of high-methoxyl esterified, low-methoxyl esterified and low-

ix
methoxyl amidated pectin gels. J. Texture Stud. 41, 899–927. doi:10.1111/j.1745-4603.2010.00261.x
Voorhees, P.W., 1985. The theory of Ostwald ripening. J. Stat. Phys. 38, 231–252. doi:10.1007/BF01017860
Voragen, A.G.J., Coenen, G.-J., Verhoef, R.P., Schols, H.A., 2009. Pectin, a versatile polysaccharide present in plant cell walls. Struct. Chem. 20, 263–275. doi:10.1007/s11224-009-9442-z
Voragen, A.G.J., Schols, H., Visser, R., 2003. Advances in pectin and pectinase research. Springer Science & Business Media, Dordrecht.
Walter, R.H., 1991. The chemistry and technology of pectin. Food Science and Technology. A series of monographs. Academic Press, London.
Warmerdam, A., Paudel, E., Jia, W., Boom, R. M., and, Janssen, A. E., 2013. Characterization of β-galactosidase isoforms from Bacillus circulans and their contribution to GOS production. Appl. Biochem. Biotechnol. 41, 340–58. doi:10.1007/s12010-013-0181-7
Wijesundera, R.L.C., Bailey, J.A., Byrde, R.J.W., Fielding, A.H., 1989. Cell wall degrading enzymes of Colletotrichum lindemuthianum: their role in the development of bean anthracnose. Physiol. Mol. Plant Pathol. 34, 403–413. doi:10.1016/0885-5765(89)90067-2
Willats, W.G.T., Knox, J.P., Mikkelsen, J.D., 2006. Pectin: new insights into an old polymer are starting to gel. Trends Food Sci. Technol. 17, 97–104. doi:10.1016/j.tifs.2005.10.008
Williams, P.A., 2011. Renewable resources for functional polymers and biomaterials: Polysaccharides, proteins and polyesters. Royal Society of Chemistry.
Williams, P.A., Phillips, G.O., Chemistry, R.S. of, 2004. Gums and Stabilisers for the Food Industry 12, Volume 12. Royal Society of Chemistry.
Williams, P.A., Sayers, C., Viebke, C., Senan, C., Mazoyer, J., Boulenguer, P., 2005. Elucidation of the emulsification properties of sugar beet pectin. J. Agric. Food Chem. 53, 3592–7. doi:10.1021/jf0404142
Williamson, G., 1991. Purification and characterization of pectin acetylesterase from orange peel. Phytochemistry 30, 445–449.
Yapo, B.M., 2011a. Rhamnogalacturonan-I: A structurally puzzling and functionally versatile polysaccharide from plant cell walls and mucilages. Polym. Rev. 51, 391–413. doi:10.1080/15583724.2011.615962

x
Yapo, B.M., 2011b. Pectic substances: From simple pectic polysaccharides to complex pectins—A new hypothetical model. Carbohydr. Polym. 86, 373–385. doi:10.1016/j.carbpol.2011.05.065
Yapo, B.M., 2011c. Pectin Rhamnogalacturonan II: On the “Small Stem with four branches” in the primary cell walls of plants. Int. J. Carbohydr. Chem. 1–11. doi:10.1155/2011/964521
Yuan, Y., Gao, Y., Zhao, J., Mao, L., 2008. Characterization and stability evaluation of β-carotene nanoemulsions prepared by high pressure homogenization under various emulsifying conditions. Food Res. Int. 41, 61–68. doi:10.1016/j.foodres.2007.09.006
Zandleven, J., Sørensen, S.O., Harholt, J., Beldman, G., Schols, H.A., Scheller, H. V., Voragen, A.J., 2007. Xylogalacturonan exists in cell walls from various tissues of Arabidopsis thaliana. Phytochemistry 68, 1219–26. doi:10.1016/j.phytochem.2007.01.016


![S x[ ( ) *] y x Optimization ( )y S - Unione Geotermica · (c)() CINIGeo - National Interuniversity Consortium forNational Interuniversity Consortium for Georesources EngineeringEngineering](https://img.pdfslide.net/doc/110x75/5c65ee1d09d3f2f91c8b8726/s-x-y-x-optimization-y-s-unione-geotermica-c-cinigeo-national.jpg)