Embed Size (px)
Citation preview

INTERUNIVERSITY PROGRAMME
IN
PHYSICAL LAND RESOURCES
Ghent University
Vrije Universiteit Brussel
Belgium
Addressing climate variability in agricultural land evaluation.
Case study for crop production in Far North Cameroon
Promoter :
Prof. Dr. ir. Ann Verdoodt
Tutor
ir. Nele Delbecque
Tutor :
Master dissertation submitted in partial
fulfillment of the requirements for the
degree of Master of Science in Physical
Land Resources
by Hemerance Menekeu Awamu (Cameroon)
Academic Year 2013-2014
I C E

i
This is an unpublished M.Sc dissertation and is not prepared for further distribution.
The author and the promoter give the permission to use this Master dissertation for
consultation and to copy parts of it for personal use. Every other use is subject to the
copyright laws, more specifically the source must be extensively specified when
using results from this Master dissertation.
Gent,
The Promoter, The Author,
Prof. Dr. ir. Ann Verdoodt
Hemerance Menekeu Awamu
The Tutor,
ir. Nele Delbecque
ii
Acknowledgements
First of all, I am indebted to Prof. Dr. ir. Ann Verdoodt for accepting me as a student under her
supervision. I sincerely appreciate her ideas, advices and constructive critics for my thesis.
I also express my gratitude to Nele Delbecque for her excellent and consistent guidance. She was
always available whenever I needed any assistance. Her comments and encouragement helped me
pursue and complete my thesis. Without her, my thesis would not have been finished.
I am thankful to Prof. Dr. Eric Van Ranst, Yengoh and also friends back home who provided data for
the database.
Last but not least, I would like to thank my parents, brothers, sisters and friends for their moral
supports and encouragements during the academic course.
iii
Table of Contents
Acknowledgements ............................................................................................................................ ii
Table of Contents............................................................................................................................... iii
List of figures ..................................................................................................................................... vi
List of tables .................................................................................................................................... viii
Summary ............................................................................................................................................ x
Chapter 1: Introduction ......................................................................................................................1
1.1 Problem statement ...................................................................................................................1
1.2 Research questions and hypotheses ..........................................................................................2
1.3 Objectives .................................................................................................................................2
Chapter 2: Literature review ...............................................................................................................4
2.1 Climate, climate change and climate variability .........................................................................4
2.1.1 Weather versus climate ......................................................................................................4
2.1.2 Climate variability ...............................................................................................................4
2.1.3 Climate change ...................................................................................................................5
2.2 Impact of climate change and climate variability .......................................................................5
2.3 Approaches to assess climate variability ....................................................................................6
2.3.1 Statistical descriptives ........................................................................................................6
2.3.2 Frequency analysis..............................................................................................................6
2.3.3 Standardized Anomaly Index (SAI) ......................................................................................6
2.4 Agro-climatic indices .................................................................................................................6
2.4.1 Precipitation Concentration Index (PCI) ..............................................................................7
2.4.2 Modified Fournier Index (MFI) ............................................................................................8
2.4.3 Drought Indices ..................................................................................................................8
2.4.4 Climate Extreme Index (CEI) ................................................................................................9
2.4.5 Growing period analysis ......................................................................................................9

iv
2.5 Land Evaluation ....................................................................................................................... 10
2.5.1 Definition, historical development, overview of methods ................................................. 10
2.5.2 Climate variability impact assessment using the land capability classification system........ 12
2.5.3 Climate variability impact assessment using the crop-specific land suitability classification
(FAO) ........................................................................................................................................ 12
2.5.4 Crop modeling .................................................................................................................. 15
Chapter 3: Materials and methods .................................................................................................... 16
3.1 Materials ................................................................................................................................. 16
3.1.1 Study area ........................................................................................................................ 16
3.1.2 Climatic data..................................................................................................................... 19
3.1.3 Crop data .......................................................................................................................... 19
3.2 Methodology ........................................................................................................................... 20
3.2.1 Assessing climate and climate variability in the study area ................................................ 20
3.2.2 Assessing the impact of climate variability on land performance....................................... 24
3.2.3 Assessing climatic suitability ............................................................................................. 25
Chapter 4: Results and discussion ..................................................................................................... 28
4.1 Climate and climate variability in Extreme-Northern Cameroon .............................................. 28
4.1.1 Long-term average climate and general climate classification ........................................... 28
4.1.2 Inter-annual variation using annual climatic data .............................................................. 29
4.1.3 Seasonal, inter- and intra-annual variation using monthly data ......................................... 32
4.1.4 Frequency analysis applied to monthly data ..................................................................... 36
4.2 Impact of climate variability on growing period and crop yield ................................................ 38
4.2.1 Variation in start, end and length and quality of the growing period using decadal data ... 38
4.2.2 Number of rainy days and events of high daily rainfall and dry spells using daily rainfall
data .......................................................................................................................................... 40
4.2.3 Impact of temporal resolution on characterization of climate ........................................... 42
4.2.4 Sorghum and cotton production in Extreme Northern Cameroon ..................................... 43

v
4.2.5 Yields and climate variability ............................................................................................. 44
4.3 Sensitivity analysis of the land suitability classification to climate variation ............................. 47
4.3.1 Scoring of individual climatic characteristics using time-series data .................................. 47
4.3.2 Statistical analysis between annual rainfall, yields and scores from variable and fixed
sowing date approach. .............................................................................................................. 52
Chapter 5: Conclusion and recommendations ................................................................................... 55
5.1 Conclusion............................................................................................................................... 55
5.2 Recommendations .................................................................................................................. 55
References ........................................................................................................................................ 56
Annex I. Overview of materials used in the study .............................................................................. 64
Annex II. Overview of indices used in the evaluation of climatic variability ........................................ 75
Annex III. Annual ratings of climatic characteristics ........................................................................... 81

vi
List of figures
Figure 1. Example of hierarchical evaluation of crop-specific climate suitability (Holzkämper et al.,
2010)…………………………………………………………………………………………………...14
Figure 2. Map indicating location of study area of Maroua, located in the Extreme-North province of
Cameroon (adapted from Luventicus Academy of Sciences (2013a,b)………………………………………………16
Figure 3. (a) Annual rainfall, trend in annual rainfall and 10-year moving average and (b) Standardized
rainfall Anomaly Index (1951-2003) for Maroua-Salak (Extreme-Northern Cameroon) ……………………30
Figure 4. (a) Annual ETo and (b) Standardized ETo AnomalyIndex (1960-2004) for Maroua-Salak
(Extreme-Northern Cameroon). ........................................................................................................ 31
Figure 5. Annual mean maximum, minimum and mean temperature (1960-2004) for Maroua-Salak
(Extreme-Northern Cameroon) ......................................................................................................... 31
Figure 6. Long-term average (a) monthly maximum, minimum and mean temperature (1960-2004)
and (b) monthly rainfall and ETo (1951-2004) for Maroua-Salak (Extreme-Northern Cameroon) ....... 32
Figure 7. Temporal Precipitation Concentration Index (PCI) (1951-2003) for Maroua-Salak (Extreme-
Northern Cameroon).. ...................................................................................................................... 33
Figure 8. Intra-annual coefficient of variation (CV) of rainfall and annual rainfall (1951-2003) for
Maroua-Salak (Extreme-Northern Cameroon) ................................................................................... 34
Figure 9. Intra-annual coefficient of variation (CV) of temperature and mean annual temperature
(1960-2004) for Maroua-Salak (Extreme-Northern Cameroon).......................................................... 35
Figure10. Inter-annual coefficient of variation of rainfall (1951-2004) for Maroua-Salak (Extreme-
Northern Cameroon)………………………………………………………………………………………………………………………..36
Figure 11. Monthly rainfall for a typical wet year (probability of exceedance = 20%), typical normal
year (probability of exceedance = 50%) and typical dry year (probability of exceedance = 80%) for the
period (1960-2003) in Maroua-Salak (Extreme-Northern Cameroon) ................................................ 37
Figure 12. Growing period (1960-2004) for Maroua-Salak (Extreme-Northern Cameroon) using long-
term average data . ........................................................................................................................... 39
Figure 13. Number of rainy days with daily rainfall ≥ 3 mm and days with daily rainfall ≥ 40mm (1951-
2004) for Maroua-Salak (Extreme-Northern Cameroon) .................................................................... 41

vii
Figure 14.a) Number of dry spell days in the growing period and b) number of days in the growing
period with their minimum and maximum represented by the error bars and their median
represented by the stars (1960-2004) for Maroua-Salak (Extreme-Northern
Cameroon)……………………………………………………………………………………………...........................................42
Figure 15. Standardized rainfall anomly index and (a) wet season sorghum (b) dry season sorghum and (c) cotton in three different periods (1984-1989; 1990-1999 and 2000-2004) in Maroua (Extreme-Northern Cameroon)………………………………………………………………………………….....................................................45
Figure 16. Climatic rating for variable and fixed sowing date for (a) sorghum and (b) cotton for
Maroua-Salak (Extreme-Northern Cameroon). .................................................................................. 54

viii
List of tables
Table 1 Long-term average climatic conditions and agricultural calendar for different cotton, dry
season sorghum and wet season sorghum (Mahop et al., 1995)........................................................ 18
Table 2. Classification of SAI Values of inter-annual rainfall (according to Mckee et al., 1993, applied
by Manacelli G. 2005). ...................................................................................................................... 22
Table 3. Corresponding probability of exceedances of rainfall and ETo for a typical dry year, normal
year and wet year (Raes et al., 2006; FAO, 2008)............................................................................... 23
Table 4. Guidelines to define the suitability classes (based on FAO 1983). ......................................... 27
Table 5. Mean climatic parameters for the meteorological station of Maroua-Salak (Extreme-
Northern Cameroon). ....................................................................................................................... 28
Table 6.UNEP Aridity Index (I), Lang factor (L) and De Martonne Index (Im) and corresponding climatic
classification for Maroua-Salak (Extreme-Northern Cameroon)………………………………………………………..29
Table 7. Overview of severely dry, very wet and extremely wet years using annual rainfall data (1951-
2003) of Maroua-Salak (Extreme-Northern Cameroon) (according to Mckee et al., 1993, applied by
Manacelli G. 2005) ............................................................................................................................ 30
Table 8. Frequency analysis results for total annual rainfall, average monthly ETo, mean temperature
(Tmean) and mean relative humidity (RHmean) ................................................................................ 37
Table 9. Crop water requirement, annual rainfall and frequency analysis rainfall. ............................. 38
Table 10.Mean, standard deviation and range in start, end and length of growing period and humid
period (1960-2004) for Maroua-Salak (Extreme-Northern Cameroon) ............................................... 39
Table 11. statistical descriptive of the total production, total production area and yield of wet and dry
season sorghum and cotton (1984-2004) from the Departmental Delegation of Agriculture of Maroua
(Extreme-Northern Cameroon) ......................................................................................................... 43
Table 12. Correlation between total production and total production area of wet and dry season
sorghum and cotton (1984-2004) from the Departmental Delegation of Agriculture of Maroua
(Extreme-Northern Cameroon) ......................................................................................................... 44
Table 13. Correlation between annual rainfall and rainfall in the growing period and yield of cotton,
wet and dry season sorghum (1984-2004) from the Departmental Delegation of Agriculture of
Maroua (Extreme-Northern Cameroon) ............................................................................................ 46

ix
Table 14. Ratings of climatic characteristic from annual data and data of the different POE, climatic
index and climatic rating for fixed and variable sowing for wet sorghum (1960-2003) for Maroua
(Extreme-Northern Cameroon) ......................................................................................................... 49
Table 15. Ratings of climatic characteristic from annual data and data of the different POE, climatic
index and climatic rating for fixed and variable sowing for cotton (1960-2003) for Maroua (Extreme-
Northern Cameroon) ........................................................................................................................ 51
Table 16. P-value of correlation between annual rainfall and ratings of variable and fixed sowing date
approach (1960-2003) for wet sorghum and cotton, and between rating and yields of dry and wet
sorghum and cotton for Maroua (Extreme-Northern Cameroon). ..................................................... 52
Table 17. Overview Suitability classification given in number of years of climatic characteristics of a
fixed and variable sowing date for sorghum and cotton, and in POE (20%, 50%and 80%) using the
parametric method proposed by the FAO Land Suitability classification (FAO, 1993) for Maroua
(Extreme-Northern Cameroon). ........................................................................................................ 53

x
Summary
Given that Cameroon, like most developing countries, is strongly dependent on agriculture, the effect
of climate variability on the agricultural sector is capable of hastening the problem of food insecurity
and the threat of starvation. This is especially true in the case of the Extreme-Northern region of
Cameroon, characterized by its semi-arid climate, hence making it the most fragile zone in the
country. In this area, natural variability of rainfall is likely to contribute to variability in agricultural
productivity. This impact of climate variability on crop production is rarely accounted for in
traditional land evaluation methods. This thesis aims to address the sensitivity of the traditional land
suitability classification to climate variability. Using time series of climatic data on rainfall (1951-
2004), temperature (1960-2004), reference evapotranspiration (1960-2004) and relative humidity
(1968-1982), climate variability was studied and related to variations in yield of sorghum (1984-
2004), an important subsistence crop, and cotton (1984-2004), the main cash crop in the region.
Finally, the sensitivity of the FAO crop-specific land suitability classification to climate variability and
selection of sowing date was assessed. Evaluation of rainfall by means of several indices revealed
that the Extreme-Northern Cameroon is a region with a sharp seasonal contrast, with rainfall
fluctuation at inter-annual, intra-annual and decadal scales. The length of growing period of 135 days
on average, varied a lot from year to year, going from a minimum of 93 days to a maximum of 192
days. Even as 91% of the annual rainfall fell within the growing period, correlation between crop
yield response to annual rainfall was mainly limited to 1990-1999, a period during which agricultural
activities were highly dependent to climate. While suitability classification using long-term averages
demonstrated that in all the years, climate will be marginally suitable for cotton production, it was
found in the classification using variation in climatic characteristics with fixed sowing date approach
that 4 out of 43 years were wrongly classified, and 8 out of 43 years were misclassified with the
variable sowing date approach. Moreover, the classification using the probability of exceedance
showed that in two out of ten years, climate will be unsuitable, but potentially suitable for cotton
production. These important information missing in the suitability assessment when using only long-
term averages are reliable to understanding the impact of climate variability on yield. These findings
suggest that the accuracy, reliability and risk-averseness of land evaluation assessments can be
increased by explicitly taking into account climate variability into the methodological approaches.
Future research can be conducted to develop improved methods on how to better incorporate the
climate variability into the land suitability assessment.
Keywords: climate variability, cotton, sorghum, land evaluation, Extreme-Northern Cameroon,
growing period, dry spell

1
Chapter 1: Introduction
1.1 Problem statement
Global climate change and associated weather extremes continue posing considerable challenges
both on developed and developing countries. The Copenhagen Accord (2009) recognized that climate
change is one of the greatest challenges of the present. Although there are still large uncertainties
about the link between climate variability and climate change, increases in climate variability are
reported (IPCC, 2001). The impacts of climate variability and change have thus come to the forefront
of scientific research.
Although climate variability has devastating impacts for both developing and developed countries,
concerns are raised particularly with regards to the latter. Developing countries are recognized under
Articles 4.8 and 4.9 of the United Nations Framework Convention on Climate Change (UNFCCC) as
being the most vulnerable to the adverse effects of climate variability. The impacts are wide ranging,
and the link to land evaluation, land degradation assessments, desertification and deforestation,
amongst others, is obvious and profound.
Developing countries, and particularly those in the arid and semi-arid zones, are the most seriously
affected by land degradation (UNEP, 1986). About 46 per cent of the land in Africa is degraded. The
highest land degradation rates are found in Sub-Saharan Africa, where it is estimated that losses in
productivity of cropping land are in the order of 0.5-1 per cent annually (WMO, 2005). Climate
variability accounts for 62.5 per cent of all the stresses contributing to land degradation in Africa
(WMO, 2005). The impact of climate variability on crop productivity, land suitability and risk thus
necessitates special attention. Nonetheless, current land evaluation tools do not sufficiently take into
account the effect of climate variability.
The area of Maroua, situated in the Extreme-Northern region of Cameroon, is chosen as pilot area
for this research. The choice of this location is based on the fact that it is situated in a semi-arid
region where desertification poses a real threat, and where food security remains an acute problem
(Ibrahima et al., 2007). In addition, agriculture in this area, as in the whole country, is predominantly
controlled by rainfall which replenishes the soil water reserves and thus controls the utilization of
water by crops and influences the pattern and productivity of rainfed agriculture (Tingem and Mike,
2008 b).

2
1.2 Research questions and hypotheses
The main research question of this study is how to address climate variability impacts in land
evaluation assessments. The following specific research questions can be derived:
How important is climate variation in the study area?
To what extent is this climate affecting land performance?
To what extent is climate variability influencing the reliability of traditional land suitability
assessments?
Is it hypothesized that the accuracy, reliability and risk-averseness of land evaluation assessments
can be increased by explicitly taking into account climate variability into the methodological
approaches.
More specific hypotheses are that:
Climate variation in the study area is mostly pronounced in rainfall. Other climatic
parameters are less susceptible to climate variation.
Climatic variability indicators are sensitive to the temporal resolution (on daily, weekly or
monthly basis) of the climatic data. Daily data are best suited to express vulnerability to
climate variability.
Climate variation affects the quality and quantity of yield. The quality of the growing period
varies from one year to another.
Climate variability affects the reliability of traditional land suitability assessments.
Adding climate variability as a separate aspect in land evaluation can improve the reliability
of land evaluation methods.
Based on these research questions and hypothesis, several objectives have been developed.
1.3 Objectives
This study aims specifically to:
Show the importance of climate variation in the area of study by determining a relevant
indicator to express climate variability in an agricultural context, considering temporal
resolution (on daily, weekly or monthly basis) or temporal range (year, season, or growing
period for specific crops). This can lead to an expression of vulnerability to climate variability.

3
Determine the extent to which this climate variation affects land performance with respect
to experimental yields and semi-quantitative calculations such as growing period and crop-
specific climatic suitability analysis.
Determine the extent to which climate variability influences the reliability of traditional land
suitability assessments. This requires determining the sensitivity of the suitability assessment
to variation in climatic parameters, in order to understand if it corresponds to real-world
impacts on yield and the implications for its interpretation.

4
Chapter 2: Literature review
2.1 Climate, climate change and climate variability
2.1.1 Weather versus climate
Knowledge of weather and climate focuses on those variables that affect daily life most directly:
average, maximum and minimum temperature, wind near the surface of the Earth, precipitation in
its various forms, humidity, cloud type and amount, and solar radiation. These are the variables
observed hourly by a large number of weather stations around the globe (IPCC, 2001). In contrast to
meteorology which focuses on the short term weather system lasting up to a few weeks, climatology
studies the frequency and trend of those systems.
Climate can be defined as a statistical aggregate of weather conditions over a period of time
(Winstanley, 2007). As recommended by the World Meteorological Organization (WMO), climatic
averages are generally computed from weather records over a period of 30 consecutive years
(WMO/IPCC, 2003).
Although an area's climate is always changing, the changes do not usually occur on a time scale that
is immediately obvious to us. While we know how the weather changes from day to day, subtle
climate changes are not as readily detectable. Daily weather measurements are highly variable
compared to long-term climate data making it difficult to detect long-term trends based on limited
data. Long-term climate averages are the result of significant annual climate variability ( Ramamasy
and Baas, 2007).
2.1.2 Climate variability
Climate varies in time, from season to season, year to year, decade to decade or on much longer
time-scales, such as the Ice Ages (IPCC, 2001). Winstanley, (2007) defines climate variability as
variation (ups and down) in climatic conditions on time scales of months, years, decades, centuries
and millennia. It is considered as variations in the mean state or other statistics (such as standard
deviations, the occurrence of extremes, etc.) of the climate on all temporal and spatial scales beyond
that of individual weather events. The term is often used to denote deviations of climatic statistics
over a given period of time (e.g. a month, season or year) from the long-term statistics relating to the
corresponding calendar period. In this sense, climate variability is measured by those deviations,
which are usually termed anomalies (WMO/IPCC, 2003).

5
2.1.3 Climate change
Considering the standard averaging period of 30 years in climatology, climate change cannot occur
over less than a 30 years period. It can be a change in the mean, a change in extremes or change in
frequencies of one or more climate variables (Winstanley, 2007).
Climate change studies have mainly focused on changes in the mean (Ching-Cheng, 2002). Fewer
studies have focused on changes in climate variability (Easterling et al., 2000). According to Folland et
al., (2002), new analyses show that in regions where total precipitation has increased it is very likely
that there have been more pronounced increases in heavy and extreme daily to multi-daily
precipitation events. However, in some regions, heavy and extreme precipitation events have
increased despite the fact that total precipitation has decreased or remained constant.
2.2 Impact of climate change and climate variability
The impacts of climate change and variability are evident in many domains, not in the least in the
domain of water resource management, agriculture and human health. Higher water temperature,
increased precipitation intensity and longer periods of low flows are projected to exacerbate many
forms of water pollution, amongst others by sediments, nutrients and dissolved organic carbon. This
will in turn impact ecosystems, human health and the reliability and operating costs of water
systems. Rosenzweig and Parry, (1994) assessed the effects of climate change and increasing CO2
levels on crop yields and water use to determine the potential impact of climate change on the world
food supply. They concluded that a doubling of the atmospheric carbon dioxide concentration will
lead to only a small decrease in global crop production, and that especially developing countries are
likely to bear the brunt of the problem.
Climate induced food shortages affect billions of people in developing countries (IPCC, 2001). Climate
dictates to a large extent what the natural vegetation is and which crops can be grown. It affects crop
production either directly or indirectly (Echerten et al., 2008). In order to develop long-term
agricultural policies, planners need to understand the likely impacts of climate change on the climatic
suitability for different cultivation types (Holzkämper and Calancaa, 2010 b). Mearns et al., (1997)
stressed the importance of also including variability changes in climate scenarios in an agricultural
context. They highlighted that the focus on changes in mean values of key climatic parameters in
climate change predictions has provided only limited information on how future changes in climate
variability could affect agriculture.
6
2.3 Approaches to assess climate variability
Several methods and indices have been used for assessing climate variability. The paragraphs below
provide an overview of different statistical techniques that can be used to assess climate variability.
2.3.1 Statistical descriptives
Statistical techniques such as averaging are commonly used in research and can help to identify
trends and relationships within and between data sets. As such, mean, standard deviation, and
coefficient of variation are statistical descriptives that are commonly used in assessing climate
variability.
2.3.2 Frequency analysis
Most of the climatic events occurring as natural phenomena are observed only once. One important
problem in climatic parameter analysis deals with interpreting past records of climatic events in
terms of future probability of occurrence. The procedure for estimating frequency of occurrence of
climatic events is known as frequency analysis. Even though the nature of rainfall is erratic and varies
with time and space, it is possible to predict design rainfall fairly accurately for certain return periods
using various probability distributions (Bhakar et al., 2006). Probability of exceedance can be defined
as the number of cases for which the observed climatic variable exceeds a given threshold in the
entire record divided by the total number of days in the record (e.g. 28 yr x 31 days = 868 for
January) (Vernon et al., 2007).
2.3.3 Standardized Anomaly Index (SAI)
Another common method for analyzing data that occur in a series, such as temperature or
precipitation measurements over time, is to look at anomalies, or differences from a pre-defined
reference value.
The Standardized Anomaly Index, also known as the Simple Climate Departure Index (SCDI), can be
used to determine how ‘normal’ or ‘unusual’ a particular year can be compared to the long-term
situation for a certain region (Suckling, 2006). For the simple climate departure index, the long-term
mean annual climatic parameter value is subtracted from each annual value and this difference is
divided by the long-term standard deviation.
2.4 Agro-climatic indices
The statistical descriptives, frequency and anomaly analyses can be conducted using simple climatic
data such as rainfall, and minimum and maximum temperature. Yet, for the assessment of climate
and climate variability impacts on agriculture, also more specific indices have been developed.

7
Agro-climatic or agro-meteorological indices have great potential to quantify and communicate the
impacts of climate change on agriculture (Eitzinger et al., 2009). They can be used to describe the
effects of climatic conditions on key agricultural aspects, including production, fertilization, site
selection, etc. (Alexandrov et al., 2008). Most of these indices are calculated using annual values and
sometimes also monthly or growing season values. They generally require monthly or annual time
series of mean maximum temperature, mean minimum temperature and total precipitation (Vega,
2008).
2.4.1 Precipitation Concentration Index (PCI)
The Precipitation Concentration Index (PCI) is suitable to be used as a comparative index for
quantifying the seasonal and temporal concentration of the rainfall throughout the year. It is a more
appropriate expression than the other statistical indices to evaluate and compare the concentration
of rainfall between stations (Oliver, 1980; Michiels et al., 1992).
(Eq. 1)
where p = (long-term) mean monthly rainfall (mm)
P = (long-term) mean annual rainfall (mm) (here long term only valid in case of seasonal PCI)
The Seasonal Precipitation Concentration Index and the Temporal Precipitation Index are defined
based on two different procedures for calculating the Precipitation Concentration Index.
In the first procedure, the mean monthly dataset is estimated by averaging the monthly rainfall data
over a number of years. Afterwards, the Precipitation Concentration Index is calculated from this
estimated mean monthly temperature dataset. In this way, the Precipitation Concentration Index of
a mean year is obtained. This indicates how the rainfall is concentrated in a specific period of the
year (season).
In the second procedure, the Precipitation Concentration Index is calculated from the monthly
rainfall dataset of individual years. Afterwards, these annual Precipitation Concentration Indices are
averaged over a number of years. In this way, the long-term average Precipitation Concentration
Index of an individual year is obtained. The Temporal Precipitation Concentration Index indicates
how the rainfall is concentrated in any period of the year (not necessary a fixed season). The
difference between both indicates how rainfall, not falling in a specific season of the year, is
concentrated. The number of years to be considered for calculating both values is situated between
10 and 20 years (Michiels et al., 1992). A Seasonal Precipitation Concentration Index of less than 10

8
suggests a uniform distribution, a value from 16-20 denotes a seasonal distribution, above 20
represents a strong seasonal effects, with increasing monthly rainfall concentration.
2.4.2 Modified Fournier Index (MFI)
The Modified Fournier Index (MFI) is derived from a climatic rainfall distribution index, the Fournier
Index, established by Fournier, (1960).
(Eq. 2)
where PCI = Precipitation Concentration Index
P = mean annual rainfall
The MFI considers not only the monthly rainfall of the wettest month as done in the Fournier Index,
but the rainfall of all the months (Arnoldus, 1978). The MFI is a combination of the relative rainfall
concentration and the total rainfall received. It can also be calculated by the two different
procedures as illustrated for the Precipitation Concentration Index.
2.4.3 Drought Indices
Drought indices assimilate data on rainfall. A drought index value is typically a single number, far
more useful for decision-making than raw data (Hayes, 2007). There are several drought indices such
as Palmer Drought Severity Index, Standardized Precipitation Index, Percent of Normal Precipitation,
etc.
The Palmer Drought Severity Index (PDSI) is a meteorological drought index, which provides a
standardized measurement of moisture conditions enabling comparisons between locations and over
time (Palmer, 1965). It estimates duration and intensity of drought events by measuring departure of
the moisture supply based on a supply-and-demand concept of the water balance equation. It
incorporates precipitation and temperature data, and local available water content of the soil from
an unspecified period that best corresponds to the past 9-12 months. The PDSI provides
measurements of the abnormality of recent weather events for a region and places current condition
in a historical perspective (Hayes, 2007).
The Standardized Anomaly Index (SAI) reflects the impact of drought on the availability of different
water resources. The SAI calculation for any location is based on the long term precipitation records
for a desired period. SAI can monitor wet period, it is typically used to access the length and
magnitude of drought events. While PDSI is the oldest and most well-known, the SAI is the most
widely used index for understanding the magnitude and duration of drought events (Hayes, 2007).

9
2.4.4 Climate Extreme Index (CEI)
Karl et al., (1996) developed a framework to quantify observed changes in climate within the United
States through the development and analysis of two indices of climate change: a Climate Extreme
Index (CEI) and U.S. Greenhouse Climate Response Index (GCRI). Twentieth century changes and
variation of precipitation, mean maximum and minimum temperature with monthly resolution, can
be calculated. For each indicator or index, it can be assumed that the magnitude of the observed
trend is a by-product of a quasi-stationary climate (“quasi-stationary” reflected the notion that over
very long timescales like thousands of years, no climate regime is likely to be stationary). An
alternative hypothesis can be that the observed trend represents a changing climate. One of the
indicators of climate change for the United States is the occurrence of extreme drought and moisture
surpluses. The CEI developed for U.S. is the annual arithmetic average of five chosen indicators:
i) The sum of percentage of the U.S with maximum temperature much below normal
and percentage of the U.S. with maximum temperature much above normal;
ii) The sum of percentage with minimum temperature much below normal and
percentage of the U.S. with minimum temperature much above normal,
iii) The sum of percentage in severe drought and percentage with severe moisture
surplus (based on Palmer’s Drought Severity Index)
iv) Twice the value of the percentage with much greater than normal proportion of
precipitation derived from extreme 1-day precipitation events, and
v) The sum of percentage with a much greater than normal number of days with
precipitation and percentage with a much greater than normal number of days
without precipitation.
Overall, the CEI gives slightly more weight to precipitation extremes than to extremes of
temperature, and it is constructed such that seasonal values can easily be calculated.
2.4.5 Growing period analysis
The statistical analysis of seasonal precipitation, length of rainy season, and probability of daily
rainfall exceeding given thresholds is of course relevant to study climate variability impacts on
agriculture (Vernon et al., 2007). For assessing the length of the rainy season, the choice of threshold
of 3 mm per day as the basis for determining the length of the rainy season (number of consecutive
days exceeding that threshold) can be made. Yet, alternatively, the length of the growing period can
be defined.

10
An unbalanced distribution of rainfall evokes periods of drought and periods of rainfall excess,
making plant and crop growth difficult (Michiels et al., 1992). The growing period is that period of the
year that is suited for crop growth because of sufficient water resources and favorable temperature.
Cochemé and Franquin, (1967) presented the first well-published example of the use of growing
period. Their growing period concept consisted of a simple water balance valid for tropical areas
where temperature constraints were in general of less importance than moisture availability. Upon
modification of this concept, FAO defined the growing period as “the continuous period during the
year when precipitation exceeds half of the reference evapotranspiration, calculated by Penman’s
method, plus a period required to evapotranspire up to 100mm of water from excess precipitation
assumed stored in the soil profile at the end of the rains” (Kowal, 1978).
In order to assess the impact of climate variability on agriculture, statistical analysis of the start, end
and length of the growing period can be conducted. Growing season defined as the difference
between the date of the beginning and end of rains (Kasei and Afuakwa, 1991, Odekunle, 2004) can
also be used in the place of growing period. Igue et al., (2000) in their study on crop’s ability to cope
with high climatic variability evaluated the climatic suitability for six selected crop in the Central-
Benin by means of a growing period analysis. Schlenker and Roberts, (2009) found the concept of
growing season so interesting that they incorporated daily temperature of growing season in their
model to estimate the impact of climate change on crop yield. Lehmann, (2010) did similar analysis.
They integrated the sum of precipitation of rain sensitive period during the growing season of various
crops into a regression model as an explanatory variable. Among the climatic parameters, they only
included months of the growing season into the regression model. Tigem et al., (2008 a & b)
simulated crop development relying on the growing season.
2.5 Land Evaluation
2.5.1 Definition, historical development, overview of methods
Land evaluation can be seen as 'the assessment of land performance when used for a specified
purpose, involving the execution and interpretation of surveys and studies of land forms, soils,
vegetation, climate and other aspects of land in order to identify and make a comparison of
promising kinds of land use in terms applicable to the objectives of the evaluation' (FAO, 1976).
Duce et al., (2002) and Davidson, (2002) considered 1950 and 1980 as being the most active period
of land evaluation, because of the development of soil and land capability surveys, the initiation of
methodological advances developed by the FAO Framework for Land Evaluation. Pioneering work for

11
the development of land evaluation system occurred in America (Klingebiel et al., 1961) and was
further improved by the Food and Agricultural Organization (FAO, 1984).
Land evaluation can be conducted directly or indirectly. In the former case, the evaluation is based
on field tests (experimental stations, random agricultural sampling in the field); data on yield
production obtained by farms record from individual farmers or by cooperatives; or also from
agricultural statistics. The main limitation for this type of evaluation is that data obtained are usually
local, spotty, sometimes unreliable, making their extrapolation difficult. Therefore, an indirect
evaluation is often applied, on the basis of soil properties, with the assumption that yield obtain on a
given soil is dependent on its properties and its level of management. As mentioned by Dorronsoro
(2002), such evaluations need to be validated at the end with real yield data. Thus, performing an
indirect evaluation to define a degree of suitability requires many groups of properties rather than
one single property.
Several methods of evaluation are applied under different philosophies and techniques. While some
methods give more value to the degree of suitability of the properties, others lay emphasis on the
feasible limiting factors for soil use. Dorronsoro (2002) stressed on the importance of indirect
method of evaluation. They seem to be more consistent, because, in reality, the negative
characteristics constitute the true limits on soil use, disregarding the degree of suitability of the most
favourable properties. Land evaluation methods also differ in terms of criteria. Some methods make
use of qualitative criteria while others apply quantitative criteria. The qualitative system suits better
with experiment aiming at a general evaluation of broad zones, whereas the quantitative are often
used in detailed studies. Thus, more information on the soil are needed, both for the construction of
the evaluation system as well as it application. However, they are more objective and therefore their
results are more reliable. Other methods start with weighted qualitative data to finish with numerical
result. From all these analysis, land evaluation can be internationally recognized as a tool capable of
providing qualitative information about land, such as its cropping potential or land degradation risk
(Hudson and Birnie, 2000). With regards to all the advantages of land evaluation, FAO, (1976)
developed in the chapter 4 of a framework for land evaluation, an approach on how to carry out a
land evaluation.
Within the existing land evaluation systems for agricultural uses, some, called land capability,
evaluate the capacity of the soil for general use (crops, pasture, forestry), while others, called land
suitability, evaluate the suitability of the soil for specific uses, such as a specific crop (e.g., wheat,
potato) and with a particular kind of soil management.

12
The classifications of land capability define the degrees of capacity in generally vague terms, focusing
fundamentally on the limitations for the general use. This is the most widely used method for
evaluating agricultural land. Its main advantage is the versatile and simple basic structure of the
system. The restrictions of the system are the predefined preference for arable use, which does not
allow land for other uses to be classified adequately, the lack of information on the suitability for
specific crops with different agro-ecological requirements and the overestimation of the capability of
land with many minor limitations. Due to all these limitations, the land suitability evaluation
according to FAO standard was developed. Land suitability provides more practical results but needs
more data both for the land as well as for concrete specifications for each type of crop (Igue et al.,
2000).
In general, both systems use a range of land qualities, derived from climatic, landscape and soil
variables to classify land.
2.5.2 Climate variability impact assessment using the land capability classification system
Land evaluation is sensitive to the effects of annual variability in weather. Yet, few studies explicitly
include climate variability into land evaluation. Hudson and Birnie, (2000) proposed a method to
incorporate inter-annual variability in weather into the Land Capability for Agriculture (LCA)
classification for system for Scotland. The authors considered variations in temperature and moisture
supply by deriving annual values of accumulative temperature above 0°C (AT0), and the median
maximum potential soil moisture deficit (MaxPSMD). AT0 is calculated as the accumulated sum of
degrees above 0 degrees for each day and this from 1 January to 30 June. On the other hand, Max
PSMD equals the maximum value of the accumulated daily moisture deficit (in mm) between rainfall
and evapotranspiration. The AT0 and MaxPSMD observations of 23 stations were empirically
classified into 7 climatic LCA classes. Finally, for every individual station, the mean return time to a
land capability category was estimated by means of Markov chain analysis in a risk assessment
approach. A similar approach was used by Duce et al., (2002) to assess climatic risk for agricultural
production in Sardinia.
2.5.3 Climate variability impact assessment using the crop-specific land suitability
classification (FAO)
Land suitability is the fitness of a given piece of land for a well specified land use. It is an expression
of how well a land unit matches the requirements of the land utilization type. The essence of land
suitability is comparing land qualities with land use requirements of the various kinds of land use for
which the land might be suited. An advantage of the introduction of land suitability evaluation
according to FAO framework is the elaboration of the concept of land use and associated crop and

13
management requirements. Another advantage is the presentation of the suitability in terms of
alternatives for land use, which is a more useful format than capability classification for making
decision by planning and management authorities (Dent and Young, 1981). Although the principles of
land suitability are straightforward, application is complex. As the concepts and guidelines have to be
worked out for every type of application, the qualifications of the applicability of the FAO framework
differ (Van Lanen, 1991).
Land evaluation systems as those inspired by FAO´s land suitability classification approach, attach
great importance to the climatic potential of the land and to the growing period characteristics for
determining suitability ratings (Igue et al., 2000). The crop-specific evaluation approach which is
based on agro-climatic indices, can be applied for assessing spatial and temporal trends in crop-
specific climate suitability and for evaluating possible impacts of climate variability, as shown by
Holzkämper et al., (2010 a & b), assessing land suitability for grain maize in Switzerland, using five
steps:
Determination of growing degree days for relevant phenological phases:
To dynamically determine phenophase-specific climate sensitivities, crop phenological development
was expressed as a function of growing degree days (GDDs), with GDD sum thresholds defining the
transition from one phenological stage to the next. For the test implementation for maize,
approximate dates of maize phenology were provided by crop experts. Based on this information and
temperature data from major maize cropping regions, GDDs for the most important phenological
stages were derived. The sowing date was kept fixed and a maximum harvest date was introduced to
avoid unrealistic maturity periods.
Selection and calculation of climate indices:
To quantify phenophase-specific climatic influences on crop development, five climatic indices were
selected: average solar radiation (MJ/m²), average minimum temperature (°C), average maximum
temperature (°C), water deficit (reference evapotranspiration - precipitation) (mm), phase length
(days). Correlation of these five indices with observed maize yields was found.
Determination of index-specific suitability ranges and weightings:
Once the relevant climatic indices were identified for the selected phenophases, both index-specific
suitabilities si and weights wi needed to be specified. Si-values were assumed to range from 0 to 1,
with 0 indicating no suitability and 1 indicating optimum suitability of an index value. Weights wi
were assigned to the indices according to their importance for the crop development and so that

14
they add up to 1. The expert-based evaluation of weightings was done using the Analytic Hierarchy
Process (AHP), (Saaty, 1980). The evaluation was broken down into the variables determining
suitability, which were then arranged in a hierarchical order as shown in the figure below.
Figure 1. Example of hierarchical evaluation of crop-specific climate suitability (Holzkämper et al., 2010). Definition of evaluation function:
Different rule sets were defined to evaluate crop-specific climate suitability based on the previously
determined factor suitability scores. For maize, it was assumed that climate effects are limiting
within each phase, but growth in one phase can be compensated for by growth in another phase.
Therefore, climate suitability for maize S was evaluated as a weighted linear combination of the four
phase-specific minimum suitabilities. A strong, highly significant correlation between estimated
maize suitabilities and observed yields (Spearman rank correlation coefficient = 0.62) was achieved.
Spatial evaluation:
To arrive at a spatial representation of the climate suitability for grain maize, spatial distributions of
estimated mean maize suitabilities and their coefficients of variance were represented in a map.
The presented framework allowed for a flexible evaluation of crop-specific climate suitability. The
integration of phenophase-specific climate indices allowed for a dynamic evaluation of climate
suitability. The consideration of variabilities in climate suitability allowed for assessing production
risks.
15
2.5.4 Crop modeling
Crop yield, as an integrator of many land aspects, has proved to be the most reliable estimate of
comparative suitability of each land unit (Dumanski and Onofrei, 1989). Crop yield depends on
several factors including planting date, and weather conditions during the growing period. Therefore,
predictability of seasonal climate variability gives the opportunity to forecast crop yields for different
planting scenarios (Porter & Semenov, 2005; Cabrera et al., 2009). Thus, yield predictions are an
important criterion to group land for specific land use purposes (Beek, 1980). Crop-weather models
allow for detailed explorations of the effect that climatic factors can have on yield. Crop models
provide a systematic means to map variations in relevant climatic and other environmental inputs
(e.g. temperature, precipitation, radiation, soil type) to variations in crop yields.
Through a simulation assessment combining a weather generator with a crop growth model, Tingem
et al., (2008 b) investigated the effects of inter-year variability of extreme rainfall events on maize
yields at locations in Cameroon. To this aim, they used the crop simulation model CropSyst and a
weather generator (ClimGen) to determine the proportion of inter-annual maize yield variability that
could be ascribed to climate variability, based on the evaluation of long-term effects of climate
variability on maize yield. The ClimGen software (version 4.1.05;
http://www.bsyse.wsu.edu/climgen/) was used to expand the temporal range of the weather data
for use in a crop model, to allow a good estimation of the probability of extreme events. This
software requires inputs of daily series of weather variables (minimum and maximum temperature,
precipitation) to calculate parameters used in the generation process for any length of period at a
specific location.
Predictability of seasonal climate variation can help in reducing farm risk by tailoring agricultural
management strategies to mitigate the impact of adverse condition or take advantage of favorable
conditions (Letson et al., 2005). In this respect, crop insurance offers famers economic stability under
the uncertainty of future random events including climate (Mahul, 2001). Climate information can
help farmers and insurers mitigate losses related to climate variability. Climate information can help
farmers to select crop insurance that maximizes their net return. In addition, this kind of information
may assist insurers to asses risk more precisely (Cabrera et al., 2009).

16
Chapter 3: Materials and methods
This chapter discusses the materials and methods used in the frame of this study. First, the study
area and available climatic data will be discussed. Next, the methodology to assess climate variability
and impact of climate variability on land performance will be presented.
3.1 Materials
3.1.1 Study area
The study area Maroua, situated in the Diamare Plain, is the largest cropping area in the savannah
region of Extreme-Northern Cameroon, occupying 1.8 million hectares of land between latitudes
10°N and 11°N (Obale-Ebanga et al., 2003). Based on the UNEP aridity index, the climate can be
classified as semi-arid. The mean annual temperature (1960-2004) is 28.1°C, whereas mean annual
rainfall is around 792 mm. However, the distribution of precipitation throughout the year is highly
irregular. Precipitation mainly occurs from May to September, with about 90% of the precipitation
falling during the period July-August. The potential evapotranspiration is on average 5mm/day and
the mean relative humidity is 47%.
Figure 2. Map indicating location of study area of Maroua, located in the Extreme-North province of Cameroon (adapted from Luventicus Academy of Sciences (2013a,b).
17
Three major land use types can be identified in the area of Maroua: dry season sorghum, locally
called 'muskwari', cotton in rotation with rainy season sorghum, and fallow/pasture.
The dry season sorghum is the main crop cultivated on Vertisols, locally called 'karals'. The sorghum
seedlings are transplanted at the beginning of the cool dry season (October) and grain yield is
harvested in February. Fields used for dry sorghum are usually flooded and inundated during the
raining season and become workable only when the rainy season ends. Generally, fertilizers are not
applied and the technique of zero tillage described as ‘muskwari slash and burn’ is practiced.
Cotton in rotation with rainy season sorghum is particularly cultivated on the Luvisols, Planosols and
to a lesser extent on Vertisols. The soils are ploughed to about 20-30 cm depth and mineral fertilizers
are applied in this system.
Fallow and pasture serve to restore soil fertility and are practiced on all soil types, except on Vertisols
that are exploited for ‘muskwari’ production (Obale-Ebanga, 2001).
Table 1 presents long-term average climatic conditions, as well as the agricultural calendar followed
by farmers in the Extreme-Northern Cameroon (Mahop, 1995). This crop calendar provides timely
information on all cultivation activities for cotton, wet and dry season sorghum. It is an important
tool for farmers to assist in decision making. Cotton, having the longest crop cycle, requires the most
intensive production activities. The labor intensity can partly be explained by the fact that cotton is
the major cash crop and represents the major income source. Transplanted dry season sorghum
production is also labor intensive, as it is mostly cultivated for commercial purposes, whereas wet
season sorghum is mainly grown for household consumption. Moreover, labor input is higher for dry
compared to wet season sorghum as a result of nursery establishment and transplanting activities.
The start and end of different labor activities in individual years are, amongst others, influenced by
weather conditions. One of the objectives of this research is to study this climate variability, in the
hope to shed a light on to what extent climate variability influences sorghum and cotton production
(and by consequence also farmers’ activities).

18
Table 1. Long-term average climatic conditions and agricultural calendar for different cotton, dry season sorghum and wet season sorghum (Mahop et al., 1995)
Climatology
Climatic variable J F M A M J J A S O N D
P (mm)
Number of days
0
0
1
1
5
1
47
5
101
9
155
12
219
15
255
18
231
15
69
6
2
1
0.3
1 Tmax (°C)
T (°C) Min
33.5
16.2
36.2
18.7
33.8
22.8
38.7
25
36.2
23.8
32.9
22.0
30.8
21.5
29.9
21.2
30.9
20.9
33.8
20.9
34.9
18.5
33.7
16.2 RHmax (%)
RH (%)Max
49
17
41
14
42
15
64
25
83
38
92
50
95
58
97
63
96
58
90
43
70
24
57
18 Evaporation (mm) 350 398 484 369 253 155 105 801 809 153 280 351
Sunshine (hours) 283 265 266 242 258 224 194 179 201 266 287 198
Agricultural activities
Crops Activity J F M A M J J A S O N D
Cotton
Field preparation
Planting
Fertilize spreading
Thinning
Weeding
Flouring
Treatment
Harvest
Commercialization
____________
_____
_______
______
________________
_________
_________
_________________
________________ _________
Dry season
sorghum
Nursery
Field preparation
Transplanting
Caretaking
Harvest
__________
____________
____________
__________
___________
Rainy
season
sorghum
Field preparation
Planting
Caretaking
Harvest
_________________
___________
_______________
__________
19
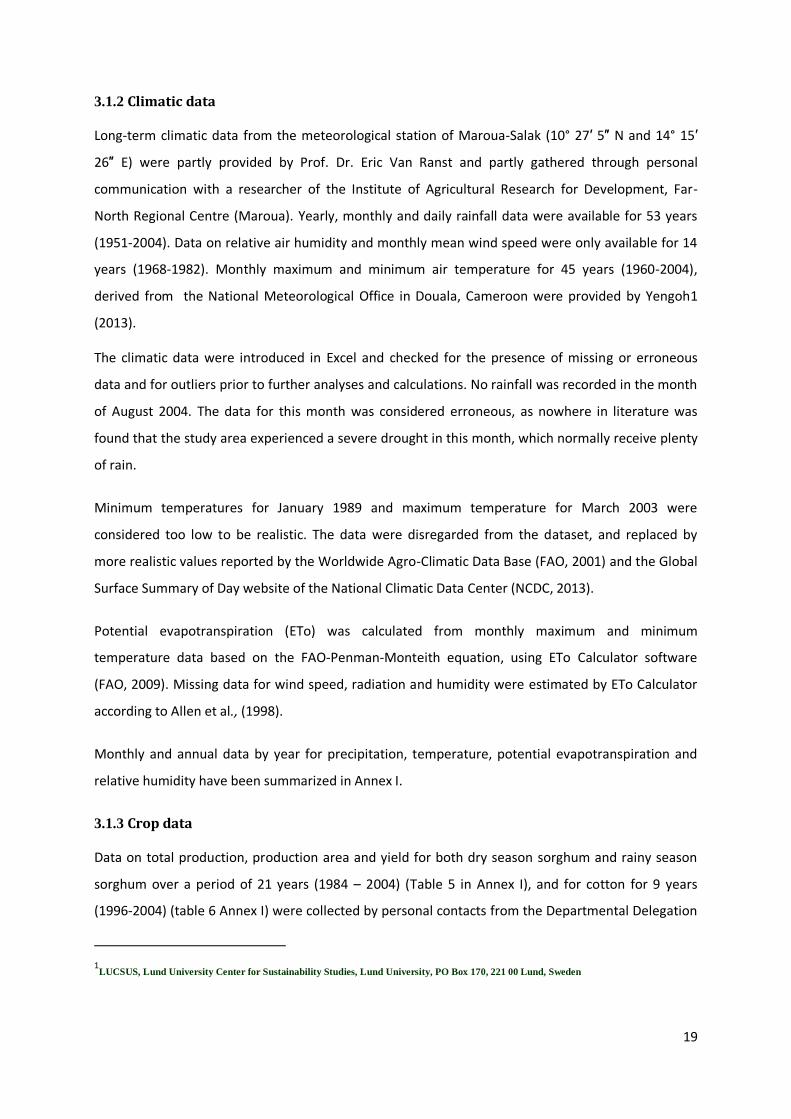
3.1.2 Climatic data
Long-term climatic data from the meteorological station of Maroua-Salak (10° 27′ 5″ N and 14° 15′
26″ E) were partly provided by Prof. Dr. Eric Van Ranst and partly gathered through personal
communication with a researcher of the Institute of Agricultural Research for Development, Far-
North Regional Centre (Maroua). Yearly, monthly and daily rainfall data were available for 53 years
(1951-2004). Data on relative air humidity and monthly mean wind speed were only available for 14
years (1968-1982). Monthly maximum and minimum air temperature for 45 years (1960-2004),
derived from the National Meteorological Office in Douala, Cameroon were provided by Yengoh1
(2013).
The climatic data were introduced in Excel and checked for the presence of missing or erroneous
data and for outliers prior to further analyses and calculations. No rainfall was recorded in the month
of August 2004. The data for this month was considered erroneous, as nowhere in literature was
found that the study area experienced a severe drought in this month, which normally receive plenty
of rain.
Minimum temperatures for January 1989 and maximum temperature for March 2003 were
considered too low to be realistic. The data were disregarded from the dataset, and replaced by
more realistic values reported by the Worldwide Agro-Climatic Data Base (FAO, 2001) and the Global
Surface Summary of Day website of the National Climatic Data Center (NCDC, 2013).
Potential evapotranspiration (ETo) was calculated from monthly maximum and minimum
temperature data based on the FAO-Penman-Monteith equation, using ETo Calculator software
(FAO, 2009). Missing data for wind speed, radiation and humidity were estimated by ETo Calculator
according to Allen et al., (1998).
Monthly and annual data by year for precipitation, temperature, potential evapotranspiration and
relative humidity have been summarized in Annex I.
3.1.3 Crop data
Data on total production, production area and yield for both dry season sorghum and rainy season
sorghum over a period of 21 years (1984 – 2004) (Table 5 in Annex I), and for cotton for 9 years
(1996-2004) (table 6 Annex I) were collected by personal contacts from the Departmental Delegation
1LUCSUS, Lund University Center for Sustainability Studies, Lund University, PO Box 170, 221 00 Lund, Sweden

20
of Agriculture of Maroua. In addition, similar data on cotton were collected for missing years (1984-
1995 and 2005-2013) from a report of the Ministry of Agriculture and Rural Development of
Cameroon (Ministry of Agriculture and Rural Development Cameroon, 2013). However, only yield
data for 1984-2004 for cotton, wet and dry sorghum were used, as rainfall data were not available as
from 2004 onwards.
3.2 Methodology
Different tools and procedures have been used during the data analysis in order to provide answers
to the various research questions.
3.2.1 Assessing climate and climate variability in the study area
Different climate variability parameters were calculated to assess both inter- and intra-annual
climate variability in the region, among which the coefficient of variation, the Precipitation
Concentration Index and Standard Anomaly Index. Furthermore, climatic data were statistically
analyzed (frequency analysis) using RAINBOW software (Raes et al., 2006).
3.2.1.1 Coefficient of variation (CV)
When the rainfall amounts or temperature are not uniformly distributed throughout the different
months of a year, knowledge on the relative monthly wetness/dryness is important for crop
production. To assess relative wetness, the mean can be used. However, the mean is unduly affected
by extreme events and may therefore be far from representative of the sample (Ostle, 1966).
Standard deviation, which is a measure of absolute dispersion, is also not suitable to compare the
relative wetness/dryness of one rainfall series with another when their average is different. The
coefficient of variation, which is a measure of relative dispersion, is used to compare the variation in
series which differ in the magnitude of their averages (Simpson and Kafka, 1997). Since time series of
rainfall for different months differ in mean, the CV can be used as a measure of wetness or dryness.
It represents the ratio of the standard deviation to the mean. The coefficient of variation, expressed
as a percentage, was calculated for rainfall, temperature, ETo and relative humidity using (Eq. 3):
(Eq. 3)
Where = mean monthly rainfall, temperature, ETo or relative humidity
s = standard deviation of monthly rainfall, temperature, ETo or relative humidity
Both the intra-annual and inter-annual CV were calculated.

21
3.2.1.2 Precipitation Concentration Index (PCI)
The Precipitation Concentration Index (PCI), expressed in %, was proposed by Oliver, (1980) and
defines the temporal aspects of monthly rainfall. The PCI characterizes the monthly concentration of
precipitation on a scale that ranges from 8.3% for evenly distributed rainfall, to 100% for extreme
monthly rainfall distribution. Two different calculation procedures can be used to derive the
Precipitation Concentration Index, namely the seasonal and temporal PCI.
3.2.1.3 Seasonal Precipitation Concentration Index
In this procedure, the mean monthly rainfall data set is estimated by averaging the monthly rainfall
data over all the years taken into account (53 years). Next, the PCI of a mean year is calculated from
this estimated mean monthly rainfall dataset (Eq. 4).
(Eq. 4)
Where p = long-term mean monthly rainfall
P = long-term mean annual rainfall (here long term only valid in case of seasonal PCI)
Seasonal PCI indicates how the rainfall is concentrated in a specific period of the year (season).
3.2.1.4 Temporal Precipitation Concentration Index
To calculate the temporal PCI, monthly rainfall data sets of individual years were used. Afterwards,
these annual PCI were averaged over 53 years. The temporal PCI indicates how the rainfall is
concentrated in any period of year, not necessarily a fixed season.
3.2.1.5 Standardized Anomaly Index
The Standardized Anomaly Index (SAI) is a measure of distance in standard unit, between a data
value and its mean. It is calculated by subtracting the mean from each observation, then dividing by
the standard deviation. (Eq. 5).
(Eq. 5)
Where xi = observation in year i
= mean observation for all years
s = standard deviation
Annual rainfall will be classified by means of Standardized Anomaly Index according to table 2.

22
Table 2. Classification of SAI Values of inter-annual rainfall (according to Mckee et al., 1993, applied by Manacelli G., 2005).
SAI >2 1.5 to 1.99 1.0 to 1.49 0.99 to
-0.99
-1 to -1.49 -1.5 to -
1.99
<-2
Class Extremely
wet
Very wet Moderately
wet
Near
normal
Moderately
dry
Severely
dry
Extremely
dry
3.2.1.6 Number of dry spells
Studies that consider average rainfall over long period of time (year, entire season or month) can
hide some important extreme events, like drought or excess rainfall, that occur at shorter time steps
(Barron et al., 2003; Javier, 2004; Monacelli, 2005; Schlenker and Roberts, 2006) and this can lead to
biased analysis (Schlenker and Roberts, 2009). Yengoh et al., 2010; Mathugama and Peiris, (2011)
highlighted that the distribution of dry spells can have an effect on the success or failure of rainfed
crop, especially when they occur in a sensitive period of crop development (seeding, germination, or
flowering). A dry spell can be seen as a period during which weather has been dry, for a length of
time considered being abnormal, but shorter and not too severe as drought would be (Fox and
Rockstrom, 2003; Barron, 2004; Mathugama and Peiris, 2011). In this study, a dry day is considered
as a day without rainfall. A consecutive number of dry days, namely five days, was considered to be a
dry spell, both for sorghum and cotton. The number of days of dry spells was determined for each
year, namely within the growing period.
3.2.1.7 Number of rainy days
Rain is not a continuous phenomenon. Rainfall occurs during rainfall events of varying durations
succeeding varying intervals of time. This intermittency is particularly important in the Extreme-
Northern Cameroon. However, study of the variability in the annual number of rainy days has seen
very little attention in previous work (Servat et al., 1998). Meanwhile, from the climatological point
of view, the study of rainy days can be helpful to improve our understanding on aspects of seasonal
and annual rainfall deficits, as well as changes that may affect the evolution of precipitation (Kouassi
et al., 2010). Indeed, these deficits may result from the decrease in the frequency of heavy
precipitation at or above a certain threshold. In this study, precipitations ≥ 40 mm per day are
considered as heavy precipitation and are used to estimate rainfall intensity meanwhile the rainfall
frequency is obtained from daily rainfall ≥ 3mm. On the agronomic point of view, the reduction in the
frequency of heavy rainfall and rainfall distribution within the season are important data. Thus, a
characterization of rainfall patterns cannot be limited to a simple statistical analysis of cumulative
rainfall. It shall also include the frequencies of rainy days (Kouassi et al., 2010).
23
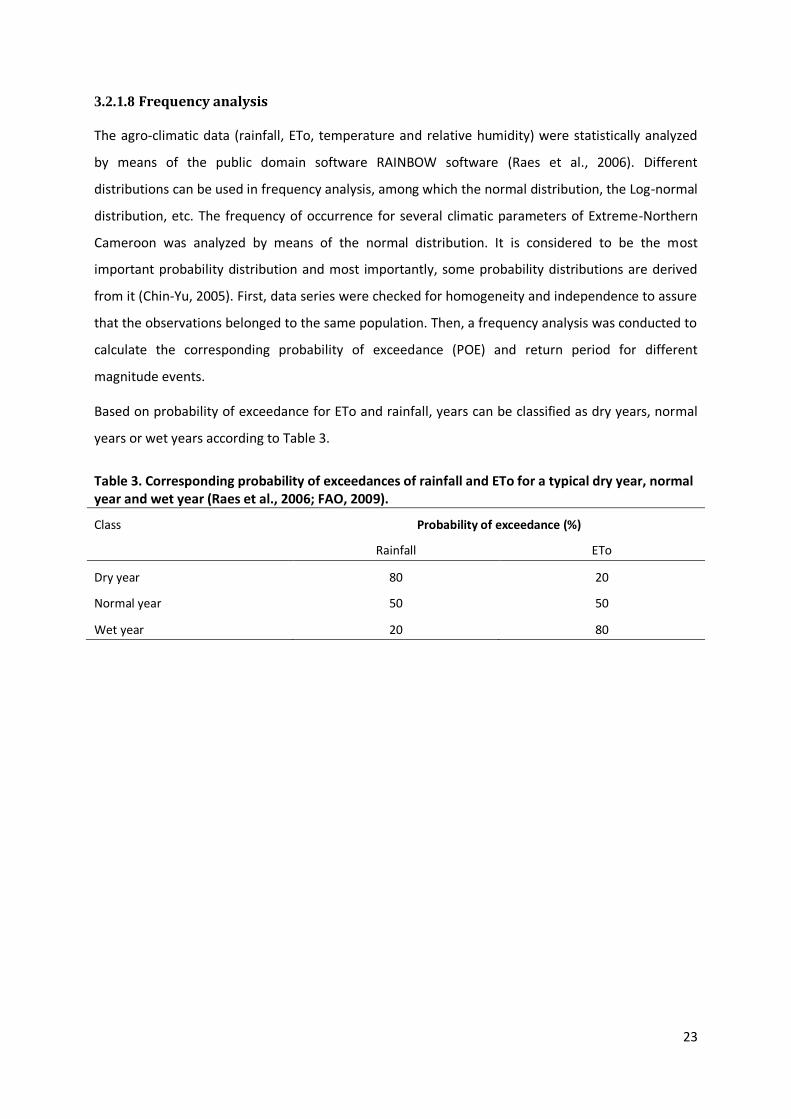
3.2.1.8 Frequency analysis
The agro-climatic data (rainfall, ETo, temperature and relative humidity) were statistically analyzed
by means of the public domain software RAINBOW software (Raes et al., 2006). Different
distributions can be used in frequency analysis, among which the normal distribution, the Log-normal
distribution, etc. The frequency of occurrence for several climatic parameters of Extreme-Northern
Cameroon was analyzed by means of the normal distribution. It is considered to be the most
important probability distribution and most importantly, some probability distributions are derived
from it (Chin-Yu, 2005). First, data series were checked for homogeneity and independence to assure
that the observations belonged to the same population. Then, a frequency analysis was conducted to
calculate the corresponding probability of exceedance (POE) and return period for different
magnitude events.
Based on probability of exceedance for ETo and rainfall, years can be classified as dry years, normal
years or wet years according to Table 3.
Table 3. Corresponding probability of exceedances of rainfall and ETo for a typical dry year, normal year and wet year (Raes et al., 2006; FAO, 2009).
Class Probability of exceedance (%)
Rainfall ETo
Dry year 80 20
Normal year 50 50
Wet year 20 80

24
3.2.2 Assessing the impact of climate variability on land performance
3.2.2.1 Determination of the growing period and humid period
To assess the start and end of the growing period (GP) and humid period, climatic data with a
temporal resolution of 10 days (decade) were used. Monthly data of ETo, relative humidity sunshine
and wind speed were interpolated by means of the Gomes algorithm (Gomes, 1983) to obtain
decadal values (Eq. 6-8):
(Eq. 6)
(Eq. 7)
(Eq. 8)
Where M1, M2 and M3 are three consecutive months, and D1, D2 and D3 correspond to the decadal
values of decade 1, 2 and 3 of the middle month respectively. The denumerator equals 81 for
interpolation of ETo (expressed as a sum over time), and 27 for relative humidity, sunshine and wind
speed (expressed as arithmetic mean).
The start, end and length of growing period and humid period were determined on a yearly basis for
the period of 1960-2004, according to the growing period concept defined by FAO (Kowal, 1978). The
start and end of each period was determined by linear interpolation of decadal rainfall and ETo data.
The start of growing period and end of rains
To calculate the start of growing period, two successive decades were selected where P1 (rainfall in
decade 1) < E1/2 and P2 > E2/2. For the end of rains, two consecutive decades where P1 > E1/2 and
P2 < E2/2 were selected. The time of intersection corresponding to the start of the growing period or
end of the rains can be obtained by (Eq. 9):
(Eq. 9)
Where t days are added to the middle of decade 1.
Start and end of humid period

25
For the start of humid period, the last decade with ETo/2< P < ETo and the first decade of the humid
period with P > ETo were considered. The last decade of the humid period and the first decade with
ETo/2< P< ETo was used to obtain the end of humid period by using (Eq. 10):
(Eq. 10)
Where t days are added to the middle of decade 1.
End of growing period
The end of the growing period was determined extending the end of rains with the number of days
required to evapotranspire up to 100 mm of water.
From the start and end of growing period, the length of the growing period and humid period was
determined, taking into account months of 30 days. Moreover, it is also important to assess the
quality of the growing period with reference to the length of crop cycles. This information is
determinant to understand variability in crop production.
3.2.2.2 Impact on yield
Yield data of sorghum and cotton were analyzed for correlations with various climatic parameters
using the software of SPSS. For wet season sorghum and cotton, only climatic variables (rainfall,
temperature and ETo) during the growing period were considered, as it is believed that mainly
weather conditions during this period will influence crop performance (Elton and Gruber, 1993;
Molua and Lambi, 2006 a).
3.2.3 Assessing climatic suitability
3.2.3.1 Selection of sowing date
The climate index, calculated according to the FAO crop-specific land suitability classification (FAO,
1993), was calculated using two different approaches. The fixed sowing date approach calculated the
climate index of sorghum or cotton in Maroua-Salak, sown at the start of the mean sowing date,
namely 29th May (Table 10, Annex II). The variable sowing date approach calculated the climate index
for every year, using the start of the sowing date for that particular year (Table 10, Annex II). The
variable sowing date was considered being the first day of the decade within the growing period in
which rainfall amount was at least 30mm. The fixed sowing date was the first day of the decade
within the mean growing period with at least 30mm of rain obtained from the average of rainfall for
all the period of study. In a case like in 1970, where the sowing date started in the second decade of
26
July, to keep the methodology consistent, crop cycle of this year lasted until January of the following
year, which is 1971. Even though farmers would not wait till this period to plant, respecting this date
was necessary to have consistency in calculations.
For both the fixed and the variable sowing date approach, the climatic index and rating for each year
was calculated.
3.2.3.2 Calculation of climatic index, rating and climatic suitability class
Before obtaining the final climatic index and rating, values of different climatic characteristics were
rated. Climatic characteristics that were assess are those proposed by the requirement table of Sys et
al., (1993) (see table 7 and 8 Annex I). For each crop, each climatic characteristic was being attributed
a rating.
Further, the least rating for each climatic characteristic group (precipitation, temperature, and
relative humidity) was retained in the calculations, by means of square root method equation, to
obtain the suitability index (Eq. 11):
(Eq. 11)
Where
Si = climatic suitability index
Rmin = climatic characteristic with the lowest rating
A,B, C, … = minimal rating of other climatic characteristic groups
The climatic index was transformed to one overall climatic rating based on the following conditions:
If index <25: climatic = 1.6 x index.
If index lies between 25 and 92.5: climatic rating = 16.67 + 0.9 x index.
If index > 92.5: climatic rating = 100.
This assessment was done for individual years, as well as using the long-term average climatic data of
Maroua-Salak. In addition, the climatic index and rating were also calculated for a typical dry, normal
and wet year, for which rainfall amounts were obtained by means of frequency analysis. For this, the
average of all the other climatic parameters (temperature and relative humidity) were used and only
data of precipitation differed.

27
3.2.3.3 Assessing impact of climate variability on FAO land suitability classification and
crop yield
Correlation analysis between climatic ratings and yield for both the variable and fixed sowing date
approach was conducted to see to what extend yield variability could be explained by the different
evaluated climatic characteristics. Furthermore, variation in climatic ratings was analyzed to study
the sensitivity of the FAO land suitability classification method to climate variation, and to the
selection of sowing date (fixed versus variable). The interpretation of the different suitability classes
adopted is given in Table 4.
Table 4. Guidelines to define the suitability classes (based on FAO 1983).
Suitability class Interpretation
S1 Suitable
S2 Moderately suitable
S3 Marginally suitable
N1 Actually unsuitable, potentially suitable
N2 Actually and potentially unsuitable

28
Chapter 4: Results and discussion
Climate plays a prominent role in agriculture as it affects, favorably or adversely, the atmospheric
conditions and vegetation of a region. Planning on rainfed farms requires good knowledge of the
temporal distribution of rains. Annual rainfall minimums for the various crops in the Extreme-
Northern Cameroon have been established by Molua and Lambi, (2006 a). For sorghum which is a
hardy plant with relatively low water requirements, minimum annual rainfall is about 500 mm. With
a longer crop cycle (6 months) compared to sorghum (4 months), cotton requires more water. The
minimum amount of rainfall needed for cotton production is estimated at 700-800mm (Witt and
Waibel, 2009; Molua and Lambi, 2006 a). Even when long-term average rainfall is sufficient to allow
sorghum and cotton production, it is important to analyze the influence of rainfall variability on yield
in the Extreme-Northern Cameroon, since its unbalanced distribution can affect yield adversely as
rain may fail to arrive during the crop’s growing stage.
4.1 Climate and climate variability in Extreme-Northern Cameroon
4.1.1 Long-term average climate and general climate classification
Table 5 shows the long-term average annual values of various climatic parameters for Maroua-Salak.
The average rainfall is 793 mm. The mean annual temperature is 28.1°C, which is similar to the mean
reported by Molua and Lambi, (2006 a). The climate of Maroua-Salak is characterized by a mean
relative humidity of 47%, with the mean minimum and maximum relative humidity equal to 42% and
60% respectively.
Table 5. Mean climatic parameters for the meteorological station of Maroua-Salak (Extreme-Northern Cameroon).
Climatic parameter Average Stdev CV (%)
Rainfall (mm) (1951-2004) 793 131 140
Mean temperature (°C) (1960-2004) 28.1 2.8 10
Maximum temperature (°C) (1960-2004) 34.8 2.7 8
Minimum temperature (°C) (1960-2004) 21.5 2.9 13
Monthly ETo (mm) (1960-2004) 163 4.2 12
Mean relative humidity (%) (1968-1982) 47 21 47
Maximum relative humidity (%) (1968-1982) 60 26 42
Minimum relative humidity (%) (1968-1982) 42 17 59
Windspeed (m/s) (1968-1982) 2.8 0.6 22

29
The classification of this climate varies from one aridity index to the other (Table 6). According to the
UNEP aridity index, the climate is classified as semi-arid. The Lang factor classifies the study area as
having an arid climate, whereas the climate can be considered Mediterranean based on the De
Martonne aridity index. Also Techoro, (2013) and Molua and Lambi, (2006 b) describe the climate of
the Extreme-Northern Cameroon as semi-arid.
Table 6. UNEP Aridity Index (I), Lang factor (L) and De Martonne Index (Im) and corresponding climatic classification for Maroua-Salak (Extreme-Northern Cameroon).
Aridity index Value Classification
I (UNEP Aridity Index) 0.4 Semi-arid
L (Lang Factor) 28 Arid
Im (De Martonne Index) 21 Mediterannean
4.1.2 Inter-annual variation using annual climatic data
Extreme-Northern Cameroon is threatened by climate variability (Molua and Lambi, 2006). Within
the period of study (1951-2004), the annual rainfall varies strongly from year to year. As shown in
Figure 3, rainfall ranged from 548 mm in 1983 to 1194 mm in 1994. Several years of meteorological
drought, which occurs when rainfall is significantly below expectation (average) over one or several
years, can be identified. Among them are 1967 (595 mm), 1983 (548 mm), 1986 (555 mm) 1997,
1998 (614mm) and 1998 (648mm). These drought years can partly be linked to the years of major
drought that occurred in West Africa in, amongst others, the period of 1972-1974, 1983 and 1997-
1998 (Molua and Lambi, 2006 b).
Several years are also characterized by an annual rainfall exceeding 1000 mm, namely 1951, 1962,
1980, and 1994. This indicates that a wet year has a return period of about 10 years, except for the
1970s, when a major drought was prevailing in the area (Molua and Lambi, 2006 b). Figure 3a shows
that annual rainfall over the years have been on the decline. Ayonghe, (2001) made similar
conclusions for the region of Maroua.
Ten year moving averages highlight decadal trends and shifts in mean values (Figure 3a). In
comparison to annual rainfall, the ten year moving averages are better in identifying trends since it
smoothens the year by year fluctuations in annual rainfall and helps removing the cycle effect from
the data (Swami and Kulkarni, 2012). In addition, the Standardized Anomaly Index (SAI) was
calculated for the annual rainfall series (Figure 3b, also see table 9, Annex II). This method has the
advantage of highlighting the surplus and deficits periods (Tukes and Talti, 2009), and allows to
identify years with extreme rainfall (Table 7).

30
Figure 3. (a) Annual rainfall, trend in annual rainfall and 10-year moving average and (b)
Standardized rainfall Anomaly Index (1951-2003) for Maroua-Salak (Extreme-Northern Cameroon)
This SAI is another means of expressing the variability that exist in the Extreme-Northern Cameroon.
The year 1983, corresponding to the minimum rainfall in the series, is described as a severely dry
year (Table 7). On the contrary, the year 1994, when the maximum rainfall of 1194 mm was
recorded, corresponds to an extremely wet year. Most years are considered to be near normal. From
table 9 (see Annex II) and Table 7 on the classification of SAI for each year, it is clear that the climate
in the Extreme-Northern Cameroon is highly variable. Out of the 53 years of study, two years can be
classified as are extremely wet, two are very wet, two are moderately wet, three are moderately dry,
three are severely dry and the rest are near normal.
Table 7. Overview of severely dry, very wet and extremely wet years using annual rainfall data
(1951-2003) of Maroua-Salak (Extreme-Northern Cameroon) (according to Mckee et al., 1993,
applied by Manacelli G., 2005)
Description Years
Severely dry 1983, 1986
Very wet 1962, 1980
Extremely wet 1951, 1994
The annual ETo, 10-year moving average and SAI for ETo for the period of 1960 to 2004 are
presented in Figure 4a and Figure 4b respectively. ETo shows a long-term increasing trend over the
period of study. Results of the analysis show that ETo varies from 1845 mm (in 1989) to 2232 mm
(2003), with an average of 1955 mm. The figure shows three major peaks in 1960, 1992 and 2003.
400
600
800
1000
1200
1400
1951 1961 1971 1981 1991 2001
An
nu
al r
ain
fall
(mm
)
Years
a)
10 years moving average
Linéaire (Annual rainfal)
-3-2-101234
1951
1956
1961
1966
1971
1976
1981
1986
1991
1996
2001
SAI
Years
b)
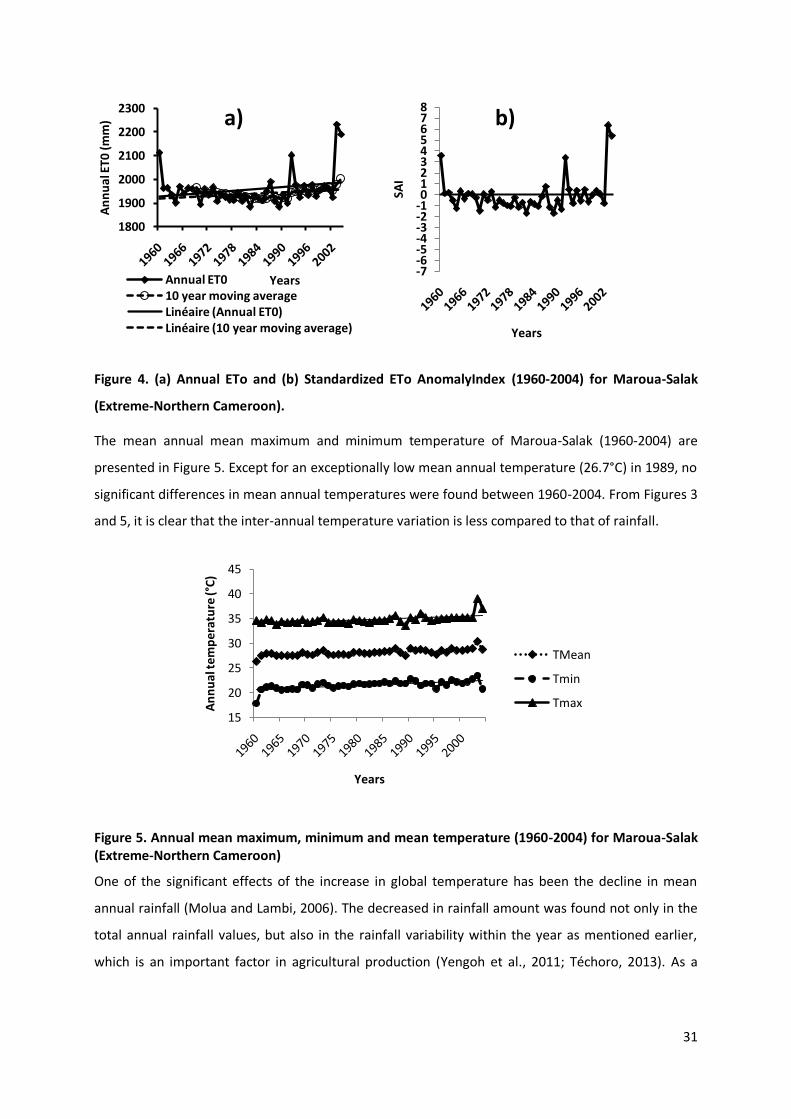
31
Figure 4. (a) Annual ETo and (b) Standardized ETo AnomalyIndex (1960-2004) for Maroua-Salak
(Extreme-Northern Cameroon).
The mean annual mean maximum and minimum temperature of Maroua-Salak (1960-2004) are
presented in Figure 5. Except for an exceptionally low mean annual temperature (26.7°C) in 1989, no
significant differences in mean annual temperatures were found between 1960-2004. From Figures 3
and 5, it is clear that the inter-annual temperature variation is less compared to that of rainfall.
Figure 5. Annual mean maximum, minimum and mean temperature (1960-2004) for Maroua-Salak (Extreme-Northern Cameroon)
One of the significant effects of the increase in global temperature has been the decline in mean
annual rainfall (Molua and Lambi, 2006). The decreased in rainfall amount was found not only in the
total annual rainfall values, but also in the rainfall variability within the year as mentioned earlier,
which is an important factor in agricultural production (Yengoh et al., 2011; Téchoro, 2013). As a
1800
1900
2000
2100
2200
2300A
nn
ual
ET0
(m
m)
Years
a)
Annual ET010 year moving averageLinéaire (Annual ET0)Linéaire (10 year moving average)
-7-6-5-4-3-2-1012345678
SAI
Years
b)
15
20
25
30
35
40
45
An
nu
al t
emp
era
ture
(°C
)
Years
TMean
Tmin
Tmax

32
result of its semi-arid climate, coupled with this climate variability, the Extreme-Northern Cameroon
can be considered as a fragile region (Ambe et al., 2013).
4.1.3 Seasonal, inter- and intra-annual variation using monthly data
4.1.3.1 Long-term average monthly data
Figure 6 shows the long-term average of monthly mean, mean maximum and minimum temperature,
rainfall and ETo for Maroua-Salak throughout the year. With a mean temperature of 32.9°C, the
month of April, coinciding with the end of the dry season, can be considered as the hottest month.
Lowest temperatures are recorded in January, which on average has a temperature of 24.6°C. Witt
and Waibel, (2009) reported similar findings for the Extreme-Northern Cameroon: temperature is
highest in April (monthly average is 32.6°C) and lowest in January (monthly average is 24.5°C) for the
period of 1961-1990.
Figure 6. Long-term average (a) monthly maximum, minimum and mean temperature (1960-2004) and (b) monthly rainfall and ETo (1951-2004) for Maroua-Salak (Extreme-Northern Cameroon)
Rainfall in the region is highly variable throughout the year. Monthly rainfall average ranges from 0
mm in the dry season months to more than 200 mm in the wet season (Figure 6b). The rainy season,
with its onset being very erratic, lasts for about 7 months (April-October), while the bulk of rains
occurs from May to September. The month of August has the highest amount of rain, close to 245
mm. On average, 788 mm of rain out of an annual of 793 mm of the rain, falls during the rainy
season. The rest of the year (November-March) is marked by a pronounced dry season which persists
for at least three months (Molua and Lambi, 2006 b).
The two distinct seasons in Extreme-Northern Cameroon are the result of the movement of two
major air masses across the area. These winds are referred to as trade winds. When the south trade
winds (also called the monsoon) blow, this leads to the rainy season. Conversely, the trades from the
15,0
20,0
25,0
30,0
35,0
40,0
45,0
J F M A M J J A S O N DMo
nth
ly t
emp
era
ture
(°C
)
Months
a)
Tmean Tmin Tmax
0
50
100
150
200
250
300
J F M A M J J A S O N D
Mo
nth
ly ra
infa
ll &
Eto
(m
m)
Months
b)
Rainfall ET0

33
north, also called Harmattan, bring along a general dry season (Wakponou et al., 2012). The advent
of the dry season is often manifested by a total stop in the rainfall (Techoro, 2013).
ETo estimations are indispensable for agricultural purposes (Zitouma et al., 2012). On a seasonal
scale, the influence of seasonal variation in rainfall on ETo is clear. ETo decreases during the rainy
season and progressively increases during the dry season with its peak in the month of April. The
pattern observed in the ETo graph is similar to that of temperature, as temperature is one of the
main parameters determining ETo.
4.1.3.2 Seasonal and temporal PCI
As demonstrated by Oliver (1980), by Michiels et al., (1992), and by Arnoldus, (1978), the
Precipitation Concentration Index can be used as a comparative index to quantify the seasonal and
temporal concentration of the rainfall throughout the year. The seasonal PCI calculated for Maroua-
Salak equals 21%, which corresponds to a strong seasonal rainfall distribution. The temporal PCI,
ranging from 21-30 % (Figure 7) with a mean of 24%, generally remains within the same range as the
seasonal PCI, corresponding to a strong concentrated rainfall distribution. However, temporal PCI
values in 1966 and 1997 were only 19% and 16% respectively, which is classified as a rather
concentrated rainfall distribution. The seasonal and temporal PCI indicate that the region of the
Extreme-Northern Cameroon is bounded to a typical dry and wet period, as explained under the
section on variability in rainfall, where most of the rainfall is concentrated in a specific period of the
year.
Figure 7. Temporal Precipitation Concentration Index (PCI) (1951-2003) for Maroua-Salak (Extreme-Northern Cameroon)..
15171921232527293133
1951 1961 1971 1981 1991 2001
Tem
po
ral P
CI (
%)
Years
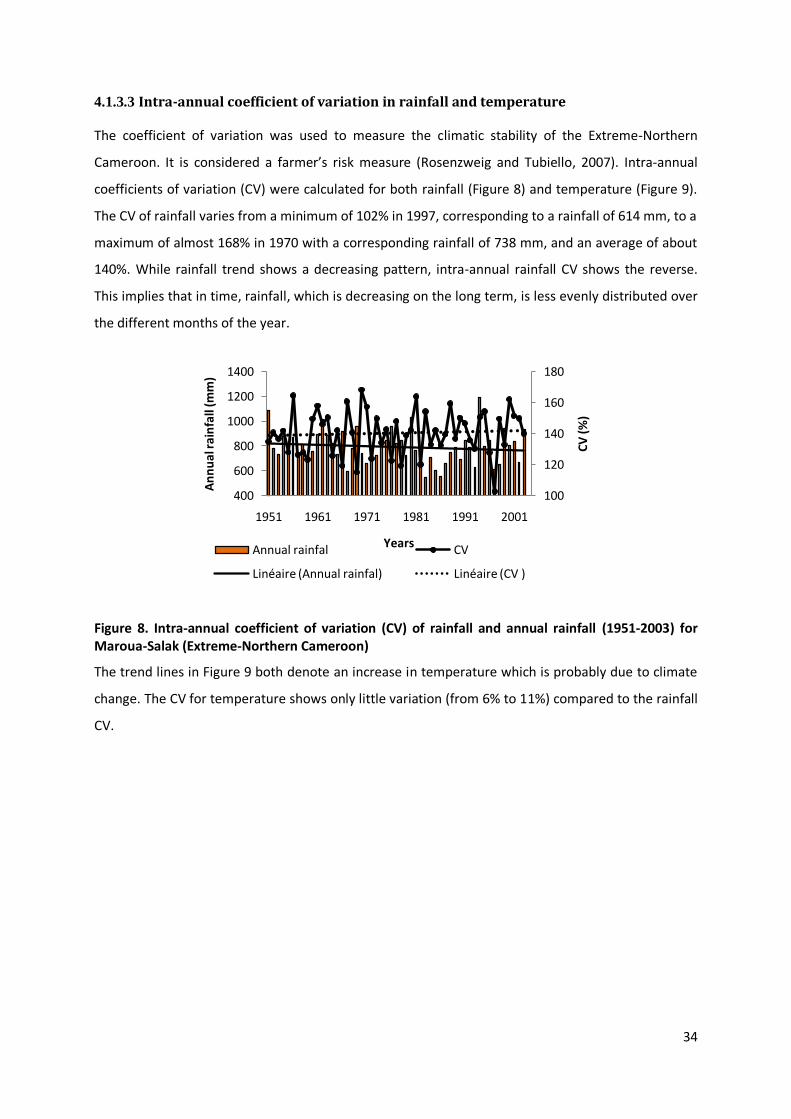
34
4.1.3.3 Intra-annual coefficient of variation in rainfall and temperature
The coefficient of variation was used to measure the climatic stability of the Extreme-Northern
Cameroon. It is considered a farmer’s risk measure (Rosenzweig and Tubiello, 2007). Intra-annual
coefficients of variation (CV) were calculated for both rainfall (Figure 8) and temperature (Figure 9).
The CV of rainfall varies from a minimum of 102% in 1997, corresponding to a rainfall of 614 mm, to a
maximum of almost 168% in 1970 with a corresponding rainfall of 738 mm, and an average of about
140%. While rainfall trend shows a decreasing pattern, intra-annual rainfall CV shows the reverse.
This implies that in time, rainfall, which is decreasing on the long term, is less evenly distributed over
the different months of the year.
Figure 8. Intra-annual coefficient of variation (CV) of rainfall and annual rainfall (1951-2003) for Maroua-Salak (Extreme-Northern Cameroon)
The trend lines in Figure 9 both denote an increase in temperature which is probably due to climate
change. The CV for temperature shows only little variation (from 6% to 11%) compared to the rainfall
CV.
100
120
140
160
180
400
600
800
1000
1200
1400
1951 1961 1971 1981 1991 2001
CV
(%
)
An
nu
al r
ain
fall
(mm
)
YearsAnnual rainfal CV
Linéaire (Annual rainfal) Linéaire (CV )
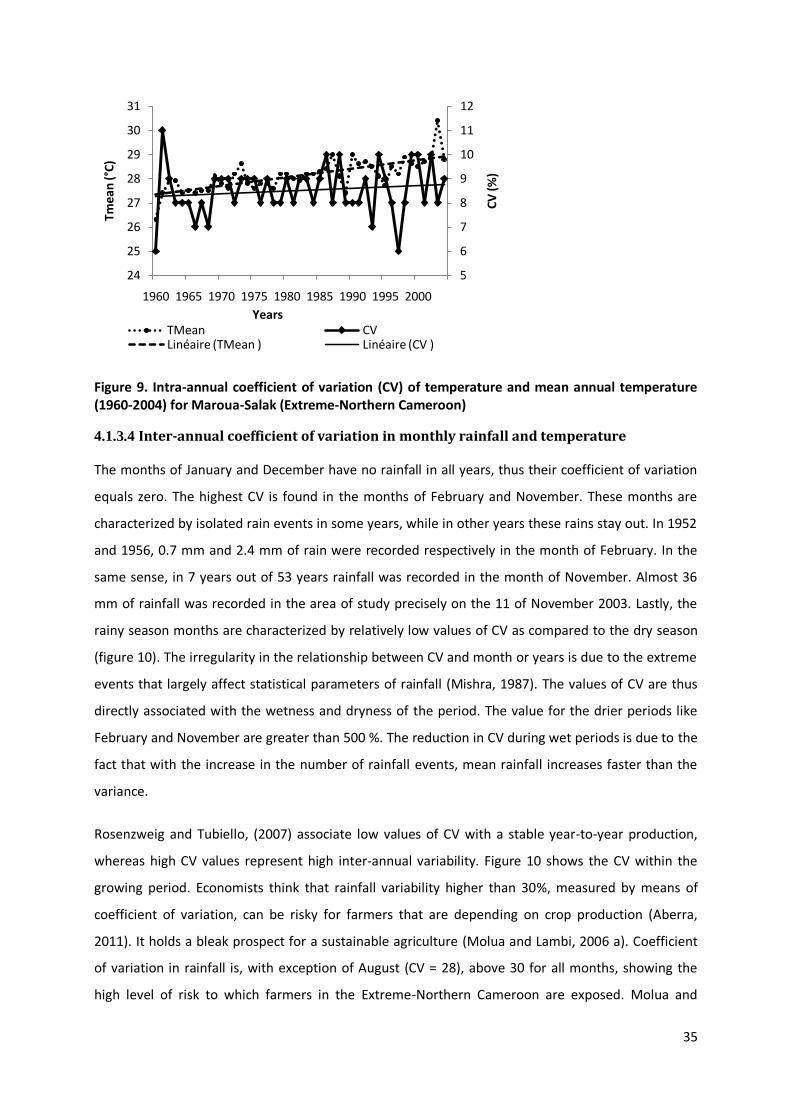
35
Figure 9. Intra-annual coefficient of variation (CV) of temperature and mean annual temperature (1960-2004) for Maroua-Salak (Extreme-Northern Cameroon)
4.1.3.4 Inter-annual coefficient of variation in monthly rainfall and temperature
The months of January and December have no rainfall in all years, thus their coefficient of variation
equals zero. The highest CV is found in the months of February and November. These months are
characterized by isolated rain events in some years, while in other years these rains stay out. In 1952
and 1956, 0.7 mm and 2.4 mm of rain were recorded respectively in the month of February. In the
same sense, in 7 years out of 53 years rainfall was recorded in the month of November. Almost 36
mm of rainfall was recorded in the area of study precisely on the 11 of November 2003. Lastly, the
rainy season months are characterized by relatively low values of CV as compared to the dry season
(figure 10). The irregularity in the relationship between CV and month or years is due to the extreme
events that largely affect statistical parameters of rainfall (Mishra, 1987). The values of CV are thus
directly associated with the wetness and dryness of the period. The value for the drier periods like
February and November are greater than 500 %. The reduction in CV during wet periods is due to the
fact that with the increase in the number of rainfall events, mean rainfall increases faster than the
variance.
Rosenzweig and Tubiello, (2007) associate low values of CV with a stable year-to-year production,
whereas high CV values represent high inter-annual variability. Figure 10 shows the CV within the
growing period. Economists think that rainfall variability higher than 30%, measured by means of
coefficient of variation, can be risky for farmers that are depending on crop production (Aberra,
2011). It holds a bleak prospect for a sustainable agriculture (Molua and Lambi, 2006 a). Coefficient
of variation in rainfall is, with exception of August (CV = 28), above 30 for all months, showing the
high level of risk to which farmers in the Extreme-Northern Cameroon are exposed. Molua and
5
6
7
8
9
10
11
12
24
25
26
27
28
29
30
31
1960 1965 1970 1975 1980 1985 1990 1995 2000
CV
(%
)
Tmea
n (°
C)
YearsTMean CV Linéaire (TMean ) Linéaire (CV )

36
Lambi, (2006) mentioned that the variability of rainfall in this area ranges from 73% to almost 195%
and concluded that this high level of variability is a clear indication of how precarious and
unpredictable climate in the Extreme-Northern Cameroon can be and its possible effect on
agriculture.
Figure 10. Inter-annual coefficient of variation of rainfall (1951-2004) for Maroua-Salak (Extreme-Northern Cameroon).
Coefficients of variation of temperature are not presented, as variation from one month to the other
is limited to 3% in the rainy season and values of about 5% to 6% in the dry season with its maximum
value in January. This brings us to the conclusion that in the Extreme-Northern Cameroon, inter-
annual variation of precipitation in higher than that of temperature (Yengoh, 2013).
4.1.4 Frequency analysis applied to monthly data
Results of the frequency analyses for total annual rainfall, average monthly ETo, mean temperature
and mean relative humidity are presented in Table 8. . In a typical wet year around 895 mm of rainfall
is expected to be recorded, whereas for a typical dry year this equals 680 mm. This study takes into
account the notion of dry and wet years because of the significant effect they might have on crop
growth and yield. Frequency analysis can estimate the recurrence period or probability of a certain
rainfall statistics (Chin-Yu, 2005). A distinction was made between wet, normal and dry years by
means of probability of exceedance of rainfall. This probability describes the likelihood of a specified
rainfall being exceeded in a given year. A rainfall amount with a probability of exceedance of 50% is
interpreted as the amount of periodic rainfall that will be exceeded in 5 out of 10 years and
corresponds to a normal year.
0
50
100
150
200
250
300
0
20
40
60
80
100
120
A M J J A S O Mo
nth
ly R
ain
fall
(mm
)
CV
(%
)
Months
Rainfall CV

37
Table 8. Frequency analysis results for total annual rainfall, average monthly ETo, mean temperature (Tmean) and mean relative humidity (RHmean)
Probability of
exceedance
(%)
Return
period
(years)
Annual rainfall
(mm/year)
Mean monthly ETo
(mm/month)
Mean annual T
(°C)
RHmean
(%)
10 10 958 170 29.1 48.5
20 5 896 168 28.7 48.2
30 3.33 852 166 28.5 47.9
40 2.5 816 164 28.3 47.6
50 2 783 163 28.1 47.4
60 1.67 752 161 27.9 47.2
70 1.43 718 160 27.7 47
80 1.25 681 158 27.5 46.7
90 1.11 631 156 27.2 46.3
The 20% and 80% probability of exceedance of accumulated annual rainfall were used to trace
differences between years with more extreme rainfall. Annual rainfall with a probability of
exceedance below 20% is considered to be a wet year, whereas a year with a probability of
exceedance above 80% for annual rainfall is considered a dry year. Although typically performed for
rainfall, frequency analyses can be done for other climatic parameters as well.
Figure 11 shows the expected monthly rainfall corresponding for the three selected probabilities of
exceedance.
Figure 11. Monthly rainfall for a typical wet year (probability of exceedance = 20%), typical normal year (probability of exceedance = 50%) and typical dry year (probability of exceedance = 80%) for the period (1960-2003) in Maroua-Salak (Extreme-Northern Cameroon)
Figure 11 follows a similar pattern as of intra-annual rainfall variability, indicating the Extreme-
Northern Cameroon is bounded to a typical dry and wet period, with most of the rainfall
0255075
100125150175200225250275300325
J F M A M J J A S O N D
Rai
nfa
ll (m
m)
Months
Wet year (20%)
Average year (50%)
Dry year (80%)

38
concentrated in a specific period of the year. While August will always have the highest amount of
rain, in two out of 10 years, no rain will be recorded in the months of April and October.
With respect to crop water requirement, table 9 shows that in a typical dry year with a return period
of two out 10 years, the amount of rainfall recorded will be sufficient to grow sorghum without
water stress. But this will not be the case for cotton which will require more water to avoid water
stress
Table 9. Crop water requirement, annual rainfall and frequency analysis rainfall.
Crop Crop water
requirement
(mm)
Mean annual rainfall
(mm)
Annual rainfall (mm)for different
POE
20% 50% 80%
Sorghum 500 792 1039 756 526
Cotton 700-800
4.2 Impact of climate variability on growing period and crop yield
4.2.1 Variation in start, end and length and quality of the growing period using decadal
data
Analyses of the variability in growing period were interesting to have an idea on how the quality of
the growing period varies from one year to another. It shows to what extent the start and end, as
well as the length of growing period in the Extreme-Northern Cameroon changes from one year to
another. The start, end and length of the growing period of each individual year are given in table 10,
(Annex II).
According to FAO, (1993), the growing period of Extreme-Northern Cameroon can be classified as
‘normal’ (figure 12). It has a humid period within the growing period which indicates that the full
evapotranspiration demands of rainfed upland crops at maximum canopy cover can be met and that
the moisture deficit of the soil is replenished.

39
Figure 12. Growing period (1960-2004) for Maroua-Salak (Extreme-Northern Cameroon) using long-term average data .
From year to year, the length of the growing period as well as the start and end date of the growing
period show considerable variations (Gunta et al., 2010). This can be seen from table 10 (also see
table 10 Annex II for more details). The average growing period starts on 29 May and ends on 12
October (table 10). The average length of growing period during the period of study is 135 days. The
shortest growing period, recorded only has 93 days (in 1970), while the longest growing period
equals 192 days (in 2003). Correlation analysis between annual rainfall and length of growing period
was statistically significant. The Pearson correlation coefficient was 0.45 and the P-value obtained
was 0.002, which was less than the 0.05 level of significance. The humid period of 72 days on
average, starts in July and ended in September. The shortest humid period is only 45 days, whereas
the longest lasts for 151 days.
Table 10. Mean, standard deviation and range in start, end and length of growing period and humid period (1960-2004) for Maroua-Salak (Extreme-Northern Cameroon)
Growing period Humid period
Year Start End Length Start End Length
Mean 29-May 12-Oct 135 01-Jul 12-Sep 72
Standard deviation
10.3 9.6 23.6 4.08 9.12 23.9
Minimum 10-Jul 12-Oct 93 16-Jul 30-Aug 45
Maximum 22-May 02-Dec 192 22-Apr 22-Sep 151
0
10
20
30
40
50
60
70
80
90
100
1 2 3 1 2 3 1 2 3 1 2 3 1 2 3 1 2 3 1 2 3 1 2 3 1 2 3 1 2 3 1 2 3 1 2 3
Jan Feb Mar Apr May Jun Jul Aug Sep Oct Nov Dec
10-d
ay r
ain
fall,
ETo
an
d E
To/2
(m
m)
Rainfall
Eto (mm)
ETo/2

40
4.2.2 Number of rainy days and events of high daily rainfall and dry spells using daily
rainfall data
Besides crop damage due to drought, heavy rainfall can also damage crops. The number of days of
abnormally high rainfall gives insights into the propensity of crop damage from falling raindrops. The
number of rainy days and the number of days of abnormally high rainfall are precipitation
characteristics that have the potential to negatively affect crop production in the Extreme-Northern
Cameroon (Yengoh, 2013).
Daily rainfall data were used to compute annual trends in the number of rainy days and events of
high daily rainfall (Figure 13). High rainfall was defined as ≥ 40mm of precipitation per day.
The number of rainy days gives an impression of the distribution of rainwater inputs within the
cultivation season. The number of days of abnormally high rainfall gives an idea on the rainfall
intensity. Statistical analysis shows correlation between rainy days and annual rainfall, and also
between high rainfall and annual rainfall. A P-value of 0.01 for both parameters implies significant
relationship between rainy days, high rainfall and annual rainfall. Thus, the amount of rain recorded
annually in the Extreme-Northern Cameroon is strongly dependent on the rainy days and high
rainfall. However, rainy days, with a Pearson Correlation value of 0.56 is more strongly correlated
with annual rainfall than high rainfall (Pearson correlation value of 0.44). This contribution can also
be seen in Figure 13 which shows a decreasing trend in the number of rainy days, compared to an
increase in number of days with rainfall ≥ 40 mm with time. By means of trend line computation,
Ayonghe, (2001) found a decrease in the mean number of rainy days in the Extreme-Northern
Cameroon which he attributed to environmental degradation as a result of the advancement of the
desert. The results of these statistical analyses explain the decreasing trend observed in the annual
rainfall as mentioned above (see Figure 3a).

41
Figure 13. Number of rainy days with daily rainfall ≥ 3 mm and days with daily rainfall ≥ 40mm (1951-2004) for Maroua-Salak (Extreme-Northern Cameroon)
Even if rainfall is sufficient, its irregularity can have adverse effects on yields if rains fail to fall during
the crucial growing stage of the crop (Elton and Guber, 1991; Molua and Lambi, 2006). In the
Extreme-Northern Cameroon, on average 91% of annual rainfall falls during the growing period (see
table 11, Annex II). Figure 14 shows the range represented by the error bars, the 25 percentile, 75
percentile and median of number of dry spell days within the growing period and the number of days
in the growing period from 1960-2003.
The month of October is the month with the highest number of dry spell days (30 days). August is the
month with the least number of dry spell days. Also, August is the only month in which all the days
always fall within the growing period. Even in years that growing period starts late like in 1970, the
month of August is always inclusive in the growing period. This is an indication of the regularity of
August rain in the area of study. This explains the absence of a bar in the month of August in the days
within the growing period because the minimum and maximum days are same. December has the
least number of days within the growing period and their maximum and minimum are also the same.
012345678910
0
10
20
30
40
50
60
1951 1961 1971 1981 1991 2001
rain
y d
ays
≥40m
m
rain
y d
ays
≥3m
m
Years
Rain days ≥ 3mm Rain days ≥40mm
Linéaire (Rain days ≥ 3mm) Linéaire (Rain days ≥40mm)

42
Figure 14. a) Number of dry spell days in the growing period and b) number of days in the growing period with their minimum and maximum represented by the error bars and their median represented by the stars (1960-2004) for Maroua-Salak (Extreme-Northern Cameroon)
4.2.3 Impact of temporal resolution on characterization of climate
Showing the importance of climate variation in the area is an important aspect of this study. This was
done by determining relevant indicators to express climate variability, considering temporal range
(year, season, and growing period for specific crops) and temporal resolution (on daily, and monthly
basis). Based on the climate classification proposed by the UNEP Aridity Index, the climate of the
Extreme-Northern Cameroon can be described as semi-arid, which falls in same line with the
classification found by Techoro, (2013) and Molua and Lambi, (2006 a). Analysis of inter-annual
variation using annual climatic data revealed that among all climatic parameters studied (rainfall,
temperature, ETo and relative humidity), rainfall in the Extreme-Northern Cameroon is the main
climatic parameter subjected to a strong year to year variability which may affect agricultural
production. The vulnerability to climate variability was well expressed on temporal resolution mainly
by daily data, analyzed by means of rainfall frequency and the number of days in dry spell. These two
climate variability indicators are crucial factors that affect crop production in the sense that they
determine the distribution of rain during the growing period. High levels of variability given by
decadal data were more pronounced in the start and end of growing period. This suggests that
farmers in the Extreme-Northern Cameroon are exposed to a risk. For even though on average 91%
of annual rainfall falls during the growing period, shorter growing period are likely to expose some
critical crop development stages to dry long spells, resulting in significant yield losses (Wilt and
Waibel, 2009). The result of frequency analysis which revealed that in two out of ten years, there will
be no rain in the month of October reinforces the seriousness of this risk. Moreover, rainfall in
general showed a decreasing trend which may lead to crop water deficit in a long run. This calls for
the necessity of other sources of water for agriculture, other than rainfall, in the Extreme-Northern
Cameroon. While torrential rains recorded in the month of August make this month the wettest
0
5
10
15
20
25
30
A M J J A S O N D
dry
sp
ell
day
s in
gro
win
g p
eri
od
Months
a)
25 percentile 75 percentile median
0
5
10
15
20
25
30
A M J J A S O N D
day
s in
gro
win
g p
eri
od
Months
b)
25 percentile 75 percentile median

43
month of all the years, even in typical dry years, some months like October in the growing period are
sometimes prone to drought. Thinking of how to make the rainfall of August a potential source of
water for agriculture in this area may constitute an important point of interest. However, keeping
aside this point, it would be more relevant to analyze how climate variability can impact yield.
4.2.4 Sorghum and cotton production in Extreme Northern Cameroon
Table 11 presents the mean, standard deviation and range in total production, total area of
production and yield for wet and dry sorghum and cotton(1984-2004). The bulk of the sorghum
production consists of wet season sorghum which is planted at the beginning of the rainy season,
generally in June. Its production and production area are almost double that of dry season sorghum.
This difference is due to the fact that wet season sorghum is mainly grown for household
consumption, while dry season sorghum is grown especially for the market. On average, dry and wet
season sorghum has a similar yield of 0.9 t/ha. The maximum yield registered for all the yield was
that of cotton, 1.48 t/ha, which is higher than the average cotton yield of 1.23 t/ha.
Table 11. Statistical descriptive of the total production, total production area and yield of wet and dry season sorghum and cotton (1984-2004) from the Departmental Delegation of Agriculture of Maroua (Extreme-Northern Cameroon)
Sorghum (wet season)1 Sorghum (dry season)1 Cotton2
Year
Prod.
(103 t)
Area
(103
ha)
Yield
(t/ha
)
Prod.
(103
t)
Area
(103
ha)
Yield
(t/ha
)
Prod.
(103
t)
Area
(103
ha)
Yield
(t/ha
)
Avera
ge
228 246 0.9 100 109 0.9 148 173 1.17
Stdev 6069 2827 0.2 4425 298 0.2 48 56
827
0.14
Min 120 196 0.5 391 55 0.6 73 97 0.88
Max 348 284 1.2 182 159 1.4 231 304 1.48 1 Source: Department Delegation of Agriculture, Maroua
2 Source: Department Delegation of Agriculture, Maroua & SODECOTON
While the average production area is largest for wet season sorghum (246 822 ha), cotton and dry
season sorghum production strongly increased over the period of study. (Naudin et al. 2010; Yengoh,
2013) reported that the cultivated area for crop production has grown for most crops, while the
intensity of production has not. According to Levrat, (2010), this increase in agricultural output can
be attributed to the population growth. The average demographic growth rate is estimated at
around 2.6 % and almost 70% of the population lives on agriculture (Techoro, 2013), mostly on
cotton which is their main cash crop (Folefack, 2011), followed by dry season sorghum. Significant
correlation found between total production and total production area are presented in table 12.

44
Table 12. Correlation between total production and total production area of wet and dry season sorghum and cotton (1984-2004) from the Departmental Delegation of Agriculture of Maroua (Extreme-Northern Cameroon)
Sorghum wet Sorghum dry Cotton
r 0.62 0.85 0.96
P-value 0.002* 0.001* 0.001*
* correlation is significant
4.2.5 Yields and climate variability
The study of yield and climate variability in the Extreme-Northern Cameroon was based on three
different periods of governmental intervention in agriculture as shown in figure 15. The figure shows
the Standardized Anomaly Index of annual rainfall and wet and dry season sorghum and cotton
yields. The three periods of diverging governmental interventions are represented by green, red and
blue color. The green color represent the period prior to the implementation of SAP (Structural
Adjustment Program), with sustainable assistance awarded to agriculture (1984-1989); the red color
represents the “harsh” period characterized by the stop of agricultural subvention and the real
application of SAP (1990-1999). The blue stands for the period of the beginning of government
assistance to agriculture.
Before the economy crisis that occurred in Cameroon during the period 1987-1993, followed by the
implementation of the Structural Adjustment Program (SAP), the Cameroonian economy had a
sustainable annual growth attributable to agricultural exports. This was due to the support initiated
by the government aiming at improving food production in Cameroon, and especially in the Extreme-
Northern Cameroon. The correlation between total annual rainfall and yield for the period when
government aid to agriculture was still substantial (1984-1989) is lower than that of the period when
the aid was canceled (1990-1999). From 2000, the emergence of governmental assistance to some
specific crops reduced the strong correlation found in the previous period (Yengoh, 2013). This
implies that agriculture in the Extreme-Northern Cameroon is, from 1990-1999, mainly conditioned
by climate.

45
Figure 15. Standardized rainfall anomly index and (a) wet season sorghum (b) dry season sorghum and (c) cotton in three different periods (1984-1989; 1990-1999 and 2000-2004) in Maroua (Extreme-Northern Cameroon).
Table 13 shows the correlation coefficient between yield of wet season sorghum and cotton and
annual rainfall for the period of governmental support and that of absence of the support. No
significant correlation was found during the period of 1984-1989, agricultural production did not
depend on rainfall. However, the period of absence of aid (1990-1999) shows significant correlation
between annual and growing period rainfall and wet season sorghum yield. Dry season sorghum was
only correlated with annual rainfall because it period of cultivation does no fall within the growing
period. From 2000, the introduction of assistance to agriculture had a slight effect on the
dependence of agriculture to rainfall. In general, cotton showed no significant correlation with
annual rainfall or growing period rainfall for all periods. Kangah, (2004) and Blanc et al., (2008) also
realized in their study in Central West Africa that cotton yield variability cannot be explained by the
variation in total annual rainfall. One of the reasons for this lack of correlation might be the length of
-2-1,5
-1-0,5
00,5
11,5
22,5
33,5
1984 1989 1994 1999 2004
SAI
Years
b)
Sorghum dry Total rainfall (mm)
-4
-2
0
2
4
1984 1989 1994 1999 2004
SAI
Years
c)
CottonTotal rainfall (mm)Linéaire (Cotton)Linéaire (Total rainfall (mm))
-3
-2
-1
0
1
2
3
4
1984 1989 1994 1999 2004
SAI
Years
a)
Sorghum wet Total rainfall (mm)

46
crop cycle. In this study, the crop cycle for cotton was considered to be 180 days. Some authors like
Sultan et al., (2010) claim that the average length of the cotton crop cycle does not exceed 150 days
in Africa and that beyond this duration, annual rainfall is unfit to define the cotton yield variability.
However, other authors like Lawson, (2008), Sawan et al., (2010) and Sawan, (2013) who did studies
on cotton in Africa mentioned that cotton takes almost six months from planting to harvesting. They
also insisted on the high influence of temperature on cotton. Kooistra and Termorsshuizen, (2006) in
their general study on cotton highlighted the sensitivity of cotton to low temperature. Analyses
carried in this thesis (see table 15) revealed that the most limiting climatic characteristics for cotton
were the very low mean day temperature of flowering stage and precipitation of yield formation
stage. A detailed analysis for some specific years (1984 and 1986) revealed that variability in cotton
yield in those years was due to rainfall variability as developed below. These findings suggest that
cotton is a crop that is extremely sensitive to adverse climatic conditions (Leblois et al., 2012).
Table 13. Correlation between annual rainfall and rainfall in the growing period and yield of cotton, wet and dry season sorghum (1984-2004) from the Departmental Delegation of Agriculture of Maroua (Extreme-Northern Cameroon)
1984-1989 1990-1999 2000-2004
Statistical
parameter
Sorghum
wet
Sorghum
dry
Cotton Sorghum
wet
Sorghum
dry
Cotton Sorghum
wet
Sorghum
dry
Cotton
Annual rainfall
R
-0.20 0.06 0.05 0.63 0.89 -0.04 0.39 0.81 -0.85
P-value 0.57 0.90 0.90 0.05* 0.001* 0.90 0.51 0.09 0.06
Rainfall in growing period
R 0.28
0.38 0.73
-0.05 0.21
-0.86
P-value 0.58
0.45 0.01*
0.87 0.72
0.06
* correlation is significant
Yengoh, (2013) reported that rainfall is the most important climatic factor for crop production in the
Extreme- Northern Cameroon. Since all the rainfall occurs during one season, which is the cultivation
season for most of the crops in this area, it is reasonable to assume that the total annual rainfall
approaches the rainfall that is used for crop cultivation since 91% of the rainfall falls during the
growing period.
The year 1994 had the highest amount of rainfall and the highest dry season sorghum yield.
However, what matters most may not be the total amount of rain registered, but its distribution
within the growing period or during the crop cycle. A study of rainfall evolution for two specific years

47
(1984 and 1986), conducted by Witt and Waibel, (2009), in the Extreme-Northern Cameroon
revealed that a year can record higher yield with lower amount of rainfall as compared to a year with
higher amount of rainfall. They noticed that, even though the year 1986 recorded the lowest amount
of rainfall, it did not record the lowest yield. Meanwhile, 1984, with a higher amount of rainfall, had a
lower yield. The main reason of this difference could be that in 1984 the growing period started in
23-April, and the highest rain fell mostly during the first decade of May, which may still be
considered as planting season, but failed to fall during the month of June, which is a crucial period in
the crop growth. As a result of this, a decreased in sorghum yield was recorded in 1984, while an
increase was found in the year 1986. Similar conclusion could be drawn in the case of cotton.
No significant correlation was found between the number of rainy days, heavy rainfall and yield,
except for dry season sorghum which showed some significance with the heavy rainfall amount, with
a P-value of 0.04. Thus, high amount of rainfall might contribute to the damage of dry season
sorghum production.
Rainfall was the major factor out of all factors studied, helpful to understand the variability in yield.
So far, this study shows how climate variability affect the quality of yield and growing period that
varies from year to year. It would also be interesting to know to what extend this climate variability
can impact the reliability of the traditional land suitability assessments.
4.3 Sensitivity analysis of the land suitability classification to climate
variation
Traditional land suitability assessments usually only consider long-term average climatic data, not
taking into account climate variability. In what follows, this research investigates to what extent
climate variability is influencing the reliability of the FAO crop-specific Land Suitability Classification.
4.3.1 Scoring of individual climatic characteristics using time-series data
The FAO crop-specific land suitability classification was run using variation in climatic characteristics,
the fixed sowing date and variable sowing date approach to test the robustness of the method with
regards to climate variability. Therefore, the climate index was calculated for each year, assuming a
fixed sowing date (29 May, mean start of growing period) and variable sowing date (start of growing
period for each year). Based on the requirement tables, ratings were attributed to the various
calculated climatic indices. From year to the other, sowing date was highly variable. This variability
was also found in the scoring of individual climatic characteristics of wet sorghum and cotton.

48
4.3.1.1 Scoring of individual climatic characteristics for wet sorghum
For sorghum, seven different climatic characteristics were scored. Their maximum minimum and
averages can be found in table 14 and the scores for individual years can be found in tables 12 and 13
(Annex III). The average climatic rating for the fixed sowing date approach equaled 90. Minimum and
maximum ratings obtained with fixed sowing date were 69 and 92. Average ratings for the variable
sowing date approach were similar to those of the fixed sowing date approach, with an average
climatic rating of 89, a minimum of 78 and a maximum of 95. Keeping the sowing date fixed for
sorghum, precipitation of the third month (flowering stage) had a better average rating (100) than
when the sowing date was variable (98). Even though relative humidity was the most limiting factor,
it standard deviation was very low. This means that relative humidity is not influenced so much by
climate variability. However, the higher value of the standard deviation in the precipitation of the
growing cycle and precipitation of 3rd month attests once more the existence of variability in rainfall.
In order to know how climatic characteristics might react towards rainfall amount in a typical wet,
dry and normal year, results obtained from the frequency analysis were also used in the ratings.
However, since rainfall was seen to be the most variable climatic parameter, only rainfall data of
probabilities of exccedance of 20%, 50% and 80% were retained in the calculations. The long-term
average data were considered for the other climatic characteristics. Results revealed that in a typical
dry year, there will be no moisture deficit in the third month of the crop cycle. The rating of
precipitation of growing cycle found in a dry (95) was higher than that of a wet year (85). This implies
that drier condition would be more favorable for sorghum production as compare to wetter
conditions. Also, the minimum rating obtained when including rainfall data from the probability of
exceedance (20%) was by far higher (86) than that obtained from the annual data set with fixed and
variable sowing date approach, which had respectively ratings of 69 and 78. This implies that if
rainfall is well distributed as supposed by the frequency analysis methods, even in a typical wet yet,
all the climatic characteristics will be favorable for sorghum production. Except of the rating of the
minimum from the different sowing date that could be classified as moderately suitable (S2), the rest
of the ratings with those of POE were suitable, which is an indication of the suitability of climate to
sorghum production.
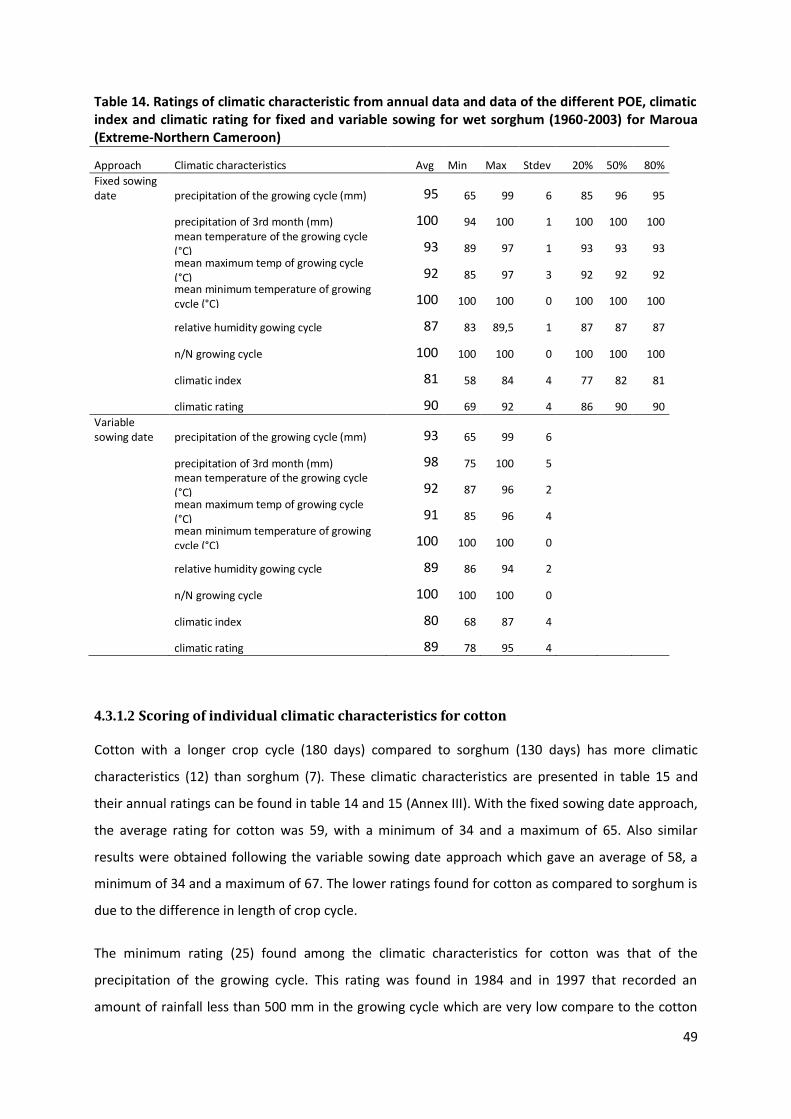
49
Table 14. Ratings of climatic characteristic from annual data and data of the different POE, climatic index and climatic rating for fixed and variable sowing for wet sorghum (1960-2003) for Maroua (Extreme-Northern Cameroon)
Approach Climatic characteristics Avg Min Max Stdev 20% 50% 80%
Fixed sowing date precipitation of the growing cycle (mm) 95 65 99 6 85 96 95
precipitation of 3rd month (mm) 100 94 100 1 100 100 100
mean temperature of the growing cycle (°C) 93 89 97 1 93 93 93
mean maximum temp of growing cycle (°C) 92 85 97 3 92 92 92
mean minimum temperature of growing cycle (°C) 100 100 100 0 100 100 100
relative humidity gowing cycle 87 83 89,5 1 87 87 87
n/N growing cycle 100 100 100 0 100 100 100
climatic index 81 58 84 4 77 82 81
climatic rating 90 69 92 4 86 90 90
Variable sowing date precipitation of the growing cycle (mm) 93 65 99 6
precipitation of 3rd month (mm) 98 75 100 5
mean temperature of the growing cycle (°C) 92 87 96 2
mean maximum temp of growing cycle (°C) 91 85 96 4
mean minimum temperature of growing cycle (°C) 100 100 100 0
relative humidity gowing cycle 89 86 94 2
n/N growing cycle 100 100 100 0
climatic index 80 68 87 4
climatic rating 89 78 95 4
4.3.1.2 Scoring of individual climatic characteristics for cotton
Cotton with a longer crop cycle (180 days) compared to sorghum (130 days) has more climatic
characteristics (12) than sorghum (7). These climatic characteristics are presented in table 15 and
their annual ratings can be found in table 14 and 15 (Annex III). With the fixed sowing date approach,
the average rating for cotton was 59, with a minimum of 34 and a maximum of 65. Also similar
results were obtained following the variable sowing date approach which gave an average of 58, a
minimum of 34 and a maximum of 67. The lower ratings found for cotton as compared to sorghum is
due to the difference in length of crop cycle.
The minimum rating (25) found among the climatic characteristics for cotton was that of the
precipitation of the growing cycle. This rating was found in 1984 and in 1997 that recorded an
amount of rainfall less than 500 mm in the growing cycle which are very low compare to the cotton

50
water requirement (700-800 mm). The most limiting factors for cotton production were in general
precipitation of yield formation stage (mm) (5th month) and mean day temperature of the flowering
stage (°C) (3-4th month). They had on average a rating 60.
The ratings for the precipitation of yield formation stage correspond to a climatic class of S2, which is
moderately suitable same as the mean day temperature’s rating. Other factors, likely the
precipitation and mean temperature of the vegetative stage (1st-2nd month), the precipitation and
mean temperature of ripening stage (6th month) and the relative humidity were evaluated as
suitable. The precipitation of the crop cycle was also limiting with a rating of 78 classified as S2
(moderately suitable). In accordance to Lebois et al., (2012) who argued that an increase in
temperature is an important handicap to cotton production, the mean day temperature of flowering
stage was in general very low and was the most limiting factor. The minimum temperature range
required by the requirement table for mean day temperature was 20 to 30°C, but the highest mean
day temperature obtained in the study area was 15°C. However, even if the mean night temperature
of flowering stage was suitable on average, the high value obtained for it standard deviation (20)
indicates the high variability that exists in the mean night temperature from one year to another for
both sowing date. This high variability was also found in the precipitation of the growing cycle
indicated by a standard deviation of 18 and 19 for the variable and fixed sowing date approach
respectively.
Using the long –term average data for temperature and relative humidity, climatic ratings were also
calculated with precipitation obtained in the probability of exceedance of 20%, 50% and 80%.
Results obtained in a typical dry year (80%) correspond exactly to those found in the minimum year
with the sowing date approach. The main different was between the ratings of the maximum (65 and
67) for the sowing date approach compared to 59 which correspond to a rating expected in a typical
wet year. However, the rating for a typical wet year and that of the maximum, even though being the
highest, are still not satisfactory, mostly that of a wet year which can be classified as marginally
suitable (S3). In general, ratings of climatic characteristics for cotton lie between suitability class of
N1 (actually unsuitable, potentially suitable) and S2 (moderately suitable). This high variability shown
by the ratings of climatic characteristics suggest the vulnerability of cotton production to climate
variability.

51
Table 15. Ratings of climatic characteristic from annual data and data of the different POE, climatic index and climatic rating for fixed and variable sowing for cotton (1960-2003) for Maroua (Extreme-Northern Cameroon)
Approach Avg Min Max Stdev 20% 50% 80%
Fixed sowing date precipitation of the growing cycle (mm) 78 25 98 19 97 74 25
precipitation of vegetative stage (mm) (1st-2nd month) 95 95 95 0 95 95 95
precipitation of yield form.stage (mm) (5th month) 60 60 79 4 60 60 60
precipitation of ripening stage (mm) (6th month) 100 90 100 2 100 100 100
mean temperature of the growing cycle (°C) 100 94 100 1 100 100 100
mean maximum temp of growing cycle (°C) 100 100 100 0 100 100 100
average max temp warmest month (°C) 100 100 100 0 100 100 100
mean temp of the vegetative stage (°C) (1st-2nd month) 91 87 95 2 91 91 91
mean day temp of flowering stage (3-4th month) 60 60 60 0 60 60 60
mean night temp of flowering stage (°C) (3-4th month) 100 60 100 20 100 100 100
mean temp of ripening stage (°C) (6th month) 100 86 100 3 100 100 100
relative humid of maturation stage (%) 100 56 100 7 100 100 100
climatic index 47 19 53 7 47 47 19
climatic rating 59 34 65 6 59 59 34
Variable sowing date precipitation of the growing cycle (mm) 77 25 99 18
precipitation of vegetative stage (mm) (1st-2nd month) 95 95 95 0
precipitation of yield form.stage (mm) (5th month) 65 51 94 10
precipitation of ripening stage (mm) (6th month) 98 54 100 8
mean temperature of the growing cycle (°C) 100 94 106 2
mean maximum temp of growing cycle (°C) 100 100 100 0
average max temp warmest month (°C) 100 100 100 0
mean temp of the vegetative stage (°C) (1st-2nd month) 92 87 100 3
mean day temp of flowering stage (3-4th month) 60 60 60 0
mean night temp of flowering stage (°C) (3-4th month) 82 60 100 20
mean temp of ripening stage (°C) (6th month) 98 86 100 4
relative humid of maturation stage (%) 99 77 100 4
climatic index 45 19 56 6
climatic rating 58 34 67 6

52
4.3.2 Statistical analysis between annual rainfall, yields and scores from variable and
fixed sowing date approach.
Since the growing cycle was determined based on rainfall, it would be interesting to check if the
ratings obtained were influenced by rainfall. Statistical analyses, table 16, revealed significant
correlation between the annual rainfall and the climatic rating for variable and fixed sowing for
sorghum, whereas for cotton, significant correlation was found only when the sowing date was
variable. This is an indication of the effect of rainfall in the crop cycle. With respect to yield,
significant correlation was found only between fixed sowing date and dry sorghum.
Table 16. P-value of correlation between annual rainfall and ratings of variable and fixed sowing date approach (1960-2003) for wet sorghum and cotton, and between rating and yields of dry and wet sorghum and cotton for Maroua (Extreme-Northern Cameroon).
Fixed sowing date Variable sowing date
Correlation between climatic rating and annual rainfall
Sorghum Cotton Sorghum Cotton
0.01* 0.28 0.03* 0.01*
Correlation between climatic rating and yields
Wet sorghum
Cotton Wet sorghum Cotton
0.6
0.62 0.6 0.9
*correlation is significant.
In order to determine the sensitivity of the suitability assessment to variation in climatic parameters,
and to understand if it corresponds to real-world impacts on yield, each climatic characteristic was
evaluated using the FAO Crop –Specific Land Suitability Classification table 17 (also see table 18,
Annex III). Results revealed variability in the suitability classes not only between years, but also
between sowing date. Climate is suitable for sorghum production in all the years, a moderate
suitability being observed in 4 out of 43 years with a variable and fixed sowing date approach. For
sorghum, climate is also suitable in a typical dry, wet and average year as demonstrated by the
different probabilities of exceedance obtained by means of the fixed sowing date approach. For
cotton, there is similarity in the suitability class (S2, S3 and N1). With a fixed sowing date, 36 out of
43 years were classified as marginally suitable. Almost same ranges were found with a fixed sowing
date approach. Even though these results do not really give a clear difference between the different
sowing date approaches, they give an indication of variability in suitability classes taking into account
variation in climatic characteristics. It should be noted that even though long-term averages were
used with the fixed sowing date approach, results differ from when variation were not included.
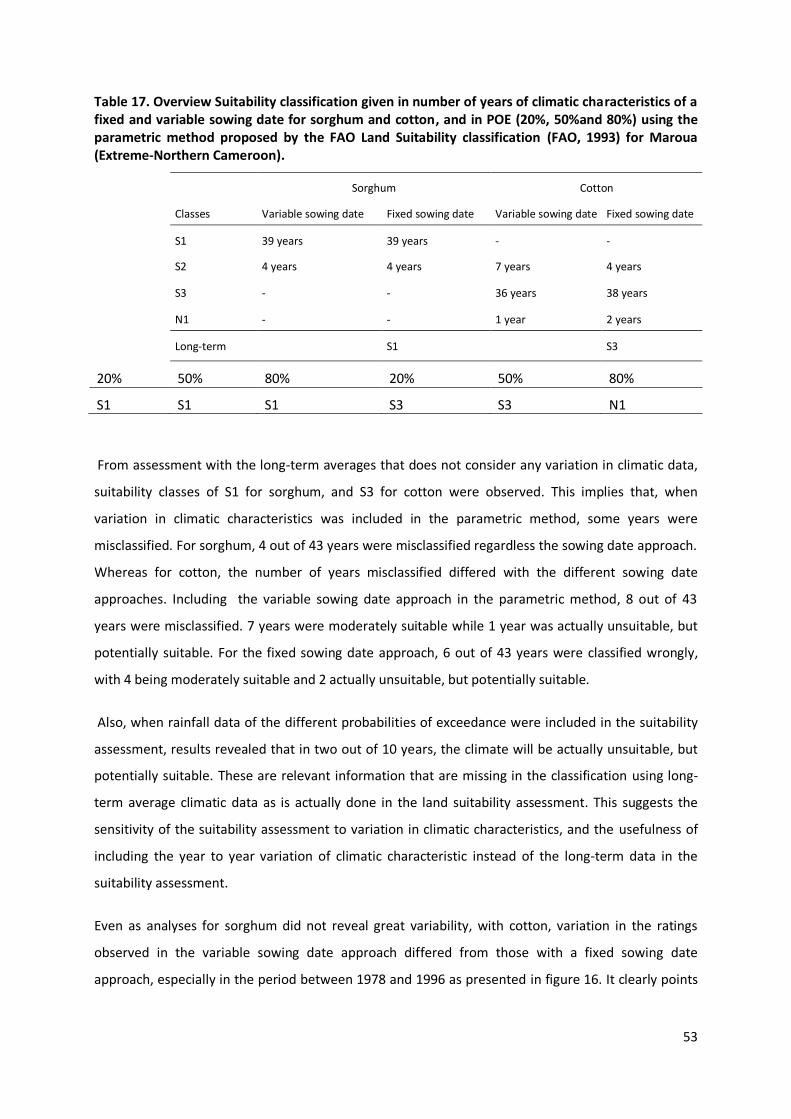
53
Table 17. Overview Suitability classification given in number of years of climatic characteristics of a fixed and variable sowing date for sorghum and cotton, and in POE (20%, 50%and 80%) using the parametric method proposed by the FAO Land Suitability classification (FAO, 1993) for Maroua (Extreme-Northern Cameroon).
Sorghum
Cotton
Classes Variable sowing date Fixed sowing date Variable sowing date Fixed sowing date
S1 39 years 39 years - -
S2 4 years 4 years 7 years 4 years
S3 - - 36 years 38 years
N1 - - 1 year 2 years
Long-term
average
S1
S3
20% 50% 80% 20% 50% 80%
S1 S1 S1 S3 S3 N1
From assessment with the long-term averages that does not consider any variation in climatic data,
suitability classes of S1 for sorghum, and S3 for cotton were observed. This implies that, when
variation in climatic characteristics was included in the parametric method, some years were
misclassified. For sorghum, 4 out of 43 years were misclassified regardless the sowing date approach.
Whereas for cotton, the number of years misclassified differed with the different sowing date
approaches. Including the variable sowing date approach in the parametric method, 8 out of 43
years were misclassified. 7 years were moderately suitable while 1 year was actually unsuitable, but
potentially suitable. For the fixed sowing date approach, 6 out of 43 years were classified wrongly,
with 4 being moderately suitable and 2 actually unsuitable, but potentially suitable.
Also, when rainfall data of the different probabilities of exceedance were included in the suitability
assessment, results revealed that in two out of 10 years, the climate will be actually unsuitable, but
potentially suitable. These are relevant information that are missing in the classification using long-
term average climatic data as is actually done in the land suitability assessment. This suggests the
sensitivity of the suitability assessment to variation in climatic characteristics, and the usefulness of
including the year to year variation of climatic characteristic instead of the long-term data in the
suitability assessment.
Even as analyses for sorghum did not reveal great variability, with cotton, variation in the ratings
observed in the variable sowing date approach differed from those with a fixed sowing date
approach, especially in the period between 1978 and 1996 as presented in figure 16. It clearly points

54
out the variation found in the climatic characteristics when yearly data are involved. With rainfall
variability, the traditional land suitability assessment is not identical in all the years.
Figure 16. Climatic rating for variable and fixed sowing date for (a) sorghum and (b) cotton for Maroua-Salak (Extreme-Northern Cameroon).
It should be noted that major variability was noticed within the different stages of crop cycle. Thus,
to trace the possible effect of rainfall on agriculture, it is not only interesting to carry out the study
generally relying on the onset and length of rains, but mostly going into detail analysis by examining
every crop development stage which can reveal possible “hidden” variability.
60
70
80
90
100
110
1960 1966 1972 1978 1984 1990 1996 2002
Rat
ing
Years
a) Sorghum
variable sowing data
fixed sowing date
Linéaire (variable sowing data)
Linéaire (fixed sowing date)
30
40
50
60
70
1960 1966 1972 1978 1984 1990 1996 2002
Rat
ing
Years
b) Cotton
fixed sowing datevariable sowing dataLinéaire (fixed sowing date)Linéaire (variable sowing data)

55
Chapter 5: Conclusion and recommendations
5.1 Conclusion
Climate variability in the Extreme-Northern Cameroon cannot be underestimated. It was noticed that
the Extreme-Northern Cameroon is a region with a sharp seasonal contrast with rainfall varying at
inter-annual, intra-annual and decadal scales. Among all climatic parameters studied (rainfall,
temperature, ETo and relative humidity), rainfall was the main climatic parameter subjected to a
strong year to year variability. Daily data were best suited to express vulnerability to climate
variability since significant statistical analyses pointed out that the amount of rain recorded annually
in this area was strongly dependent on the rainy days and the high rainfall. The assessment of length
and quality of growing period was a helpful tool to understand to what extent this climate variability
affects land performance.
Since 91% of the annual rainfall were concentrated within the growing period, including variation in
climatic characteristics and sowing date approach into the land suitability assessment were
important to trace out the detrimental effect that irregularities of rainfall could have on yield. This
assessment gave interesting information which can be used to understand the effects of climate
variability on yield, but that were not highlighted when suitability assessment relied only on long-
term averages. This suggests that the accuracy, reliability and risk-averseness of land evaluation
assessments can be increased by explicitly taking into account climate variability into the
methodological approaches.
5.2 Recommendations
In order to protect the population from food shortage in the Extreme-Northern Cameroon, it would
be interesting to adopt some agricultural practices that could help to store more water. Since the
bulk of rain falling within the period from April to October might be higher than soil storage capacity,
rainwater harvesting during this period can turn the water scarcity of the period from November to
March into a positive water balance. Experts on the subjects can transfer their knowledge either
indirectly through academic programs or directly to farmers through farmer’s local organization.
Research should also propose improved methods on how to better incorporate climate variability
into the land suitability assessments.

56
References
Aberra, K., (2011). The impact of climate variability on crop production in Ethiopia: Which crop is
more vulnerable to rainfall variability? Ethiopian Economics Association, Ninth International
Conference on the Ethiopian Economy. July 21-23, EEA Conference Center Addis Ababa.
Alexandrov, V., Mateescu, E., Mestre, A., Kepinska-Kasprzak, M., Stefano, V. D. and Dalezios, N.
(2008). Summarizing a questionnaire on trends of agro-climatic indices and simulation model outputs
in Europe. In: Cost Action 734: Impact of Climate Change and Variability on Europpean Agriculture -
Survey of Agro-meteorological Practices and Applications in Europe regarding Climate Change
Impacts. Nejedlik, P. and Orlandini, S. (eds), pp. 115-161
Allen, R. G., Pereira, L. S., Raes, D. & Smith, M. (1998). Crop Evapotranspiration: Guidelines for
Computing Crop Water Requirements. FAO Irrigation and Drainage Paper No. 56. FAO, Rome,
Italy. 300 p.
Ambe, E. C., Hans, J. V. and Roy, L. M. (2013). Vulnerability of water resources in Northern Cameroon
in the context of climate change. Environ Earth Sci, 70: 1211-1217.
Arnoldus, H. M. J. (1978). An approximation of the rainfall factor in the Universal soil loss equation. In
De Boodt, M. and Gabriels, D. (Eds), Assessment of Soil Erosion, John Wiley and Sons, Chichester,127-
132.
Ayonghe, S. N. (2001). A qualitative evaluation of global warming and precipitation in Cameroon from
1930 to 1995 and projection to 2060. In: Effects on environment and water resources. Lambi, C. M.
(ed), Unique Printer, pp. 142-155
Barron, J., (2004). Dry spell mitigation to upgrade semi-arid rainfed agriculture: water harvesting and
soil nutrient management for smallholder maize cultivation in Machakos, Kenya. Ph. D. thesis in
Natural Resource Management. Department of system ecology, Stokholm University, Stockholm (PP.
1-39)
Barron, J., Rockstrom, J., Gichuki, F., & Htibu, N. (2003). Dry spell analysis and maize yield for two
semi-arid locations in east Africa. Agricultural and forest meteorology, 117: 1-2, 23-37.
Beek, K. J.(1980). From soil survey interpretation to land evaluation. In: Land reclamation and water
management, ILRI Publication 27, Wageningen, pp 29-42.
Bhakar, S. R., Bansal, A. K., Chajed, N. and Purohit, R. C. (2006). Frequency analysis of consecutive
days maximum rainfall at Banswara, Rajasthan, India. ARPN Journal of Engeineering and applied
Sciences 1 (3): 64-67
Blanc, E., Quirion, P. and Stroble, E. (2008). The climatic determinants of cotton yields: evidence
froma plot in West Africa. Agricultural and Forest Meteorology 148: 1093-1100.

57
Cabrera, D. E., Solis, & Letson, D. (2009). Optimal crop insurance under climate variability:
contrasting insurer and farmer interest. American society of agricultural and biological engineer, 52
(2): 623-631.
Chin-Cheng, C. (2002). The potential impact of climate change on Taiwan’s agriculture. Agricultural
Economics 27: 51-64
Chin-Yu, L. (2005). Application of rainfall frequency analysis on studying rainfall distribution
characteristics of Chia-Nan plain area in Southern Taiwan. Crop, Environment and Bioinformatics 2:
31-38.
Cochemé, J. and Franquin, P. (1967). An agroclimatology survey of a semi-arid area in Africa, south
of the Sahara. World Meteorology Organisation 86: 210, TP 110
Copenhagen Accord 2009 of the United Nations Climate Change Conference 2009 in Copenhagen.
Davidson, D. A. (2002). The assessment of land resources: achievement and new challenges.
Australian geographical studies 40 (2): 109-128.
Dent, D. and Young, A. (1981). Soil survey and land evaluation. George Allen & Unwin Publ. LTD.,
London, 278pp.
Dorronsoro, C. (2002). Soil evaluation. The role of the Soil Science in the Land Evaluation. Sustainble
use and management of soils in arid and semiarid regions. SUMASS 2002.Cartagena (Murcia-Spain).
Volume I. Edts.: A. Faz, R. Ortiz, A.R. Mermut. 106-128. Quaderna Editorial. Murcia.
Duce, P., Donatella, S., Motroni, A. and Canu, S. (2002). Climatic Risk Assessment for Agriculture in a
Mediterranean Region. First technical workshop on the Medirranean component of CLIMAGRI
project on climate change and agriculture.
Dumanski, C. and Onofrei, C. (1989). Techniques of crop yields assessment for agricultural land
evaluation. Soil use and Management 5: 9-16.
Easterling, D. R., Evans J. L., Groisman, P., Ya, K. T.R., Kunkel T. E. and Abenje, P. (2000). Observed
variability and trend in extreme climate events: a brief review. Bull. Am. Meterol. Soc. 81: 417-425.
Echersten, H., Komber, A. and Bergkevist, G. (2008). Symposium on climate change and variability:
Agrometeorological monitoring and coping strategies for agriculture Norway. Book of abstracts
Biifork Fokus, 3:8, 77p.
Eitzinger, J. S., Thaler, S., Orlandini, P., Nejedlik, V., Kazandjiev, T. H., Sivertsen and Mihailovic, D.
(2009). Applications of agroclimatic indices and process oriented crop simulation models in European
agriculture. Idojaras 113(1-2): 1-12.
Elton, E. J. and Gruber, M. J. (1991). Modren porfolio theory and investment analysis. Willey, New
York.
FAO, (1976). A framework for land evaluation. Soils Bulletin 32. Rome. Italy.

58
FAO, (1984). Land evaluation for forestry. FAO forestry paper 48, FAO, Rome, 123p
FAO, (1993). Agro-ecological assessments for national planning: the example of Kenya. FAO Soil
Bulletin n° 67. FAO, Rome.
FAO, (2001). FAOCLIM 2: world-wide agro-climatic data. Environment and Natural Resources.
Working paper No. 5 (CD-ROM)
FAO, (2009). ETo Calculator. Land and Water Digital Media Series, N° 36. FAO, Rome, Italy.
Folefack, D. P. (2011). Coordination des acteurs dans un contexte de crise : le cas de la filière coton
au Cameroun depuis 1990. Thèse de Doctorat, Université de Rennes 2 Haute-Bretagne.
Folland, K. C., Karl, T. R. and Salinger, M. J. (2002). Observed climate variability and change. Weather
57: 269- 278
Fournier, F. (1960). Climat et érosion. Presse Universitaire de France, Paris.
Fox, P. and Rockstrom, J. (2003). Supplemental irrigation for dry- spells mitigation of rainfed
agriculture I the Sahel. Agricultural water management 61, 29-50.
Gunta, K., Agrita, B. and Lita, L. (2010). Changes of growing season in Latvia. The Smithsonian/NASA
Astrophysics Data System EGU General Assembly in Vienna, Austria, p.10212.
Hayes, M. J. (2007). Drought Indices. Feature article from International West Climate Summary.
University of Colorado and NOAA.
Holzkämper, A. and Calanca, P. J. (2010 a). Fuhrer Spatial Statistics 2011 Analyzing Climate Effects on
Agriculture in Time and Space, Switzerland. Journal of Procedia Environmental Sciences 3 (2011) 58–
62.
Holzkämpera, A., Calancaa, P. and Fuhrera, J. (2010 b). Evaluating Climate Suitability for Agriculture
in Switzerland. International Congress on Environmental Modelling and Software
Hudston, G. and Birnie, V. (2000). A method of land evaluation including year to year weather
variability. Agricultural land Forest meteorology 101: 203-216.
Ibrahima, A., Nguetnkam, J. P., Pabame, P., Tchimbi, B. and Guidawa, G. (2007). Soil Degradation in
the Sudano-guinea Savannas of Mbe, Cameroon: Farmers’ perception, indicators and soil fertility
management strategies. Department of Biological Sciences and Department of Earth Sciences,
Faculty of Science, University of Ngaoundéré. F.
Igue, A.M., Gaiser, T. and Stahr, K. (2000). Suitability of Landscape units for Crop Production in
Central Benin. SFB Symposium 2000. University of Hohenheim (in print).
IPCC, (2001): The third IPCC assessment report: Climate change 2001, impacts, adaptation and
vulnerability. McCarthy, J. J., Canziani, O. F., Leary, N. A., Dokken, D. J., White, K. S. eds., Cambridge
University Press, Cambridge.

59
Javier, M. V. (2004). Spartial distribution of daily precipitation concentration index in peninsular
Sapin. Int J. Climatol. 24: 959-971.
Kangah, P. (2004). Rainfall and agriculture in Central West Africa since 1930. Ph. D. thesis, University
of Oklahoma.
Karl, T. R., Knight, R. W., Easterling, D. R. and Quayle, R. G. (1996). Indices of Climate Change for the
United States. Bulletin of the Meteorological Society 77(2): 279- 292.
Kasei, C., N. and Afuakwa, J., J. (1991). Determination of optimum planting date and growing season
of maize in the northern savanna zone of Ghana: soil water balance in the Sudano-Sahelian zone.
Proceedings of the Niamcy workshop 199: 593-600.
Klingebiel, A. A. and Montgomery, P.H., (1961). Land Capability Classification. Agricultural Handbook
No. 210, US Department of Agriculture, Soil Conservation Service.
Kooistra, K. and Termorshuizen, A. (2006). The sustainability of cotton: consequences for man and
environment/ science shop wageningen UR, Report 223, wageningen University.
Kouassi, A. M., Kouamé K. F., Koffi, Y. B., Dje, K. B., Paturel J. E. and Oulare S. (2010). Analyse de la
variabilité climatique et de ses influences sur les régimes pluviométriques saisonniers en Afrique de
l’Ouest : cas du bassin versant du N’zi (Bandama) en Côte d’Ivoire. Revue Européenne de Geographie
(Cybergeo). http://cybergeo.revue.org/index 23388/html.
Kowal, J. (1978). Agro-ecological zoning for the assessment of land potianlities for agriculture. In:
Land evaluation standards for rainfed agriculture. FAO World Soil Resources Report n° 49. FAO,
Rome.
Lawson, A. J. (2008). Effet de différentes pratiques de taille sur l'amélioration des performances
agronomiques du cotonnier Gossypium hirsutum L. thèse de Doctorat. Université de Parakou (Benin).
Leblois, A., Quirion, P. and Sultan, B. (2012). Weather index-based insurance in a cash crop regulated
sector: ex ante evaluation for cotton producers in Cameroon. Research paper N° 21.
Lehmann, N. (2010). Regional crop modeling: How future climate may impact crop yield in
Switzerland. Available online www.ofee.eth.ch.
Letson, D., Podesta, G., Messima, C. and Ferreyra, A. (2005). The uncertain value of perfect ENSO
phase forecasts: stochastic agricultural prices and intra-phase climatic variation. Climatic change 69
(2-3): 163-196.
Levrat, R. (2010). Culture commerciale et développement rural : L’exemple du coton au Nord-
Cameroun depuis 1950. Edition l’Harmattan, 294 p.
Luventicus Academy of Sciences (2013a). Extreme North Region [online]. Available at:
http://www.luventicus.org/maps/cameroon/extremenorth.html (19/12/2013).
60
Luventicus Academy of Sciences (2013b). Extreme North Region [online]. Available at:
http://www.luventicus.org/maps/africa/cameroon.html (19/12/2013).
Mahop, Van R. E. and Seiny,. B. (1995). Influence de l’aménagement des sols sur l’efficacité des pluies
au Nord Cameroun. Université de Gand, Belgique.
Mahul, O. (2001). Optimal insurance against climatic experience. American Journal of agriculture and
and economy 83 (3): 593-604.
Mathugama, S., C. and Peiris T., S., G. (2011). Critical evaluation of dry spell research. International
Journal of Basic & Applied Sciences IJBAS, 11:06, 153-160.
Mckee, T., B. and Kleist, J. (1993). The relationship of drought frequency and duration at time scales.
Eight conference on applied climatology. American Meteorological Society, Anaheim CA, pp 179-186.
Mearns, O. L., Rosenzweig C. and Goldberg R. (1997). Mean and Variance Change in Climate
Scenarios: Methods, Agricultural Applications, and Measures of Uncertainties. Climatic Change 35:
367-396
Michiels, P., Gabriels, D. and Hartmann, R. (1992). Using the seasonal and temporal precipitation
concentration index for characterizing the monthly distribution in Spain, Catena, 19, 43-58.
Ministry of Agriculture and Rural Development Cameroon (2013). Overview of the status of
Cameroonian cotton (crop year 2012-2013) (online). International Cotton Advisory Committee.
Available at: https://www.icac.org/wp-content/uploads/2012/07/Cameroon_E.pdf (12/11/2013).
Mishra, K. K. (1991). Coefficient of variation and a measure of relative wetness of different stations in
India. Int. J Biometerol 34: 217-220.
Mishra, K. K., Satyanarayana, T. (1987). Effect of extreme events on statistical parameters of rainfall
at Kharagpur, West Bengal. J Agric Engng 24: 74–86.
Molua, E. L. and Lambi C. M. (2006 a). Climatic trends in Cameroon: implications for Agricultural
management. Climate Research 30, 255-262.
Molua, E. L. and Lambi, C. M. (2006 b). Climate hydrology and water resources in Cameroon, CEEPA
Discussion Paper 33, 37.
Monacelli, G. (2005). Drought assessment and forecasting. Draft report (Italy), World Meteorological
Organization, weather, climate and water.
National Climatic Data Center (NCDC) (2013). Global Surface Summary of Day [online]. Available at:
http://www.ncdc.noaa.gov/cgi-bin/res40.pl?page=gsod.html (12/09/2013)
Naudin, K., Goze E., Balarabe O., Giller K. and E., Scopel E. (2010). Impact of no tillage and mulching
practices on cotton production in North-Cameroon: A multi-locational on-farm assessment. Soil
Tillage Research 108: 1-2, 68-76.

61
Obale-Ebanga, F. (2001). Impact on agricultural land use histories on soil organic matter dynamics
and related properties of savannah soils in North Cameroon. Ph.D. thesis, University of Amsterdam.
Obale-Ebanga, F., Sevink J., De Groot, W. and Nolte, C. (2003). Myths of slash and burn on physical
degradation of savannah soils: impact on Vertisols in North Cameroon. Soil Use and Management 19:
83-86.
Odekunle, T. O., (2004). Rainfall and the length of the growing season in Nigeria. International
Journal of Climatology, 24, 467-479.
Oliver, J.E. (1980). Monthly precipitation distribution: A comparative Index. Professional Geographer,
32, 300-309
Ostle, B. (1966). Statistics in research. Iowa University Press, Iowa
Palmer, W. C. (1965). Meteorological Drought. Research paper No 45, U.S. Weather Bureau,
Washington D.C.
Porter, J. R. and Semenov, M. A. (2005). Crop response to climatic variation. Phil. Trans. R. Soc. B.
360 : 2021-2035.
Raes, D., Willems, P. and Gbaguidi, F. (2006). RAINBOW– a software package for analyzing data
and testing the homogeneity of historical data sets. Proceedings of the 4th International
Workshop on ‘Sustainable management of marginal drylands’. Islamabad, Pakistan, January
2006, p. 27-31 .
Ramamasy, S. and Baas, S. (2007). Climate variability and change : adaptation to drought in
Bangladesh. A resource book and training guide, FAO.
Rosenzweig, C. and Tubiello, F. N. (2007). Adaptation and mitigation strategies: An analysis of
potentials synergies. Mitigation and adaptation strategies for Global climate change 12: 855-873.
Rosenzweig, C. and Parry, M. L. (1994). Potential impast of climate change on world food supply.
Nature 367: 133-138
Saaty, T.L. (1980). The Analytical Hierarchy Process, New York.
Sawan, M. Z. (2013). Applied methods for studying the relationship between climatic factors and
cotton production. Agricultural Sciences 4 (11): 37-54.
Sawan, M. Z., Hanna, L. I., McCuistion, L. W. and Foote, R. J. (2010). Egyptian cotton (Gossypium
barbadense) flower and boll production as affected by climatic factors and soil moisture status.
Climatol 99: 217-227.
Schlenke, W. and Roberts J. M. (2009). Non-linear temperature effects indicate severe damages to
U.S. crop yield under climate change.106: 37, 15594-15598.

62
Schlenke, W. and Roberts, J. M. (2006). The importance on non-linear temperature effects.
Proceedings of the American Agricultural Economics Association Sessions at the 2006 Allied Social
Sciences Association meeting, Boston MA.
Servat, E., Paturel J.E., Kouamé, B., Travaglio, M., Ouédraogo, M., Boyer, J. F., Lubès-Niel, H., Fritsch,
J.M., Masson, J.M. and Marieu, B. (1998). Identification, caractérisation et conséquences d’une
variabilité hydrologique en Afrique de l’Ouest et centrale. IAHS Publication. 252, 323-337.
Simpson, G. and Kafka, F., (1977). Basic statistics. Oxford and IBM publishng Co., New Delhi
Suckling, P. W. (2006). Application of a climate departure index to the study of freeze dates and
growing season length in the south-eastern United States. International Journal of Climatology, 9: 4,
383-394
Sultan, B., Bella-Medjio M., Berg, A., Quirion, P. and Janicot, S. (2010). Multiscales and multi-sites
analyses of the role of rainfall in cotton yields in West Africa. International Journal of Climatology 30:
58-71.
Sys, C., Van Ranst, E., Debaveye, I. and Beernaert, F. (1993). Land evaluation. Part III. Crop
requirements. Agricultural Publications n°7. General Administration for Development Cooperation,
Brussels, 199p.
Swami, V. and Kulkurni, S. (2012). Analysis of statistical parameters for rainfall series of Kaneri
watershed, Maharashtra and computation of runoff for different returns periods. International
Journal of Engineering Research and Development, 3:2 pp 70-75.
Techoro, P. S. (2013). Climatic change impacts on subsistence crops in the Sudano-Sahel Zone of
Cameroon – Constraints and opportunities for adaptation. Ph. D. thesis on Environmental sciences at
the Brandenburg University of Technology Cottbus.
Tigem, M. and Mike, R. (2008 a). Adaptation for crop agriculture to climate change in Cameroon:
Turning on the heat. Journal of Mitigation and Adaptation Strategies for Global Change 2009, 14 (2):
153-168.
Tingem, M., Mike, R. and Jeremy, C. (2008 b). Climate variability and maize production in Cameroon:
Simulating the effects of extreme dry and wet years. University of Nottingham, Nottingham, UK.
Tukes, M. and Talti, H. (2009). Use of Standardized Precipitation Index (SPI) and a modified SPI for
shaping the drought probability over Turkey. International Journal of Climatology, 29, 2270-2232.
UNEP (United Nations Environment Program). (1986). Farming system principles for improved food
production and the contol of soil degradation in the arid, semi-arid, and humid tropics. Experts
meeting sponsored by UNEP, June 20-30. International Crops Research Institue for the semi-arid
Tropics (ICRISAT), Hyderabad India.
University Coorperation for Atmospheric Research (UCAR) 2001

63
Van, L. H.A.J. (1991). Quantitative and Qualitative physical land evaluation: An operational approach.
Doctoral thesis. Agricultural University Wageningen, the Netherlands (xiv +196 pp).
Vega, R. E. (2008). Workbook of climate change impact assessment in agriculture, Cuba. ISBN 978-
976-95260-1-3.
Vernon, E., Kousky, Viviane, B. S., Shi, S. W. and Higgins, R. W. (2007). An Improved Gridded Historical
Daily Precipitation Analysis for Brazil. Journal of Hydrometeorology 8: 847-861.
Wakponou, A., Mainguet, M. and Dumay, F. (2012). The role of harmattan in the edaphic processes
in the Extreme-North-Cameroon. Journal of environmental science and Engineering 1: 699-708.
Winstanley, D. (2007). Water Supply Planning and Management: Climate Variability and Change. 217-
244.
Witt, R. and Waibel, H. (2009). Climate risk and farming systems in rural Cameroon. Discussion Paper
423, 28.
WMO (World Meteorology Organization). (2005). Report on Climate and Land Degradation. Weather-
climate-weather, WMO-NO 989.
WMO/IPCC. (2003). Integrated flood plain management case study: Bangladesh flood management.
World Meteorological Organization, Geneva, Switzerland.
Yengoh, G. T., Hicklerb, T. and Tchuinte C. T. (2011). Adaptating to climate variability: pumpkins,
people and policy. Natural Resources Forum, 30: 294-305.
Yengoh, G. T., Onumah, E. E., Odoi, J. O. (2010). Trend in agriculturally-relevant rainfall characteristics
for small-scale agriculturein Northern Ghana. Journal of Agricultural Science, 2: 3, 16p.
Yengoh, T. G. (2013). Climate and food production: understanding vulnerability from past trends in
Africa’s Sudan-Sahel. Sustanibility 5, 52-71.
Zitouma, C. R., Prévot, L., Jacob, F., Voltz, M. (2012). Establishing seasonal chronicle of actual
evapotranspiration under sloping conditions. The Smithsonian/NASA Astrophysics Data System EGU
General Assembly in Vienna, Austria. p.10212.

64
Annex I. Overview of materials used in the study
Table1. Annual and monthly rainfall data (1951-2004) from the meteorology station of
Maroua-Salak (Extreme-Northern Cameroon)
Year
J F M A M J J A S O N D Total
1951 0 0 0 0 113.4 87 130.5 354.7 295.2 103.1 0 0 1083.9
1952 0 0.7 0 1.5 57.2 81.1 138.7 249.7 224.2 26.6 0 0 779.7
1953 0 0 11.8 0 92.1 133.1 253 92.2 149.9 0.9 0 0 733
1954 0 0 2.6 14 117.5 70.9 217.1 328 87.1 40.3 0.4 0 877.9
1955 0 0 0 12.4 60.3 112.6 198.4 121.3 222.7 35.3 0 0 763
1956 0 2.4 5.8 2.7 19.7 122.4 335.9 293.2 67.9 18.5 0 0 868.5
1957 0 0 0 22 43.1 110.1 166.7 185.6 158.2 18.7 0.7 0 705.1
1958 0 0 0 25.6 44.3 138.8 181.3 256.4 128.9 35.2 4.1 0 814.6
1959 0 0 0 17.1 134.4 93.9 164.9 160 108 0 0 0 678.3
1960 0 0 0 23.2 31.6 112.8 261.9 239.1 71.2 17 0 0 756.8
1961 0 0 0 0 0.6 191.6 318.7 248.7 132.2 0 0 0 891.8
1962 0 0 7.9 1.5 29.5 163.5 268.9 350.9 168.6 20.4 0 0 1011.2
1963 0 0 0 4.8 64.6 109.4 275.8 318.5 71 40.3 0 0 884.4
1964 0 0 6.2 51.4 67 82.3 173.3 232.6 195.6 8.9 0 0 817.3
1965 0 0 0 16.2 38.8 155.8 173.1 262.5 54.4 35.9 0 0 736.7
1966 0 0 0 90.6 40.8 86.7 255 183.9 208.3 56 0 0 921.3
1967 0 0 0 12.8 15.7 34.9 164.7 235.8 121.3 9.2 0 0 594.4
1968 0 0 0 14.2 38.6 116.3 196.4 254.9 151.5 5 0 0 776.9
1969 0 0 0 41.3 42.5 167 180.6 244 196.3 88.6 0 0 960.3
1970 0 0 0 1.4 24.2 50.2 141.8 338.8 156.7 25.5 0 0 738.6
1971 0 0 0 0 42.2 51 176.5 261.7 122.2 7.7 0 0 661.3
1972 0 0 0 11.5 116.3 148.3 107.2 242 110.4 36 0 0 771.7
1973 0 0 0 1.4 51 84.8 165.9 277.8 131.9 7.5 0 0 720.3
1974 0 0 0 23 96.5 54.4 133.9 315.7 146.6 75.3 0 0 845.4
1975 0 0 0 26.7 79 81.6 289.4 248.3 99.3 18.1 0 0 842.4
1976 0 0 0 8.7 89.7 111.7 193.3 270.2 215.7 66.3 3 0 958.6
1977 0 0 0 0 14.1 137.6 164 313.1 152.1 38.6 0 0 819.5
1978 0 0 3 28.9 105.4 65.9 229.1 224.7 100.5 89.3 0 0 846.8
1979 0 0 1.8 14 55 115 113.4 235.8 193.5 0 0 0 728.5
1980 0 0 0 3.4 93.3 107.2 329.5 299.9 185 13.5 0 0 1031.8

65
Year
J F M A M J J A S O N D Total
1981 0 0 0 13.1 56.1 33.9 214.9 323.5 118.5 6.8 0 0 766.8
1982 0 0 0 41.4 92.2 62.6 139.5 239.4 141.5 49.8 0 0 766.4
1983 0 0 0 0 32.8 72 205.5 155.7 81.9 0 0 0 547.9
1984 0 0 10.1 39.8 167.5 61.7 224.2 151.3 53.8 0 0 0 708.4
1985 0 0 1.3 0.1 58.9 81.7 208.4 168.4 75.2 13.3 0 0 607.3
1986 0 0 0 4.5 48.7 89 131.3 142.8 137.7 0.7 0 0 554.7
1987 0 0 0 31.7 35.5 169.2 106.9 225.2 79.5 6.7 0 0 654.7
1988 0 0 0 0.4 29.7 62.5 180.9 289.9 180.6 2.1 0 0 746.1
1989 0 0 0 20.7 18.5 182.8 236 203.1 77.9 44.9 0 0 783.9
1990 0 0 0 27.2 23.3 153.5 265.8 155.2 43 23.2 0 0 691.2
1991 0 0 0 9.3 109.2 124.7 188.1 331.3 74.7 11.6 0 0 848.9
1992 0 0 16.8 21.6 35.8 91.9 191.8 189.3 237.2 2.5 1.5 0 788.4
1993 0 0 0 26.5 54.9 102.6 175.7 177 89.9 3.5 0 0 630.1
1994 0 0 0 22.4 21.1 123.2 291.5 448 249.4 38.2 0 0 1193.8
1995 0 0 0 18.1 37 113.5 105.2 359.2 109.7 58 0 0 800.7
1996 0 0 0 15 93.9 74 193.6 243.3 192.5 36.9 0 0 849.2
1997 0 0 0 65.7 75.5 101.8 104.1 155.4 64 47.7 0 0 614.2
1998 0 0 0 3.4 17 100.7 174.1 222.9 128.7 1.7 0 0 648.5
1999 0 0 0 2.4 35.9 145 222.5 302.5 155.4 79.1 0 0 942.8
2000 0 0 0 8.7 13.7 151.4 295.2 263.4 64.7 7.2 0 0 804.3
2001 0 0 0 21.5 0 115 250.1 275.2 169.9 4.4 0 0 836.1
2002 0 0 0 36.9 47 147.5 220.4 200.6 0 15.6 2.1 0 670.1
2003 0 0 0 5 46 157.6 325.5 219.4 143.2 0 37.1 0 933.8
2004 0 0 0 6.3 89.2 291.5 90.8 0 178.5 6.5 2.1 0 664.9

66
Table 2. Annual and monthly temperature (°C) data (1960-2004) for Maroua-Salak
(Extreme-Northern Cameroon)
Year
J F M A M J J A S O N D Mean
1960 25.8 25.0 28.1 29.2 28.4 27.1 24.6 25.0 25.4 27.2 24.9 24.7 26.3
1961 24.1 25.1 29.0 33.1 32.9 28.4 27.9 25.6 26.1 27.8 26.4 23.2 27.4
1962 23.3 26.6 31.5 32.6 31.8 27.8 26.6 25.1 26.3 28.3 28.9 26.0 27.9
1963 25.7 29.7 30.4 32.2 31.0 29.0 26.5 25.7 27.0 27.4 25.8 24.8 27.9
1964 24.8 26.1 31.1 31.7 30.5 28.0 26.2 25.6 26.2 27.4 26.3 25.4 27.4
1965 25.7 27.8 30.0 31.4 31.5 27.6 26.6 25.2 26.5 27.4 26.2 24.2 27.5
1966 25.0 26.2 30.2 31.2 29.8 27.5 27.5 25.6 26.2 27.5 27.1 25.2 27.4
1967 23.3 27.6 30.2 31.9 31.7 29.1 26.8 25.6 25.8 27.2 25.8 25.6 27.5
1968 24.0 26.9 30.7 30.5 30.6 26.6 26.5 26.3 26.5 28.0 27.5 25.6 27.5
1969 23.5 28.4 32.7 33.2 31.5 28.3 26.6 26.1 26.5 28.1 27.2 25.9 28.1
1970 24.9 27.2 30.3 33.2 31.6 29.4 27.0 25.3 26.2 27.6 26.8 24.4 27.8
1971 23.3 27.8 32.0 32.3 31.0 28.8 26.3 24.9 26.0 28.1 26.8 24.2 27.6
1972 24.3 27.3 30.5 33.1 31.5 29.6 27.3 26.5 26.9 28.6 27.5 25.1 28.2
1973 26.6 29.2 31.4 33.3 32.0 29.4 27.2 25.4 26.9 28.7 26.6 26.2 28.6
1974 23.8 27.3 30.4 33.1 30.6 30.3 26.4 26.6 26.3 28.3 27.5 23.4 27.8
1975 22.2 26.9 30.8 32.9 30.7 28.9 26.1 26.1 25.9 28.1 27.7 24.6 27.6
1976 24.7 29.0 30.3 32.8 30.6 28.3 26.7 25.8 26.4 27.8 26.2 25.3 27.8
1977 24.6 26.6 29.3 32.7 32.4 29.3 27.4 25.8 27.4 27.8 26.8 23.7 27.8
1978 24.3 27.9 31.0 32.2 30.1 28.3 25.6 26.4 26.4 28.4 26.3 24.9 27.6
1979 25.2 27.8 31.4 32.6 30.8 27.9 27.0 26.8 27.2 28.9 28.5 24.2 28.2
1980 25.8 28.1 31.2 33.6 31.3 28.8 26.4 25.9 27.7 28.7 27.5 23.9 28.2
1981 22.8 27.3 30.6 32.8 30.5 30.3 26.5 26.8 27.1 29.3 26.7 25.7 28.0
1982 25.4 26.0 31.4 32.7 31.1 29.4 27.5 26.2 27.0 27.5 25.9 25.0 27.9
1983 20.9 27.9 29.2 33.4 33.7 30.0 27.2 26.7 27.5 28.7 27.3 26.3 28.2
1984 23.9 27.4 31.9 33.0 29.9 29.5 27.0 27.3 27.1 29.2 28.1 24.6 28.2
1985 27.2 25.9 32.1 32.4 32.2 29.6 26.1 26.2 26.7 28.5 28.1 24.9 28.3
1986 24.8 29.1 31.9 33.7 32.2 29.8 26.6 26.3 26.6 28.2 27.6 24.2 28.4
1987 25.3 28.4 31.2 32.9 33.2 29.7 28.6 27.2 27.9 29.1 28.3 26.0 29.0
1988 25.1 27.7 32.1 33.7 32.1 29.4 26.7 25.7 26.3 27.6 26.6 24.9 28.1
1989 23.3 25.4 27.8 32.7 30.6 28.4 26.3 26.3 27.3 28.5 28.1 24.5 26.2
1990 26.6 25.6 29.1 33.7 32.1 30.8 26.6 27.1 27.9 29.7 30.4 28.5 29.0

67
Year
J F M A M J J A S O N D Mean
1991 25.7 29.8 32.0 33.2 29.1 29.1 26.9 26.2 28.8 28.7 28.3 24.9 28.6
1992 23.6 27.3 32.2 33.6 32.9 30.9 28.3 26.2 27.5 29.2 27.4 25.6 28.7
1993 23.4 26.6 31.2 32.9 31.4 29.3 27.6 26.8 27.8 29.6 29.6 26.1 28.5
1994 25.5 27.2 31.9 33.0 32.3 29.3 26.9 25.7 27.0 28.6 26.5 23.6 28.1
1995 23.7 25.4 28.2 33.3 32.8 29.2 26.7 25.9 28.3 27.9 25.9 25.8 27.7
1996 24.4 29.0 32.6 33.2 31.0 28.2 27.8 26.7 27.1 29.0 27.0 26.0 28.5
1997 26.1 25.3 31.1 30.9 30.3 28.3 27.9 27.1 28.1 29.0 29.0 25.9 28.2
1998 24.4 29.1 29.7 33.8 33.0 30.9 27.7 26.8 26.5 29.4 29.0 26.2 28.9
1999 26.2 29.6 32.5 34.0 31.9 30.2 26.9 24.2 26.8 27.6 28.2 25.0 28.6
2000 26.6 25.5 30.1 34.4 33.0 29.8 26.8 26.1 27.8 28.8 27.8 24.8 28.5
2001 24.7 26.8 31.9 34.2 31.4 30.1 28.6 26.4 27.2 28.6 28.1 26.6 28.7
2002 23.1 27.4 32.1 34.2 34.2 31.2 28.1 27.0 26.9 29.0 28.6 25.2 28.9
2003 26.4 20.8 20.5 36.0 34.5 31.1 29.2 28.3 29.4 30.8 29.7 27.0 31.2
2004 26.1 28.5 31.2 33.8 34.6 29.1 27.5 26.5 27.1 27.2 27.8 26.8 28.8

68
Table 3. Annual and monthly ETo (1960-2004) for Maroua-Salak (Extreme-Northern
Cameroon)
Year J F M A M J J A S O N D Mean
1960 147 189 216 210 198 177 150 147 150 180 174 174 176
1961 129 156 186 201 198 159 165 135 144 177 165 147 163.5
1962 147 171 201 195 186 159 141 129 144 165 171 156 163.75
1963 162 192 186 186 174 162 135 132 147 150 153 156 161.25
1964 147 162 195 192 177 156 132 123 141 168 156 153 158.5
1965 159 180 189 192 195 153 144 132 150 168 159 150 164.25
1966 153 162 198 186 168 156 156 135 147 168 168 144 161.75
1967 144 174 183 207 195 162 141 129 141 168 159 159 163.5
1968 147 177 198 192 183 147 144 141 150 168 159 153 163.25
1969 144 186 198 192 171 162 141 138 147 159 153 153 162
1970 144 165 189 192 183 174 135 123 135 162 150 141 157.75
1971 138 171 204 201 195 165 144 129 144 168 159 141 163.25
1972 144 165 186 198 183 168 141 141 147 165 156 141 161.25
1973 156 177 192 198 180 165 153 132 144 165 150 156 164
1974 135 168 186 201 180 168 135 138 141 165 156 135 159
1975 135 165 195 207 180 165 138 138 141 162 165 144 161.25
1976 147 177 189 192 177 156 144 141 144 153 156 147 160.25
1977 147 162 174 198 186 162 144 132 150 162 162 135 159.5
1978 147 171 192 189 177 156 129 141 147 162 153 147 159.25
1979 150 177 192 198 177 153 141 144 153 165 159 135 162
1980 153 165 189 192 177 156 132 135 156 159 156 138 159
1981 135 165 189 204 174 168 135 144 147 168 144 153 160.5
1982 144 150 177 198 177 159 144 135 144 156 150 150 157
1983 117 165 177 198 195 165 144 138 153 171 159 147 160.75
1984 138 159 192 189 177 168 147 150 147 162 156 135 160
1985 153 150 186 186 186 165 135 138 147 168 159 138 159.25
1986 147 174 183 210 189 168 138 138 144 171 159 129 162.5
1987 156 174 189 195 198 162 153 138 150 168 162 144 165.75
1988 144 165 189 201 186 159 138 126 138 162 165 135 159
1989 150 162 180 198 174 156 138 135 147 159 153 132 157
1990 150 144 171 207 177 171 135 141 156 168 165 150 161.25
1991 138 180 183 183 153 162 141 132 162 165 159 141 158.25

69
Year J F M A M J J A S O N D Mean
1992 156 180 198 201 210 195 177 144 159 180 153 150 175.25
1993 135 171 192 198 180 162 150 144 159 177 171 138 164.75
1994 147 162 198 195 183 159 144 132 147 165 156 135 160.25
1995 141 162 219 198 183 159 141 141 147 171 165 147 164.5
1996 138 180 180 195 174 153 147 144 150 162 153 156 161
1997 156 153 183 192 177 156 150 144 165 180 171 150 164.75
1998 144 171 174 195 180 174 138 132 135 165 168 153 160.75
1999 156 180 213 207 189 171 138 93 141 153 165 150 163
2000 156 150 195 207 195 165 135 138 153 174 162 144 164.5
2001 156 165 198 204 183 165 132 132 150 162 165 147 163.25
2002 132 165 192 198 198 141 144 141 144 162 162 144 160.25
2003 183 198 120 225 219 195 177 171 186 204 186 168 186
2004 189 222 246 237 231 168 144 141 147 141 162 162 182.5

70
Table 4. Annual and Monthly Relative humidity (1960-2004) for Maroua-Salak (Extreme-
Northern Cameroon)
Year J F M A M J J A S O N D Mean
1968 29.5 22.0 21.0 44.5 52.0 72.5 74.0 77.0 75.0 57.5 31.0 28.0 48.7
1969 27.5 25.0 29.5 44.0 53.0 68.5 60.8 71.0 76.0 66.0 41.0 44.5 50.6
1970 32.5 28.0 26.0 33.0 52.0 63.0 74.0 82.0 78.5 58.0 33.0 29.0 49.1
1971 44.0 31.0 19.5 24.5 28.0 45.5 63.0 75.0 80.5 77.0 52.5 34.5 33.5
1972 24.5 19.5 19.0 43.5 58.5 69.0 75.5 80.0 74.0 61.0 32.0 29.5 48.8
1973 23.0 20.5 18.5 36.0 48.0 60.0 69.5 78.0 75.0 55.0 29.5 27.5 45.0
1974 28.0 21.0 17.5 38.5 53.0 55.5 72.5 77.0 76.0 60.5 36.5 28.5 47.0
1975 28.0 22.0 20.5 34.5 55.0 44.8 77.3 78.5 76.0 55.5 41.8 28.0 46.8
1976 28.5 24.5 20.0 33.5 55.5 62.5 71.0 75.0 74.0 68.0 39.5 29.5 48.5
1977 24.0 18.0 14.5 12.0 41.5 59.0 69.5 76.5 70.5 54.0 26.0 24.0 40.8
1978 23.0 17.5 16.5 47.0 65.0 64.5 77.0 76.5 70.5 63.0 34.0 28.0 48.5
1979 19.5 18.5 20.5 34.0 56.5 68.5 72.5 75.0 71.0 56.0 35.0 23.5 45.9
1980 22.0 17.5 20.0 29.0 56.5 66.0 76.0 79.0 71.0 61.5 27.8 30.5 49.9
1981 25.0 19.0 18.0 30.5 58.5 57.0 77.0 77.5 75.0 55.5 28.5 23.5 45.4
1982 27.0 19.5 22.0 33.0 53.0 75.3 73.5 77.0 76.0 65.0 34.0 28.5 48.6

71
Table 5. Total production, total production area and yield of wet and dry season sorghum
(1984-2004) from the Departmental Delegation of Agriculture of Maroua (Extreme-
Northern Cameroon)
Sorghum (wet season) Sorghum (dry season)*
Year Production
(100 tonnes)
Area
(1000 ha)
Yield
(ton/ha)
Production
(1000 t)
Area
(1000 ha)
Yield
(ton/ha) 1984 157 396 273 630 0.6 39 166 55 924 0.7
1985 253 904 264 458 1.0 154 413 158 744 1.0
1986 348 991 284 571 1.2 106 886 103 562 1.0
1987 248 240 245 618 1.0 62 604 77 231 0.8
1988 319 949 267 563 1.2 102 627 89 973 1.1
1989 187 900 196 015 1.0 88 016 86 260 1.0
1990 169 912 245 611 0.7 42 187 64 931 0.6
1991 204 065 243 523 0.8 112 471 111 569 1.0
1992 280 707 279 450 1.0 117 473 122 315 1.0
1993 185 302 212 635 0.9 54 719 76 288 0.7
1994 286 412 280 700 1.0 168 708 121 833 1.4
1995 235 459 229 712 1.0 120 802 120 453 1.0
1996 226 904 275 563 0.8 67 984 89 545 0.8
1997 120 961 237 910 0.5 80 494 107 349 0.7
1998 176 080 228 260 0.8 78 612 108 500 0.7
1999 254 490 276 100 0.9 141 720 148 890 1.0
2000 145 550 198 950 0.7 62 100 108 500 0.6
2001 246 665 221 274 1.1 179 020 159 287 1.1
2002 186 120 210 603 0.9 61 287 107 065 0.6
2003 308 703 268 147 1.2 182 075 156 545 1.2
2004 253 110 242 987 1.0 80 432 128 962 0.6
Average 228 420 246 822 0.9 10 0180 109 701 0.9
Stdev 60696 28273 0.2 44253 29879 0.2
Min 120961 196015 0.5 39166 55924 0.6
Max 348991 284571 1.2 182075 159287 1.4

72
Table 6. Total production, total production area and yield (t/ha) (1984-2004) for cotton
from the SODECOTON Maroua (Extreme-Northern Cameroon)
Year Production (thousand tonnes)
Area (thousand hectares)
Yield (ton/ha)
1984 97 502 73 316 1.13
1985 115 544 89 232 1.30
1986 122 773 94 461 1.30
1987 113 500 94 744 1.20
1988 165 432 111 604 1.48
1989 103 879 89 004 1.17
1990 113 259 93 814 1.21
1991 114 362 89 849 1.27
1992 125 702 98 644 1.27
1993 126 468 102 939 1.23
1994 165 737 141 059 1.18
1995 195 214 158 816 1.23
1996 223 101 190 920 1.17
1997 193 332 172 246 1.12
1998 194 575 172 519 1.13
1999 196 239 179 579 1.10
2000 230 932 193 627 1.16
2001 246 070 201 576 1.22
2002 233 803 181 810 1.29
2003 242 819 208 204 1.17
2004 304 053 215 027 1.41
2005 220 839 231,993 0.95
2006 232 000 230 000 1.00
2007 115 000 130 000 0.88
2008 145 000 150 000 0.96
2009 109 000 125 000 0.88
2010 162 000 142 000 1.14
2011 185 419 148 888 1.25
Average 148 651 173 916 1.17
Stdev 48 585 56 827 0.14 Min 73 316 97 502 0.88
Max 231 993 304 053 1.48

73
Table 7. Climatic requirements table for sorghum (Sys et al., 1993).
Climatic characteristics
Class, degree of limitation and rating scale
S1 S2 S3 N1 N2
0 1 2 3 4
100 95 85 60 40 25 0
precipitation of the growing cycle (mm) 600-500
600-700
500-400
700-900
400-300
900-1200
300-150
1200-1400
- <150
>1400
precipitation of 3rd month (mm) >150 150-100 100-75 75-45 - <45
mean temperature of the growing cycle (°C) 25-24
25-26
24-21
26-32
21-18
>32
18-15
-
-
-
<15
-
mean maximum temp of growing cycle (°C) 30-32
30-28
32-34
28-24
>34
24-22
-
22-20
-
-
-
<28
mean minimum temp of growing cycle (°C) >18 18-15 15-12 12-8 - <8
relative humidity gowing cycle 0-60 60-75 75-85 >85 - -
n/N growing cycle <0.8 0.8-0.85 0.8-1 - - -

74
Table 8. Climatic requirements table for cotton (Sys et al., 1993).
Climatic characteristics
Class, degree of limitation and rating scale
S1 S2 S3 N1 N2
0 1 2 3 4
100 95 85 60 40 25 0
precipitation of the growing cycle (mm) 1050-900
1050-1200
900-750
1200-1400
750-625
1400-1600
625-500
>1600
-
-
<500
-
precipitation of vegetative stage (mm)
(1st-2nd month)
56-65
50-35
>65
<35
-
-
-
-
-
-
-
-
precipitation of yield form.stage (mm)
(5th month)
200-150
200-300
150-100
300-400
100-50
>400
<50
-
-
-
-
-
precipitation of ripening stage (mm) (6th
month)
<25
25-50 50-75 75-100 - >100
mean temperature of the growing cycle
(°C)
>26 26-24 24-22 22-20 - <20
mean maximum temp of growing cycle
(°C)
>32 32-28 28-26 26-24 - <24
average max temp warmest month (°C) >34 34-30 <30 - - -
mean temp of the vegetative stage (°C) (1st-
2nd month)
>30 30-35 25-20 <20 - -
mean day temp of flowering stage (3-4th
month)
20-30 30-35 35-40 >40
<20
- -
mean night temp of flowering stage (°C)
(3-4th month)
12-18 18-22 22-27 >27
<12
- -
mean temp of ripening stage (°C) (6th
month)
>26 26-24 24-22 22-20 - <20
relative humid of maturation stage (%) <50 50-65 65-75 75-80 - -
Day temperature= [mean T. + mean max. T.]/2
Night temperature= [mean T. + mean min T.]/2

75
Annex II. Overview of indices used in the evaluation of
climatic variability
Table 9. Classification of Standardized Anomaly Index (1951-2003) of Maroua (Extreme-
Northern Cameroon)
Years Annual rainfal SAI Classification
1951 1083.9 2.21495318 extreme wet
1952 779.7 -0.09816244 near normal
1953 733 -0.45326599 near normal
1954 877.9 0.64854353 near normal
1955 763 -0.22514807 near normal
1956 868.5 0.57706658 near normal
1957 705.1 -0.66541564 near normal
1958 814.6 0.16721473 near normal
1959 678.3 -0.86920098 near normal
1960 756.8 -0.27229244 near normal
1961 891.8 0.75423816 near normal
1962 1011.2 1.66214744 very wet
1963 884.4 0.69796907 near normal
1964 817.3 0.18774535 near normal
1965 736.7 -0.42513144 near normal
1966 921.3 0.9785541 near normal
1967 594.4 -1.50717074 severely dry
1968 776.9 -0.11945344 near normal
1969 960.3 1.27510739 moderately wet
1970 738.6 -0.41068398 near normal
1971 661.3 -0.99846779 near normal
1972 771.7 -0.15899388 near normal
1973 720.3 -0.5498359 near normal
1974 845.4 0.40141579 near normal
1975 842.4 0.378604 near normal
1976 958.6 1.26218071 moderately wet
1977 819.5 0.20447399 near normal
1978 846.8 0.41206129 near normal
1979 728.5 -0.48748367 near normal
1980 1031.8 1.81878841 very wet
1981 766.8 -0.19625314 near normal
1982 766.4 -0.19929471 near normal
1983 547.9 -1.8607535 severely dry
1984 708.4 -0.64032267 near normal
1985 607.3 -1.40908003 moderately dry
1986 554.7 -1.80904677 severely dry
1987 654.7 -1.04865373 moderately dry
1988 746.1 -0.3536545 near normal

76
Years Annual rainfal SAI Classification
1989 783.9 -0.06622593 near normal
1990 691.2 -0.77111028 near normal
1991 848.9 0.42802954 near normal
1992 788.4 -0.03200824 near normal
1993 630.1 -1.23571042 moderately dry
1994 1193.8 3.05062513 extreme wet
1995 800.7 0.0615201 near normal
1996 849.2 0.43031072 near normal
1997 614.2 -1.35661291 moderately dry
1998 648.5 -1.0957981 moderately dry
1999 942.8 1.14203861 moderately wet
2000 804.3 0.08889425 near normal
2001 836.1 0.33069924 near normal
2002 670.1 -0.93155321 near normal
2003 933.8 1.07360323 moderately wet
mean 792.6 -0.02946784 near normal
max 1193.8 3.05062513 Extremely wet
min 547.9 -1.8607535 Severely dry
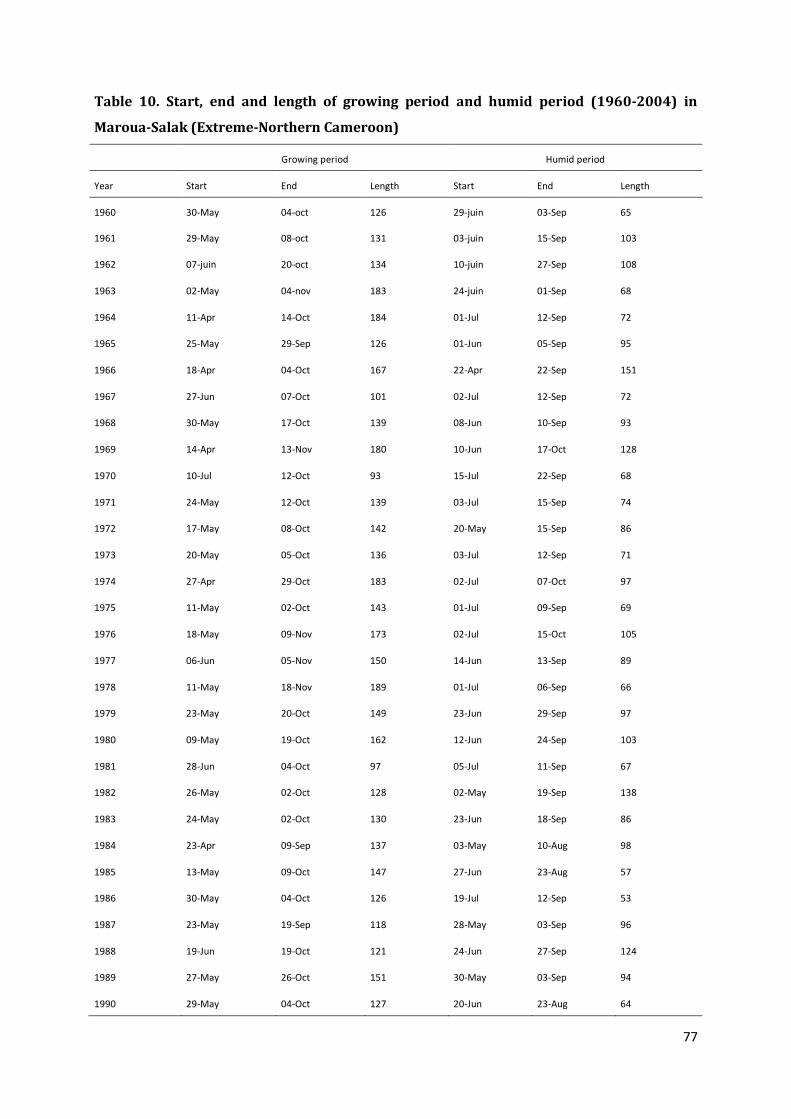
77
Table 10. Start, end and length of growing period and humid period (1960-2004) in
Maroua-Salak (Extreme-Northern Cameroon)
Growing period Humid period
Year Start End Length Start End Length
1960 30-May 04-oct 126 29-juin 03-Sep 65
1961 29-May 08-oct 131 03-juin 15-Sep 103
1962 07-juin 20-oct 134 10-juin 27-Sep 108
1963 02-May 04-nov 183 24-juin 01-Sep 68
1964 11-Apr 14-Oct 184 01-Jul 12-Sep 72
1965 25-May 29-Sep 126 01-Jun 05-Sep 95
1966 18-Apr 04-Oct 167 22-Apr 22-Sep 151
1967 27-Jun 07-Oct 101 02-Jul 12-Sep 72
1968 30-May 17-Oct 139 08-Jun 10-Sep 93
1969 14-Apr 13-Nov 180 10-Jun 17-Oct 128
1970 10-Jul 12-Oct 93 15-Jul 22-Sep 68
1971 24-May 12-Oct 139 03-Jul 15-Sep 74
1972 17-May 08-Oct 142 20-May 15-Sep 86
1973 20-May 05-Oct 136 03-Jul 12-Sep 71
1974 27-Apr 29-Oct 183 02-Jul 07-Oct 97
1975 11-May 02-Oct 143 01-Jul 09-Sep 69
1976 18-May 09-Nov 173 02-Jul 15-Oct 105
1977 06-Jun 05-Nov 150 14-Jun 13-Sep 89
1978 11-May 18-Nov 189 01-Jul 06-Sep 66
1979 23-May 20-Oct 149 23-Jun 29-Sep 97
1980 09-May 19-Oct 162 12-Jun 24-Sep 103
1981 28-Jun 04-Oct 97 05-Jul 11-Sep 67
1982 26-May 02-Oct 128 02-May 19-Sep 138
1983 24-May 02-Oct 130 23-Jun 18-Sep 86
1984 23-Apr 09-Sep 137 03-May 10-Aug 98
1985 13-May 09-Oct 147 27-Jun 23-Aug 57
1986 30-May 04-Oct 126 19-Jul 12-Sep 53
1987 23-May 19-Sep 118 28-May 03-Sep 96
1988 19-Jun 19-Oct 121 24-Jun 27-Sep 124
1989 27-May 26-Oct 151 30-May 03-Sep 94
1990 29-May 04-Oct 127 20-Jun 23-Aug 64

78
Growing period Humid period
Year Start End Length Start End Length
1991 01-May 13-Oct 163 24-May 02-Sep 99
1992 05-Jun 14-Oct 130 03-Jul 22-Sep 80
1993 29-May 04-Oct 127 16-Jul 30-Aug 45
1994 28-May 11-Oct 135 29-Jun 21-Sep 83
1995 23-May 27-Oct 156 13-Jun 05-Oct 113
1996 18-May 24-Oct 158 22-May 20-Sep 119
1997 12-May 30-Sep 140 04-May 15-Sep 132
1998 02-Jun 16-Oct 135 02-Jul 10-Sep 129
1999 04-Jun 04-Nov 152 19-Jun 01-Oct 103
2000 01-Jun 10-Oct 129 08-Jun 23-Aug 76
2001 16-Jun 11-Oct 116 20-Jun 21-Sep 92
2002 13-Apr 14-Sep 152 29-May 20-Aug 82
2003 22-May 02-déc 192 02-Jun 12-Sep 101
Mean 29-May 12-Oct 135 01-Jul 12-Sep 72
Table 11. . Percentile of annual rainfall occurrence in growing period (1960-2003) in
Maroua (Extreme-Northern Cameroon).
years Rainfall GP(mm) Annual rainfall(mm) Percentile (%)
1960 685 756.8 91
1961 891.2 891.8 100
1962 958.9 1011.2 95

79
years Rainfall GP(mm) Annual rainfall(mm) Percentile (%)
1963 879.6 884.4 99
1964 802.2 817.3 98
1965 672.6 736.7 91
1966 879.2 921.3 95
1967 524.8 594.4 88
1968 724.1 776.9 93
1969 953.9 960.3 99
1970 645 738.6 87
1971 641.8 661.3 97
1972 719.8 771.7 93
1973 711.8 720.3 99
1974 822.4 845.4 97
1975 790 842.4 94
1976 922.8 958.6 96
1977 787.6 819.5 96
1978 790.4 846.8 93
1979 684.7 728.5 94
1980 1019.5 1031.8 99
1981 659.2 766.8 86
1982 701.4 766.4 92
1983 547.5 547.9 100
1984 659.7 708.4 93
1985 563 607.3 93
1986 501.1 554.7 90
1987 621 654.7 95
1988 706.6 746.1 95
1989 745.7 783.9 95
1990 645.8 691.2 93
1991 836.3 848.9 99
1992 684.4 788.4 87
1993 548.3 630.1 87
1994 1138.7 1193.8 95
1995 782.6 800.7 98
1996 813.7 849.2 96

80
years Rainfall GP(mm) Annual rainfall(mm) Percentile (%)
1997 561.7 614.2 91
1998 628.1 648.5 97
1999 827.4 942.8 88
2000 781.7 804.3 97
2001 791.4 836.1 95
2002 652.4 670.1 97
2003 928.8 933.8 99
2004 635.9 664.9 96
average 715.2 788.7 91
min 501.1 547.9 86
max 1138.7 1193.8 100

81
Annex III. Annual ratings of climatic characteristics
Table 12. Annual rating of climatic characteristics with variable sowing date approach
for sorghum (1960-2003) in Maroua (Extreme-Northern Cameroon)
years
precipitation of the growing cycle (mm)
precipitation of 3rd month (mm)
mean temperature of the growing cycle (°C)
mean maximum temp of growing cycle (°C)
mean minimum temperature of growing cycle (°C)
relative humidity gowing cycle
n/N growing cycle
climatic index
climatic rating
1960 95.8 100 95.7 95 100 87.3 100 83.3 91.6
1961 85.4 100 93.2 92 100 87.3 100 76.5 85.5
1962 80.5 100 94.2 95.8 100 87.3 100 76 85.1
1963 90.5 100 91.8 89.5 100 89.9 100 80.7 89.3
1964 94.9 88.4 91 86.5 100 94 100 78.9 87.7
1965 96.1 100 93.7 94.5 100 87.7 100 83.2 91.6
1966 97.6 100 92 85 100 91.8 100 80.5 89.1
1967 96.6 89.4 94.5 95.3 100 89.3 100 82.1 90.6
1968 93.9 100 94 95.3 100 85.7 100 80.5 89.1
1969 91.6 100 92.5 91 100 90.7 100 82.8 91.2
1970 97.1 100 94 95.8 100 88.1 100 84.2 92.5
1971 97.7 100 93.7 94 100 86.2 100 82.5 90.9
1972 94.4 100 92 89.5 100 85.9 100 79 87.8
1973 94.4 100 92.5 90.5 100 88.9 100 82.2 90.7
1974 98.9 92 91.2 87 100 91.3 100 79.7 88.4
1975 91.3 100 92.8 92 100 90.4 100 82.9 91.3
1976 88.5 100 93.3 93.5 100 88.5 100 80.4 89
1977 90.9 100 92.8 92.5 100 89.5 100 82.1 90.6
1978 96 100 93.2 94 100 87.3 100 82.6 91
1979 95.5 100 92.5 91.5 100 87.7 100 82.4 90.8
1980 80.5 100 92.2 91.5 100 87.4 100 72 81.5
1981 96.8 88.8 92.7 91 100 89.4 100 87.3 95.2
1982 99.1 93 91 87 100 85.9 100 77.8 86.7
1983 97.4 100 91.3 87 100 87.7 100 80.4 89
1984 98 100 90.5 85 100 91.8 100 80.6 89.2
1985 98.1 100 91.8 89 100 88.6 100 82.8 91.2
1986 95.1 93.6 92.7 92 100 87.3 100 81 89.6
1987 98.5 88.6 88.3 85 100 91.8 100 76.7 85.7

82
years
precipitation of the growing cycle (mm)
precipitation of 3rd month (mm)
mean temperature of the growing cycle (°C)
mean maximum temp of growing cycle (°C)
mean minimum temperature of growing cycle (°C)
relative humidity gowing cycle
n/N growing cycle
climatic index
climatic rating
1988 94.7 100 93.8 95.8 100 87.9 100 82.8 91.2
1989 93.1 100 93.2 94 100 87.3 100 81.3 89.8
1990 98.1 100 91.3 88 100 87.3 100 81.1 89.7
1991 90 100 91.8 91 100 89.9 100 81.4 89.9
1992 94.4 100 91.2 85 100 87.3 100 77.2 86.2
1993 97.1 100 90.5 85 100 89.9 100 79.4 88.1
1994 65 100 92.8 92.5 100 87.3 100 67.7 77.6
1995 93.7 100 91.8 90 100 87.7 100 80.5 89.1
1996 91.2 100 92.3 90.5 100 87.7 100 79.7 88.4
1997 90.1 75 90.3 88.5 100 94 100 68.4 78.2
1998 98.6 100 91.7 90 100 87.3 100 82.2 90.7
1999 89.8 100 92.2 93 100 88.6 100 80.6 89.2
2000 90.8 100 92.2 90.5 100 87.3 100 79.1 87.9
2001 90.7 100 92 91 100 87.9 100 79.9 88.6
2002 98.1 100 86.7 85 100 94 100 81.6 90.1
2003 85.3 100 88.7 85 100 87.7 100 73.5 82.8

83
Table 13. Annual rating of climatic characteristics with fixed sowing date approach for
sorghum (1960-2003) in Maroua (Extreme-Northern Cameroon)
years
precipitation of the growing cycle (mm)
precipitation of 3rd month (mm)
mean temperature of the growing cycle (°C)
mean maximum temp of growing cycle (°C)
mean minimum temperature of growing cycle (°C)
relative humidity gowing cycle
n/N growing cycle
climatic index
climatic rating
1960 95.8 100 97 95 100 87.3 100 83.3 91.6
1961 85.4 100 93.2 92 100 87.3 100 77.4 86.3
1962 79.5 100 94.2 95.8 100 87.3 100 75.5 84.6
1963 90.6 100 93.2 85.5 100 87.3 100 76 85.1
1964 95.9 100 94 96.5 100 87.3 100 82.9 91.3
1965 96.9 100 94.2 95.5 100 87.3 100 83.4 91.7
1966 92.2 100 93.8 94 100 87.3 100 81.2 89.8
1967 97.9 100 93.7 95.3 100 87.3 100 83.6 91.9
1968 93.9 100 94 95.3 100 85.7 100 80.5 89.1
1969 90.4 100 93.5 94 100 88.8 100 81.6 90.1
1970 95 100 93.3 95 100 85.9 100 80.9 89.5
1971 99 100 94 95.3 100 86.5 100 83.4 91.7
1972 99 100 92.2 90.5 100 85.6 100 81 89.6
1973 96.9 100 92.8 91.5 100 88.3 100 83.1 91.5
1974 93.8 100 92.5 92 100 88.3 100 82 90.5
1975 93.6 100 93.7 95 100 89.3 100 83.6 91.9
1976 89.8 100 93.7 94.5 100 87.8 100 80.5 89.1
1977 91.5 100 92.5 91.5 100 89.5 100 81.9 90.4
1978 98.7 100 93.7 95.3 100 87.1 100 83.8 92.1
1979 97.1 100 92.8 92 100 87.7 100 82.9 91.3
1980 82.3 100 92.8 93.5 100 86.9 100 73.9 83.2
1981 95.5 100 92 90 100 87.7 100 81.3 89.8
1982 99 100 92.5 92 100 82.7 100 78.9 87.7
1983 95.8 100 91.8 88.5 100 87.3 100 80.4 89
1984 94.1 100 92 88.5 100 87.3 100 79.7 88.4
1985 96.8 100 93 92.5 100 87.3 100 82.6 91
1986 95.1 93.6 92.7 92 100 87.3 100 81 89.6
1987 95.8 100 91 86.5 100 87.3 100 79.1 87.9
1988 94.2 100 93.2 95.3 100 87.3 100 81.8 90.3
1989 93.1 100 93.2 94 100 87.3 100 81.3 89.8
1990 98.1 100 91.3 88 100 87.3 100 81.1 89.7

84
years
precipitation of the growing cycle (mm)
precipitation of 3rd month (mm)
mean temperature of the growing cycle (°C)
mean maximum temp of growing cycle (°C)
mean minimum temperature of growing cycle (°C)
relative humidity gowing cycle
n/N growing cycle
climatic index
climatic rating
1991 93.6 100 92 89.5 100 87.3 100 79.9 88.6
1992 94.4 100 91.2 85 100 87.3 100 77.2 86.2
1993 97.3 100 91.7 87.5 100 87.3 100 80.6 89.2
1994 65 100 92.8 92.5 100 87.3 100 58.4 69.2
1995 92.6 100 92.3 91 100 87.3 100 80.1 88.8
1996 93.4 100 92.5 91 100 87.3 100 80.5 89.1
1997 88.3 100 91.8 87.5 100 87.3 100 76.7 85.7
1998 98.6 100 91.7 90 100 87.3 100 82.2 90.7
1999 86.4 100 93.3 96.3 100 87.3 100 78 86.9
2000 90.8 100 92.2 90.5 100 87.3 100 79.1 87.9
2001 89.3 100 91.5 90.5 100 87.3 100 78.5 87.3
2002 98.9 100 91.2 89.5 100 87.3 100 82.1 90.6
2003 87.6 100 89 85 100 87.3 100 74.3 83.5
1960-2003 95 100 92.7 93.3 100 87.3 100 81.9 90.4

85
Table 14. Annual rating of climatic characteristics with fixed sowing date approach for
cotton (1960-2004) in Maroua (Extreme-Northern Cameroon)
years
P of the growing cycle (mm)
P of veg stage (mm) (1st-2nd month)
P of yield form. stage (mm) (5th month)
P of Rip stage (mm) (6th month)
Tmaen of the growing cycle (°C)
mean Tmax of growing cycle (°C)
average Tmax warmest month (°C)
Tmean of the veg. stage (°C) (1st-2nd month)
Tmean day of flow. stage (3-4th month)
Tmean night of flow. stage (°C) (3-4th month)
Tmean of rip. stage (°C) (6th month)
RH of mat. stage (%)
index
rating
1960 75.4 95 60 100 93.5 100 100 86.6 60 60 89.4 100 46.5 58.5
1961 94.5 95 60 100 100 100 100 89.2 60 60 85.7 100 46.5 58.5
1962 97.5 95 60 100 100 100 100 89.3 60 60 100 100 46.5 58.5
1963 79.3 95 60 100 100 100 100 90.4 60 60 94 100 46.5 58.5
1964 73.4 95 60 100 100 100 100 89.2 60 60 96.5 100 46.5 58.5
1965 71.6 95 60 100 100 100 100 89.1 60 60 100 100 46.5 58.5
1966 87.5 95 62.5 100 100 100 100 89.9 60 60 100 100 47.4 59.3
1967 50.7 95 60 100 100 100 100 90.8 60 60 93.7 100 39.3 52
1968 79.6 95 60 100 100 100 100 88.1 60 60 100 100 46.5 58.5
1969 93.5 95 79 100 93.5 100 100 86.6 60 60 89.4 100 53.3 64.6
1970 77.8 95 60 100 100 100 100 91.4 60 60 100 100 46.5 58.5
1971 59.2 95 60 100 100 100 100 90.1 60 60 100 100 45.9 58
1972 64.2 95 60 100 100 100 100 91.9 60 99.9 100 100 46.5 58.5
1973 68.6 95 60 100 100 100 100 91.6 60 60 100 100 46.5 58.5
1974 80.8 95 73 100 100 100 100 91.8 60 100 100 100 51.3 62.8
1975 82 95 60 100 100 100 100 90 60 60 100 100 46.5 58.5
1976 92.5 95 68 100 100 100 100 89.9 60 60 96 100 49.5 61.2
1977 88.7 95 60 100 100 100 100 91.7 60 99.9 100 100 46.5 58.5
1978 76.6 95 60 100 100 100 100 88.8 60 60 100 100 46.5 58.5
1979 66.8 95 60 100 100 100 100 89.9 60 99.8 100 100 46.5 58.5
1980 96.1 95 60 100 100 100 100 90.1 60 99.9 100 55.7 33.4 46.7
1981 74.6 95 60 100 100 100 100 91.8 60 99.8 100 100 46.5 58.5
1982 62 95 60 100 100 100 100 91.8 60 99.9 94.5 100 46.5 58.5
1983 42.6 95 60 100 100 100 100 92.2 60 99.8 100 100 33 46.4
1984 25 95 60 100 100 100 100 91.5 60 99.8 100 100 19.4 34.1
1985 47.7 95 60 100 100 100 100 90.7 60 60 100 100 46.5 58.5
1986 40.5 95 60 100 100 100 100 91.4 60 60 100 100 31.4 44.9
1987 75.4 95 60 100 100 100 100 93.3 60 99.5 100 100 46.5 58.5
1988 78.4 95 60 100 100 100 100 91.1 60 99.9 100 100 46.5 58.5

86
years
P of the growing cycle (mm)
P of veg stage (mm) (1st-2nd month)
P of yield form. stage (mm) (5th month)
P of Rip stage (mm) (6th month)
Tmaen of the growing cycle (°C)
mean Tmax of growing cycle (°C)
average Tmax warmest month (°C)
Tmean of the veg. stage (°C) (1st-2nd month)
Tmean day of flow. stage (3-4th month)
Tmean night of flow. stage (°C) (3-4th month)
Tmean of rip. stage (°C) (6th month)
RH of mat. stage (%)
index
rating
1989 84 95 60 100 100 100 100 89.7 60 60 100 100 46.5 58.5
1990 42.4 95 60 100 100 100 100 92.4 60 99.6 100 100 46.5 58.5
1991 81.4 95 60 100 100 100 100 91 60 99.6 100 100 46.5 58.5
1992 92.4 95 60 100 100 100 100 94.2 60 99.9 100 100 46.5 58.5
1993 47.7 95 60 100 100 100 100 91.9 60 99.8 100 100 41.4 53.9
1994 96.6 95 60 100 100 100 100 91.2 60 99.8 100 100 46.5 58.5
1995 84.6 95 64 100 100 100 100 90.9 60 60 94.2 100 48 59.9
1996 83 95 60 100 100 100 100 91 60 99.9 100 100 46.5 58.5
1997 25 95 60 100 100 100 100 91.1 60 60 100 100 19.4 34.1
1998 59.4 95 60 100 100 100 100 93.6 60 99.8 100 100 46 58.1
1999 95.2 95 74.5 100 100 100 100 92 60 60 100 100 51.8 63.3
2000 87.3 95 60 100 100 100 100 91.5 60 99.8 100 100 46.5 58.5
2001 89.3 95 60 100 100 100 100 93.7 60 99.8 100 100 46.5 58.5
2002 53.8 95 60 100 100 100 100 94.4 60 99.8 100 100 46.5 58.5
2003 94 95 60 90.2 100 100 100 95.2 60 99.5 100 100 46.5 58.5
1960-2003 77.8 95 60 100 100 100 100 91.1 60 100 100 100 46.5 58.5
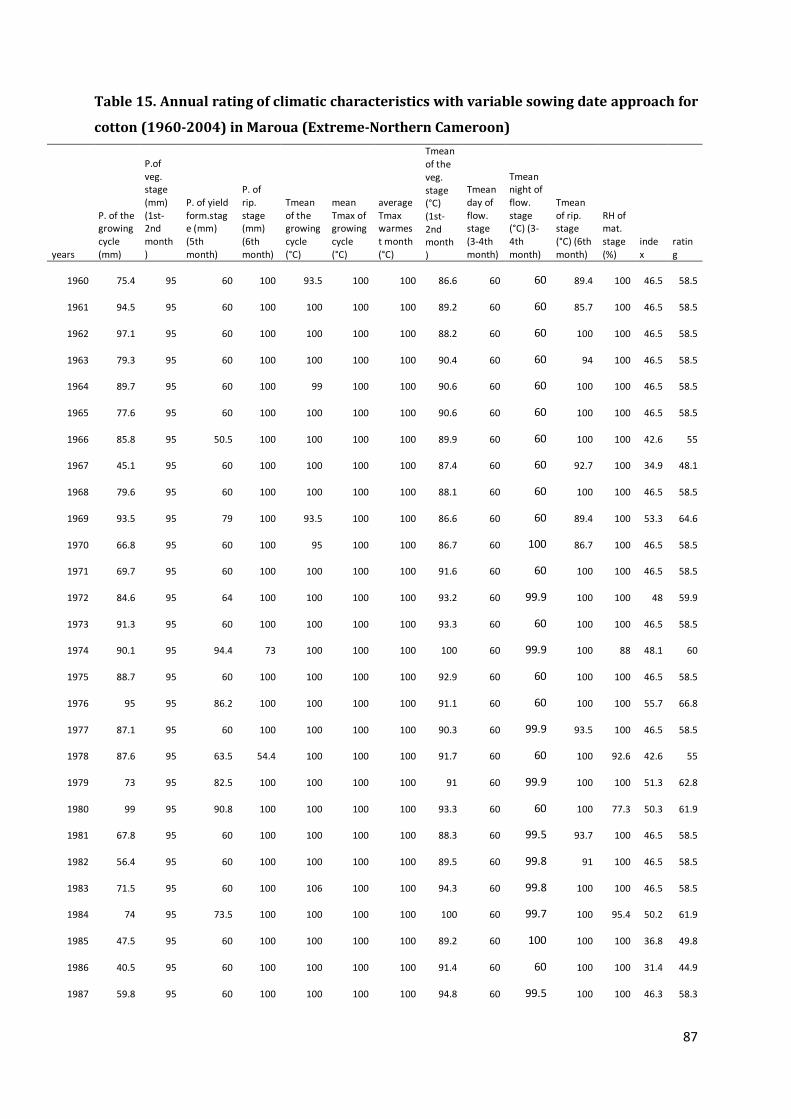
87
Table 15. Annual rating of climatic characteristics with variable sowing date approach for
cotton (1960-2004) in Maroua (Extreme-Northern Cameroon)
years
P. of the growing cycle (mm)
P.of veg. stage (mm) (1st-2nd month)
P. of yield form.stage (mm) (5th month)
P. of rip. stage (mm) (6th month)
Tmean of the growing cycle (°C)
mean Tmax of growing cycle (°C)
average Tmax warmest month (°C)
Tmean of the veg. stage (°C) (1st-2nd month)
Tmean day of flow. stage (3-4th month)
Tmean night of flow. stage (°C) (3-4th month)
Tmean of rip. stage (°C) (6th month)
RH of mat. stage (%)
index
rating
1960 75.4 95 60 100 93.5 100 100 86.6 60 60 89.4 100 46.5 58.5
1961 94.5 95 60 100 100 100 100 89.2 60 60 85.7 100 46.5 58.5
1962 97.1 95 60 100 100 100 100 88.2 60 60 100 100 46.5 58.5
1963 79.3 95 60 100 100 100 100 90.4 60 60 94 100 46.5 58.5
1964 89.7 95 60 100 99 100 100 90.6 60 60 100 100 46.5 58.5
1965 77.6 95 60 100 100 100 100 90.6 60 60 100 100 46.5 58.5
1966 85.8 95 50.5 100 100 100 100 89.9 60 60 100 100 42.6 55
1967 45.1 95 60 100 100 100 100 87.4 60 60 92.7 100 34.9 48.1
1968 79.6 95 60 100 100 100 100 88.1 60 60 100 100 46.5 58.5
1969 93.5 95 79 100 93.5 100 100 86.6 60 60 89.4 100 53.3 64.6
1970 66.8 95 60 100 95 100 100 86.7 60 100 86.7 100 46.5 58.5
1971 69.7 95 60 100 100 100 100 91.6 60 60 100 100 46.5 58.5
1972 84.6 95 64 100 100 100 100 93.2 60 99.9 100 100 48 59.9
1973 91.3 95 60 100 100 100 100 93.3 60 60 100 100 46.5 58.5
1974 90.1 95 94.4 73 100 100 100 100 60 99.9 100 88 48.1 60
1975 88.7 95 60 100 100 100 100 92.9 60 60 100 100 46.5 58.5
1976 95 95 86.2 100 100 100 100 91.1 60 60 100 100 55.7 66.8
1977 87.1 95 60 100 100 100 100 90.3 60 99.9 93.5 100 46.5 58.5
1978 87.6 95 63.5 54.4 100 100 100 91.7 60 60 100 92.6 42.6 55
1979 73 95 82.5 100 100 100 100 91 60 99.9 100 100 51.3 62.8
1980 99 95 90.8 100 100 100 100 93.3 60 60 100 77.3 50.3 61.9
1981 67.8 95 60 100 100 100 100 88.3 60 99.5 93.7 100 46.5 58.5
1982 56.4 95 60 100 100 100 100 89.5 60 99.8 91 100 46.5 58.5
1983 71.5 95 60 100 106 100 100 94.3 60 99.8 100 100 46.5 58.5
1984 74 95 73.5 100 100 100 100 100 60 99.7 100 95.4 50.2 61.9
1985 47.5 95 60 100 100 100 100 89.2 60 100 100 100 36.8 49.8
1986 40.5 95 60 100 100 100 100 91.4 60 60 100 100 31.4 44.9
1987 59.8 95 60 100 100 100 100 94.8 60 99.5 100 100 46.3 58.3

88
years
P. of the growing cycle (mm)
P.of veg. stage (mm) (1st-2nd month)
P. of yield form.stage (mm) (5th month)
P. of rip. stage (mm) (6th month)
Tmean of the growing cycle (°C)
mean Tmax of growing cycle (°C)
average Tmax warmest month (°C)
Tmean of the veg. stage (°C) (1st-2nd month)
Tmean day of flow. stage (3-4th month)
Tmean night of flow. stage (°C) (3-4th month)
Tmean of rip. stage (°C) (6th month)
RH of mat. stage (%)
index
rating
1988 76.4 95 60 100 100 100 100 88.3 60 60 91.9 100 46.5 58.5
1989 84 95 60 100 100 100 100 89.7 60 99.9 100 100 46.5
1990 42.4 95 60 100 100 100 100 92.4 60 96.6 100 100 32.8 46.2
1991 91.1 95 60 100 100 100 100 93.2 60 99.9 100 88.8 43.8 56.1
1992 92.4 95 60 100 100 100 100 94.2 60 99.9 100 100 46.5
1993 47.7 95 60 100 100 100 100 91.9 60 99.8 100 100 36.9 49.9
1994 96.6 95 60 100 100 100 100 91.2 60 60 100 100 46.5 58.5
1995 87.3 95 82.5 100 100 100 100 92.8 60 99.9 100 100 54.5 65.7
1996 89.2 95 62.5 100 100 100 100 91.8 60 99.9 100 100 47.4 59.3
1997 25 95 60 100 100 100 100 91.1 60 99.7 100 100 19.4 34.1
1998 59.4 95 60 100 100 100 100 93.6 60 99.8 100 100 46 58.1
1999 92.3 95 90.4 100 100 100 100 95.5 60 60 100 94.7 55.5 66.6
2000 87.3 95 60 100 100 100 100 91.5 60 99.8 100 100 46.5 58.5
2001 87.4 95 60 100 100 100 100 91.1 60 99.7 100 100 46.5 58.5
2002 61 95 60 100 100 100 100 100 60 99.8 100 100 46.5 58.5
2003 93 95 60 100 100 100 100 100 60 99.5 100 100 46.5 58.5

89
Table16. Climatic index and rating for variable and fixed sowing date approach for
sorghum (1960-2004) in Maroua (Extreme-Northern Cameroon)
Climatic Index Climatic rating
Year Fixed sowing date Variable sowing date Fixed sowing date Variable sowing date
1960 83.3 83.3 91.6 91.6
1961 77.4 76.5 86.3 85.5
1962 75.5 76.0 84.6 85.1
1963 76.0 80.7 85.1 98.3
1964 82.9 78.9 91.3 87.7
1965 83.4 83.2 91.7 91.6
1966 81.2 80.5 89.9 89.1
1967 83.6 82.1 91.9 90.6
1968 80.5 80.5 89.8 89.1
1969 81.6 82.8 90.1 91.2
1970 80.9 84.2 89.5 92.5
1971 83.4 82.5 91.7 90.9
1972 81.0 79.0 89.6 87.8
1973 83.1 82.2 91.5 90.7
1974 82.0 79.7 90.5 88.4
1975 83.6 82.9 91.6 91.3
1976 80.5 80.4 89.1 89.0
1977 81.9 82.1 90.4 90.6
1978 83.8 82.6 92.1 91.0
1979 82.9 82.4 91.3 90.8
1980 73.9 72.0 83.2 81.5
1981 81.3 87.3 89.8 95.2
1982 78.9 77.8 87.7 86.7
1983 80.4 80.4 89.0 89.0
1984 79.7 80.6 88.4 89.2
1985 82.6 82.8 91.0 91.2
1986 81.0 81.0 89.6 89.6
1987 79.1 76.7 87.9 85.7
1988 81.8 82.8 90.3 91.2
1989 81.3 81.3 89.8 89.8
1990 81.1 81.1 89.7 89.7

90
Climatic Index Climatic rating
Year Fixed sowing date Variable sowing date Fixed sowing date Variable sowing date
1991 79/9 81.4 88.6 89.9
1992 77.2 77.2 86.2 86.2
1993 80.6 79.4 89.2 88.1
1994 58.4 67.7 69.2 77.6
1995 80.1 80.5 88.8 89.1
1996 80.5 79.7 89.1 88.4
1997 76.7 68.4 85.7 78.4
1998 82.2 82.2 90.7 90.7
1999 78.0 80.6 86.9 89.2
2000 79.1 79.1 87.9 87.9
2001 78.5 79.1 87.3 88.6
2002 82.1 81.6 90.6 90.1
2003 74.3 73.5 83.5 82.8

91
Table17. Climatic index and rating for variable and fixed sowing date approach for cotton
(1960-2004) in Maroua (Extreme-Northern Cameroon)
Sowing date Climatic Index Climatic rating
years
Fixed sowing date Variable sowing data Fixed sowing date Variable sowing data
1960 01 June 46.5 46.5 58.5 58.5
1961 01 June 46.5 46.5 58.5 58.5
1962 11 June 46.5 46.5 58.5 58.5
1963 01 June 46.5 46.5 58.5 58.5
1964 21 May 46.5 46.5 58.5 58.5
1965 21 May 46.5 46.5 58.5 58.5
1966 11 June 47.4 42.6 59.3 55
1967 01 Jully 39.3 34.9 52 48.1
1968 01 June 46.5 46.5 58.5 58.5
1969 01 June 53.3 53.3 64.6 64.6
1970 11 Jully 46.5 46.5 58.5 58.5
1971 21 May 45.9 46.5 58.5 58.5
1972 21 May 46.5 48 58.5 59.9
1973 21 May 46.5 46.5 58.5 58.5
1974 21 May 51.3 48.1 62.8 60
1975 11 May 46.5 46.5 58.5 58.5
1976 21May 49.5 55.7 61.2 66.8
1977 11 June 46.5 46.5 58.5 58.5
1978 11 May 46.5 42.6 58.5 56.5
1979 21 May 46.5 51.3 58.5 62.8
1980 11 May 33.4 50.3 46.7 61.7
1981 01 Jully 46.5 46.5 58.5 58.5
1982 21 June 46.5 46.5 58.5 58.5
1983 21 May 33 46.5 58.5 58.5
1984 21 April 19.4 50.2 34.1 61.9
1985 11 June 36.8 36.8 49.9 49.8
1986 01 June 46.5 31.4 58.5 44.9
1987 21 May 48 46.3 59.9 58.5
1988 21 June 46.5 46.5 56.5 58.5
1989 01 June 46.5 46.5 58.5 58.5
1990 01 June 46.5 32.8 58.5 46.2

92
Sowing date Climatic Index Climatic rating
years
Fixed sowing date Variable sowing data Fixed sowing date Variable sowing data
1991 01 May 46.5 43.8 58.5 56.1
1992 01 June 46.5 46.5 58.5 58.5
1993 01 June 46.5 36.9 58.5 49.9
1994 01 June 46.5 46.5 58.5 58.5
1995 21 May 48 54.5 59.9 65.7
1996 21 May 46.5 47.4 58.5 59.3
1997 01 June 46.5 19.4 58.5 34.1
1998 01 June 46.5 46 58.5 58.1
1999 11 May 51.8 55.5 63.3 66.6
2000 01 June 46.5 46.5 58.5 58.5
2001 21 June 46.5 46.5 58.5 58.5
2002 21 May 46.5 46.5 58.5 58.5
2003 21 May 46.5 46.5 58.5 58.5

93
Table18. Annual suitability classes of climatic characteristics of a fixed and variable sowing
date for sorghum and cotton(1060-2003) by the FAO land suitability classification method
(FAO, 1993)
sorghum
cotton years variable sowing date fixed sowing date variable sowingdate fixed sowing date
1960 S1 S1 S3 S3
1961 S1 S1 S3 S3
1962 S1 S2 S3 S3
1963 S1 S1 S3 S3
1964 S1 S1 S3 S3
1965 S1 S1 S3 S3
1966 S1 S1 S3 S3
1967 S1 S1 S3 S3
1968 S1 S1 S3 S3
1969 S1 S1 S2 S2
1970 S1 S1 S3 S3
1971 S1 S1 S3 S3
1972 S1 S1 S3 S3
1973 S1 S1 S3 S3
1974 S1 S1 S3 S2
1975 S1 S1 S3 S3
1976 S1 S1 S2 S2
1977 S1 S1 S3 S3
1978 S1 S1 S3 S3
1979 S1 S1 S2 S3
1980 S2 S2 S2 S3
1981 S1 S1 S3 S3
1982 S1 S1 S3 S3
1983 S1 S1 S3 S3
1984 S1 S1 S2 N1
1985 S1 S1 S3 S3
1986 S1 S1 S3 S3
1987 S1 S1 S3 S3
1988 S1 S1 S3 S3
1989 S1 S1 S3 S3

94
sorghum
cotton years variable sowing date fixed sowing date variable sowingdate fixed sowing date
1990 S1 S1 S3 S3
1991 S1 S1 S3 S3
1992 S1 S1 S3 S3
1993 S1 S1 S3 S3
1994 S2 S2 S3 S3
1995 S1 S1 S2 S3
1996 S1 S1 S3 S3
1997 S2 S1 N1 N1
1998 S1 S1 S3 S3
1999 S1 S1 S2 S2
2000 S1 S1 S3 S3
2001 S1 S1 S3 S3
2002 S1 S1 S3 S3
2003 S2 S2 S3 S3
1960-2003
S1 S3
![S x[ ( ) *] y x Optimization ( )y S - Unione Geotermica · (c)() CINIGeo - National Interuniversity Consortium forNational Interuniversity Consortium for Georesources EngineeringEngineering](https://img.pdfslide.net/doc/110x75/5c65ee1d09d3f2f91c8b8726/s-x-y-x-optimization-y-s-unione-geotermica-c-cinigeo-national.jpg)