Embed Size (px)
Citation preview

Faculty of Engineering
MEng in Engineering Design
YEAR 4 PROJECT
An Investigation Into the Use of Energy Storage Technologies to Reduce Energy Charges for the New
University of Bristol Temple Quarter Campus
Alex Charles
Project thesis submitted in support of the degree of Master of Engineering
Project Advisor Dr Theo Tryfonas Dept of Civil Engineering
March 31 2017
AcknowledgementsI would like to recognise Peter Cooper andGeorgios Papantoniou for setting up the project and giving supportcontacts and guidance throughout the process I would like to thank Mark Dale and Matt Watson at WesternPower for meeting with me to discuss energy tariffsAt the University of Bristol I would like to thank Dr Theo Tryfonasr my project supervisor for his guidance indefining the scope of the project I would like to acknowledge Dr Mike McCann for his help with establishingand verifying themodel I would also like to thank John Brenton andChris Jones for providing data their advicewith the new campus specifications Finally I would like to thank my fellow groupmembers for their hard workand cooperation throughout the project
DeclarationThe accompanying research project report entitled ldquoAn Investigation Into theUse of Energy StorageTechnologies to ReduceEnergyCharges for theNewUniversity of Bristol TempleQuarterCampusrdquo issubmitted in the fourth year of study towards an application for the degree ofMasters of Engineeringin Engineering Design at the University of Bristol The report is based upon independent work bythe candidate All contributions from others have been acknowledged above The views expressedwithin the report are those of the author and not of the University of Bristol
I hereby declare that the above statements are true
Signed (author)
helliphelliphelliphelliphelliphelliphelliphelliphelliphelliphelliphelliphelliphelliphelliphelliphelliphelliphelliphelliphelliphelliphelliphelliphelliphelliphellip
Full Name
Alexander Charles
Date
31st March 2017
Alexander Charles i
Executive SummaryWith the rapid fall in Li-ion energy storage costs and the continual price rise of energy bills now seems like anappropriate time to investigate the feasibility of using energy storage to reduce costs By understanding theadvantages of using batteries and alleviating risks through modelling the full value of using energy storagecan be understood and implemented This project constitutes one piece of a wider group design projectlooking to create a smart ``brain for the new Temple Quarter Campus This will combine enriched data withnew technology and strategies developing a business case to implement digital innovations in sustainabilityon the new campus helping the University meet its carbon neutral 2030 goal
One aim of the group project is to assess the value of investing in energy storage discussed in this projectWhere an energy profile tool optimised zero-dimensional battery system model and business case for Li-ionbattery storage investment are were all achieved within this report
To understand the advantages and challenges inherent to using energy storage technologies a modelwas produced Valid assumptions of various parameters were made which reduced the uncertainty of themodel Throughout the modelling process an effort to develop a fast efficient and easy to use preliminarydesign tool for use in further group project studies The model assessed different peak demand chargesand was designed to target Red rate DUoS charges and TRIADs as these were identified to be the largestcontributors to cost As longevity is a key challenge in using batteries degradation control strategies were alsoimplemented The model simulated a variety of battery specifications to find the optimum battery parametersunderstanding the maximum value an ESS could generate for the new campus
Along with producing useful tools for the group project the model found that the shortest payback periodfor a battery implementation in the new campus is 63 years By using a larger battery total savings of up topound2mil were found over the batteries lifetime The results of the zero-dimensional model concluded that thereis a strong business case for investing in Li-ion storage to reduce peak demand consumption Further workhas identified that there are additional methods which if accessed could additionally improve the value of thebattery while decreasing uncertainties around battery degradation prediction and changes in energy pricing
Alexander Charles ii
CONTENTS
ContentsAcknowledgements i
Declaration i
Executive Summary ii
List of Figures v
List of Tables v
List of Acronyms vi
List of Definitions vi
1 Project Introduction and Objectives 111 Individual Project Introduction 112 Objectives 2
2 Background and Summary of Key Work and References 221 Sustainability and Energy Storage Systems 322 University Energy Charges 323 Current Peak Demand Management Methods 424 Peak Shaving Systems Literature Review 5
241 Forecasting and the Use of ESS in Load Shifting 5242 Supply Levelling 5243 Battery Sizing and Financial Modelling 5
25 Comparison of Energy Storage Systems 626 Battery Selection - Tesla Powerpack 2 7
3 Battery Storage Technology Key Advantages and Challenges 731 Li-ion Battery Costs 732 Battery Economics 8
321 Net Present Value 8322 Payback Period 9
33 Battery Lifetime Assessment - Understanding Battery Degradation 9331 Temperature 9332 Depth of Discharge 10333 Usage 10334 Charging 11
4 Battery Model Definition 11
Alexander Charles iii
CONTENTS41 Model Development Requirements 12
411 Zero-Dimensional vs Three-Dimensional Modelling 12412 Code Optimisation and Ease of Development 12413 User Interface 12
42 Creation of Senate House Billing Model 1243 Representative Bill Creation 1344 Representative Demand Profile 1345 Definition of the New Temple Quarter Campus 15
451 Energy Profile Tool 1546 Definition of System Strategies 16
461 Red Rate Charge Avoidance Strategy 16462 Triad Avoidance Strategy 16463 Battery Control Strategy 17
47 Input Parameters and Multi-Battery Simulation 19
5 Validation of Model 2051 Data File 2052 Assumptions and Limitations 20
6 Results 2161 Total Savings and Payback Period Results 2262 Net Present Value Results 2463 Battery Health Analysis 2564 Discussion on Optimum Battery 2665 Sensitivity Analysis on Energy Pricing 27
7 Conclusions and Future Work 2871 Conclusions on Modelling Tools 2872 Conclusions on Temple Quarter Campus Results 2973 Future Work 30
8 Appendices 3881 Battery Degradation 4182 Senate Load Profile 4183 Campus Sizing 4284 Model Operation Parameters 4385 Matlab Code 44
851 Multi Battery Simulation 44852 Energy Profile Tools and Plots 67853 Max Fit Fucntion 76
Alexander Charles iv
LIST OF TABLES
List of Figures11 Group Design Project Diagram Showing Relationships Between Individual Projects 131 Plot of Li-ion Battery Prices 2010-2016 [50] 832 Plot of the General Relationship Between Battery Capacity and Cycle Number Extracted From
[54] 933 Plot of Depth of Discharge vs Rated Capacity Interpolated From [59] 1034 Plot of the Relationship Between Discharge Time and Rated Capacity Interpolated from [61] 1035 Relationship Between State of Charge and Cycle Life [68] 1141 Diagram Showing Key Inputs Processes and Outputs of Model 1142 Plot of Mean Senate House Weekday and Weekend Usage and Difference in Unit Charge Rates 1343 Plots of Usage and Demand Profile Generation and Histogram of Year Data 1444 Logic of Energy Profile Tool Create New Campus Data 1645 Showing Battery Degradation 1746 Logic Diagram For Multi-battery Simulation 1961 Histogram Showing Red Periods Total Daily Usage Frequency 2162 Time Spent at Power Demand Level 2163 Battery Size Vs Total Savings 2264 Graph of Battery Size vs PayBack Time 2265 Graph Showing Top 40 Batteries with Fitted Curves for both Payback Time and Total Savings 2366 Comparison Between Fit Curves for Payback Period and Total Savings 2367 Net Present value at Different Discount Rates - Comparison 2468 Depth of Discharge For Battery Lifetime 2569 Expected Capacity Offset Due to Discharge Rate and Depth of Discharge 25610 Showing the Expected Effect of Depth of Discharge and Discharge Time on Predicted Cycle Life 26611 Effect of a Decrease in Red Rate Charges (pence) on the NPV 28612 Effect of a Decrease in Red Rate Charges (pence) on the Payback Period 2881 Diagram Showing Batteries Catorgised for Their Use Case [45] 3882 Image of Energy Bill For Victoria Rooms 4083 Plot of the Relationship Between Battery Cycle Life and Voltage of Charge [66] 4184 Load Duration Plot of Year Usage Data 41
List of Tables1 Showing the Advantages and Challenges of Using Energy Storage 72 Tesla Powerpack 2 Specification 183 Showing All Assumptions Made for Simulation 204 Table Showing the Best Battery Results Comparing the different Economic Measurements 275 Table Showing Battery Performance 396 Table Showing Temple Quarter Campus Sizing Requirements 42
Alexander Charles v
LIST OF TABLES7 Table Showing the Input Parameters of the Model 43
List of AcronymsESS Energy Storage SystemDUoS Energy Storage System Distribution Use of SystemTNUoS Transmission Network Use of SystemIoT Internet of ThingsSQP Sequential Quadratic ProgrammingPV PhotoVoltaicROI Return On InvestmentVRB Vanadium Redox BatteriesPHS Pumped Hydroelectric StorageCAES Compressed Air Energy StorageCES Cryogenic Energy StorageTES Thermal Energy StorageSMES Superconducting Magnetic Energy StoragesNPV Net Present ValueIRR Initial Return RateDCF Discounted Cash FlowPBP Payback PeriodBMS Battery Management SystemHVAC Heating Ventilation and Air Conditioning
List of DefinitionsMiddleware This is computer software that provides additional services to software applic-
ations making it easier for software developers to implement communicationand inputoutput
Asset An asset is a resource with economic value with the expectation that it willprovide future benefit
Net Present Value Is the difference between the current value of cash inflows and outflows NPV isused in capital budgeting to analyse the profitability of an investment
Discount Rate Measure of the depreciation of cash generated by an assetDemand Measure of instantaneous power (kW)Usage Measure of power consumption (kWh)
Alexander Charles vi
1 PROJECT INTRODUCTION AND OBJECTIVES
1 Project Introduction and ObjectivesThe announcement of the new pound300million University of Bristol Campus in Temple Quarter [1] presents anexciting new opportunity for digital innovations in sustainable energy The governments 2020 smart meterrollout is the first step for creating a smart energy grid This is key for the UK to achieve a low-carbon sustain-able and efficient energy system for the future [2] The UKs vision is mirrored in the University of Bristols newstrategy as it seeks to boost its world-class research capacity and promote innovation in policy to increasesustainability [3] The creation of a world-leading campus is an attractive means for the University to realiseits vision Consequently the aim of this group project is to explore new digital technologies to reduce bothenergy costs and energy usage to set a precedent in university campus sustainability
Figure 11 describes the relationships between the individual project themes where research in occupancysensing smart metering and building services will evaluate how energy usage can be optimised Projectslooking at smart thermal grids energy system interactions and peak demand reduction analyse methods toreduce the universitys energy costs providing financial incentives to increase the new campuss sustainabilityThe fifth year group project will unite this research creating a smart ``brain [4] This will combine enricheddata with new technology and strategies developing a business case to implement digital innovations in sus-tainability on the new campus helping the University meet its carbon neutral 2030 goal [3]
Smart Thermal Grids -JB
- Cost benefit analysis for sensitising the heat network
Energy System Interactions -TMpound- Business case for energy saving techniques
Peak Demand Reduction -AC- Optimised battery system- Cost benefit analysis of energy storage
Occupancy Sensing -TL- Occupancy resolution value assessment
-LGSmart Metering- Implementing behavioural change through smart meters
Building Services -RS- Selection of an optimum demand controlled system strategy
Reduction in Energy Usage
Reduction in Energy Costs
System Behaviour
Usage Requirement Live Demand and Usage Data
System BehaviourBuilding Requirement
System Behaviour
Data Mining
Digital Energy Systems for a Sustainable Campus
Figure 11 Group Design Project Diagram Showing Relationships Between Individual Projects
11 Individual Project IntroductionThis project report investigates the feasibility of using energy storage systems (ESS) to reduce energy chargesand increase sustainability for the University of Bristol Through understanding the effects of installing the tech-nology in new Temple Quarter campus this project seeks to provide a value incentive for investing in energystorage Within the project the Universitys energy profile and billing structure are analysed and simulatedused to define energy requirements for the new campus A comprehensive technology study of the differentESSs evaluates the feasibility of various systems down-selecting the most appropriate battery for modellingThrough further evaluation of how the selected battery system would function a model was designed to simu-late battery system strategies analysing their impact Finally to find an optimum ESS solution a comprehens-
Alexander Charles 1
2 BACKGROUND AND SUMMARY OF KEY WORK AND REFERENCESive range of battery specifications are simulated comparing results to find a battery which generates the mostvalue
The overall outputs of the project for use in the fifth year group design project are
bull Cost Based Analysis Business Case for investing in battery storage technologybull Energy Profile Tool to build and understand the new university campus demandbull Optimised Battery System Model producing best storage solutions based on energy profile tool
12 ObjectivesTo achieve the outputs of the project the following detailed objectives were defined
Literature Review
1 Perform a detailed literature review and market analysis of energy storage technologies and researchevaluating using ESS to reduce peak energy demands highlighting relevant techniques and limitations
2 Investigate different energy storage solutions for the Universitys new campus comparing parameterssuch as power-ratings capacity discharge times and costs to down selecting the best solution
Definition of System Strategies
3 Define battery system strategies establishing the key performance variables
Modelling and Analysis
4 Analyse the universityrsquos current peak demand charges understanding the current billing structure andcollecting typical energy usage data
5 Create a tool to generate demand profiles (kW) from half-hourly usage data (kWh) defining energy pro-file of the new campus
6 Create a model simulating the use of battery strategies to change the energy demand profile of the newcampus comprising of three stages
(a) A simulation of using the battery system against a current university building analysing the effectof the system for use as a datum
(b) A simulation of using the battery system in the new university campus(c) An assessment on the optimum battery design to select based on the new campuss energy profile
Evaluation
7 Evaluate results of the simulation concluding on the effectiveness of different battery systems A cost-based analysis will be used to measure the feasibility of the different energy storage systems for theUniversity comparing the value of the system against current challenges in using the new technology
2 Background and Summary of Key Work and ReferencesThe following summary of key work provides an overview of using Energy Storage Systems (ESS) to lower en-ergy costs Using batteries in this manner is still novel with a broad range of ESSs and use strategies available
Alexander Charles 2
2 BACKGROUND AND SUMMARY OF KEY WORK AND REFERENCESfor evaluation these can produce dramatically different results under various scenarios By building an un-derstanding of both the technology and university energy billing an optimised energy storage system can befound
21 Sustainability and Energy Storage SystemsThe UKs energy grid uses many methods to provide the power required to meet the countrys demand Thisenergy comes from both clean (hydro wind solar) and dirty (coal gas) sources Due to the nature of mostclean technologies these sources are used to meet the UKs base load (power usage during off-peak periods)[5] Periods of the day when the UKs energy usage soars require additional fast reactive dirty sources such ascombined cycle gas turbines to meet this demand [6] Consumption during peak demand periods is chargedsignificantlymore for this reason An ESSproposes a newway to level out peaks during these periods reducingthe needdirty technologies By using energy storage technologies theUniversity could reduce their emissionsby up to 360gCO2 per kWh [7] while having the potential to save a significant amount of money
22 University Energy ChargesThe University of Bristols infrastructure spans across three sites the City Centre Stoke Bishop and LangfordAcross these locations the majority of facilities receive separate energy bills allowing some granularity inunderstanding where these charges originate [8] The University receives charges bundled together underfour distinct themes [8] described below where their applicability to energy storage technology is discussed
1 Unit Charge - Base cost of energy consumption making up 58 of the bill2 Distribution Use of System (DUoS) - Including capacity charge and DUoS rate
(a) DUoS Rate - there are three DUoS rates Green Amber and Reda depending on the time of dayEnergy costs during Red periods are significantly higher (between 5pm-7pm) For Western Power(Universitys current supplier) there is a 17000 increase in price during these periods a ReducingDUoS rate charges is the main method of reducing peak demand charges an ESS should be usedduring Red periods and charged during Green periods These make up 20 of the bill b
(b) Capacity Charge - this is where the customer sets their maximum demand (kW) level[10] This isset above the actual maximum demand of a building to reduce the risk of breaching this thresholdIf breached the customer incurs substantial penalties and the supplier increases the threshold forthe next billing period By levelling off peaks in energy demand the capacity charge thresholdcan decrease Capacity charges make up a 4 of the monthly bill b where the risk surpassing thethreshold exceeds any savings seen through implementing an ESS
3 Transmission Network Use of System (TNUoS) - Three times a year when the UKs energy demand isgreatest called TRIADs These dates lie between November and February separated by at least tendays in each financial year [11] The average max peak demand (kW) across the three TRIADS [12] ismultiplied by a tariff [13] added to the customers end of year bill The University has become quite
aSee page 27 of [9] 25405 pkWh in Red against 0147pkWh in GreenbSee Figure 82 in Appendix
Alexander Charles 3
2 BACKGROUND AND SUMMARY OF KEY WORK AND REFERENCESgood at forecasting these periods [8] making it possible to schedule an ESS to reduce demand duringthese periods where power supply rate (kW) is crucial These make up 7 of the monthly bill b
4 Feed-In Tariff (FIT) - Basedon feedingback energy to thegrid Dependent on thebattery system selectedthere is potential to increases the value of the ESS by leveraging this charge FIT charges frequentlychange making it difficult to assess the value which can be gained
23 Current Peak Demand Management MethodsPeak demand reduction is synonymous with peak shaving the ability to control energy usage during intervalsof high demand to limit or reduce demand charges [14] [15] Traditionally there are twomethods for reducingpeak demand for industrial complexes [14] These are
Load Shedding This is reducing energy usage by switching off certain systems during periods of peak de-mand [16] An intelligent scheduling systemor a simple forecasting tool can be used to execute load shedding[17] where systems are switched off autonomously or manually Often load shedding is calculated daily usinga schedule to set a fixed maximum energy limit [18]
bull Limitations Forecasting errors can significantly reduce the effectiveness of this system where reactivemethods are often better [18] Getting university staff and students to shift their usage habits from peaktimes could be potentially costly [8] Also found in experiments conducted by the University of Copen-hagen [19]
On-site Generation Adding off-the-grid capacity to the consumer [14] The University currently uses dieselgenerators roughly ten times a year to reduce TRIAD charges supported by [20] Replacing diesel generatorswith ESSs will significantly reduce their environmental impact while allowing autonomy in reducing TRIADcharges increasing savings
bull Limitations The University currently has 05MW of PhotoVoltaic (PV) installed using nearly all availablespace [8] These PVs provide only 05 of the total energy demand meaning the use of on-site genera-tion to offset peak demand has a negligible effect in flattening the Universitys demand Pairing batterieswith PV as a method of supply levelling appears unfeasible in the context of the University
University Research IODICUS is a current University project looking at reducing energy costs by improvingenergy consumption sensing data The project produced middleware for an Internet of Things (IoT) deploy-ment of energy sensors actuators and software to explore the resulting `big data of the sensors [21] Althoughthe project did not evaluate the use of ESSs the outcome of improving sensing data will help to improve thechosen ESS performance
There are a limited number of commercially available solutions that use ESSs to reduce peak loads directlyABB offers energy-storage smart-grid products which perform load levelling at grid level [22] These systemsare designed primarily for supply levelling using forecasting methods and extensive ESSs to offset excessenergy supply produced from renewable energies [23] rather than focusing on reducing its customers energybills One Cycle Control have created technologies to regulate peak-load and mitigate peak demand charges
Alexander Charles 4
2 BACKGROUND AND SUMMARY OF KEY WORK AND REFERENCESfor commercialindustrial facilities using Li-ion batteries [24] The technologies proved effective at reducingpeak demand charges but revealed that ESSs upfront costs are the largest deterrent in making the systemfinancial feasibilie[25] As there is nodirect commercial solution this report sets to understand the componentsrequired to create an efficient energy storage solution for reducing the universitys new campus energy bills
24 Peak Shaving Systems Literature ReviewAcknowledging the limitations in commercial ESSs being used to reduce peak demand it is crucial to under-stand current research to design an optimal system Research is grouped highlighting each sections signific-ance and relevance to the development of the model
241 Forecasting and the Use of ESS in Load ShiftingUsing energy price forecasts an ESS can be switched on to shift energy costs purchasing energy at a cheaperrate and using this energy during peak times [26] ran simulations to test NaS Li-ion and Flow batteries for anItalian commercial plant but failed to find viable return on investment (ROI)[26][27] used real hourly spot pricesto decide the best times to turn on and off Vanadium Redox Batteries (VRB) and Polysulfide Bromide Batteries(PSB) Through sequential quadratic programming (SQP) was used to optimise battery sizes finding a businesscase for load shifting These two conflicting results were due to the sensitivity in energy pricing highlighting itas a strong area of uncertainty An independent investigation of this technique with the University may provefeasible [28] added a real-time operator to create an intelligent scheduling system for home prediction Thissystem significantly improved the state of charge of the battery freeingmore energy for use in reducing peaksThe work highlights that forecasts combined with real-time information can increase the performance of thesystem further Work conducted in the IODICUSwill therefore be useful in improving the system effectivenessModelling development will research
bull Local energy pricing acts as a large area of uncertainty being the significant deterrent for making ESSsfinancially feasible
bull the implications of battery health on the lifetime value of the battery for the battery selectedbull increasing granularity in the Universitys usage data will incorporate a real-time operator
242 Supply LevellingSupply levelling is the most common use for ESS [29] using large batteries to reduce power fluctuationsbrought by the use of renewable technologies [30] [31] Supply levelling works by storing excess supplyreducing peaks in the grid rather than in demand [32] looked at improving supply for a residential homeShiftable water heating was identified to account for 50 of household electricity use used as the primarystorage device Excess load from wind turbines was used to heat water in excess supply periods bypassingthe inverter thus improving energy losses [33] Minimising conversion through inverters makes a large differ-ence in the efficiency of the system Supply levelling will not be addressed in thismodel due to the UniversitysPhotoVoltaics (PVs) contributing to only 05 of its supply [8]
243 Battery Sizing and Financial ModellingNumerous studies have been run to find commercial feasibility for using ESSs [26] and [34]model the use ESSsbroadly to reduce the cost of all energy charges revealing that the return on investment ROI is unlikely until
Alexander Charles 5
2 BACKGROUND AND SUMMARY OF KEY WORK AND REFERENCESbeyond 2020 Papers including [35] and [36] evaluated financial models for particular case studies showingthat bespoke solutions achieved greater peak shaving reductions than returns promised by current genericproducts [22] [26] [34] [35] [36] and [37] all present strong arguments for bespoke ESS solutions producingbetter businesses cases over general commercial technology
Research has highlighted some benefits of using multiple ESSs systems in a decentralised format over onecentralised system [38] analysed both peak shaving and battery longevity for a large data centre Throughboth experimentation andmodelling [38] showed that when regarding the batteries lifespan the ability to reg-ulate load through a series of batteries can bemore favourable than a centralised system Research conductedby [39] and [25] also both support using a decentralised system
[40] [41] and [42] show methods to optimise battery configurations [42] used a non-numeric modellingmethod focusing on ultra-capacitors to find the optimal ESS The results emphasised the constraint of storagecapacity showing an exponential decrease in value gained after a particular size of ESS Finding the requiredbattery size and power for the new campus will be the primary focus of this projects model [41] created ananalytical model using energy bands to regulate peak load giving an optimum storage size for a given systema straightforward and efficient method of modelling battery usage The model will incorporate
bull [40] modelling technique adapted to find the optimal configuration of the ESSbull An assessment of the benefits of using a decentralised battery system focusing primarily on lab space
25 Comparison of Energy Storage SystemsThe selected ESSwill govern the cost and feasibility of a peak shaving system An ESS converts electrical energyinto a form stored for later use [43] Electrochemical batteries characterise low maintenance high round-tripefficiency long cycle lives and high energy densitys being the most appropriate technology for reducingpeak demand [44] [45] Batteries therefore have been chosen as the main focus for this study The variousstorage methods can be characterised by their different uses summarised below
bull EnergyManagement for large scale storage typically used by power plants for load levelling and ramp-ingload following
Pumped Hydroelectric Storage (PHS) Compressed Air Energy Storage (CAES) and Cryogenic En-ergy Storage (CES) are the conventional technologies for high generation above 100MW All thesemethods are on a scale too large to be considered for this project
Large-scalebatteries flowbatteries fuel cells solar fuels CES andThermal Energy Storage (TES) aresuitable for medium-scale energy management with capacities of 10--100MW These technologiesare too large and their frequency response is too slow for this application
bull Power quality Batteries with fast response times improve power quality allowing techniques such as theinstantaneous voltage drop flicker mitigation and short duration uninterrupted power supply valuableon a grid level
Flywheels Batteries SuperconductingMagnetic Energy Storages (SMES) capacitors and ultracapa-citors have millisecond response times lower for but all have storage sizes below 1 MW - suitable
Alexander Charles 6
3 BATTERY STORAGE TECHNOLOGY KEY ADVANTAGES AND CHALLENGESfor adding a to a larger battery
bull Bridging power Relatively fast response (lt 1 s) but also have long discharge time (hours) The typicalpower ratings are between 100 kW-10 MW
Batteries flow batteries [46] fuel cells andMetal-Air Cells[43] [47] These are the most appropriatefor peak demand reduction on the scale of a new university campus
By removing inappropriate energy storage systems shortlist of was created c comparing the different prop-erties of ESSs Rechargeable batteries along with capacitors provide the response time [48] and efficienciesrequired to make the system justifiable
26 Battery Selection - Tesla Powerpack 2As a mature technology with fast frequency response in delivering power Li-ion batteries were down-selectedas themost viable option for achieving the projects aims EOS BYD and Tesla are currently the only companiesthat supply Li-ion batteries of an appropriate size Due to readiness in information around performance andprice the Tesla Powerpack 2 was chosen for this model to improve the validity of results
3 Battery Storage Technology Key Advantages and ChallengesTable 1 identifies the key values and challenges associated with implementing Li-ion technology Themodel inthis project aims to overcome high severity challenges by developing a comprehensive understanding of theireffects necessary to create an accurate cost-based analysis for Li-ion energy storage This section assessesthe technology creating strong arguments for how the system will overcome its challenges showing were theassumptions made in creating the model originate
Table 1 Showing the Advantages and Challenges of Using Energy Storage
AdvantagesReducing Electricity Bills Lifetime of Battery Too Short 4bull DUoS TRIADS Capacity Charges bull Cyclelife difficult to predict for applicationSupply Levelling Cost of Battery High 5bull Maximising use of PVs and other Renewable Sources bull PurchaseInstallation maintenancebull Providing predictable energy profile for new building bull Complexity in retrofittingEmergency Power Change in Energy Regulation and Pricing 5bull Supporting crucial systems in power cuts bull Frequently changing costs structuresIncreasing Sustainability Legal and Commercial Barriers to Entry 3bull Reducing usage during peak demand periods bull Energy companies may penalise battery useSupport Regional Electricity Grid Negative Environmental Effects 2 bullProvides fast frequency supply and increases flexibility bull Effects of mass Li-ion mining not understoodSecurity Low Level of Technology Maturity 2bull Protection against cyber attacks bull Technology Still Maturing Lacks Extensive Tests
Challenges Severity
Measure of Challenges - Severity Scale 1 (Low) 5 (High)
31 Li-ion Battery CostsOver the last decade Li-ion technology has advanced significantly partly due to the rise in electric vehiclesslashing the price of Li-ion through economies of scale while improving efficiency and energy densities Figure
cSee table 5 in the Appendices
Alexander Charles 7
3 BATTERY STORAGE TECHNOLOGY KEY ADVANTAGES AND CHALLENGES31 shows the trend in prices for the last six years and the predictions for the next 15 Between 2010 to 2016battery pack prices fell ~77 from$1000kWh to $227kWh Current projections put Li-ion battery pack pricesbelow $190kWh by the end of the decade corresponding with the construction of the new campus Thisfurther 16 reduction suggests that the feasibility of investing in the technology will only continue to increase
Pricing data readily available on the Powerpack is based on the batterys capacity (kWh) and maximum power(kW) [49] making it possible to evaluate optimum specifications based on real prices rather than predictionsUnit costs start at pound51940 and scale infinitely After purchasing the product installation is the next largestcost to consider The Powerpack comes almost as plug and play including an inbuilt inverter simplifyingthe process extensively The cost to install will however be significantly greater when retrofitting to existinginfrastructure where proper foundations are necessary for the battery to be fully operational in a universityenvironment For the Temple Quarter campus it is assumed the foundations will be developed as the site isconstructed this will add little expense to so has bee ignored in this model
200
100
0
400
600
800
1000
10 11 12 13 14 15 16
Price
Per
kW
h $
Year
1000
800
642
2020 Forecast
2030 Forecast
-77
Figure 31 Plot of Li-ion Battery Prices2010-2016 [50]
Maintenance and operation costs are other factors to consider ThePowerpack uses a health checking system requiring little training op-erate It seems likely that the University can use a member of theEstates team to monitor the battery infrequently Section 322 dis-cussed the Powerpacks ten-year warranty eliminating any costs inthe first ten years For these reasons maintenanceoperations are as-sumed negligible
By using todays battery prices rather than future predictions batterycosts will be over-estimated This reduces uncertainty around all cost-ing assumptions made
32 Battery EconomicsThe primary objective of this project is to build a business case forusing a battery system giving a valid prediction on the value an ESScould generate There are three ways the model will assess the value of the storage system net present valuepay-back period and total-savings Each of these results will be compared crediting their merits and pitfallsto give a full understanding of the batterys value
321 Net Present ValueNet Present Value (NPV) describes the difference between the current value of cash inflows and outflows [51]NPV is used in capital budgeting to analyse the profitability of an investment over the long-term Batteries area significant upfront investment seeing little financial value for many years As a consequence purchasingthe battery through finance is likely adding an interest rate to the cost of the battery Battery degradation andinflation are also factors which decrease the value of the battery over time
The Internal Return Rate (IRR) is a method for finding the maximum discount rate before an asset generates anegative NPV This is found by setting the net present value to 0 and calculating the return rate Equation 1
Alexander Charles 8
3 BATTERY STORAGE TECHNOLOGY KEY ADVANTAGES AND CHALLENGESdefines the secant numerical method used for calculating the IRR
rn+1 = rn minusNPV n middot
rn minus rnminus1
NPV n minusNPV nminus1
(1)
Where rn defines the nth approximation of the IRR [52]
Using Equation 1 the maximum discount rate can be found using batteries at the extremities of the results(lowest and highest performers) If the IRR is found to be too low battery strategies will need revising else itis unfeasible to invest in energy storagedTotal savings is the measure of NPV when the discount rate is set to zero providing a clear understanding ofthe cash flow which the system generates
322 Payback PeriodThe Payback Period (PBP) is the time for project savings to equal or exceed the cost of the investment [53] Thismetric is used tomeasure risk Minimising the payback period diminishesmany high severity challenges of thebattery reducing the likelihood of energy billing change and the probability of the battery failing The TeslaPowerpack 2 has ten years warranty lessen the risk of additional costs to replacerepair the battery beforeit becomes profitable As the battery will first be viewed as a financial investment by the University a shortpayback period will be essential to prove the battery systems financial feasibility
33 Battery Lifetime Assessment - Understanding Battery Degradation
959080
70
Number of Cycles
Rem
aing
Capa
city
AB
CD
End of Life
Region of Rapid Degredation
Figure 32 Plot of the General RelationshipBetween Battery Capacity and Cycle Number Ex-tracted From [54]
Sections 241 and 243 highlighted the importance of batteryhealth in increasing the long-term value of an ESS By operat-ing the battery in a way that considers its longevity more valuecan be generated To correctly model how the Li-ion batteriesdegrade over time the following section discusses the paramet-ers which affect battery health considering how they should beregarded in the model
Figure 32 shows the typical capacity degradation profile of aLi-ion battery After the battery degrades below 80 (C) of itsoriginal capacity its regarded to be in its end of life phase [55]After this point degradation becomes more rapid and unpredictable [54] There is still potential for moreenergy to be delivered beyond this point [56] but for the model to remain representative the battery will beregarded as dead beyond its end of life value
The following list of parameters gives a brief overview of how these affect battery degradation highlightinghow they are implemented in the model
331 TemperatureRunning the battery at a temperature too hot or too cold increases its rate of degradation significantly [57]The Tesla Powerpack incorporates an internal liquid cooling and heating system which provides pinpoint tem-
dAn IRR below 5 is considered unfeasible although unquantified benefits may be present [53]
Alexander Charles 9
3 BATTERY STORAGE TECHNOLOGY KEY ADVANTAGES AND CHALLENGESperature control A dual coolant and refrigerant loop system minimise the effect of temperature degradationproviding better efficiency than traditional HVAC systems [49] Due to safety reason it is recommended thatthe battery is installed outside making the battery susceptible to climate England experiences a mild climateall year round with temperatures mostly between 3degC and 22degC [58] These cooler temperatures favour thebatterys performance For both these reasons themodel will assume that the temperatures effect on degrad-ation is negligible
332 Depth of Discharge
20 30 40 50 60 70 80Depth of Discharge
100
150
200
250
300
350
400
o
f R
ate
d C
apaci
ty
Effect of Depth of Discharge on Capacity
FitData000007x -00169x +155x -6559 +1240= 0
4 23
Figure 33 Plot of Depth of Discharge vs Rated Capa-city Interpolated From [59]
Depth of Discharge (DOD) is related to the number of act-ive chemicals transformed with each charge dischargecycle e Figure 33 shows experimental results of the ef-fect of DOD on Lead-Acid batteries capacity which holdstrue for Li-ion [59] At the rated cycle life of 5000 it wasassumed a 70 DOD was used to test the battery lifespan[60] This value was scaled accordingly By restricting thepossible DoD the cycle life of the battery is improved dra-matically It is common practice to select cells with morecapacity than required The batterys average depth of discharge over its lifetime should be recorded andused as a metric for the validity of the selected batteries expected lifetime
333 Usage
1 2 3 4 5 6 7Discharge Time hours
50
60
70
80
90
100
110
o
f Rat
ed C
apac
ity
Effect of Discharge Rate on Capacity
Poly Fit00056x -00792x +0383x +0358= 03 2
Figure 34 Plot of the Relationship Between DischargeTime and Rated Capacity Interpolated from [61]
Over Depletion Fully depleting a battery for extendedperiods can have detrimental effects on capacity It is com-mon for battery management systems (BMS) particularlyin consumer electronics to power devices off above zeronegating some of the effects of depleted storage levels[62] Themodel should prevent the battery from being de-pleted below 10 to offset this effect
Discharge Time When discharging batteries quickly theeffective capacity of the cell can be reduced [63] The Peuk-ert Equation is a method that characterises capacity offset when depleting the battery at high discharge ratesIt is unclear what the Powerpacks Peukert number is but it can be assumed to be between 1-102 f where 1characterises minimal capacity offset [64] [65] The low Peukert number means the discharge rate up to therated power has little effect on the batterys perceived capacity Rate of discharge also affects the batterieslifetime[59][61] Using the experimental trend shown in Figure 34 an equation has been derived character-ising the effect depletion speed on capacity This can be used to validate the degradation model used Thisparameter should be recorded by the model
eSee Figure 45 for a detailed description of battery cyclingfLi-ions low Peukert number is another strong supporting factor why using Li-ion is well suited reducing peak demand where
there may be instantaneous high levels in demand
Alexander Charles 10
4 BATTERY MODEL DEFINITION334 ChargingCharging Level The cycle life of a battery can be increased by reducing the cut-off voltage Battery voltagewill be fixed at either high voltage (three phase) or at 240V (single phase) where current drawn into the batterywill vary Decreasing the batterys voltage will extend its life (partial charging) [66] g By charging the battery toits full capacity or overcharging the battery capacity will degrade quicker becoming unstable Cell chemistrycauses pressure to rise increasing temperature inside the cell further reducing the batterys capacity The cellalso has a lower thermal runaway temperature and will vent its temperature quicker than one that is partiallycharged Consequently Li-ion batteries are safer at a lower charge [67] Due to these two issues the batteryshould stop charging before reaching this threshold
Charging Rate Similar to discharge time a reduction in battery capacity occurs at high discharge rates dueto the transformation of the active chemicals inside the cell being unable to keep pace with the current drawnthus reducing cell capacity [59] The model should maximise the charge time of the battery to mitigate thiseffect
Figure 35 Relationship Between State of Charge andCycle Life [68]
Figure 35 shows testing conducted on Li-ion cells combin-ing the ideas of battery charging and depth of dischargeto increase the lifetime of the battery Using this result acharging range can be selected which optimises the pay-back period of the battery against the batterys lifetime
4 Battery Model DefinitionBy understanding the key design parameters for reducingthe impact of challenges set in section 3 a viable model ofthe battery system was defined Data was obtained fromSenate House (a 7-storey University officestudy building) This was used to create a characteristic demandand usage profile for Senate then manipulated to create a representative energy profile for the New CampusThis section will define how the model was created discussing the methodology and any assumptions madeFigure 41 describes an overview of the primary inputs processes and outputs of the model
Inputs
Output
Half Hourly Energy Usage Data Building Energy Profile
Battery Perfomance Parameters
Optimum Battery Configuration
Battery Life UsageSimulation
Cumulative Savings
Battery Price and Specification
Energy Billing Structure
Battery StrategyPayback Time
Battery Health
YesNo Final Battery
Figure 41 Diagram Showing Key Inputs Processes and Outputs of Model
gSee Figure 83 in the Appendix showing the relationship of cell capacity and charge voltage where a dramatic decrease in cellperformance for cells charged to higher levels is visible
Alexander Charles 11
4 BATTERY MODEL DEFINITION
41 Model Development RequirementsA distinct set of modelling requirements were essential to ensure that a functional model was created whichcorresponded to the projects objectives By building a flexible simple model any unnecessary complexitywas removed sparing both time and computational expense A robust set of requirements also provided abasis for assessing the completeness of work The following section defines these requirements
411 Zero-Dimensional vs Three-Dimensional ModellingThe zero-dimensional modelling approach is a technique used in the development cycle of a product typicallyin the early stages Zero-dimensionalmodels are used to understand the general performance of a system [69]Instead three-dimensionalmodels are implementedwhen a detailed analysis is needed The systemdynamicsof a zero-dimensionalmodel are a function of the timewhile a three-dimensionalmodel is a function of the timeand space For this reason zero-dimensional models are simpler and faster at generating solutions enablinga much large number of simulations to be run As multiple battery systems and strategies are being evaluatedthe zero-dimensional modelling method was used
412 Code Optimisation and Ease of DevelopmentA time-based iterative modelling method based on a zero-dimensional approach was selected to modela large variety of different battery specifications Running the simulation through time requires performingcalculations on large matrices The model should be optimised for performance to minimise running timesThis helps improve the model performance and reduce data collection time allowing for different batteryspecifications to be modelled h It is essential that the model remains structured to allow for expansion as theproject progresses A function based approach must be taken throughout the development process to allowthe model to reach its expected size and complexity Without functions the structure will be poor increasingthe difficulty in further development and debugging
413 User InterfaceThere is a strong likelihood of using this model for next years group design project The modelling functionsoutlined in the projects outputs should operate independently from each other working with a broad rangeof data The ability to manipulate the model easily will mean others will be able to use the tools developedmaking themodel muchmore useful Themodel consequently must allow for a range of inputs which shouldbe easily configurable Designing the model in this way will also simplify data collection reducing the risk ofintroducing a systemic error associatedwith the user entering incorrect inputs or false logic Dates and times ofthe energy usagedata inputted in themodel will have a large effect on the results It is therefore important thatthe model can read data files and use their dates to create accurate runtime usage data The data outputtedby the model must be clear and easy to interpret by any user with minimal post-processing this will improvethe models ability to be a design tool
42 Creation of Senate House Billing ModelTo validate the results of the model before testing on the new campus the model was developed for use inSenate House
hSee section 47 the methods used to create optimised code
Alexander Charles 12
4 BATTERY MODEL DEFINITION
1050 15 20
Time Hours
150
200
250
300
350
400
0002800016
024
Use
ag
e kW
h
Un
it C
ha
rge
Price
pound
WeekendWeekdays
Average of Usage Data For Senate House Weekends vs Weekdays
Figure 42 Plot of Mean Senate House Weekday and Week-end Usage and Difference in Unit Charge Rates
Senate House date described half-hourly usagebetween 10082014 and 10082015 A bill wasalso provided for a months energy usage at the Vic-toria rooms i A meeting with John Brenton [8] cla-rified that billing profiles for both buildings wereidentical To gauge the size and power requirementsof a battery system for Senate House a minute byminute energy profile was required Correspondingthis energy profile with a bill identified how energyconsumption correlated with the cost This allowedquick sensitivity calculations to select strategies likelyto have the greatest impact
Plots of the data were used to visualise key trends inenergy consumption It was clear that there is a significant difference between energy demand during theweekend and during the week shown in 42 where total energy consumption was found to be three timesgreater over weekdays than the weekend It was vital that all these trends are replicated in the creation ofrepresentative energy profiles
43 Representative Bill CreationSection 22 described the components of the energy bill Its clear that Red rate charges are a significantcharge which an ESS can target incorporating ~20 of the bill To highlight the significance of the Red ratecharge Figure 42 shows the difference in DUoS rates A preliminary model was designed to target Red ratecharges only through load shifting Using Senates half-hourly data DUoS rate charges and unit charges werecalculated The energy profile was scanned to find the start date of the bill assigning weekends weekdaysaccordingly (crucial as Red rate charges arent applicable on weekends) By creating a counter that loopedthrough each half hour period logic was applied to categorise each half hour period into their respective unitrate Total units consumed in Red Amber and Green periods were found where simple calculations revealedthe effect load shifting could have This crude model captured 79 of the monthly energy bill charges
44 Representative Demand ProfileBoth power and capacity must be considered to simulate how a battery performs Applying too much loadon a battery can severely reduce the batterys cycle life discussed in section 33 Due to the lack of availabledemand data from the University assumptions were made to generate a valid demand profile based on theoriginal half-hourly usage profile
First the usage data was broken down into a minute by minute representation By using linear interpolationan identical looking graph of the original data was created containing 1440 points representing each minute
iA Bristol University building used for lecturing offices and teaching classes see Figure 82 for the Bill provided
Alexander Charles 13
4 BATTERY MODEL DEFINITION(see Figure 43) This graph was then downscaled to give usage per minute (validated by summing all thepoints and comparing to the original data)
This crude profile however assumed that all usage varies linearly between time periods In reality this is nottrue Amore realistic demandprofilewas then created by finding themidpoint between values and assigning arandom normally distributed number in intervals of 10 minutes Choosing an interval too small would deviatethe total usage away from the original while too big would subdue the shape of the graph This methodmodelled how usage varied randomly minute by minute similar to items being turned on and off frequentlyin a building but maintained the original datas consumption trend A standard deviation σ was then selectedwhich would reasonably represent the change in usage over time For σ to be valid for a variety of differentmagnitudes in data the value was trailed against a range of different data sizes It was found that by assigningσ as a function of average usage and max usage gave a fair but conservative representation of how energyusagemay look Scaling by a factor of 60 converted usage from kWh to demand kW producing a graphwhichshowed the peaky nature of energy demand for Senate House By integrating the area under the demandcurve this graph was validated against the original data
Assumptions Usage will have a peaky profile due to a large number of individuals in the buildings frequentlyswitching numerous devices on and off For an office style building like Senate it is unlikely that there is anyhigh-energy-consuming equipment that could cause a major spike in demand
12-Aug-2014
0 200 400 600 800 1000 1200 1400
Time Mins
10
15
20
25
30
35
40
45
Use
ag
e
kWh
20
30
40
50
60
70
80
90
De
ma
nd
kW
Date Plot of Original Useage and Demand
0 200 400 600 800 1000 1200 1400
Time Minutes
05
1
15
Use
ag
ek
Wh
Date Plot of Live Use Fit Against Minute Resoultion
0 200 400 600 800 1000 1200 1400
Time Minutes
20
30
40
50
60
70
80
90
De
ma
nd
kW
Date Plot of Live Demand Fit Against Minute Resoultion Plot of Frequency of Energy Demand Over a Year
0 20 40 60 80 100
DemandkW
0
05
1
15
2
25
Fre
qu
en
cy
104
Figure 43 Plots of Usage and Demand Profile Generation and Histogram of Year DataTo fully understand the energy profile histograms and cumulative distribution plots j were used to identifythe typical demand Senate House sees over the year as well as the max demand the building experiences[70] Figure 43 shows the demand profile of Senate House providing insight into what requirements maybe needed by a battery system It can be observed from in the histogram that the demand of the Senate
jSee Figure 84 in the appendix to see Senate Houses load profile
Alexander Charles 14
4 BATTERY MODEL DEFINITIONHouse typically falls between two points One low peak representing morning and evening of 30KW and asecond peak constituting the energy usage in the middle of the day averaging around 80KW but rarely everexceeding 90KW Insights from the load profile also identified a battery rated at 40KW would cover 5000hours of the year roughly 55 of the years usage
45 Definition of the New Temple Quarter CampusUnderstanding the requirements new campus was necessary tin creating valid assumption about its energyprofile At the time of writing this report no building plans were available Instead many assumptions aboutthe likely size and use of the campus were used to create a representative energy profile k
The campus will be designed for ~1500 resident students having ~5000 staff and students on site during term-time A range of facilities have been proposed for Temple Quarter Campus where it is likely that the campuswill constitute largely of tutorial rooms a few lecture halls and offices A meeting with John Brenton [8] madeclear that creating an infrastructure that supports postgraduate business studies made the most economicalsense and is likely to influence the Campuss design
As the proposed tutorial rooms and office will be similar to Senate House it is assumed that these energy pro-files will be transferrable to the new campus It is unlikely that the new campus will have any equipment thatwill greatly distort the load profile rather it is likely that the campus will have improved efficiency through em-ploying the latest technologies in its construction and services (HVAC) Data on 125 rooms in halls of residencewas also provided with a higher degree of certainty of its applicability to the new campus Footprints of bothbuildings were combined with laboratory data testing the effects labs may have on any large spikes in energyusage The final scaling factors used were
bull Senate House (7840sqm) - 79xbull Hall data (2761sqm) - 76xbull Lab data (1 Lab Use) - 4x
451 Energy Profile ToolDue to energy usage data files beginning on different dates and running for various periods of time these re-cords required adjustments to be correctly scaled and combined To fully meet the projects outputs andmod-elling requirements a program was created to manipulate various half-hour energy usage files An algorithmwas set up to read the data dates and then convert this data into a realistic demand profile To simulate life-time energy usage copies of the energy profile were concatenated for the length of simulation checking thateach year began on the next day in the week from the end of the previous year It was imperative that datesaligned to make sure results were valid as the difference in energy usage between weekdays and weekends(see section 42) could cause the total savings to vary on a seven-year cycle pattern Figure 44 outlines thelogic of this program
kSee Table 6 In the appendix for a breakdown of how the new campus was sized
Alexander Charles 15
4 BATTERY MODEL DEFINITION
Read Master Start Date
Read Secondary Start Dates
Find Difference Between Two Dates
Align
Split Data to Align Days and Months
Switch Data Splits and Join
Check Days with Master
Shift Dates Back One Day
InputHalf Hourly Energy Usage Data
Output Scaled and Combine Data
Create Minute by Minute Granularity
Usage Data
Add Random Normally Distributed Variablitlity into
Data
Create Demand Profile for Data
Extrapolate Profiles for Batteryrsquos Lifetime
Yes
Yes
End Of Data Files
No
While Data Files
Unprocessed
Figure 44 Logic of Energy Profile Tool Create New Campus Data
46 Definition of System StrategiesTo fully understand the value of using battery storage representative simulations of how the battery wouldoperate is required This section defines the logic of the batterys operation The model calculates both eco-nomical and technical battery performance based on the chosen battery strategies The following section willdiscuss why the final strategies were selected detailing their development
461 Red Rate Charge Avoidance StrategyAs outlined in section 43 using energy consumed during Red rate periods was considerably more expensivethan Amber and Green periods making it a primary strategy By switching the battery on during Red rateperiods then charging during Green periods cost savings of up to 20 could be made Currently for theUniversity Red rates apply between 5 and 7 PM on weekdays making it simple to forecast alleviating the needfor complex prediction systems highlighted in section 241 During this period the battery would be drainedat a rate up to its maximum output power requiring demand and usage data to be checked simultaneouslyIf the load exceeded max power energy supply was capped at this value The battery would continue to bedrained until either its minimum capacity was reached or the Red rate period elapsed The battery would thenbe fully charged during Green ensuring all capacity was available for the next Red rate period entered Thismethod was repeated for the run-length of the simulation
462 Triad Avoidance StrategyTo correctly understand the effects of TRIAD avoidance in the model TRIAD dates needed to be correctlyidentified Using [71] the dates 41214 190115 020215 were used aligning with the original SenateHouse data set as the master template for the new campus (discussed in section 451) These dates wereused for the sequential years in the simulation as they were typical days in which TRIADS would fall Fromobservation it was assumed that therewas no increase in theUniversitys usageduring TRIADperiods allowingany day within that week to be used To make sure these dates did not fall weekends days were checked and
Alexander Charles 16
4 BATTERY MODEL DEFINITIONadjusted accordingly It is assumed that daily variation in energy usage is negligible and instead energy trendsare seen only on a monthly basis
It was observed that TRIAD times all fell into Red rate periods corresponding with the Red rate avoidancebattery strategy Using these dates and the time of 530 pm the TRIAD cost was calculated based on energydemand (kW) Battery usage was thenmeasured against the TRIAD cost to understand the reduction in energydemand delivered by the battery The reduction in TRIAD rate was a factor of the batteries max power supplyand not capacity as the battery would only need to run for a few minutes to offset this charge
At the end of each year in the simulation usage on the three TRIAD dates was averaged to find the total costThis was then spread evenly over the next year in the simulation representing how TRIAD billing is split acrosseach monthly energy bill
463 Battery Control StrategyThe importance of optimising battery longevity was highlighted in 241 and 243 Section 33 discussed thedifferent variables which can affect a batterys longevity An approximation of battery degradation was takentaking into account the effect of each of these variables as a battery control strategy
The rated battery cycle life is taken as the number of full cycles a battery can complete before it degrades to80 of its original capacity l This value was used to measure how the battery should perform based on anormal use case With this assumption batteries were degraded at a level proportional to the fraction of itscurrent cycle
Dead Capacity
Battery Degredation
MaxCap
MinCap
CurrentCharge
Full Cycle Current
Size
Figure 45 Showing Battery De-gradation
For each charging iteration the new max capacity becomes slightly smaller re-ducing the size of the cycle A counter was used to sum each charge resettingwhen its value equalled the current cycle size indicating one complete cycleWith this method batteries were degraded based on their use thus degrad-ing quicker as they deteriorate This followed the cell cycle degradation trendshown in figure 32
By using the cycle-life metric all battery degradation assumptions were basedon the batterys operation and not the batterys chemistry Assumptions on thebatteries normal working parameters were made limiting the battery to con-form to these rules This would prevent the battery running in a way that wouldmajorly affect its longevity making the prediction more accurate These restric-tions could be adjusted at the expense of a greater or smaller chance of erroron the perdition of battery health The following battery control measured wereimplemented
bull Reduction in Depth of Discharge To reduce wear on the battery the battery was confined to work within10-90 of its current maximum capacity allowing a maximum depth of discharge of 80 Draining the
lThis is quoted to be 5000 cycles for the Tesla Powerpack see Figure 2
Alexander Charles 17
4 BATTERY MODEL DEFINITIONbattery can cause detrimental effects while overcharging can also do the same Working within thesetwo parameters follows similar principles applied by Tesla in their electric cars [72]
bull Speed of Depletion A battery was never run above its max specified power As the battery was ratedat this value it should be designed to cope with this level of use for no longer than 2 hours a day Thesimulation will analyse the average discharge rate as a measure of the validity of the battery health
bull Temperature Based on the assumptions made in section 331 it was assumed that the temperaturewould remain within expected bounds Using the Red rate and TRIAD strategies would allow the batteryto cool over weekends
bull Charging The battery would only charge during Green periods at a rate which would ensure it to befully charged by the next Red period this was based on the capacity required divided by the length ofthe Green rate period Section 334 suggested that charging at a lower speed particularly during thelast 10 of charge made a large impact on the battery lifetime It is assumed here that smart chargingtechniques such as trickling (seen on most modern smartphones) would be incorporated into the ac-tual battery but modelling these methods would not increase the accuracy of the model so has beenneglected
bull Battery Efficiency This was incorporated into themodel bymultiplying the energy drawnwhen chargingby the additional losses caused inefficiencies This assumption was made as it is likely that the batteryonce charged can supply what it has stored The Powerpack 2 integrated inverter supplies energy in ACquoting its efficiency to this level (see figure 2) It is assumed that the quoted figure is representative ofthe batterys efficiency in the system Efficiency gains could also be achieved by designing the systemso it that primarily sends power to DC first without transforming This will not be evaluated in this projectsee Figure 2
Table 2 Tesla Powerpack 2 Specification
Capacity (Per Pack) 210 kWh (AC)
Power (Per Pack) 50 kW (AC)
Net System Efficiency 88 round-trip (2 hour system)
89 round-trip (4 hour system)
Operating Temperature -30degC to 50degC
Scalable Inverter Power from 50kVA to 625kVA (at 480V)
Depth of Discharge 100
Cycle Life 5000 Cycles
Warranty 10 Years
AC Voltage 380 to 480V 3 phases
Additional Features bull Bi-Directional Inverter (Inbuilt)
bullThermal Controller
bull Modular Scalable Design
Powerpack 2 Specifications
The model was run until either runtime elapsed or the batteryreached its end of life value (80) allowing results to be com-parable There are examples of batteries being used beyondtheir end of life cycle Renault and Connected Energy havebeen investigating the use the end of life Li-ion car batteriesin home applications [56] [73] It is believed that there is stillplenty of life remaining and the increased probability of fail-ure is less of a problemwhen used for bill reduction purposesIn the case of the new campus there are few associated costswith batteries after they have been installed If the battery haspaid itself back the battery will continue to generate profitUnpredictability may be seen as an issue potentially the case for emergency power applications Analysingthis value is out of the scope of this project therefore an end of life battery is classed as having no value
Alexander Charles 18
4 BATTERY MODEL DEFINITION
47 Input Parameters and Multi-Battery SimulationTo understand the optimum battery type for a given scenario and then infer the total savings that the batterycould generate a large array of different batteries with different power ratings and capacities were modelledUsing actual data from Tesla [49] the real costs of the different battery specifications were modelled To findtrends in the different battery types it was required to iterate through numerous different battery specificationsTo reduce computation time parallel computing was implemented to iterate each discrete battery scenario inthe 0D model
The following diagram depicts the model of the entire multi-battery system
Input Powerpack Specification List
Process File Extract Max Power Capacity and Cost
Input Energy Profile
Run Energy Profile ToolOutput Demand and
Usage Profile
For Input Powerpack
Specification
Set Battery Control Measures Pricing and
TRIAD Dates
While Remaing Battery Life and
Runtime
Output Battery Health Payback Time Savings
Aggregate Data and Produce Plots
Assign TRIAD Days for next
year
If Year
Elapsed
For Mintues in current day
Assign Unit Charge Rate (RedAmber Green)
Charge or Deplete Battery based on capacity
and rate
Calculate Original Cost and Savings
If Charging
If TRIAD
Capture Power Demand
Calculate Previous Years TRIAD charge
Reduce Maximum
Battery Capacity
Calculate charge levels and cycle life
Yes
Yes
ElseEnd of
Day
Next Minute
End of Life RunTime
Next Battery
All Batteries Simulated
Else
Else
Yes
Yes
Figure 46 Logic Diagram For Multi-battery Simulation
To comply with the requirements set in section 41 the following methods were used to optimise the perform-ance of MATLAB model
bull Vectorisation storing data within multidimensional arrays and using vector operationsbull Variable Initialisation all matrices were initialised to reduce memorybull MATLAB Function Reduction functions such as linear interpolation are cumbersome These were recre-ated and simplified solving tasks more efficiently
bull Parallel Processing Multiple cores on the processor were used to iterate through independent batteryspecifications in large multi-battery simulations To achieve this successfully the code was rewritten tomake all events discrete substituting techniques such as and For large multi-parametersimulations this can increase the processing time significantly
Alexander Charles 19
5 VALIDATION OF MODELbull Profiler Tool Within MATLAB the performance of code can be measured by the amount of time it takesto run This tool was used to identify bottlenecks within the model
bull Single Integers Single integers are half the size of double integers MATLABs default storage methodDouble-precision floating point numbers allow the CPU to handle very large values As this level ofaccuracy is unnecessary use of 32bit single integers was used as they increased performance [74]
bull Do Not Repeat Yourself (DRY) Coding technique to improve readability and performance of the codethrough the use of functions
The result of this method reduced the processing time of each battery from~110 seconds to under 10 secondsThis was crucial to allow 65 different simulations run quickly The runtime of the multi-scenario program wasreduced to 200 seconds This allowed different sensitivity studies to be run greatly improving the functionalityof the tool
5 Validation of Model
51 Data FileBy using the model with real data first taken from Senate House the tool which creates live data could bevalidated through integration and direct comparison to the original usage data As no data could be gatheredon actual demand for Senate house assumptions were made on the type of operations the building fulfils (seethe table below) this was compared to demand data at Princeton [75] Section 4 describes how the modelwas initially tested on Senate House to validate whether the model produced expected results After beingvalidated on Senate House the model was then run with the new campus energy profile
52 Assumptions and LimitationsTable 3 summarises all the assumptions discussed in section 4 To create a valid model all assumptions mustbe based on logical expectations of all parameters that may affect the system Thereby using the followingassumptions the model is validated
Table 3 Showing All Assumptions Made for Simulation
bull The new campus overall energy profile will have small peaks in demand only due it being very unlikely for lots of equipment with high power consumptions to be switched on together
50
bull Energy demand is assumed to be normally distributed between each half hour period 20bull Standard deviation of energy demand equals average between mean and max of data following the assumption that peaks sizes are proportional to the total demand
40
bull Daily variation negligible in energy usage is negligible assume profile is unlikely to change over battery lifetime
20
bull New campus profile is formed of Senate House Hall data and Lab data only scaled according to their total footprint size
30
bull Red rate periods remain the same for the duration of the simulation 50bull Energy prices and bills remain the same for the duration of the simulation 90bull TRIAD dates kept as close as possible to 41214 190115 020215 (no weekends used) 20bull TRIAD Bills are divided equally over the next billing year 10bull Battery degrades linearly from new to its end of life value of 80 20bull Battery parameters restrict battery to perform under normal use case 5000 cycles for a max depth of discharge of 80
40
bull Battery does not overheat is temperature controlled and allowed to cool over weekends so does temperatures effect is assumed reliable
20
bull Effect of depth of discharge and discharge rate on battery health is negligible based on normal constraints (effects discussed as secondary results)
80
bull Normal working parameters prevent over depletion or over charging from occurring 10bull Battery cycle life instantaneously degrades when charging 10bull Battery efficiency losses occur only when charging 20bull Trickle charging and minimum charge rate employed 10bull Battery has health monitoring equipment allowing its health to be optimised 20bull Current Powerpack 2 costs are used to evaluate the cost of the investment Assumed that the price will decrease and performance of batterys will improve at the time of the new campus build Current costs are therefore used as a worst case scenario
5
bullInstallation costs have been assumed negligible due to new campus build absorbing this 30bull Maintenance cost assumed not applicable as this cost will be very small 30
Assumptions Uncertainty
Batt
ery
Hea
lthBa
tter
y U
sage
Batt
ery
Cost
sEn
ergy
Pro
file
Ener
gy
Billi
ng
Alexander Charles 20
6 RESULTS
bull The new campus overall energy profile will have small peaks in demand only due it being very unlikely for lots of equipment with high power consumptions to be switched on together
50
bull Energy demand is assumed to be normally distributed between each half hour period 20bull Standard deviation of energy demand equals average between mean and max of data following the assumption that peaks sizes are proportional to the total demand
40
bull Daily variation negligible in energy usage is negligible assume profile is unlikely to change over battery lifetime
20
bull New campus profile is formed of Senate House Hall data and Lab data only scaled according to their total footprint size
30
bull Red rate periods remain the same for the duration of the simulation 50bull Energy prices and bills remain the same for the duration of the simulation 90bull TRIAD dates kept as close as possible to 41214 190115 020215 (no weekends used) 20bull TRIAD Bills are divided equally over the next billing year 10bull Battery degrades linearly from new to its end of life value of 80 20bull Battery parameters restrict battery to perform under normal use case 5000 cycles for a max depth of discharge of 80
40
bull Battery does not overheat is temperature controlled and allowed to cool over weekends so does temperatures effect is assumed reliable
20
bull Effect of depth of discharge and discharge rate on battery health is negligible based on normal constraints (effects discussed as secondary results)
80
bull Normal working parameters prevent over depletion or over charging from occurring 10bull Battery cycle life instantaneously degrades when charging 10bull Battery efficiency losses occur only when charging 20bull Trickle charging and minimum charge rate employed 10bull Battery has health monitoring equipment allowing its health to be optimised 20bull Current Powerpack 2 costs are used to evaluate the cost of the investment Assumed that the price will decrease and performance of batterys will improve at the time of the new campus build Current costs are therefore used as a worst case scenario
5
bullInstallation costs have been assumed negligible due to new campus build absorbing this 30bull Maintenance cost assumed not applicable as this cost will be very small 30
Assumptions Uncertainty
Batt
ery
Hea
lthBa
tter
y U
sage
Batt
ery
Cost
sEn
ergy
Pro
file
Ener
gy
Billi
ng
Themodel is limited to working with these parameters only Section 412 set an objective for the model to bedeveloped so these parameters can be easily changed allowing for themodel to be easily customised to workwith a different set of assumptions Modelling peaks in demand higher than those expected energy pricingchanging andDODanddischarge rate effect on capacity all have high levels of uncertainty in themodel Thesewere sensitivity checked to understand the effects of these assumptions being incorrect
6 ResultsThe objective of this report was to evaluate whether there is a strong business case for investing in energystorage technology for the New University Campus This section analyses the data gathered from the zero-dimensional model discussing the value which optimum battery specifications could bring to the new TempleQuarter campus Figures 61 and 62 describes the energy profile for the new campuss usage during Red rateperiods
Plot of Frequecy of Total Daily Red Rate Usage A Over a Year
600 800 1000 1200 1400 1600 1800
UsagekWh
0
2
4
6
8
10
12
14
16
18
20
Fre
quency
Figure 61 Histogram Showing Red Periods Total Daily Us-age Frequency
0 20 40 60 80 100
Time Spent at Load Over A Year
200
300
400
500
600
700
800
900
1000
1100
Po
we
r D
em
an
d
kW
Load Duaration Curve For Red Rate Demand Over a Year
Figure 62 Time Spent at Power Demand Level
Alexander Charles 21
6 RESULTSThese energy profile plots describe the range of battery specifications which should be simulated Figure61 shows how a battery with a usable capacity greater than ~1800kWh will have excess capacity to demandBy taking into account end of life degradation batteries with an end of life capacity of up to 2000kWh weremodelled Figure 62 describes the percentage of time the battery would spend atmax load A battery rated at920kWwould only be run at max load 10 of the time As discharge rate effects capacity batterys rated up to1300kWwere simulated Based on this analysis 65 different Powerpack 2 battery specifications were identifiedas plausible solutions
A 25 year runtime period was used to evaluate the battery performance overm chosen on the assumptionthat most technology in the building will be replaced by this point as the building begins to receive somerefurbishment Li-ion battery technology will also have significantly advanced or at least drop significantlyin price n Using a set period will also reduce uncertainty in battery health and prevent favouritism for largerbatteries An investor is unlikely to look beyond 25 years so savings made after these periods will not beconsidered The following results will talk through the three key value measurements discussed in section 32
61 Total Savings and Payback Period ResultsFigure 63 shows the parabolic shape with a local maximum between the battery size and the total savings Forthe new campus a battery size of around ~22MWh generated the maximum total savings over the simulationrun time In contrast Figure 64 highlights that amuch larger rangeof batteries fell close to the shortest paybacktime of 63years where power and capacity increased proportionally
0 500 1000 1500 2000
Battery Size kWh
02
04
06
08
1
12
14
16
18
2
Tota
l Savi
ng
106 Battery Size vs Total Saving
200
400
600
800
1000
1200
Max
Pow
er
kW
Max Fit Curve
Figure 63 Battery Size Vs Total Savings
0 500 1000 1500 2000 2500
Battery Size kWh
6
8
10
12
14
16
18
20
22
Pa
yba
ck T
ime
Y
ea
rs
Battery Size vs Payback Time
200
400
600
800
1000
1200
Max
Pow
er
kW
Max Fit Curve
Figure 64 Graph of Battery Size vs PayBack Time
Figures 63 and 64 begin to give a good insight into the financial performance of the battery Howeverpresented in this form it difficult for a designer to choose the optimum battery To make the results moreuseful an algorithm was made which generated best-fit plots over the maximum battery specifications forthe different total saving and payback time plots Figures 65 shows these curves plotted over the maximumvalues
mSee Page 27 of [76]nSee Figure 31 for a prediction in battery prices
Alexander Charles 22
6 RESULTS
500 1000 1500 2000 2500
Battery Size kWh
05
1
15
2
Tota
l Savi
ngs
pound
106 Battery Size vs Total Saving (Cond)
Max Fit Curve
0 500 1000 1500 2000 2500
Battery Size kWh
6
65
7
75
8
85
Payb
ack
Tim
e Y
ears
Battery Size vs Payback Time (Cond)
200
400
600
800
1000
1200
Ma
x P
ow
er
kW
Max Fit Curve
200 400 600 800 1000 1200 1400
Max Power kW
0
05
1
15
2
Tota
l Savi
ngs
pound
106 Max Power vs Total Saving (Cond)
Max Fit Curve
0 200 400 600 800 1000 1200 1400
Max Power kW
6
65
7
75
8
85
Payb
ack
Tim
e Y
ears
Max Power vs Payback Time (Cond)
500
1000
1500
2000
Ba
tte
ry S
ize
kW
Max Fit Curve
Figure 65 Graph Showing Top 40 Batteries with Fitted Curves for both Payback Time and Total Savings
By superimposing these max-fit curves a graphical tool was created allowing a designer to visualise thetradeoff between total savings and payback time shown in Figure 66 A small region around the crossoverpoint of the two plots shows the specifications of the optimum batteries By creating a set of rules (eg thebattery must have a payback period less than seven years) all the solutions become immediately apparent Asmall shortlist of the batteries can be made referring to the original list of Powerpack specifications
0 500 1000 1500 2000 2500
Battery Size kWh
06
08
1
12
14
16
18
2
Tota
l Savi
ngs
pound
106
62
64
66
68
7
72
74
76
78
8
82
Payb
ack
Tim
e Y
ears
Comparision of Top Batteries based onSize for Payback Time And Total Savings
0 200 400 600 800 1000 1200 1400
Max Power kW
04
06
08
1
12
14
16
18
2
Tota
l Savi
ngs
pound
106
6
65
7
75
8
85
Payb
ack
Tim
e Y
ears
Comparision of Top Batteries based onMax Power for Payback Time And Total Savings
1862kWh1662kWh
1762kWh175
645173
8444kW
7444kW
Figure 66 Comparison Between Fit Curves for Payback Period and Total Savings
The regions of the best trade-off between payback time and total savings (aroundwhere the twoplots intersect)are highlighted in Figure66 The results show that a battery around 1762kWh and 7444kW produces a goodcompromise Increasing capacity beyond this would increase total savings thus quickly decreasing pay backperiod Alternatively when looking at max power payback time increases slightly as power decreases Uptop 950kW total savings dramatically increase with very little decrease in payback time The green regionhighlights the area after the intersection point This shows that a battery larger than 745kW but smaller than950kW is optimum
Alexander Charles 23
6 RESULTSMeasuring the payback period is necessary when evaluating the risk of investing in a battery The longer thepayback time the greater the risk in either the battery failing or regulation changing diminishing the batteriesvalue o The Powerpack 2 specifications modelled have a ten-year warranty this eliminates any risk if thebattery were to fail before this period Changes in energy billing are therefore the biggest risk the technologyfaces Energy contracts typically last no longer than four years [77] after which a change in pricing schemecould reduce the batterys value to zero Knowing that 2
3 of the investment has a very low risk of uncertaintyrather than 1
2 makes the investmentmuchmore attractive These factors should be consideredwhen choosingthe design region of battery selection For a structural investment a payback period of five and seven years isdeemed safe Since the optimum battery payback time is 63 years (which falls within the range) investing inLi-ion appears feasible
62 Net Present Value ResultsThe net present value was the second method used to assess the battery systems worth As long paybackperiods are inherently risky NPV uses discount rates to devalue cash that is made further in the future Asdiscussed in section 321 the Internal Return Rate was found This calculation found that for the range ofbatteries accessed the average IRR fell between 2 and 15 at 11 Three discount rates of 3 7 and 12were selected to understand the value of the different batteries based on the IRR calculation Figure 67 showsthe net present values of the various simulated batteries at these different rates
0 500 1000 1500 2000 2500
Battery Size kWh
0
2
4
6
8
10
12
Net P
rese
nt V
alu
e pound
105Net Present Value Based on Battery Size
and Power 3 Discount Rate
Max Fit Curve
0 500 1000 1500 2000 2500
Battery Size kWh
-1
0
1
2
3
4
5
Net P
rese
nt V
alu
e pound
105
Net Present Value Based on Battery Sizeand Power 7 Discount Rate
Max Fit Curve
0 500 1000 1500 2000 2500Battery Size kWh
-3
-2
-1
0
1
Net P
rese
nt V
alu
e pound
105Net Present Value Based on Battery Size
and Power 12 Discount Rate
Max Fit Curve
0 500 1000 1500 2000Battery Size kWh
0
2
4
6
8
10
12
Net P
rese
nt V
alu
e pound
105Net Present Value Fit Battery Based on Size
and Power Different Discount Rates
3712
200
400
600
800
1000
1200
Max
Pow
er
kW
Figure 67 Net Present value at Different Discount Rates - Comparison
Using the different NPV rates presented conflicting optimum batteries Increasing discount rate favouredsmaller batteries Looking at the results it was decided that a batteries a 7 discount rate the following as-
oSee Table 1 for a more detailed description of the challenges that an ESS system faces
Alexander Charles 24
6 RESULTSsumptions
bull Battery Health As the battery will degrade each year until it reaches its end of life value the assumptioncan be made that the value of the asset decreases proportionally to the batterys health Looking at theoptimum battery at a discount rate of 7 (see Table 4 below) it can be observed that the specific batteryran for 4980 cycles Based on this assumption the value of the battery would be 99 of its original valueequating to a discount rate of ~398 over the 25 year period As each battery degrades differently thediscount rate due to batterys healthy can be approximated to 4
bull Inflation Inflation is another factor of the discount rate For the UK this rate has varied between -01and 35 for the last five years [78] It is expected that the price of energy bills will increase with inflationtherefore this can be neglected in the discount rate assumption
bull Interest Rates Discount rates can be used to incorporate interests on loans As the battery would bepurchased at the same time as the rest of the new campus it is assumed that the battery will be boughtunder the new campuss mortgage keeping the interest rate low approximated to 3
Using these approximations gives a discount rate of around 7 shown in figure 67
63 Battery Health AnalysisTo reduce computational time and simplify the model assumptions were made to confine the battery to neverwork outside of normal working parameters Section 33 discussed how discharge time and depth of dis-charge effect the battery lifetime Based on experimental data equations on how these factors have an effecton capacity were found The model measured the average depth of discharge and discharge time allowingthese parameters to be analysed after completing the simulation Understanding the effect of these paramet-ers increases the validity of results Figure 68 and 69 show the trend between the depth of discharge anddischarge for the different batteries
0 500 1000 1500 2000 2500
Battery Size kWh
20
30
40
50
60
70
80
90
Me
an
De
pth
of
Dis
cha
rge
Mean Depth of Discharge vs Battery Size
200
400
600
800
1000
1200
Max
Pow
er
kW
0 200 400 600 800 1000 1200 1400
Max Power kW
20
30
40
50
60
70
80
90
Me
an
De
pth
of
Dis
cha
rge
Mean Depth of Discharge vs Max Power
500
1000
1500
2000
Battery
Siz
e kW
h
Figure 68 Depth of Discharge For Battery Lifetime
0 500 1000 1500 2000 2500
Battery Size kWh
1
2
3
4
5
6
7
8
9
Me
an
Dis
cha
rge
Tim
e
Ho
urs
Mean Discharge Time vs Battery Size
200
400
600
800
1000
1200
Max
Pow
er
kW
0 200 400 600 800 1000 1200 1400
Max Power kW
1
2
3
4
5
6
7
8
9
Me
an
Dis
cha
rge
Tim
e
Ho
urs
Mean Discharge Time vs Max Power
500
1000
1500
2000
Battery
Siz
e kW
h
Figure 69 Expected Capacity Offset Due to DischargeRate and Depth of Discharge
Alexander Charles 25
6 RESULTSThe patterns observed in Figures 68 and 69 occur due to the difference between maximum power and max-imumcapacity Comparing these result to Figure 63 it is understood that the batteries achieving themaximumtotal savings have DOD greater than 70 but are not always fully discharged Batteries appear to fall into twocategories one of the highmean depth of discharge between 70-80 andonewith amean depth of dischargearound 50 This is a result of the relationship between capacity and max power limiting the possible depthof discharge that the battery could reach in the two-hours red rate period The discharge rate in Figure 69shows as capacity increases discharge rate also increases almost doubling for high powered low capacitybatteries
Using the polynomial equations outlined in Figures 34 and 35 an additional performance parameter describ-ing a more realistic end cycle life size was found based on these two measurements The results are shown inFigure 610
500 1000 1500 2000
Battery Size kWh
3000
4000
5000
6000
7000
8000
9000
10000
11000
12000
Cyc
le L
ife (
Offse
t) (D
imensi
onle
ss)
Battery Size vs Capacity Offset
200
400
600
800
1000
1200
Ma
x P
ow
er
kW
Figure 610 Showing the Expected Effect of Depth of Discharge and Discharge Time on Predicted Cycle Life
It is clear from Figure 610 that taking into account DOD and discharge time the lifetime of the battery caneither be reduced or increased significantly Since not all batteries will fully degrade by the end of the 25year lifetime slightly reduced capacity may not be a problem as the battery should still be functional beyondthe end of life value From research it appears that depth of discharge can have a more dramatic effect onthe batteries lifetime To make experimental effects of DOD comparable for the Powerpack a conservativeassumption that the batteries DOD rate was 70 was made [60] however notes that it is possible higherDOD were used to achieve the 5000 cycle life This would decrease the effect of DOD significantly meaningmany more batteries would increase in cycle life rather than decrease For both these reasons it is unclearwhether the error in predicting battery health will have a significant effect on the batterys value
64 Discussion on Optimum BatteryTable 4 show the optimum battery configurations based on the metrics discussed perviously
Alexander Charles 26
6 RESULTSTable 4 Table Showing the Best Battery Results Comparing the different Economic Measurements
NPV Total Savings Payback Max PlotBattery Power (kW) 1050 1200 450 900
Battery Capacity (kWh) 2000 2280 860 1710Purchase Cost (pound) 803630 915980 343100 683420
Total Saved (pound) 1912775 1969808 870561 1765193ROI () 238 215 254 258
Payback (Years) 695 759 636 653NPV 7 (pound) 522613 483657 256381 498150
IRR () 14 12 15 15Mean DoD () 764 722 800 784
Mean Discharge (hrs) 240 280 173 210Years Run 250 250 240 245
Annulised Savings (pound) 76511 78792 36302 72117Cycles Complete 4980 4709 5000 5000Predicted Health 3960 4384 3476 3721
ParameterHighest Performers
The following observations can be made from the results
bull The difference in NPV between the best NPV total savings andmax plot values are around pound40000 Thisis relatively marginal against the total cost of the investment
bull A difference of only a years payback time can be observed by all the best performing batteriesbull All the batteries are run towards their maximum working threshold with high DOD and mean dischargetimes
bull Themaximumplot specification battery gives the highest Return on Investment (ROI) this measure helpsunderstand how much money is made compared to how much was invested
bull Annualised savings of all the battery excluding lowest payback ranges by pound6000 only Between maxplot and total savings an increase in 35 in upfront cost creates only 9 more yield a year
bull Selecting a battery based on the lowest payback period has a significantly lower NPV and the likelihoodof it failing before it reaches 5000 cycles is likely
bull Selecting the battery with the largest total savings will have the highest probability of not wearing outbefore it reaches the end of life
65 Sensitivity Analysis on Energy PricingChange in energypricing is the greatest uncertainty that battery technology faces A conversationwithWesternPower highlighted the likelihood of DUoS unit charges decreasing shortly To understand whether investingin battery storage is feasible Red red cost were to drop a range of different prices were simulated Figures611 shows the effect of decreasing the red rate DUoS charged on the maximum NPV (at 7) and minimumpayback periods
Alexander Charles 27
7 CONCLUSIONS AND FUTURE WORK
500 1000 1500 2000
Battery Size kWh
-4
-3
-2
-1
0
1
2
3
4
5
6T
ota
l Sa
vin
gs
105 Senstivity of NVP at 7 For Different DUoS Rates
81367122051627331830752441
Figure 611 Effect of a Decrease in Red Rate Charges(pence) on the NPV
500 1000 1500 2000
Battery Size kWh
6
7
8
9
10
11
12
13
14
Pa
yba
ck P
erio
d
Senstivity of Payback Time For Different DUoS Rates
122051627331830752441
Figure 612 Effect of a Decrease in Red Rate Charges(pence) on the Payback Period
The sensitivity analysis shows that there is still value in investing in battery storage for the new campus if the Redrate charge decreases up to 50 If the Red rate charge were to decrease beyond this point alternate batterystrategies would need to be accessed Looking at the NPV curves in Figure 611 smaller batteries becomemore favourable as the rate decreases This is due to the increase in payback time for the larger batteriesobserved in Figure 612 Choosing a battery which is smaller in capacity reduces the risk of the battery notpaying itself back if Red rate charges were to drop this should be regarded by the designer
7 Conclusions and Future WorkThis project sets out to evaluate the feasibility of investing in an ESS when developing the new Temple Quartercampus To successfully achieve this objective while making the results useful for the fifth year group designproject the following outcomes were produced
bull Energy Profile Tool to build and understand the New University Campuss Demandbull Optimised Battery System Model producing best storage solutions based on the energy profile toolbull Business case for battery technology investment
71 Conclusions on Modelling ToolsThe project successfully produced two tools which will be useful for the final year project The energy profiletool was built to allow a flexible array of different half hourly usage data To comply with the user interfacerequirements set in section 413 the tool allows for the names of the data files to be inputted and the toolwill then adjust and overlay the data correctly Combining this program with the data plotting tool generatessome useful graphs Being able to generate lots of different representative data quickly will aid next years workwhen analysing different heat and electricity profiles
The optimised battery system model meets the three modelling requirements Code optimisation and easeof development (412) were crucial adding increased functionality through additional battery strategies and
Alexander Charles 28
7 CONCLUSIONS AND FUTURE WORKmetrics The performance required tomake the tool quick and easy for the designer was successfully achievedreducing the full simulation runtimedown to 200 seconds A user will be able to easily choose an energy profilethey want to simulate (preferably processed by the energy profile tool although not a requirement) and arange of battery specifications resulting in the output of graphs shown in the results An optimum battery canbe selected using different graphs and results produced thusmaking it a useful tool not only in understandingthe business case but also in aiding a designer in selecting the most appropriate battery
The tool will remain valid for other batteries and will is not limited to just the Tesla Powerpack This is due tothe specific parameters such as cycle life size power and price all being customisable in the model Also theassumptions made are mostly generic to Li-ion technology This will increase the functionality if the broaderrange of ESS systems is required although additional refinement is recommended
72 Conclusions on Temple Quarter Campus ResultsThe project confirms that there is a strong business case for investing in Li-ion storage when developing thenew TempleQuarter Campus From the shortlist of optimum Tesla Powerpack batteries all achieved a paybackperiod of fewer than seven years After the battery has paid itself back there is minimal input or costs arerequired to keep the storage system functioning Theoretically the battery continues to generate savingsbeyond the end of life thus increasing the value of the battery further
If the system is installed into the new campus the Powerpacks modular design will make it feasible to swapthe batteries out once they have worn-out or the technology has significantly improved Li-ion technologyhas improved significantly over the last ten years and will continue to do so following the rise in electric carownership
Referring to the challenges discussed in Table 1 the following can be concluded from the project on how theseseverity challenges have been overcome through research and modelling
bull Costs of purchase too high the model proves that finance is only required for seven years until thebattery pays itself back Since the battery will be purchased as part of the new campus assets along withthe buildings land and other equipment a very low-interest rate will be taken on the battery Within thisperiod the battery will be covered under warranty reducing the risk of the battery failing before returninga positive cash flow
bull Lifetime longevity of the battery too low research and modelling have identified that it is likely that thebattery will last up to or beyond the 25 year runtime period This can be achieved by controlling howthe battery is run preventing it from falling out of these boundaries Secondary analysis of the effects ofdepth of discharge and discharge rate confirm that most batteries should produce the value simulatedin the model
bull Frequent change to regulation and barriers to entry This is still the largest barrier to entry Discussionswith Western Power [77] noted that DUoS prices are very likely to change over this period where it is ex-pected that DUoS rates will decrease while capacity charge will increase consistently Due to the addedflexibility that fast frequency responses Li-ion battery offer it is in the energy suppliers interest to encour-
Alexander Charles 29
7 CONCLUSIONS AND FUTURE WORKage the customer to purchase this technology rather than penalise its use It is likely that further changein regulation will support the use of Li-ion batteries which could increase the batteries value further inthe future
bull Technology still maturing the model has made it clear that Li-ion is now ready to be used to reduce peakdemand
Finally along with being a financial asset using energy storage to reduce peak demand will help to reducethe Universitys emissions significantly The model forecasts that the new campus will use up to 18MWh ofelectricity a day during peak timesEliminating usage during this period would cut back energy producedfrom dirty fuel sources up to 576kg of C02 per day
73 Future WorkThe following work is suggested to improve the model
1 Further development is necessary to validate the degradation model Implementing the depth of dis-charge and discharge time calculations into the model will cause the validity of the results to improveThis can be integrated either through running the simulation twice using the mean values as the newend of life cycle counter or by creating an algorithm that calculates the effects on the fly
2 There is a lack of data on energy usagewithin university rooms particularly engineering and biology labscomputer rooms and lecture halls Due to this a simulation of thedifferencebetween a centralisedbatterysystem (modelled) anddecentralised system (where lots of smaller batteries are usedon a localisedbasis)could not be modelled This is an area of highly unexplored work where technologies such as the TeslaPowerwall could be used
3 An evaluation of other methods to increase the value of the battery such as capacity charges and FITshould be assessed
4 Research highlighted that a battery could be used to create a fixed demand profile for the new campusThe new campus will have to pay large upfront costs of planting supply lines to connect the campus tothe grid The ability to set the energy profile of the campus would dramatically reduce this cost Furtherresearchmay identify that the reduction in connection fee costsmay cover the upfront costs of the battery
Alexander Charles 30
REFERENCES
References[1] (Nov 2016) November new pound300 million campus will transform temple quarter | news | university of
bristol [Online] Available httpwwwbristolacuknews2016novembertemple-quarter-campushtml (visited on 08122016)
[2] S E GB (2016) The voice of the smart meter rollout [Online] Available httpswwwsmartenergygborgen (visited on 08122016)
[3] UoB (2016) Our vision our strategy [Online] Available httpwwwbristolacukmedia-librarysitesuniversitydocumentsgovernancepoliciesuniversity-strategypdf (visited on 08122016)
[4] P Cooper Project meeting with arup Personal Communications Nov 2016
[5] (2017) G b national grid status [Online] Available httpwwwgridwatchtemplarcoukindexphp(visited on 24032017)
[6] G Wright (Jan 2013) Reducing peak demand lowering prices but what about emissions [Online]Available http theconversation comreducing- peak- demand- lowering- prices - but - what - about -emissions-11564 (visited on 24032017)
[7] T Lea (Apr 2016) Part 1 attempting to measure and understand the co2 intensity of grid electricity -blog | openenergymonitor [Online] Available httpsblogopenenergymonitororg201604Understand-CO2-intensity-grid-electricity (visited on 24032017)
[8] J Brenton and C JonesMeeting Personal Communications Nov 2016
[9] (Feb 2014) Use of system charging statement [Online] Available httpswwwwesternpowercoukdocssystem-chargesUse-of-System2014SWEB-2014-2015aspx (visited on 10122016)
[10] (Sep 2012) Deconstructing your energy bill capacity charges [Online] Available httpwwwenergysmartenernoccomdeconstructing-your-energy-bill-capacity-charges (visited on 09122016)
[11] N Grid (2014) Triads why three is the magic number - national grid [Online] Available httpnationalgridconnectingcomtriads-why-three-is-the-magic-number (visited on 09122016)
[12] PCMG (2012) Tnuos (transmission network use of system) charges and triads [Online] Available http www pcmg co uk services energy tnuos - transmission - network - use - of - system - charges - and -triadshtmlL=02FRK3D02FRS3DL1v24MDxrTlEQk4XnNhR0chgJ14- (visited on 09122016)
[13] E Energy (2015) Tnuos chargepdf [Online] Available https wwweonenergycomfor - your- business large- energy- usersUnderstand- Energy~mediaPDFsFor- your- businessLarge- Energy-Users3rd20Party20ChargesTNUoS20chargepdf (visited on 09122016)
[14] S Electric (2007) Reducing energy costs with peak shaving [Online] Available httpswwwschneider-electriccomhkdocumentsenergy-efficiency-forumReducing-Energy-Costs-with-Peak-Shavingpdf(visited on 27112016)
Alexander Charles 31
REFERENCES[15] Baldor (2005) Energy management best practices energy management best practices - peak shaving
generators [Online] Available http wwwsustainableplant comassets WP00010 pdf (visited on30112016)
[16] S Barker A Mishra D Irwin P Shenoy and J Albrecht lsquoSmartcap flattening peak electricity demand insmart homesrsquo in 2012 IEEE International Conference on Pervasive Computing and Communications Mar2012 pp 67ndash75 doi 101109PerCom20126199851
[17] S B S Inc (2012) Reducing utility demand charges pdf [Online] Available httpwwwsbsbatterycomPDFsReducingUtilityDemandChargespdf (visited on 27112016)
[18] R T de Salis A Clarke Z Wang J Moyne and D M Tilbury lsquoEnergy storage control for peak shavingin a single buildingrsquo in 2014 IEEE PES General Meeting | Conference Exposition Jul 2014 pp 1ndash5 doi101109PESGM20146938948
[19] T R PoulsenMeeting with the university of copenhagen Personal Communications Jan 2017
[20] J Shen C Jiang Y Liu and J Qian lsquoAmicrogrid energymanagement systemwith demand response forproviding grid peak shavingrsquo Electric Power Components and Systems vol 44 no 8 pp 843ndash852 2016doi 1010801532500820161138344 [Online] Available httpdxdoiorg1010801532500820161138344
[21] C Priest Chris priest iodicus project correspondance Email Correspondance Jan 2017
[22] ABB (2016) Peak shaving [Online] Available httpwwwabb-energystoragesolutionscom_ga=112385165812952669031480518807 (visited on 30112016)
[23] T Sauter and M Lobashov lsquoEnd-to-end communication architecture for smart gridsrsquo IEEE Transactionson Industrial Electronics vol 58 no 4 pp 1218ndash1228 Apr 2011 issn 0278-0046 doi 101109TIE20102070771
[24] I One-Cycle Control (2012) Peak load reduction with lithium iron battery energy storage peak shaving[Online] Available httpwwwonecyclecontrolcomOCC-PLR-producthtml (visited on 07122016)
[25] G T Smedley lsquoDemonstration of one-cycle control peak load regulator (occ-plr) systemrsquo California En-ergy Commission Tech Rep 2013 [Online] Available httpwwwenergycagov2014publicationsCEC-500-2014-100CEC-500-2014-100pdf (visited on 07122016)
[26] E Telaretti and L Dusonchet lsquoBattery storage systems for peak load shaving applications part 2 eco-nomic feasibility and sensitivity analysisrsquo in 2016 IEEE 16th International Conference on Environment andElectrical Engineering (EEEIC) Jun 2016 pp 1ndash6 doi 101109EEEIC20167555795
[27] W Hu Z Chen and B Bak-Jensen lsquoOptimal operation strategy of battery energy storage system to real-time electricity price in denmarkrsquo in IEEE PES General Meeting Jul 2010 pp 1ndash7 doi 101109PES20105590194
Alexander Charles 32
REFERENCES[28] C J Bennett R A Stewart and J W Lu lsquoDevelopment of a three-phase battery energy storage schedul-
ing and operation system for low voltage distribution networksrsquo Applied Energy vol 146 pp 122 ndash1342015 issn 0306-2619 doi httpdxdoiorg101016japenergy201502012 [Online] AvailablehttpwwwsciencedirectcomsciencearticlepiiS0306261915001841
[29] IEA lsquoTechnology roadmap energy storagersquo International Energy Agency Tech Rep 2014 [Online]Available httpswwwieaorgpublicationsfreepublicationspublicationTechnologyRoadmapEnergystoragepdf
[30] E M G Rodrigues R Godina G J Osoacuterio J M Lujano-Rojas J C O Matias and J P S Catalatildeo lsquoCom-parison of battery models for energy storage applications on insular gridsrsquo in 2015 Australasian Univer-sities Power Engineering Conference (AUPEC) Sep 2015 pp 1ndash6 doi 101109AUPEC20157324861
[31] S R Deeba R Sharma T K Saha D Chakraborty and A Thomas lsquoEvaluation of technical and finan-cial benefits of battery-based energy storage systems in distribution networksrsquo IET Renewable PowerGeneration vol 10 no 8 pp 1149ndash1160 2016 issn 1752-1416 doi 101049iet-rpg20150440
[32] A Allik M Maumlrss J Uiga and A Annuk lsquoOptimization of the inverter size for grid-connected residentialwind energy systems with peak shavingrsquo Renewable Energy vol 99 pp 1116 ndash1125 2016 issn 0960-1481 doi httpdxdoiorg101016jrenene201608016 [Online] Available httpwwwsciencedirectcomsciencearticlepiiS0960148116307170
[33] J Leadbetter and L Swan lsquoBattery storage system for residential electricity peak demand shavingrsquo En-ergy and Buildings vol 55 pp 685 ndash692 2012 Cool Roofs Cool Pavements Cool Cities and CoolWorld issn 0378-7788 doi httpdxdoiorg101016jenbuild201209035 [Online] AvailablehttpwwwsciencedirectcomsciencearticlepiiS0378778812004896
[34] E Telaretti and L Dusonchet lsquoBattery storage systems for peak load shaving applications part 1 oper-ating strategy and modification of the power diagramrsquo in 2016 IEEE 16th International Conference onEnvironment and Electrical Engineering (EEEIC) Jun 2016 pp 1ndash6 doi 101109EEEIC20167555793
[35] J Malinowski and K Kaderly lsquoPeak shaving - a method to reduce utility costsrsquo in Region 5 ConferenceAnnual Technical and Leadership Workshop 2004 Apr 2004 pp 41ndash44 doi 10 1109REG5 2004 1300158
[36] O Lavrova F Cheng S Abdollahy H Barsun A Mammoli D Dreisigmayer S Willard B Arellano andC van Zeyl lsquoAnalysis of battery storage utilization for load shifting and peak smoothing on a distributionfeeder in new mexicorsquo in 2012 IEEE PES Innovative Smart Grid Technologies (ISGT) Jan 2012 pp 1ndash6doi 101109ISGT20126175723
[37] L C Hau and Y S Lim lsquoA real-time active peak demand reduction for battery energy storage with lim-ited capacityrsquo English Journal of Communications vol 11 no 9 pp 841 ndash847 2016 Battery energystorageBessControl strategiesEnergy storage systemsFundamental controlLimited capacityPeak de-mandSimulation evaluation issn 17962021 [Online] Available httpdxdoiorg1012720jcm119841-847
Alexander Charles 33
REFERENCES[38] B Aksanli T Rosing and E Pettis lsquoDistributed battery control for peak power shaving in datacentersrsquo in
2013 International Green Computing Conference Proceedings Jun 2013 pp 1ndash8 doi 101109IGCC20136604477
[39] S V Giannoutsos and S N Manias lsquoA cascade control scheme for a grid connected battery energystorage system (bess)rsquo in 2012 IEEE International Energy Conference and Exhibition (ENERGYCON) Sep2012 pp 469ndash474 doi 101109EnergyCon20126348200
[40] A Lucas and S Chondrogiannis lsquoSmart grid energy storage controller for frequency regulation and peakshaving using a vanadium redox flow batteryrsquo English International Journal of Electrical Power and En-ergy Systems vol 80 pp 26 ndash36 2016 Fast charging stationsFrequency regulationsGrid connectedsystemsGrid StorageMedium voltage substationsPeak shavingSmart gridVanadium redox flow bat-teries issn 01420615 [Online] Available httpdxdoiorg101016jijepes201601025
[41] Y Levron and D Shmilovitz lsquoPower systems optimal peak-shaving applying secondary storagersquo Elec-tric Power Systems Research vol 89 pp 80 ndash84 2012 issn 0378-7796 doi http dx doi org10 1016 j epsr 2012 02 007 [Online] Available http wwwsciencedirect comsciencearticle pii S037877961200048X
[42] Y Levron and D Shmilovitz lsquoOptimal power management in fueled systems with finite storage capacityrsquoIEEE Transactions on Circuits and Systems I Regular Papers vol 57 no 8 pp 2221ndash2231 Aug 2010issn 1549-8328 doi 101109TCSI20092037405
[43] H Chen T N Cong W Yang C Tan Y Li and Y Ding lsquoProgress in electrical energy storage systema critical reviewrsquo Progress in Natural Science vol 19 no 3 pp 291 ndash312 2009 issn 1002-0071 doihttpdxdoiorg101016jpnsc200807014 [Online] Available httpwwwsciencedirectcomsciencearticlepiiS100200710800381X
[44] Q Liao B Sun Y Liu J Sun and G Zhou lsquoA technoeconomic analysis on nas battery energy storagesystem supporting peak shavingrsquo International Journal of Energy Research vol 40 no 2 pp 241ndash247Feb 2016 issn 1099-114X doi 101002er3460 [Online] Available httphttpsdxdoiorg101002er3460
[45] B Dunn H Kamath and J-M Tarascon lsquoElectrical energy storage for the grid a battery of choicesrsquo Sci-ence vol 334 no 6058 pp 928ndash935 2011 issn 0036-8075 doi 101126science1212741 [Online]Available httpsciencesciencemagorgcontent3346058928
[46] B Garg (2012) Introduction to flow batteries theory and applications [Online] Available httplargestanfordeducourses2011ph240garg1 (visited on 30112016)
[47] B Univeristy (2016) Comparison table of secondary batteries [Online] Available httpbatteryuniversitycomlearnarticlesecondary_batteries (visited on 30112016)
Alexander Charles 34
REFERENCES[48] A Choudar D Boukhetala S Barkat and J-M Brucker lsquoA local energy management of a hybrid
pv-storage based distributed generation for microgridsrsquo Energy Conversion and Management vol 90pp 21 ndash33 2015 issn 0196-8904 doi httpdxdoiorg101016jenconman201410067 [Online]Available httpwwwsciencedirectcomsciencearticlepiiS0196890414009625
[49] (2017) Powerpack | commercial and utility energy storage solutions [Online] Available httpswwwteslacomen_GBpowerpack (visited on 29032017)
[50] S M Knupfer R Hensley P Hertzke and P Schaufuss lsquoElectrifying insights how automakers can driveelectrified vehicle sales and profitabilityrsquo Mckinsey amp Company Tech Rep 2017
[51] (2017) Net present value - npv [Online] Available httpwwwinvestopediacomtermsnnpvasp(visited on 24032017)
[52] P Y-D Lyuu Numerical methods for yields Lecture Slides 205 [Online] Available httpswwwcsientuedutw~lyuufinance1200520050302pdf (visited on 24032017)
[53] N DiOrio A Dobos and S Janzou lsquoEconomic analysis case studies of battery energy storage with samrsquoNational Renewable Energy Laboratory Denver CO USA 2015
[54] R Spotnitz lsquoSimulation of capacity fade in lithium-ion batteriesrsquo Journal of Power Sources vol 113no 1 pp 72ndash80 2003 [Online] Available http www sciencedirect com science article pii S0378775302004901
[55] (2013) The importance of testing pv batteries to the iec 61427 standard [Online] Available httpwwwtrojanbatterycompdfRE_IEC_61427_Standardpdf (visited on 27032017)
[56] C Lilly (Feb 2016) Renault to recycle evbatterieswith energy storage firm - zap-map [Online] Availablehttpswwwzap-mapcomrenault - to- recycle- ev-batteries-with- energy- storage- firm (visited on26032017)
[57] P Rong and M Pedram lsquoAn analytical model for predicting the remaining battery capacity of lithium-ionbatteriesrsquo IEEE Transactions on Very Large Scale Integration (VLSI) Systems vol 14 no 5 pp 441ndash4512006 [Online] Available httpdxdoiorg101109DATE20031253775
[58] (2017) Weather averages for london united kingdom [Online] Available httpwwwholiday-weathercomlondonaverages (visited on 25032017)
[59] () Battery life and how to improve it [Online] Available httpwwwmpowerukcomlifehtm (visited on15032017)
[60] (2015) Tesla will use different batteries for its grid products heres why [Online] Available http fortunecom20150518tesla-grid-batteries-chemistry (visited on 28032017)
[61] () Effects of discharge rate and temperature on battery capacity and life | engineers edge [Online] Avail-able http wwwengineersedge combattery discharge_ rate_ temperature_effects _battery htm(visited on 15032017)
Alexander Charles 35
REFERENCES[62] () Premature voltage cut-off - battery university [Online] Available httpbatteryuniversitycomlearn
articlepremature_voltage_cut_off (visited on 15032017)
[63] (2016) Battery performance characteristics - how to specify and test a battery [Online] Available httpwwwmpowerukcomperformancehtm (visited on 28032017)
[64] N Omar M Daowd P v d Bossche O Hegazy J Smekens T Coosemans and J v Mierlo lsquoRe-chargeable energy storage systems for plug-in hybrid electric vehicles---assessment of electricalcharacteristicsrsquo Energies vol 5 no 8 pp 2952ndash2988 2012
[65] N Omar P V d Bossche T Coosemans and J V Mierlo lsquoPeukert revisited---critical appraisal and needfor modification for lithium-ion batteriesrsquo Energies vol 6 no 11 pp 5625ndash5641 2013
[66] S S Choi and H S Lim lsquoFactors that affect cycle-life and possible degradation mechanisms of a li-ioncell based on licoo2rsquo Journal of Power Sources vol 111 no 1 pp 130 ndash136 2002 issn 0378-7753 doihttpdxdoiorg101016S0378-7753(02)00305-1 [Online] Available httpwwwsciencedirectcomsciencearticlepiiS0378775302003051
[67] () Charging lithium-ion batteries -- battery university [Online] Available httpbatteryuniversitycomlearnarticlecharging_lithium_ion_batteries (visited on 15032017)
[68] B Xu A Oudalov A Ulbig G Andersson and D Kirschen lsquoModeling of lithium-ion battery degradationfor cell life assessmentrsquo IEEE Transactions on Smart Grid 2016
[69] () Zero-dmodelling approachwith ansys products | valeacuterie gelbgras | pulse | linkedin [Online] Availablehttpswwwlinkedincompulsezero-d-modelling-approach-ansys-products-valC3A9rie-gelbgras(visited on 17032017)
[70] CIBSE Combined Heat and Power for Buildings - CIBSE AM12 2013 (2nd Edition) CIBSE 2013 isbn978-1-906846-30-5 [Online] Available httpappknovelcomhotlinktocidkpCHPBCIB1combined-heat-power-buildingscombined-heat-power-buildings
[71] lsquoTriads dates and times 2014 - 2015rsquo National Grid Tech Rep 2015 [Online] Available httpwww2nationalgrid comUK Industry - informationSystem- chargesElectricity - transmissionTransmission -Network-Use-of-System-ChargesTransmission-Charges-Triad-Data
[72] (Jul 2015) Charging for optimum battery life [Online] Available httpsforumsteslacomen_GBforumforumscharging-optimum-battery-life (visited on 26032017)
[73] (Feb 2016) Used renault ev batteries to be recycled into energy storage systems [Online] Availablehttpwwwfleetnewscouknewsenvironment20160205used-renault-ev-batteries-to-be-recycled-into-energy-storage-systems (visited on 26032017)
[74] PGetreuer lsquoWriting fastmatlab codersquoMathworks File Exchange5685 2009 [Online] Available URLhttpwwwmathworkscommatlabcentralfileexchange5685
[75] () Live data | sustainability at princeton [Online] Available httpsustainprincetonedulablive-data(visited on 18032017)
Alexander Charles 36
REFERENCES[76] AECOM lsquoHeat networks code of practice for the ukrsquo CIBSE Tech Rep 2015
[77] M Watson and M DaleWestern power discussion Meeting Minutes Mar 2017
[78] (2017) United kingdom inflation rate | 1989-2017 | data | chart | calendar [Online] Available httpwwwtradingeconomicscomunited-kingdominflation-cpi (visited on 22032017)
Alexander Charles 37

4 BATTERY MODEL DEFINITION
1050 15 20
Time Hours
150
200
250
300
350
400
0002800016
024
Use
ag
e kW
h
Un
it C
ha
rge
Price
pound
WeekendWeekdays
Average of Usage Data For Senate House Weekends vs Weekdays
Figure 42 Plot of Mean Senate House Weekday and Week-end Usage and Difference in Unit Charge Rates
Senate House date described half-hourly usagebetween 10082014 and 10082015 A bill wasalso provided for a months energy usage at the Vic-toria rooms i A meeting with John Brenton [8] cla-rified that billing profiles for both buildings wereidentical To gauge the size and power requirementsof a battery system for Senate House a minute byminute energy profile was required Correspondingthis energy profile with a bill identified how energyconsumption correlated with the cost This allowedquick sensitivity calculations to select strategies likelyto have the greatest impact
Plots of the data were used to visualise key trends inenergy consumption It was clear that there is a significant difference between energy demand during theweekend and during the week shown in 42 where total energy consumption was found to be three timesgreater over weekdays than the weekend It was vital that all these trends are replicated in the creation ofrepresentative energy profiles
43 Representative Bill CreationSection 22 described the components of the energy bill Its clear that Red rate charges are a significantcharge which an ESS can target incorporating ~20 of the bill To highlight the significance of the Red ratecharge Figure 42 shows the difference in DUoS rates A preliminary model was designed to target Red ratecharges only through load shifting Using Senates half-hourly data DUoS rate charges and unit charges werecalculated The energy profile was scanned to find the start date of the bill assigning weekends weekdaysaccordingly (crucial as Red rate charges arent applicable on weekends) By creating a counter that loopedthrough each half hour period logic was applied to categorise each half hour period into their respective unitrate Total units consumed in Red Amber and Green periods were found where simple calculations revealedthe effect load shifting could have This crude model captured 79 of the monthly energy bill charges
44 Representative Demand ProfileBoth power and capacity must be considered to simulate how a battery performs Applying too much loadon a battery can severely reduce the batterys cycle life discussed in section 33 Due to the lack of availabledemand data from the University assumptions were made to generate a valid demand profile based on theoriginal half-hourly usage profile
First the usage data was broken down into a minute by minute representation By using linear interpolationan identical looking graph of the original data was created containing 1440 points representing each minute
iA Bristol University building used for lecturing offices and teaching classes see Figure 82 for the Bill provided
Alexander Charles 13
4 BATTERY MODEL DEFINITION(see Figure 43) This graph was then downscaled to give usage per minute (validated by summing all thepoints and comparing to the original data)
This crude profile however assumed that all usage varies linearly between time periods In reality this is nottrue Amore realistic demandprofilewas then created by finding themidpoint between values and assigning arandom normally distributed number in intervals of 10 minutes Choosing an interval too small would deviatethe total usage away from the original while too big would subdue the shape of the graph This methodmodelled how usage varied randomly minute by minute similar to items being turned on and off frequentlyin a building but maintained the original datas consumption trend A standard deviation σ was then selectedwhich would reasonably represent the change in usage over time For σ to be valid for a variety of differentmagnitudes in data the value was trailed against a range of different data sizes It was found that by assigningσ as a function of average usage and max usage gave a fair but conservative representation of how energyusagemay look Scaling by a factor of 60 converted usage from kWh to demand kW producing a graphwhichshowed the peaky nature of energy demand for Senate House By integrating the area under the demandcurve this graph was validated against the original data
Assumptions Usage will have a peaky profile due to a large number of individuals in the buildings frequentlyswitching numerous devices on and off For an office style building like Senate it is unlikely that there is anyhigh-energy-consuming equipment that could cause a major spike in demand
12-Aug-2014
0 200 400 600 800 1000 1200 1400
Time Mins
10
15
20
25
30
35
40
45
Use
ag
e
kWh
20
30
40
50
60
70
80
90
De
ma
nd
kW
Date Plot of Original Useage and Demand
0 200 400 600 800 1000 1200 1400
Time Minutes
05
1
15
Use
ag
ek
Wh
Date Plot of Live Use Fit Against Minute Resoultion
0 200 400 600 800 1000 1200 1400
Time Minutes
20
30
40
50
60
70
80
90
De
ma
nd
kW
Date Plot of Live Demand Fit Against Minute Resoultion Plot of Frequency of Energy Demand Over a Year
0 20 40 60 80 100
DemandkW
0
05
1
15
2
25
Fre
qu
en
cy
104
Figure 43 Plots of Usage and Demand Profile Generation and Histogram of Year DataTo fully understand the energy profile histograms and cumulative distribution plots j were used to identifythe typical demand Senate House sees over the year as well as the max demand the building experiences[70] Figure 43 shows the demand profile of Senate House providing insight into what requirements maybe needed by a battery system It can be observed from in the histogram that the demand of the Senate
jSee Figure 84 in the appendix to see Senate Houses load profile
Alexander Charles 14
4 BATTERY MODEL DEFINITIONHouse typically falls between two points One low peak representing morning and evening of 30KW and asecond peak constituting the energy usage in the middle of the day averaging around 80KW but rarely everexceeding 90KW Insights from the load profile also identified a battery rated at 40KW would cover 5000hours of the year roughly 55 of the years usage
45 Definition of the New Temple Quarter CampusUnderstanding the requirements new campus was necessary tin creating valid assumption about its energyprofile At the time of writing this report no building plans were available Instead many assumptions aboutthe likely size and use of the campus were used to create a representative energy profile k
The campus will be designed for ~1500 resident students having ~5000 staff and students on site during term-time A range of facilities have been proposed for Temple Quarter Campus where it is likely that the campuswill constitute largely of tutorial rooms a few lecture halls and offices A meeting with John Brenton [8] madeclear that creating an infrastructure that supports postgraduate business studies made the most economicalsense and is likely to influence the Campuss design
As the proposed tutorial rooms and office will be similar to Senate House it is assumed that these energy pro-files will be transferrable to the new campus It is unlikely that the new campus will have any equipment thatwill greatly distort the load profile rather it is likely that the campus will have improved efficiency through em-ploying the latest technologies in its construction and services (HVAC) Data on 125 rooms in halls of residencewas also provided with a higher degree of certainty of its applicability to the new campus Footprints of bothbuildings were combined with laboratory data testing the effects labs may have on any large spikes in energyusage The final scaling factors used were
bull Senate House (7840sqm) - 79xbull Hall data (2761sqm) - 76xbull Lab data (1 Lab Use) - 4x
451 Energy Profile ToolDue to energy usage data files beginning on different dates and running for various periods of time these re-cords required adjustments to be correctly scaled and combined To fully meet the projects outputs andmod-elling requirements a program was created to manipulate various half-hour energy usage files An algorithmwas set up to read the data dates and then convert this data into a realistic demand profile To simulate life-time energy usage copies of the energy profile were concatenated for the length of simulation checking thateach year began on the next day in the week from the end of the previous year It was imperative that datesaligned to make sure results were valid as the difference in energy usage between weekdays and weekends(see section 42) could cause the total savings to vary on a seven-year cycle pattern Figure 44 outlines thelogic of this program
kSee Table 6 In the appendix for a breakdown of how the new campus was sized
Alexander Charles 15
4 BATTERY MODEL DEFINITION
Read Master Start Date
Read Secondary Start Dates
Find Difference Between Two Dates
Align
Split Data to Align Days and Months
Switch Data Splits and Join
Check Days with Master
Shift Dates Back One Day
InputHalf Hourly Energy Usage Data
Output Scaled and Combine Data
Create Minute by Minute Granularity
Usage Data
Add Random Normally Distributed Variablitlity into
Data
Create Demand Profile for Data
Extrapolate Profiles for Batteryrsquos Lifetime
Yes
Yes
End Of Data Files
No
While Data Files
Unprocessed
Figure 44 Logic of Energy Profile Tool Create New Campus Data
46 Definition of System StrategiesTo fully understand the value of using battery storage representative simulations of how the battery wouldoperate is required This section defines the logic of the batterys operation The model calculates both eco-nomical and technical battery performance based on the chosen battery strategies The following section willdiscuss why the final strategies were selected detailing their development
461 Red Rate Charge Avoidance StrategyAs outlined in section 43 using energy consumed during Red rate periods was considerably more expensivethan Amber and Green periods making it a primary strategy By switching the battery on during Red rateperiods then charging during Green periods cost savings of up to 20 could be made Currently for theUniversity Red rates apply between 5 and 7 PM on weekdays making it simple to forecast alleviating the needfor complex prediction systems highlighted in section 241 During this period the battery would be drainedat a rate up to its maximum output power requiring demand and usage data to be checked simultaneouslyIf the load exceeded max power energy supply was capped at this value The battery would continue to bedrained until either its minimum capacity was reached or the Red rate period elapsed The battery would thenbe fully charged during Green ensuring all capacity was available for the next Red rate period entered Thismethod was repeated for the run-length of the simulation
462 Triad Avoidance StrategyTo correctly understand the effects of TRIAD avoidance in the model TRIAD dates needed to be correctlyidentified Using [71] the dates 41214 190115 020215 were used aligning with the original SenateHouse data set as the master template for the new campus (discussed in section 451) These dates wereused for the sequential years in the simulation as they were typical days in which TRIADS would fall Fromobservation it was assumed that therewas no increase in theUniversitys usageduring TRIADperiods allowingany day within that week to be used To make sure these dates did not fall weekends days were checked and
Alexander Charles 16
4 BATTERY MODEL DEFINITIONadjusted accordingly It is assumed that daily variation in energy usage is negligible and instead energy trendsare seen only on a monthly basis
It was observed that TRIAD times all fell into Red rate periods corresponding with the Red rate avoidancebattery strategy Using these dates and the time of 530 pm the TRIAD cost was calculated based on energydemand (kW) Battery usage was thenmeasured against the TRIAD cost to understand the reduction in energydemand delivered by the battery The reduction in TRIAD rate was a factor of the batteries max power supplyand not capacity as the battery would only need to run for a few minutes to offset this charge
At the end of each year in the simulation usage on the three TRIAD dates was averaged to find the total costThis was then spread evenly over the next year in the simulation representing how TRIAD billing is split acrosseach monthly energy bill
463 Battery Control StrategyThe importance of optimising battery longevity was highlighted in 241 and 243 Section 33 discussed thedifferent variables which can affect a batterys longevity An approximation of battery degradation was takentaking into account the effect of each of these variables as a battery control strategy
The rated battery cycle life is taken as the number of full cycles a battery can complete before it degrades to80 of its original capacity l This value was used to measure how the battery should perform based on anormal use case With this assumption batteries were degraded at a level proportional to the fraction of itscurrent cycle
Dead Capacity
Battery Degredation
MaxCap
MinCap
CurrentCharge
Full Cycle Current
Size
Figure 45 Showing Battery De-gradation
For each charging iteration the new max capacity becomes slightly smaller re-ducing the size of the cycle A counter was used to sum each charge resettingwhen its value equalled the current cycle size indicating one complete cycleWith this method batteries were degraded based on their use thus degrad-ing quicker as they deteriorate This followed the cell cycle degradation trendshown in figure 32
By using the cycle-life metric all battery degradation assumptions were basedon the batterys operation and not the batterys chemistry Assumptions on thebatteries normal working parameters were made limiting the battery to con-form to these rules This would prevent the battery running in a way that wouldmajorly affect its longevity making the prediction more accurate These restric-tions could be adjusted at the expense of a greater or smaller chance of erroron the perdition of battery health The following battery control measured wereimplemented
bull Reduction in Depth of Discharge To reduce wear on the battery the battery was confined to work within10-90 of its current maximum capacity allowing a maximum depth of discharge of 80 Draining the
lThis is quoted to be 5000 cycles for the Tesla Powerpack see Figure 2
Alexander Charles 17
4 BATTERY MODEL DEFINITIONbattery can cause detrimental effects while overcharging can also do the same Working within thesetwo parameters follows similar principles applied by Tesla in their electric cars [72]
bull Speed of Depletion A battery was never run above its max specified power As the battery was ratedat this value it should be designed to cope with this level of use for no longer than 2 hours a day Thesimulation will analyse the average discharge rate as a measure of the validity of the battery health
bull Temperature Based on the assumptions made in section 331 it was assumed that the temperaturewould remain within expected bounds Using the Red rate and TRIAD strategies would allow the batteryto cool over weekends
bull Charging The battery would only charge during Green periods at a rate which would ensure it to befully charged by the next Red period this was based on the capacity required divided by the length ofthe Green rate period Section 334 suggested that charging at a lower speed particularly during thelast 10 of charge made a large impact on the battery lifetime It is assumed here that smart chargingtechniques such as trickling (seen on most modern smartphones) would be incorporated into the ac-tual battery but modelling these methods would not increase the accuracy of the model so has beenneglected
bull Battery Efficiency This was incorporated into themodel bymultiplying the energy drawnwhen chargingby the additional losses caused inefficiencies This assumption was made as it is likely that the batteryonce charged can supply what it has stored The Powerpack 2 integrated inverter supplies energy in ACquoting its efficiency to this level (see figure 2) It is assumed that the quoted figure is representative ofthe batterys efficiency in the system Efficiency gains could also be achieved by designing the systemso it that primarily sends power to DC first without transforming This will not be evaluated in this projectsee Figure 2
Table 2 Tesla Powerpack 2 Specification
Capacity (Per Pack) 210 kWh (AC)
Power (Per Pack) 50 kW (AC)
Net System Efficiency 88 round-trip (2 hour system)
89 round-trip (4 hour system)
Operating Temperature -30degC to 50degC
Scalable Inverter Power from 50kVA to 625kVA (at 480V)
Depth of Discharge 100
Cycle Life 5000 Cycles
Warranty 10 Years
AC Voltage 380 to 480V 3 phases
Additional Features bull Bi-Directional Inverter (Inbuilt)
bullThermal Controller
bull Modular Scalable Design
Powerpack 2 Specifications
The model was run until either runtime elapsed or the batteryreached its end of life value (80) allowing results to be com-parable There are examples of batteries being used beyondtheir end of life cycle Renault and Connected Energy havebeen investigating the use the end of life Li-ion car batteriesin home applications [56] [73] It is believed that there is stillplenty of life remaining and the increased probability of fail-ure is less of a problemwhen used for bill reduction purposesIn the case of the new campus there are few associated costswith batteries after they have been installed If the battery haspaid itself back the battery will continue to generate profitUnpredictability may be seen as an issue potentially the case for emergency power applications Analysingthis value is out of the scope of this project therefore an end of life battery is classed as having no value
Alexander Charles 18
4 BATTERY MODEL DEFINITION
47 Input Parameters and Multi-Battery SimulationTo understand the optimum battery type for a given scenario and then infer the total savings that the batterycould generate a large array of different batteries with different power ratings and capacities were modelledUsing actual data from Tesla [49] the real costs of the different battery specifications were modelled To findtrends in the different battery types it was required to iterate through numerous different battery specificationsTo reduce computation time parallel computing was implemented to iterate each discrete battery scenario inthe 0D model
The following diagram depicts the model of the entire multi-battery system
Input Powerpack Specification List
Process File Extract Max Power Capacity and Cost
Input Energy Profile
Run Energy Profile ToolOutput Demand and
Usage Profile
For Input Powerpack
Specification
Set Battery Control Measures Pricing and
TRIAD Dates
While Remaing Battery Life and
Runtime
Output Battery Health Payback Time Savings
Aggregate Data and Produce Plots
Assign TRIAD Days for next
year
If Year
Elapsed
For Mintues in current day
Assign Unit Charge Rate (RedAmber Green)
Charge or Deplete Battery based on capacity
and rate
Calculate Original Cost and Savings
If Charging
If TRIAD
Capture Power Demand
Calculate Previous Years TRIAD charge
Reduce Maximum
Battery Capacity
Calculate charge levels and cycle life
Yes
Yes
ElseEnd of
Day
Next Minute
End of Life RunTime
Next Battery
All Batteries Simulated
Else
Else
Yes
Yes
Figure 46 Logic Diagram For Multi-battery Simulation
To comply with the requirements set in section 41 the following methods were used to optimise the perform-ance of MATLAB model
bull Vectorisation storing data within multidimensional arrays and using vector operationsbull Variable Initialisation all matrices were initialised to reduce memorybull MATLAB Function Reduction functions such as linear interpolation are cumbersome These were recre-ated and simplified solving tasks more efficiently
bull Parallel Processing Multiple cores on the processor were used to iterate through independent batteryspecifications in large multi-battery simulations To achieve this successfully the code was rewritten tomake all events discrete substituting techniques such as and For large multi-parametersimulations this can increase the processing time significantly
Alexander Charles 19
5 VALIDATION OF MODELbull Profiler Tool Within MATLAB the performance of code can be measured by the amount of time it takesto run This tool was used to identify bottlenecks within the model
bull Single Integers Single integers are half the size of double integers MATLABs default storage methodDouble-precision floating point numbers allow the CPU to handle very large values As this level ofaccuracy is unnecessary use of 32bit single integers was used as they increased performance [74]
bull Do Not Repeat Yourself (DRY) Coding technique to improve readability and performance of the codethrough the use of functions
The result of this method reduced the processing time of each battery from~110 seconds to under 10 secondsThis was crucial to allow 65 different simulations run quickly The runtime of the multi-scenario program wasreduced to 200 seconds This allowed different sensitivity studies to be run greatly improving the functionalityof the tool
5 Validation of Model
51 Data FileBy using the model with real data first taken from Senate House the tool which creates live data could bevalidated through integration and direct comparison to the original usage data As no data could be gatheredon actual demand for Senate house assumptions were made on the type of operations the building fulfils (seethe table below) this was compared to demand data at Princeton [75] Section 4 describes how the modelwas initially tested on Senate House to validate whether the model produced expected results After beingvalidated on Senate House the model was then run with the new campus energy profile
52 Assumptions and LimitationsTable 3 summarises all the assumptions discussed in section 4 To create a valid model all assumptions mustbe based on logical expectations of all parameters that may affect the system Thereby using the followingassumptions the model is validated
Table 3 Showing All Assumptions Made for Simulation
bull The new campus overall energy profile will have small peaks in demand only due it being very unlikely for lots of equipment with high power consumptions to be switched on together
50
bull Energy demand is assumed to be normally distributed between each half hour period 20bull Standard deviation of energy demand equals average between mean and max of data following the assumption that peaks sizes are proportional to the total demand
40
bull Daily variation negligible in energy usage is negligible assume profile is unlikely to change over battery lifetime
20
bull New campus profile is formed of Senate House Hall data and Lab data only scaled according to their total footprint size
30
bull Red rate periods remain the same for the duration of the simulation 50bull Energy prices and bills remain the same for the duration of the simulation 90bull TRIAD dates kept as close as possible to 41214 190115 020215 (no weekends used) 20bull TRIAD Bills are divided equally over the next billing year 10bull Battery degrades linearly from new to its end of life value of 80 20bull Battery parameters restrict battery to perform under normal use case 5000 cycles for a max depth of discharge of 80
40
bull Battery does not overheat is temperature controlled and allowed to cool over weekends so does temperatures effect is assumed reliable
20
bull Effect of depth of discharge and discharge rate on battery health is negligible based on normal constraints (effects discussed as secondary results)
80
bull Normal working parameters prevent over depletion or over charging from occurring 10bull Battery cycle life instantaneously degrades when charging 10bull Battery efficiency losses occur only when charging 20bull Trickle charging and minimum charge rate employed 10bull Battery has health monitoring equipment allowing its health to be optimised 20bull Current Powerpack 2 costs are used to evaluate the cost of the investment Assumed that the price will decrease and performance of batterys will improve at the time of the new campus build Current costs are therefore used as a worst case scenario
5
bullInstallation costs have been assumed negligible due to new campus build absorbing this 30bull Maintenance cost assumed not applicable as this cost will be very small 30
Assumptions Uncertainty
Batt
ery
Hea
lthBa
tter
y U
sage
Batt
ery
Cost
sEn
ergy
Pro
file
Ener
gy
Billi
ng
Alexander Charles 20
6 RESULTS
bull The new campus overall energy profile will have small peaks in demand only due it being very unlikely for lots of equipment with high power consumptions to be switched on together
50
bull Energy demand is assumed to be normally distributed between each half hour period 20bull Standard deviation of energy demand equals average between mean and max of data following the assumption that peaks sizes are proportional to the total demand
40
bull Daily variation negligible in energy usage is negligible assume profile is unlikely to change over battery lifetime
20
bull New campus profile is formed of Senate House Hall data and Lab data only scaled according to their total footprint size
30
bull Red rate periods remain the same for the duration of the simulation 50bull Energy prices and bills remain the same for the duration of the simulation 90bull TRIAD dates kept as close as possible to 41214 190115 020215 (no weekends used) 20bull TRIAD Bills are divided equally over the next billing year 10bull Battery degrades linearly from new to its end of life value of 80 20bull Battery parameters restrict battery to perform under normal use case 5000 cycles for a max depth of discharge of 80
40
bull Battery does not overheat is temperature controlled and allowed to cool over weekends so does temperatures effect is assumed reliable
20
bull Effect of depth of discharge and discharge rate on battery health is negligible based on normal constraints (effects discussed as secondary results)
80
bull Normal working parameters prevent over depletion or over charging from occurring 10bull Battery cycle life instantaneously degrades when charging 10bull Battery efficiency losses occur only when charging 20bull Trickle charging and minimum charge rate employed 10bull Battery has health monitoring equipment allowing its health to be optimised 20bull Current Powerpack 2 costs are used to evaluate the cost of the investment Assumed that the price will decrease and performance of batterys will improve at the time of the new campus build Current costs are therefore used as a worst case scenario
5
bullInstallation costs have been assumed negligible due to new campus build absorbing this 30bull Maintenance cost assumed not applicable as this cost will be very small 30
Assumptions Uncertainty
Batt
ery
Hea
lthBa
tter
y U
sage
Batt
ery
Cost
sEn
ergy
Pro
file
Ener
gy
Billi
ng
Themodel is limited to working with these parameters only Section 412 set an objective for the model to bedeveloped so these parameters can be easily changed allowing for themodel to be easily customised to workwith a different set of assumptions Modelling peaks in demand higher than those expected energy pricingchanging andDODanddischarge rate effect on capacity all have high levels of uncertainty in themodel Thesewere sensitivity checked to understand the effects of these assumptions being incorrect
6 ResultsThe objective of this report was to evaluate whether there is a strong business case for investing in energystorage technology for the New University Campus This section analyses the data gathered from the zero-dimensional model discussing the value which optimum battery specifications could bring to the new TempleQuarter campus Figures 61 and 62 describes the energy profile for the new campuss usage during Red rateperiods
Plot of Frequecy of Total Daily Red Rate Usage A Over a Year
600 800 1000 1200 1400 1600 1800
UsagekWh
0
2
4
6
8
10
12
14
16
18
20
Fre
quency
Figure 61 Histogram Showing Red Periods Total Daily Us-age Frequency
0 20 40 60 80 100
Time Spent at Load Over A Year
200
300
400
500
600
700
800
900
1000
1100
Po
we
r D
em
an
d
kW
Load Duaration Curve For Red Rate Demand Over a Year
Figure 62 Time Spent at Power Demand Level
Alexander Charles 21
6 RESULTSThese energy profile plots describe the range of battery specifications which should be simulated Figure61 shows how a battery with a usable capacity greater than ~1800kWh will have excess capacity to demandBy taking into account end of life degradation batteries with an end of life capacity of up to 2000kWh weremodelled Figure 62 describes the percentage of time the battery would spend atmax load A battery rated at920kWwould only be run at max load 10 of the time As discharge rate effects capacity batterys rated up to1300kWwere simulated Based on this analysis 65 different Powerpack 2 battery specifications were identifiedas plausible solutions
A 25 year runtime period was used to evaluate the battery performance overm chosen on the assumptionthat most technology in the building will be replaced by this point as the building begins to receive somerefurbishment Li-ion battery technology will also have significantly advanced or at least drop significantlyin price n Using a set period will also reduce uncertainty in battery health and prevent favouritism for largerbatteries An investor is unlikely to look beyond 25 years so savings made after these periods will not beconsidered The following results will talk through the three key value measurements discussed in section 32
61 Total Savings and Payback Period ResultsFigure 63 shows the parabolic shape with a local maximum between the battery size and the total savings Forthe new campus a battery size of around ~22MWh generated the maximum total savings over the simulationrun time In contrast Figure 64 highlights that amuch larger rangeof batteries fell close to the shortest paybacktime of 63years where power and capacity increased proportionally
0 500 1000 1500 2000
Battery Size kWh
02
04
06
08
1
12
14
16
18
2
Tota
l Savi
ng
106 Battery Size vs Total Saving
200
400
600
800
1000
1200
Max
Pow
er
kW
Max Fit Curve
Figure 63 Battery Size Vs Total Savings
0 500 1000 1500 2000 2500
Battery Size kWh
6
8
10
12
14
16
18
20
22
Pa
yba
ck T
ime
Y
ea
rs
Battery Size vs Payback Time
200
400
600
800
1000
1200
Max
Pow
er
kW
Max Fit Curve
Figure 64 Graph of Battery Size vs PayBack Time
Figures 63 and 64 begin to give a good insight into the financial performance of the battery Howeverpresented in this form it difficult for a designer to choose the optimum battery To make the results moreuseful an algorithm was made which generated best-fit plots over the maximum battery specifications forthe different total saving and payback time plots Figures 65 shows these curves plotted over the maximumvalues
mSee Page 27 of [76]nSee Figure 31 for a prediction in battery prices
Alexander Charles 22
6 RESULTS
500 1000 1500 2000 2500
Battery Size kWh
05
1
15
2
Tota
l Savi
ngs
pound
106 Battery Size vs Total Saving (Cond)
Max Fit Curve
0 500 1000 1500 2000 2500
Battery Size kWh
6
65
7
75
8
85
Payb
ack
Tim
e Y
ears
Battery Size vs Payback Time (Cond)
200
400
600
800
1000
1200
Ma
x P
ow
er
kW
Max Fit Curve
200 400 600 800 1000 1200 1400
Max Power kW
0
05
1
15
2
Tota
l Savi
ngs
pound
106 Max Power vs Total Saving (Cond)
Max Fit Curve
0 200 400 600 800 1000 1200 1400
Max Power kW
6
65
7
75
8
85
Payb
ack
Tim
e Y
ears
Max Power vs Payback Time (Cond)
500
1000
1500
2000
Ba
tte
ry S
ize
kW
Max Fit Curve
Figure 65 Graph Showing Top 40 Batteries with Fitted Curves for both Payback Time and Total Savings
By superimposing these max-fit curves a graphical tool was created allowing a designer to visualise thetradeoff between total savings and payback time shown in Figure 66 A small region around the crossoverpoint of the two plots shows the specifications of the optimum batteries By creating a set of rules (eg thebattery must have a payback period less than seven years) all the solutions become immediately apparent Asmall shortlist of the batteries can be made referring to the original list of Powerpack specifications
0 500 1000 1500 2000 2500
Battery Size kWh
06
08
1
12
14
16
18
2
Tota
l Savi
ngs
pound
106
62
64
66
68
7
72
74
76
78
8
82
Payb
ack
Tim
e Y
ears
Comparision of Top Batteries based onSize for Payback Time And Total Savings
0 200 400 600 800 1000 1200 1400
Max Power kW
04
06
08
1
12
14
16
18
2
Tota
l Savi
ngs
pound
106
6
65
7
75
8
85
Payb
ack
Tim
e Y
ears
Comparision of Top Batteries based onMax Power for Payback Time And Total Savings
1862kWh1662kWh
1762kWh175
645173
8444kW
7444kW
Figure 66 Comparison Between Fit Curves for Payback Period and Total Savings
The regions of the best trade-off between payback time and total savings (aroundwhere the twoplots intersect)are highlighted in Figure66 The results show that a battery around 1762kWh and 7444kW produces a goodcompromise Increasing capacity beyond this would increase total savings thus quickly decreasing pay backperiod Alternatively when looking at max power payback time increases slightly as power decreases Uptop 950kW total savings dramatically increase with very little decrease in payback time The green regionhighlights the area after the intersection point This shows that a battery larger than 745kW but smaller than950kW is optimum
Alexander Charles 23
6 RESULTSMeasuring the payback period is necessary when evaluating the risk of investing in a battery The longer thepayback time the greater the risk in either the battery failing or regulation changing diminishing the batteriesvalue o The Powerpack 2 specifications modelled have a ten-year warranty this eliminates any risk if thebattery were to fail before this period Changes in energy billing are therefore the biggest risk the technologyfaces Energy contracts typically last no longer than four years [77] after which a change in pricing schemecould reduce the batterys value to zero Knowing that 2
3 of the investment has a very low risk of uncertaintyrather than 1
2 makes the investmentmuchmore attractive These factors should be consideredwhen choosingthe design region of battery selection For a structural investment a payback period of five and seven years isdeemed safe Since the optimum battery payback time is 63 years (which falls within the range) investing inLi-ion appears feasible
62 Net Present Value ResultsThe net present value was the second method used to assess the battery systems worth As long paybackperiods are inherently risky NPV uses discount rates to devalue cash that is made further in the future Asdiscussed in section 321 the Internal Return Rate was found This calculation found that for the range ofbatteries accessed the average IRR fell between 2 and 15 at 11 Three discount rates of 3 7 and 12were selected to understand the value of the different batteries based on the IRR calculation Figure 67 showsthe net present values of the various simulated batteries at these different rates
0 500 1000 1500 2000 2500
Battery Size kWh
0
2
4
6
8
10
12
Net P
rese
nt V
alu
e pound
105Net Present Value Based on Battery Size
and Power 3 Discount Rate
Max Fit Curve
0 500 1000 1500 2000 2500
Battery Size kWh
-1
0
1
2
3
4
5
Net P
rese
nt V
alu
e pound
105
Net Present Value Based on Battery Sizeand Power 7 Discount Rate
Max Fit Curve
0 500 1000 1500 2000 2500Battery Size kWh
-3
-2
-1
0
1
Net P
rese
nt V
alu
e pound
105Net Present Value Based on Battery Size
and Power 12 Discount Rate
Max Fit Curve
0 500 1000 1500 2000Battery Size kWh
0
2
4
6
8
10
12
Net P
rese
nt V
alu
e pound
105Net Present Value Fit Battery Based on Size
and Power Different Discount Rates
3712
200
400
600
800
1000
1200
Max
Pow
er
kW
Figure 67 Net Present value at Different Discount Rates - Comparison
Using the different NPV rates presented conflicting optimum batteries Increasing discount rate favouredsmaller batteries Looking at the results it was decided that a batteries a 7 discount rate the following as-
oSee Table 1 for a more detailed description of the challenges that an ESS system faces
Alexander Charles 24
6 RESULTSsumptions
bull Battery Health As the battery will degrade each year until it reaches its end of life value the assumptioncan be made that the value of the asset decreases proportionally to the batterys health Looking at theoptimum battery at a discount rate of 7 (see Table 4 below) it can be observed that the specific batteryran for 4980 cycles Based on this assumption the value of the battery would be 99 of its original valueequating to a discount rate of ~398 over the 25 year period As each battery degrades differently thediscount rate due to batterys healthy can be approximated to 4
bull Inflation Inflation is another factor of the discount rate For the UK this rate has varied between -01and 35 for the last five years [78] It is expected that the price of energy bills will increase with inflationtherefore this can be neglected in the discount rate assumption
bull Interest Rates Discount rates can be used to incorporate interests on loans As the battery would bepurchased at the same time as the rest of the new campus it is assumed that the battery will be boughtunder the new campuss mortgage keeping the interest rate low approximated to 3
Using these approximations gives a discount rate of around 7 shown in figure 67
63 Battery Health AnalysisTo reduce computational time and simplify the model assumptions were made to confine the battery to neverwork outside of normal working parameters Section 33 discussed how discharge time and depth of dis-charge effect the battery lifetime Based on experimental data equations on how these factors have an effecton capacity were found The model measured the average depth of discharge and discharge time allowingthese parameters to be analysed after completing the simulation Understanding the effect of these paramet-ers increases the validity of results Figure 68 and 69 show the trend between the depth of discharge anddischarge for the different batteries
0 500 1000 1500 2000 2500
Battery Size kWh
20
30
40
50
60
70
80
90
Me
an
De
pth
of
Dis
cha
rge
Mean Depth of Discharge vs Battery Size
200
400
600
800
1000
1200
Max
Pow
er
kW
0 200 400 600 800 1000 1200 1400
Max Power kW
20
30
40
50
60
70
80
90
Me
an
De
pth
of
Dis
cha
rge
Mean Depth of Discharge vs Max Power
500
1000
1500
2000
Battery
Siz
e kW
h
Figure 68 Depth of Discharge For Battery Lifetime
0 500 1000 1500 2000 2500
Battery Size kWh
1
2
3
4
5
6
7
8
9
Me
an
Dis
cha
rge
Tim
e
Ho
urs
Mean Discharge Time vs Battery Size
200
400
600
800
1000
1200
Max
Pow
er
kW
0 200 400 600 800 1000 1200 1400
Max Power kW
1
2
3
4
5
6
7
8
9
Me
an
Dis
cha
rge
Tim
e
Ho
urs
Mean Discharge Time vs Max Power
500
1000
1500
2000
Battery
Siz
e kW
h
Figure 69 Expected Capacity Offset Due to DischargeRate and Depth of Discharge
Alexander Charles 25
6 RESULTSThe patterns observed in Figures 68 and 69 occur due to the difference between maximum power and max-imumcapacity Comparing these result to Figure 63 it is understood that the batteries achieving themaximumtotal savings have DOD greater than 70 but are not always fully discharged Batteries appear to fall into twocategories one of the highmean depth of discharge between 70-80 andonewith amean depth of dischargearound 50 This is a result of the relationship between capacity and max power limiting the possible depthof discharge that the battery could reach in the two-hours red rate period The discharge rate in Figure 69shows as capacity increases discharge rate also increases almost doubling for high powered low capacitybatteries
Using the polynomial equations outlined in Figures 34 and 35 an additional performance parameter describ-ing a more realistic end cycle life size was found based on these two measurements The results are shown inFigure 610
500 1000 1500 2000
Battery Size kWh
3000
4000
5000
6000
7000
8000
9000
10000
11000
12000
Cyc
le L
ife (
Offse
t) (D
imensi
onle
ss)
Battery Size vs Capacity Offset
200
400
600
800
1000
1200
Ma
x P
ow
er
kW
Figure 610 Showing the Expected Effect of Depth of Discharge and Discharge Time on Predicted Cycle Life
It is clear from Figure 610 that taking into account DOD and discharge time the lifetime of the battery caneither be reduced or increased significantly Since not all batteries will fully degrade by the end of the 25year lifetime slightly reduced capacity may not be a problem as the battery should still be functional beyondthe end of life value From research it appears that depth of discharge can have a more dramatic effect onthe batteries lifetime To make experimental effects of DOD comparable for the Powerpack a conservativeassumption that the batteries DOD rate was 70 was made [60] however notes that it is possible higherDOD were used to achieve the 5000 cycle life This would decrease the effect of DOD significantly meaningmany more batteries would increase in cycle life rather than decrease For both these reasons it is unclearwhether the error in predicting battery health will have a significant effect on the batterys value
64 Discussion on Optimum BatteryTable 4 show the optimum battery configurations based on the metrics discussed perviously
Alexander Charles 26
6 RESULTSTable 4 Table Showing the Best Battery Results Comparing the different Economic Measurements
NPV Total Savings Payback Max PlotBattery Power (kW) 1050 1200 450 900
Battery Capacity (kWh) 2000 2280 860 1710Purchase Cost (pound) 803630 915980 343100 683420
Total Saved (pound) 1912775 1969808 870561 1765193ROI () 238 215 254 258
Payback (Years) 695 759 636 653NPV 7 (pound) 522613 483657 256381 498150
IRR () 14 12 15 15Mean DoD () 764 722 800 784
Mean Discharge (hrs) 240 280 173 210Years Run 250 250 240 245
Annulised Savings (pound) 76511 78792 36302 72117Cycles Complete 4980 4709 5000 5000Predicted Health 3960 4384 3476 3721
ParameterHighest Performers
The following observations can be made from the results
bull The difference in NPV between the best NPV total savings andmax plot values are around pound40000 Thisis relatively marginal against the total cost of the investment
bull A difference of only a years payback time can be observed by all the best performing batteriesbull All the batteries are run towards their maximum working threshold with high DOD and mean dischargetimes
bull Themaximumplot specification battery gives the highest Return on Investment (ROI) this measure helpsunderstand how much money is made compared to how much was invested
bull Annualised savings of all the battery excluding lowest payback ranges by pound6000 only Between maxplot and total savings an increase in 35 in upfront cost creates only 9 more yield a year
bull Selecting a battery based on the lowest payback period has a significantly lower NPV and the likelihoodof it failing before it reaches 5000 cycles is likely
bull Selecting the battery with the largest total savings will have the highest probability of not wearing outbefore it reaches the end of life
65 Sensitivity Analysis on Energy PricingChange in energypricing is the greatest uncertainty that battery technology faces A conversationwithWesternPower highlighted the likelihood of DUoS unit charges decreasing shortly To understand whether investingin battery storage is feasible Red red cost were to drop a range of different prices were simulated Figures611 shows the effect of decreasing the red rate DUoS charged on the maximum NPV (at 7) and minimumpayback periods
Alexander Charles 27
7 CONCLUSIONS AND FUTURE WORK
500 1000 1500 2000
Battery Size kWh
-4
-3
-2
-1
0
1
2
3
4
5
6T
ota
l Sa
vin
gs
105 Senstivity of NVP at 7 For Different DUoS Rates
81367122051627331830752441
Figure 611 Effect of a Decrease in Red Rate Charges(pence) on the NPV
500 1000 1500 2000
Battery Size kWh
6
7
8
9
10
11
12
13
14
Pa
yba
ck P
erio
d
Senstivity of Payback Time For Different DUoS Rates
122051627331830752441
Figure 612 Effect of a Decrease in Red Rate Charges(pence) on the Payback Period
The sensitivity analysis shows that there is still value in investing in battery storage for the new campus if the Redrate charge decreases up to 50 If the Red rate charge were to decrease beyond this point alternate batterystrategies would need to be accessed Looking at the NPV curves in Figure 611 smaller batteries becomemore favourable as the rate decreases This is due to the increase in payback time for the larger batteriesobserved in Figure 612 Choosing a battery which is smaller in capacity reduces the risk of the battery notpaying itself back if Red rate charges were to drop this should be regarded by the designer
7 Conclusions and Future WorkThis project sets out to evaluate the feasibility of investing in an ESS when developing the new Temple Quartercampus To successfully achieve this objective while making the results useful for the fifth year group designproject the following outcomes were produced
bull Energy Profile Tool to build and understand the New University Campuss Demandbull Optimised Battery System Model producing best storage solutions based on the energy profile toolbull Business case for battery technology investment
71 Conclusions on Modelling ToolsThe project successfully produced two tools which will be useful for the final year project The energy profiletool was built to allow a flexible array of different half hourly usage data To comply with the user interfacerequirements set in section 413 the tool allows for the names of the data files to be inputted and the toolwill then adjust and overlay the data correctly Combining this program with the data plotting tool generatessome useful graphs Being able to generate lots of different representative data quickly will aid next years workwhen analysing different heat and electricity profiles
The optimised battery system model meets the three modelling requirements Code optimisation and easeof development (412) were crucial adding increased functionality through additional battery strategies and
Alexander Charles 28
7 CONCLUSIONS AND FUTURE WORKmetrics The performance required tomake the tool quick and easy for the designer was successfully achievedreducing the full simulation runtimedown to 200 seconds A user will be able to easily choose an energy profilethey want to simulate (preferably processed by the energy profile tool although not a requirement) and arange of battery specifications resulting in the output of graphs shown in the results An optimum battery canbe selected using different graphs and results produced thusmaking it a useful tool not only in understandingthe business case but also in aiding a designer in selecting the most appropriate battery
The tool will remain valid for other batteries and will is not limited to just the Tesla Powerpack This is due tothe specific parameters such as cycle life size power and price all being customisable in the model Also theassumptions made are mostly generic to Li-ion technology This will increase the functionality if the broaderrange of ESS systems is required although additional refinement is recommended
72 Conclusions on Temple Quarter Campus ResultsThe project confirms that there is a strong business case for investing in Li-ion storage when developing thenew TempleQuarter Campus From the shortlist of optimum Tesla Powerpack batteries all achieved a paybackperiod of fewer than seven years After the battery has paid itself back there is minimal input or costs arerequired to keep the storage system functioning Theoretically the battery continues to generate savingsbeyond the end of life thus increasing the value of the battery further
If the system is installed into the new campus the Powerpacks modular design will make it feasible to swapthe batteries out once they have worn-out or the technology has significantly improved Li-ion technologyhas improved significantly over the last ten years and will continue to do so following the rise in electric carownership
Referring to the challenges discussed in Table 1 the following can be concluded from the project on how theseseverity challenges have been overcome through research and modelling
bull Costs of purchase too high the model proves that finance is only required for seven years until thebattery pays itself back Since the battery will be purchased as part of the new campus assets along withthe buildings land and other equipment a very low-interest rate will be taken on the battery Within thisperiod the battery will be covered under warranty reducing the risk of the battery failing before returninga positive cash flow
bull Lifetime longevity of the battery too low research and modelling have identified that it is likely that thebattery will last up to or beyond the 25 year runtime period This can be achieved by controlling howthe battery is run preventing it from falling out of these boundaries Secondary analysis of the effects ofdepth of discharge and discharge rate confirm that most batteries should produce the value simulatedin the model
bull Frequent change to regulation and barriers to entry This is still the largest barrier to entry Discussionswith Western Power [77] noted that DUoS prices are very likely to change over this period where it is ex-pected that DUoS rates will decrease while capacity charge will increase consistently Due to the addedflexibility that fast frequency responses Li-ion battery offer it is in the energy suppliers interest to encour-
Alexander Charles 29
7 CONCLUSIONS AND FUTURE WORKage the customer to purchase this technology rather than penalise its use It is likely that further changein regulation will support the use of Li-ion batteries which could increase the batteries value further inthe future
bull Technology still maturing the model has made it clear that Li-ion is now ready to be used to reduce peakdemand
Finally along with being a financial asset using energy storage to reduce peak demand will help to reducethe Universitys emissions significantly The model forecasts that the new campus will use up to 18MWh ofelectricity a day during peak timesEliminating usage during this period would cut back energy producedfrom dirty fuel sources up to 576kg of C02 per day
73 Future WorkThe following work is suggested to improve the model
1 Further development is necessary to validate the degradation model Implementing the depth of dis-charge and discharge time calculations into the model will cause the validity of the results to improveThis can be integrated either through running the simulation twice using the mean values as the newend of life cycle counter or by creating an algorithm that calculates the effects on the fly
2 There is a lack of data on energy usagewithin university rooms particularly engineering and biology labscomputer rooms and lecture halls Due to this a simulation of thedifferencebetween a centralisedbatterysystem (modelled) anddecentralised system (where lots of smaller batteries are usedon a localisedbasis)could not be modelled This is an area of highly unexplored work where technologies such as the TeslaPowerwall could be used
3 An evaluation of other methods to increase the value of the battery such as capacity charges and FITshould be assessed
4 Research highlighted that a battery could be used to create a fixed demand profile for the new campusThe new campus will have to pay large upfront costs of planting supply lines to connect the campus tothe grid The ability to set the energy profile of the campus would dramatically reduce this cost Furtherresearchmay identify that the reduction in connection fee costsmay cover the upfront costs of the battery
Alexander Charles 30
REFERENCES
References[1] (Nov 2016) November new pound300 million campus will transform temple quarter | news | university of
bristol [Online] Available httpwwwbristolacuknews2016novembertemple-quarter-campushtml (visited on 08122016)
[2] S E GB (2016) The voice of the smart meter rollout [Online] Available httpswwwsmartenergygborgen (visited on 08122016)
[3] UoB (2016) Our vision our strategy [Online] Available httpwwwbristolacukmedia-librarysitesuniversitydocumentsgovernancepoliciesuniversity-strategypdf (visited on 08122016)
[4] P Cooper Project meeting with arup Personal Communications Nov 2016
[5] (2017) G b national grid status [Online] Available httpwwwgridwatchtemplarcoukindexphp(visited on 24032017)
[6] G Wright (Jan 2013) Reducing peak demand lowering prices but what about emissions [Online]Available http theconversation comreducing- peak- demand- lowering- prices - but - what - about -emissions-11564 (visited on 24032017)
[7] T Lea (Apr 2016) Part 1 attempting to measure and understand the co2 intensity of grid electricity -blog | openenergymonitor [Online] Available httpsblogopenenergymonitororg201604Understand-CO2-intensity-grid-electricity (visited on 24032017)
[8] J Brenton and C JonesMeeting Personal Communications Nov 2016
[9] (Feb 2014) Use of system charging statement [Online] Available httpswwwwesternpowercoukdocssystem-chargesUse-of-System2014SWEB-2014-2015aspx (visited on 10122016)
[10] (Sep 2012) Deconstructing your energy bill capacity charges [Online] Available httpwwwenergysmartenernoccomdeconstructing-your-energy-bill-capacity-charges (visited on 09122016)
[11] N Grid (2014) Triads why three is the magic number - national grid [Online] Available httpnationalgridconnectingcomtriads-why-three-is-the-magic-number (visited on 09122016)
[12] PCMG (2012) Tnuos (transmission network use of system) charges and triads [Online] Available http www pcmg co uk services energy tnuos - transmission - network - use - of - system - charges - and -triadshtmlL=02FRK3D02FRS3DL1v24MDxrTlEQk4XnNhR0chgJ14- (visited on 09122016)
[13] E Energy (2015) Tnuos chargepdf [Online] Available https wwweonenergycomfor - your- business large- energy- usersUnderstand- Energy~mediaPDFsFor- your- businessLarge- Energy-Users3rd20Party20ChargesTNUoS20chargepdf (visited on 09122016)
[14] S Electric (2007) Reducing energy costs with peak shaving [Online] Available httpswwwschneider-electriccomhkdocumentsenergy-efficiency-forumReducing-Energy-Costs-with-Peak-Shavingpdf(visited on 27112016)
Alexander Charles 31
REFERENCES[15] Baldor (2005) Energy management best practices energy management best practices - peak shaving
generators [Online] Available http wwwsustainableplant comassets WP00010 pdf (visited on30112016)
[16] S Barker A Mishra D Irwin P Shenoy and J Albrecht lsquoSmartcap flattening peak electricity demand insmart homesrsquo in 2012 IEEE International Conference on Pervasive Computing and Communications Mar2012 pp 67ndash75 doi 101109PerCom20126199851
[17] S B S Inc (2012) Reducing utility demand charges pdf [Online] Available httpwwwsbsbatterycomPDFsReducingUtilityDemandChargespdf (visited on 27112016)
[18] R T de Salis A Clarke Z Wang J Moyne and D M Tilbury lsquoEnergy storage control for peak shavingin a single buildingrsquo in 2014 IEEE PES General Meeting | Conference Exposition Jul 2014 pp 1ndash5 doi101109PESGM20146938948
[19] T R PoulsenMeeting with the university of copenhagen Personal Communications Jan 2017
[20] J Shen C Jiang Y Liu and J Qian lsquoAmicrogrid energymanagement systemwith demand response forproviding grid peak shavingrsquo Electric Power Components and Systems vol 44 no 8 pp 843ndash852 2016doi 1010801532500820161138344 [Online] Available httpdxdoiorg1010801532500820161138344
[21] C Priest Chris priest iodicus project correspondance Email Correspondance Jan 2017
[22] ABB (2016) Peak shaving [Online] Available httpwwwabb-energystoragesolutionscom_ga=112385165812952669031480518807 (visited on 30112016)
[23] T Sauter and M Lobashov lsquoEnd-to-end communication architecture for smart gridsrsquo IEEE Transactionson Industrial Electronics vol 58 no 4 pp 1218ndash1228 Apr 2011 issn 0278-0046 doi 101109TIE20102070771
[24] I One-Cycle Control (2012) Peak load reduction with lithium iron battery energy storage peak shaving[Online] Available httpwwwonecyclecontrolcomOCC-PLR-producthtml (visited on 07122016)
[25] G T Smedley lsquoDemonstration of one-cycle control peak load regulator (occ-plr) systemrsquo California En-ergy Commission Tech Rep 2013 [Online] Available httpwwwenergycagov2014publicationsCEC-500-2014-100CEC-500-2014-100pdf (visited on 07122016)
[26] E Telaretti and L Dusonchet lsquoBattery storage systems for peak load shaving applications part 2 eco-nomic feasibility and sensitivity analysisrsquo in 2016 IEEE 16th International Conference on Environment andElectrical Engineering (EEEIC) Jun 2016 pp 1ndash6 doi 101109EEEIC20167555795
[27] W Hu Z Chen and B Bak-Jensen lsquoOptimal operation strategy of battery energy storage system to real-time electricity price in denmarkrsquo in IEEE PES General Meeting Jul 2010 pp 1ndash7 doi 101109PES20105590194
Alexander Charles 32
REFERENCES[28] C J Bennett R A Stewart and J W Lu lsquoDevelopment of a three-phase battery energy storage schedul-
ing and operation system for low voltage distribution networksrsquo Applied Energy vol 146 pp 122 ndash1342015 issn 0306-2619 doi httpdxdoiorg101016japenergy201502012 [Online] AvailablehttpwwwsciencedirectcomsciencearticlepiiS0306261915001841
[29] IEA lsquoTechnology roadmap energy storagersquo International Energy Agency Tech Rep 2014 [Online]Available httpswwwieaorgpublicationsfreepublicationspublicationTechnologyRoadmapEnergystoragepdf
[30] E M G Rodrigues R Godina G J Osoacuterio J M Lujano-Rojas J C O Matias and J P S Catalatildeo lsquoCom-parison of battery models for energy storage applications on insular gridsrsquo in 2015 Australasian Univer-sities Power Engineering Conference (AUPEC) Sep 2015 pp 1ndash6 doi 101109AUPEC20157324861
[31] S R Deeba R Sharma T K Saha D Chakraborty and A Thomas lsquoEvaluation of technical and finan-cial benefits of battery-based energy storage systems in distribution networksrsquo IET Renewable PowerGeneration vol 10 no 8 pp 1149ndash1160 2016 issn 1752-1416 doi 101049iet-rpg20150440
[32] A Allik M Maumlrss J Uiga and A Annuk lsquoOptimization of the inverter size for grid-connected residentialwind energy systems with peak shavingrsquo Renewable Energy vol 99 pp 1116 ndash1125 2016 issn 0960-1481 doi httpdxdoiorg101016jrenene201608016 [Online] Available httpwwwsciencedirectcomsciencearticlepiiS0960148116307170
[33] J Leadbetter and L Swan lsquoBattery storage system for residential electricity peak demand shavingrsquo En-ergy and Buildings vol 55 pp 685 ndash692 2012 Cool Roofs Cool Pavements Cool Cities and CoolWorld issn 0378-7788 doi httpdxdoiorg101016jenbuild201209035 [Online] AvailablehttpwwwsciencedirectcomsciencearticlepiiS0378778812004896
[34] E Telaretti and L Dusonchet lsquoBattery storage systems for peak load shaving applications part 1 oper-ating strategy and modification of the power diagramrsquo in 2016 IEEE 16th International Conference onEnvironment and Electrical Engineering (EEEIC) Jun 2016 pp 1ndash6 doi 101109EEEIC20167555793
[35] J Malinowski and K Kaderly lsquoPeak shaving - a method to reduce utility costsrsquo in Region 5 ConferenceAnnual Technical and Leadership Workshop 2004 Apr 2004 pp 41ndash44 doi 10 1109REG5 2004 1300158
[36] O Lavrova F Cheng S Abdollahy H Barsun A Mammoli D Dreisigmayer S Willard B Arellano andC van Zeyl lsquoAnalysis of battery storage utilization for load shifting and peak smoothing on a distributionfeeder in new mexicorsquo in 2012 IEEE PES Innovative Smart Grid Technologies (ISGT) Jan 2012 pp 1ndash6doi 101109ISGT20126175723
[37] L C Hau and Y S Lim lsquoA real-time active peak demand reduction for battery energy storage with lim-ited capacityrsquo English Journal of Communications vol 11 no 9 pp 841 ndash847 2016 Battery energystorageBessControl strategiesEnergy storage systemsFundamental controlLimited capacityPeak de-mandSimulation evaluation issn 17962021 [Online] Available httpdxdoiorg1012720jcm119841-847
Alexander Charles 33
REFERENCES[38] B Aksanli T Rosing and E Pettis lsquoDistributed battery control for peak power shaving in datacentersrsquo in
2013 International Green Computing Conference Proceedings Jun 2013 pp 1ndash8 doi 101109IGCC20136604477
[39] S V Giannoutsos and S N Manias lsquoA cascade control scheme for a grid connected battery energystorage system (bess)rsquo in 2012 IEEE International Energy Conference and Exhibition (ENERGYCON) Sep2012 pp 469ndash474 doi 101109EnergyCon20126348200
[40] A Lucas and S Chondrogiannis lsquoSmart grid energy storage controller for frequency regulation and peakshaving using a vanadium redox flow batteryrsquo English International Journal of Electrical Power and En-ergy Systems vol 80 pp 26 ndash36 2016 Fast charging stationsFrequency regulationsGrid connectedsystemsGrid StorageMedium voltage substationsPeak shavingSmart gridVanadium redox flow bat-teries issn 01420615 [Online] Available httpdxdoiorg101016jijepes201601025
[41] Y Levron and D Shmilovitz lsquoPower systems optimal peak-shaving applying secondary storagersquo Elec-tric Power Systems Research vol 89 pp 80 ndash84 2012 issn 0378-7796 doi http dx doi org10 1016 j epsr 2012 02 007 [Online] Available http wwwsciencedirect comsciencearticle pii S037877961200048X
[42] Y Levron and D Shmilovitz lsquoOptimal power management in fueled systems with finite storage capacityrsquoIEEE Transactions on Circuits and Systems I Regular Papers vol 57 no 8 pp 2221ndash2231 Aug 2010issn 1549-8328 doi 101109TCSI20092037405
[43] H Chen T N Cong W Yang C Tan Y Li and Y Ding lsquoProgress in electrical energy storage systema critical reviewrsquo Progress in Natural Science vol 19 no 3 pp 291 ndash312 2009 issn 1002-0071 doihttpdxdoiorg101016jpnsc200807014 [Online] Available httpwwwsciencedirectcomsciencearticlepiiS100200710800381X
[44] Q Liao B Sun Y Liu J Sun and G Zhou lsquoA technoeconomic analysis on nas battery energy storagesystem supporting peak shavingrsquo International Journal of Energy Research vol 40 no 2 pp 241ndash247Feb 2016 issn 1099-114X doi 101002er3460 [Online] Available httphttpsdxdoiorg101002er3460
[45] B Dunn H Kamath and J-M Tarascon lsquoElectrical energy storage for the grid a battery of choicesrsquo Sci-ence vol 334 no 6058 pp 928ndash935 2011 issn 0036-8075 doi 101126science1212741 [Online]Available httpsciencesciencemagorgcontent3346058928
[46] B Garg (2012) Introduction to flow batteries theory and applications [Online] Available httplargestanfordeducourses2011ph240garg1 (visited on 30112016)
[47] B Univeristy (2016) Comparison table of secondary batteries [Online] Available httpbatteryuniversitycomlearnarticlesecondary_batteries (visited on 30112016)
Alexander Charles 34
REFERENCES[48] A Choudar D Boukhetala S Barkat and J-M Brucker lsquoA local energy management of a hybrid
pv-storage based distributed generation for microgridsrsquo Energy Conversion and Management vol 90pp 21 ndash33 2015 issn 0196-8904 doi httpdxdoiorg101016jenconman201410067 [Online]Available httpwwwsciencedirectcomsciencearticlepiiS0196890414009625
[49] (2017) Powerpack | commercial and utility energy storage solutions [Online] Available httpswwwteslacomen_GBpowerpack (visited on 29032017)
[50] S M Knupfer R Hensley P Hertzke and P Schaufuss lsquoElectrifying insights how automakers can driveelectrified vehicle sales and profitabilityrsquo Mckinsey amp Company Tech Rep 2017
[51] (2017) Net present value - npv [Online] Available httpwwwinvestopediacomtermsnnpvasp(visited on 24032017)
[52] P Y-D Lyuu Numerical methods for yields Lecture Slides 205 [Online] Available httpswwwcsientuedutw~lyuufinance1200520050302pdf (visited on 24032017)
[53] N DiOrio A Dobos and S Janzou lsquoEconomic analysis case studies of battery energy storage with samrsquoNational Renewable Energy Laboratory Denver CO USA 2015
[54] R Spotnitz lsquoSimulation of capacity fade in lithium-ion batteriesrsquo Journal of Power Sources vol 113no 1 pp 72ndash80 2003 [Online] Available http www sciencedirect com science article pii S0378775302004901
[55] (2013) The importance of testing pv batteries to the iec 61427 standard [Online] Available httpwwwtrojanbatterycompdfRE_IEC_61427_Standardpdf (visited on 27032017)
[56] C Lilly (Feb 2016) Renault to recycle evbatterieswith energy storage firm - zap-map [Online] Availablehttpswwwzap-mapcomrenault - to- recycle- ev-batteries-with- energy- storage- firm (visited on26032017)
[57] P Rong and M Pedram lsquoAn analytical model for predicting the remaining battery capacity of lithium-ionbatteriesrsquo IEEE Transactions on Very Large Scale Integration (VLSI) Systems vol 14 no 5 pp 441ndash4512006 [Online] Available httpdxdoiorg101109DATE20031253775
[58] (2017) Weather averages for london united kingdom [Online] Available httpwwwholiday-weathercomlondonaverages (visited on 25032017)
[59] () Battery life and how to improve it [Online] Available httpwwwmpowerukcomlifehtm (visited on15032017)
[60] (2015) Tesla will use different batteries for its grid products heres why [Online] Available http fortunecom20150518tesla-grid-batteries-chemistry (visited on 28032017)
[61] () Effects of discharge rate and temperature on battery capacity and life | engineers edge [Online] Avail-able http wwwengineersedge combattery discharge_ rate_ temperature_effects _battery htm(visited on 15032017)
Alexander Charles 35
REFERENCES[62] () Premature voltage cut-off - battery university [Online] Available httpbatteryuniversitycomlearn
articlepremature_voltage_cut_off (visited on 15032017)
[63] (2016) Battery performance characteristics - how to specify and test a battery [Online] Available httpwwwmpowerukcomperformancehtm (visited on 28032017)
[64] N Omar M Daowd P v d Bossche O Hegazy J Smekens T Coosemans and J v Mierlo lsquoRe-chargeable energy storage systems for plug-in hybrid electric vehicles---assessment of electricalcharacteristicsrsquo Energies vol 5 no 8 pp 2952ndash2988 2012
[65] N Omar P V d Bossche T Coosemans and J V Mierlo lsquoPeukert revisited---critical appraisal and needfor modification for lithium-ion batteriesrsquo Energies vol 6 no 11 pp 5625ndash5641 2013
[66] S S Choi and H S Lim lsquoFactors that affect cycle-life and possible degradation mechanisms of a li-ioncell based on licoo2rsquo Journal of Power Sources vol 111 no 1 pp 130 ndash136 2002 issn 0378-7753 doihttpdxdoiorg101016S0378-7753(02)00305-1 [Online] Available httpwwwsciencedirectcomsciencearticlepiiS0378775302003051
[67] () Charging lithium-ion batteries -- battery university [Online] Available httpbatteryuniversitycomlearnarticlecharging_lithium_ion_batteries (visited on 15032017)
[68] B Xu A Oudalov A Ulbig G Andersson and D Kirschen lsquoModeling of lithium-ion battery degradationfor cell life assessmentrsquo IEEE Transactions on Smart Grid 2016
[69] () Zero-dmodelling approachwith ansys products | valeacuterie gelbgras | pulse | linkedin [Online] Availablehttpswwwlinkedincompulsezero-d-modelling-approach-ansys-products-valC3A9rie-gelbgras(visited on 17032017)
[70] CIBSE Combined Heat and Power for Buildings - CIBSE AM12 2013 (2nd Edition) CIBSE 2013 isbn978-1-906846-30-5 [Online] Available httpappknovelcomhotlinktocidkpCHPBCIB1combined-heat-power-buildingscombined-heat-power-buildings
[71] lsquoTriads dates and times 2014 - 2015rsquo National Grid Tech Rep 2015 [Online] Available httpwww2nationalgrid comUK Industry - informationSystem- chargesElectricity - transmissionTransmission -Network-Use-of-System-ChargesTransmission-Charges-Triad-Data
[72] (Jul 2015) Charging for optimum battery life [Online] Available httpsforumsteslacomen_GBforumforumscharging-optimum-battery-life (visited on 26032017)
[73] (Feb 2016) Used renault ev batteries to be recycled into energy storage systems [Online] Availablehttpwwwfleetnewscouknewsenvironment20160205used-renault-ev-batteries-to-be-recycled-into-energy-storage-systems (visited on 26032017)
[74] PGetreuer lsquoWriting fastmatlab codersquoMathworks File Exchange5685 2009 [Online] Available URLhttpwwwmathworkscommatlabcentralfileexchange5685
[75] () Live data | sustainability at princeton [Online] Available httpsustainprincetonedulablive-data(visited on 18032017)
Alexander Charles 36
REFERENCES[76] AECOM lsquoHeat networks code of practice for the ukrsquo CIBSE Tech Rep 2015
[77] M Watson and M DaleWestern power discussion Meeting Minutes Mar 2017
[78] (2017) United kingdom inflation rate | 1989-2017 | data | chart | calendar [Online] Available httpwwwtradingeconomicscomunited-kingdominflation-cpi (visited on 22032017)
Alexander Charles 37

4 BATTERY MODEL DEFINITION
Read Master Start Date
Read Secondary Start Dates
Find Difference Between Two Dates
Align
Split Data to Align Days and Months
Switch Data Splits and Join
Check Days with Master
Shift Dates Back One Day
InputHalf Hourly Energy Usage Data
Output Scaled and Combine Data
Create Minute by Minute Granularity
Usage Data
Add Random Normally Distributed Variablitlity into
Data
Create Demand Profile for Data
Extrapolate Profiles for Batteryrsquos Lifetime
Yes
Yes
End Of Data Files
No
While Data Files
Unprocessed
Figure 44 Logic of Energy Profile Tool Create New Campus Data
46 Definition of System StrategiesTo fully understand the value of using battery storage representative simulations of how the battery wouldoperate is required This section defines the logic of the batterys operation The model calculates both eco-nomical and technical battery performance based on the chosen battery strategies The following section willdiscuss why the final strategies were selected detailing their development
461 Red Rate Charge Avoidance StrategyAs outlined in section 43 using energy consumed during Red rate periods was considerably more expensivethan Amber and Green periods making it a primary strategy By switching the battery on during Red rateperiods then charging during Green periods cost savings of up to 20 could be made Currently for theUniversity Red rates apply between 5 and 7 PM on weekdays making it simple to forecast alleviating the needfor complex prediction systems highlighted in section 241 During this period the battery would be drainedat a rate up to its maximum output power requiring demand and usage data to be checked simultaneouslyIf the load exceeded max power energy supply was capped at this value The battery would continue to bedrained until either its minimum capacity was reached or the Red rate period elapsed The battery would thenbe fully charged during Green ensuring all capacity was available for the next Red rate period entered Thismethod was repeated for the run-length of the simulation
462 Triad Avoidance StrategyTo correctly understand the effects of TRIAD avoidance in the model TRIAD dates needed to be correctlyidentified Using [71] the dates 41214 190115 020215 were used aligning with the original SenateHouse data set as the master template for the new campus (discussed in section 451) These dates wereused for the sequential years in the simulation as they were typical days in which TRIADS would fall Fromobservation it was assumed that therewas no increase in theUniversitys usageduring TRIADperiods allowingany day within that week to be used To make sure these dates did not fall weekends days were checked and
Alexander Charles 16
4 BATTERY MODEL DEFINITIONadjusted accordingly It is assumed that daily variation in energy usage is negligible and instead energy trendsare seen only on a monthly basis
It was observed that TRIAD times all fell into Red rate periods corresponding with the Red rate avoidancebattery strategy Using these dates and the time of 530 pm the TRIAD cost was calculated based on energydemand (kW) Battery usage was thenmeasured against the TRIAD cost to understand the reduction in energydemand delivered by the battery The reduction in TRIAD rate was a factor of the batteries max power supplyand not capacity as the battery would only need to run for a few minutes to offset this charge
At the end of each year in the simulation usage on the three TRIAD dates was averaged to find the total costThis was then spread evenly over the next year in the simulation representing how TRIAD billing is split acrosseach monthly energy bill
463 Battery Control StrategyThe importance of optimising battery longevity was highlighted in 241 and 243 Section 33 discussed thedifferent variables which can affect a batterys longevity An approximation of battery degradation was takentaking into account the effect of each of these variables as a battery control strategy
The rated battery cycle life is taken as the number of full cycles a battery can complete before it degrades to80 of its original capacity l This value was used to measure how the battery should perform based on anormal use case With this assumption batteries were degraded at a level proportional to the fraction of itscurrent cycle
Dead Capacity
Battery Degredation
MaxCap
MinCap
CurrentCharge
Full Cycle Current
Size
Figure 45 Showing Battery De-gradation
For each charging iteration the new max capacity becomes slightly smaller re-ducing the size of the cycle A counter was used to sum each charge resettingwhen its value equalled the current cycle size indicating one complete cycleWith this method batteries were degraded based on their use thus degrad-ing quicker as they deteriorate This followed the cell cycle degradation trendshown in figure 32
By using the cycle-life metric all battery degradation assumptions were basedon the batterys operation and not the batterys chemistry Assumptions on thebatteries normal working parameters were made limiting the battery to con-form to these rules This would prevent the battery running in a way that wouldmajorly affect its longevity making the prediction more accurate These restric-tions could be adjusted at the expense of a greater or smaller chance of erroron the perdition of battery health The following battery control measured wereimplemented
bull Reduction in Depth of Discharge To reduce wear on the battery the battery was confined to work within10-90 of its current maximum capacity allowing a maximum depth of discharge of 80 Draining the
lThis is quoted to be 5000 cycles for the Tesla Powerpack see Figure 2
Alexander Charles 17
4 BATTERY MODEL DEFINITIONbattery can cause detrimental effects while overcharging can also do the same Working within thesetwo parameters follows similar principles applied by Tesla in their electric cars [72]
bull Speed of Depletion A battery was never run above its max specified power As the battery was ratedat this value it should be designed to cope with this level of use for no longer than 2 hours a day Thesimulation will analyse the average discharge rate as a measure of the validity of the battery health
bull Temperature Based on the assumptions made in section 331 it was assumed that the temperaturewould remain within expected bounds Using the Red rate and TRIAD strategies would allow the batteryto cool over weekends
bull Charging The battery would only charge during Green periods at a rate which would ensure it to befully charged by the next Red period this was based on the capacity required divided by the length ofthe Green rate period Section 334 suggested that charging at a lower speed particularly during thelast 10 of charge made a large impact on the battery lifetime It is assumed here that smart chargingtechniques such as trickling (seen on most modern smartphones) would be incorporated into the ac-tual battery but modelling these methods would not increase the accuracy of the model so has beenneglected
bull Battery Efficiency This was incorporated into themodel bymultiplying the energy drawnwhen chargingby the additional losses caused inefficiencies This assumption was made as it is likely that the batteryonce charged can supply what it has stored The Powerpack 2 integrated inverter supplies energy in ACquoting its efficiency to this level (see figure 2) It is assumed that the quoted figure is representative ofthe batterys efficiency in the system Efficiency gains could also be achieved by designing the systemso it that primarily sends power to DC first without transforming This will not be evaluated in this projectsee Figure 2
Table 2 Tesla Powerpack 2 Specification
Capacity (Per Pack) 210 kWh (AC)
Power (Per Pack) 50 kW (AC)
Net System Efficiency 88 round-trip (2 hour system)
89 round-trip (4 hour system)
Operating Temperature -30degC to 50degC
Scalable Inverter Power from 50kVA to 625kVA (at 480V)
Depth of Discharge 100
Cycle Life 5000 Cycles
Warranty 10 Years
AC Voltage 380 to 480V 3 phases
Additional Features bull Bi-Directional Inverter (Inbuilt)
bullThermal Controller
bull Modular Scalable Design
Powerpack 2 Specifications
The model was run until either runtime elapsed or the batteryreached its end of life value (80) allowing results to be com-parable There are examples of batteries being used beyondtheir end of life cycle Renault and Connected Energy havebeen investigating the use the end of life Li-ion car batteriesin home applications [56] [73] It is believed that there is stillplenty of life remaining and the increased probability of fail-ure is less of a problemwhen used for bill reduction purposesIn the case of the new campus there are few associated costswith batteries after they have been installed If the battery haspaid itself back the battery will continue to generate profitUnpredictability may be seen as an issue potentially the case for emergency power applications Analysingthis value is out of the scope of this project therefore an end of life battery is classed as having no value
Alexander Charles 18
4 BATTERY MODEL DEFINITION
47 Input Parameters and Multi-Battery SimulationTo understand the optimum battery type for a given scenario and then infer the total savings that the batterycould generate a large array of different batteries with different power ratings and capacities were modelledUsing actual data from Tesla [49] the real costs of the different battery specifications were modelled To findtrends in the different battery types it was required to iterate through numerous different battery specificationsTo reduce computation time parallel computing was implemented to iterate each discrete battery scenario inthe 0D model
The following diagram depicts the model of the entire multi-battery system
Input Powerpack Specification List
Process File Extract Max Power Capacity and Cost
Input Energy Profile
Run Energy Profile ToolOutput Demand and
Usage Profile
For Input Powerpack
Specification
Set Battery Control Measures Pricing and
TRIAD Dates
While Remaing Battery Life and
Runtime
Output Battery Health Payback Time Savings
Aggregate Data and Produce Plots
Assign TRIAD Days for next
year
If Year
Elapsed
For Mintues in current day
Assign Unit Charge Rate (RedAmber Green)
Charge or Deplete Battery based on capacity
and rate
Calculate Original Cost and Savings
If Charging
If TRIAD
Capture Power Demand
Calculate Previous Years TRIAD charge
Reduce Maximum
Battery Capacity
Calculate charge levels and cycle life
Yes
Yes
ElseEnd of
Day
Next Minute
End of Life RunTime
Next Battery
All Batteries Simulated
Else
Else
Yes
Yes
Figure 46 Logic Diagram For Multi-battery Simulation
To comply with the requirements set in section 41 the following methods were used to optimise the perform-ance of MATLAB model
bull Vectorisation storing data within multidimensional arrays and using vector operationsbull Variable Initialisation all matrices were initialised to reduce memorybull MATLAB Function Reduction functions such as linear interpolation are cumbersome These were recre-ated and simplified solving tasks more efficiently
bull Parallel Processing Multiple cores on the processor were used to iterate through independent batteryspecifications in large multi-battery simulations To achieve this successfully the code was rewritten tomake all events discrete substituting techniques such as and For large multi-parametersimulations this can increase the processing time significantly
Alexander Charles 19
5 VALIDATION OF MODELbull Profiler Tool Within MATLAB the performance of code can be measured by the amount of time it takesto run This tool was used to identify bottlenecks within the model
bull Single Integers Single integers are half the size of double integers MATLABs default storage methodDouble-precision floating point numbers allow the CPU to handle very large values As this level ofaccuracy is unnecessary use of 32bit single integers was used as they increased performance [74]
bull Do Not Repeat Yourself (DRY) Coding technique to improve readability and performance of the codethrough the use of functions
The result of this method reduced the processing time of each battery from~110 seconds to under 10 secondsThis was crucial to allow 65 different simulations run quickly The runtime of the multi-scenario program wasreduced to 200 seconds This allowed different sensitivity studies to be run greatly improving the functionalityof the tool
5 Validation of Model
51 Data FileBy using the model with real data first taken from Senate House the tool which creates live data could bevalidated through integration and direct comparison to the original usage data As no data could be gatheredon actual demand for Senate house assumptions were made on the type of operations the building fulfils (seethe table below) this was compared to demand data at Princeton [75] Section 4 describes how the modelwas initially tested on Senate House to validate whether the model produced expected results After beingvalidated on Senate House the model was then run with the new campus energy profile
52 Assumptions and LimitationsTable 3 summarises all the assumptions discussed in section 4 To create a valid model all assumptions mustbe based on logical expectations of all parameters that may affect the system Thereby using the followingassumptions the model is validated
Table 3 Showing All Assumptions Made for Simulation
bull The new campus overall energy profile will have small peaks in demand only due it being very unlikely for lots of equipment with high power consumptions to be switched on together
50
bull Energy demand is assumed to be normally distributed between each half hour period 20bull Standard deviation of energy demand equals average between mean and max of data following the assumption that peaks sizes are proportional to the total demand
40
bull Daily variation negligible in energy usage is negligible assume profile is unlikely to change over battery lifetime
20
bull New campus profile is formed of Senate House Hall data and Lab data only scaled according to their total footprint size
30
bull Red rate periods remain the same for the duration of the simulation 50bull Energy prices and bills remain the same for the duration of the simulation 90bull TRIAD dates kept as close as possible to 41214 190115 020215 (no weekends used) 20bull TRIAD Bills are divided equally over the next billing year 10bull Battery degrades linearly from new to its end of life value of 80 20bull Battery parameters restrict battery to perform under normal use case 5000 cycles for a max depth of discharge of 80
40
bull Battery does not overheat is temperature controlled and allowed to cool over weekends so does temperatures effect is assumed reliable
20
bull Effect of depth of discharge and discharge rate on battery health is negligible based on normal constraints (effects discussed as secondary results)
80
bull Normal working parameters prevent over depletion or over charging from occurring 10bull Battery cycle life instantaneously degrades when charging 10bull Battery efficiency losses occur only when charging 20bull Trickle charging and minimum charge rate employed 10bull Battery has health monitoring equipment allowing its health to be optimised 20bull Current Powerpack 2 costs are used to evaluate the cost of the investment Assumed that the price will decrease and performance of batterys will improve at the time of the new campus build Current costs are therefore used as a worst case scenario
5
bullInstallation costs have been assumed negligible due to new campus build absorbing this 30bull Maintenance cost assumed not applicable as this cost will be very small 30
Assumptions Uncertainty
Batt
ery
Hea
lthBa
tter
y U
sage
Batt
ery
Cost
sEn
ergy
Pro
file
Ener
gy
Billi
ng
Alexander Charles 20
6 RESULTS
bull The new campus overall energy profile will have small peaks in demand only due it being very unlikely for lots of equipment with high power consumptions to be switched on together
50
bull Energy demand is assumed to be normally distributed between each half hour period 20bull Standard deviation of energy demand equals average between mean and max of data following the assumption that peaks sizes are proportional to the total demand
40
bull Daily variation negligible in energy usage is negligible assume profile is unlikely to change over battery lifetime
20
bull New campus profile is formed of Senate House Hall data and Lab data only scaled according to their total footprint size
30
bull Red rate periods remain the same for the duration of the simulation 50bull Energy prices and bills remain the same for the duration of the simulation 90bull TRIAD dates kept as close as possible to 41214 190115 020215 (no weekends used) 20bull TRIAD Bills are divided equally over the next billing year 10bull Battery degrades linearly from new to its end of life value of 80 20bull Battery parameters restrict battery to perform under normal use case 5000 cycles for a max depth of discharge of 80
40
bull Battery does not overheat is temperature controlled and allowed to cool over weekends so does temperatures effect is assumed reliable
20
bull Effect of depth of discharge and discharge rate on battery health is negligible based on normal constraints (effects discussed as secondary results)
80
bull Normal working parameters prevent over depletion or over charging from occurring 10bull Battery cycle life instantaneously degrades when charging 10bull Battery efficiency losses occur only when charging 20bull Trickle charging and minimum charge rate employed 10bull Battery has health monitoring equipment allowing its health to be optimised 20bull Current Powerpack 2 costs are used to evaluate the cost of the investment Assumed that the price will decrease and performance of batterys will improve at the time of the new campus build Current costs are therefore used as a worst case scenario
5
bullInstallation costs have been assumed negligible due to new campus build absorbing this 30bull Maintenance cost assumed not applicable as this cost will be very small 30
Assumptions Uncertainty
Batt
ery
Hea
lthBa
tter
y U
sage
Batt
ery
Cost
sEn
ergy
Pro
file
Ener
gy
Billi
ng
Themodel is limited to working with these parameters only Section 412 set an objective for the model to bedeveloped so these parameters can be easily changed allowing for themodel to be easily customised to workwith a different set of assumptions Modelling peaks in demand higher than those expected energy pricingchanging andDODanddischarge rate effect on capacity all have high levels of uncertainty in themodel Thesewere sensitivity checked to understand the effects of these assumptions being incorrect
6 ResultsThe objective of this report was to evaluate whether there is a strong business case for investing in energystorage technology for the New University Campus This section analyses the data gathered from the zero-dimensional model discussing the value which optimum battery specifications could bring to the new TempleQuarter campus Figures 61 and 62 describes the energy profile for the new campuss usage during Red rateperiods
Plot of Frequecy of Total Daily Red Rate Usage A Over a Year
600 800 1000 1200 1400 1600 1800
UsagekWh
0
2
4
6
8
10
12
14
16
18
20
Fre
quency
Figure 61 Histogram Showing Red Periods Total Daily Us-age Frequency
0 20 40 60 80 100
Time Spent at Load Over A Year
200
300
400
500
600
700
800
900
1000
1100
Po
we
r D
em
an
d
kW
Load Duaration Curve For Red Rate Demand Over a Year
Figure 62 Time Spent at Power Demand Level
Alexander Charles 21
6 RESULTSThese energy profile plots describe the range of battery specifications which should be simulated Figure61 shows how a battery with a usable capacity greater than ~1800kWh will have excess capacity to demandBy taking into account end of life degradation batteries with an end of life capacity of up to 2000kWh weremodelled Figure 62 describes the percentage of time the battery would spend atmax load A battery rated at920kWwould only be run at max load 10 of the time As discharge rate effects capacity batterys rated up to1300kWwere simulated Based on this analysis 65 different Powerpack 2 battery specifications were identifiedas plausible solutions
A 25 year runtime period was used to evaluate the battery performance overm chosen on the assumptionthat most technology in the building will be replaced by this point as the building begins to receive somerefurbishment Li-ion battery technology will also have significantly advanced or at least drop significantlyin price n Using a set period will also reduce uncertainty in battery health and prevent favouritism for largerbatteries An investor is unlikely to look beyond 25 years so savings made after these periods will not beconsidered The following results will talk through the three key value measurements discussed in section 32
61 Total Savings and Payback Period ResultsFigure 63 shows the parabolic shape with a local maximum between the battery size and the total savings Forthe new campus a battery size of around ~22MWh generated the maximum total savings over the simulationrun time In contrast Figure 64 highlights that amuch larger rangeof batteries fell close to the shortest paybacktime of 63years where power and capacity increased proportionally
0 500 1000 1500 2000
Battery Size kWh
02
04
06
08
1
12
14
16
18
2
Tota
l Savi
ng
106 Battery Size vs Total Saving
200
400
600
800
1000
1200
Max
Pow
er
kW
Max Fit Curve
Figure 63 Battery Size Vs Total Savings
0 500 1000 1500 2000 2500
Battery Size kWh
6
8
10
12
14
16
18
20
22
Pa
yba
ck T
ime
Y
ea
rs
Battery Size vs Payback Time
200
400
600
800
1000
1200
Max
Pow
er
kW
Max Fit Curve
Figure 64 Graph of Battery Size vs PayBack Time
Figures 63 and 64 begin to give a good insight into the financial performance of the battery Howeverpresented in this form it difficult for a designer to choose the optimum battery To make the results moreuseful an algorithm was made which generated best-fit plots over the maximum battery specifications forthe different total saving and payback time plots Figures 65 shows these curves plotted over the maximumvalues
mSee Page 27 of [76]nSee Figure 31 for a prediction in battery prices
Alexander Charles 22
6 RESULTS
500 1000 1500 2000 2500
Battery Size kWh
05
1
15
2
Tota
l Savi
ngs
pound
106 Battery Size vs Total Saving (Cond)
Max Fit Curve
0 500 1000 1500 2000 2500
Battery Size kWh
6
65
7
75
8
85
Payb
ack
Tim
e Y
ears
Battery Size vs Payback Time (Cond)
200
400
600
800
1000
1200
Ma
x P
ow
er
kW
Max Fit Curve
200 400 600 800 1000 1200 1400
Max Power kW
0
05
1
15
2
Tota
l Savi
ngs
pound
106 Max Power vs Total Saving (Cond)
Max Fit Curve
0 200 400 600 800 1000 1200 1400
Max Power kW
6
65
7
75
8
85
Payb
ack
Tim
e Y
ears
Max Power vs Payback Time (Cond)
500
1000
1500
2000
Ba
tte
ry S
ize
kW
Max Fit Curve
Figure 65 Graph Showing Top 40 Batteries with Fitted Curves for both Payback Time and Total Savings
By superimposing these max-fit curves a graphical tool was created allowing a designer to visualise thetradeoff between total savings and payback time shown in Figure 66 A small region around the crossoverpoint of the two plots shows the specifications of the optimum batteries By creating a set of rules (eg thebattery must have a payback period less than seven years) all the solutions become immediately apparent Asmall shortlist of the batteries can be made referring to the original list of Powerpack specifications
0 500 1000 1500 2000 2500
Battery Size kWh
06
08
1
12
14
16
18
2
Tota
l Savi
ngs
pound
106
62
64
66
68
7
72
74
76
78
8
82
Payb
ack
Tim
e Y
ears
Comparision of Top Batteries based onSize for Payback Time And Total Savings
0 200 400 600 800 1000 1200 1400
Max Power kW
04
06
08
1
12
14
16
18
2
Tota
l Savi
ngs
pound
106
6
65
7
75
8
85
Payb
ack
Tim
e Y
ears
Comparision of Top Batteries based onMax Power for Payback Time And Total Savings
1862kWh1662kWh
1762kWh175
645173
8444kW
7444kW
Figure 66 Comparison Between Fit Curves for Payback Period and Total Savings
The regions of the best trade-off between payback time and total savings (aroundwhere the twoplots intersect)are highlighted in Figure66 The results show that a battery around 1762kWh and 7444kW produces a goodcompromise Increasing capacity beyond this would increase total savings thus quickly decreasing pay backperiod Alternatively when looking at max power payback time increases slightly as power decreases Uptop 950kW total savings dramatically increase with very little decrease in payback time The green regionhighlights the area after the intersection point This shows that a battery larger than 745kW but smaller than950kW is optimum
Alexander Charles 23
6 RESULTSMeasuring the payback period is necessary when evaluating the risk of investing in a battery The longer thepayback time the greater the risk in either the battery failing or regulation changing diminishing the batteriesvalue o The Powerpack 2 specifications modelled have a ten-year warranty this eliminates any risk if thebattery were to fail before this period Changes in energy billing are therefore the biggest risk the technologyfaces Energy contracts typically last no longer than four years [77] after which a change in pricing schemecould reduce the batterys value to zero Knowing that 2
3 of the investment has a very low risk of uncertaintyrather than 1
2 makes the investmentmuchmore attractive These factors should be consideredwhen choosingthe design region of battery selection For a structural investment a payback period of five and seven years isdeemed safe Since the optimum battery payback time is 63 years (which falls within the range) investing inLi-ion appears feasible
62 Net Present Value ResultsThe net present value was the second method used to assess the battery systems worth As long paybackperiods are inherently risky NPV uses discount rates to devalue cash that is made further in the future Asdiscussed in section 321 the Internal Return Rate was found This calculation found that for the range ofbatteries accessed the average IRR fell between 2 and 15 at 11 Three discount rates of 3 7 and 12were selected to understand the value of the different batteries based on the IRR calculation Figure 67 showsthe net present values of the various simulated batteries at these different rates
0 500 1000 1500 2000 2500
Battery Size kWh
0
2
4
6
8
10
12
Net P
rese
nt V
alu
e pound
105Net Present Value Based on Battery Size
and Power 3 Discount Rate
Max Fit Curve
0 500 1000 1500 2000 2500
Battery Size kWh
-1
0
1
2
3
4
5
Net P
rese
nt V
alu
e pound
105
Net Present Value Based on Battery Sizeand Power 7 Discount Rate
Max Fit Curve
0 500 1000 1500 2000 2500Battery Size kWh
-3
-2
-1
0
1
Net P
rese
nt V
alu
e pound
105Net Present Value Based on Battery Size
and Power 12 Discount Rate
Max Fit Curve
0 500 1000 1500 2000Battery Size kWh
0
2
4
6
8
10
12
Net P
rese
nt V
alu
e pound
105Net Present Value Fit Battery Based on Size
and Power Different Discount Rates
3712
200
400
600
800
1000
1200
Max
Pow
er
kW
Figure 67 Net Present value at Different Discount Rates - Comparison
Using the different NPV rates presented conflicting optimum batteries Increasing discount rate favouredsmaller batteries Looking at the results it was decided that a batteries a 7 discount rate the following as-
oSee Table 1 for a more detailed description of the challenges that an ESS system faces
Alexander Charles 24
6 RESULTSsumptions
bull Battery Health As the battery will degrade each year until it reaches its end of life value the assumptioncan be made that the value of the asset decreases proportionally to the batterys health Looking at theoptimum battery at a discount rate of 7 (see Table 4 below) it can be observed that the specific batteryran for 4980 cycles Based on this assumption the value of the battery would be 99 of its original valueequating to a discount rate of ~398 over the 25 year period As each battery degrades differently thediscount rate due to batterys healthy can be approximated to 4
bull Inflation Inflation is another factor of the discount rate For the UK this rate has varied between -01and 35 for the last five years [78] It is expected that the price of energy bills will increase with inflationtherefore this can be neglected in the discount rate assumption
bull Interest Rates Discount rates can be used to incorporate interests on loans As the battery would bepurchased at the same time as the rest of the new campus it is assumed that the battery will be boughtunder the new campuss mortgage keeping the interest rate low approximated to 3
Using these approximations gives a discount rate of around 7 shown in figure 67
63 Battery Health AnalysisTo reduce computational time and simplify the model assumptions were made to confine the battery to neverwork outside of normal working parameters Section 33 discussed how discharge time and depth of dis-charge effect the battery lifetime Based on experimental data equations on how these factors have an effecton capacity were found The model measured the average depth of discharge and discharge time allowingthese parameters to be analysed after completing the simulation Understanding the effect of these paramet-ers increases the validity of results Figure 68 and 69 show the trend between the depth of discharge anddischarge for the different batteries
0 500 1000 1500 2000 2500
Battery Size kWh
20
30
40
50
60
70
80
90
Me
an
De
pth
of
Dis
cha
rge
Mean Depth of Discharge vs Battery Size
200
400
600
800
1000
1200
Max
Pow
er
kW
0 200 400 600 800 1000 1200 1400
Max Power kW
20
30
40
50
60
70
80
90
Me
an
De
pth
of
Dis
cha
rge
Mean Depth of Discharge vs Max Power
500
1000
1500
2000
Battery
Siz
e kW
h
Figure 68 Depth of Discharge For Battery Lifetime
0 500 1000 1500 2000 2500
Battery Size kWh
1
2
3
4
5
6
7
8
9
Me
an
Dis
cha
rge
Tim
e
Ho
urs
Mean Discharge Time vs Battery Size
200
400
600
800
1000
1200
Max
Pow
er
kW
0 200 400 600 800 1000 1200 1400
Max Power kW
1
2
3
4
5
6
7
8
9
Me
an
Dis
cha
rge
Tim
e
Ho
urs
Mean Discharge Time vs Max Power
500
1000
1500
2000
Battery
Siz
e kW
h
Figure 69 Expected Capacity Offset Due to DischargeRate and Depth of Discharge
Alexander Charles 25
6 RESULTSThe patterns observed in Figures 68 and 69 occur due to the difference between maximum power and max-imumcapacity Comparing these result to Figure 63 it is understood that the batteries achieving themaximumtotal savings have DOD greater than 70 but are not always fully discharged Batteries appear to fall into twocategories one of the highmean depth of discharge between 70-80 andonewith amean depth of dischargearound 50 This is a result of the relationship between capacity and max power limiting the possible depthof discharge that the battery could reach in the two-hours red rate period The discharge rate in Figure 69shows as capacity increases discharge rate also increases almost doubling for high powered low capacitybatteries
Using the polynomial equations outlined in Figures 34 and 35 an additional performance parameter describ-ing a more realistic end cycle life size was found based on these two measurements The results are shown inFigure 610
500 1000 1500 2000
Battery Size kWh
3000
4000
5000
6000
7000
8000
9000
10000
11000
12000
Cyc
le L
ife (
Offse
t) (D
imensi
onle
ss)
Battery Size vs Capacity Offset
200
400
600
800
1000
1200
Ma
x P
ow
er
kW
Figure 610 Showing the Expected Effect of Depth of Discharge and Discharge Time on Predicted Cycle Life
It is clear from Figure 610 that taking into account DOD and discharge time the lifetime of the battery caneither be reduced or increased significantly Since not all batteries will fully degrade by the end of the 25year lifetime slightly reduced capacity may not be a problem as the battery should still be functional beyondthe end of life value From research it appears that depth of discharge can have a more dramatic effect onthe batteries lifetime To make experimental effects of DOD comparable for the Powerpack a conservativeassumption that the batteries DOD rate was 70 was made [60] however notes that it is possible higherDOD were used to achieve the 5000 cycle life This would decrease the effect of DOD significantly meaningmany more batteries would increase in cycle life rather than decrease For both these reasons it is unclearwhether the error in predicting battery health will have a significant effect on the batterys value
64 Discussion on Optimum BatteryTable 4 show the optimum battery configurations based on the metrics discussed perviously
Alexander Charles 26
6 RESULTSTable 4 Table Showing the Best Battery Results Comparing the different Economic Measurements
NPV Total Savings Payback Max PlotBattery Power (kW) 1050 1200 450 900
Battery Capacity (kWh) 2000 2280 860 1710Purchase Cost (pound) 803630 915980 343100 683420
Total Saved (pound) 1912775 1969808 870561 1765193ROI () 238 215 254 258
Payback (Years) 695 759 636 653NPV 7 (pound) 522613 483657 256381 498150
IRR () 14 12 15 15Mean DoD () 764 722 800 784
Mean Discharge (hrs) 240 280 173 210Years Run 250 250 240 245
Annulised Savings (pound) 76511 78792 36302 72117Cycles Complete 4980 4709 5000 5000Predicted Health 3960 4384 3476 3721
ParameterHighest Performers
The following observations can be made from the results
bull The difference in NPV between the best NPV total savings andmax plot values are around pound40000 Thisis relatively marginal against the total cost of the investment
bull A difference of only a years payback time can be observed by all the best performing batteriesbull All the batteries are run towards their maximum working threshold with high DOD and mean dischargetimes
bull Themaximumplot specification battery gives the highest Return on Investment (ROI) this measure helpsunderstand how much money is made compared to how much was invested
bull Annualised savings of all the battery excluding lowest payback ranges by pound6000 only Between maxplot and total savings an increase in 35 in upfront cost creates only 9 more yield a year
bull Selecting a battery based on the lowest payback period has a significantly lower NPV and the likelihoodof it failing before it reaches 5000 cycles is likely
bull Selecting the battery with the largest total savings will have the highest probability of not wearing outbefore it reaches the end of life
65 Sensitivity Analysis on Energy PricingChange in energypricing is the greatest uncertainty that battery technology faces A conversationwithWesternPower highlighted the likelihood of DUoS unit charges decreasing shortly To understand whether investingin battery storage is feasible Red red cost were to drop a range of different prices were simulated Figures611 shows the effect of decreasing the red rate DUoS charged on the maximum NPV (at 7) and minimumpayback periods
Alexander Charles 27
7 CONCLUSIONS AND FUTURE WORK
500 1000 1500 2000
Battery Size kWh
-4
-3
-2
-1
0
1
2
3
4
5
6T
ota
l Sa
vin
gs
105 Senstivity of NVP at 7 For Different DUoS Rates
81367122051627331830752441
Figure 611 Effect of a Decrease in Red Rate Charges(pence) on the NPV
500 1000 1500 2000
Battery Size kWh
6
7
8
9
10
11
12
13
14
Pa
yba
ck P
erio
d
Senstivity of Payback Time For Different DUoS Rates
122051627331830752441
Figure 612 Effect of a Decrease in Red Rate Charges(pence) on the Payback Period
The sensitivity analysis shows that there is still value in investing in battery storage for the new campus if the Redrate charge decreases up to 50 If the Red rate charge were to decrease beyond this point alternate batterystrategies would need to be accessed Looking at the NPV curves in Figure 611 smaller batteries becomemore favourable as the rate decreases This is due to the increase in payback time for the larger batteriesobserved in Figure 612 Choosing a battery which is smaller in capacity reduces the risk of the battery notpaying itself back if Red rate charges were to drop this should be regarded by the designer
7 Conclusions and Future WorkThis project sets out to evaluate the feasibility of investing in an ESS when developing the new Temple Quartercampus To successfully achieve this objective while making the results useful for the fifth year group designproject the following outcomes were produced
bull Energy Profile Tool to build and understand the New University Campuss Demandbull Optimised Battery System Model producing best storage solutions based on the energy profile toolbull Business case for battery technology investment
71 Conclusions on Modelling ToolsThe project successfully produced two tools which will be useful for the final year project The energy profiletool was built to allow a flexible array of different half hourly usage data To comply with the user interfacerequirements set in section 413 the tool allows for the names of the data files to be inputted and the toolwill then adjust and overlay the data correctly Combining this program with the data plotting tool generatessome useful graphs Being able to generate lots of different representative data quickly will aid next years workwhen analysing different heat and electricity profiles
The optimised battery system model meets the three modelling requirements Code optimisation and easeof development (412) were crucial adding increased functionality through additional battery strategies and
Alexander Charles 28
7 CONCLUSIONS AND FUTURE WORKmetrics The performance required tomake the tool quick and easy for the designer was successfully achievedreducing the full simulation runtimedown to 200 seconds A user will be able to easily choose an energy profilethey want to simulate (preferably processed by the energy profile tool although not a requirement) and arange of battery specifications resulting in the output of graphs shown in the results An optimum battery canbe selected using different graphs and results produced thusmaking it a useful tool not only in understandingthe business case but also in aiding a designer in selecting the most appropriate battery
The tool will remain valid for other batteries and will is not limited to just the Tesla Powerpack This is due tothe specific parameters such as cycle life size power and price all being customisable in the model Also theassumptions made are mostly generic to Li-ion technology This will increase the functionality if the broaderrange of ESS systems is required although additional refinement is recommended
72 Conclusions on Temple Quarter Campus ResultsThe project confirms that there is a strong business case for investing in Li-ion storage when developing thenew TempleQuarter Campus From the shortlist of optimum Tesla Powerpack batteries all achieved a paybackperiod of fewer than seven years After the battery has paid itself back there is minimal input or costs arerequired to keep the storage system functioning Theoretically the battery continues to generate savingsbeyond the end of life thus increasing the value of the battery further
If the system is installed into the new campus the Powerpacks modular design will make it feasible to swapthe batteries out once they have worn-out or the technology has significantly improved Li-ion technologyhas improved significantly over the last ten years and will continue to do so following the rise in electric carownership
Referring to the challenges discussed in Table 1 the following can be concluded from the project on how theseseverity challenges have been overcome through research and modelling
bull Costs of purchase too high the model proves that finance is only required for seven years until thebattery pays itself back Since the battery will be purchased as part of the new campus assets along withthe buildings land and other equipment a very low-interest rate will be taken on the battery Within thisperiod the battery will be covered under warranty reducing the risk of the battery failing before returninga positive cash flow
bull Lifetime longevity of the battery too low research and modelling have identified that it is likely that thebattery will last up to or beyond the 25 year runtime period This can be achieved by controlling howthe battery is run preventing it from falling out of these boundaries Secondary analysis of the effects ofdepth of discharge and discharge rate confirm that most batteries should produce the value simulatedin the model
bull Frequent change to regulation and barriers to entry This is still the largest barrier to entry Discussionswith Western Power [77] noted that DUoS prices are very likely to change over this period where it is ex-pected that DUoS rates will decrease while capacity charge will increase consistently Due to the addedflexibility that fast frequency responses Li-ion battery offer it is in the energy suppliers interest to encour-
Alexander Charles 29
7 CONCLUSIONS AND FUTURE WORKage the customer to purchase this technology rather than penalise its use It is likely that further changein regulation will support the use of Li-ion batteries which could increase the batteries value further inthe future
bull Technology still maturing the model has made it clear that Li-ion is now ready to be used to reduce peakdemand
Finally along with being a financial asset using energy storage to reduce peak demand will help to reducethe Universitys emissions significantly The model forecasts that the new campus will use up to 18MWh ofelectricity a day during peak timesEliminating usage during this period would cut back energy producedfrom dirty fuel sources up to 576kg of C02 per day
73 Future WorkThe following work is suggested to improve the model
1 Further development is necessary to validate the degradation model Implementing the depth of dis-charge and discharge time calculations into the model will cause the validity of the results to improveThis can be integrated either through running the simulation twice using the mean values as the newend of life cycle counter or by creating an algorithm that calculates the effects on the fly
2 There is a lack of data on energy usagewithin university rooms particularly engineering and biology labscomputer rooms and lecture halls Due to this a simulation of thedifferencebetween a centralisedbatterysystem (modelled) anddecentralised system (where lots of smaller batteries are usedon a localisedbasis)could not be modelled This is an area of highly unexplored work where technologies such as the TeslaPowerwall could be used
3 An evaluation of other methods to increase the value of the battery such as capacity charges and FITshould be assessed
4 Research highlighted that a battery could be used to create a fixed demand profile for the new campusThe new campus will have to pay large upfront costs of planting supply lines to connect the campus tothe grid The ability to set the energy profile of the campus would dramatically reduce this cost Furtherresearchmay identify that the reduction in connection fee costsmay cover the upfront costs of the battery
Alexander Charles 30
REFERENCES
References[1] (Nov 2016) November new pound300 million campus will transform temple quarter | news | university of
bristol [Online] Available httpwwwbristolacuknews2016novembertemple-quarter-campushtml (visited on 08122016)
[2] S E GB (2016) The voice of the smart meter rollout [Online] Available httpswwwsmartenergygborgen (visited on 08122016)
[3] UoB (2016) Our vision our strategy [Online] Available httpwwwbristolacukmedia-librarysitesuniversitydocumentsgovernancepoliciesuniversity-strategypdf (visited on 08122016)
[4] P Cooper Project meeting with arup Personal Communications Nov 2016
[5] (2017) G b national grid status [Online] Available httpwwwgridwatchtemplarcoukindexphp(visited on 24032017)
[6] G Wright (Jan 2013) Reducing peak demand lowering prices but what about emissions [Online]Available http theconversation comreducing- peak- demand- lowering- prices - but - what - about -emissions-11564 (visited on 24032017)
[7] T Lea (Apr 2016) Part 1 attempting to measure and understand the co2 intensity of grid electricity -blog | openenergymonitor [Online] Available httpsblogopenenergymonitororg201604Understand-CO2-intensity-grid-electricity (visited on 24032017)
[8] J Brenton and C JonesMeeting Personal Communications Nov 2016
[9] (Feb 2014) Use of system charging statement [Online] Available httpswwwwesternpowercoukdocssystem-chargesUse-of-System2014SWEB-2014-2015aspx (visited on 10122016)
[10] (Sep 2012) Deconstructing your energy bill capacity charges [Online] Available httpwwwenergysmartenernoccomdeconstructing-your-energy-bill-capacity-charges (visited on 09122016)
[11] N Grid (2014) Triads why three is the magic number - national grid [Online] Available httpnationalgridconnectingcomtriads-why-three-is-the-magic-number (visited on 09122016)
[12] PCMG (2012) Tnuos (transmission network use of system) charges and triads [Online] Available http www pcmg co uk services energy tnuos - transmission - network - use - of - system - charges - and -triadshtmlL=02FRK3D02FRS3DL1v24MDxrTlEQk4XnNhR0chgJ14- (visited on 09122016)
[13] E Energy (2015) Tnuos chargepdf [Online] Available https wwweonenergycomfor - your- business large- energy- usersUnderstand- Energy~mediaPDFsFor- your- businessLarge- Energy-Users3rd20Party20ChargesTNUoS20chargepdf (visited on 09122016)
[14] S Electric (2007) Reducing energy costs with peak shaving [Online] Available httpswwwschneider-electriccomhkdocumentsenergy-efficiency-forumReducing-Energy-Costs-with-Peak-Shavingpdf(visited on 27112016)
Alexander Charles 31
REFERENCES[15] Baldor (2005) Energy management best practices energy management best practices - peak shaving
generators [Online] Available http wwwsustainableplant comassets WP00010 pdf (visited on30112016)
[16] S Barker A Mishra D Irwin P Shenoy and J Albrecht lsquoSmartcap flattening peak electricity demand insmart homesrsquo in 2012 IEEE International Conference on Pervasive Computing and Communications Mar2012 pp 67ndash75 doi 101109PerCom20126199851
[17] S B S Inc (2012) Reducing utility demand charges pdf [Online] Available httpwwwsbsbatterycomPDFsReducingUtilityDemandChargespdf (visited on 27112016)
[18] R T de Salis A Clarke Z Wang J Moyne and D M Tilbury lsquoEnergy storage control for peak shavingin a single buildingrsquo in 2014 IEEE PES General Meeting | Conference Exposition Jul 2014 pp 1ndash5 doi101109PESGM20146938948
[19] T R PoulsenMeeting with the university of copenhagen Personal Communications Jan 2017
[20] J Shen C Jiang Y Liu and J Qian lsquoAmicrogrid energymanagement systemwith demand response forproviding grid peak shavingrsquo Electric Power Components and Systems vol 44 no 8 pp 843ndash852 2016doi 1010801532500820161138344 [Online] Available httpdxdoiorg1010801532500820161138344
[21] C Priest Chris priest iodicus project correspondance Email Correspondance Jan 2017
[22] ABB (2016) Peak shaving [Online] Available httpwwwabb-energystoragesolutionscom_ga=112385165812952669031480518807 (visited on 30112016)
[23] T Sauter and M Lobashov lsquoEnd-to-end communication architecture for smart gridsrsquo IEEE Transactionson Industrial Electronics vol 58 no 4 pp 1218ndash1228 Apr 2011 issn 0278-0046 doi 101109TIE20102070771
[24] I One-Cycle Control (2012) Peak load reduction with lithium iron battery energy storage peak shaving[Online] Available httpwwwonecyclecontrolcomOCC-PLR-producthtml (visited on 07122016)
[25] G T Smedley lsquoDemonstration of one-cycle control peak load regulator (occ-plr) systemrsquo California En-ergy Commission Tech Rep 2013 [Online] Available httpwwwenergycagov2014publicationsCEC-500-2014-100CEC-500-2014-100pdf (visited on 07122016)
[26] E Telaretti and L Dusonchet lsquoBattery storage systems for peak load shaving applications part 2 eco-nomic feasibility and sensitivity analysisrsquo in 2016 IEEE 16th International Conference on Environment andElectrical Engineering (EEEIC) Jun 2016 pp 1ndash6 doi 101109EEEIC20167555795
[27] W Hu Z Chen and B Bak-Jensen lsquoOptimal operation strategy of battery energy storage system to real-time electricity price in denmarkrsquo in IEEE PES General Meeting Jul 2010 pp 1ndash7 doi 101109PES20105590194
Alexander Charles 32
REFERENCES[28] C J Bennett R A Stewart and J W Lu lsquoDevelopment of a three-phase battery energy storage schedul-
ing and operation system for low voltage distribution networksrsquo Applied Energy vol 146 pp 122 ndash1342015 issn 0306-2619 doi httpdxdoiorg101016japenergy201502012 [Online] AvailablehttpwwwsciencedirectcomsciencearticlepiiS0306261915001841
[29] IEA lsquoTechnology roadmap energy storagersquo International Energy Agency Tech Rep 2014 [Online]Available httpswwwieaorgpublicationsfreepublicationspublicationTechnologyRoadmapEnergystoragepdf
[30] E M G Rodrigues R Godina G J Osoacuterio J M Lujano-Rojas J C O Matias and J P S Catalatildeo lsquoCom-parison of battery models for energy storage applications on insular gridsrsquo in 2015 Australasian Univer-sities Power Engineering Conference (AUPEC) Sep 2015 pp 1ndash6 doi 101109AUPEC20157324861
[31] S R Deeba R Sharma T K Saha D Chakraborty and A Thomas lsquoEvaluation of technical and finan-cial benefits of battery-based energy storage systems in distribution networksrsquo IET Renewable PowerGeneration vol 10 no 8 pp 1149ndash1160 2016 issn 1752-1416 doi 101049iet-rpg20150440
[32] A Allik M Maumlrss J Uiga and A Annuk lsquoOptimization of the inverter size for grid-connected residentialwind energy systems with peak shavingrsquo Renewable Energy vol 99 pp 1116 ndash1125 2016 issn 0960-1481 doi httpdxdoiorg101016jrenene201608016 [Online] Available httpwwwsciencedirectcomsciencearticlepiiS0960148116307170
[33] J Leadbetter and L Swan lsquoBattery storage system for residential electricity peak demand shavingrsquo En-ergy and Buildings vol 55 pp 685 ndash692 2012 Cool Roofs Cool Pavements Cool Cities and CoolWorld issn 0378-7788 doi httpdxdoiorg101016jenbuild201209035 [Online] AvailablehttpwwwsciencedirectcomsciencearticlepiiS0378778812004896
[34] E Telaretti and L Dusonchet lsquoBattery storage systems for peak load shaving applications part 1 oper-ating strategy and modification of the power diagramrsquo in 2016 IEEE 16th International Conference onEnvironment and Electrical Engineering (EEEIC) Jun 2016 pp 1ndash6 doi 101109EEEIC20167555793
[35] J Malinowski and K Kaderly lsquoPeak shaving - a method to reduce utility costsrsquo in Region 5 ConferenceAnnual Technical and Leadership Workshop 2004 Apr 2004 pp 41ndash44 doi 10 1109REG5 2004 1300158
[36] O Lavrova F Cheng S Abdollahy H Barsun A Mammoli D Dreisigmayer S Willard B Arellano andC van Zeyl lsquoAnalysis of battery storage utilization for load shifting and peak smoothing on a distributionfeeder in new mexicorsquo in 2012 IEEE PES Innovative Smart Grid Technologies (ISGT) Jan 2012 pp 1ndash6doi 101109ISGT20126175723
[37] L C Hau and Y S Lim lsquoA real-time active peak demand reduction for battery energy storage with lim-ited capacityrsquo English Journal of Communications vol 11 no 9 pp 841 ndash847 2016 Battery energystorageBessControl strategiesEnergy storage systemsFundamental controlLimited capacityPeak de-mandSimulation evaluation issn 17962021 [Online] Available httpdxdoiorg1012720jcm119841-847
Alexander Charles 33
REFERENCES[38] B Aksanli T Rosing and E Pettis lsquoDistributed battery control for peak power shaving in datacentersrsquo in
2013 International Green Computing Conference Proceedings Jun 2013 pp 1ndash8 doi 101109IGCC20136604477
[39] S V Giannoutsos and S N Manias lsquoA cascade control scheme for a grid connected battery energystorage system (bess)rsquo in 2012 IEEE International Energy Conference and Exhibition (ENERGYCON) Sep2012 pp 469ndash474 doi 101109EnergyCon20126348200
[40] A Lucas and S Chondrogiannis lsquoSmart grid energy storage controller for frequency regulation and peakshaving using a vanadium redox flow batteryrsquo English International Journal of Electrical Power and En-ergy Systems vol 80 pp 26 ndash36 2016 Fast charging stationsFrequency regulationsGrid connectedsystemsGrid StorageMedium voltage substationsPeak shavingSmart gridVanadium redox flow bat-teries issn 01420615 [Online] Available httpdxdoiorg101016jijepes201601025
[41] Y Levron and D Shmilovitz lsquoPower systems optimal peak-shaving applying secondary storagersquo Elec-tric Power Systems Research vol 89 pp 80 ndash84 2012 issn 0378-7796 doi http dx doi org10 1016 j epsr 2012 02 007 [Online] Available http wwwsciencedirect comsciencearticle pii S037877961200048X
[42] Y Levron and D Shmilovitz lsquoOptimal power management in fueled systems with finite storage capacityrsquoIEEE Transactions on Circuits and Systems I Regular Papers vol 57 no 8 pp 2221ndash2231 Aug 2010issn 1549-8328 doi 101109TCSI20092037405
[43] H Chen T N Cong W Yang C Tan Y Li and Y Ding lsquoProgress in electrical energy storage systema critical reviewrsquo Progress in Natural Science vol 19 no 3 pp 291 ndash312 2009 issn 1002-0071 doihttpdxdoiorg101016jpnsc200807014 [Online] Available httpwwwsciencedirectcomsciencearticlepiiS100200710800381X
[44] Q Liao B Sun Y Liu J Sun and G Zhou lsquoA technoeconomic analysis on nas battery energy storagesystem supporting peak shavingrsquo International Journal of Energy Research vol 40 no 2 pp 241ndash247Feb 2016 issn 1099-114X doi 101002er3460 [Online] Available httphttpsdxdoiorg101002er3460
[45] B Dunn H Kamath and J-M Tarascon lsquoElectrical energy storage for the grid a battery of choicesrsquo Sci-ence vol 334 no 6058 pp 928ndash935 2011 issn 0036-8075 doi 101126science1212741 [Online]Available httpsciencesciencemagorgcontent3346058928
[46] B Garg (2012) Introduction to flow batteries theory and applications [Online] Available httplargestanfordeducourses2011ph240garg1 (visited on 30112016)
[47] B Univeristy (2016) Comparison table of secondary batteries [Online] Available httpbatteryuniversitycomlearnarticlesecondary_batteries (visited on 30112016)
Alexander Charles 34
REFERENCES[48] A Choudar D Boukhetala S Barkat and J-M Brucker lsquoA local energy management of a hybrid
pv-storage based distributed generation for microgridsrsquo Energy Conversion and Management vol 90pp 21 ndash33 2015 issn 0196-8904 doi httpdxdoiorg101016jenconman201410067 [Online]Available httpwwwsciencedirectcomsciencearticlepiiS0196890414009625
[49] (2017) Powerpack | commercial and utility energy storage solutions [Online] Available httpswwwteslacomen_GBpowerpack (visited on 29032017)
[50] S M Knupfer R Hensley P Hertzke and P Schaufuss lsquoElectrifying insights how automakers can driveelectrified vehicle sales and profitabilityrsquo Mckinsey amp Company Tech Rep 2017
[51] (2017) Net present value - npv [Online] Available httpwwwinvestopediacomtermsnnpvasp(visited on 24032017)
[52] P Y-D Lyuu Numerical methods for yields Lecture Slides 205 [Online] Available httpswwwcsientuedutw~lyuufinance1200520050302pdf (visited on 24032017)
[53] N DiOrio A Dobos and S Janzou lsquoEconomic analysis case studies of battery energy storage with samrsquoNational Renewable Energy Laboratory Denver CO USA 2015
[54] R Spotnitz lsquoSimulation of capacity fade in lithium-ion batteriesrsquo Journal of Power Sources vol 113no 1 pp 72ndash80 2003 [Online] Available http www sciencedirect com science article pii S0378775302004901
[55] (2013) The importance of testing pv batteries to the iec 61427 standard [Online] Available httpwwwtrojanbatterycompdfRE_IEC_61427_Standardpdf (visited on 27032017)
[56] C Lilly (Feb 2016) Renault to recycle evbatterieswith energy storage firm - zap-map [Online] Availablehttpswwwzap-mapcomrenault - to- recycle- ev-batteries-with- energy- storage- firm (visited on26032017)
[57] P Rong and M Pedram lsquoAn analytical model for predicting the remaining battery capacity of lithium-ionbatteriesrsquo IEEE Transactions on Very Large Scale Integration (VLSI) Systems vol 14 no 5 pp 441ndash4512006 [Online] Available httpdxdoiorg101109DATE20031253775
[58] (2017) Weather averages for london united kingdom [Online] Available httpwwwholiday-weathercomlondonaverages (visited on 25032017)
[59] () Battery life and how to improve it [Online] Available httpwwwmpowerukcomlifehtm (visited on15032017)
[60] (2015) Tesla will use different batteries for its grid products heres why [Online] Available http fortunecom20150518tesla-grid-batteries-chemistry (visited on 28032017)
[61] () Effects of discharge rate and temperature on battery capacity and life | engineers edge [Online] Avail-able http wwwengineersedge combattery discharge_ rate_ temperature_effects _battery htm(visited on 15032017)
Alexander Charles 35
REFERENCES[62] () Premature voltage cut-off - battery university [Online] Available httpbatteryuniversitycomlearn
articlepremature_voltage_cut_off (visited on 15032017)
[63] (2016) Battery performance characteristics - how to specify and test a battery [Online] Available httpwwwmpowerukcomperformancehtm (visited on 28032017)
[64] N Omar M Daowd P v d Bossche O Hegazy J Smekens T Coosemans and J v Mierlo lsquoRe-chargeable energy storage systems for plug-in hybrid electric vehicles---assessment of electricalcharacteristicsrsquo Energies vol 5 no 8 pp 2952ndash2988 2012
[65] N Omar P V d Bossche T Coosemans and J V Mierlo lsquoPeukert revisited---critical appraisal and needfor modification for lithium-ion batteriesrsquo Energies vol 6 no 11 pp 5625ndash5641 2013
[66] S S Choi and H S Lim lsquoFactors that affect cycle-life and possible degradation mechanisms of a li-ioncell based on licoo2rsquo Journal of Power Sources vol 111 no 1 pp 130 ndash136 2002 issn 0378-7753 doihttpdxdoiorg101016S0378-7753(02)00305-1 [Online] Available httpwwwsciencedirectcomsciencearticlepiiS0378775302003051
[67] () Charging lithium-ion batteries -- battery university [Online] Available httpbatteryuniversitycomlearnarticlecharging_lithium_ion_batteries (visited on 15032017)
[68] B Xu A Oudalov A Ulbig G Andersson and D Kirschen lsquoModeling of lithium-ion battery degradationfor cell life assessmentrsquo IEEE Transactions on Smart Grid 2016
[69] () Zero-dmodelling approachwith ansys products | valeacuterie gelbgras | pulse | linkedin [Online] Availablehttpswwwlinkedincompulsezero-d-modelling-approach-ansys-products-valC3A9rie-gelbgras(visited on 17032017)
[70] CIBSE Combined Heat and Power for Buildings - CIBSE AM12 2013 (2nd Edition) CIBSE 2013 isbn978-1-906846-30-5 [Online] Available httpappknovelcomhotlinktocidkpCHPBCIB1combined-heat-power-buildingscombined-heat-power-buildings
[71] lsquoTriads dates and times 2014 - 2015rsquo National Grid Tech Rep 2015 [Online] Available httpwww2nationalgrid comUK Industry - informationSystem- chargesElectricity - transmissionTransmission -Network-Use-of-System-ChargesTransmission-Charges-Triad-Data
[72] (Jul 2015) Charging for optimum battery life [Online] Available httpsforumsteslacomen_GBforumforumscharging-optimum-battery-life (visited on 26032017)
[73] (Feb 2016) Used renault ev batteries to be recycled into energy storage systems [Online] Availablehttpwwwfleetnewscouknewsenvironment20160205used-renault-ev-batteries-to-be-recycled-into-energy-storage-systems (visited on 26032017)
[74] PGetreuer lsquoWriting fastmatlab codersquoMathworks File Exchange5685 2009 [Online] Available URLhttpwwwmathworkscommatlabcentralfileexchange5685
[75] () Live data | sustainability at princeton [Online] Available httpsustainprincetonedulablive-data(visited on 18032017)
Alexander Charles 36
REFERENCES[76] AECOM lsquoHeat networks code of practice for the ukrsquo CIBSE Tech Rep 2015
[77] M Watson and M DaleWestern power discussion Meeting Minutes Mar 2017
[78] (2017) United kingdom inflation rate | 1989-2017 | data | chart | calendar [Online] Available httpwwwtradingeconomicscomunited-kingdominflation-cpi (visited on 22032017)
Alexander Charles 37

6 RESULTS
bull The new campus overall energy profile will have small peaks in demand only due it being very unlikely for lots of equipment with high power consumptions to be switched on together
50
bull Energy demand is assumed to be normally distributed between each half hour period 20bull Standard deviation of energy demand equals average between mean and max of data following the assumption that peaks sizes are proportional to the total demand
40
bull Daily variation negligible in energy usage is negligible assume profile is unlikely to change over battery lifetime
20
bull New campus profile is formed of Senate House Hall data and Lab data only scaled according to their total footprint size
30
bull Red rate periods remain the same for the duration of the simulation 50bull Energy prices and bills remain the same for the duration of the simulation 90bull TRIAD dates kept as close as possible to 41214 190115 020215 (no weekends used) 20bull TRIAD Bills are divided equally over the next billing year 10bull Battery degrades linearly from new to its end of life value of 80 20bull Battery parameters restrict battery to perform under normal use case 5000 cycles for a max depth of discharge of 80
40
bull Battery does not overheat is temperature controlled and allowed to cool over weekends so does temperatures effect is assumed reliable
20
bull Effect of depth of discharge and discharge rate on battery health is negligible based on normal constraints (effects discussed as secondary results)
80
bull Normal working parameters prevent over depletion or over charging from occurring 10bull Battery cycle life instantaneously degrades when charging 10bull Battery efficiency losses occur only when charging 20bull Trickle charging and minimum charge rate employed 10bull Battery has health monitoring equipment allowing its health to be optimised 20bull Current Powerpack 2 costs are used to evaluate the cost of the investment Assumed that the price will decrease and performance of batterys will improve at the time of the new campus build Current costs are therefore used as a worst case scenario
5
bullInstallation costs have been assumed negligible due to new campus build absorbing this 30bull Maintenance cost assumed not applicable as this cost will be very small 30
Assumptions Uncertainty
Batt
ery
Hea
lthBa
tter
y U
sage
Batt
ery
Cost
sEn
ergy
Pro
file
Ener
gy
Billi
ng
Themodel is limited to working with these parameters only Section 412 set an objective for the model to bedeveloped so these parameters can be easily changed allowing for themodel to be easily customised to workwith a different set of assumptions Modelling peaks in demand higher than those expected energy pricingchanging andDODanddischarge rate effect on capacity all have high levels of uncertainty in themodel Thesewere sensitivity checked to understand the effects of these assumptions being incorrect
6 ResultsThe objective of this report was to evaluate whether there is a strong business case for investing in energystorage technology for the New University Campus This section analyses the data gathered from the zero-dimensional model discussing the value which optimum battery specifications could bring to the new TempleQuarter campus Figures 61 and 62 describes the energy profile for the new campuss usage during Red rateperiods
Plot of Frequecy of Total Daily Red Rate Usage A Over a Year
600 800 1000 1200 1400 1600 1800
UsagekWh
0
2
4
6
8
10
12
14
16
18
20
Fre
quency
Figure 61 Histogram Showing Red Periods Total Daily Us-age Frequency
0 20 40 60 80 100
Time Spent at Load Over A Year
200
300
400
500
600
700
800
900
1000
1100
Po
we
r D
em
an
d
kW
Load Duaration Curve For Red Rate Demand Over a Year
Figure 62 Time Spent at Power Demand Level
Alexander Charles 21
6 RESULTSThese energy profile plots describe the range of battery specifications which should be simulated Figure61 shows how a battery with a usable capacity greater than ~1800kWh will have excess capacity to demandBy taking into account end of life degradation batteries with an end of life capacity of up to 2000kWh weremodelled Figure 62 describes the percentage of time the battery would spend atmax load A battery rated at920kWwould only be run at max load 10 of the time As discharge rate effects capacity batterys rated up to1300kWwere simulated Based on this analysis 65 different Powerpack 2 battery specifications were identifiedas plausible solutions
A 25 year runtime period was used to evaluate the battery performance overm chosen on the assumptionthat most technology in the building will be replaced by this point as the building begins to receive somerefurbishment Li-ion battery technology will also have significantly advanced or at least drop significantlyin price n Using a set period will also reduce uncertainty in battery health and prevent favouritism for largerbatteries An investor is unlikely to look beyond 25 years so savings made after these periods will not beconsidered The following results will talk through the three key value measurements discussed in section 32
61 Total Savings and Payback Period ResultsFigure 63 shows the parabolic shape with a local maximum between the battery size and the total savings Forthe new campus a battery size of around ~22MWh generated the maximum total savings over the simulationrun time In contrast Figure 64 highlights that amuch larger rangeof batteries fell close to the shortest paybacktime of 63years where power and capacity increased proportionally
0 500 1000 1500 2000
Battery Size kWh
02
04
06
08
1
12
14
16
18
2
Tota
l Savi
ng
106 Battery Size vs Total Saving
200
400
600
800
1000
1200
Max
Pow
er
kW
Max Fit Curve
Figure 63 Battery Size Vs Total Savings
0 500 1000 1500 2000 2500
Battery Size kWh
6
8
10
12
14
16
18
20
22
Pa
yba
ck T
ime
Y
ea
rs
Battery Size vs Payback Time
200
400
600
800
1000
1200
Max
Pow
er
kW
Max Fit Curve
Figure 64 Graph of Battery Size vs PayBack Time
Figures 63 and 64 begin to give a good insight into the financial performance of the battery Howeverpresented in this form it difficult for a designer to choose the optimum battery To make the results moreuseful an algorithm was made which generated best-fit plots over the maximum battery specifications forthe different total saving and payback time plots Figures 65 shows these curves plotted over the maximumvalues
mSee Page 27 of [76]nSee Figure 31 for a prediction in battery prices
Alexander Charles 22
6 RESULTS
500 1000 1500 2000 2500
Battery Size kWh
05
1
15
2
Tota
l Savi
ngs
pound
106 Battery Size vs Total Saving (Cond)
Max Fit Curve
0 500 1000 1500 2000 2500
Battery Size kWh
6
65
7
75
8
85
Payb
ack
Tim
e Y
ears
Battery Size vs Payback Time (Cond)
200
400
600
800
1000
1200
Ma
x P
ow
er
kW
Max Fit Curve
200 400 600 800 1000 1200 1400
Max Power kW
0
05
1
15
2
Tota
l Savi
ngs
pound
106 Max Power vs Total Saving (Cond)
Max Fit Curve
0 200 400 600 800 1000 1200 1400
Max Power kW
6
65
7
75
8
85
Payb
ack
Tim
e Y
ears
Max Power vs Payback Time (Cond)
500
1000
1500
2000
Ba
tte
ry S
ize
kW
Max Fit Curve
Figure 65 Graph Showing Top 40 Batteries with Fitted Curves for both Payback Time and Total Savings
By superimposing these max-fit curves a graphical tool was created allowing a designer to visualise thetradeoff between total savings and payback time shown in Figure 66 A small region around the crossoverpoint of the two plots shows the specifications of the optimum batteries By creating a set of rules (eg thebattery must have a payback period less than seven years) all the solutions become immediately apparent Asmall shortlist of the batteries can be made referring to the original list of Powerpack specifications
0 500 1000 1500 2000 2500
Battery Size kWh
06
08
1
12
14
16
18
2
Tota
l Savi
ngs
pound
106
62
64
66
68
7
72
74
76
78
8
82
Payb
ack
Tim
e Y
ears
Comparision of Top Batteries based onSize for Payback Time And Total Savings
0 200 400 600 800 1000 1200 1400
Max Power kW
04
06
08
1
12
14
16
18
2
Tota
l Savi
ngs
pound
106
6
65
7
75
8
85
Payb
ack
Tim
e Y
ears
Comparision of Top Batteries based onMax Power for Payback Time And Total Savings
1862kWh1662kWh
1762kWh175
645173
8444kW
7444kW
Figure 66 Comparison Between Fit Curves for Payback Period and Total Savings
The regions of the best trade-off between payback time and total savings (aroundwhere the twoplots intersect)are highlighted in Figure66 The results show that a battery around 1762kWh and 7444kW produces a goodcompromise Increasing capacity beyond this would increase total savings thus quickly decreasing pay backperiod Alternatively when looking at max power payback time increases slightly as power decreases Uptop 950kW total savings dramatically increase with very little decrease in payback time The green regionhighlights the area after the intersection point This shows that a battery larger than 745kW but smaller than950kW is optimum
Alexander Charles 23
6 RESULTSMeasuring the payback period is necessary when evaluating the risk of investing in a battery The longer thepayback time the greater the risk in either the battery failing or regulation changing diminishing the batteriesvalue o The Powerpack 2 specifications modelled have a ten-year warranty this eliminates any risk if thebattery were to fail before this period Changes in energy billing are therefore the biggest risk the technologyfaces Energy contracts typically last no longer than four years [77] after which a change in pricing schemecould reduce the batterys value to zero Knowing that 2
3 of the investment has a very low risk of uncertaintyrather than 1
2 makes the investmentmuchmore attractive These factors should be consideredwhen choosingthe design region of battery selection For a structural investment a payback period of five and seven years isdeemed safe Since the optimum battery payback time is 63 years (which falls within the range) investing inLi-ion appears feasible
62 Net Present Value ResultsThe net present value was the second method used to assess the battery systems worth As long paybackperiods are inherently risky NPV uses discount rates to devalue cash that is made further in the future Asdiscussed in section 321 the Internal Return Rate was found This calculation found that for the range ofbatteries accessed the average IRR fell between 2 and 15 at 11 Three discount rates of 3 7 and 12were selected to understand the value of the different batteries based on the IRR calculation Figure 67 showsthe net present values of the various simulated batteries at these different rates
0 500 1000 1500 2000 2500
Battery Size kWh
0
2
4
6
8
10
12
Net P
rese
nt V
alu
e pound
105Net Present Value Based on Battery Size
and Power 3 Discount Rate
Max Fit Curve
0 500 1000 1500 2000 2500
Battery Size kWh
-1
0
1
2
3
4
5
Net P
rese
nt V
alu
e pound
105
Net Present Value Based on Battery Sizeand Power 7 Discount Rate
Max Fit Curve
0 500 1000 1500 2000 2500Battery Size kWh
-3
-2
-1
0
1
Net P
rese
nt V
alu
e pound
105Net Present Value Based on Battery Size
and Power 12 Discount Rate
Max Fit Curve
0 500 1000 1500 2000Battery Size kWh
0
2
4
6
8
10
12
Net P
rese
nt V
alu
e pound
105Net Present Value Fit Battery Based on Size
and Power Different Discount Rates
3712
200
400
600
800
1000
1200
Max
Pow
er
kW
Figure 67 Net Present value at Different Discount Rates - Comparison
Using the different NPV rates presented conflicting optimum batteries Increasing discount rate favouredsmaller batteries Looking at the results it was decided that a batteries a 7 discount rate the following as-
oSee Table 1 for a more detailed description of the challenges that an ESS system faces
Alexander Charles 24
6 RESULTSsumptions
bull Battery Health As the battery will degrade each year until it reaches its end of life value the assumptioncan be made that the value of the asset decreases proportionally to the batterys health Looking at theoptimum battery at a discount rate of 7 (see Table 4 below) it can be observed that the specific batteryran for 4980 cycles Based on this assumption the value of the battery would be 99 of its original valueequating to a discount rate of ~398 over the 25 year period As each battery degrades differently thediscount rate due to batterys healthy can be approximated to 4
bull Inflation Inflation is another factor of the discount rate For the UK this rate has varied between -01and 35 for the last five years [78] It is expected that the price of energy bills will increase with inflationtherefore this can be neglected in the discount rate assumption
bull Interest Rates Discount rates can be used to incorporate interests on loans As the battery would bepurchased at the same time as the rest of the new campus it is assumed that the battery will be boughtunder the new campuss mortgage keeping the interest rate low approximated to 3
Using these approximations gives a discount rate of around 7 shown in figure 67
63 Battery Health AnalysisTo reduce computational time and simplify the model assumptions were made to confine the battery to neverwork outside of normal working parameters Section 33 discussed how discharge time and depth of dis-charge effect the battery lifetime Based on experimental data equations on how these factors have an effecton capacity were found The model measured the average depth of discharge and discharge time allowingthese parameters to be analysed after completing the simulation Understanding the effect of these paramet-ers increases the validity of results Figure 68 and 69 show the trend between the depth of discharge anddischarge for the different batteries
0 500 1000 1500 2000 2500
Battery Size kWh
20
30
40
50
60
70
80
90
Me
an
De
pth
of
Dis
cha
rge
Mean Depth of Discharge vs Battery Size
200
400
600
800
1000
1200
Max
Pow
er
kW
0 200 400 600 800 1000 1200 1400
Max Power kW
20
30
40
50
60
70
80
90
Me
an
De
pth
of
Dis
cha
rge
Mean Depth of Discharge vs Max Power
500
1000
1500
2000
Battery
Siz
e kW
h
Figure 68 Depth of Discharge For Battery Lifetime
0 500 1000 1500 2000 2500
Battery Size kWh
1
2
3
4
5
6
7
8
9
Me
an
Dis
cha
rge
Tim
e
Ho
urs
Mean Discharge Time vs Battery Size
200
400
600
800
1000
1200
Max
Pow
er
kW
0 200 400 600 800 1000 1200 1400
Max Power kW
1
2
3
4
5
6
7
8
9
Me
an
Dis
cha
rge
Tim
e
Ho
urs
Mean Discharge Time vs Max Power
500
1000
1500
2000
Battery
Siz
e kW
h
Figure 69 Expected Capacity Offset Due to DischargeRate and Depth of Discharge
Alexander Charles 25
6 RESULTSThe patterns observed in Figures 68 and 69 occur due to the difference between maximum power and max-imumcapacity Comparing these result to Figure 63 it is understood that the batteries achieving themaximumtotal savings have DOD greater than 70 but are not always fully discharged Batteries appear to fall into twocategories one of the highmean depth of discharge between 70-80 andonewith amean depth of dischargearound 50 This is a result of the relationship between capacity and max power limiting the possible depthof discharge that the battery could reach in the two-hours red rate period The discharge rate in Figure 69shows as capacity increases discharge rate also increases almost doubling for high powered low capacitybatteries
Using the polynomial equations outlined in Figures 34 and 35 an additional performance parameter describ-ing a more realistic end cycle life size was found based on these two measurements The results are shown inFigure 610
500 1000 1500 2000
Battery Size kWh
3000
4000
5000
6000
7000
8000
9000
10000
11000
12000
Cyc
le L
ife (
Offse
t) (D
imensi
onle
ss)
Battery Size vs Capacity Offset
200
400
600
800
1000
1200
Ma
x P
ow
er
kW
Figure 610 Showing the Expected Effect of Depth of Discharge and Discharge Time on Predicted Cycle Life
It is clear from Figure 610 that taking into account DOD and discharge time the lifetime of the battery caneither be reduced or increased significantly Since not all batteries will fully degrade by the end of the 25year lifetime slightly reduced capacity may not be a problem as the battery should still be functional beyondthe end of life value From research it appears that depth of discharge can have a more dramatic effect onthe batteries lifetime To make experimental effects of DOD comparable for the Powerpack a conservativeassumption that the batteries DOD rate was 70 was made [60] however notes that it is possible higherDOD were used to achieve the 5000 cycle life This would decrease the effect of DOD significantly meaningmany more batteries would increase in cycle life rather than decrease For both these reasons it is unclearwhether the error in predicting battery health will have a significant effect on the batterys value
64 Discussion on Optimum BatteryTable 4 show the optimum battery configurations based on the metrics discussed perviously
Alexander Charles 26
6 RESULTSTable 4 Table Showing the Best Battery Results Comparing the different Economic Measurements
NPV Total Savings Payback Max PlotBattery Power (kW) 1050 1200 450 900
Battery Capacity (kWh) 2000 2280 860 1710Purchase Cost (pound) 803630 915980 343100 683420
Total Saved (pound) 1912775 1969808 870561 1765193ROI () 238 215 254 258
Payback (Years) 695 759 636 653NPV 7 (pound) 522613 483657 256381 498150
IRR () 14 12 15 15Mean DoD () 764 722 800 784
Mean Discharge (hrs) 240 280 173 210Years Run 250 250 240 245
Annulised Savings (pound) 76511 78792 36302 72117Cycles Complete 4980 4709 5000 5000Predicted Health 3960 4384 3476 3721
ParameterHighest Performers
The following observations can be made from the results
bull The difference in NPV between the best NPV total savings andmax plot values are around pound40000 Thisis relatively marginal against the total cost of the investment
bull A difference of only a years payback time can be observed by all the best performing batteriesbull All the batteries are run towards their maximum working threshold with high DOD and mean dischargetimes
bull Themaximumplot specification battery gives the highest Return on Investment (ROI) this measure helpsunderstand how much money is made compared to how much was invested
bull Annualised savings of all the battery excluding lowest payback ranges by pound6000 only Between maxplot and total savings an increase in 35 in upfront cost creates only 9 more yield a year
bull Selecting a battery based on the lowest payback period has a significantly lower NPV and the likelihoodof it failing before it reaches 5000 cycles is likely
bull Selecting the battery with the largest total savings will have the highest probability of not wearing outbefore it reaches the end of life
65 Sensitivity Analysis on Energy PricingChange in energypricing is the greatest uncertainty that battery technology faces A conversationwithWesternPower highlighted the likelihood of DUoS unit charges decreasing shortly To understand whether investingin battery storage is feasible Red red cost were to drop a range of different prices were simulated Figures611 shows the effect of decreasing the red rate DUoS charged on the maximum NPV (at 7) and minimumpayback periods
Alexander Charles 27
7 CONCLUSIONS AND FUTURE WORK
500 1000 1500 2000
Battery Size kWh
-4
-3
-2
-1
0
1
2
3
4
5
6T
ota
l Sa
vin
gs
105 Senstivity of NVP at 7 For Different DUoS Rates
81367122051627331830752441
Figure 611 Effect of a Decrease in Red Rate Charges(pence) on the NPV
500 1000 1500 2000
Battery Size kWh
6
7
8
9
10
11
12
13
14
Pa
yba
ck P
erio
d
Senstivity of Payback Time For Different DUoS Rates
122051627331830752441
Figure 612 Effect of a Decrease in Red Rate Charges(pence) on the Payback Period
The sensitivity analysis shows that there is still value in investing in battery storage for the new campus if the Redrate charge decreases up to 50 If the Red rate charge were to decrease beyond this point alternate batterystrategies would need to be accessed Looking at the NPV curves in Figure 611 smaller batteries becomemore favourable as the rate decreases This is due to the increase in payback time for the larger batteriesobserved in Figure 612 Choosing a battery which is smaller in capacity reduces the risk of the battery notpaying itself back if Red rate charges were to drop this should be regarded by the designer
7 Conclusions and Future WorkThis project sets out to evaluate the feasibility of investing in an ESS when developing the new Temple Quartercampus To successfully achieve this objective while making the results useful for the fifth year group designproject the following outcomes were produced
bull Energy Profile Tool to build and understand the New University Campuss Demandbull Optimised Battery System Model producing best storage solutions based on the energy profile toolbull Business case for battery technology investment
71 Conclusions on Modelling ToolsThe project successfully produced two tools which will be useful for the final year project The energy profiletool was built to allow a flexible array of different half hourly usage data To comply with the user interfacerequirements set in section 413 the tool allows for the names of the data files to be inputted and the toolwill then adjust and overlay the data correctly Combining this program with the data plotting tool generatessome useful graphs Being able to generate lots of different representative data quickly will aid next years workwhen analysing different heat and electricity profiles
The optimised battery system model meets the three modelling requirements Code optimisation and easeof development (412) were crucial adding increased functionality through additional battery strategies and
Alexander Charles 28
7 CONCLUSIONS AND FUTURE WORKmetrics The performance required tomake the tool quick and easy for the designer was successfully achievedreducing the full simulation runtimedown to 200 seconds A user will be able to easily choose an energy profilethey want to simulate (preferably processed by the energy profile tool although not a requirement) and arange of battery specifications resulting in the output of graphs shown in the results An optimum battery canbe selected using different graphs and results produced thusmaking it a useful tool not only in understandingthe business case but also in aiding a designer in selecting the most appropriate battery
The tool will remain valid for other batteries and will is not limited to just the Tesla Powerpack This is due tothe specific parameters such as cycle life size power and price all being customisable in the model Also theassumptions made are mostly generic to Li-ion technology This will increase the functionality if the broaderrange of ESS systems is required although additional refinement is recommended
72 Conclusions on Temple Quarter Campus ResultsThe project confirms that there is a strong business case for investing in Li-ion storage when developing thenew TempleQuarter Campus From the shortlist of optimum Tesla Powerpack batteries all achieved a paybackperiod of fewer than seven years After the battery has paid itself back there is minimal input or costs arerequired to keep the storage system functioning Theoretically the battery continues to generate savingsbeyond the end of life thus increasing the value of the battery further
If the system is installed into the new campus the Powerpacks modular design will make it feasible to swapthe batteries out once they have worn-out or the technology has significantly improved Li-ion technologyhas improved significantly over the last ten years and will continue to do so following the rise in electric carownership
Referring to the challenges discussed in Table 1 the following can be concluded from the project on how theseseverity challenges have been overcome through research and modelling
bull Costs of purchase too high the model proves that finance is only required for seven years until thebattery pays itself back Since the battery will be purchased as part of the new campus assets along withthe buildings land and other equipment a very low-interest rate will be taken on the battery Within thisperiod the battery will be covered under warranty reducing the risk of the battery failing before returninga positive cash flow
bull Lifetime longevity of the battery too low research and modelling have identified that it is likely that thebattery will last up to or beyond the 25 year runtime period This can be achieved by controlling howthe battery is run preventing it from falling out of these boundaries Secondary analysis of the effects ofdepth of discharge and discharge rate confirm that most batteries should produce the value simulatedin the model
bull Frequent change to regulation and barriers to entry This is still the largest barrier to entry Discussionswith Western Power [77] noted that DUoS prices are very likely to change over this period where it is ex-pected that DUoS rates will decrease while capacity charge will increase consistently Due to the addedflexibility that fast frequency responses Li-ion battery offer it is in the energy suppliers interest to encour-
Alexander Charles 29
7 CONCLUSIONS AND FUTURE WORKage the customer to purchase this technology rather than penalise its use It is likely that further changein regulation will support the use of Li-ion batteries which could increase the batteries value further inthe future
bull Technology still maturing the model has made it clear that Li-ion is now ready to be used to reduce peakdemand
Finally along with being a financial asset using energy storage to reduce peak demand will help to reducethe Universitys emissions significantly The model forecasts that the new campus will use up to 18MWh ofelectricity a day during peak timesEliminating usage during this period would cut back energy producedfrom dirty fuel sources up to 576kg of C02 per day
73 Future WorkThe following work is suggested to improve the model
1 Further development is necessary to validate the degradation model Implementing the depth of dis-charge and discharge time calculations into the model will cause the validity of the results to improveThis can be integrated either through running the simulation twice using the mean values as the newend of life cycle counter or by creating an algorithm that calculates the effects on the fly
2 There is a lack of data on energy usagewithin university rooms particularly engineering and biology labscomputer rooms and lecture halls Due to this a simulation of thedifferencebetween a centralisedbatterysystem (modelled) anddecentralised system (where lots of smaller batteries are usedon a localisedbasis)could not be modelled This is an area of highly unexplored work where technologies such as the TeslaPowerwall could be used
3 An evaluation of other methods to increase the value of the battery such as capacity charges and FITshould be assessed
4 Research highlighted that a battery could be used to create a fixed demand profile for the new campusThe new campus will have to pay large upfront costs of planting supply lines to connect the campus tothe grid The ability to set the energy profile of the campus would dramatically reduce this cost Furtherresearchmay identify that the reduction in connection fee costsmay cover the upfront costs of the battery
Alexander Charles 30
REFERENCES
References[1] (Nov 2016) November new pound300 million campus will transform temple quarter | news | university of
bristol [Online] Available httpwwwbristolacuknews2016novembertemple-quarter-campushtml (visited on 08122016)
[2] S E GB (2016) The voice of the smart meter rollout [Online] Available httpswwwsmartenergygborgen (visited on 08122016)
[3] UoB (2016) Our vision our strategy [Online] Available httpwwwbristolacukmedia-librarysitesuniversitydocumentsgovernancepoliciesuniversity-strategypdf (visited on 08122016)
[4] P Cooper Project meeting with arup Personal Communications Nov 2016
[5] (2017) G b national grid status [Online] Available httpwwwgridwatchtemplarcoukindexphp(visited on 24032017)
[6] G Wright (Jan 2013) Reducing peak demand lowering prices but what about emissions [Online]Available http theconversation comreducing- peak- demand- lowering- prices - but - what - about -emissions-11564 (visited on 24032017)
[7] T Lea (Apr 2016) Part 1 attempting to measure and understand the co2 intensity of grid electricity -blog | openenergymonitor [Online] Available httpsblogopenenergymonitororg201604Understand-CO2-intensity-grid-electricity (visited on 24032017)
[8] J Brenton and C JonesMeeting Personal Communications Nov 2016
[9] (Feb 2014) Use of system charging statement [Online] Available httpswwwwesternpowercoukdocssystem-chargesUse-of-System2014SWEB-2014-2015aspx (visited on 10122016)
[10] (Sep 2012) Deconstructing your energy bill capacity charges [Online] Available httpwwwenergysmartenernoccomdeconstructing-your-energy-bill-capacity-charges (visited on 09122016)
[11] N Grid (2014) Triads why three is the magic number - national grid [Online] Available httpnationalgridconnectingcomtriads-why-three-is-the-magic-number (visited on 09122016)
[12] PCMG (2012) Tnuos (transmission network use of system) charges and triads [Online] Available http www pcmg co uk services energy tnuos - transmission - network - use - of - system - charges - and -triadshtmlL=02FRK3D02FRS3DL1v24MDxrTlEQk4XnNhR0chgJ14- (visited on 09122016)
[13] E Energy (2015) Tnuos chargepdf [Online] Available https wwweonenergycomfor - your- business large- energy- usersUnderstand- Energy~mediaPDFsFor- your- businessLarge- Energy-Users3rd20Party20ChargesTNUoS20chargepdf (visited on 09122016)
[14] S Electric (2007) Reducing energy costs with peak shaving [Online] Available httpswwwschneider-electriccomhkdocumentsenergy-efficiency-forumReducing-Energy-Costs-with-Peak-Shavingpdf(visited on 27112016)
Alexander Charles 31
REFERENCES[15] Baldor (2005) Energy management best practices energy management best practices - peak shaving
generators [Online] Available http wwwsustainableplant comassets WP00010 pdf (visited on30112016)
[16] S Barker A Mishra D Irwin P Shenoy and J Albrecht lsquoSmartcap flattening peak electricity demand insmart homesrsquo in 2012 IEEE International Conference on Pervasive Computing and Communications Mar2012 pp 67ndash75 doi 101109PerCom20126199851
[17] S B S Inc (2012) Reducing utility demand charges pdf [Online] Available httpwwwsbsbatterycomPDFsReducingUtilityDemandChargespdf (visited on 27112016)
[18] R T de Salis A Clarke Z Wang J Moyne and D M Tilbury lsquoEnergy storage control for peak shavingin a single buildingrsquo in 2014 IEEE PES General Meeting | Conference Exposition Jul 2014 pp 1ndash5 doi101109PESGM20146938948
[19] T R PoulsenMeeting with the university of copenhagen Personal Communications Jan 2017
[20] J Shen C Jiang Y Liu and J Qian lsquoAmicrogrid energymanagement systemwith demand response forproviding grid peak shavingrsquo Electric Power Components and Systems vol 44 no 8 pp 843ndash852 2016doi 1010801532500820161138344 [Online] Available httpdxdoiorg1010801532500820161138344
[21] C Priest Chris priest iodicus project correspondance Email Correspondance Jan 2017
[22] ABB (2016) Peak shaving [Online] Available httpwwwabb-energystoragesolutionscom_ga=112385165812952669031480518807 (visited on 30112016)
[23] T Sauter and M Lobashov lsquoEnd-to-end communication architecture for smart gridsrsquo IEEE Transactionson Industrial Electronics vol 58 no 4 pp 1218ndash1228 Apr 2011 issn 0278-0046 doi 101109TIE20102070771
[24] I One-Cycle Control (2012) Peak load reduction with lithium iron battery energy storage peak shaving[Online] Available httpwwwonecyclecontrolcomOCC-PLR-producthtml (visited on 07122016)
[25] G T Smedley lsquoDemonstration of one-cycle control peak load regulator (occ-plr) systemrsquo California En-ergy Commission Tech Rep 2013 [Online] Available httpwwwenergycagov2014publicationsCEC-500-2014-100CEC-500-2014-100pdf (visited on 07122016)
[26] E Telaretti and L Dusonchet lsquoBattery storage systems for peak load shaving applications part 2 eco-nomic feasibility and sensitivity analysisrsquo in 2016 IEEE 16th International Conference on Environment andElectrical Engineering (EEEIC) Jun 2016 pp 1ndash6 doi 101109EEEIC20167555795
[27] W Hu Z Chen and B Bak-Jensen lsquoOptimal operation strategy of battery energy storage system to real-time electricity price in denmarkrsquo in IEEE PES General Meeting Jul 2010 pp 1ndash7 doi 101109PES20105590194
Alexander Charles 32
REFERENCES[28] C J Bennett R A Stewart and J W Lu lsquoDevelopment of a three-phase battery energy storage schedul-
ing and operation system for low voltage distribution networksrsquo Applied Energy vol 146 pp 122 ndash1342015 issn 0306-2619 doi httpdxdoiorg101016japenergy201502012 [Online] AvailablehttpwwwsciencedirectcomsciencearticlepiiS0306261915001841
[29] IEA lsquoTechnology roadmap energy storagersquo International Energy Agency Tech Rep 2014 [Online]Available httpswwwieaorgpublicationsfreepublicationspublicationTechnologyRoadmapEnergystoragepdf
[30] E M G Rodrigues R Godina G J Osoacuterio J M Lujano-Rojas J C O Matias and J P S Catalatildeo lsquoCom-parison of battery models for energy storage applications on insular gridsrsquo in 2015 Australasian Univer-sities Power Engineering Conference (AUPEC) Sep 2015 pp 1ndash6 doi 101109AUPEC20157324861
[31] S R Deeba R Sharma T K Saha D Chakraborty and A Thomas lsquoEvaluation of technical and finan-cial benefits of battery-based energy storage systems in distribution networksrsquo IET Renewable PowerGeneration vol 10 no 8 pp 1149ndash1160 2016 issn 1752-1416 doi 101049iet-rpg20150440
[32] A Allik M Maumlrss J Uiga and A Annuk lsquoOptimization of the inverter size for grid-connected residentialwind energy systems with peak shavingrsquo Renewable Energy vol 99 pp 1116 ndash1125 2016 issn 0960-1481 doi httpdxdoiorg101016jrenene201608016 [Online] Available httpwwwsciencedirectcomsciencearticlepiiS0960148116307170
[33] J Leadbetter and L Swan lsquoBattery storage system for residential electricity peak demand shavingrsquo En-ergy and Buildings vol 55 pp 685 ndash692 2012 Cool Roofs Cool Pavements Cool Cities and CoolWorld issn 0378-7788 doi httpdxdoiorg101016jenbuild201209035 [Online] AvailablehttpwwwsciencedirectcomsciencearticlepiiS0378778812004896
[34] E Telaretti and L Dusonchet lsquoBattery storage systems for peak load shaving applications part 1 oper-ating strategy and modification of the power diagramrsquo in 2016 IEEE 16th International Conference onEnvironment and Electrical Engineering (EEEIC) Jun 2016 pp 1ndash6 doi 101109EEEIC20167555793
[35] J Malinowski and K Kaderly lsquoPeak shaving - a method to reduce utility costsrsquo in Region 5 ConferenceAnnual Technical and Leadership Workshop 2004 Apr 2004 pp 41ndash44 doi 10 1109REG5 2004 1300158
[36] O Lavrova F Cheng S Abdollahy H Barsun A Mammoli D Dreisigmayer S Willard B Arellano andC van Zeyl lsquoAnalysis of battery storage utilization for load shifting and peak smoothing on a distributionfeeder in new mexicorsquo in 2012 IEEE PES Innovative Smart Grid Technologies (ISGT) Jan 2012 pp 1ndash6doi 101109ISGT20126175723
[37] L C Hau and Y S Lim lsquoA real-time active peak demand reduction for battery energy storage with lim-ited capacityrsquo English Journal of Communications vol 11 no 9 pp 841 ndash847 2016 Battery energystorageBessControl strategiesEnergy storage systemsFundamental controlLimited capacityPeak de-mandSimulation evaluation issn 17962021 [Online] Available httpdxdoiorg1012720jcm119841-847
Alexander Charles 33
REFERENCES[38] B Aksanli T Rosing and E Pettis lsquoDistributed battery control for peak power shaving in datacentersrsquo in
2013 International Green Computing Conference Proceedings Jun 2013 pp 1ndash8 doi 101109IGCC20136604477
[39] S V Giannoutsos and S N Manias lsquoA cascade control scheme for a grid connected battery energystorage system (bess)rsquo in 2012 IEEE International Energy Conference and Exhibition (ENERGYCON) Sep2012 pp 469ndash474 doi 101109EnergyCon20126348200
[40] A Lucas and S Chondrogiannis lsquoSmart grid energy storage controller for frequency regulation and peakshaving using a vanadium redox flow batteryrsquo English International Journal of Electrical Power and En-ergy Systems vol 80 pp 26 ndash36 2016 Fast charging stationsFrequency regulationsGrid connectedsystemsGrid StorageMedium voltage substationsPeak shavingSmart gridVanadium redox flow bat-teries issn 01420615 [Online] Available httpdxdoiorg101016jijepes201601025
[41] Y Levron and D Shmilovitz lsquoPower systems optimal peak-shaving applying secondary storagersquo Elec-tric Power Systems Research vol 89 pp 80 ndash84 2012 issn 0378-7796 doi http dx doi org10 1016 j epsr 2012 02 007 [Online] Available http wwwsciencedirect comsciencearticle pii S037877961200048X
[42] Y Levron and D Shmilovitz lsquoOptimal power management in fueled systems with finite storage capacityrsquoIEEE Transactions on Circuits and Systems I Regular Papers vol 57 no 8 pp 2221ndash2231 Aug 2010issn 1549-8328 doi 101109TCSI20092037405
[43] H Chen T N Cong W Yang C Tan Y Li and Y Ding lsquoProgress in electrical energy storage systema critical reviewrsquo Progress in Natural Science vol 19 no 3 pp 291 ndash312 2009 issn 1002-0071 doihttpdxdoiorg101016jpnsc200807014 [Online] Available httpwwwsciencedirectcomsciencearticlepiiS100200710800381X
[44] Q Liao B Sun Y Liu J Sun and G Zhou lsquoA technoeconomic analysis on nas battery energy storagesystem supporting peak shavingrsquo International Journal of Energy Research vol 40 no 2 pp 241ndash247Feb 2016 issn 1099-114X doi 101002er3460 [Online] Available httphttpsdxdoiorg101002er3460
[45] B Dunn H Kamath and J-M Tarascon lsquoElectrical energy storage for the grid a battery of choicesrsquo Sci-ence vol 334 no 6058 pp 928ndash935 2011 issn 0036-8075 doi 101126science1212741 [Online]Available httpsciencesciencemagorgcontent3346058928
[46] B Garg (2012) Introduction to flow batteries theory and applications [Online] Available httplargestanfordeducourses2011ph240garg1 (visited on 30112016)
[47] B Univeristy (2016) Comparison table of secondary batteries [Online] Available httpbatteryuniversitycomlearnarticlesecondary_batteries (visited on 30112016)
Alexander Charles 34
REFERENCES[48] A Choudar D Boukhetala S Barkat and J-M Brucker lsquoA local energy management of a hybrid
pv-storage based distributed generation for microgridsrsquo Energy Conversion and Management vol 90pp 21 ndash33 2015 issn 0196-8904 doi httpdxdoiorg101016jenconman201410067 [Online]Available httpwwwsciencedirectcomsciencearticlepiiS0196890414009625
[49] (2017) Powerpack | commercial and utility energy storage solutions [Online] Available httpswwwteslacomen_GBpowerpack (visited on 29032017)
[50] S M Knupfer R Hensley P Hertzke and P Schaufuss lsquoElectrifying insights how automakers can driveelectrified vehicle sales and profitabilityrsquo Mckinsey amp Company Tech Rep 2017
[51] (2017) Net present value - npv [Online] Available httpwwwinvestopediacomtermsnnpvasp(visited on 24032017)
[52] P Y-D Lyuu Numerical methods for yields Lecture Slides 205 [Online] Available httpswwwcsientuedutw~lyuufinance1200520050302pdf (visited on 24032017)
[53] N DiOrio A Dobos and S Janzou lsquoEconomic analysis case studies of battery energy storage with samrsquoNational Renewable Energy Laboratory Denver CO USA 2015
[54] R Spotnitz lsquoSimulation of capacity fade in lithium-ion batteriesrsquo Journal of Power Sources vol 113no 1 pp 72ndash80 2003 [Online] Available http www sciencedirect com science article pii S0378775302004901
[55] (2013) The importance of testing pv batteries to the iec 61427 standard [Online] Available httpwwwtrojanbatterycompdfRE_IEC_61427_Standardpdf (visited on 27032017)
[56] C Lilly (Feb 2016) Renault to recycle evbatterieswith energy storage firm - zap-map [Online] Availablehttpswwwzap-mapcomrenault - to- recycle- ev-batteries-with- energy- storage- firm (visited on26032017)
[57] P Rong and M Pedram lsquoAn analytical model for predicting the remaining battery capacity of lithium-ionbatteriesrsquo IEEE Transactions on Very Large Scale Integration (VLSI) Systems vol 14 no 5 pp 441ndash4512006 [Online] Available httpdxdoiorg101109DATE20031253775
[58] (2017) Weather averages for london united kingdom [Online] Available httpwwwholiday-weathercomlondonaverages (visited on 25032017)
[59] () Battery life and how to improve it [Online] Available httpwwwmpowerukcomlifehtm (visited on15032017)
[60] (2015) Tesla will use different batteries for its grid products heres why [Online] Available http fortunecom20150518tesla-grid-batteries-chemistry (visited on 28032017)
[61] () Effects of discharge rate and temperature on battery capacity and life | engineers edge [Online] Avail-able http wwwengineersedge combattery discharge_ rate_ temperature_effects _battery htm(visited on 15032017)
Alexander Charles 35
REFERENCES[62] () Premature voltage cut-off - battery university [Online] Available httpbatteryuniversitycomlearn
articlepremature_voltage_cut_off (visited on 15032017)
[63] (2016) Battery performance characteristics - how to specify and test a battery [Online] Available httpwwwmpowerukcomperformancehtm (visited on 28032017)
[64] N Omar M Daowd P v d Bossche O Hegazy J Smekens T Coosemans and J v Mierlo lsquoRe-chargeable energy storage systems for plug-in hybrid electric vehicles---assessment of electricalcharacteristicsrsquo Energies vol 5 no 8 pp 2952ndash2988 2012
[65] N Omar P V d Bossche T Coosemans and J V Mierlo lsquoPeukert revisited---critical appraisal and needfor modification for lithium-ion batteriesrsquo Energies vol 6 no 11 pp 5625ndash5641 2013
[66] S S Choi and H S Lim lsquoFactors that affect cycle-life and possible degradation mechanisms of a li-ioncell based on licoo2rsquo Journal of Power Sources vol 111 no 1 pp 130 ndash136 2002 issn 0378-7753 doihttpdxdoiorg101016S0378-7753(02)00305-1 [Online] Available httpwwwsciencedirectcomsciencearticlepiiS0378775302003051
[67] () Charging lithium-ion batteries -- battery university [Online] Available httpbatteryuniversitycomlearnarticlecharging_lithium_ion_batteries (visited on 15032017)
[68] B Xu A Oudalov A Ulbig G Andersson and D Kirschen lsquoModeling of lithium-ion battery degradationfor cell life assessmentrsquo IEEE Transactions on Smart Grid 2016
[69] () Zero-dmodelling approachwith ansys products | valeacuterie gelbgras | pulse | linkedin [Online] Availablehttpswwwlinkedincompulsezero-d-modelling-approach-ansys-products-valC3A9rie-gelbgras(visited on 17032017)
[70] CIBSE Combined Heat and Power for Buildings - CIBSE AM12 2013 (2nd Edition) CIBSE 2013 isbn978-1-906846-30-5 [Online] Available httpappknovelcomhotlinktocidkpCHPBCIB1combined-heat-power-buildingscombined-heat-power-buildings
[71] lsquoTriads dates and times 2014 - 2015rsquo National Grid Tech Rep 2015 [Online] Available httpwww2nationalgrid comUK Industry - informationSystem- chargesElectricity - transmissionTransmission -Network-Use-of-System-ChargesTransmission-Charges-Triad-Data
[72] (Jul 2015) Charging for optimum battery life [Online] Available httpsforumsteslacomen_GBforumforumscharging-optimum-battery-life (visited on 26032017)
[73] (Feb 2016) Used renault ev batteries to be recycled into energy storage systems [Online] Availablehttpwwwfleetnewscouknewsenvironment20160205used-renault-ev-batteries-to-be-recycled-into-energy-storage-systems (visited on 26032017)
[74] PGetreuer lsquoWriting fastmatlab codersquoMathworks File Exchange5685 2009 [Online] Available URLhttpwwwmathworkscommatlabcentralfileexchange5685
[75] () Live data | sustainability at princeton [Online] Available httpsustainprincetonedulablive-data(visited on 18032017)
Alexander Charles 36
REFERENCES[76] AECOM lsquoHeat networks code of practice for the ukrsquo CIBSE Tech Rep 2015
[77] M Watson and M DaleWestern power discussion Meeting Minutes Mar 2017
[78] (2017) United kingdom inflation rate | 1989-2017 | data | chart | calendar [Online] Available httpwwwtradingeconomicscomunited-kingdominflation-cpi (visited on 22032017)
Alexander Charles 37
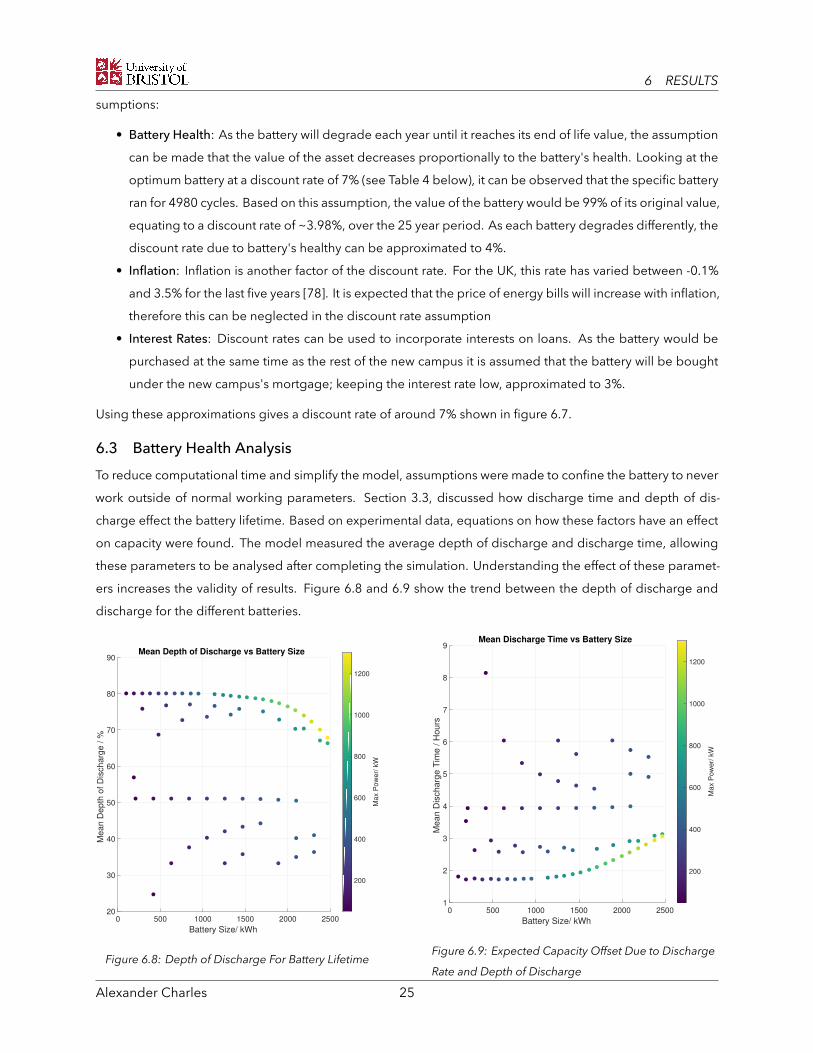