Embed Size (px)
Citation preview

Center for the M
BalancedExamples
Faculty & Research
CMERanagement of Environmental Resources
Scorecard and Sustainability: from Literature and Practice
by
F. Zingales and
K. Hockerts
2003/30/CMER
Working Paper Series

Balanced Scorecard & Sustainability:
Examples from literature and practice
Francesco G.G. Zingales & Kai Hockerts
Published in: Schaltegger, S. & Dyllick, T. (2002): Nachhaltig managen mit der Balanced Scorecard. Konzept und Fallstudien. Wiesbaden: Gabler, pp. 151 – 166, [English Version].
Table of contents
1.1 Introduction....................................................................................................... 1 1.1.1 Examples from the literature review ......................................................... 1 1.1.2 Examples from the practice....................................................................... 4 1.1.3 Conclusions............................................................................................. 11
Bibliography ............................................................................................................... 13 Interviews & Presentations ......................................................................................... 13
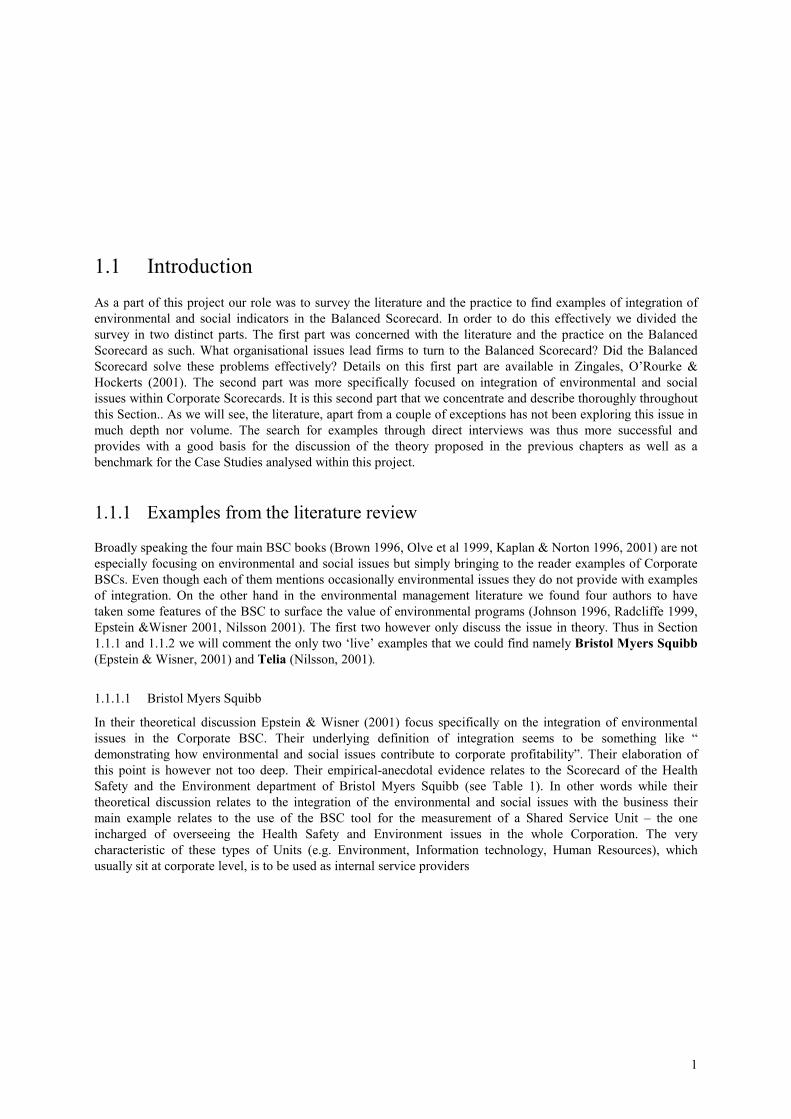
1.1 Introduction As a part of this project our role was to survey the literature and the practice to find examples of integration of environmental and social indicators in the Balanced Scorecard. In order to do this effectively we divided the survey in two distinct parts. The first part was concerned with the literature and the practice on the Balanced Scorecard as such. What organisational issues lead firms to turn to the Balanced Scorecard? Did the Balanced Scorecard solve these problems effectively? Details on this first part are available in Zingales, O’Rourke & Hockerts (2001). The second part was more specifically focused on integration of environmental and social issues within Corporate Scorecards. It is this second part that we concentrate and describe thoroughly throughout this Section.. As we will see, the literature, apart from a couple of exceptions has not been exploring this issue in much depth nor volume. The search for examples through direct interviews was thus more successful and provides with a good basis for the discussion of the theory proposed in the previous chapters as well as a benchmark for the Case Studies analysed within this project.
1.1.1 Examples from the literature review
Broadly speaking the four main BSC books (Brown 1996, Olve et al 1999, Kaplan & Norton 1996, 2001) are not especially focusing on environmental and social issues but simply bringing to the reader examples of Corporate BSCs. Even though each of them mentions occasionally environmental issues they do not provide with examples of integration. On the other hand in the environmental management literature we found four authors to have taken some features of the BSC to surface the value of environmental programs (Johnson 1996, Radcliffe 1999, Epstein &Wisner 2001, Nilsson 2001). The first two however only discuss the issue in theory. Thus in Section 1.1.1 and 1.1.2 we will comment the only two ‘live’ examples that we could find namely Bristol Myers Squibb (Epstein & Wisner, 2001) and Telia (Nilsson, 2001).
1.1.1.1 Bristol Myers Squibb
In their theoretical discussion Epstein & Wisner (2001) focus specifically on the integration of environmental issues in the Corporate BSC. Their underlying definition of integration seems to be something like “ demonstrating how environmental and social issues contribute to corporate profitability”. Their elaboration of this point is however not too deep. Their empirical-anecdotal evidence relates to the Scorecard of the Health Safety and the Environment department of Bristol Myers Squibb (see Table 1). In other words while their theoretical discussion relates to the integration of the environmental and social issues with the business their main example relates to the use of the BSC tool for the measurement of a Shared Service Unit – the one incharged of overseeing the Health Safety and Environment issues in the whole Corporation. The very characteristic of these types of Units (e.g. Environment, Information technology, Human Resources), which usually sit at corporate level, is to be used as internal service providers
1

Table 1 Example of Bristol Myers Squibb S&E. Performance objectives and measures
Financial Perspective
Customer Perspective
Internal Process Perspective
Learning & Growth perspective
- Cost Savings - $ Saved from
accident reduction - $ saved from PLC
reviews - Investments - $ Spent on EH&S
capital projects - Remediation costs - Prevenative costs - Community
improvements - Revenues - Sales of S&E friendly
products
- External customer Support
- Product safety - Post-consumer
waste recycled - Consumer education - # Product safety
brochures distributed
- Goop Citizenship - # Awards - Philantropic
contributions - Product donations
- Environmental Performance
- Water use - Packaging
reduction - % Solvents
recycled - Energy use - Hazardous waste
generated - # supplier reviews - # fines - Worker exposure - Employee
performance - # Lost workdays - Work-related
injuries-illnesses
- Employee practices - Training hours - Ergonomic reviews - Diversity - Transfer of Best
Practices - # ISO 14001
certifications - # Product life cycle
reviews
to the Business Units. They are not, by nature, integrated with the Businesses. The very problem for corporations today is in fact their lack of integration. This suggests that building such an HSE BSC without understanding its interaction with the various Businesses (or product lines) might be only an apparently useful exercise. Unfortunately, besides providing the example the authors do not comment on the specific use of this BSC. Questions like: Why was it put together? How does it help? What does it add compared to an ISO 14031? Remain unanswered. Without the example of Novartis (See Section 1.2.2) - where we were able to access first hand information - we would be left with very little to say except making rather sterile hypothesis. We will thus leave a more detailed discussion on the usefulness of an HSE BSC to that later section.
1.1.1.2 Telia Nära Linköping
Telia Nära Linköping (Telia NL) is a business unit of Telia AB, a Swedish company active in the wireless industry. As described by Nilsson (2001) this Business Unit had been using a Balanced Scorecard for several years already. In our view this action research project relates much more closely to the idea of integrating the environmental and social indicators in a Balanced Scorecard. Nilsson interprets integration in a more elaborate fashion than Epstein and Wisner. Despite the fact she does not give any explicit definition her discussion seems to suggest that environmental issues will be integrated in the business units only when the causes and the effects of actions that relate to the environmental performance are explicitly mapped and their indicators tracked as part of the business unit scorecard.
Nilsson explores this hypothesis starting from a single ‘environmental’ project trying to detail how it contributes to the improvement of specific Telia NL Balanced Scorecard key success factors. The project was called the Virtual Meetings (VM) Project. Virtual meetings are defined as meetings that would take place through the use of video/audio conferencing and web casting. The project was ‘sold’ to the outside world as ‘environmental’ because the use of Virtual meetings would reduce travelling and, as a consequence also reduce both from travelling costs emissions to air. An additional motivation (or perhaps the main one) for the VM project was that Telia wanted expertise and technology to manage virtual meetings to become an asset of the company that could be sold to their clients in the future. Telia would pilot the pros and cons internally in order to improve the product and provide a showcase for the marketing (Nilsson 2001, p.47). On a Corporate point of view these two explanations can be complemented, and indeed it seems to be an excellent example of a win-win situation (i.e. that would benefit the bottom line and the environment at the same time). But let us see what happened in Telia NL.
In order to come up with the map shown in Table 2 Nilsson went through a three step process. Firstly a tentative list of strategic objectives and relative indicators was drawn from previous research on drivers and barriers to the use of virtual meetings. Secondly the list was discussed with a core group in each firm during a three-hour brainstorming session. During this session the proposed strategic objectives of the virtual meeting project (e.g. awareness building) were revised and prioritised and a number of ones added. Thirdly with the assistance of a criteria list drawn from the literature Nilsson evaluated whether some of the indicators related to these strategic objectives could be integrated in the existing Balanced Scorecards of Telia NL.
2

Table XX2 The Balanced Scorecard of Telia Nära Linköping and existing key success factors as well as key success factors related to the virtual meetings
Perspectives
Key success factors Telia Nära
Key success factors of the virtual meeting-projects
Economic efficiency Cut costs Follow up costs and display savings Managerial meeting behaviour Reliance Visualisation Availability Using virtual meetings more internally
Market Capital Focus on the most important customers (companies and larger accounts)
Loyal customers
Win back important customers lost
Human Capital Competent and motivated staff
Follow up time and display savings
Awareness building
Training
As shown in Table 2 the strategic objectives of virtual meetings– developed during the project - are put in relation through cause-effect linkages with the strategic objectives of Telia NL. The visualisation of the links shows how the virtual meeting project has the potential to both decrease costs (through decreased travelling) and increase motivation of staff (through training and awareness building). Interestingly no reference to the possible corporate implications of this project (i.e. new product development) arises from this map. We don’t know why this feature was omitted. We can only say that its absence is reducing the richness of insight provided by the map. In other words we could even make the extreme hypothesis that anything left out of such a map becomes inexistent and ‘disappears’. This consideration, on the other hand, points to the powerfulness of visualisation and maps, an issue to consider carefully for future studies.
Another interesting consideration from this case arises from the choice of putting in relation the strategic objectives instead of the indicators. Managers and researchers made this specific choice together during their working groups. The author explains that it is overly complex to design cause-effect relationships between indicators because they are often expressed through mathematical formulas containing several parameters (Nilsson 2001, p.45). Again, unfortunately we lack further insight on the matter, but an alternative explanation for not linking the measures is that Business Unit managers really did not want extra indicators to deal with. In this respect anything that does not bear an explicit relation with the measures might be seen as peripheral to the core of the business and be discarded when the research project is over. Some important questions arise from this discussion: is the fact of not linking the indicators acceptable? If so, how to evaluate the effect of the project on the business? Is it always necessary to do so? For the moment we leave these questions as inspiration for future action-based projects.
Following on the usefulness of maps one important issue seemed to be that drawing these maps was complicated and required the presence of many actors (e.g. top managers, controller, environmental manager) in a group discussion. According to the participants to the research project the main value of this exercise was the visualisation of the links in a one-page document, which provided with an excellent platform for discussion.
The interest of this example lies mainly in the use of the existing BSC as the platform for discussion of the relevance of a project (i.e. the virtual meetings project) that would have financial, motivational and environmental benefits. The use of cause-effect linkages being the main feature that visualises the relationship between the project and the strategy of the firm. The main outcome of this effort was the difficulty of inserting new indicators in a BSC. This problem was strongly felt by Nilsson in her study.
3

There are two ways of interpreting this difficulty. The first and simplest is that indicators about a single project do not need to be part of the general BSC. In the BSC methodology “projects” are actions that stem from the definition of an objective, its specific indicator(s) and a target achievement in a given time horizon. Virtual meetings, by reducing travelling expenses automatically qualify as a good project because (among other things) contribute to the Telia NL strategic objective of “cutting costs”. There is thus no need for “separate” indicators to be integrated explicitly in the BSC. Simply the monitoring of the Virtual meeting project will be done through indicators of cost reduction and the project will be judged successful if a certain target is achieved. All of these indicators will be part of the BSC because they are included in the total result that Telia NL achieves in “cutting costs”.
The second is a more indirect and general comment that relates to the absence of links (or maps) between indicators in Telia NL original BSC. It is our opinion that the absence of an explicit hypothesis about causes and effect hinders that possibility of discussing whether that hypothesis is proven by facts. In other words if the management team had made an hypothesis that an increased costumer satisfaction would lead to higher sales and achieves the first but not the second it could be that (i) the definitions and parameters of costumer satisfaction were wrong and need to be revised (ii) the measuring technique was ineffective and needs to be improved (iii) the total size of the market has shrunk. We argue that it will not be possible to discuss these possibilities whilst enhancing learning without the hypothesis being made in the first place. This misuse of the BSC might end up with measures that are ‘set in stone’. We do not know whether this was an important issue in the case of Telia NL, but the resistance experienced by Nilsson in inserting new indicators in the BSC could be an indication of this problem. The relevance of this issue for environmental/sustainability professionals should not be underestimated. In fact, to the extreme, this means that if you are not at the table when the first BSC is built you have very scarce chances of getting in later.
All in all we found this Case very interesting because of the richness in insight that provided in the description of exactly what were the problems and the issues at the different stages of the research. Action-based research seems to provide the right means both to gather relevant data and to provoke managers into desired discussions.
1.1.2 Examples from the practice
Given the relatively scarce evidence we found in the literature we turned to the practice in search for primary data. In order to short list a number of companies we used the literature surveyed to identify companies that might be worth interviewing. The companies in Table 3 have two things in common (i) they are documented to be using the Balanced Scorecard (ii) they are carrying out environmental and social programs that go beyond legislative requirements. We thought that for these companies the likelihood of finding some environmental/social indicators in their BSCs would’ve been higher than in a random sample.
Table XX3. List of companies attempted contact
Source Companies mentioned Kaplan And Norton (a) Book: The Balanced Scorecard (1996)
Dupont, General Electric, Hewlett-Packard, Shell Canada.
Olve et al. Book : Performance Drivers (1998)
ABB, British Airways, British Telecom, Coca-Cola Beverages - Sweden, Electrolux, Skandia, Volvo, Xerox
Epstein 2000 Book: Counting What Counts (2000)
Whirlpool, Cigna Property & Casualty, Bank of Montreal, Skandia.
Kaplan and Norton (b) Book: The Strategy Focused Organization (2001)
Nova Scotia Power, AT&T Canada (now Equifax), Wintherthur International.
Other Sources (mainly attempts from tips) Statoil, Telia, Skanska, Unilever, BP Chemicals
4

Given the internal nature of the BSC tool we needed to get in touch with people within the company that participated (or coached) the implementation of the BSC. This proved to be much harder than we had anticipated. In the end we succeeded in carrying out ten interviews with the following companies: ABB Sweden, British Telecom, Lunds Energi, Novartis, Nova Scotia Power, Novo Nordisk, Shell, Skandia, SwissRe, Xerox Sweden. Most of them could provide us with interesting insights on the use of the Balanced Scorecard (see Zingaleset al. 2001) but only four companies were able to show us that they had integrated environmental and/or social indicators in their BSCs namely Lunds Energi, Novartis, Novo Nordisk and Shell. The following four sections are dedicated to presenting and discussing each of these four cases.
1.1.2.1 Lunds Energi
Lunds Energi provides the city of Lund in Southern Sweden with electricity, heating and water services. Lunds Energi, wholly owned by the municipality, apparently did not have any specific organizational problem pressuring them to implement a BSC. Simply they were looking for better ways to measure performance and plan their work (Parker, 2002). Mr. Parker perception is that the process of building the BSC provided with an excellent platform to discuss milestones of projects before the project would end. This would in turn highlight problems early on and increase the chances of projects to deliver successful results.
On an environmental management point of view however the use of the BSC has created a rather dangerous situation. The same manager that implemented in earlier times the Health Safety and Environment management systems was also the one incharged of coaching the BSC process. He thinks that in reality implementing the BSC has the potential to damage the environmental work in the long run. Lunds Energi had been working for years with their EMS as part of the engagements the firms has with its owner (i.e. Lund Municipality) and its clients (i.e. Lunds citizens). With the implementation of the BSC Lunds Energi is charged with far too many goals and projects (i.e. the ones from the EMS and the ones from the BSC). None of the goals is well followed up because there are too many. Even though some environmental measures are present in Lunds Energi Corporate (and Business Unit) BSCs he strongly believes that an increased understanding of the interaction between BSC and EMS objectives should be sought. His personal feeling and fear is that a failure in this sense might, in the long run, reduce the total environmental effort of Lunds Energi simply because resources will be more and more allocated based on what is found in the BSC. [Parker, 16 April 2002, Lecture].
In other words generalizing this finding we might have companies that manage the environmental and social issues very proactively through environmental (and social) management systems whose programs are downsized because of the implementation of the BSC. The downsizing effect seems to relate more to the lack of capacity of integration between the environmental and the financial control systems rather than the actual questioning of the strategic relevance of environmental and social issues for the firm. How should environmental and financial control systems interact? This is a question Lunds Energi is today trying to tackle in the practice and another interesting theme for future research.
1.1.2.2 Novartis
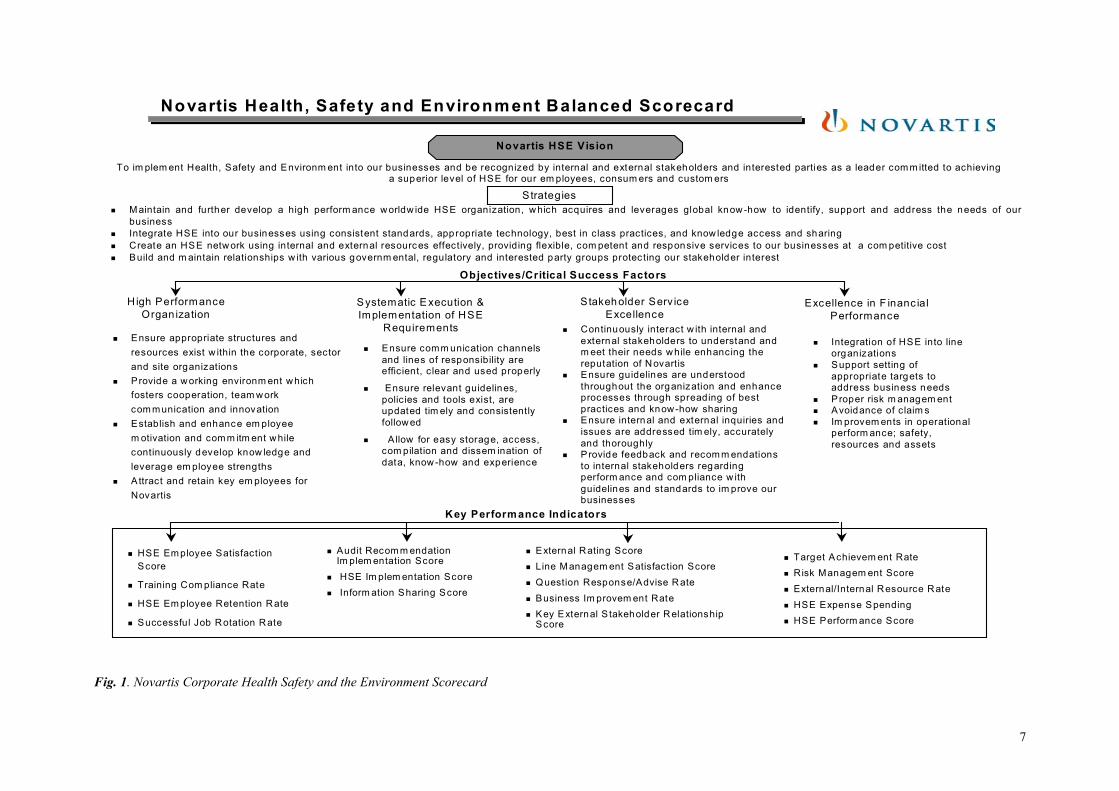
Novartis is a large pharmaceutical company with Corporate offices in Switzerland with sales of roughly 19 billion USD. The firm as a whole is not using the BSC. The Corporate HSE department used the BSC to measure their performance. As it is easy to understand, this is a particularly daunting task in a setting like Novartis where the HSE department and its five people sitting at corporate level have to manage a large network of HSE practitioners each in different levels of different business units. The Corporate HSE group was looking for a tool that would allow them to have a closer contact with the management of the business units and not only with their HSE delegates. The BSC in Figure 1 is the result of this work and the way the HSE department will evaluate - and be evaluated for - the success of its efforts.
Again, as for Bristol Myers Squibb, given the very high aggregation level, little is left of the link between HSE issues and the strategy of the different business units. It seems that this BSC serves more to manage in a more coherent fashion Corporate HSE rather than explicitly linking HSE to the core of the business. Nevertheless the Corporate HSE Manager included the Business Unit managers in the discussion when defining the objectives and the indicators in their Scorecard. According to him this increased their understanding of the relevance HSE issues for their businesses (Eigenmann, 31st May 2002, Presentation). The next steps in Novartis are related to breaking down the Corporate HSE BSC into Business Unit HSE BSCs.
5

The four perspectives of the HSE BSC are broadly following the BSC standard structure. The High Performance Organisation relates to the capacity and satisfaction of the employees of the HSE department (equivalent to Development and Growth). The perspective Systematic Execution & implementation of HSE requirements objectives relates to the idea that the main role of the HSE network (i.e. corporate and business units HSE professionals) is to readily provide HSE information/knowledge to the business units when required (equivalent to Internal Processes). The perspective Stakeholder Service Excellence is the equivalent of the Costumer perspective but enlarged to a much broader set of key stakeholders. Finally the perspective Excellence in Financial Performance seems to be a mixture of internal efficiency measures where the link with the financial performance of the firm is not explicit.
6
To im plem ent Health, Safety and Environm ent into our businesses and be recognized by internal and external stakeholders and interested parties as a leader com m itted to achieving a superior level of HSE for our em ployees, consum ers and custom ers
Novartis Health, Safety and Environment Balanced Scorecard
Novartis HSE Vision
Strategies� M aintain and further develop a high perform ance worldw ide HSE organization, which acquires and leverages global know-how to identify, support and address the needs of our
business� Integrate HSE into our businesses using consistent standards, appropriate technology, best in class practices, and know ledge access and sharing� Create an HSE network using internal and external resources effectively, providing flexible, com petent and responsive services to our businesses at a com petitive cost� Build and m aintain relationships w ith various governm ental, regulatory and interested party groups protecting our stakeholder interest
H igh Performance Organ ization
Excellence in F inanc ial Performance
Systematic E xecution & Implementation of HSE
Requirements
Stakeholder Serv ice Excellence
� Ensure appropriate structures and resources exist w ithin the corporate, sector and site organizations
� Provide a working environm ent which fosters cooperation, team work com m unication and innovation
� Establish and enhance em ployee m otivation and com m itm ent while continuously develop know ledge and leverage em ployee strengths
� Attract and retain key em ployees for Novartis
� Integration of HSE into line organizations
� Support setting of appropriate targets to address business needs
� Proper risk m anagem ent� Avoidance of claim s� Im provem ents in operational
perform ance; safety, resources and assets
� Ensure comm unication channels and lines of responsibility are effic ient, c lear and used properly
� Ensure relevant guidelines, polic ies and tools exist, are updated tim ely and consistently followed
� Allow for easy storage, access, com pilation and dissem ination of data, know-how and experience
� Continuously interact w ith internal and external stakeholders to understand and m eet their needs while enhancing the reputation of Novartis
� Ensure guidelines are understood throughout the organization and enhance processes through spreading of best practices and know-how sharing
� Ensure internal and external inquiries and issues are addressed tim ely, accurately and thoroughly
� Provide feedback and recom m endations to internal stakeholders regarding perform ance and com pliance w ith guidelines and standards to im prove our businesses
Objectives/Critical Success Factors
� HSE Em ployee Satisfaction Score
� Training Com pliance Rate
� HSE Em ployee Retention Rate
� Successful Job Rotation Rate
� Target Achievem ent Rate� Risk Managem ent Score� External/Internal Resource Rate� HSE Expense Spending� HSE Perform ance Score
� Audit Recom m endation Im plem entation Score
� HSE Im plem entation Score � Inform ation Sharing Score
� External Rating Score� Line M anagem ent Satisfaction Score� Question Response/Advise Rate� Business Im provem ent Rate � Key External S takeholder Relationship
Score
Key Performance Indicators
Fig. 1. Novartis Corporate Health Safety and the Environment Scorecard
7

1.1.2.3 Novo Nordisk
Novo Nordisk is a Danish pharmaceutical company producing mainly drugs for diabetes care with annual sales of 900 million Euros. Given their large investments in people and R&D (i.e. intangible & long term investments) the CEO felt that he needed a way to understand if they were going in the right direction before this would show up in the financials. Novo Nordisk turned to the BSC five years ago for this very purpose. The integration of environmental and social parameters within the BSC was partly due to the culture of the company and partly pushed by events in the business environment that highlighted the relevance of global inequity issues for the business of pharmaceutical companies. In Table 4 we can see what the Balanced Scorecard of Corporate Novo Nordisk looks like today.
Table 4: Novo Nordisk Balanced Scorecard 2002.
Customers & Society Finance - Realise the full potential of strategic products
- Improve market share globally
- Ensure successful implementation of US and Japanese Business plan
- Achieve superior costumer satisfactions
- Improve social, environmental and bioethical performance
- Growth in Operation Profit - ROIC - Operating Margin - Cash to Earnings Ratio
Business Processes People & Organization - Discovery speed quality and productivity - Competitive development portfolio - Ensure launch capabilities within GP
segment - Improve quality management focus in all
business processes - Timely and efficient execution of investment
portfolio - Ensure effective use of IT supporting the
business strategies
- Costumer Relations
- Winning culture
- Attract and retain the best - Development of people
- Social responsibility
Environmental and social issues are integrated explicitly in Costumers & Society and in the People & Organisation perspectives. According to the Corporate Sustainability VP environmental targets are also present in the Internal Process perspective within the categories of productivity and quality. These general objectives are cascaded through the organization. The system is managed through software and Novo Nordisk external (triple bottom line) reporting is a result of the data gathered through it. Furthermore bonuses of managers are based on the criteria outlined in the BSC. The general objectives are then coupled with relevant indicators and agreed targets. In Table 4 we find the follow up table related to the perspective People & Organization.
8

Table 5: Example of KPIs for Social issues in Novo Nordisk
CSF CSF - Rationale KPI Target ‘02 Resp. Attraction & Retention
High retention of employees will secure our knowledge and competitive advantage
Reduction of unwanted turnover in selected units
- X% XY
Development of People
Development of people is a key objective for managers
N. of managers with development of people as a personal target
… XX
Costumer Relations
Improving CR is essential for improving sustainable business results
N. of dialogues between patients and employees
Winning culture Developing a Winning culture will help us strive for stretch targets
N. of team targets
Social Responsibility
Increase equal opportunities and diversity throughout the entire company
N. of plans for increasing equal opportunities
The department that champions environmental and social issues in Novo Nordisk is called the Stakeholder Relations (SR) Department. The top manager of this department is a member of the executive committee. The SR department also has a BSC as shown in Table 5. The attempt to relate to the Corporate BSC is only implicit (i.e. no graphical representation of the relationship). As we understand it the SR BSC seems to take three ‘routes’ to bring value to the firm (i) Enhance the quality of the SR dialogue with external stakeholders (ii) Enhance the SR capacity to find effective and efficient ways to bring these issues to top management (iii) Enhance the SR capacity to bring these issues down to the business unit level.
Table 6 Novo Nordisk Stakeholder Relations Balanced Scorecard 2002.
Customers & Society Finance - Enable Management to manage issues &
trends with implications for the Triple Bottom Line
- Drive and continually challenge NN performance on the TBL
- Protect and Enhance NN’s reputation and long term brand value
- Exploit and develop NN’s position as a global leader in TBL reporting and accounting
- Fulfill the business plan 02-03
Deliver Value for money by : - Ensure that SR projects support NN
business strategies and competitiveness on existing as well as emerging markets
- Continuously ensure the SR Annual Budget efficiency through prioritization/evaluation
- Meet the adjusted Annual Budget 2002 - Focus on planning & synergies in the SR
projects
Business Processes People & Organization - Work towards full business integration,
including embedding NN’s TBL approach/commitment in the entire organization through :
- Develop tools for implementing TBL issues - Monitor the NN performance & quality of TBL
processes, targets, data and documentation - Utilize TBL trend spotting & risk management
in the decision making process - Use project management to optimize
efficiency and quality - Ensure efficient use of IT
- Costumer Increase dialogue and integration with the NN business areas :
- Costumer/partner relations - Develop a learning organization and a
winning culture : - Attract, retain and develop people - Nurture diversity of professional skills
through social responsibility and equal opportunities
In the Case of Novo Nordisk there is a strong push from the top to have social and environmental targets integrated at every level of the company. This commitment is evident in the Corporate BSC. The way forward in this field for Novo Nordisk is described as follows by the VP of Stakeholder relations “We need to go more to the external stakeholders to seek information. We also would like to see more sustainability issues on the BSC. Especially important is however getting further down in the business with the BSC work. We are now only at a
9

business unit level. Finally we need to anchor the system by reporting to the board of directors with the BSC” [Hanne Schou Roude, presentation, 31 May 2002].
What we find in Novo Nordisk is very close to the original idea of the BSC. Their already ‘digested’ interest in Sustainability issues is adequately reflected in their BSC. The anecdotal evidence gathered by us up to this point seems to suggest that the interest in Sustainability of a firm is (at best) mirrored in their BSC but certainly not a result of the discussion that brings a firm to build it. Novo Nordisk case does not disconfirm this perception. Additionally they feel that the BSC is helping them to bring these issues close to the Business Units and ultimately closer to each and every employee in the firm. They also see the BSC as exclusively an implementation tool. Their lack of use of the concept of strategy maps certainly hampers discussion on the relevance of the chosen indicators and somewhat confirms the perception within Novo Nordisk of the BSC as a purely implementation (or control) tool. In order for the BSC to be the occasion for learning hypothetical cause-effect relationship should be drawn and their monitoring results discussed, which might very well be Novo Nordisk next step in the utilization of this tool.
1.1.2.4 Shell
Royal Dutch Shell is a very large multinational petrol company from the Netherlands. Shell communicates strongly its Sustainable Development efforts to external stakeholders. We asked them how that this reflect in their BSC . In Shell’s BSC we find Sustainable Development to occupy one entire perspective in the BSC. The first thing that we asked ourselves was whether or not their BSC was actually a good representation of the priorities in the company. Apparently, to support this point is the simple notion that all the indicators that are derived from this Corporate BSC are integrated in the bonuses of the managers from the different Business Units. According to Shell’s corporate controller this alone is an excellent proxy for motivation of top management (Thomas, May 31st 2001, Presentation).
This example raises three main issues. The first related to the change in the perspectives. Instead of a Development and Growth perspective we see a Sustainable Development perspective. The internal process perspective basically disappeared. This is a characteristic of the Scorecards, they can be used rather flexibly and the change in perspective is a feature we often observed in the practice. Our opinion on the matter is that the perspectives can be changed as far as the linking of objectives across the perspectives remains possible.
The second issue is more fundamental and relates to the actual effectiveness of linking managers bonuses to specific indicators. Once a company has Sustainable Development explicitly stated as one of the four main perspectives the success in this effort will depend on two main things. The first – which we will not here discuss - is how Sustainable Development has been defined in the firm. The second relates closely to the effectiveness of the BSC mechanism itself. We should not forget that the discussion over the usefulness of bonus incentives is a very hot discussion today in the management literature. Shell’s controller is convinced that integration in bonuses is fundamental for the BSC to have any weight in decision making but is also stressing how these indicators should not be fed to a mathematical formula but rather constitute the base of a more informed discussion whereby stressing learning rather than control. We do agree with this line of reasoning. However it remains a theme for future discussion whether at all learning can take place within the framework set by the Balanced Scorecard and its explicit linking to the bonuses.
10

Get Scorecard fromt he presentations
Describe results from the workshop
Excellent classic top down
They have it already up there too
The Shell Brand
Safety Social Responsibility
Financial Performance
Employee Satisfaction
Customer
People
Sustainable Development
Financial Results
Figure 2 Sample of Shell’s Strategy map
The third issue that is worth discussing is the use that Shell is making of the concept of strategy maps. What we find in Figure 2 is the hypothetical map drawn through an action research project that Shell carries out in collaboration with Cranfield management school. Through the availability of a large amount of data coming from the BSCs cascaded throughout the organisation the Center for Business performance strives to test the weight of each of these cause-effect relationships. According to the project coordinator this is the first time that a validation of an entire strategy map (i.e. more than one cause-effect relationship) has been attempted (Marr 2002). This experiment seems to point, although at a very macro level to the importance of strategy maps. In this case the strategy map is used to ‘prove’ how and to what extent Sustainable Development-related activities – in this specific case Health and Safety and Stakeholder dialogue - are creating value for Shell. Shell today is not using strategy maps to guide management discussion. We could find no evidence that these maps are used at all in any BSC firm. Whether these strategy maps can at all be used in this way is something left for future research to explain.
1.1.3 Conclusions
The studying of the literature and the practice on the Balanced Scorecard and Sustainability brought us some interesting discoveries. We are aware however that this represents only anecdotal evidence and that there needs to be more research in order to prove or disprove our intuitions.
The first issue is of fundamental nature and relates to the absence of literature testing scientifically the Balanced Scorecard effectiveness. This is true for any given dimension that the BSC is supposed to assist. There is no scientific proof that it helps pursuing medium-long term strategy, no proof that helps stir managers in given directions and ultimately no proof that it brings value to the firm. This should not be seen as a criticism of the BSC but rather as an incentive for scholars to research in this direction. This is true considering the fact that for some reason companies are in search for solutions for these problems and that the current performance measurement tools are certainly inadequate for this purpose. The question would then be: is the BSC any better?
When we turned to the practice to get some ideas on how the BSC is working we found a rather scattered situation. For a first group of companies that were cited to be using the BSC in the literature we could not even reach the control department, let alone find the controller responsible for the BSC. A second group of companies had dropped the BSC altogether because it was perceived as ‘too heavy’. A third group was using it in ways very far from what the original concept describes. In the end, out of the 28 companies we had targeted, we were able
11

to verify only four cases that we could safely classify as ‘real’ BSC’s. This suggests that despite the BSC concept was introduced in the management literature at the beginning of the 1990’s companies are far from understanding how this concept can (if at all) be used to their advantage. Whether this depends on the complexity of the implementation, on the culture of the firms, on the inadequacy of current software or on other factors constitutes again a possible theme for future research.
The scarce relevance of the Balanced Scorecard in the practice today makes us doubt whether the issue of integration of environmental and social issues in a Balanced Scorecard is actually a useful discussion. If such a scarce number of companies are using correctly this tool what use can it do to integrate in it? Nevertheless analysing the four companies that were found to have both the Balanced Scorecard and a strong environmental (and social) focus some preliminary conclusions can be drawn. In Lunds Energi there was no effort to align environmental management with the Balanced Scorecard. The EMS and the strategic planning cycle (managed through the BSC) are thus running in parallel, which is perceived by Lunds Energi management to generate a number of inefficiencies. In this respect Shell and Novo Nordisk approach of integrating environmental and social issues explicitly on the Corporate BSC seems to have solved this problem. After all, this is exactly what the BSC is trying to do, generate alignment of objectives, targets, actions and processes.
The second interesting issue that we would like to underline is the causal relationship between the Balanced Scorecard use and Sustainability management. Is the use of the BSC framework enhancing Sustainability management? The evidence in our possession is largely inadequate to give a definite answer. However a few considerations might help us to design future hypothesis. Firstly, one of the main advantages of the BSC is that it foster dialogue in the top management upon strategic issues and directs focusing. This means that the absence of a Environmental/Sustainability manager from the ‘decision table’ will most likely result in the absence of these issues in the BSC. Resources that were previously given to the environmental work may actually be withdrawn to ‘focus’ on the perceived new strategic issues. To us this seems to be a very dangerous mechanism. Furthermore, given the current misuse of the tool most companies seem not to be updating the indicators very often (if at all). It seems that once the indicators have been decided the controllers prefer to keep them as they are and they lack effective mechanisms to question their usefulness. In other words, in a firm using the BSC it seems that if the environmental and social issues are not ‘in’ they will hardly ever be.
On the other hand, for the companies that had already ‘digested’ the importance of environmental and social issues (i.e. Shell and Novo Nordisk) for their business the BSC seemed to provide a good implementation mechanism to corporate-relevant issues through to the various layers of the organisation. What remains unclear is whether this mechanism generates actual understanding of interaction between environmental/social issues and strategy or if it is taken as a ‘credo’ coming from the top of the organisations. The danger of this second scenario is that with the change of the top management and its ‘credo’ the environmental and social issues disappear as swiftly as they have appeared.
All in all we found this research very interesting. As outlined throughout the Chapter and the conclusions there are numerous avenues for research that this topic unveiled. The topic of integration of Sustainability in core decision making processes seems to be the on the top of the agenda of many firms today. Whether the Balanced Scorecard represents a way to do that will depend on a number of things, not least a deep understanding of what integration really means and how this would constitute in practice a competitive advantage.
12

13
Bibliography Brown M.G. (1996). Keeping Score. New York: Quality Resources.
Epstein, M. & Wisner P. (2001). Good neighbours: implementing Social and environmental strategies with the BSC. Balanced Scorecard Report. May-June 2001, 3:3. Massachusetts: Harvard Business School Publishing.
Johnson, S. (1998). Application of the Balanced Scorecard approach. Corporate Environmental Strategy, Summer 98, 5:4.
Kaplan, R., & Norton D. (1996). The Balanced Scorecard. Boston (Massachussets): Harvard Business School Press.
Kaplan R., & Norton D. (2001). The Strategy-Focused Organisation. Boston (Massachussets): Harvard Business School Press.
Nilsson E. (2001). Balanced Scorecard – A Vehicle for the Greening of Business Meetings?: A Case study of Telia Nära AB and Skanska Facilities Management AB, Sweden. Master Thesis 2000-2001. International Institute for Industrial Environmental Economics (IIIEE), Lund University (Sweden).
Olve N., Roy J. and Wetter M. (1999). Performance Drivers. New York (USA).
Radcliffe, M. (1999). Using the Balanced Scorecard to develop metrics for Sustainable Development. Greening of Industry Network 1999, Chapel Hill.
Zingales, O’Rourke & Hockerts (2001). Balanced Scorecard and Sustainability State of the Art Review. Working paper INSEAD. May 2001. INSEAD publishing. Fontainebleau (France).
Interviews & Presentations Eigenmann Kaspar. Novartis. Corporate HSE Manager. Presentation 31st May 2002. INSEAD, Fontainebleau (France).
Kingo Lise. President Stakeholder Relations. Telephone interview 10th of May 2002.
Marr Bernard. Centre for Performance Measurement (Cranfield Management School) Presentation 31st May 2002. INSEAD, Fontainebleau (France).
Parker Thomas. Lunds Energi. Environmental Manager. Presentation 16th April 2002. Lund (Sweden).
Schou Roude Hanne. Vice President Stakeholder Relations. Presentation 31st May 2002. INSEAD, Fontainebleau (France).
Thomas Geoff. Shell International. Corporate Controller. Presentation 31st May 2002. INSEAD, Fontainebleau (France).
Wade Mark. Shell International. Corporate Sustainability Manager. Telephone interview 30th February 2002.