Embed Size (px)
Citation preview

Fairness and Redistribution
By ALBERTO ALESINA AND GEORGE-MARIOS ANGELETOS*
Different beliefs about the fairness of social competition and what determines income inequality influence the redistributive policy chosen in a society. But the composition of income in equilibrium depends on tax policies. We show how the interaction between social beliefs and welfare policies may lead to multiple equi- libria or multiple steady states. If a society believes that individual effort determines income, and that all have a right to enjoy the fruits of their effort, it will choose low redistribution and low taxes. In equilibrium, effort will be high and the role of luck will be limited, in which case market outcomes will be relatively fair and social beliefs will be self-fulfilled. If instead, a society believes that luck, birth, connec- tions, and/or corruption determine wealth, it will levy high taxes, thus distorting allocations and making these beliefs self-sustained as well. These insights may help explain the cross-country variation in perceptions about income inequality and choices of redistributive policies. (JEL D31, E62, H2, P16)
Pre-tax inequality is higher in the United States than in continental West European coun- tries ("Europe" hereafter). For example, the Gini coefficient in the pre-tax income distribu- tion in the United States is 38.5, while in Europe it is 29.1. Nevertheless, redistributive policies are more extensive in Europe, where the income tax structure is more progressive and the overall size of government is about 50 percent larger (that is, about 30 versus 45 percent of GDP). The largest difference is indeed in transfers and other social benefits, where Europeans spend about twice as much as Americans. Moreover, the public budget is only one of the means to
support the poor; an important dimension of redistribution is legislation, and in particular the regulation of labor and product markets, which are much more intrusive in Europe than in the United States.1
The coexistence of high pre-tax inequality and low redistribution is prima facia inconsis- tent with both the Meltzer-Richard paradigm of redistribution and the Mirrlees paradigm of so- cial insurance. The difference in political sup- port for redistribution appears, rather, to reflect a difference in social perceptions regarding the fairness of market outcomes and the underlying sources of income inequality. Americans be- lieve that poverty is due to bad choices or lack of effort; Europeans view poverty as a trap from which it is hard to escape. Americans perceive wealth and success as the outcome of individual talent, effort, and entrepreneurship; Europeans attribute a larger role to luck, corruption, and connections. According to the World Values Survey, 60 percent of Americans versus 29 per- cent of Europeans believe that the poor could become rich if they just tried hard enough; and a larger proportion of Europeans than Ameri- cans believe that luck and connections, rather than hard work, determine economic success.
* Alesina: Department of Economics, Harvard Univer- sity, Cambridge, MA 02138, National Bureau of Economic Research, and Center for Economic Policy Research (e-mail: [email protected]); Angeletos: Department of Economics, Massachusetts Institute of Technology, 50 Me- morial Drive, Cambridge, MA 02142, and NBER (e-mail: [email protected]). We are grateful to the editor (Douglas Bernheim), two anonymous referees, and Roland Benabou for extensive comments and suggestions. We also thank Daron Acemoglu, Robert Barro, Marco Bassetto, Olivier Blanchard, Peter Diamond, Glenn Ellison, Xavier Gabaix, Ed Glaeser, Jon Gruber, Eliana La Ferrara, Roberto Perotti, Andrei Shleifer, Guido Tabellini, Ivan Werning, and semi- nar participants at the Massachusetts Institute of Technol- ogy, University of Warwick, Trinity College, Dublin, European Central Bank, International Monetary Fund, IGIER Bocconi, and NBER. We finally thank Arnaud Devleeschauwer for excellent research assistance and Emily Gallagher for editorial help.
1 Alesina and Edward L. Glaeser (2004) document ex- tensively the sharp differences in redistribution between the United States and Europe.
960
VOL. 95 NO. 4 ALESINA AND ANGELETOS: FAIRNESS AND REDISTRIBUTION 961
Belgium 20%
-SwederNetherlands
France Austria
Germany Den 15% Italy
Norway i Ireland
FinlandJnited gdom
t0% Switz d
CanadaJ n Chile
Portugal
U.SA stralia Brazil
Iceland Argentina
Dominican Republicvenezuela
• Turkey
0 Phnippines
20% 40% 60% 80%
Percentage who believe that luck determines income
FIGURE 1
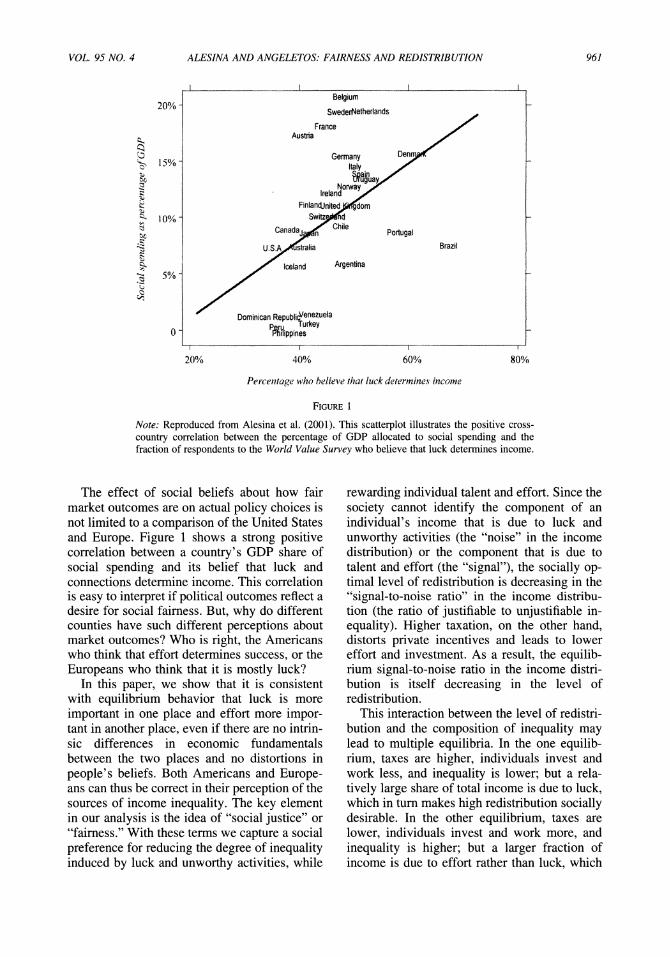
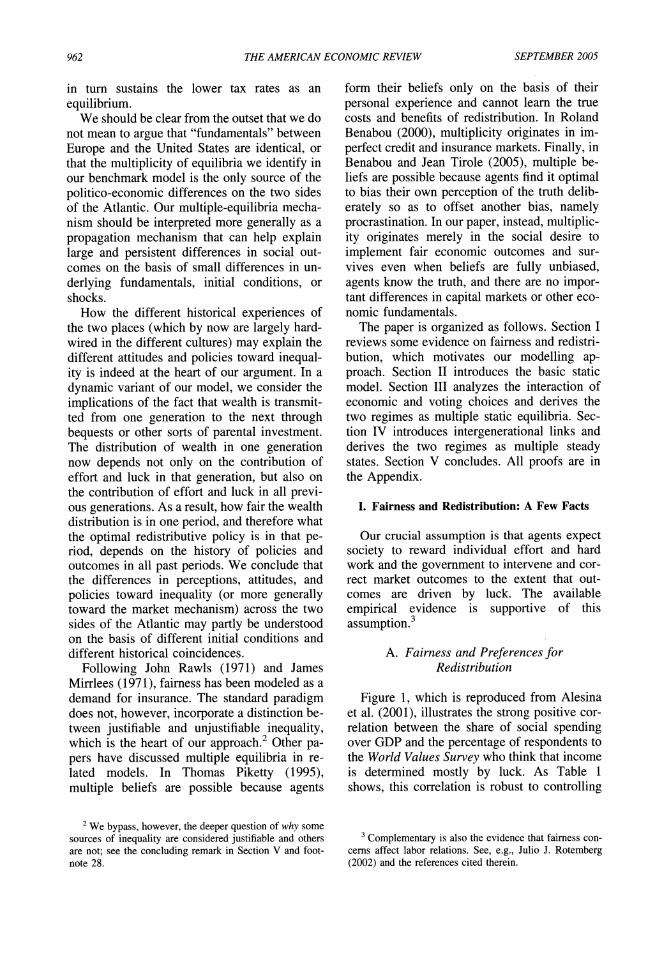
Note: Reproduced from Alesina et al. (2001). This scatterplot illustrates the positive cross- country correlation between the percentage of GDP allocated to social spending and the fraction of respondents to the World Value Survey who believe that luck determines income.
The effect of social beliefs about how fair market outcomes are on actual policy choices is not limited to a comparison of the United States and Europe. Figure 1 shows a strong positive correlation between a country's GDP share of social spending and its belief that luck and connections determine income. This correlation is easy to interpret if political outcomes reflect a desire for social fairness. But, why do different counties have such different perceptions about market outcomes? Who is right, the Americans who think that effort determines success, or the Europeans who think that it is mostly luck?
In this paper, we show that it is consistent with equilibrium behavior that luck is more important in one place and effort more impor- tant in another place, even if there are no intrin- sic differences in economic fundamentals between the two places and no distortions in people's beliefs. Both Americans and Europe- ans can thus be correct in their perception of the sources of income inequality. The key element in our analysis is the idea of "social justice" or "fairness." With these terms we capture a social preference for reducing the degree of inequality induced by luck and unworthy activities, while
rewarding individual talent and effort. Since the society cannot identify the component of an individual's income that is due to luck and unworthy activities (the "noise" in the income distribution) or the component that is due to talent and effort (the "signal"), the socially op- timal level of redistribution is decreasing in the "signal-to-noise ratio" in the income distribu- tion (the ratio of justifiable to unjustifiable in- equality). Higher taxation, on the other hand, distorts private incentives and leads to lower effort and investment. As a result, the equilib- rium signal-to-noise ratio in the income distri- bution is itself decreasing in the level of redistribution.
This interaction between the level of redistri- bution and the composition of inequality may lead to multiple equilibria. In the one equilib- rium, taxes are higher, individuals invest and work less, and inequality is lower; but a rela- tively large share of total income is due to luck, which in turn makes high redistribution socially desirable. In the other equilibrium, taxes are lower, individuals invest and work more, and inequality is higher; but a larger fraction of income is due to effort rather than luck, which
962 THE AMERICAN ECONOMIC REVIEW SEPTEMBER 2005
in turn sustains the lower tax rates as an equilibrium.
We should be clear from the outset that we do not mean to argue that "fundamentals" between Europe and the United States are identical, or that the multiplicity of equilibria we identify in our benchmark model is the only source of the politico-economic differences on the two sides of the Atlantic. Our multiple-equilibria mecha- nism should be interpreted more generally as a propagation mechanism that can help explain large and persistent differences in social out- comes on the basis of small differences in un- derlying fundamentals, initial conditions, or shocks.
How the different historical experiences of the two places (which by now are largely hard- wired in the different cultures) may explain the different attitudes and policies toward inequal- ity is indeed at the heart of our argument. In a dynamic variant of our model, we consider the implications of the fact that wealth is transmit- ted from one generation to the next through bequests or other sorts of parental investment. The distribution of wealth in one generation now depends not only on the contribution of effort and luck in that generation, but also on the contribution of effort and luck in all previ- ous generations. As a result, how fair the wealth distribution is in one period, and therefore what the optimal redistributive policy is in that pe- riod, depends on the history of policies and outcomes in all past periods. We conclude that the differences in perceptions, attitudes, and policies toward inequality (or more generally toward the market mechanism) across the two sides of the Atlantic may partly be understood on the basis of different initial conditions and different historical coincidences.
Following John Rawls (1971) and James Mirrlees (1971), fairness has been modeled as a demand for insurance. The standard paradigm does not, however, incorporate a distinction be- tween justifiable and unjustifiable inequality, which is the heart of our approach.2 Other pa- pers have discussed multiple equilibria in re- lated models. In Thomas Piketty (1995), multiple beliefs are possible because agents
form their beliefs only on the basis of their personal experience and cannot learn the true costs and benefits of redistribution. In Roland Benabou (2000), multiplicity originates in im- perfect credit and insurance markets. Finally, in Benabou and Jean Tirole (2005), multiple be- liefs are possible because agents find it optimal to bias their own perception of the truth delib- erately so as to offset another bias, namely procrastination. In our paper, instead, multiplic- ity originates merely in the social desire to implement fair economic outcomes and sur- vives even when beliefs are fully unbiased, agents know the truth, and there are no impor- tant differences in capital markets or other eco- nomic fundamentals.
The paper is organized as follows. Section I reviews some evidence on fairness and redistri- bution, which motivates our modelling ap- proach. Section II introduces the basic static model. Section III analyzes the interaction of economic and voting choices and derives the two regimes as multiple static equilibria. Sec- tion IV introduces intergenerational links and derives the two regimes as multiple steady states. Section V concludes. All proofs are in the Appendix.
I. Fairness and Redistribution: A Few Facts
Our crucial assumption is that agents expect society to reward individual effort and hard work and the government to intervene and cor- rect market outcomes to the extent that out- comes are driven by luck. The available empirical evidence is supportive of this assumption.3
A. Fairness and Preferences for Redistribution
Figure 1, which is reproduced from Alesina et al. (2001), illustrates the strong positive cor- relation between the share of social spending over GDP and the percentage of respondents to the World Values Survey who think that income is determined mostly by luck. As Table 1 shows, this correlation is robust to controlling
2 We bypass, however, the deeper question of why some sources of inequality are considered justifiable and others are not; see the concluding remark in Section V and foot- note 28.
3 Complementary is also the evidence that fairness con- cerns affect labor relations. See, e.g., Julio J. Rotemberg (2002) and the references cited therein.

VOL. 95 NO. 4 ALESINA AND ANGELETOS: FAIRNESS AND REDISTRIBUTION 963
TABLE 1-THE EFFECT OF THE BELIEF THAT LUCK DETERMINES INCOME ON AGGREGATE SOCIAL SPENDING
Dependent variable: Social spending as percent of GDP 1 2 3 4
Mean belief that luck 32.728*** 32.272*** 36.430*** 31.782** determines income (2.925) (3.064) (3.305) (2.521)
Gini coefficient -0.306* -0.238* -0.115 (1.724) (1.739) (0.613)
GDP per capita 3.148 4.754 (1.348) (1.548)
Majoritarian 0.493 0.031 (0.184) (0.011)
Presidential -4.24 (1.392)
Latin America -6.950*** -4.323 -2.992 0.413 (3.887) (1.472) (0.941) (0.098)
Asia -9.244*** -6.075** -0.808 4.657 (6.684) (2.153) (0.142) (0.618)
Constant -3.088 7.907 -25.207 -41.401 (0.590) (1.396) (1.152) (1.425)
Observations 29 26 26 26 Adjusted R-squared 0.431 0.494 0.495 0.496
Sources: Total social spending is social spending as a percentage of GDP, from Persson and Tabellini (2003); original source: IMF. Majoritarian, presidential, and age structure are from Persson and Tabellini (2002). Ethnic fractionalization is from Alesina et al. (2001). Mean belief that luck determines income is constructed using World Value Survey data for 1981- 1997 from the Institute for Social Research, University of Michigan. This variable corre- sponds to the response to the following question: "In the long run, hard work usually brings a better life. Or, hard work does not generally bring success; it's more a matter of luck and connections." The answers are coded 1 to 10. We recoded on a scale 0 to 1, with 1 indicating the strongest belief in luck. We report OLS estimates, with robust t statistics in parentheses (* significant at 10 percent; ** significant at 5 percent; *** significant at 1 percent).
for the Gini coefficient, per capita GDP, and continent dummies. It is also robust to control- ling for two political variables, the nature of the electoral system and presidential versus parlia- mentary systems of government, which may influence the size of transfers, as argued by Torsten Persson and Guido Tabellini (2003).4
The impact of fairness perceptions is evident, not only in aggregate outcomes, but also in individual attitudes. The World Values Survey asks the respondent whether he identifies him- self as being on the left of the political spec- trum. We take this "leftist political orientation"
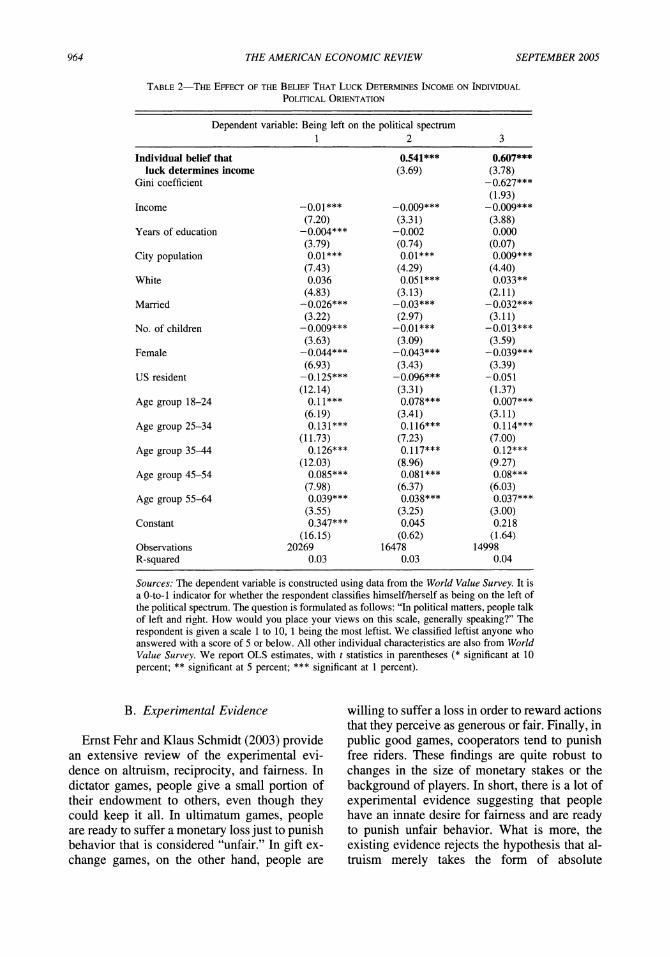
as a proxy for favoring redistribution and gov- ernment intervention. We then regress it against the individual's belief about what determines income together with a series of individual- and country-specific controls. As Table 2 shows, we find the belief that luck determines income has a strong and significant effect on the probability of being leftist.5
Further evidence is provided by Christina Fong (2001), Giacomo Corneo and Hans Peter Gruner (2002), and Alesina and Eliana La Fer- rara (2005). Using the General Social Survey for the United States, the latter study finds that individuals who think that income is determined by luck, connections, and family history rather than individual effort, education, and ability, are much more favorable to redistribution, even af- ter controlling for an exhaustive set of other individual characteristics.
4 The correlation loses some significance if one controls for the population share of the old, because the size of pensions depends heavily on this variable. The pension system, however, is much more redistributive in Europe than in the United States (Alesina and Glaeser, 2004). Also, the correlation between transfer payments and beliefs in luck remains very strong once we exclude pensions. More details are available in the working paper version of the paper.
5 Table 2 reports OLS estimates; Probit gives similar results.
964 THE AMERICAN ECONOMIC REVIEW SEPTEMBER 2005
TABLE 2-THE EFFECT OF THE BELIEF THAT LUCK DETERMINES INCOME ON INDIVIDUAL POLITICAL ORIENTATION
Dependent variable: Being left on the political spectrum 1 2 3
Individual belief that 0.541*** 0.607*** luck determines income (3.69) (3.78)
Gini coefficient -0.627*** (1.93)
Income -0.01*** -0.009*** -0.009*** (7.20) (3.31) (3.88)
Years of education -0.004*** -0.002 0.000 (3.79) (0.74) (0.07)
City population 0.01*** 0.01*** 0.009*** (7.43) (4.29) (4.40)
White 0.036 0.051*** 0.033** (4.83) (3.13) (2.11)
Married -0.026*** -0.03*** -0.032*** (3.22) (2.97) (3.11)
No. of children -0.009*** -0.01*** -0.013*** (3.63) (3.09) (3.59)
Female -0.044*** -0.043*** -0.039*** (6.93) (3.43) (3.39)
US resident -0.125*** -0.096*** -0.051 (12.14) (3.31) (1.37)
Age group 18-24 0.11*** 0.078*** 0.007*** (6.19) (3.41) (3.11)
Age group 25-34 0.131*** 0.116*** 0.114*** (11.73) (7.23) (7.00)
Age group 35-44 0.126*** 0.117*** 0.12*** (12.03) (8.96) (9.27)
Age group 45-54 0.085*** 0.081*** 0.08*** (7.98) (6.37) (6.03)
Age group 55-64 0.039*** 0.038*** 0.037*** (3.55) (3.25) (3.00)
Constant 0.347*** 0.045 0.218 (16.15) (0.62) (1.64)
Observations 20269 16478 14998 R-squared 0.03 0.03 0.04
Sources: The dependent variable is constructed using data from the World Value Survey. It is a 0-to-i indicator for whether the respondent classifies himself/herself as being on the left of the political spectrum. The question is formulated as follows: "In political matters, people talk of left and right. How would you place your views on this scale, generally speaking?" The respondent is given a scale 1 to 10, 1 being the most leftist. We classified leftist anyone who answered with a score of 5 or below. All other individual characteristics are also from World Value Survey. We report OLS estimates, with t statistics in parentheses (* significant at 10 percent; ** significant at 5 percent; *** significant at 1 percent).
B. Experimental Evidence
Ernst Fehr and Klaus Schmidt (2003) provide an extensive review of the experimental evi- dence on altruism, reciprocity, and fairness. In dictator games, people give a small portion of their endowment to others, even though they could keep it all. In ultimatum games, people are ready to suffer a monetary loss just to punish behavior that is considered "unfair." In gift ex- change games, on the other hand, people are
willing to suffer a loss in order to reward actions that they perceive as generous or fair. Finally, in public good games, cooperators tend to punish free riders. These findings are quite robust to changes in the size of monetary stakes or the background of players. In short, there is a lot of experimental evidence suggesting that people have an innate desire for fairness and are ready to punish unfair behavior. What is more, the existing evidence rejects the hypothesis that al- truism merely takes the form of absolute
VOL. 95 NO. 4 ALESINA AND ANGELETOS: FAIRNESS AND REDISTRIBUTION 965
inequity aversion. People instead appear to de- sire equality relative to some reference point, namely what they consider to be "fair" payoffs.
Further support in favor of our concept of fairness is provided by the evidence that exper- imental outcomes are sensitive to whether ini- tial endowments are assigned randomly or as a function of previous achievement. In ultimatum games, Elizabeth Hoffman and Matthew L. Spitzer (1985) and Hoffman et al. (1996) find that proposers are more likely to make unequal offers, and respondents are less likely to reject unequal offers, when the proposers have out- scored the respondents in a preceding trivia quiz, and even more if they have been explicitly told that they have "earned" their roles in the ultimatum game on the basis of their preceding performance. In double auction games, Sheryl Ball et al. (2001) report a similar sensitivity of the division of surplus between buyers and sell- ers on whether market status is random or earned. Finally, in a public good game where groups of people with unequal endowments vote over two alternative contribution schemes, Jeremy Clark (1998) finds that members of a group are more likely to vote for the scheme that effectively redistributes less from the rich to the poor members of the same group, when initial endowments depend on previous relative performance in a general-knowledge quiz rather than having been randomly assigned.
Psychologists, sociologists, and political sci- entists have also stressed the importance of a sense of fairness in people's private, social, and political life. People enjoy great satisfaction when they know (or believe) that they live in a just world, where hard work and good behavior ultimately pay off.6 In short, it is a fundamental conviction that one should get what one de- serves and, conversely, that one should deserve whatever one gets.
II. The Basic Model
Consider a static economy with a large num- ber (a measure-one continuum) of agents, in- dexed by i E [0, 1]. Agents live for two periods and, in each period of life, engage in a produc-
tive activity, which can be interpreted as labor supply, accumulation of physical or human cap- ital, entrepreneurship, etc. The tax and redistrib- utive policy is set in the middle of their lives.7
A. Income, Redistribution, and Budgets
Total pre-tax life-cycle income (yi) is the combined outcome of inherent talent (Ai), in- vestment during the first period of life (ki), effort during the second period of life (e,), and "noise" (ri):
(1) yi = Ai,[aki + (1 - ax)ei] + mqi.
aE (0, 1) is a technological constant which parametrizes the share of income that is sunk when the tax rate is set. Both Ai and -qi are i.i.d. across agents. We interpret Tli
either as pure random luck, or as the effect of socially unwor- thy activities, such as corruption, rent seeking, political subversion, and theft.
The government imposes a flat-rate tax on income and then redistributes the collected taxes in a lump-sum manner across agents. In- dividual i's budget is thus given by
(2) ci = (1 - 7)yi + G
whereas the government budget is G = T7. ci denotes consumption (also disposable income), T is the rate of income taxation, G is the lump- sum transfer, and y- fi yi is the average income in the population. This linear redistributive scheme is widely used in the literature follow- ing Thomas Romer (1975) and Allan H. Meltzer and Scott F. Richard (1981) because it is the simplest one to model. We conjecture that the qualitative nature of our results is not unduly sensitive to the precise nature of this scheme.8
B. Preferences
Individual preferences are given by
(3) Ui - ui - -yf
6 The desire for a just world is so strong that people may actually distort their perception or interpretation of reality; see Melvin J. Lerner (1982) and Benabou and Tirole (2005).
7 The assumption that an effort/investment choice precedes the policy choice is made only to ensure that part of agents' wealth is fixed when the policy is chosen; this assumption is relaxed in the dynamic extension of Section IV.
8 See footnote 11 and the concluding remark in Sec- tion V.

966 THE AMERICAN ECONOMIC REVIEW SEPTEMBER 2005
where ui represents the private utility from own consumption, investment, and effort choices, fl represents the common disutility generated by unfair social outcomes (to be defined below), and y ? 0 parametrizes the strength of the social demand for fairness. To simplify, we let
(4) ui = Vi(ci, ki, ei)
= Ci [aki + (1 - a)ei]. 2 2#i
The first term represents the utility of consump- tion (ci), the second the costs of first-period investment (ki) and second-period effort (ei). The coefficients a/2 and (1 - a)/2 are merely a normalization. Finally, Pi is i.i.d. across agents and parametrizes the willingness to postpone consumption and work hard: a low Pi captures impatience or laziness, a high Pi captures "love for work."9
C. Fairness
Following the evidence in Section I that peo- ple share a common conviction that one should get what one deserves, and deserve what one gets, we define our measure of social injustice as
(5) fl i (ui -
Ui)2
where ui denotes the actual level of utility and ai denotes the "fair" level of utility. The latter is defined as the utility the agent deserves on the basis of his talent and effort, namely ai = Vi(ci, ki, ei), where
(6) Ci = Yi
= Ai[ak, + (1 - a)eil
represent the "fair" levels of consumption and income. Similarly, the residual yi - Yi = qi measures the "unfair" component of income.
D. Policy and Equilibrium
Because fairness is a public good, it is not essential for our results how exactly individual preferences are aggregated into political choices about redistribution: no matter what the weight of different agents in the political process, the concern for fairness will always be reflected in political choices. To be consistent with the re- lated literature, we assume that the preferences of the government coincide with those of the median voter.'1
DEFINITION: An equilibrium is a tax rate 7 and a collection of individual plans {ki, eii([0o,1] such that (i) the plan (ki,
ei) maximizes
the utility of agent i for every i, and (ii) the tax rate 7 maximizes the utility of the median agent.
Note that the heterogeneity in the population is defined by the distribution of (Ai, i, 3i). For future reference, we let 5i 6 A2P3i and assume that
Cov(5i, rmi) = 0 and that qi has zero mean and median. We also denote
o -o Var(5i), 1 - Var( Qi), and A - 6m
- 6 > 0, where 6m and 8 are the median and the mean of 5i. An economy is thus parametrized by i = (A, y, a, o-, o,). A and y, in particular, parametrize the two sources of support for redistribution in our model: one is the standard "selfish" redistribu- tion as in Meltzer and Richard (1981), which arises if and only if A > 0; another is the "altruistic" redistribution originating in the de- sire to correct for the effect of luck on income, which arises if and only if y > 0.
III. Equilibrium Analysis
A. Fairness and the Signal-to-Noise Ratio
Because utility is quasi-linear in consumption, ui - ui = ci - i for every i, and therefore l = Var(ci - ci), where Var denotes variance in the cross section of the population. Combining this with (2), (6), and the property that yi - 9i is independent of 9 (which will turn out to be true in equilibrium since Tr
is independent of Bi), we 9 If agents suffered from procrastination and hyperbolic discounting, /3i could also be interpreted as the degree of self control, although in that case we would need to distin- guish between ex ante and ex post preferences. For an elegant model where the anticipation of procrastination af- fects also the choice of "ideology," see Benabou and Tirole (2005).
10 As shown in the Appendix, maxi{ li} l 28 actually suffices for preferences to be single-picked in r and thus for the median-voter theorem to apply.

VOL. 95 NO. 4 ALESINA AND ANGELETOS: FAIRNESS AND REDISTRIBUTION 967
obtain social injustice as a weighted average of the "variance decomposition" of income inequality:
(7) T = 72Varf(i) + (1 - 7)2Var(y - 9i).
In the absence of government intervention, the above would reduce to fl = fi (yi - yi)2, thus measuring how unfair the pre-tax income dis- tribution is; in the presence of government in- tervention, fl measures how unfair economic outcomes remain after redistribution.
Note that the weights of the variances in (7) depend on the level of redistribution (7). If minimizing fl were the only policy goal, taxa- tion were not distortionary, and the income dis- tribution were exogenous, the equilibrium tax rate would be given simply by:
1 - 7 Var(fi) (8)ar
7 Var(yi
- Yi)"
The right-hand side represents a signal-to-noise ratio in the pre-tax income distribution: the sig- nal is the fair component of income, and the noise is the effect of luck. As the goal of redis- tribution is to correct for the effect of luck on income, the optimal tax rate is decreasing in this signal-to-noise ratio.1
This signal-to-noise ratio, however, is endog- enous in equilibrium. To compute it, consider the investment and effort choices of agent i. Substituting (1) and (2) into (4), we have
(9) ui = (1 - 7)Ai[aki + (1 - a)ei]
1 + G -
2--[ak + (1 - a)e-]. 2pi
Recall that agents choose ei after the policy is set, but ki before. First-period investment is thus a function of the anticipated tax rate and is sunk when the actual tax rate is chosen. To distin- guish the anticipated tax rate from the realized one, we henceforth denote the former by T and
the latter by 7. (Of course, Te = 7 in equilib- rium.) The first-order conditions then imply
(10) ki = (1 - 7Te)iAi
and
ei = (1 - 7)PiAi.
Next, substituting into (6) gives
(11) 9i = [1 - aTe
- (1 - a)T7]5i
where 6i " PiA2. Combining the above with yi -
Yi = Tqi,
we conclude the equilibrium signal-to- noise ratio in the income distribution is
Varfi) oi (1
Var(y- ) = [1 - ae - (1 - a)7]2
(12)Var0y -)
where ao = Var(5i) = Var(j3iA) and &2 Var(rli). Hence, heterogeneity in talent or will- ingness to work increases the signal, whereas luck increases the noise. Most importantly, the signal-to-noise ratio is itself decreasing in the tax rate, reflecting the distortionary effects of taxation.
B. Optimal Policy
The optimal policy maximizes the utility of the median voter. Assuming that luck has zero mean and median, the median voter, denoted by i = m, is an agent with characteristics 5m =
median(Si) and -7m = 0. Letting A - = - 5m and
normalizing 6m = 2, the utility of the median voter in equilibrium reduces to12
(13) Um = (1 - a")
- (1 - a)72
+ [1 - aTe- (1 - a)7]TA - -yf.
The first and second terms in (13) capture the welfare losses due to the distortion of first- period investment and second-period effort, re- spectively. The third term measures the net transfer the median voter enjoys from the tax system, reflecting the fact that a positive tax rate effectively redistributes from the mean to the median of the income distribution. This term
" The implicit assumption that justifies the restriction of policy to a linear income/wealth tax is that the government cannot tell apart the fruits of talent and effort from the effect of luck: (Ai, 3i, -qi, ki, ei) are private information to agent i. Therefore, the society would face a signal-extraction prob- lem like the one identified above even if it could use a general nonlinear redistributive scheme. 12 See the Appendix for the derivation of (13).

968 THE AMERICAN ECONOMIC REVIEW SEPTEMBER 2005
introduces a "selfish" motive for redistribution, as in Meltzer and Richard (1981).
The last term instead captures the "altruistic" motive originating in the social concern for fairness. From (7) and (11), the equilibrium value of fl is
(14) = 72[1 - a - (1 - a)]2
+ (1 - 7)2o
where o2, = Var(8i) and a = Var(TQi).
Note that fl depends on both re and 7. The negative dependence on re reflects the fact that the an- ticipation of high taxation, by distorting first- period incentives, results in a large relative contribution of luck to income. The dependence on 7 reflects not only a similar distortion of second-period incentives, but also the property that, keeping the pre-tax income distribution constant, more redistribution may correct for the effect of luck, thus obtaining a fairer distri- bution of after-tax disposable income.13
LEMMA 1: When the ex ante anticipated pol- icy is re, the ex post optimal policy is
(15) f(e,; F) - arg min,,-G[o]{(1 - a)r2
+ r(1 - are - (1 - a)r)2'ya2
+(1 - 7)2'-2yo-1 - a, re- (1 - a)7]A}.
If y = 0, then f = 0 if A = 0, f > 0 and
af/la > 0 > af/lar if A > 0, and af/ao- = af/ao- = 0 in either case.
If instead, y > 0, then f > 0 and af/aoa, > 0 necessarily, whereas there exists ^e > 0 such that af/lao, < 0 and af/la > 0, if and only if
re <
'e, where the threshold
re is increasing in
yoa2 and reaches 1 at ya2 = 1 - a. Finally, a > 1/3 and y > A/(2 - 3(1 - a)) suffice for aflare > 1 for all e < te and some fe > 0.
The intuition of these results is simple. If there is neither a concern for fairness (y = 0), nor a difference between the mean and the me-
dian of the income distribution (A = 0), the optimal tax is zero, as redistribution has only costs and no benefits from the perspective of the median voter. When the median is poorer than the mean (A > 0), the Meltzer-Richard effect kicks in, implying that the optimal tax rate is positive and increasing in A. Nevertheless, as long as the there is no demand for fairness (y = 0), the optimal tax remains independent of the sources of income inequality. Moreover, the ex post optimal policy is decreasing in the ex ante anticipated policy, as a higher distortion of first- period incentives reduces the income difference between the mean and the median, and therefore also reduces the benefit of redistribution from the perspective of the median voter.
Things are quite different in the presence of a demand for fairness (y > 0). The society then seeks a positive level of redistribution in order to correct for the undesirable effect of luck on income inequality. As a result, the optimal tax is positive even if the median and the mean of the population coincide (A = 0). The optimal tax then trades less efficiency for more fairness. As o- increases, more of the observed income in- equality originates in luck, which implies a higher optimal tax rate. The opposite consider- ation holds for higher o-s, as this implies a larger relative contribution of ability and effort in in- come inequality. Finally, the relationship be- tween re and 7 is generally nonmonotonic. To understand this nonmonotonicity, note that an increase in e has an unambiguous adverse ef- fect on the fairness of the income distribution, as it distorts first-period incentives. An increase in 7, instead, has two opposing effects. On the one hand, as in the case of re, a higher "
reduces the "fair" component of income variation be- cause it distorts second-period incentives. On the other hand, a higher 7 redistributes more from the poor to the rich and may thus "correct" for the effect of luck. When re is small, the second effect dominates: 7 increases with re in order to expand redistribution and thus "correct" for the relatively larger effect of luck. When, in- stead, re is high, the first effect dominates: 7 falls with e in order to encourage more effort and thus "substitute" for the adverse effect of a higher e.
C. Multiple Equilibria
In equilibrium, expectations must be validated and therefore Te = 7r. The equilibrium set thus
13 Note that re is taken as given when 7 is set, reflecting the fact that the agents' first-period investments are sunk. In other words, the government lacks commitment. In Sections III D and IV, we explain why commitment is inessential once intergenerational links are introduced.
VOL. 95 NO. 4 ALESINA AND ANGELETOS: FAIRNESS AND REDISTRIBUTION 969
.i[-, ,J~ I
..
.,..
......
::
/
0.4
.b, 0.6 ....
/
~us
0
Us 7 0.2
o 0.2 0.4 0.6 0.8
ex ante anticipated policy T
FIGURE 2
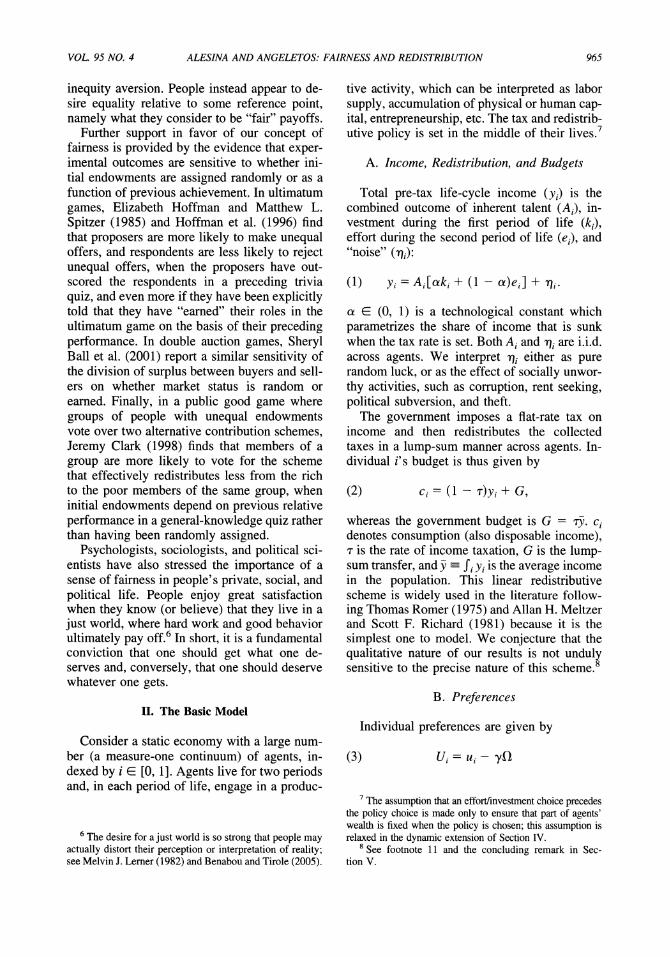
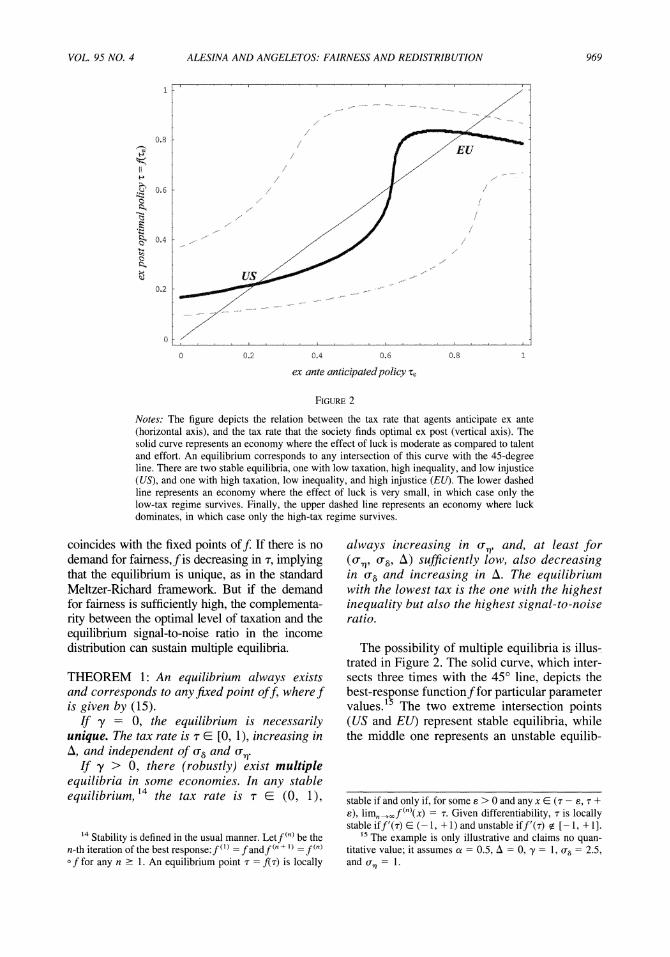
Notes: The figure depicts the relation between the tax rate that agents anticipate ex ante (horizontal axis), and the tax rate that the society finds optimal ex post (vertical axis). The solid curve represents an economy where the effect of luck is moderate as compared to talent and effort. An equilibrium corresponds to any intersection of this curve with the 45-degree line. There are two stable equilibria, one with low taxation, high inequality, and low injustice (US), and one with high taxation, low inequality, and high injustice (EU). The lower dashed line represents an economy where the effect of luck is very small, in which case only the low-tax regime survives. Finally, the upper dashed line represents an economy where luck dominates, in which case only the high-tax regime survives.
coincides with the fixed points off. If there is no demand for fairness, fis decreasing in 7, implying that the equilibrium is unique, as in the standard Meltzer-Richard framework. But if the demand for fairness is sufficiently high, the complementa- rity between the optimal level of taxation and the equilibrium signal-to-noise ratio in the income distribution can sustain multiple equilibria.
THEOREM 1: An equilibrium always exists and corresponds to any fixed point off, where f is given by (15).
If y = 0, the equilibrium is necessarily unique. The tax rate is T E [0, 1), increasing in A, and independent of rs8 and -,.
If y > 0, there (robustly) exist multiple equilibria in some economies. In any stable equilibrium, 14 the tax rate is 7 E (0, 1),
always increasing in oa, and, at least for (ow, a, A) sufficiently low, also decreasing in as and increasing in A. The equilibrium with the lowest tax is the one with the highest inequality but also the highest signal-to-noise ratio.
The possibility of multiple equilibria is illus- trated in Figure 2. The solid curve, which inter- sects three times with the 450 line, depicts the
best-response functionf for particular parameter values.'5 The two extreme intersection points (US and EU) represent stable equilibria, while the middle one represents an unstable equilib-
14 Stability is defined in the usual manner. Let f() be the n-th iteration of the best response: f( ) = fandf(n" + ) = f(n) of for any n
- 1. An equilibrium point 7 = f(7) is locally
stable if and only if, for some e > 0 and any x E (7 - e, 7 + e), limnoof(n)(x) -= . Given differentiability, 7 is locally stable iff'(Q) E (-1, +1) and unstable iff'(-r) ? [-1, +1].
15 The example is only illustrative and claims no quan- titative value; it assumes a = 0.5, A = 0, y = 1, ao = 2.5, and o- = 1.
970 THE AMERICAN ECONOMIC REVIEW SEPTEMBER 2005
rium.16 In point EU, the anticipation of high taxes induces agents to exert little effort in the first period. This, in turn, implies that the bulk of income heterogeneity is due to luck and makes it ex post optimal for society to under- take large redistributive programs, thus vindi- cating initial expectations. In point US, instead, the anticipation of low taxes induces agents to exert high effort and implies that income vari- ation is mostly the outcome of heterogeneity in talent and effort, which in turn makes low re- distribution self-sustained in the political pro- cess. What is more, the level of inequality (as measured by the total variance of income) is lowest in EU, but the decomposition of inequal- ity (as measured by the signal-to-noise ratio) is fairest in US, which explains why more inequal- ity may be consistent with lower taxes.
The assumption that a fraction of income is sunk when the tax is set (a > 0) is essential for the existence of multiple equilibria: if a were zero, the income distribution would be indepen- dent of the anticipated tax, and therefore the equilibrium would be unique.17 On the other hand, a < 1 is not essential and only ensures that agents internalize part of the distortionary costs of taxation when voting on the tax rate. Indeed, an extreme but particularly simple ver- sion of our result holds when a = 1 and A > 0.18 If y = 0, the unique equilibrium is r = 1, because the median voter sees a positive benefit and a zero cost in raising r as long as Te < 1. If y > 0, the fixed-point relation 7 = f(7) reduces to
2o + A/(2y) )=
In this case, r = 1 remains an equilibrium, because T = 1 implies that all income inequal- ity is the outcome of luck and makes full redis- tribution optimal from a fairness perspective as well. Moreover, if
(•r, + A/(2y))/o2 > 1/4,
there is no other equilibrium. If, however,
(o-2 + A/(2y))/o2, < 1/4, there is in addition
another stable equilibrium, corresponding to the lowest solution of (16). This equilibrium is the analogue of US in Figure 2 and is such that r is increasing in o- and decreasing in -as (reflecting the effect of fairness), as well as increasing in A (reflecting the standard Meltzer-Richard effect).
The assumption a < 1 thus implies only that EU does not take the extreme form r = 1. Numerical simulations then suggest that the US- and EU-type equilibria coexist as long as y is sufficiently high and o-, is neither too large nor too small relative to oa. Instead, only the high- tax regime survives when the effect of luck is sufficiently strong relative to the effect of talent and effort in shaping the income distribution (high ao); and only the low-tax regime survives if there is either little demand for fairness (low -y) or little noise to correct (low o,). These situations are illustrated, respectively, by the upper and lower dashed lines in Figure 2. Fi- nally, the existence of multiple equilibria does not rely on whether there is a standard Meltzer- Richard motive for redistribution in addition to the fairness motive, although ceteris paribus a higher A makes it more likely that only the high-tax regime survives.
D. Comments
The critical features of the model that gener- ate equilibrium multiplicity are (a) that the op- timal tax rate is decreasing in the signal-to-noise ratio and (b) that the equilibrium signal-to-noise ratio is in turn decreasing in the tax rate. To deliver the second feature, we have chosen a simple specification for income in which "luck" enters additively and thus does not interact with effort or investment. Nevertheless, this simpli- fication is not essential per se. What is essential is that higher taxes, by distorting effort and investment, result in a reduction in the level of justifiable inequality relative to the level of un- justifiable inequality. For this to be true, it is necessary and sufficient that higher taxes reduce the fair component of income more than the unfair component, which we believe to be a plausible scenario.'9 Note also that, in our
16 Because f(i) = 7 is a cubic equation in our model, multiplicity always takes the form of three equilibria (ex- cept for degenerate cases of two solutions).
17 In the dynamic model of the next section, a > 0 will mean that part of the agents' wealth is determined by their family history.
18 We thank a referee for highlighting this example.
19 In Alesina and Angeletos (forthcoming), we investigate a different model in which unfair income originates in rent seeking and corruption. Higher taxes and bigger governments may then reduce the signal-to-noise ratio, not only because they distort effort, but also because they increase rent seeking.
VOL. 95 NO. 4 ALESINA AND ANGELETOS: FAIRNESS AND REDISTRIBUTION 971
model, the role of heterogeneity in Ai and/or Pi is to generate endogenous variation in the "fair" level of income. Endogenizing the concept of fairness, and understanding why societies con- sider some sources of inequality justifiable and others unfair, is an exciting direction for future research, but it is beyond the scope of this paper.
The pure Meltzer-Richard model predicts that greater inequality is correlated with more redistri- bution. Pure inequality aversion would predict a similar positive correlation. The evidence, how- ever, suggests a negative or null correlation be- tween inequality and redistributive effort (e.g., Roberto Perotti, 1996; Alesina et al., 2001). Our model can deliver such a negative correlation even after controlling for exogenous fundamentals: in the example of Figure 2, US has both a lower 7 and a higher Var(yi) than EU, simply because lower taxes generate higher-but also more jus- tifiable-levels of inequality.
The prediction that higher redistribution should be correlated with higher belief that income in- equality is unfair is clearly consistent with the evidence discussed in Section I. But what about the prediction that higher tax distortions should be correlated with lower levels of effort and invest- ment? As we noted before, tax distortions are much higher in Europe; the income tax is much more progressive and the total tax burden is about 50 percent higher than in the United States. At the same time, hours worked are much lower in Eu- rope. In 2001, the average worked time per em- ployee was about 1,200 hours in Europe as compared to 1,600 in the United States. Given the lower labor participation rate in Europe, the dif- ference becomes even more striking when mea- sured per person rather than per employee. Prescott (2004) computes an effective marginal tax on labor income that properly accounts for consumption taxes and social security contribu- tions. He finds this to be about 50 percent lower in the United States than in France and Germany, and argues that this difference can explain a large fraction of the difference in labor supply across the two continents. Consistent with a distortionary effect of government intervention is also the observation that growth rates and various mea- sures of investment in intangible capital are higher in the United States.20 In short, relative
to Europeans, Americans are taxed less, work more, invest more in intangible capital, and obtain higher rewards.21
The two equilibria in Figure 2 can easily be ranked from the perspective of the median vot- er: the one with lower taxes is superior. This is both because there are fewer distortions, more investment, and more aggregate income, and because income inequality originates relatively more in ability than in luck. Poorer agents, however, may prefer the high-tax equilibrium, as it redistributes more from the rich to the poor. Also, the high-tax equilibrium provides more insurance against the risk of being born with little talent or willingness to work and may be preferred behind the "veil of ignorance" (that is, before the idiosyncratic shocks are realized).
Finally, it is of course unrealistic to think that an economy could "jump" from one re- gime to another by simply revising equilib- rium expectations from one day to another. In the next section, we consider a dynamic vari- ant of our model, in which history determines what beliefs the society holds and what redis- tributive policies it selects. The two regimes then reemerge as multiple steady states along a unique equilibrium path. Similarly, whereas only the low-tax regime would survive in the static economy if the society could credibly commit to its tax policies before agents make their early-in-life investment choices, such commitment has little bite in the dynamic economy, where the wealth distribution is largely determined by policies and outcomes from earlier generations.
20 For example, the United States spends 2.8 percent of GDP in R&D, while the 15 E.U. countries spend 1.9 percent
(OECD data, 2001). Moreover, the fraction of this invest- ment that is private (not government sponsored) is double in the United States. The percentage of college-educated indi- viduals is 37.3 in the United States as compared to 18.8 in Europe (OECD data, 2001, individuals between the age of 25 and 64). This difference is even more striking if one considers that, in most European countries, college educa- tion is publicly provided and largely financed by general government revenues.
21 In addition to these measurable effects of taxation and regulation, there may be other, more subtle disincentive effects of the welfare state; these may involve changes in social norms that disengage individuals from market activ- ities, as argued by Assar Lindbeck et al. (1999) in theory and by Lindbeck et al. (1994) as an explanation of the effects of the welfare state in Sweden.
972 THE AMERICAN ECONOMIC REVIEW SEPTEMBER 2005
IV. Intergenerational Links and History Dependence
One important determinant of wealth and success in life is being born into a wealthy family. To explore this issue, we now introduce intergenerational wealth transfers and parental investment (e.g., bequests, education, status, etc.) that link individual income to family his- tory.22 Since we now wish to concentrate on the effect of history rather than on self-fulfilling expectations, we abstract from investment choices made within a generation before the tax is set. The optimal policy is then uniquely de- termined in any given generation, but it depends on the decomposition of wealth in all previous generations.
A. The Environment
The economy is populated by a sequence of nonoverlapping generations, indexed by t E { ..., -1, 0, 1, ...}. Each generation lives for one
period. Within each generation, there is a single effort choice and it takes place after the tax is voted on. Parents enjoy utility for leaving a bequest to their children; by "bequest" we mean not only monetary transfers, but also all other sorts of parental investment.23
Pre-tax wealth is the outcome of talent and effort, random luck, and parental investment:
(17) Yit = Aiteit + T;it + kit,
where kit-1 now represents the bequest or other parental investment received by the previous generation. Ai, continues to denote innate talent and qit the luck or other unworthy income within the life of the agent. The individual's budget constraint, on the other hand, is given by
(18) ci, + kit = Wit , (1 - 7,t)Yi + Gt
where ci, denotes own consumption, ki, is the
bequest left to the next generation, wit denotes disposable wealth, 7, is the tax rate, G, = Tty, is the lump-sum transfer, and •, - fi Yit
is mean income in generation t.
Individual preferences are again Uit = ui -
y1t,, but the private utility is now
(19) ui, = Vi,(ci,, kit, eit)
(1 - (Cit)l-a(kit)a
iit
The first term in (19) represents the utility from own consumption and bequests, whereas the second term is the disutility of effort. For sim- plicity, we have assumed a Cobb-Douglas ag- gregator over consumption and bequests, with a E (0, 1) now parametrizing to the fraction of wealth allocated to bequests. The constant 1/((1 - a) l-'aa) is an innocuous normaliza- tion, and it, denotes again willingness to work. We assume that it
=- Pit(Ait)2
and rit are i.i.d. across agents but fully persistent over time.
Finally, social injustice is again the distance between actual and fair utility in any given generation:
(20) ft,
f (uit - u it)2 ;
where Uit
= Vi(cit,, kit, eit) and Lit
= Vi,(Ji,, kit,
ei). The fair levels of consumption and bequests
it, ,it) are defined below.
B. History and Fairness
Household i in generation t chooses con- sumption, bequest, and effort (Ci,, k,, eit) so as to maximize its utility subject to its budget con- straint, taking political and social outcomes (7,, fi) as given. It follows that the optimal con- sumption and bequests are
(21) cit = (1 - a)wi, and kit = awit.
Utility thus reduces to uit = Wit - ei/(20it), which in turn implies that the optimal level of
effort is eit = (1 - Tt)Aitrit.
22 For a recent discussion on the intergenerational trans- fer of wealth and its effect on entrepreneurship, see Francesco Caselli and Nicola Gennaioli (2003).
23 This is of course a shortcut, which is easier to model than adding the utility function of the children into that of the parents. It also rules out the dependence of political decisions in one generation on expectations about political decisions in future generations.

VOL. 95 NO. 4 ALESINA AND ANGELETOS: FAIRNESS AND REDISTRIBUTION 973
Since wealth in one generation depends on bequests and parental investment from the pre- vious generation, which in turn depend on wealth in the previous generation, the wealth of any given individual depends on the contribu- tion of talent and effort and the realization of luck, not only during a person's own lifetime, but also along his whole family tree. We thus need to adjust our measures of fair outcomes for the propagation of luck through intergenera- tional transfers. Assuming that bequests and parental investments are considered fair only to the extent that they reflect effort and talent, not pure luck, we define fair outcomes as the luck- free counterparts of consumption, bequests, and wealth: Ci, = (1 - a)9i, it
= (1 - a)9,i, and
Wit = t = Aiteit
+ kit-1.
Iterating the latter backward, we infer that the fair level of wealth is given by the cumulative effect of talent and effort throughout the individual's family history:24
(22) Wit, Yit aj = -tAsei.
set
Similarly, the residual between actual and fair wealth, wit - it,, captures the cumulative effect of luck and redistribution.
Consider next the interaction between redis- tribution and fairness. Note that uit -
uit
=
Wit - it and therefore ?1, = Var(wit - Wit), or
equivalently
(23) ,t = TrVar(,it)
+ (1 - 7,)2Var(yit - it)
+ 27,(1 - Tt)Cov(yit, it - Yit).
Apart from the covariance term, this is identical to the corresponding expression (7) in the benchmark model. Thus once again the optimal tax rate is bound to decrease with the signal-to- noise ratio in the pre-tax wealth distribution. As
shown in the Appendix, the signal-to-noise ratio in turn depends on the policies chosen by all past generations. In particular, a society that has a history of high distortions will tend to have inherited a rather unfair wealth distribution, which makes it more likely that it favors ag- gressive redistribution in the present.25 High levels of taxation and redistribution can thus be self-reproducing, opening the door to multiple steady states.
C. Multiple Steady States
We look for fixed points such that, if s = 7
for all generations s - t - 1, then rt = r is optimal for generation t. We first characterize the optimal policy for a given stationary history.
LEMMA 2: When all past generations have chosen r, the optimal tax for the current gener- ation is T' = (rT; E), where
(T; E) -arg min t - r T,[(1
- T)
a(1 - 7) 1 + (-
?-r)I 2
+YO1- t) 2 1+1-a(l-r)
12
S- a(1 - 7)
+y (1 T)r t- - a(1 - )
+ [( -1 - a(1
- T)
x (1 - T,)(1 - )
- (1- _)2
Comparing the above with Lemma 1, we see that, apart from the fact that 0 now represents the best reaction against the historical policies rather than against same-period market expec- tations, 0 has similar properties with f in the static model. In particular, 0 is increasing in A,
24 We assume that the parents are fully entitled to make different transfers to their children deriving from different levels of effort. The society, however, may not want to keep children responsible for their parents' laziness and lack of talent. There may then be a conflict between what is fair
vis-a-vis parents and what is fair vis-a-vis children. In the working-paper version of this article, we considered a sim- ple extension in which, from a fairness perspective, children were entitled only to a fraction A of their parents' justifiable bequests. The multiplicity survives for A sufficiently high.
25 There is an offsetting effect, however, namely that higher taxation in the past has already partly corrected for the impact of past luck, which explains why the impact of past policies on the signal-to-noise ratio is nonmonotonic in general.
974 THE AMERICAN ECONOMIC REVIEW SEPTEMBER 2005
reflecting the Meltzer-Richard effect.26 More- over, when y = 0, ) is decreasing in 7, for a higher tax in the past means lower wealth in- equality in the present and therefore a weaker Meltzer-Richard motive for redistribution. By implication, 0 has a unique fixed point when y = 0. When, instead, y > 0, ) can be increas- ing in 7, for higher tax distortions in the past imply more unfair wealth distribution in the present. As a result, 4 can have multiple fixed points when y > 0.
THEOREM 2: If y = 0, there exists a unique steady state. If instead, y > 0, there robustly exist multiple steady states.
The multiple equilibria of our benchmark model can thus be reinterpreted as multiple steady states of the dynamic model. Like in the static model, multiple steady states exist only when the social desire for fairness is sufficiently high. The one steady state (US) is then charac- terized by persistently lower taxation, lower dis- tortions, and fairer outcomes, but the other (EU) might be preferred behind the veil of ignorance. But unlike the static model, it is different initial conditions or different shocks, not different self-fulfilling expectations, that explain which regime an economy rests on. We conclude that different historical experiences may have led different societies to different steady states, in which different social beliefs and political out- comes are self-reproducing.
V. Conclusion
The heart of our results is the politico- economic complementarity introduced by the view that "people should get what they deserve and deserve what they get." The possibility of multiple equilibria or multiple steady states was only an extreme manifestation of this comple- mentarity. More generally, a demand for fair- ness introduces persistence in social beliefs and political choices. This also suggests that re- forms of the welfare state and the regulatory system may need to be large and persistent to be politically sustainable. In practice, this means
that policymakers need to persuade their elec- torates that, although such reforms may gener- ate rather unfair outcomes in the short run, they will ultimately ensure both more efficient and fairer outcomes for future generations.
Although we focused on income taxation, the demand for fairness may have similar implica- tions for a broader spectrum of policy choices, such as the inheritance tax, the public provision of education, or the regulation of product and labor markets. For example, if a society per- ceives differences in wealth and family back- grounds largely as the effect of luck and connections, it may consider the "death tax" quite fair, and may also find it desirable, albeit costly, to limit the options for private education.
Our analysis thus sheds some light on why differences in attitudes toward the market mech- anism are so rooted in American and European cultures. In Europe, opportunities for wealth and success have been severely restrained by class differences at least since medieval times.27 At the time of the extension of the franchise, the distribution of income was perceived as unfair because it was generated more by birth and nobility than by ability and effort. The "invisi- ble hand" has frequently favored the lucky and privileged rather than the talented and hard- working. Europeans have thus favored aggres- sive redistributive policies and other forms of government intervention. In the "land of oppor- tunity," on the other hand, the perception was that those who were wealthy and successful had "made it" on their own. Americans have thus chosen strong property protection, limited reg- ulation, and low redistribution, which in turn have resulted in fewer distortions, more effi- cient market outcomes, and a smaller effect of "luck." Today, the "self-made man" remains very much an American "icon"; and Americans remain more averse to government intervention than Europeans.
Of course, this is only part of the story. Was slavery a justifiable source of inequality in the United States? And is the sustained income differential between whites and blacks a fair
26 Note, however, that the Meltzer-Richard motive now applies to redistribution of both contemporaneous income and inherited bequests.
27 Marx and Engels had already identified the lack of a feudal period as one of the reasons why in the United States it would have been much harder to create a Communist party committed to wealth expropriation. See Alesina and Glaeser (2004) for more discussion.
VOL. 95 NO. 4 ALESINA AND ANGELETOS: FAIRNESS AND REDISTRIBUTION 975
outcome? Probably not. Also, part of the reason why the median in the United States believes that the poor deserve to be poor may be that the median tends to be white and the poor tend to be black. And there is certainly much to the point that Americans overestimate social mobility, while Europeans underestimate it, and that some of the welfare programs in Europe, such as in public education or public health, may actually help reduce the effect of luck. An im- portant question thus remains as to whether different beliefs reflect different facts or simply different ideologies and stereotypes.
Finally, the definition of fairness in this paper was embedded in individual preferences. An important question is where such preferences originate, and why societies consider particular sources of income "fair" and others "unfair." One may think of such preferences for fairness as a metaphor for a social norm that supports a socially preferable outcome. This seems partic- ularly valid if one interprets "luck" as the effect
of corruption, rent seeking, theft, and the like- activities that involve private but no social ben- efits and may thus be naturally treated by society as "unjust." Alternatively, one may fol- low the Mirrlees paradigm and model fairness as social insurance. Since taxing luck or rent- seeking may involve no or little efficiency costs as compared to taxing productive effort, the optimal level of redistribution is again likely to decrease with the signal-to-noise ratio in the income distribution.28 We leave these issues open for future research.
APPENDIX
PROOF OF LEMMA 1: Conditions (2), (10), and (11) imply that, in equilibrium, the level of consumption and the cost of investment and effort for agent i are
Ci (1 - 7)yi + = [1 - a, - (1 - a)T][8i + T(8 - 6~i)] + ? (q - +i),
1 1 213
[ak/ + (1 - a)e] = 2 [a(1 -
Te)2 + (1 - a)(1 - T)2]~i. 216i
1 )'+(
Combining, we infer that the equilibrium utility of agent i is
(24) Ui = [1 - a - (1 - a)2] + [1 - are - (1 - a)r7](5 - 8i) +
[Ti +
"7( -
'i)] - yfl,
with f• as in (14). It follows that
a2Ui r2= -(1 - a)(26 - 68) - 2y{o [1 - 27(1 - a)- are]2 + }.
Therefore 26 > max{ 5i} suffices for preferences to be single-picked in r for all agents, in which case the median voter theorem applies. In any event, we assume that the policy maximizes the utility of the median voter. Evaluating (24) for i = m, using qm
= 0, A = - ,,,, and the normalization 6m = 2, gives (13). Next, define W(7, e) = (1 - aT) - Um, or equivalently
W(7, Te) = (1 - a)T2 + 7[1 - aTe - (1 - a)Tr]2y( + (1 - T)2'yo2 - 71 - ae, - (1 - a)er]A.
28 Amador et al. (2004) consider a Mirrlees-type model with two types of privately observed idiosyncratic shocks, one which is desirable to insure ("taste shocks") and another which is undesirable to insure ("self-control shocks"). Al- though their environment is very different from ours, one of their findings is reassuring: in simulations, the optimal level of redistribution tends to decrease with the variance of taste shocks relative to the variance of self-control shocks.
976 THE AMERICAN ECONOMIC REVIEW SEPTEMBER 2005
Define also H(T, re)
= aW/Iar. Letting f(Te) = arg minTE[o,1 W(T, Te) gives (15). Note that W is strictly convex, since a2W/la2
= 2(1 - a)(1 + A) + 2y-{oyf[1 - 27(1 - a) - are]2 + o, } > 0. By implication, the first-order condition is both necessary and sufficient, in which case 7 = f(Te) is the unique solution to H(7, re) = 0.
If = A = 0 = , it is immediate that f(re) = 0 for all Ge E [0, 1]. But if y > 0 and/or A > 0, H(0, e) = -2yo-2 - A(1 - ae) < 0, which ensures f(le) > 0 for all T, E [0, 1]. Moreover, if A > 0
but y = 0, the first-order condition gives f(T) = A(1 - aTe)/(2(1 + A)) and therefore aflare < 0, af/laA > 0, and fl/ao-, = af/l, = 0.
For y > 0, the solution can be analyzed using the Implicit Function Theorem. By the second-order condition, aH/la = a2W1/82 > 0. Next, it is easy to check that aH/Ola = -2(1 - 7), aH/la8 =
2yo -[1 - are - (1 - a)r][1 - are - 2(1 - a)r], and aH/IA = -[1 - are,
- 2(1 - a)r]. It follows that afla/u > 0 necessarily. On the other hand, af/lao, < 0 < afl/A > 0 < 7 < (1 - aTre)/2(1 - a). Let
1 - a 1 h(e) 2(1 - a)'e 1 - {[1 - a - (1 - 2a)yo2_ ]
- 2 [1 -
_ + yO2-]2e} h(e) H 2(1 - a) 1 - aqq]Te
and note that r < (1 - are)/2(1 - a) if and only if h(re) > 0. Since h'(Te) < 0, there exist a unique Te such that h(Te) > 0 if and only if re <
-e; this threshold is e = (1 - a - (1 - 2a)y-)/(a(1 -
a + yo2)). We conclude that af/lo-, < 0 and afl/A if and only if Te < e, where ?e is decreasing in yo2, and satisfies Te
-? 1, if and only if yo-2, 1 - a. Finally, 8H/ar0e=a0
= -yao {[2 - 3(1 -
a)r] - A/y}. It follows that a > 1/3 and y > A/[2 - 3(1 - a)] suffice for aH/IOrey=o < 0, in which case f'(0) > 0; that is, f is initially increasing in re.
PROOF OF THEOREM 1: That f has at least one fixed point follows immediately from the fact that f is bounded and continuous. First, note that T = re = 1 implies (aW/la) =
(1 - a)(2 + A) and thus, for any A ? 0, f(1) < 1 if and only if a < 1. Therefore, a < 1 is necessary and sufficient for 7 = 1 not to be a fixed point. Next, note that Lemma 1 established that f is nonincreasing in 7 for either y = 0 or a = 0. It follows that f has a unique fixed point whenever y = 0 or a = 0, and by continuity also when y or a are sufficiently close to zero. For -y and a sufficiently high, on the other hand, f is increasing over some portions, which opens the door to multiple fixed points. An example of an economy with multiple fixed points is given by Figure 2 in the main text (that is, by a = 0.5, A 0= , y = 1, o-, = 2.5, a, = 1). Since all three fixed points in this example are nonsingular (in the sense that f(7) t 1) and since f is continuous in E = (a, A, y, o-,, o-,), there is an open set of E for which f(7) = 7 admits multiple fixed points, which proves that multiplicity emerges robustly in some economies. Finally, the comparative statics of the equilibria with respect to o-, and o- follow directly from the comparative statics of f (see Lemma 1 again), whereas the equilibrium level and the decomposition of inequality are given by Var(yi) = (1 - 7r)2 + a-2 and Var(ii)/Var(yi
- i) = (1 -
7)2o2o2, which clearly are both decreasing in 7.
PROOF OF LEMMA 2 AND THEOREM 2: Iterating (17) and (21), after-tax wealth in period t reduces to
(25) Wit-
= -s(1 - as+1,,-,)[(1 - r7)(Aiei
+ •r)
+F G,] s<t
where is, 1 - Ij= s (1 - Tj) denotes the cumulative tax rate between periods s and t (with the convention that ts,t = 0 for s > t). Combining with (22), the residual between actual and fair wealth reduces to
VOL. 95 NO. 4 ALESINA AND ANGELETOS: FAIRNESS AND REDISTRIBUTION 977
(26) wit,- wit,= at-[(1 - Ts,t- )l -
s,t-A 1Ae + (1 - ts+l,t-1)Gs].
s,-t
Next, note that Yit = Aiteit + T7it + awit-1, Yit = Aiteit + a it-1-I,
and therefore Yit - it t
a(wit-1 - wit). Using (25) and (26) for t - 1, and substituting eis = (1 - sw)Aisisw, we get
Yit - Yit = i t--s[(1 - s,t2)i - ,t-2( ( - s+,t-2)Gs]. st- 1
Using the above and (22) to compute Var(yit - jit) and Var(gi,), we conclude that the equilibrium signal-to-noise ratio is given by
( Var('(1 - s7))2- Var(it) s
Var(yi, - 9it)
( au"(1 - is,,t-
))2+ ( t-ss,t- 2 (1 - )) s<t s<;t-1
where ;i,, - 1 - I = s1 (1 - T.)
denotes the cumulative tax rate between periods s and t (with the convention that
fs,, = 0 for s > t). Note that the above depends on
s for every s ? t, which proves
the claim in the main text that how fair the wealth distribution is in generation t depends not only on the policies chosen by the same generation, but also on the policies chosen by all past generations.
Next, consider a stationary history s = 7 for all s
- t - 1. It follows that, for all s - t - 1, Wis
wi, where
wi = (1 - 7)yi + G= (1 - r)2i + (- - )2 )i •
(1 - T)awi + G
or equivalently
1 wi
= 1 - (1 -
((1 - 7)28i + G + (1 - 7)Ti). 1- a(1 -T)
Similarly, for s t - 1, is = i = (1 - T)8i/(l - a). In period t, on the other hand,
(28) wit = (1 - T7)28i
+ (1 - Tt)-qi + (1 - rt)awi + G
and similarly W^i, = (1 - 7t)8 + a i. It follows that
wit- i,= -(1 - rt)r + (1 - t)ri + (1 - 7)awi - avi + G,
a a_ _ =-(1-r +1 +( I -
)(1 -(1 ) --
(I - r) 5i
+ (1- ) +(17 - )1--a(1
-T)
I- )-T)
and therefore ?1t = Var(wit - it,)
reduces to
978 THE AMERICAN ECONOMIC REVIEW SEPTEMBER 2005
(29) flI= (1 - ) - 1-a(1 -))(1 -r,)(1- 7)2+ (-T)
2
1- c(1- 7r) }2a
1-a(1-T)OI
The private utility of an agent, on the other hand, can be computed as follows. Noting that and y = w and using G, =j 7[(1 - 7,)8 + aw] into (28) gives
(30) wit = (1 - 7,)8i + (1 - Tt)-qi + awi + 7,(1 - 7,)(68- 8i) + ~a(w - wi).
Similarly, Wi = (1 - 7)6~ + (1 - T7)m, + awi + 7(1 - 7)(6 - 6~) + Toa(w
- Wi) and therefore W = (1 - T)8/(1 - a) and
1 w -
wi= -[(1 - 7)2(- i) - (1 - )i 1- a(1 -T)
Substituting the above into (30), we get
a(1 - 7)
wit = (1 -
Tt)6i + (1 -
Tt)Ti- +
OaWi + r,(1 -
7't)(6 - 6i) +
" 1
-- ') [(1 - ')(6 -
6/) - mui].
Combining this with ui, = wit
- ei/2, we conclude that
1 1 it =
- + awi + (1 -
7Tt)Tli - -•
,8 •(1
-
Tt)(8 -
8i) 2 2a(1-
1 - a(1 -T)
Noting that the first two terms do not depend on , and evaluating the above at 6i = 8m and i =
0, we infer that the private utility of the median voter reduces to
1 a(1l - 7) (31) Umt=
2 + (1
--r)+ 1--
(1 --) r)
where we normalized 8m = 1 and let A = 8 - Sm. Combining (29) and (31) gives the definition of
4 and completes the proof of Lemma 2. Finally, to prove Theorem 2, note the following. When y = 0, the best-response function 4
reduces to
a(1 - 7)2 A O(r) = arg min{-umt}
= - 1 + a(1r)J 12A ,ti
which is clearly decreasing in 7. Hence, 4 has a unique fixed point if y = 0. If, instead, y > 0, there are open sets of E for which 4 has multiple fixed points: one robust example is given by a = 0.5, A = 0.15, -y = 0.39, uo = 2, ao = 0.75.

VOL. 95 NO. 4 ALESINA AND ANGELETOS: FAIRNESS AND REDISTRIBUTION 979
REFERENCES
Acemoglu, Daron. "Cross-Country Inequality Trends." Economic Journal, 2003, 113(485), pp. 121-49.
Alesina, Alberto and Angeletos, George-Marios. "Corruption, Inequality and Fairness." Jour- nal of Monetary Economics (forthcoming).
Alesina, Alberto and Glaeser, Edward L. Fight- ing poverty in the US and Europe: A world of difference. Oxford: Oxford University Press, 2004.
Alesina, Alberto; Glaeser, Edward L. and Sacer- dote, Bruce. "Why Doesn't the United States Have a European-Style Welfare State?" Brookings Papers on Economic Activity, 2001, (2), pp. 187-254.
Alesina, Alberto and La Ferrara, Eliana. "Prefer- ences for Redistribution in the Land of Op- portunities." Journal of Public Economics, 2005, 89(5), pp. 897-931.
Amador, Manuel; Angeletos, George-Marios and Werning, Ivan. "Redistribution and Corrective Taxation." Unpublished Paper, 2004.
Ball, Sheryl; Eckel, Catherine; Grossman, Philip J. and Zane, William. "Status in Markets." Quarterly Journal of Economics, 2001, 116(1), pp. 161-88.
Benabou, Roland. "Unequal Societies: Income Distribution and the Social Contract." Amer- ican Economic Review, 2000, 90(1), pp. 96- 129.
Benabou, Roland and Tirole, Jean. "Belief in a Just World and Redistributive Politics." National Bureau of Economic Research, Inc., NBER Working Papers: No. 11208, 2005.
Caselli, Francesco and Gennaioli, Nicola. "Dynas- tic Management." Center for Economic Pol- icy Research, CEPR Discussion Papers: No. 3767, 2003.
Clark, Jeremy. "Fairness in Public Good Provi- sion: An Investigation of Preferences for Equality and Proportionality." Canadian Journal of Economics, 1998, 31(3), pp. 708- 29.
Corneo, Giacomo and Gruner, Hans Peter. "Indi- vidual Preferences for Political Redistribu- tion." Journal of Public Economics, 2002, 83(1), pp. 83-107.
Fehr, Ernst and Schmidt, Klaus. "Theories of Fairness and Reciprocity-Evidence and
Economic Applications," in Mathias Dewat- ripont, Lars P. Hansen, and Stephen J. Turn- ovsky, eds., Advances in economics and econometrics: Theory and applications, Vol. 1. Eighth World Congress of the Econometric Society. Cambridge: Cambridge University Press, 2003, ch. 6.
Fong, Christina. "Social Preferences, Self- Interest, and the Demand for Redistribu- tion." Journal of Public Economics, 2001, 82(2), pp. 225-46.
Hoffman, Elizabeth; McCabe, Kevin A. and Smith, Vernon L. "On Expectations and the Monetary Stakes in Ultimatum Games." In- ternational Journal of Game Theory, 1996, 25(3), pp. 289-301.
Hoffman, Elizabeth and Spitzer, Matthew L. "En- titlements, Rights, and Fairness: An Experi- mental Examination of Subjects' Concepts of Distributive Justice." Journal of Legal Stud- ies, 1985, 14(2), pp. 259-97.
Lerner, Melvin J. The belief in a just world: A fundamental delusion. New York: Plenum Press, 1982.
Lindbeck, Assar; Molander, Per; Persson, Tor- sten; Petterson, Olef; Swendenberg, Brigitta and Thygesen, Niels. Turning Sweden around. Cambridge, MA: MIT Press, 1994.
Lindbeck, Assar; Nyberg, Sten and Weibull, Jorgen W. "Social Norms and Economic Incentives in the Welfare State." Quarterly Journal of Economics, 1999, 114(1), pp. 1-35.
Meltzer, Allan H. and Richard, Scott F. "A Ra- tional Theory of the Size of Government." Journal of Political Economy, 1981, 89(5), pp. 914-27.
Mirrlees, James. "An Exploration in the The- ory of Optimal Income Taxation." Review of Economic Studies, 1971, 38, pp. 175- 208.
Perotti, Roberto. "Growth, Income Distribution, and Democracy: What the Data Say." Jour- nal of Economic Growth, 1996, 1(2), pp. 149-87.
Persson, Torsten and Tabellini, Guido. The eco- nomic effects of constitutions. Cambridge, MA: MIT Press, 2003.
Piketty, Thomas. "Social Mobility and Redis- tributive Politics." Quarterly Journal of Eco- nomics, 1995, 110(3), pp. 551-84.
Prescott, Edward C. "Why Do Americans Work So Much More Than Europeans?" Federal
980 THE AMERICAN ECONOMIC REVIEW SEPTEMBER 2005
Reserve Bank of Minneapolis Quarterly Re- view, 2004, 28(1), pp. 2-13.
Rawls, John. The theory of justice. Harvard: Harvard University Press, 1971.
Romer, Thomas. "Individual Welfare, Majority Voting, and the Properties of a Linear Income
Tax." Journal of Public Economics, 1975, 4(2), pp. 163-85.
Rotemberg, Julio J. "Altruism, Reciprocity and Co- operation in the Workplace." Harvard Univer- sity, Business, Government and International Economy Working Paper: No. 03-021, 2002.