Embed Size (px)
Citation preview

FAKULTAT FUR INFORMATIKDER TECHNISCHEN UNIVERSITAT MUNCHEN
Master’s Thesis in Wirtschaftsinformatik
Reverse Engineering of organization-specificViewpoints: Applying and Extending
Building Blocks for Enterprise ArchitectureManagement Solutions (BEAMS)
Mariana Mykhashchuk


FAKULTAT FUR INFORMATIKDER TECHNISCHEN UNIVERSITAT MUNCHEN
Master’s Thesis in Wirtschaftsinformatik
Reverse Engineering of organization-specificViewpoints: Applying and Extending Building Blocks
for Enterprise Architecture Management Solutions(BEAMS)
Reverse Engineering von organisationsspezifischenViewpoints: Anwendung und Erweiterung der Building
Blocks fur Enterprise Architecture ManagementSolutions (BEAMS)
Author: Mariana MykhashchukSupervisor: Prof. Dr. rer. nat. Florian MatthesAdvisor: M.Sc. Sascha RothDate: September 15, 2011


I assure the single handed composition of this master’s thesis only supported by declaredressources.
Garching, September 12, 2011 Mariana Mykhashchuk


Abstract
Complexity of today’s information technology (IT) together with its ubiquity and con-tinuously growing role in enterprise arouse enormous interest in approaches meant formanaging business and IT as a whole. A commonly accepted means to enhance the align-ment between business and IT by means of providing the holistic view on the organi-zation is enterprise architecture (EA) management, which guides and supports compa-nies in transformations within a rapidly changing environment. Despite the plurality ofavailable publications and research initiatives in this field, the topic of EA managementis still faced with a challenging lack of standardization, as no common understanding ofwhat EA management really is has yet developed. To deal with aforementioned issue,the chair of Software Engineering for Business Information Systems of the Technische Univer-sitat Munchen developed configurable Building Blocks for Enterprise Architecture Manage-ment Solutions (BEAMS) approach, which represents a collection of best-practice solutionsfor recurring EA management problems and provides a practical guidance for organiza-tions to design an organization-specific EA management function. Nevertheless, BEAMSapproach is still relatively young and its thorough evaluation has not been undertaken.In the course of this master’s thesis, an applicability evaluation of the visual constituentof BEAMS approach is performed by decomposing viewpoints, collected from theory andpractice, in modular components, which are further compared with viewpoint buildingblocks available in BEAMS collection. Gaps detected during the applicability evaluationphase are subsequently used as a basis for extending BEAMS viewpoint building blockswith new candidates.
vii

viii

Contents
Abstract vii
Contents x
1. Introduction and overview 11.1. Motivation and scope . . . . . . . . . . . . . . . . . . . . . . . . . . . . . . . . 11.2. Objectives of the thesis . . . . . . . . . . . . . . . . . . . . . . . . . . . . . . . 21.3. Structure of the thesis . . . . . . . . . . . . . . . . . . . . . . . . . . . . . . . . 3
2. Definitions and foundations 52.1. Enterprise architecture management . . . . . . . . . . . . . . . . . . . . . . . 52.2. ISO standard . . . . . . . . . . . . . . . . . . . . . . . . . . . . . . . . . . . . . 72.3. Best practices for visualizations in EA management . . . . . . . . . . . . . . 9
2.3.1. Pattern Catalog - V-Patterns . . . . . . . . . . . . . . . . . . . . . . . . 102.3.2. BEAMS - VBBs . . . . . . . . . . . . . . . . . . . . . . . . . . . . . . . 11
3. Viewpoints overview in EA management related areas 173.1. Classic on data visualization . . . . . . . . . . . . . . . . . . . . . . . . . . . . 173.2. Business intelligence . . . . . . . . . . . . . . . . . . . . . . . . . . . . . . . . 213.3. Data mining . . . . . . . . . . . . . . . . . . . . . . . . . . . . . . . . . . . . . 253.4. Urban planning . . . . . . . . . . . . . . . . . . . . . . . . . . . . . . . . . . . 29
4. Viewpoint Catalog from theory and practice 354.1. Viewpoints from theory . . . . . . . . . . . . . . . . . . . . . . . . . . . . . . 354.2. Viewpoints from practice . . . . . . . . . . . . . . . . . . . . . . . . . . . . . . 354.3. Decomposing viewpoints to reusable building blocks . . . . . . . . . . . . . 36
5. Extending BEAMS with new viewpoint building blocks candidates 415.1. BEAMS VBBs utilization analysis . . . . . . . . . . . . . . . . . . . . . . . . . 415.2. Structural VBBs candidates . . . . . . . . . . . . . . . . . . . . . . . . . . . . 42
5.2.1. VBB Clustering: special cases . . . . . . . . . . . . . . . . . . . . . . . 435.2.2. VBB Dot plot . . . . . . . . . . . . . . . . . . . . . . . . . . . . . . . . 475.2.3. VBB Graph . . . . . . . . . . . . . . . . . . . . . . . . . . . . . . . . . 485.2.4. VBB Grouping . . . . . . . . . . . . . . . . . . . . . . . . . . . . . . . 505.2.5. VBB Interactioning . . . . . . . . . . . . . . . . . . . . . . . . . . . . . 515.2.6. VBB Lifecycle diagram . . . . . . . . . . . . . . . . . . . . . . . . . . . 525.2.7. VBB Line chart . . . . . . . . . . . . . . . . . . . . . . . . . . . . . . . 545.2.8. VBB Matrix . . . . . . . . . . . . . . . . . . . . . . . . . . . . . . . . . 555.2.9. VBB Migration diagram . . . . . . . . . . . . . . . . . . . . . . . . . . 62
ix

Contents
5.2.10. VBB Radar chart . . . . . . . . . . . . . . . . . . . . . . . . . . . . . . 655.2.11. VBB Regionalization . . . . . . . . . . . . . . . . . . . . . . . . . . . . 665.2.12. VBB Scatter plot . . . . . . . . . . . . . . . . . . . . . . . . . . . . . . . 675.2.13. VBB Scheduling . . . . . . . . . . . . . . . . . . . . . . . . . . . . . . . 685.2.14. VBB Set diagram . . . . . . . . . . . . . . . . . . . . . . . . . . . . . . 695.2.15. VBB Time interval map . . . . . . . . . . . . . . . . . . . . . . . . . . 725.2.16. Structural VBBs optimization recommendations . . . . . . . . . . . . 73
5.3. Symbol VBBs candidates . . . . . . . . . . . . . . . . . . . . . . . . . . . . . . 745.3.1. Shape . . . . . . . . . . . . . . . . . . . . . . . . . . . . . . . . . . . . . 755.3.2. Icon . . . . . . . . . . . . . . . . . . . . . . . . . . . . . . . . . . . . . . 785.3.3. Compound chart symbol . . . . . . . . . . . . . . . . . . . . . . . . . 795.3.4. Compound dashboard symbol . . . . . . . . . . . . . . . . . . . . . . 835.3.5. Symbol VBBs optimization recommendations . . . . . . . . . . . . . 94
6. Summary and Outlook 956.1. Summary . . . . . . . . . . . . . . . . . . . . . . . . . . . . . . . . . . . . . . . 956.2. Outlook . . . . . . . . . . . . . . . . . . . . . . . . . . . . . . . . . . . . . . . . 97
Appendix 101
A. Decomposition of viewpoints found in EA management literature 101
B. Decomposition of viewpoints ascertained in the course of case study 129
C. List of abbreviations 145
Bibliography 147
x

List of Figures
2.1. Layers and crosscutting functions diagram. Source: [Se11] . . . . . . . . . . 62.2. Integration of management areas within EA management. Source: [Ma08] . 72.3. Conceptual model of architectural description. Source: [IE00] . . . . . . . . 92.4. UML class diagram describing the structure of the EA management pattern
catalog. Source: [Bu08] . . . . . . . . . . . . . . . . . . . . . . . . . . . . . . . 112.5. Layering principle. Source: [Bu08] . . . . . . . . . . . . . . . . . . . . . . . . 122.6. Components of BEAMS. Source: [Bu10] . . . . . . . . . . . . . . . . . . . . . 132.7. Structural, symbol and decorator BEAMS viewpoint building blocks. Source:
[Se11] . . . . . . . . . . . . . . . . . . . . . . . . . . . . . . . . . . . . . . . . . 14
3.1. Viewpoints from literature on classic data visualization . . . . . . . . . . . . 183.2. Drawing of Charles Joseph Minard from 1869 of Napoleon’s campaign of
1812 in Russia [Tu01] . . . . . . . . . . . . . . . . . . . . . . . . . . . . . . . . 183.3. The first representation of pie chart, used by William Playfair. Source: [Tu01] 193.4. John Snow’s map of location of deaths from cholera in central London for
September 1854. Source: [Tu01] . . . . . . . . . . . . . . . . . . . . . . . . . . 203.5. Map/schedule for Czechoslovakia Air Transport Company in 1933. Ex-
tracted from: [Tu90] . . . . . . . . . . . . . . . . . . . . . . . . . . . . . . . . . 213.6. Viewpoints in the area of business intelligence . . . . . . . . . . . . . . . . . 223.7. Example of treemap (created using Panopticon explorer. URL: http://www.panopticon.com/demo gallery/d risk perform attrib ex demo.htm) 253.8. Viewpoints from data mining block . . . . . . . . . . . . . . . . . . . . . . . . 263.9. Portion of supertable showing voter profiles for the 1976 and 1980 U.S. elec-
tions. Source: [MJ09] . . . . . . . . . . . . . . . . . . . . . . . . . . . . . . . . 273.10. Clustering exemplified on a data set of animals. Source: [MJ09] . . . . . . . 283.11. Viewpoints used in the area of urban planning . . . . . . . . . . . . . . . . . 293.12. An example of isometric bar chart showing a number of apartments in Berlin
by number of occupants. Source: [Be08] . . . . . . . . . . . . . . . . . . . . . 303.13. An example of sankey diagram showing average household income and
spendings per month. Source: [Be08] . . . . . . . . . . . . . . . . . . . . . . . 313.14. An example of thread arcs representing openings and reopenings of Berlin
subway stations since the reunification by line. Source: [Be08] . . . . . . . . 323.15. An example of pearl necklet showing projected extension of the U5 subway
with rail connections. Source: [Be08] . . . . . . . . . . . . . . . . . . . . . . . 333.16. An example of relation circle displaying an overview of superlative struc-
tures in Berlin. Source: [Be08] . . . . . . . . . . . . . . . . . . . . . . . . . . . 33
4.1. Example of a viewpoint from the theoretical block of the Viewpoint Catalog.Source: [Bu08] . . . . . . . . . . . . . . . . . . . . . . . . . . . . . . . . . . . . 37
xi

List of Figures
5.1. Relationship between sets of BEAMS VBBs and VCBBs . . . . . . . . . . . . 435.2. Structural VBBs candidates . . . . . . . . . . . . . . . . . . . . . . . . . . . . 445.3. Example of VBB Clustering: Deformed clustering. Source: [Bu08] . . . . . . 455.4. Information model of VBB Clustering: Deformed clustering . . . . . . . . . 465.5. Example of VBB Clustering: special case 2. Source: [Se05] . . . . . . . . . . . 465.6. Multiple dot plot . . . . . . . . . . . . . . . . . . . . . . . . . . . . . . . . . . 475.7. VBB Graph information model . . . . . . . . . . . . . . . . . . . . . . . . . . 505.8. Lifecycle diagram . . . . . . . . . . . . . . . . . . . . . . . . . . . . . . . . . . 525.9. VBB Lifecycle diagram information model . . . . . . . . . . . . . . . . . . . . 535.10. Line chart of the real-life financial service provider (anonymized) . . . . . . 545.11. VBB Line chart information model for Scenario 1 . . . . . . . . . . . . . . . . 555.12. VBB Line chart information model for Scenario 1 . . . . . . . . . . . . . . . . 565.13. VBB Unary matrix information model . . . . . . . . . . . . . . . . . . . . . . 585.14. VBB Binary matrix information model . . . . . . . . . . . . . . . . . . . . . . 605.15. Ternary matrix - example 1 . . . . . . . . . . . . . . . . . . . . . . . . . . . . . 605.16. Ternary matrix - example 2 . . . . . . . . . . . . . . . . . . . . . . . . . . . . . 615.17. VBB Ternary matrix information model (with intermediate class) . . . . . . 625.18. VBB Ternary matrix information model (directly related classes) . . . . . . . 625.19. Example of VBB Migration diagram [Bu08]) . . . . . . . . . . . . . . . . . . . 635.20. VBB Migration diagram information model . . . . . . . . . . . . . . . . . . . 645.21. VBB Radar chart of the real-life financial service provider (anonymized) -
example 1 . . . . . . . . . . . . . . . . . . . . . . . . . . . . . . . . . . . . . . 645.22. VBB Radar chart - example 2: Source [Ma08] . . . . . . . . . . . . . . . . . . 675.23. VBB Scatter plot information model . . . . . . . . . . . . . . . . . . . . . . . 685.24. VBB Scheduling information model . . . . . . . . . . . . . . . . . . . . . . . 695.25. VBB Set diagram . . . . . . . . . . . . . . . . . . . . . . . . . . . . . . . . . . 705.26. VBB Set diagram information model . . . . . . . . . . . . . . . . . . . . . . . 715.27. Example of time interval map (Source: [Bu08]) . . . . . . . . . . . . . . . . . 715.28. VBB Time interval map information model . . . . . . . . . . . . . . . . . . . 735.29. Reorganized structural BEAMS VBBs . . . . . . . . . . . . . . . . . . . . . . 745.30. VBBs of the group ”Shape” . . . . . . . . . . . . . . . . . . . . . . . . . . . . 755.31. VBB Polygon and its special cases . . . . . . . . . . . . . . . . . . . . . . . . . 765.32. Special cases of VBB Line . . . . . . . . . . . . . . . . . . . . . . . . . . . . . . 775.33. Forms of VBB Arrow identified during the viewpoints decomposition phase 785.34. Most common representatives of VBB Icons detected during the viewpoints
decomposition step . . . . . . . . . . . . . . . . . . . . . . . . . . . . . . . . . 795.35. Symbol VBBs: compound chart symbols candidates . . . . . . . . . . . . . . 795.36. Symbol VBBs: compound dashboard symbols . . . . . . . . . . . . . . . . . 845.37. An example of VBB Bricks . . . . . . . . . . . . . . . . . . . . . . . . . . . . . 86
6.1. BEAMS VBBs collection reorganized and extended with new viewpoint build-ing block candidates . . . . . . . . . . . . . . . . . . . . . . . . . . . . . . . . 96
xii

List of Tables
4.1. Example of a viewpoint used by the real-life financial service provider (anonymized) 384.2. Similarities and distinctions between exemplified viewpoints . . . . . . . . 39
5.1. BEAMS VBBs used for viewpoints decomposition of Viewpoint Catalog the-oretical and practical parts . . . . . . . . . . . . . . . . . . . . . . . . . . . . . 42
5.2. VBB Dot plot information models . . . . . . . . . . . . . . . . . . . . . . . . . 495.3. VBB Dot plot information models . . . . . . . . . . . . . . . . . . . . . . . . . 515.4. Unary matrix of the real-life financial service provider (anonymized) - ex-
ample 1 . . . . . . . . . . . . . . . . . . . . . . . . . . . . . . . . . . . . . . . . 575.5. Unary matrix of the real-life financial service provider (anonymized) - ex-
ample 2 . . . . . . . . . . . . . . . . . . . . . . . . . . . . . . . . . . . . . . . . 575.6. Binary matrix of the real-life financial service provider (anonymized) - ex-
ample 1: Review matrix: M - review is mandatory, OD - review on demand 585.7. Extracted from binary matrix of the real-life financial service provider (anonymized)
- example 2: Labor category matrix . . . . . . . . . . . . . . . . . . . . . . . . 585.8. Extracted from binary matrix of the real-life financial service provider (anonymized)
- example 3: Project costs matrix . . . . . . . . . . . . . . . . . . . . . . . . . 605.9. VBB Battery . . . . . . . . . . . . . . . . . . . . . . . . . . . . . . . . . . . . . 855.10. VBB Comparing circles: three exemplary values . . . . . . . . . . . . . . . . 875.11. Discrete scaled VBB Harvey balls . . . . . . . . . . . . . . . . . . . . . . . . . 885.12. Continuously scaled VBB Harvey balls: exemplarily values . . . . . . . . . . 885.13. VBB Progress bar: three exemplary values . . . . . . . . . . . . . . . . . . . . 895.14. VBB Smiley . . . . . . . . . . . . . . . . . . . . . . . . . . . . . . . . . . . . . 905.15. VBB Speedometer: three exemplary values . . . . . . . . . . . . . . . . . . . 925.16. VBB Traffic light . . . . . . . . . . . . . . . . . . . . . . . . . . . . . . . . . . . 935.17. VBB Trend arrow . . . . . . . . . . . . . . . . . . . . . . . . . . . . . . . . . . 94
A.1. Decomposition of viewpoints found in EA management literature . . . . . . 127
B.1. Decomposition of viewpoints used by a real-life global financial service provider143
xiii


1. Introduction and overview
The growth and rapid development of information technology (IT) in recent years entailedconsiderable changes in the role of IT in business. Being once considered solely as a costcenter, IT is currently regarded rather as a value creator and, even more, undertakes therole of business enabler [Kr05].
1.1. Motivation and scope
Intensive use of information technology in business since the mid of 90s, together withsimultaneous restructuring of the companies, gave rise to a new phenomenon of indus-trial society: the fully networked companies, i.e. organizations in which all essential busi-ness processes, all business functional areas, and relations to the corporate environment,in particular to customers and suppliers, are supported by IT [LLS10]. Being used alongthe whole value chain for both primary activities (e.g. purchasing, production, inboundand outbound logistics, operations scheduling, marketing, distribution and customer ser-vice) and support activities (e.g. administration, human resource management, account-ing, technical infrastructure), and playing important role in linkages among them, infor-mation technology has become completely pervasive in the value chain and is having pro-found impact on competitive advantages of an enterprise [LLS10, Lu04]. Moreover, somebusiness concepts are completely based on the usage of information technology and areabsolutely unimaginable without IT [La08], e.g. e-business, e-commerce.On the other hand, increasing support role of IT for enterprise workflow activities, to-gether with ever-changing environment, triggered by globalized markets, specialized cus-tomer demands, shorter time to markets, emerging legal regulations, etc. [My11], whichorganizations permanently have to react and to adapt to, led to an explosive growth ofcorporate IT application landscapes, the parts of which were often locally developed toimprove business-IT alignment. This resulted in huge and complex, historically grown,heterogeneous IT application landscapes, as they are found today in many organizations[Se05, De06]. Furthermore, application systems can not be considered on a stand-alonebasis, but rather within a complex interaction and interdependencies of interwoven com-ponents, e.g. technologies they are developed on, organizational units they are operatedby, interfaces through which they are connected to each other, hardware they are installedon, projects they are modified by, business objectives they should be aligned with, busi-ness processes they are supporting, etc. [La08, Wi07]Complexity of today’s information technology, together with its ubiquity and continu-ously growing role in enterprise, arouse enormous interest in approaches meant for man-aging business and IT as a whole. A commonly accepted means to enhance the alignmentbetween business and IT in ever-changing environment by means of providing the holistic
1

1. Introduction and overview
view on the organization is enterprise architecture (EA) management [Bu10]. EA manage-ment enables the managed evolution of the enterprise and supports it in the transforma-tion process by providing architectural descriptions of current, planned, and future statesof enterprise. In doing so, EA management is strongly supported by an integral part ofEA management function and its important instrument - visualizations, or so called view-points - to be able to get the picture of complex interrelationships between the componentsin organizations (e.g. business processes, infrastructure components, projects, IT architec-tures, strategies, etc.) and document them, analyze data and information in order to bettermanage what is going on, plan and predict what will likely happen under particular con-ditions in the future [Fe09], describe current, planned and future states of enterprise, aswell as ensure communication and collaboration between different stakeholders by EAmanagement function realization.Due to aforementioned significance of EA management topic, a plurality of approachesfor establishing EA management function in organizations have been developed in recentyears by researchers, practitioners, standardization bodies, and tool vendors. However,despite a wide variety of available publications in this field, no commonly accepted un-derstanding of what EA management really is has yet developed, followed by the lack ofterminological clearness, which can be explained by the fact that organizational structures,contexts, cultures and requirements are very specific for each enterprise, and thus requireorganization-specific EA management function fulfillment [Bu10, My11]. Furthermore,many approaches in this field introduce EA management from scratch without consider-ing actual maturity level of the organization, or are too abstract and too extensive to beimplemented in the real world [Bu08].In order to address the aforementioned issues, the chair for Software Engineering for BusinessInformation Systems at the Institute for Informatics of the Technische Universitat Munchendeveloped a configurable, building blocks based approach, which represents a collectionof practice-proven, redundancy-free and composeable building blocks for designing EAmanagement problem-specific solutions. Having its groundings in prominent approachesfrom academic research and standardization bodies, proved to be successful in practice,BEAMS provides a comprehensive technique to support the enterprises seeking to estab-lish organization-specific function. Being, however, relatively young approach, BEAMSrequires a thorough evaluation and evolvement [Bu10].
1.2. Objectives of the thesis
This master’s thesis addresses the visual constituent of EA management function imple-mentation, intended to support a specific audience interested in specific concerns, andfocuses on the evolvement of BEAMS viewpoint building blocks knowledge base.The first objective of the thesis lies in Viewpoint Catalog construction performed by col-lecting and structuring viewpoints commonly used in literature and practice. A furtherpurpose consists in evaluating BEAMS VBBs against the Viewpoint Catalog by decompos-ing its viewpoints into modular components and comparing them with viewpoint buildingblocks of BEAMS. And, finally, the main purpose of this thesis is to identify and documentso called new viewpoint building block candidates, i.e. building blocks detected during
2

1.3. Structure of the thesis
Viewpoint Catalog decomposition phase which are not yet a part of BEAMS collection, aswell as make improvement suggestion for reorganization of existing VBBs.
1.3. Structure of the thesis
The subsequent Chapter 2 makes an introduction to the topic EA management and EAmanagement related terminology, and discusses best-practice approaches for organization-specific EA management function design, namely the EA management pattern based andbuilding block based approaches, with particular focus on the viewpoint perspective.Chapter 3 reviews viewpoints, used in literature on EA management related areas, disclos-ing authors motivation in considering visualization techniques and providing viewpoints,identified in the corresponding research area, together with their descriptions.Chapter 4 is concerned with Viewpoint Catalog construction revealing results of explo-rative analysis of specialized literature on EA management as well as outcomes of a casestudy by a real-life financial service provider, describes the viewpoint decomposition pro-cess and considers Viewpoint Catalog decomposition into modular building blocks on con-crete examples.Applicability evaluation of BEAMS VBBs is performed in Chapter 5. This chapter is alsofocused on the extension of existing VBBs with the new structural and symbol viewpointbuilding block candidates, deduced from performed viewpoint decomposition in Chap-ter 4. Additionally, some reorganization improvements for structural and symbol BEAMSVBBs are suggested in this chapter.Finally, Chapter 6 summarizes the previous chapters, integrates the results of the thesis,and gives an outlook on further research.
3

1. Introduction and overview
4

2. Definitions and foundations
In order to address aforementioned lack of terminological clearness in the field of EA man-agement and prepare the ground for further research, this chapter provides theoreticalfoundations and definitions of central concepts of this work. Initially, EA managementconcept is described in detail, afterwards the description of terminology used in this thesisis provided, and finally best-practice approaches for designing EA management functionin organizations are discussed.
2.1. Enterprise architecture management
Since a plurality of definitions and approaches in the area of EA management exists, thegoal of this section lies in providing definitions and explaining EA management relatedconcepts used throughout the remainder of this master’s thesis.To explain the central constituent of the term EA management, architecture, definition ofinternational standard ISO/IEC 42010 [IE00] is referred to, which specifies architecture as”the fundamental organization of a system embodied in its components, their relation-ships to each other, and to the environment, and the principles guiding its design andevolution”. Based on this general definition of architecture, [Wi07] defines enterprise archi-tecture as coherent and holistic architecture of a certain enterprise, which comprises bothbusiness and IT elements in such a way that not only individual elements of a companyare considered, e.g. organizational structure, business processes, application systems andinfrastructure components, but also their connections and crosscutting elements such asstrategies and goals, demands and projects, principles and patterns as well as key perfor-mance indicators and metrics. Thus, the EA allows to recognize the interplay between thedifferent elements of enterprise and identify the interactions and interrelations betweenthem, which are not recognizable within the scope of individual management processes ofthis elements.Being committed to representation of all relevant elements with all interrelationships be-tween them, EA information models achieve in some cases considerable complexity ofmore than 300 classes [Wi07] and are very specific for each organization. Neverthelesscertain patterns, similar for different information models, can be found. Figure 2.1 pro-vides a conceptual framework for the EA and gives an overview of the general aspects,same for each EA information model, called layers and cross functions. Architectural lay-ers, namely Business&Organization, Application&Information and Infrastructure&Data, rep-resent the overall EA structure of a company, describing logic concepts abstracting fromtheir technical realization (e.g. products, business processes, organizational units, etc.), ITapplication systems supporting the organization’s business execution, and the technicalcomponents, e.g. middleware and hardware systems, storage capacity, etc., used by busi-ness applications, respectively. Architecture layers are complemented by abstraction lay-
5

2. Definitions and foundations
ers named Business capabilities, Business services and Infrastructure services, which describeEA concepts with a focus on provided functionalities of the corresponding architecturallayer, instead of concretizing technical details of its realization. The crosscutting functionsVisions&Goals, Strategies&Projects, Principles&Standards and Questions&KPIs may affect theelements of any layer. Thus, Visions&Goals addresses long range vision of an enterpriseand its operational goals, deduced from enterprise vision and generating calls for action.These calls for action are implemented in a form of demands and projects within the cross-cutting function Strategies&Projects. Thereby, success has to be measured (Questions&KPIs)and standards have to be followed (Principles&Standards). Individual components of lay-ers and crosscutting functions diagram are described in [Se11].To present and communicate data, stored according to information model, support ofvisualizations is needed. By means of visual representations complex interrelationshipsbetween elements of one or several layers and crosscutting functions, interactions of theelements, the values of their key measures, and their behavior in time can be reflected.For example, software maps, which are the graphical models of application landscapes,i.e. constellation of business applications of a certain enterprise, including communicationrelationships between them as well as their characteristics [Wi07], are very useful for de-tailed visualizing of the interplay between the elements of different layers and crosscuttingfunctions. If, however, large information volumes have to be presented in compact form,dashboards visualizations may be used.
Figure 2.1.: Layers and crosscutting functions diagram. Source: [Se11]
Finally, the concept of EA management is used in this thesis in the meaning defined in[Ma08] as ”a continuous and iterative process controlling and improving the existing andplanned IT support for an organization”, which not only considers enterprise IT, but also
6

2.2. ISO standard
business processes, business goals, strategies, etc. to create a holistic view on the enter-prise. Thus, the task of EA management consists in documenting, managing and con-trolling the interplay between different interrelated elements of a certain enterprise on anarchitectural level. One of the main goals of EA management lies in continuous align-ment of business and IT, achieved by identifying opportunities and problems arising frompresent state of the EA.EA management process does not take place on a stand-alone basis and should be neces-sarily linked to related management processes. Figure 2.2 depicts the integration of dif-ferent management processes, related to EA management, into one continuous process.Involved management processes are described in detail in [Ma08].Certain correlations between individual management processes, shown in Figure 2.2, andcross functions of Layers and crosscutting functions diagram, depicted in Figure 2.1, can benoticed. Demand management process starts with identification of calls for actions, whichare generated according to company’s vision and goals of crosscutting function of the samename, and in coordination with Strategies & goals management process it prepares the corre-sponding demand initiatives and project proposals, discussed by Strategies&Projects cross-cutting function. This crosscutting function is also correlates with Project portfolio man-agement process, which proceeds with the execution of approved project portfolio, andSyncronization management process coordinating and synchronizing executed projects ac-cording to their interdependencies and interrelations. IT architecture management process,concerned with standardization of application landscapes development, resembles Princi-ples&Standards cross function.
Figure 2.2.: Integration of management areas within EA management. Source: [Ma08]
2.2. ISO standard
In order to facilitate EA management function performance, a common terminology andunderstanding are necessary to provide the communication basis for the various stake-holders involved in EA management process. Although there is still a lack of standard-
7
2. Definitions and foundations
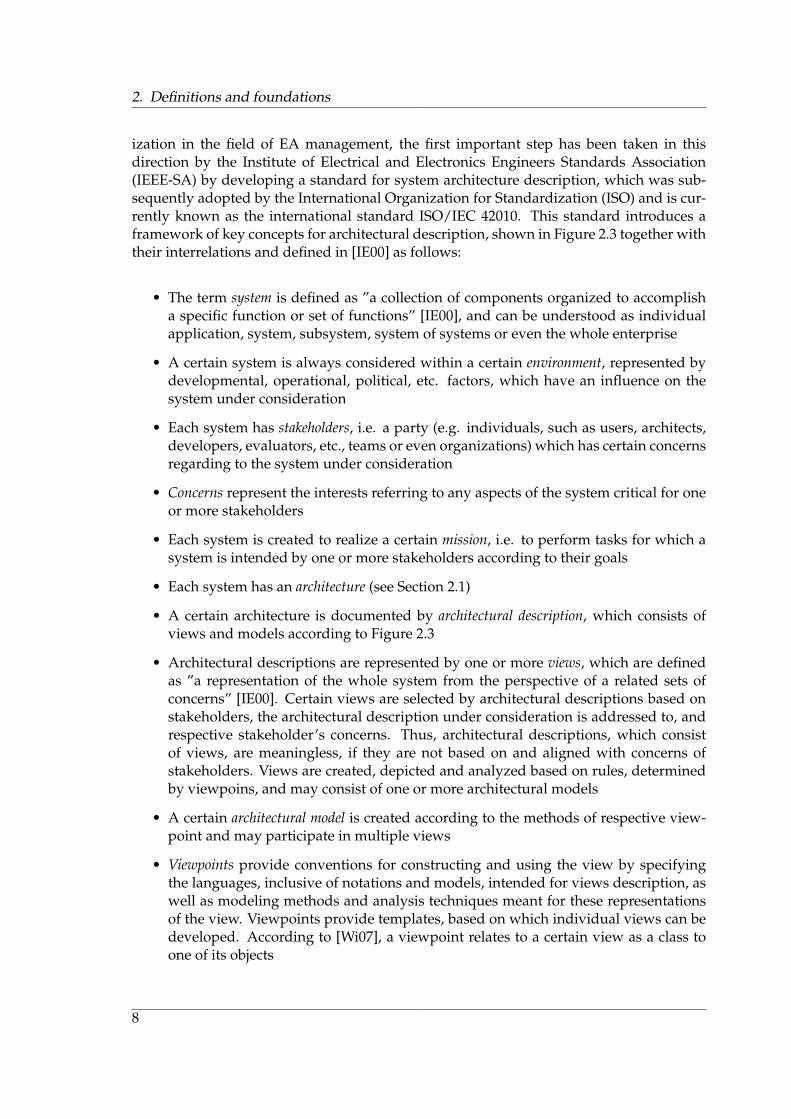
ization in the field of EA management, the first important step has been taken in thisdirection by the Institute of Electrical and Electronics Engineers Standards Association(IEEE-SA) by developing a standard for system architecture description, which was sub-sequently adopted by the International Organization for Standardization (ISO) and is cur-rently known as the international standard ISO/IEC 42010. This standard introduces aframework of key concepts for architectural description, shown in Figure 2.3 together withtheir interrelations and defined in [IE00] as follows:
• The term system is defined as ”a collection of components organized to accomplisha specific function or set of functions” [IE00], and can be understood as individualapplication, system, subsystem, system of systems or even the whole enterprise
• A certain system is always considered within a certain environment, represented bydevelopmental, operational, political, etc. factors, which have an influence on thesystem under consideration
• Each system has stakeholders, i.e. a party (e.g. individuals, such as users, architects,developers, evaluators, etc., teams or even organizations) which has certain concernsregarding to the system under consideration
• Concerns represent the interests referring to any aspects of the system critical for oneor more stakeholders
• Each system is created to realize a certain mission, i.e. to perform tasks for which asystem is intended by one or more stakeholders according to their goals
• Each system has an architecture (see Section 2.1)
• A certain architecture is documented by architectural description, which consists ofviews and models according to Figure 2.3
• Architectural descriptions are represented by one or more views, which are definedas ”a representation of the whole system from the perspective of a related sets ofconcerns” [IE00]. Certain views are selected by architectural descriptions based onstakeholders, the architectural description under consideration is addressed to, andrespective stakeholder’s concerns. Thus, architectural descriptions, which consistof views, are meaningless, if they are not based on and aligned with concerns ofstakeholders. Views are created, depicted and analyzed based on rules, determinedby viewpoins, and may consist of one or more architectural models
• A certain architectural model is created according to the methods of respective view-point and may participate in multiple views
• Viewpoints provide conventions for constructing and using the view by specifyingthe languages, inclusive of notations and models, intended for views description, aswell as modeling methods and analysis techniques meant for these representationsof the view. Viewpoints provide templates, based on which individual views can bedeveloped. According to [Wi07], a viewpoint relates to a certain view as a class toone of its objects
8

2.3. Best practices for visualizations in EA management
• Viewpoints originating from outside of architectural description are referred as li-brary viewpoints. Library viewpoints may originate from the literature or be prede-fined as standards within an enterprise [Wi07]
• Technical rationale describes the reasons for selection of a certain architecture [Wi07]
Figure 2.3.: Conceptual model of architectural description. Source: [IE00]
The concepts of viewpoint, architecture model, stakeholder, concern and architecture, usedin this thesis, are understood according to the term definition specified in ISO/IEC 42010,as described above.
2.3. Best practices for visualizations in EA management
ISO/IEC 42010, considered in detail in previous section, brings together the concepts ofview, concern and stakeholder by stating that only visual representations of a system thataddress certain concerns of certain stakeholders have the right to exist. Another important
9

2. Definitions and foundations
contribution of this standard consists in defining the concept of viewpoint, which deter-mines the languages, architectural models and modeling methods to be used to describethe view. This ideas are followed by EAMPC and BEAMS best-practice approaches in thefield of EA management considered in subsequent subsections.
2.3.1. Pattern Catalog - V-Patterns
Research in the field of EA management has a distinguishing tendency to develop newmodels and approaches instead of improving the existing ones. According to [Bu07], thereare scarcely any prominent findings in the area that are further verified and developedby another researchers. Also practitioners prefer to use self-defined guidelines, neglectingresults made available by academic research. That may be one of the reasons why despiteof a plurality of existing research in this field still no common understanding of EA man-agement was developed.In order to complement existing EA management frameworks, which usually introduceEA management from scratch without considering actual maturity level of the organiza-tion, or are too abstract and too extensive to be implemented in the real world [Bu08],the chair for Software Engineering for Business Information Systems at the Institute for Infor-matics of the Technische Universitat Munchen in the course of the Enterprise ArchitectureManagement Pattern Catalog (EAMPC) research project has developed the EA manage-ment pattern approach. Enterprise Architecture Management Pattern Catalog is an exten-sible collection of best-practice EA management patterns originated from academia andpractice, which describe re-usable solutions for recurring problems and can be adaptedto a specific enterprise context [Ma08]. Pattern catalog demonstrates the importance ofviewpoints, highlighting their ability to provide conspicuous and often intuitive basis forcommunication, and links them with underlying information models storing the data vi-sualized in one or more viewpoints, concerns, i.e. pain points of the company expressedin the goals of certain stakeholders used as a starting point for patterns selection, andmanagement methodologies, meant for describing the steps to be taken to address therespective concerns. Thereby, viewpoints, information models and concern-specific man-agement methodologies are presented in pattern catalog as three kinds of patterns, closelyinterlinked with one another as shown in Figure 2.4, and defined as follows:
• Methodology patterns (M-patterns) offer solutions for solving the pain-points of a com-pany, defining concrete activities to be performed and providing statements aboutthe intended usage context
• Viewpoint patterns (V-patterns) describe conventions for data representation, provid-ing the languages used by M-patterns
• Information model patterns (I-patterns) supply the underlying information models fordata required to generate a particular viewpoint
Each pattern is structured according to a particular template, which is splitted in threesections: overview section, solution section and consequence section. Overview sectionincludes such information as unique alphanumerical pattern identifier, a short and expres-sive pattern name, a short summary of the pattern, a number of its version, and optionally
10

2.3. Best practices for visualizations in EA management
Figure 2.4.: UML class diagram describing the structure of the EA management patterncatalog. Source: [Bu08]
alternative names for this pattern, whereas solution section provides a detailed descriptionof the pattern. Consequence section is optional and shows consequences from the usageof the corresponding EA management pattern.Pattern catalog may be used in the following way. In the first step, concerns of the com-pany have to be identified. This activity is supported by identically named chapter ofpattern catalog, which provides the list of all 43 documented concerns, grouped by the EAmanagement topics for easier access. Each concern has references on all related methodol-ogy patterns, which in their turn reference respective viewpoints and information models.Of particular interest for this thesis are viewpoint patterns. Altogether, 53 V-patterns areincluded in pattern catalog, which role is to support certain stakeholders by solving oneor more of their concerns. In this sense, viewpoint patterns follow the terminology ofISO/IEC 42010. On the other hand, viewpoints borrowed the idea of layering from systemcartography. According to [Wi07], layering principle allows to bring together certain char-acteristics of elements or relationships between them in different groups, and then assigna particular layer to each group (see Figure 2.5). Software maps use as a basis so calledbase maps, which determine the type of the map (e.g. cluster map, cartesian map, etc.)and on which further layers can be placed. Arranging of multiple layers on a certain basemap enables a compact representation of different characteristics with high recognitionvalue. Thus, each viewpoint pattern contains not only references on underlying informa-tion models and supported methodologies, but it also cites another viewpoint patterns intwo possible ways:
• for V-patterns, which represent a certain base map, such viewpoints patterns are ref-erenced, which also use the same type of base map
• if a certain V-pattern represents a certain layer, then it can not be used independently,without any base map. That is why such viewpoint patterns reference another view-point patterns (namely, base maps), where they can be alternatively used on
2.3.2. BEAMS - VBBs
Although Enterprise Architecture Management Pattern Catalog provides concern-basedmeans for appropriate patterns selection, it lacks the integration mechanisms and artifacts,which would enable patterns integration into EA management function, defined by [Se11]as ”a continuous management function seeking to improve the alignment of business and
11

2. Definitions and foundations
Figure 2.5.: Layering principle. Source: [Bu08]
IT and to guide the managed evolution of an organization”. According to [Bu10] a designmethod for EA management function additionally would have to provide a guidance for:
• patterns selection, especially in case of applicability of alternative patterns
• methodology patterns integration into EA management process, preventing redun-dancies
• integration of V- and I-patterns into EA modeling language
In order to address this issue and to refine the EA management pattern approach a build-ing block based approach was developed by the sebis chair. Building Blocks for Enter-prise Architecture Management Solutions (BEAMS) provide a configurable approach todesigning problem-specific EA management function by presenting method and languagebuilding blocks that can be selected and configured based on the peculiarities of the orga-nization [Bu10]. Patterns from the EA management pattern approach are reorganized byBEAMS into practice-proven, redundancy free and composeable building blocks for EAmanagement solutions, providing in this way a comprehensive EA modeling language.Similarly to patterns, building blocks of BEAMS are neither invented, nor developed, butobserved in practice, and included into BEAMS collection according the rule of three, i.e.before a certain building block becomes a part of BEAMS at least three uses of it in EAmanagement practice must have been detected [BMS10]. Being observed for the first time,a certain building block is registered as building block candidate and is further observed.BEAMS approach is based on the idea of interrelating competing solutions, or so-calledcompeting theories, used to design an organization-specific EA management function. Fig-ure 2.6 demonstrates the components of BEAMS, which are described in [Bu10, Se11] asfollows:
• Competing theories: are the knowledge base of BEAMS represented by solutions valu-able in practice, e.g. best practices, case studies, patterns, etc.
• Problem: is an issue to be solved, which in the area of EA management is usuallyexpressed by certain goals to be achieved (e.g. reduce operation costs or ensure com-pliance, etc.) and certain concerns to be addressed (e.g. service usage or hierarchy ofbusiness processes, etc.)
12

2.3. Best practices for visualizations in EA management
Figure 2.6.: Components of BEAMS. Source: [Bu10]
• Organizational context: is an environment, in which the EA management functionoperates (e.g. organizational culture, background of EA management initiative, etc.)
• Building blocks: are solution models, represented by method building blocks (MBBs)and language building blocks (LBBs), from combination of which an organization-specific EA management function is constructed
• Method building blocks: define actions to be performed to solve a certain problemwithin a certain organizational context. MBBs are splitted in four groups accordingto EA management function activities: develop&describe (i.e. MBBs for describing,developing and maintaining descriptions of current, planned, target states of theEA, and architectural principles), communicate&enact (i.e. MBBs for communicatingEA artifacts and enacting EA plans), analyze&evaluate (i.e. MBBs for different kindsof analysis of EA states, e.g. whether a certain planned state helps to achieve thetarget state) and configure&adapt (i.e. MBB for assessment and improvement of EAmanagement function itself)
• Language building blocks: provide MBBs with necessary information and supportingviewpoints, and are represented by information model building blocks (IBBs) andviewpoint building blocks (VBB)
13

2. Definitions and foundations
The central concept of this thesis is the one of viewpoint building block (VBB), defined ona higher abstraction level than concern-specific viewpoint. While viewpoint is understoodby [Se11] in line with viewpoints definition of ISO/IEC 42010 (see Section 2.2), and thusconsidered in the context of specific concerns of certain stakeholders, which ”define theEA model elements that the viewpoint uses in constructing a corresponding view”, VBBsare considered from concern-independent perspective. According to [Se11], ”viewpointbuilding block does not build on any specific concern but may be applied to many dif-ferent concerns in order to develop corresponding viewpoints”. By use of BEAMS, anyspecific viewpoint may be produced by combination of viewpoint building blocks of dif-ferent types. Three types of VBBs are considered in [Se11]:
• Structural VBBs describe the basic organization of a certain view
• Symbol VBBs provide symbols, which should be exploited in a certain view
• Decorator VBBs facilitate the encoding of additional information on a certain view
In terms of the layering principle discussed in Subsection 2.3.1 structural VBBs take on therole of base map, whereas symbol VBBs represent elements, which may be employed ondifferent layers. Each viewpoint have to be necessarily composed from at least one struc-tural VBB and at least one symbol VBB, and may optionally include one or more decoratorVBBs.Currently 8 structural, 4 symbol and 3 decorator VBBs are representing the collection of
Figure 2.7.: Structural, symbol and decorator BEAMS viewpoint building blocks. Source:[Se11]
BEAMS viewpoint building blocks (see Figure 2.7). All viewpoint building blocks are de-scribed uniformly in accordance with a predefined template. Each section of this templatehas its name except the only one, which follows the ”Tags” section and is marked in bold.To be able to address this section in remainder of this thesis, pseudonym ”Usage” is as-signed to this section. Some sections of this template are appropriate for certain typesof VBBs and are not applicable to another. Nevertheless, such fields as ”Name”, ”Tags”,”Usage”, ”Explanation”, ”Examples” and ”Type” are specified for every VBB type.
• Name: represents a short and expressive name of viewpoint building block
14

2.3. Best practices for visualizations in EA management
• Tags: contains all tags, i.e. keywords, relevant to this VBB, which help to describe itbriefly and reference all related topics and issues
• Usage: gives a short, but meaningful summary about VBBs usage. Additionally, itspecifies types of relationships or scale types of attributes appropriate for represen-tation by this VBB
• Explanation: provides more concrete description of the corresponding building block,e.g. concretization of the type of relationship between the instances represented bythis VBB, or description of different usage scenarios of a certain VBB
• Examples: illustrate possible applications of the corresponding VBB with concreteexamples
• Building block: represents the corresponding viewpoint building block using trans-formation framework notation developed in [Ac10]
• Abstract viewmodel: displays an information model in UML notation, which suppliesunderlying models of data structure represented by a certain VBB. Abstract modelsare only provided for structural VBBs
• Type: depicts to which type belongs a certain VBB, e.g. structural VBB, symbol VBBor decorator VBB
• M2 concept: specifies VBB in terms of MOF meta model layer (M2) as an attribute ora relationship VBB. This field is only defined for structural and decorator VBBs
• Visual variables: represent which visual components of a certain VBB can be adjustedto graphically encode additional information, e.g. length, height, radius, bordercolor, fill color, etc. Visual variables are only specified for symbol VBBs
15

2. Definitions and foundations
16

3. Viewpoints overview in EA managementrelated areas
This chapter reviews viewpoints used in literature on EA management related areas. Toget an idea of visual representations commonly used in different areas, only the sourcesthat have a focus on the subject of visualizations were researched for each application areain the course of literature review. Initially, general literature on visualizations was consid-ered, then sources on information visualization in the field of business intelligence, whichgoes into practice areas of EA management, and data mining, that provides technical so-lutions for EA management related scope, were reviewed. Furthermore, viewpoints in thefield of urban planning, which with its view on the city as on a ”dynamic, multi-layered,interconnected structure” [Be08] is often used as a metaphor for EA management, are re-garded within this section. For each application area works of one author were analyzed.Subsequent sections consider thematic blocks of reviewed literature in detail, providingviewpoints identified in the corresponding block as well as motivation of authors in usingthem. In the course of analysis performed in this chapter, two interesting outcomes wereascertained:
• a number of viewpoints is used in all regarded application areas, e.g. bar chart,scatter plot, etc.
• same viewpoints are defined and sometimes called differently in different applica-tion domains, e.g. time series of [Tu01], line graph of [Fe09], frequency polygon of[MJ09], and line chart of [Be08]
3.1. Classic on data visualization
Information visualizations are treated generally in books of Edward Tufte [Tu01, Tu90],which have already become a classic in the area of data graphics. The main focus of thesebooks lies on formulating principles for designing and sequential improvement of datagraphics in order to explain design excellence, i.e. why some displays are better thanothers, and creating non-distorted visualizations. Tufte is also concerned with enhancingdimensionality and density of graphical representations to be able to use the enormous in-formation accumulation power of visualizations at full capacity. According to Tufte, threebasic structures for showing data exist, namely the sentence, the table, and the graphic,which may be used in combination with one another. In Tufte’s opinion, graphics is notonly an instrument for information representation, but also a mechanism for reasoningabout quantitative information.In order to demonstrate design excellence on examples, in his books Tufte reviews numer-ous graphical representations from graphical practice of last two centuries, some of which
17

3. Viewpoints overview in EA management related areas
Figure 3.1.: Viewpoints from literature on classic data visualization
are unique in their art, e.g. Charles Joseph Minards drawing of disastrous Napoleon’s cam-paign in Russia (see Figure 3.2), that brilliantly represents the loss of Napoleon’s troops intime and within geographical context. On the other hand, a number of statistical graphi-cal representations, abstracting from geographical analogy, are introduced and discussedin books of Edward Tufte. Schematical representations of viewpoints, reviewed by Tufte,are shown in Figure 3.1. Moreover, design manipulation techniques, which lead to datadistortion, are exemplified by Tufte for different viewpoints.Thus, bar chart, schematically shown in Figure 3.1 (case 1), invented by William Playfair,
Figure 3.2.: Drawing of Charles Joseph Minard from 1869 of Napoleon’s campaign of 1812in Russia [Tu01]
18

3.1. Classic on data visualization
a Scottish political economist, in order to compare different branches of trade by a certaincharacteristic and already used in 1781 (e.g. import volumes to Scotland from differentcountries), may be misused causing data deception by manipulating a baseline, and thusmaking an impression of attribute values being greater/less than they really are.Another invention of W. Playfair, pie chart, appeared for the first time in his book ”TheStatistical Breviary” in 1801. An extract from the first representation of pie chart is shownin Figure 3.3 and visualizes proportions of the Turkish Empire located in Asia, Europe andAfrica. Nevertheless, Tufte recommends not to use pie charts at all saying, ”the only worsedesign than a pie chart is several of them”, because of their low data-density, inability toorder numbers along a visual dimension as well as difficulties by comparing the data fromdifferent pie charts.Scatter plot, made for the first time by Johann Heinrich Lambert, a Swiss-German scientistand mathematician, in 1765 and shown schematically in Figure 3.1 (case 3), is intendedto collate two quantitative variables and ascertain causal relationship between them. Thefirst representation visualized evaporation rate of water as a function of temperature.Time series, schematically depicted in Figure 3.1 (case 4) and not used until the late 1700s inscientific writings, are meant for representing behaviour of a certain quantitative variablein time. According to Tufte, the time-series plot is the most frequently used form of graphicdesign. The oldest known example of time-series usage originates from around tenth oreleventh century and represents inclinations of planetary orbits as a function of time.Another viewpoint discussed by Tufte is box plot, initially introduced by Mary Eleanor
Figure 3.3.: The first representation of pie chart, used by William Playfair. Source: [Tu01]
Spear as a range bar in ”Charting statistics” in 1952, and subsequently coined in its presentmeaning by John W. Tukey, a Princeton statistician, in 1977 as ”box-and-whisker-plot” (seecase 5 in Figure 3.1). Box plot is a convenient way to depict a group of data by displayingessential five-number summary, which can be easily compared for different groups: mini-mal value, lower quartile, median, upper quartile and maximal value.One more invention of J.W. Tukey, so called stem-and-leaf plot, provides quick means toexamine a distribution of values of a certain group of data and ”combines summary anddetail information in a single display” [Fe09]. Stem-and-leaf digram consists of two parts(see case 6 in Figure 3.1): stem, which is positioned on the left side from a vertical dividing
19
3. Viewpoints overview in EA management related areas
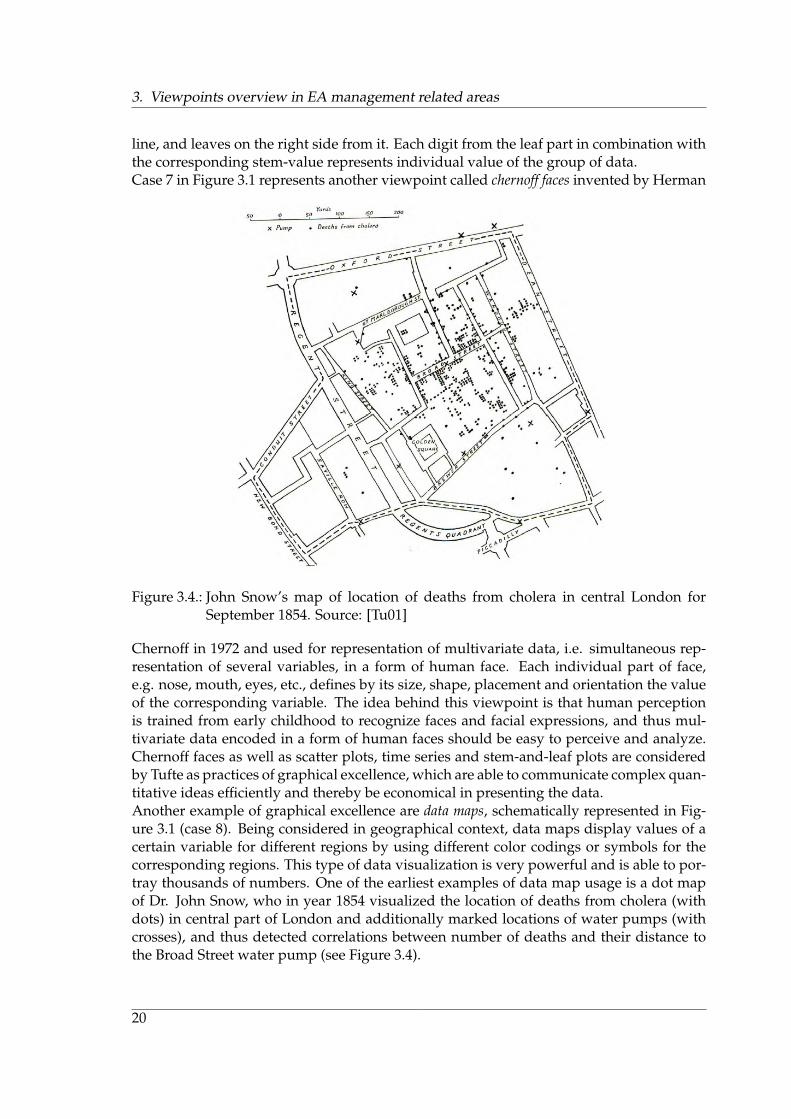
line, and leaves on the right side from it. Each digit from the leaf part in combination withthe corresponding stem-value represents individual value of the group of data.Case 7 in Figure 3.1 represents another viewpoint called chernoff faces invented by Herman
Figure 3.4.: John Snow’s map of location of deaths from cholera in central London forSeptember 1854. Source: [Tu01]
Chernoff in 1972 and used for representation of multivariate data, i.e. simultaneous rep-resentation of several variables, in a form of human face. Each individual part of face,e.g. nose, mouth, eyes, etc., defines by its size, shape, placement and orientation the valueof the corresponding variable. The idea behind this viewpoint is that human perceptionis trained from early childhood to recognize faces and facial expressions, and thus mul-tivariate data encoded in a form of human faces should be easy to perceive and analyze.Chernoff faces as well as scatter plots, time series and stem-and-leaf plots are consideredby Tufte as practices of graphical excellence, which are able to communicate complex quan-titative ideas efficiently and thereby be economical in presenting the data.Another example of graphical excellence are data maps, schematically represented in Fig-ure 3.1 (case 8). Being considered in geographical context, data maps display values of acertain variable for different regions by using different color codings or symbols for thecorresponding regions. This type of data visualization is very powerful and is able to por-tray thousands of numbers. One of the earliest examples of data map usage is a dot mapof Dr. John Snow, who in year 1854 visualized the location of deaths from cholera (withdots) in central part of London and additionally marked locations of water pumps (withcrosses), and thus detected correlations between number of deaths and their distance tothe Broad Street water pump (see Figure 3.4).
20

3.2. Business intelligence
Tufte also considers visual representation called narratives of space and time, which is schemat-ically depicted in Figure 3.1 (case 9). One of such graphs, considered in [Tu90], representsa comprehensive map/schedule for Czechoslovakia Air Transport Company from year1933, and combines a complex spatial network of routes, including information about dis-tances between cities, together with arrival and departure times and identification num-bers of planes (see Figure 3.5).Although Tufte does not consider tables as graphical representations, he admits that theyare preferable to graphics in case small data sets to be visualized or exact numerical valuesto be represented. Tables are also useful if numerous localized comparisons have to beperformed on visualization. Furthermore, Tufte introduces so called supertables, which aredivided into topical paragraphs by horizontal rules and arranged in a way that ”attractsand intrigues readers through its organized, sequential detail and reference-like quality”[Tu01].
Figure 3.5.: Map/schedule for Czechoslovakia Air Transport Company in 1933. Extractedfrom: [Tu90]
3.2. Business intelligence
In the books of Stephen Few [Fe04, Fe09] relevance of visual representations of quantitativeinformation is shown for business intelligence application domain. The author affirms thattrue business intelligence, which is supposed to provide methods and technologies to sup-port data analysis and reporting, is impossible without a human component able to makesense of data. In his opinion, it is immensely important to understand by means of datawhat is really going on in a certain organization to be able to better manage company’scurrent state, as well as make better predictions, so that opportunities can be created andproblems can be avoided. The greatest concern of Few is the lack of training in visualanalysis, therefore, in his monographs he teaches the fundamental skills needed to presentquantitative information visually to others, on the one hand, and understand the message
21

3. Viewpoints overview in EA management related areas
Figure 3.6.: Viewpoints in the area of business intelligence
contained in the data, on the other hand. The author does not see information visualiza-tion as a goal, but rather as a means to gain an understanding of data, which is an integralbasis for good decisions.In [Fe09] the author provides a guidance on how to learn to understand visual represen-tations and recognize patterns within them. In doing so, he considers how human visualperception and thinking work, introduces perceptual building blocks that can visually rep-resent quantitative data, analyzes interaction techniques, which contribute to understand-ing of data, and overviews general methods and practices that improve effectiveness ofvisual analysis. Few exemplifies his findings on a number of viewpoints, shown in Figure3.6. These viewpoints together with recommendations for their usage are considered indetail in the remainder of this section.According to [Fe09], bar graphs are useful when it is necessary to emphasize individual-ity of values and compare their magnitudes. Separate bars share a common baseline andaccurately encode a certain quantitative characteristic of categorical items, i.e. items thathave no particular order or close connection between one another, visually reinforcing by
22

3.2. Business intelligence
their nature the independent nature of the items (see case 1 in Figure 3.6). Bar graphs mayalso be used to display a distribution of values of a certain set of data. In this case bargraphs are called histograms, x-axis displays numeric intervals of values being measured,whereas y-axis is represented by quantitative scale that counts the number of observa-tions in each interval. Additionally, bar graphs may be useful for time-series analysis,displaying change of a certain value over time. Further, bar graph allows to represent andcompare multiple different magnitudes for each value by placing them next to one anotherfor the corresponding item (see case 2 in Figure 3.6). It is also possible to display explicitlyboundaries, shown on a graph as reference lines or as reference areas of fill color, that de-fine the range of normal magnitudes of values (see case 3 in Figure 3.6).Dot plots are very similar to bar charts and are also used to visualize magnitudes of indi-vidual values. Nevertheless, the magnitudes of values are not represented by rectangleheights, but vertical positions of dots related to the quantitative scale on y-axis (see case 4in Figure 3.6). Additional property, inherent in dot plots, is that the scale placed on y-axiscan be narrowed in case all values fall within a relatively narrow range and are difficult tocompare. This is impossible by bar charts because of bars binding to the baseline.The next viewpoint, called line graph, is very useful if the shape of change from one valueto the next one to be shown, e.g. increase, decrease or no change (see case 9 in Figure 3.6).Line graph is able to visualize an overall trend and specific patterns of change in a set ofvalues, and is most commonly used to convey change of a certain quantitative value dur-ing a continuous period of time. Whereas bar graph is applied in case values of categoricalitems to be shown, line graph should be used to display values along an interval scale, i.e.”continuous range of quantitative values, divided into equal intervals” [Fe09]. Anotherdistinction of line graph from bar graph is that the first one represent an overall change,while the second one concentrates on individual values and their comparisons. Moreover,line graphs are often used to compare several same-scaled variables by representing eachof them with a separate line (see case 6 in Figure 3.6). Same as bar chart, line graph mayalso be used to display a distribution. In this case line chart is called frequency polygon andcan be obtained from histogram by using instead of bars line segments connecting centralpoints of bar top sides.Viewpoint Pareto chart, shown in Figure 3.6 (case 7), combines two viewpoints consideredabove, namely bar graph and line graph, and is used if cumulative contribution of partsto the whole to be examined. Thereby, values represented in a form of bars are ranked bysize from the largest to the smallest, and in the same order their contributions are depictedwith line graph starting from top side of the first bar.The greatest strength of the next graphical representation shown in Figure 3.6 (case 8),scatter plot, lies in its ability to ascertain whether, how, and to what extent two quantitativevariables are correlated. Thereby, each point of scatter plot encodes magnitudes of valueswith its horizontal and vertical positions. Scatter plots are also able to display differentgroups of values, differentiating between them by assigning different colors to data points(case 9 in Figure 3.6) or using different shapes instead of dots (case 10 Figure 3.6).Pie chart is considered and explained in [Fe09] as a means to represent part-to-whole re-lationships, even though Few recommends not to use them for two reasons. Firstly, circlesectors, representing magnitudes of values, are difficult to estimate and compare withouthaving labels with exact values on them, and secondly, interpretation of pie charts mayappear to be rather a time consuming task in case legends are used to label the slices, forc-
23

3. Viewpoints overview in EA management related areas
ing the eyes to glance constantly back and forth between the legend and the pie chart tomake sense of it. Pie chart is shown schematically by case 11 in Figure 3.6.Another viewpoint considered in [Fe09] and schematically shown in Figure 3.6 (case 12)is called strip plot. Same as histogram and frequency polygon it is used to display a distri-bution of values with a distinction that strip plot visualizes thereby each individual valuealong the interval scale. However, by providing these details strip plots are missing a clearoverview of distribution shape available in first two cases.The further viewpoint regarded in [Fe09] is box plot, which boxes to a certain extent re-semble bars of bar chart, but still are rather different from them as they do not share acommon baseline as bars do. Another peculiarity of box plot is expressed by the horizon-tal line that divides each box in two parts (see case 13 in Figure 3.6). Also functionality ofthis graphical representation differs from the one of bar chart, as each box is supposed todisplay a distribution of a certain set of values. Thereby, box bottom represents the lowestvalue in the set, the top visualizes its highest value, box length reflects the full spread ofvalues from the lowest one to the highest one, and the line in the middle stands for medianor mean value. Another manifestation of box plot is shown by case 14 of Figure 3.6 andgives five-values distribution summary, as already discussed in Section 3.1. Box plots arenot very appropriate for representation of a single distribution, but are very effective inexamination and comparison of several distributions.The next viewpoint considered in [Fe09] and schematically represented in Figure 3.6 (case15), namely radar graph, can be used for time-series analysis. The circular shape of radargraph is then used to represent the cyclical nature of time, e.g. its axes display hours of aday, whereas different lines of radar graph display magnitudes of a certain value measuredduring different days. Data visualized by radar graph may be also represented using bymeans of line graph.Viewpoints stem-and-leaf plot, chernoff faces, data map and table, schematically represented inFigure 3.6 by cases 16, 17, 18 and 19, respectively, are considered in detail in Section 3.1.Glyphs, similar to chernoff faces, are used for multivariate data visualization, i.e. they con-vey multiple data values. Glyphs are composed from several graphical elements, each ofwhich represents the value of a certain variable. Glyphs exemplified by Few are illustratedschematically in Figure 3.6 (case 20). In this example glyphs take a form of people in orderto encode multiple variables by using such visual variables as color, shape of head, thick-ness of the torso, position of the arms, and position of the legs.The next viewpoint considered in [Fe09] is node-link diagram (or tree diagram), which is usedto display hierarchically structured data. For example, node-link diagram may be appliedin case it is necessary to represent sale volumes per region along given geographical hier-archy, according to which continents are placed on the highest hierarchical level followedby countries, provinces and cities. This viewpoint is schematically shown in Figure 3.6(case 21).Another viewpoint supposed to visualize hierarchical structures is treemap. Treemap wasinvented by Ben Schneiderman and is supposed to display hierarchically structured datausing containment to represent hierarchical relationship, i.e. placing child objects insideof parent object. Additionally, treemaps are able to display two quantitative variables byapplying color and size coding to rectangles. Although treemaps do not support precisequantitative comparisons, which can not be done based on relative sizes of rectangles andtheir color hues, these graphs are efficient when it is necessary to view simultaneously two
24
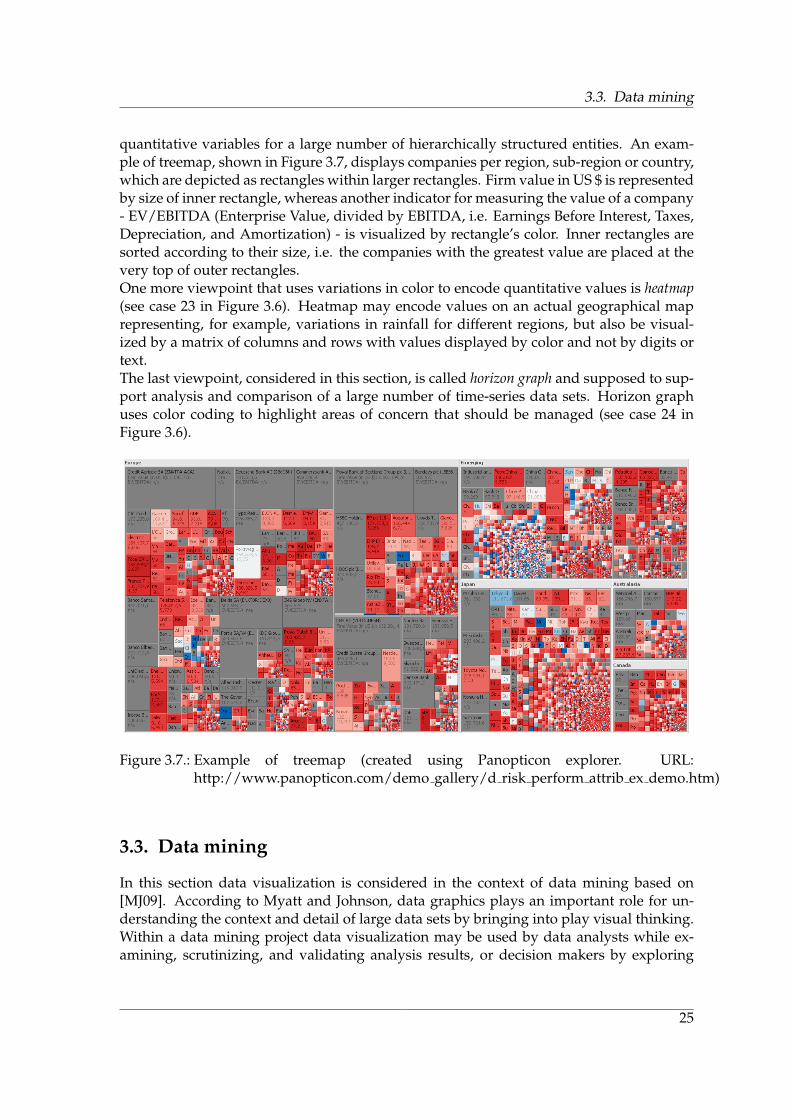
3.3. Data mining
quantitative variables for a large number of hierarchically structured entities. An exam-ple of treemap, shown in Figure 3.7, displays companies per region, sub-region or country,which are depicted as rectangles within larger rectangles. Firm value in US $ is representedby size of inner rectangle, whereas another indicator for measuring the value of a company- EV/EBITDA (Enterprise Value, divided by EBITDA, i.e. Earnings Before Interest, Taxes,Depreciation, and Amortization) - is visualized by rectangle’s color. Inner rectangles aresorted according to their size, i.e. the companies with the greatest value are placed at thevery top of outer rectangles.One more viewpoint that uses variations in color to encode quantitative values is heatmap(see case 23 in Figure 3.6). Heatmap may encode values on an actual geographical maprepresenting, for example, variations in rainfall for different regions, but also be visual-ized by a matrix of columns and rows with values displayed by color and not by digits ortext.The last viewpoint, considered in this section, is called horizon graph and supposed to sup-port analysis and comparison of a large number of time-series data sets. Horizon graphuses color coding to highlight areas of concern that should be managed (see case 24 inFigure 3.6).
Figure 3.7.: Example of treemap (created using Panopticon explorer. URL:http://www.panopticon.com/demo gallery/d risk perform attrib ex demo.htm)
3.3. Data mining
In this section data visualization is considered in the context of data mining based on[MJ09]. According to Myatt and Johnson, data graphics plays an important role for un-derstanding the context and detail of large data sets by bringing into play visual thinking.Within a data mining project data visualization may be used by data analysts while ex-amining, scrutinizing, and validating analysis results, or decision makers by exploring
25

3. Viewpoints overview in EA management related areas
Figure 3.8.: Viewpoints from data mining block
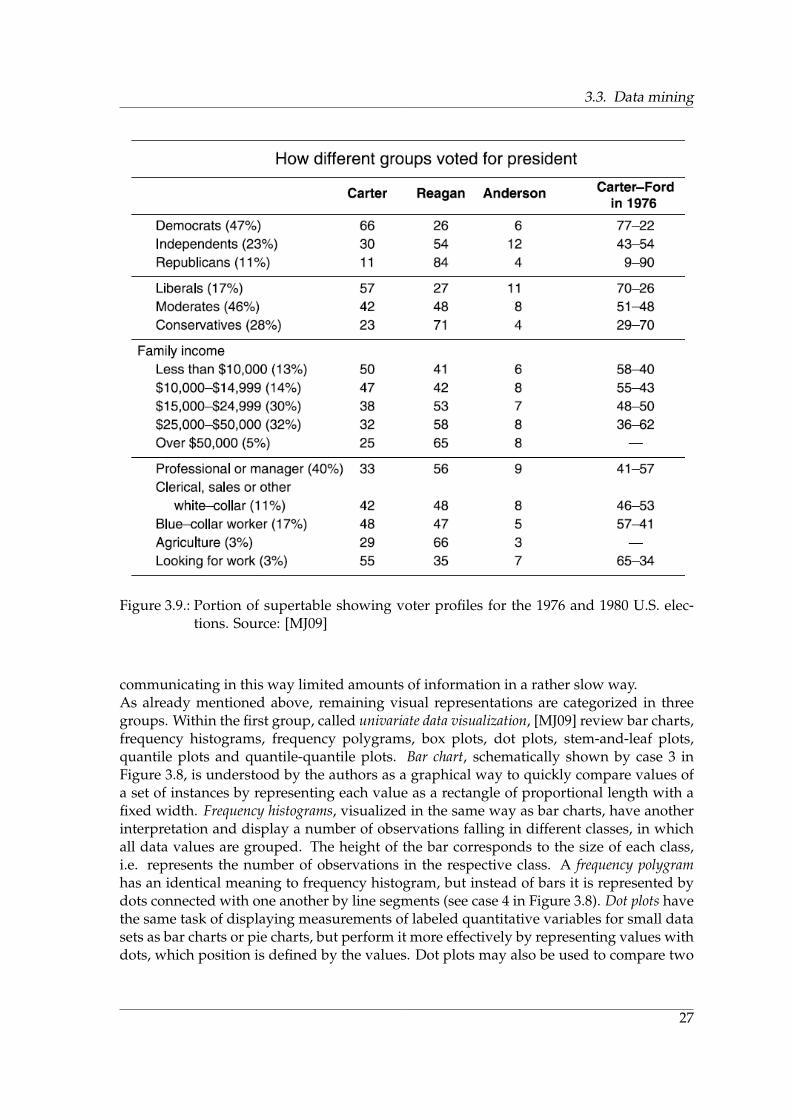
the findings before to take any decision. The authors provide general principles for datagraphics design, review and explain different types of tables, and consider a number ofspecific viewpoints classified according to a number of variables they display in univari-ate (for one variable), bivariate (for two variables) and multivariate (for many variables).Viewpoints, considered in [MJ09], are displayed schematically in Figure 3.8.Although [MJ09] does not regard tables as graphics, same as Tufte it acknowledges thattables are effective in many situations (see Section 3.1), and reviews different table types,namely simple tables, summary tables, two-way contingency tables and supertables. Un-der simple table authors understand a usual table that contains values organized into rowsand columns, and recommend using simple tables in case simple data to be represented.Summary tables visualize summary statistics for observations grouped by a single vari-able. The first column of summary table contains grouping variables, the second columndisplays a number of observations grouped by the corresponding grouping variable, andeach remaining column represents values of a certain statistic applied to the correspond-ing group of observations grouped by the corresponding variable, e.g. mean, median, sum,minimum, maximum, etc. Two-way contingency table represents how frequencies of obser-vations are distributed among categories or ranges of values in two variables. Header rowand header column of two-way contingency table represent categories or ranges of valuesof two different variables, respectively, and its cells contain numbers of observations withthe corresponding values of the first and the second variables. Finally, supertables, owingtheir name to Edward Tufte, are used to summarize and at the same time show in detailinformation, and are ”as engaging as a well-written news article” [MJ09]. The exampleof supertable displayed in Figure 3.9 shows a profile of voters in presidential elections of1976 and 1980.Same as Tufte, [MJ09] asserts that pie charts (see case 2 in Figure 3.8) have better to beavoided, as they ”force the viewer to find unaligned categorical labels inside or outsideof irregularly spaced sectors within a circle, or decode colors of sectors using a legend”,
26
3.3. Data mining
Figure 3.9.: Portion of supertable showing voter profiles for the 1976 and 1980 U.S. elec-tions. Source: [MJ09]
communicating in this way limited amounts of information in a rather slow way.As already mentioned above, remaining visual representations are categorized in threegroups. Within the first group, called univariate data visualization, [MJ09] review bar charts,frequency histograms, frequency polygrams, box plots, dot plots, stem-and-leaf plots,quantile plots and quantile-quantile plots. Bar chart, schematically shown by case 3 inFigure 3.8, is understood by the authors as a graphical way to quickly compare values ofa set of instances by representing each value as a rectangle of proportional length with afixed width. Frequency histograms, visualized in the same way as bar charts, have anotherinterpretation and display a number of observations falling in different classes, in whichall data values are grouped. The height of the bar corresponds to the size of each class,i.e. represents the number of observations in the respective class. A frequency polygramhas an identical meaning to frequency histogram, but instead of bars it is represented bydots connected with one another by line segments (see case 4 in Figure 3.8). Dot plots havethe same task of displaying measurements of labeled quantitative variables for small datasets as bar charts or pie charts, but perform it more effectively by representing values withdots, which position is defined by the values. Dot plots may also be used to compare two
27

3. Viewpoints overview in EA management related areas
sets of values by using different plotting symbols for the values from each set. Box plots(case 6 in Figure 3.8) and stem-and-leaf plots (case 7 in Figure 3.8) are used by Myatt andJohnson in the same meaning as by Tufte and are explained in Section 3.1. Quantile plotsare supposed to represent a distribution of a variable by means of scatter plot, shown in3.8 (case 8). Scatter plot is also used by quantile-quantile plots, which task is to comparedistributions of one or two different variables.As for scatterplot, it is considered within the second group, called bivariate data visualization,as a means for comparing one variable with another one and a graphical way to identifycorrelations between values of two continuous variables.The third group, called multivariate data visualization, discusses how several variables maybe visualized simultaneously in an understandable manner, so that the graphic that repre-sents this data is not overlaid by the complexity of many dimensions. Additional dimen-sions may be added, for example, by using color coding or texture coding for graphicalrepresentations considered above. Another way to increase dimensionality of a certaingraphic is to organize aforementioned viewpoints in a matrix of plots.Furthermore, [MJ09] considers graphical displays for hierarchies (dendograms), observa-
Figure 3.10.: Clustering exemplified on a data set of animals. Source: [MJ09]
tion groupings (decision trees) and complex, high density data (image maps). Under a den-dogram a graphical representation is understood, which displays a hierarchy in the form ofa tree (see case 9 in Figure 3.8). Decision tree, which may be also schematically representedas case 9 of Figure 3.8, visualizes a series of decision alternatives and conditions used tosplit a group of certain observations into smaller groups corresponding to certain criteria.Image map (or else heat map) represents a table of colored cells, where the values taken by a
28

3.4. Urban planning
variable are represented with colors (see case 10 in Figure 3.8). A special case of the heatmap, cluster image map, combines in itself qualities of heat map and dendogram.Myatt and Johnson are also concerned with breaking down data into smaller groups ofobservations that share something in common by means of clustering, so that observationswithin a particular group have more in common with one another than with representa-tives of any other group. Clustering is illustrated on a data set of animals shown in Figure3.10.
3.4. Urban planning
The last section of this chapter considers viewpoints in the area of urban planning on anexample of [Be08], which goal was to research application of information design for visu-alizing urban structures, flows and connections. As a result of this work, a taxonomy ofdesign patterns was presented. All patterns are separated into three categories, namelydisplay, behavior and interaction patterns. Display patterns describe how information isrepresented in the context of its usage purposes, i.e. stand for viewpoints. Behavior pat-terns reflect dynamic characteristics of interactive information visualization, e.g. revealsfunctionalities provided to the user relating to a certain infographics. Interaction patternsrepresent interface elements, which allow the user to interact with a certain informationvisualization. Within the context of this thesis display patterns are of particular interest.A rough overview of display design patterns, considered in [Be08], is provided in Figure3.11.Display patterns are categorized in their turn in further eight groups: correlations, contin-
Figure 3.11.: Viewpoints used in the area of urban planning
uous quantities, discrete quantities, proportions, flows, hierarchies, networks and space.The first group of display design patterns, correlations, is used, if correlations within data tobe identified, and contains two representatives, namely scatter plot and bubble chart. Scat-ter plot is schematically shown by case 1 in Figure 3.11 and used in the meaning describedin previous sections. Bubble chart being similar, to a certain extent, to scatter plot by usingCartesian coordinate system and providing a graphical way to identify correlations be-tween two quantitative attributes, possesses two distinguishing peculiarities. Firstly, each
29

3. Viewpoints overview in EA management related areas
value represented by bubble chart has a unique label and is not anonymous as by scat-ter plot. Secondly, bubble chart allows to display more than two characteristics of items(quantitative or qualitative) by encoding additional attributes with color and size of bub-bles, used instead of dots (see case 2 in Figure 3.11).The second group, continuous quantities, provides means to display continuous datasetsand contains four members: simple line chart, multiple line chart, stacked area chart andsparkline. Simple line chart (case 3 in Figure 3.11) as well as multiple line chart (case 4 in Fig-ure 3.11) are already considered in previous sections. Area chart is based on a line chart andalso displays a quantitative value over a continuous interval with a specific characteristicthat the area below the line is filled with a color or texture. In case multiple data sets tobe visualized, each new line is added on the top of the previous one, forming altogether astacked area chart (see case 5 in Figure 3.11). The last representative of this group is sparkline,which is a minituarized form of a time-series chart. Sparkline is not used on a stand-alonebasis, but rather as a redundant feature embedded in textual descriptions or tables.The third group, discrete quantities, facilitates visualization of sets of discrete quantitative
Figure 3.12.: An example of isometric bar chart showing a number of apartments in Berlinby number of occupants. Source: [Be08]
data and is represented by simple bar chart, multiple bar chart, stacked bar chart, dotmatrix, isometric bar chart and span chart. Bar chart (see case 6 in Figure 3.11) allows tocompare absolute magnitudes of nominal data items of a certain data set with one another,whereas multiple bar chart (see case 7 in Figure 3.11) is used to display and compare severalsets of quantitative data. Stacked bar chart represents with its bars whole sets of quantitativedata. The bars are, however, splitted into segments, each of which displays a single itemof the corresponding set (see case 8 in Figure 3.11). Dot matrix (see case 9 in Figure 3.11)is a one-dimensional representation for discrete quantitative data, in which each value isrepresented by proportional quantity of dots that are filled with different colors to dif-fer between the magnitudes of different entities. Isometric bar chart use three-dimensional
30

3.4. Urban planning
Cartesian coordinate system to display several sets of quantitative data, being in this wayan alternative for multiple bar chart design pattern. An example of isometric bar chart isshown in Figure 3.12. And, finally, span chart allows direct comparison between data setsand is a special case of box plot, considered in detail in Section 3.1. Each rectangle of spanchart displays only two statistics for each data set, namely its minimum and maximum(see case 10 in Figure 3.11).The fourth group, proportions, displays share sizes of data set members within the totalamount and is represented by two design patterns: simple pie chart and ring chart. Simplepie chart, schematically shown in Figure 3.11 (case 11), represents with its sectors a distri-bution of a number of values from a certain dataset. The full circle displays a value of acertain characteristic of the whole dataset, equal to 100%, whereas sectors of simple piechart visualize magnitudes of the same characteristic for its subsets. Ring chart (see case 12in Figure 3.11) may be considered as an extension of simple pie chart. It provides meansto represent and compare distributions of several values from multiple data sets of thesame configuration, i.e. such data sets that share the same number and type of elements,or those with the data related to each other.The fifth group, named flows, enables representation of sequential nature of a certain data
Figure 3.13.: An example of sankey diagram showing average household income andspendings per month. Source: [Be08]
structure and consists of two members: sankey diagram and thread arcs. Sankey diagramdescribes a certain system by means of representing its input and output flows, and isrepresented by a main flow, usually running from left to right, with incoming arrows, des-ignating input components, and outcoming arrows, displaying outputs (see Figure 3.13).Width of each arrow is proportional to the amount of contribution of respective compo-nent. Thread arcs facilitate representation of data that consist of ordered elements, whichare associated with one another. This visual representation was introduced in 2004 withinthe scope of the project on developing experimental prototype for email client called Re-mail, which organized all messages in sequential thread according to the time of their cre-ation, and thereby grouped messages related to one another in respect of a common topic.Moreover, Behrens exemplifies application of thread arcs to the area of urban planning,using them to depict an extension of underground network in Berlin (see Figure 3.14).The sixth group, considered in [Be08], is called hierarchies and is supposed to display hier-
31

3. Viewpoints overview in EA management related areas
archical structures by revealing parental relationships between elements, on the one hand,and representing characteristics of individual elements, on the other hand. The group con-tains two design patterns, namely tree diagram and tree map, which are schematicallyshown in Figure 3.11 by cases 13 and 14, respectively. Tree diagram is useful when it is nec-essary to represent data that consist of hierarchically structured items. All elements standin some kind of inheritance relationship to each other, i.e. either having only descendants(root element of a tree diagram), or having only ancestors (leaf elements of a tree diagram),or having both descendants and ancestors (remaining elements of tree diagram). Each treediagram may have only one root element, and each item may have only one ancestor,except for a root element, which does not have any parent element. Tree maps is an alterna-tive representation for hierarchically structured data, which additionally provides meansto encode quantitative properties of hierarchically structured elements. This viewpoints isused by Behrens in the same meaning as in [Fe09] and is considered in detail in Section 3.2.The seventh group, considered in [Be08] and called networks, focuses on visualization of
Figure 3.14.: An example of thread arcs representing openings and reopenings of Berlinsubway stations since the reunification by line. Source: [Be08]
interconnections between different elements and is represented by three design patterns:diagram map, pearl necklet, and relation circle. The first design pattern of this group, di-agram map (schematically shown in Figure 3.11 as case 15), is used to represent a systemof considerable number of interconnected elements. The second member of the group, de-sign pattern called pearl necklet, allows to represent a number of elements that are sequen-tially interrelated to each other. Stretched layout of this design pattern does not take intoaccount geographical location of items, but focuses on topological structure of data (seeFigure 3.15). The last representative of the seventh group, called relation circle, representsa system of interconnected items in a radial form. In this representation nodes of networkare arranged on a circle in equal distances. Relation circle may display two types of con-nections, namely between several nodes placed on the circle as well as between nodes onthe circle and items within the area enclosed by the circle, and its main strength lies in itsability to display amount and distribution of connections between elements. Accordingto [Be08], relation circles may be used in combination with thematic maps when a largenumber of items from a thematic map should be assigned to one or multiple descriptiveelements (see Figure 3.16).The last, eighth group, called spatial configurations, considers space-related representa-tions and contains two members, namely topographic and thematic maps. According toBehrens, topographic map allows to ”describe the features of space or an area as accurateas possible, but without confusing the user by overloading the available display with toomuch information”. Thematic maps, schematically shown as case 16 in Figure 3.11, are use-
32

3.4. Urban planning
Figure 3.15.: An example of pearl necklet showing projected extension of the U5 subwaywith rail connections. Source: [Be08]
ful to display data that have a spatial reference and thereby represent some characteristicsof these data, which may be numerical, categorical or qualitative. Data items are usuallyrepresented by a certain spatial entity, e.g. continent, region, country, state, etc., whereasattributes of these items are displayed by color coding of spatial regions or additional us-age of another graphs.
Figure 3.16.: An example of relation circle displaying an overview of superlative structuresin Berlin. Source: [Be08]
33

3. Viewpoints overview in EA management related areas
34
4. Viewpoint Catalog from theory andpractice
This chapter is concerned with Viewpoint Catalog construction used subsequently forBEAMS VBBs evaluation and extension. The Viewpoint Catalog collects and structuresviewpoints from theory and practice in the area of EA management. Therefor, an explo-rative analysis of specialized literature as well as a case study by a real-life financial serviceprovider have been performed.As referred in Chapter 2, only findings in the field of EA management can be subsequentlyincluded into BEAMS collection according to the rule of three. Hence, only viewpointsoriginating from this field are relevant for subsequent BEAMS VBBs reorganization andextension process, and thus were included in the Viewpoint Catalog.
4.1. Viewpoints from theory
At the first step of Viewpoint Catalog construction, literature sources in the area of EAmanagement were considered. Altogether, six sources were thoroughly analyzed in orderto identify viewpoints for the catalog.Selection of sources can be explained by two arguments. First, EA management back-ground of the sources is critical for the further BEAMS VBBs extension and reorganizationprocess, and second, all regarded sources focus on visualization aspect for EA manage-ment, providing in this way a comprehensive overview of viewpoints used in the field.Thus, [Se05] analyzes and evaluates various visualization capabilities for IT landscapes,whereas [Wi07] develops graphical modeling language for application landscapes as wellas provides models and methods for their systematical visualization. [La08] and [Be04]are concerned with visualizations of metrics and key performance indicators relating toapplication landscapes. Finally, [Bu08] represents the collection of best-practice visualiza-tions used in organizations, whereas [Ma08] researches visualization facilities of modernEA management tools.
4.2. Viewpoints from practice
In the second step viewpoints from practice were collected in the course of case study,which was conducted in cooperation with IT-subsidiary of a global enterprise active in fi-nancial services sector and affiliated in Munich, Germany. The participating organizationoperates in 22 countries of Western and Eastern Europe and is represented on approx-imately 50 markets all over the world. With more than 160.000 employees and almost
35

4. Viewpoint Catalog from theory and practice
10.000 branches it belongs to one of the largest players on the Central and Eastern Europebanking market. Most of present activities of IT-subsidiary are aimed at consolidation ofIT-systems and technologies in consequence of recent mergers and acquisitions of the fi-nancial institution, as well as at innovation targets.Viewpoints were gathered in this phase by means of personal interviews, which were con-ducted between April and July 2011 with various stakeholders, as well as in course ofdocumentation analysis. Altogether viewpoints from such areas as Finance, Project con-trolling, Project management, Contract management, Infrastructure architecture and Per-formance management were collected to be included into the Viewpoint Catalog.
4.3. Decomposing viewpoints to reusable building blocks
In the course of Viewpoint Catalog construction phase it was noticed, that certain visual el-ements occur repeatedly in different viewpoints. The focus of this section lies on breakingdown the viewpoints from Visualization Catalog into reusable, nonintersecting compo-nents, which may be regarded as a certain decomposition basis. Altogether 141 viewpoints- 79 from the theoretical part of the Viewpoint Catalog and 62 from its practical block - weredecomposed during viewpoint decomposition phase. Subsequently, this section considersseveral principles used in the course of decomposition process and exemplifies it on anumber of concrete examples. Complete Viewpoint Catalog can be found in AppendixesA and B, which represent viewpoints from its theoretical and practical parts, respectively,together with the corresponding modular building blocks, ascertained in the course of de-composition phase. Thereby, each viewpoint from the Viewpoint Catalog is represented asa sum of its elementary components.Decomposition process was performed in accordance with layering principle, discussed inChapter 2. Viewpoints, represented as a sum of all modular building blocks they consistof, were decomposed ”from bottom”, i.e. at first, building blocks used as a base map wereascertained, in case they were available by the viewpoint under consideration, then mod-ular components of the first layer were detached, after that the ones of the second layer,etc. Every time all elementary blocks of a certain layer were identified and added to thesum, BEAMS VBB Add on was used to move to the next layer.In order to make decomposition process more transparent and indicate all essential com-ponents, participating in a certain viewpoint, some building blocks, as for example BEAMSVBB Color coding, were explicitly added to decomposition sum, even if visual variables of”neighbour” blocks already contained the same information implicitly. In cases when VBBColor coding added additional information to the viewpoint, it was used by decomposingin combination with VBB Add on. Otherwise, as for instance in cases when VBB Color cod-ing was just used to increase the expressiveness of the viewpoint without adding any newsense to it, this building block was added to decomposition on a stand-alone basis. An-other remark of this character concerns new viewpoint building block candidates, namelyVBB Graph and VBB Arrow (see Chapter 5). As VBB Graph can be directed and undirected,it is not necessary to use VBB Arrow together with VBB Graph to represent its directedrelations. Nevertheless, if a certain viewpoint represents relationships of different typeswith various arrow types, VBB Arrow is used explicitly within viewpoint decomposition
36

4.3. Decomposing viewpoints to reusable building blocks
process together with VBB Add on to be able to differentiate between different types of re-lationships.Viewpoint, shown in Figure 4.1 and originating from [Bu08] and [Ma08], represents a cer-tain two-level cluster map that visualizes which business applications use which databasesystems together with the information, which of these database systems are running out ofsupport. Business applications are depicted by inner elements of viewpoint cluster map,whereas its outer elements represent organizational units, in which the corresponding ap-plications are hosted. Database systems are displayed with the corresponding icon, whichcolor encodes its attribute ”is running of support”.According to the principle of starting with decomposition from the bottom of the view-point, building block Clustering, that represents which business applications are located inwhich organizational units, is ascertained in the first place as the base map of this view-point. In order to move to the next layer, building block Add on is added to the buildingblock Clustering, already included in decomposition sum. In the first layer database iconsare used to represent which database systems are used by which business applications.Therefore, building block Icon in a form of database is added to the sum. As color codingof database systems provides additional information to the viewpoint (namely, whethercertain system is running out of support or not), firstly, one more layer via building blockAdd on should be built up, and secondly, building block Color coding should be applied.Thus, the viewpoint illustrated in Figure 4.1 is decomposed into a sum of the followingelementary components: Clustering, Add on, Database icon, Add on, Color coding.Another example, considered in this chapter, is used by the real-life financial service provider
Figure 4.1.: Example of a viewpoint from the theoretical block of the Viewpoint Catalog.Source: [Bu08]
in the field of performance management and represents values of key performance indica-tors KPI1, KPI2 and KPI3 specified by a certain country, domain and timeframe (see Table4.1). Values of KPI1 and KPI2 are shown as numbers, whereas KPI3 values are depicted bysymbols with three possible manifestations: red circle, yellow circle and green circle.This viewpoint combines in itself several simpler patterns, i.e. modular building blocks.
37

4. Viewpoint Catalog from theory and practice
Date 1 Date 2Country 1 Country 2 Country 3 Country 1 Country 2 Country 3
Domain 1KPI1 22 22 22 22 22 22KPI2 100.615 35.017 23.712 2.585 2.975 5.515
KPI3
Domain 2KPI1 25 25 24 25 25 25KPI2 98.087 55.714 28.005 15.503 1.837 7.438
KPI3
Domain 3KPI1 738 114 256 1.110 102 876KPI2 3.254 1.303 1.147 16 2 1.110
KPI3
Domain 3KPI1 965 542 380 247 1.089 482KPI2 12.473 5.004 2.684 5.345 903 1.845
KPI3
Table 4.1.: Example of a viewpoint used by the real-life financial service provider(anonymized)
Fundamental component, this viewpoint is based on, is a table, or else a matrix, whichvisualizes attribute values of different instances of a certain type, i.e. values of key per-formance indicators splitted by different countries. However, this multidimensional tablecontains another two types of instances. Instances of type ”Timeframe” Date1 and Date2serve as a grouping factor for countries, e.g. all instances of type ”Country” are, firstly,grouped around Date1, and then Date2, recurring in this way several time in the table.Instances of type ”Domain” take on the same role in respect of KPIs. Thus, the secondbuilding block, which represents a grouping of instances of one type by instances of an-other type, is identified. Further building blocks stand for colored circles, which visualizevalues of some key metrics. These symbols can be regarded as combination of two ele-mentary components: shape and color.Starting decomposition from the lowest layer of the viewpoint, building block Matrix isadded as the first component to the sum of decomposition building blocks. However,building block Matrix is used in this case in combination with building block Grouping toform the table of the structure shown in Table 4.1. Thus, building block Grouping is addedto the the building block Matrix in the next step. Elements of the table are displayed bynumbers and colored symbols. The latter ones represent combination of building blocksEllipse and Color coding. On the contrary to the previous example, in which building blockAdd on was used within decomposition process in order, first, to place database icons onthe base map and, second, to lay on the color coding on icon symbols, Add on buildingblock is not used for decomposition of this viewpoint at all. Ellipses, representing the val-ues of KPI3, illustrate matrix elements, and thus, do not add additional layer to the basemap, formed by composition of Matrix and Grouping building blocks. Color coding of el-lipses in this case also takes place without adding on new layer, because ellipses do notrepresent anything on their own and make sense only in combination with color coding,
38

4.3. Decomposing viewpoints to reusable building blocks
opposite to database icons from previous example.In this way, the viewpoint exemplified in Table 4.1 can be regarded as a sum of the follow-ing modular building blocks: Matrix, Grouping, Ellipse and Color coding.Results of viewpoint decomposition for examples, considered in this chapter, are summa-rized in Table 4.2, which demonstrates similarities and distinctions of viewpoints on thebasis of building blocks and layers used for their decomposition. The table is organized ac-cording to the layering concept, and shows which building blocks of which type are usedin which layer.
Base map Layer1 Layer2Example1 clustering database icons color codingExample2 matrix, ellipses, color coding
Table 4.2.: Similarities and distinctions between exemplified viewpoints
39

4. Viewpoint Catalog from theory and practice
40

5. Extending BEAMS with new viewpointbuilding blocks candidates
This chapter of the thesis is concerned with providing the evaluation and extension ofBEAMS viewpoint building blocks based on the outcomes from Viewpoint Catalog de-composition performed in Chapter 4. The goal of this chapter is to check, whether anyviewpoint from the Viewpoint Catalog can be reproduced by means of existing VBBs, andif not, which elementary viewpoint components are still missing in BEAMS. According tothe rules for inclusion of new building blocks into BEAMS, considered in Subsection 2.3.2,such findings in the area of EA management may be further treated as BEAMS viewpointbuilding block candidates, and after detection of their three practical uses become a partof BEAMS collection.Subsequent Section 5.1 analyzes BEAMS viewpoint building blocks utilization within thescope of decomposition process, and the gaps ascertained in the course of this analysis aretaken as a basis for BEAMS VBBs extension and reorganization, suggested in Section 5.2and Section 5.3.
5.1. BEAMS VBBs utilization analysis
After Chapter 4 demonstrated in which way different viewpoints were broken down intononintersecting modular components, this section inspects the set of this componentsfrom the perspective of its correspondence to the BEAMS collection of viewpoint build-ing blocks. Therefor, two sets of elements are compared, namely the set of elementarycomponents ascertained in the course of Viewpoint Catalog decomposition and furthercalled viewpoint catalog building blocks (VCBBs), and the collection of BEAMS VBBs.In order to check whether any viewpoint from the Viewpoint Catalog can be reproducedby means of existing viewpoint building blocks, the inclusion of VCBBs within the set ofBEAMS VBBs is analyzed in the first step, i.e. VCBBs ⊂ BEAMS VBBs. In the course ofViewpoint Catalog decomposition a number of viewpoint catalog building blocks wereidentified that are not a part of BEAMS VBBs collection. Such VCBB was considered inSection 4.3 on the example of modular building block Grouping that was used for decom-posing the multidimensional table used by the real-life financial service provider. Hence,the conclusion can be made that not every viewpoint from the Viewpoint Catalog canbe decomposed using solely viewpoint building blocks of BEAMS, i.e VCBBs /∈ BEAMSVBBs.In the second step, the inclusion of BEAMS VBBs within the set of VCBBs is analyzed,i.e. VCBBs ⊃ BEAMS VBBs. Table 5.1 demonstrates the results of this analysis shownfor the viewpoints collected from EA management literature as well as for the outcomesfrom the case study by global financial service provider. Theoretical and practical blocks
41

5. Extending BEAMS with new viewpoint building blocks candidates
BEAMS VBBs [Be04] [Bu08] [La08] [Ma08] [Se05] [Wi07] Case studyOrdering + + + + + +Binary matrix + + + + +Matrix (continuous) + +Ternary matrix + + + + +Swimlane + +Clustering + + + + + + +Recursive clustering +Tree diagram + +Bar chart + + +Pie chart + + + +Rectangle + + + + +Ellipse + + + +Adding on + + + + + + +Color coding + + + + + + +Size coding + + + + + +
Table 5.1.: BEAMS VBBs used for viewpoints decomposition of Viewpoint Catalog theo-retical and practical parts
of the Viewpoint Catalog are depicted in the header row of the table, whereas its headercolumn represents all viewpoint building blocks currently available in BEAMS collection.As shown in this table, in the theoretical block of the Viewpoint Catalog, represented bysix sources, namely [Be04], [Bu08], [La08], [Ma08], [Se05], and [Wi07], BEAMS VBBs uti-lization is absolutely. Also by viewpoints used by the global financial service provider,absolute majority of VBBs found their application. These results give an evidence, thatBEAMS viewpoint building blocks are highly applied in the field of EA management inboth theory and practice. Another conclusion, which can be made from this comparativeanalysis of two sets, is that BEAMS VBBs collection is a subset of VCBBs set, as all BEAMSviewpoint building blocks were utilized during Viewpoint Catalog decomposition phase(see Figure 5.1).After considering BEAMS viewpoint building blocks participation withing the VCBBs col-lection, remaining viewpoint catalog building blocks, different from BEAMS VBBs, areinspected, i.e. VCBBs \BEAMS VBBs (see Figure 5.1). The following sections documentviewpoint catalog building blocks used for decomposition of viewpoints in the field ofEA management, i.e. viewpoints originating from EA management literature and used bythe real-life enterprise that are still not a part of BEAMS, and inscribe them as viewpointbuilding block candidates into existing BEAMS VBBs structure, providing solutions for itsoptimization and reorganization.
42

5.2. Structural VBBs candidates
Figure 5.1.: Relationship between sets of BEAMS VBBs and VCBBs
5.2. Structural VBBs candidates
This subsection is concerned with BEAMS structural viewpoint building blocks and startswith introduction of 14 new structural VBBs candidates and 2 special cases of VBB Clus-tering (see Figure 5.2) sorted in alphabetical order.Each of VBB candidates is subsequently described in detail based on layout used in [Se11]for BEAMS viewpoint building blocks description and explicated in Subsection 2.3.2. Lay-out sections ”Name”, ”Explanation”, ”Examples” and ”Type” are incorporated into view-point building block candidates layout one-to-one, with the only one exception for VBBMatrix, for which section ”Example” is specified for each of its special cases, but not withinbuilding block candidate description itself. Section ”Usage” for structural VBBs descrip-tion is used in the same meaning as in [Se11], although for representation of attribute scaletypes the terminology in the meaning of [Fe09] is used. In doing so, it is differentiated be-tween nominal, ordinal and interval scales. Additionally, such issues as ”Formatting” and”Connections to other VBBs” are described for each structural candidate. Section ”For-matting” lists format settings for VBB candidate under consideration that do not add anyadditional information to the base map layer playing solely the role of decorator, whereas”Connection to other VBBs” section shows which building blocks may be used in combi-nation with considered candidate to encode additional information on additional layersor extend considered builing block. On the contrary, BEAMS VBBs layout sections ”Tags”,”Building block” and ”M2 concept” were not included in VBBs candidates descriptions.Finally, this subsection makes optimization recommendations for existing structural VBBsand gives an overview on extended BEAMS collection of structural viewpoint buildingblocks.
5.2.1. VBB Clustering: special cases
VBB Clustering is used to display a hierarchic relationship between instances of differenttypes and is already described in [Se11]. This subsection communicates additional two lay-out sections for VBB Clustering, namely ”Formatting” and ”Connections to other VBBs”
43

5. Extending BEAMS with new viewpoint building blocks candidates
Figure 5.2.: Structural VBBs candidates
44

5.2. Structural VBBs candidates
and then represents two special cases of VBB Clustering, identified among viewpoint cat-alog building blocks during the decomposition phase.Formatting: Following format settings can be applied to VBB Clustering and all its specialcases:
• set background color for clusters
• set shape of clusters
• set frame color of clusters
• set frame style of clusters
Connections to other VBBs: VBB Clustering may be used in combination with VBB Smiley,VBB Traffic light, VBB Battery, VBB Harvey balls, VBB Speedometer, VBB Trend arrow,VBB Progress bar, VBB Bar chart, VBB Pie chart, VBB Color coding and VBB Size codingto depict additional attributes of its elements. VBB Icon and VBB Shape may be used todifferentiate between instances of different types. Furthermore, VBB Clustering may beused together with VBB Graph, if relationships between its elements to be shown.
Figure 5.3.: Example of VBB Clustering: Deformed clustering. Source: [Bu08]
VBB Clustering: Deformed clustering
Deformed clustering represents a special case of VBB Clustering, as some inner elements ofcluster map are not assigned to any outer ones.Explanation: An shown in Figure 5.2 (case A) symbols labeled x, y and z represent theinstances of type Z (x:Z, y:Z and z:Z), whereas symbol a displays the instance of type A(a:A). While instances x and y of type Z are related to instance a of type A, instance z:Z hasno relation to any instance of type A.Example: Shown in Figure 5.4 special case of VBB Clustering represents how businessobjects are used by business processes in business interactions. Here three-level hierarchy
45

5. Extending BEAMS with new viewpoint building blocks candidates
of instances is displayed, which visualizes application components on the highest level ofhierarchy (outer symbols of cluster map), business processes in between (symbols of themiddle layer of cluster map) and business functions on the lowest hierarchical level (innersymbols). However, instances of type ”Business object” (green, outside the cluster map)and ”Business service” (yellow, outside the cluster map) are not assigned to any level ofhierarchy and are out of it.Abstract viewmodel: An abstract viewmodel for this special case of VBB Clustering isshown in Figure 5.4.
Figure 5.4.: Information model of VBB Clustering: Deformed clustering
Figure 5.5.: Example of VBB Clustering: special case 2. Source: [Se05]
VBB Clustering: Circular clustering
Circular clustering displays a special case of VBB Clustering, as it is not represented in itsstandard form of contextless nested rectangles, but in a form that has a resemblance to thereal-life structure of elements to be visualized.
46

5.2. Structural VBBs candidates
Explanation: Circular representation of VBB Clustering, shown schematically in Figure 5.2(case B), is suitable if it is necessary to show many-to-many relationships between innerand outer elements in an expressive and intuitive recognizable manner, thereby consider-ing logical relatedness between the elements. This special case places side by side suchouter components, which have the majority of common inner elements, they are relatedto. Inner components related to both neighbouring outer elements are placed then on theircommon border. Circular representation also takes into account the context of elements itvisualizes. Thus, elements with the central role can be placed in the middle of the circle.Example: Example of circular representation of VBB Clustering is shown in Figure 5.5,which considers cross-departamental use of same application systems. Thereby, depart-ments with the highest cooperation by application systems usage placed next to one an-other. Moreover, organizational context is also incorporated in this visualization by locat-ing finance department in the middle of the viewpoint emphasizing in this way its centralrole for organization. Color and size coding of inner elements of this viewpoint encodeadditional information about application systems, namely their importance (size) and ur-gency of need for action (color).Abstract viewmodel: An abstract viewmodel for this special case of VBB Clustering maybe also represented by Figure 5.4 with relationship multiplicity ”many-to-many”.
5.2.2. VBB Dot plot
Usage: You want to display the values taken by one or more ordinal or interval attributes.y-coordinate of symbols represents an attribute value.Explanation: VBB Dot plot is schematically depicted in Figure 5.2 (case C). Dot plots canbe used to visualize one of the following scenarios:
• values of a single attribute for instances of one particular type
• values of different attributes for a single instance of one particular type
• values of multiple attributes as taken by a collection of instances of one particulartype
Figure 5.6.: Multiple dot plot
47

5. Extending BEAMS with new viewpoint building blocks candidates
Example: The example in Figure 5.2 (case C) indicates four different values a, b, c and d.Here, two from three aforementioned scenarios are possible.Scenario 1:a, b, c and d represent different instances of one particular type Z: a:Z, b:Z, c:Z, d:Z. Type Zhas one attribute z of interval scale, which takes values:a.z = 5b.z = 4c.z = 4,5d.z = 3This scenario was detected by financial service provider. In the real-life example instancesrepresents different organization domains, and dot plot symbols depicts target KPI valuesfor each domain, respectively.Scenario 2:a, b, c and d represent different attributes of one particular instance z of type Z: z:Z. Theseattributes take values:z.a = 5z.b = 4z.c = 4,5z.d = 3Scenario 3:The example in Figure 5.6 shows the third scenario, in which two different values as takenby each of two attributes of interval scale are indicated.Each group of symbols represents instances a, b, c or d of type Z: a:Z, b:Z, c:Z, d:Z. Type Zhas two attributes of interval scale: y and z, taking values as follows:a.y = 5a.z = 4,4b.y = 4b.z = 2,8c.y = 4,5c.z = 5,1d.y = 3d.z = 2Type: Structural VBB candidateFormatting: Following format settings may be applied to VBB Dot plot:
• y-axis can be switched on and off
• gridlines can be switched on and off
Connections to other VBBs: VBB Dot plot may be used in combination with VBB Shape,VBB Icon and VBB Bar chart to depict multiple attributes of instances in Scenario 3. VBBColor coding may be used to depict additional attribute of a certain instance in Scenario1 and Scenario 3 (e.g. attribute ”Status” can be coded in the following way: green - inproduction; yellow - in development; red - to be retired)Abstract viewmodel: Information models of VBB Dot plot for each Scenario are shown inTable 5.2.
48

5.2. Structural VBBs candidates
Scenarios 1 and 3 Scenario 2
Table 5.2.: VBB Dot plot information models
5.2.3. VBB Graph
Usage: You want to visualize a set of instances of types and relations between them.Explanation: VBB Graph is schematically depicted in Figure 5.2 (case D). Vertices of VBBGraph visualize instances of types, whereas its edges represent relationships between theseinstances. Graphs may be used to represent one of the following scenarios:
• instances to be visualized are of one certain type. In this case all instances are de-picted by uniform representatives of VBB Shape, usually by circles - special cases ofVBB Ellipse
• instances to be visualized are of different types. In this situation instances of differenttypes are visualized by by different representatives of VBB Shape or VBB Icon
• relations between instances are symmetric, i.e. if a is related to b then b is related toa. Here graph is undirected, and relations between the instances are represented byVBB Line
• relations between instances are asymmetric, i.e. if a is related to b then b is not neces-sarily related to a. In this case graph is directed, and relations between instances arevisualized by VBB Arrow
Example: Example shown in Figure 5.2 (case D) represents five instances of same type A:a:A, b:A, c:A, d:A, e:A and f:A with following symmetric relations between them:(a,c), (c,a)(a,b), (b,a)(b,c), (c,b)(c,d), (d,c)(c,f), (f,c)(b,f), (f,b)(d,e), (e,d)(f,e), (e,f)Type: Structural VBB candidateFormatting: Show/hide grid format may be applied to VBB Graph.Connections to other VBBs: VBB Graph may be used in combination with such symbolVBBs as VBB Smiley, VBB Traffic light, VBB Battery, VBB Harvey balls, VBB Speedometer,VBB Trend arrow and VBB Progress bar to depict additional attributes of instances. For
49

5. Extending BEAMS with new viewpoint building blocks candidates
decoration of vertices and edges of VBB Graph visual variables of VBB Shape, VBB Icon,VBB Line and VBB Arrow may be used.Abstract viewmodel: Information model of VBB Graph is shown in Figure 5.7.
Figure 5.7.: VBB Graph information model
5.2.4. VBB Grouping
Usage: You want to show the grouping of instances of one type by instances of anothertype.Explanation: VBB Grouping is schematically depicted in Figure 5.2 (case E). Two scenariosof its usage are thinkable:
• Scenario 1: VBB Grouping displays a hierarchical relationship between instances ofone certain type
• Scenario 2: VBB Grouping displays a grouping relationship between instances of dif-ferent types
Example:Scenario 1: Symbols labeled A, a1, a2 and a3, shown in Figure 5.2 (case E), represent in-stances of class ”Process”, and thus visualize a certain process A, which consists of smallersubprocesses a1, a2, and a3.Scenario 2: Symbol labeled A, shown in Figure 5.2 (case E), represent a certain instanceof class ”Year”, whereas symbols labeled a1, a2 and a3 visualize instances of type ”Coun-try”. In this case VBB Grouping displays the grouping of instances of type ”Country” byinstances of type ”Year” (see Table 4.1).Type: Structural VBB candidateFormatting: VBB Grouping may be established in two graphical layouts:
• a grouping instance above and grouped instances below
• a grouping instance below and grouped instances above
50

5.2. Structural VBBs candidates
VBB Grouping may be also established in two graphical directions, namely horizontallyand vertically.Additionally, following format settings are applicable to VBB Grouping:
• set fill color of elements
• set shape of elements
• set frame color of elements
• set frame style of elements
• set text color of elements
Connections to other VBBs: VBB Grouping is not an independent VBB and is usually usedcomplementary to VBB Matrix, VBB Ordering and VBB 2D-Swimlane.Abstract viewmodel: Information models of VBB Grouping for both possible scenarios areshown in Table 5.3.
Scenario 1 Scenario 2
Table 5.3.: VBB Dot plot information models
5.2.5. VBB Interactioning
Usage: You want to show how instances operate with each other and in what order. ThisVBB is also known as UML sequence diagram.Explanation: VBB Interactioning is schematically depicted in Figure 5.2 (case F). Parallelvertical lines of this VBB represent lifelines of different instances. Horizontal arrows be-tween the lifelines of the instances represent exchange of messages between these instancesin the order, in which they occur.Example: Symbols labeled a, b, and c represent instances of the type Z (a:Z, b:Z and c:Z).Instance a sends a message to instance b and waits for reply from b. Instance b in its turnsends another message to instance c, and waits for reply from c. Instance c answers to b.Then, b answers to a.Type: Structural VBB candidateFormatting: Following format settings are applicable to VBB Interactioning:
• set fill color of elements
51

5. Extending BEAMS with new viewpoint building blocks candidates
• set shape of elements
• set frame color of elements
• set frame style of elements
• set text color of elements
Connections to other VBBs: Differentiation between request and response messages aswell as between synchronous and asynchronous requests is done by the usage of differentarrows styles of VBB Arrow.
Figure 5.8.: Lifecycle diagram
5.2.6. VBB Lifecycle diagram
Usage: You want to visualize lifecycles of instances of a certain type, including lifecyclesof respective instances of subtype.Explanation: VBB Lifecycle diagram is schematically depicted in Figure 5.2 (case G). Headerrow of VBB Lifecycle diagram represents time scale, whereas its header column contains in-stances of a certain type and their constituents represented by instances of subtype. Barsplaced in central part of this VBB represent different lifecycle phases of instances of thetype and its subtype with different colors. Lifecycle phase of a certain instance of the typedepends on lifecycle phases of the instances of its subtype.Example: Shown in Figure 5.8 lifecycle diagram, considered in [Bu08], visualizes lifecyclesof business applications and their versions. Header row represents time scale with yearsY1 and Y2 splitted by months. Header column of this lifecycle diagram contains businessapplications a1, a2 and a3 together with their versions:v 1.5, v 2.0 and v 2.5 for application a1v 1.0 and v 1.5 for application a2v 1.0 and v 2.0 for application a3
52

5.2. Structural VBBs candidates
Each application as well as each application version can be in each moment of time in oneof four lifecycle phases: planned, in development, in production and to be retired. Barsrepresent lifecycles of the corresponding instances: the ones without texture show appli-cation lifecycles, whereas the ones with texture visualize lifecycles of business applicationversions.Business application lifecycle phases depend on lifecycle phases of their versions, e.g. acertain application stays in phase ”In production” as long as one of its versions is in thesame status. As soon as the latest version should be retired and no new version is planned,the status of the application also switches to ”To be retired” (see a3 in Figure 5.8).Type: Structural VBB candidateFormatting: Following decorators can be applied to VBB Lifecycle diagram:
• show/hide grid (show grid completely or partially in any combination: show onlyhorizontal gridlines, only vertical gridlines, only gridlines for header row and col-umn)
• place column headers above/beneath the lifecycle diagram
• place row headers on the left/ on the right side of the lifecycle diagram
• set cells text color
• set cells frame color
• set cells frame style
Connections to other VBBs: VBB Lifecycle diagram may be used in combination withsuch symbol VBBs as VBB Smiley, VBB Traffic light, VBB Battery, VBB Harvey balls, VBBSpeedometer, VBB Trend arrow and VBB Progress bar to depict additional attributes ofinstances. VBB Color coding and texture coding are used to differentiate between differentlifecycle phases. VBB Lifecycle diagram may be also used with structural VBB Grouping,e.g. to group months by years.Abstract viewmodel: Information model of VBB Lifecycle diagram is shown in Figure 5.9.
5.2.7. VBB Line chart
Usage: You want to visualize a trend in ordinally or interval-scaled attribute values of acertain instance of a certain type over time.Explanation: VBB Line chart is schematically depicted in Figure 5.2 (case H). x-axis depictsa time scale, and y-axis represents the scale of an attribute of a certain instance of a cer-tain type. A line represents dependency of the attribute from time, i.e. each point of theline represents a certain value taken by the attribute in the corresponding moment of time.Line chart is formed by connecting the points, which represent individual measurements,with line segments.VBB Line chart can be represented by only one or multiple lines. In case of multiple linesfollowing two scenarios may be visualized:
53

5. Extending BEAMS with new viewpoint building blocks candidates
Figure 5.9.: VBB Lifecycle diagram information model
Figure 5.10.: Line chart of the real-life financial service provider (anonymized)
• Scenario 1: Different lines show changes in values of same attribute for different in-stances of a certain type. If u and v are some instances of type Z, which have anattribute a, then VBB Line chart may visualize changes of this attribute over time forboth instances with two lines: u.a and v.a.
• Scenario 2: Different lines show changes in values of different attributes of a cer-
54

5.2. Structural VBBs candidates
tain instance of a certain type. In this case the attributes should be comparable, i.e.have the same scale. If z is an instance of type Z, which has two comparable iden-tically scaled attributes a and b, then VBB Line chart may visualize changes of theseattributes over time with two lines: z.a and z.b
Example: Example of VBB Line chart shown in Figure 5.10, used in the area of contractmanagement of the real-life financial service provider, represents two lines. The upperline depicts changes in values of availability of a certain infrastructural element. x-axisdepicts the months, and y-axis shows the scale for availability. According to the figure,attribute ”Availability” is measured once a month, because there is only one measurementpoint per month visualized.The lower line of this viewpoint represents the limit value for attribute ”Availability” equalto 98,0%. It is shown as a horizontal line, because the limit value is equal in each month,and thus its y-coordinate is equal to 98,0% for each value of time x.In this example the second scenario is represented, as different lines depict different at-tributes of a certain instance of type ”Infrastructural element”, namely actual availabilityand limit availability.Type: Structural VBB candidateFormatting: Following format settings can be applied to VBB Line chart:
• Switch on/off the gridlines
• Switch on/off the values captions of the points
• Fade in/down the axes
• Fade in/down the axes scales
• Axes rotation
• One/multiple lines shown
Connections to other VBBs: VBB Line chart may be used in combination with VBB Shapeand VBB Color coding to differentiate between attribute values for different instances (sce-nario 1) or values of different attributes (scenario 2).Abstract viewmodel: Information models of VBB Line chart for each of aforementionedscenarios are shown in Figures 5.11 and 5.12.
Figure 5.11.: VBB Line chart information model for Scenario 1
55

5. Extending BEAMS with new viewpoint building blocks candidates
Figure 5.12.: VBB Line chart information model for Scenario 1
5.2.8. VBB Matrix
Usage: You want to visualize one of the following scenarios:
• which values various attributes of instances of particular type take
• how instances/attributes of two types relate
• how instances/attributes of three types relate
Explanation: VBB Matrix is schematically depicted in Figure 5.2 (case I). Columns a, b, c, dand rows x, y, z of the matrix can represent instances of particular type, different attributelabels or different values of particular attribute. Cells of matrix may contain:
• numerals
• binary values
• categorical data
• text
• instances of particular type
• symbol VBBs
Type: Structural VBB candidateFormatting: Following format settings may be applied to VBB Matrix and all its specialcases:
• show/hide grid (show grid completely or partially in any combination: show onlyhorizontal gridlines, only vertical gridlines, only gridlines for column and row head-ers)
• add/remove axes
• swap column and row headers of the matrix
• place column headers above/beneath the matrix
• place row headers on the left/ on the right side of the matrix
• set cells background color
56

5.2. Structural VBBs candidates
• set cells text color
• set cell frame color
• set cell frame style
Three special cases of VBB Matrix are considered in detail in subsequent subsections.
Department KPI1 KPI2 KPI3 ...Dpt. 1 28,6 0,8 14,9 ...Dpt. 2 82,1 5,4 14,3 ...Dpt. 3 79,5 3,6 15,9 ...... ... ... ... ...
Table 5.4.: Unary matrix of the real-life financial service provider (anonymized) - example1
VBB Unary matrix
Usage: You want to visualize attribute values grouped by different instances of a certaintype or by different values of another attribute.Explanation: Header column of VBB Unary matrix represents some values (either instancesof particular type or attribute values of particular attribute), and its header row containsattribute labels. Cells of the matrix visualize values of the attributes specified in headerrow grouped by the values stated in header column. These values can be visualized bynumerals, categorical data, text or symbol VBBs.Example:Example 1: As shown in Table 5.4 header column of this unary matrix, used in the area offinance by the real-life financial service provider, represents different departments of theorganization (values of type ”Department”), its header row depicts different KPI namesfor finance area, and the numerals at the intersections of columns and rows display thevalues of the corresponding KPIs in the corresponding departments, i.e. values of the cor-responding KPI grouped by the corresponding department.Example 2: Another example of VBB Unary matrix found in project controlling area of thereal-life financial service provider is shown in Table 5.5. Header column of this unary ma-trix designates two possible values of the attribute ”Resource type”, namely external andinternal, whereas its header row contains labels for different KPIs used in project control-ling area. The numerals at the intersections of columns and rows indicate the values of thecorresponding KPI grouped by the corresponding value of the attribute ”Resource type”.Not only numerals, but also textual descriptions, symbol VBBs (e.g. traffic lights, trendarrows and smileys, etc.), and categorical data (e.g. in development/in production/to be retiredor red/yellow/green, etc.) as well as their combination are used by the industry partner todepict attribute values in unary matrix.Connections to other VBBs: VBB Unary matrix may be used in combination with suchsymbol VBBs as VBB Smiley, VBB Traffic light, VBB Battery, VBB Harvey balls, VBB Speedome-ter, VBB Trend arrow, VBB Progress bar, VBB bar chart and VBB Pie chart, to depict the
57

5. Extending BEAMS with new viewpoint building blocks candidates
Resource type KPI1 KPI2 KPI3External 70 70 81Internal 30 30 18
Table 5.5.: Unary matrix of the real-life financial service provider (anonymized) - example2
contents of its cells. VBB Unary matrix may be also used with structural VBB Grouping toincrease its dimensionality by grouping its instances by instances of another type.Abstract viewmodel: Information model of VBB Unary matrix is shown in Figure 5.13.
Figure 5.13.: VBB Unary matrix information model
`````````````DocumentStakeholder
Stakeholder 1 Stakeholder 2 Stakeholder 3 Stakeholder 4
Document 1 M OD M MDocument 2 OD MDocument 3 OD M MDocument 4 M M
Table 5.6.: Binary matrix of the real-life financial service provider (anonymized) - example1: Review matrix: M - review is mandatory, OD - review on demand
`````````````RoleLabor category
A B C D
Role 1 660 0 N/A N/ARole 2 660 N/A N/A N/ARole 3 N/A N/A 1300 0Role 4 260 0 N/A N/A
Table 5.7.: Extracted from binary matrix of the real-life financial service provider(anonymized) - example 2: Labor category matrix
58

5.2. Structural VBBs candidates
Binary matrix
Usage: You want to visualize how instances of two types relate. Thereby, you want eitherjust to show relation existence, or you want also to specify existing relations.Explanation: VBB Binary matrix visualizes relationships between instances of two differenttypes and therefor uses a many-to-many relationship. Header column and header row ofVBB Binary matrix represent instances of two different types, respectively, and matrix cellseither show the existence of relation between certain instances of these two types, if theytake only two values, thus representing binary data (e.g. empty value, if no relation be-tween the corresponding instances exists, and cross otherwise [Se11]), or they may specifythe existing relation by taking different values in non-empty cells, usually represented bynumerals, categorical data or symbol VBBs.Example: In this section three possible scenarios of VBB Binary matrix use are considered.Scenario 1: Header row and column contain instances of two different types correspond-ingly.As shown in Table 5.6 header row of this binary matrix, used in the project managementarea of the real-life service provider, represents different stakeholders of review process,while its header column depicts different documents to be reviewed. Cells of this matrixtake two different values: M - review is mandatory and OD - review on demand, or areempty in case no review of particular document should be performed by particular stake-holder. Thereby, the first row of the matrix means that Document 1 should be mandatoryreviewed by Stakeholders 1, 3 and 4, and it should be considered by Stakeholder 2 in caseof necessity.Another example of usage of Scenario 1 is CRUD-matrix considered in [Se05], which repre-sents how different information objects can be used by different processes. Four possibletypes of use are: create, read, update and delete.Scenario 2: Header row and column contain instances of a certain type and values of a cer-tain attribute, respectively.As shown in Table 5.7 header row of this binary matrix contains values of attribute ”Laborcategory” (A, B, C and D), and its header column represents instances of type ”Role”. Cellsof this binary matrix represent values of attribute ”Salary” of type ”Role”. The values ofcells take numeral values which correspond to salary rates of the corresponding role inthe corresponding labor category. The cells which take the value ”N/A” show that thecorresponding role can not be attributed to the corresponding category, in other words norelationship between them exists.Scenario 3: Header row and column contain values of two different attributes, respectively.Table 5.8 depicts project costs grouped by two attributes: project priority and project pro-gram, which designates the group of related projects managed in a coordinated way.Header row contains the values, which attribute ”program” takes (p1, p2, p3 and p4),header column represents the values taken by attribute ”priority” (a, b and c). Cells of thisbinary matrix depict the values of attribute ”project costs” grouped by the correspondingvalues of ”priority” and ”program” attributes.Connections to other VBBs: VBB Binary matrix may be used in combination with suchsymbol VBBs as VBB Smiley, VBB Traffic light, VBB Battery, VBB Harvey balls, VBB Speedome-ter, VBB Trend arrow, VBB Progress bar, VBB bar chart and VBB Pie chart, which may beused to depict the contents of its cells. VBB Binary matrix may be also used with structural
59
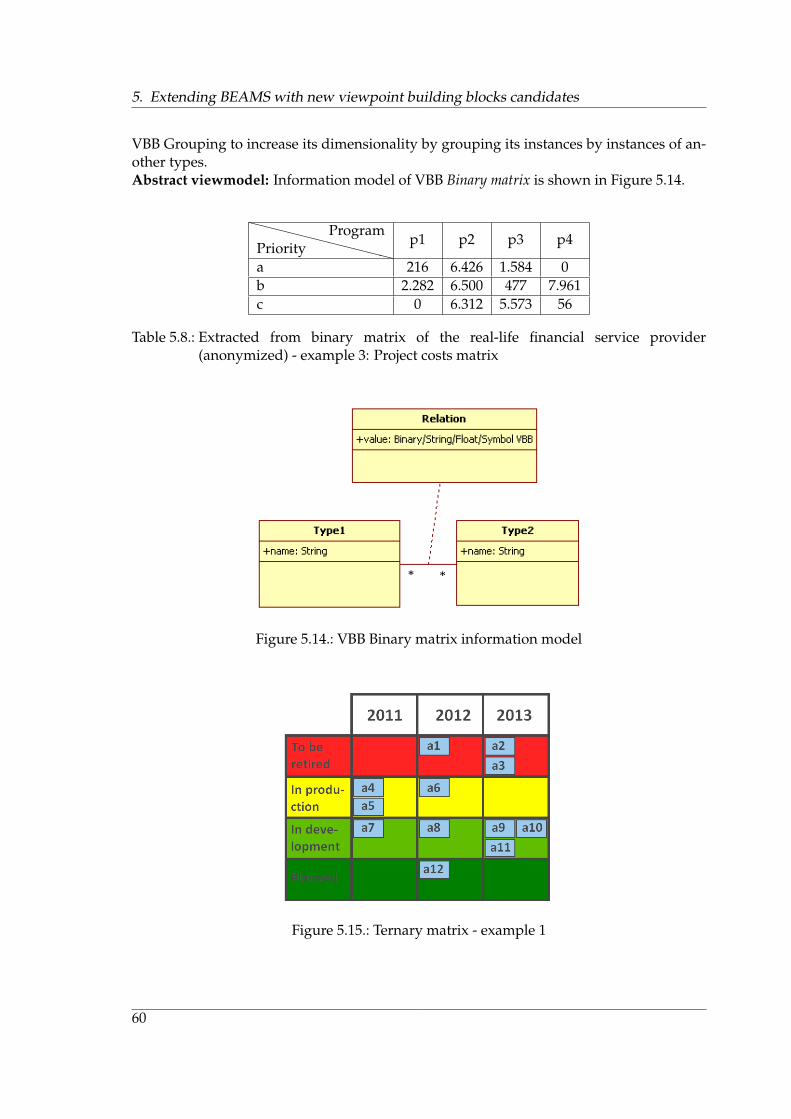
5. Extending BEAMS with new viewpoint building blocks candidates
VBB Grouping to increase its dimensionality by grouping its instances by instances of an-other types.Abstract viewmodel: Information model of VBB Binary matrix is shown in Figure 5.14.
XXXXXXXXXXXPriorityProgram
p1 p2 p3 p4
a 216 6.426 1.584 0b 2.282 6.500 477 7.961c 0 6.312 5.573 56
Table 5.8.: Extracted from binary matrix of the real-life financial service provider(anonymized) - example 3: Project costs matrix
Figure 5.14.: VBB Binary matrix information model
Figure 5.15.: Ternary matrix - example 1
60

5.2. Structural VBBs candidates
Figure 5.16.: Ternary matrix - example 2
Ternary matrix
Usage: You want to visualize how instances of three types relate.Explanation: VBB Ternary matrix visualizes relationships between instances of three differ-ent types and therefor uses a many-to-many relationship. Header row, header column andcells of ternary matrix represent instances of three different types, respectively. Instancesplaced in ternary matrix cells are aligned with the instances of two other types that arerepresented in its header column and row.Example:Example 1: Example shown in Figure 5.15 and considered in [Bu08] depicts which applica-tions are in which lifecycle phase in different years. In this example instances of two types,namely ”Application” and ”Time”, are represented together with an attribute ”Lifecyclephase”. Header column of this ternary matrix depicts values of attribute ”Lifecycle phase”and its header row displays years. Cells contain instances of type ”Application” that is inthe corresponding lifecycle phase in the corresponding year. In this example, each instanceof type ”Application” is represented only once in the cells of ternary matrix.Example 2: Figure 5.16 schematically shows which business applications are participat-ing in which processes of which organizational units. In this example instances of threetypes are involved, namely ”Process”, ”Organizational unit” and ”Business application”.Header column depicts instances of type ”Organizational unit”, whilst header row con-tains instances of type ”Process”. Cells of this matrix represent instances of type ”Businessapplication” which are aligned with instances of two other types. In this example, someinstances are placed in multiple cells.Connections to other VBBs: VBB Ternary matrix may be used together with VBB Smi-ley, VBB Traffic light, VBB Battery, VBB Harvey balls, VBB Speedometer, VBB Trend ar-row, VBB Progress bar, VBB bar chart and VBB Pie chart to encode additional informationabout the instances. Also it may be used in combination with VBB Icon, VBB Color codingand VBB Shape to depict instance status or differentiate between the instances of differenttypes.Abstract viewmodel: Information model of VBB Ternary matrix can be represented in two
61

5. Extending BEAMS with new viewpoint building blocks candidates
ways depending on the specific situation.Each of the instances of type ”Application”, represented in the first example (see Figure5.15), appear only once in matrix cells. For this example information model shown in Fig-ure 5.17 is suitable. In the ternary matrix considered in the second example (see Figure5.16) some instances of type ”Business application” recur in different cells several times,thereby some identical instances are positioned diagonally relative to each other. For thisexample the information model shown in the Figure 5.16 is not appropriate consideringits inconsistencies related to diagonal location of identical instances. In such situation it isbetter to use the information model represented in Figure 5.18.
Figure 5.17.: VBB Ternary matrix information model (with intermediate class)
5.2.9. VBB Migration diagram
Usage: You want to visualize migration of functionality from one instance of a certain typeto another.Explanation: VBB Migration diagram is schematically depicted in Figure 5.2 (case J). Axisbelow visualizes time scale with time moments Q1, Q2, Q3 and Q4. Symbols labeled witha, b, c, d and e represent instances of a certain type Z (a:Z, b:Z, c:Z, d:Z and e:Z), whichlifecycles are depicted by the corresponding lines. Diamond symbols designate milestones,i.e. the moments of migration relevant decisions and events, and circles symbolize goalsachievement. Different line styles represent different phases of lifecycle, and arrows whichconnect milestones symbolize migration of functionality from one instance of a certaintype to another one with the corresponding milestones.Example: Example shown in Figure 5.19 represents migration of functionality from onebusiness application to another [Bu08].Type: Structural VBB candidateFormatting: Following format settings may be applied to VBB Migration diagram:
• show/hide vertical gridlines
62
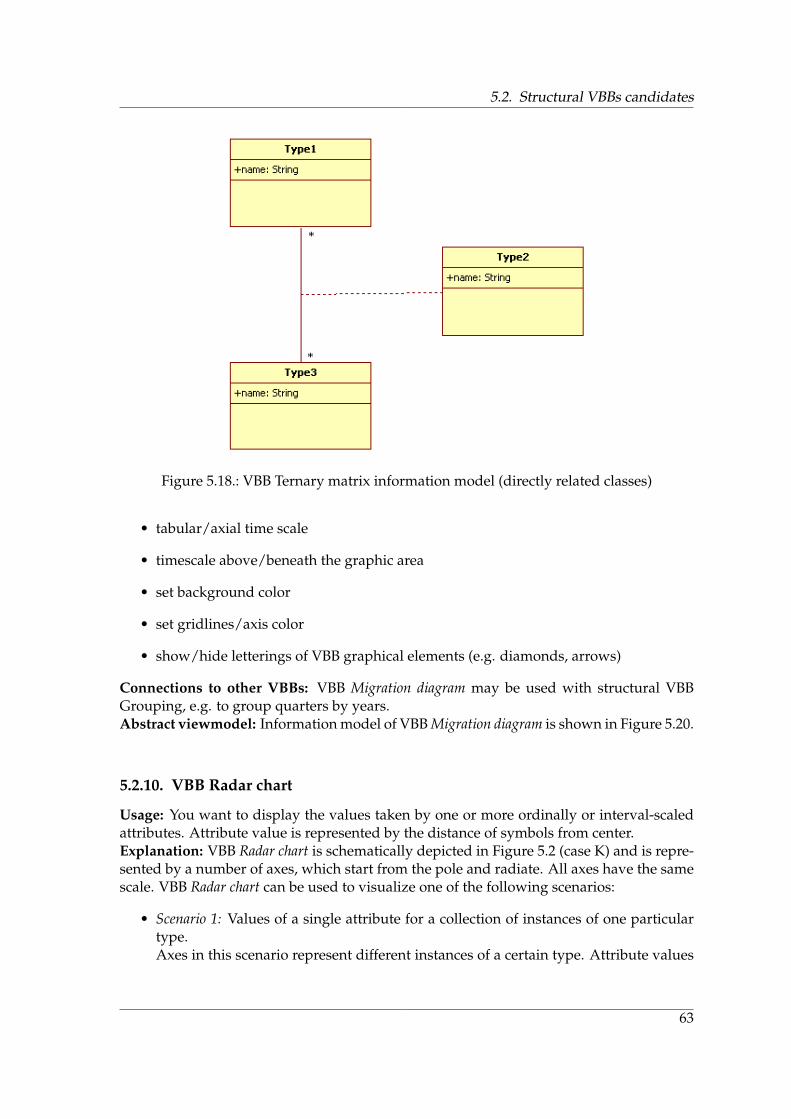
5.2. Structural VBBs candidates
Figure 5.18.: VBB Ternary matrix information model (directly related classes)
• tabular/axial time scale
• timescale above/beneath the graphic area
• set background color
• set gridlines/axis color
• show/hide letterings of VBB graphical elements (e.g. diamonds, arrows)
Connections to other VBBs: VBB Migration diagram may be used with structural VBBGrouping, e.g. to group quarters by years.Abstract viewmodel: Information model of VBB Migration diagram is shown in Figure 5.20.
5.2.10. VBB Radar chart
Usage: You want to display the values taken by one or more ordinally or interval-scaledattributes. Attribute value is represented by the distance of symbols from center.Explanation: VBB Radar chart is schematically depicted in Figure 5.2 (case K) and is repre-sented by a number of axes, which start from the pole and radiate. All axes have the samescale. VBB Radar chart can be used to visualize one of the following scenarios:
• Scenario 1: Values of a single attribute for a collection of instances of one particulartype.Axes in this scenario represent different instances of a certain type. Attribute values
63

5. Extending BEAMS with new viewpoint building blocks candidates
Figure 5.19.: Example of VBB Migration diagram [Bu08])
of a certain instance are represented by symbols, which are positioned on the cor-responding axis. The farther away from the pole the symbol is depicted, the biggerthe attribute value of the corresponding instance is. If scenario 1 is used to interpretVBB Radar chart in Figure 5.2, then u, v, w, x, y and z are instances of a certain type Z:u:Z, v:Z, w:Z, x:Z, y:Z and z:Z, and a is an attribute of type Z, which takes followingvalues by different instances:u.a = y.a = 3v.a = z.a = 1w.a = x.a = 2
• Scenario 2: Values of different attributes for a single instance of one particular type.In this case attributes have to be comparable, i.e. equally scaled. Axes in this sce-nario represent different attributes of a certain instance. Attribute values of these
64

5.2. Structural VBBs candidates
Figure 5.20.: VBB Migration diagram information model
Figure 5.21.: VBB Radar chart of the real-life financial service provider (anonymized) - ex-ample 1
attributes are represented by symbols, which are positioned on the correspondingaxis. The farther away from the pole the symbol is depicted, the bigger the value ofthe corresponding attribute is. If scenario 2 is used to interpret VBB Radar chart inFigure 5.2, then u, v, w, x, y and z are the attributes of a certain instance a of a certaintype A: a:A, which take following values:a.u = a.y = 3a.v = a.z = 1a.w = a.x = 2
65

5. Extending BEAMS with new viewpoint building blocks candidates
• Scenario 3: Values of multiple attributes as taken by a collection of instances of oneparticular type. In this case attributes have also to be comparable. Axes in this sce-nario represent different instances of a certain type. Attribute values of a certain in-stance are represented by symbols, which are positioned on the corresponding axis.To differentiate between different attributes different symbols for their visualizationare used
Example: Example shown in Figure 5.21 and used in finance area of the real-life financialservice provider, visualizes different ordinally scaled status attributes, and thus belongs tothe second scenario. Attributes in this example take only three values:watch (status green)manage (status yellow)act (status red)Each attribute value is represented by a certain symbol for the purpose of expressivenessreinforcement: ”watch” is represented by green rectangle, ”manage” corresponds to yel-low triangle, and ”act” is visualized by red circle.Another example of VBB Radar chart is shown in Figure 5.22 and also represents the secondscenario. Axes of this radar chart designate eight ordinally scaled attributes characterizinga certain tool, which take eight integer values on a scale of 0-7. The difference between thisradar chart and the one considered before is that attribute values are connected with oneanother via line segments, which reinforce the expressiveness of the viewpoint.Type: Structural VBB candidateFormatting: Following format settings may be applied to VBB Radar chart:
• grid switch on/off
• axes switch on/off
• symbols (dots) connected / not connected with line segments
• cells fill color set
• grid color set
Connections to other VBBs: VBB Radar chart is close to the VBB Dot plot from the func-tionality perspective.It may be used in combination with VBB Shape, VBB Color coding and VBB Icon to depictmultiple attributes of the instances.Abstract viewmodel: Information models of VBB Radar chart are identical to the ones ofVBB Dot plot and are shown for each Scenario in Table 5.2.
5.2.11. VBB Regionalization
Usage: You want to visualize some instances of types, relations between them or their at-tributes (also aggregated per region) in geographical context.
66
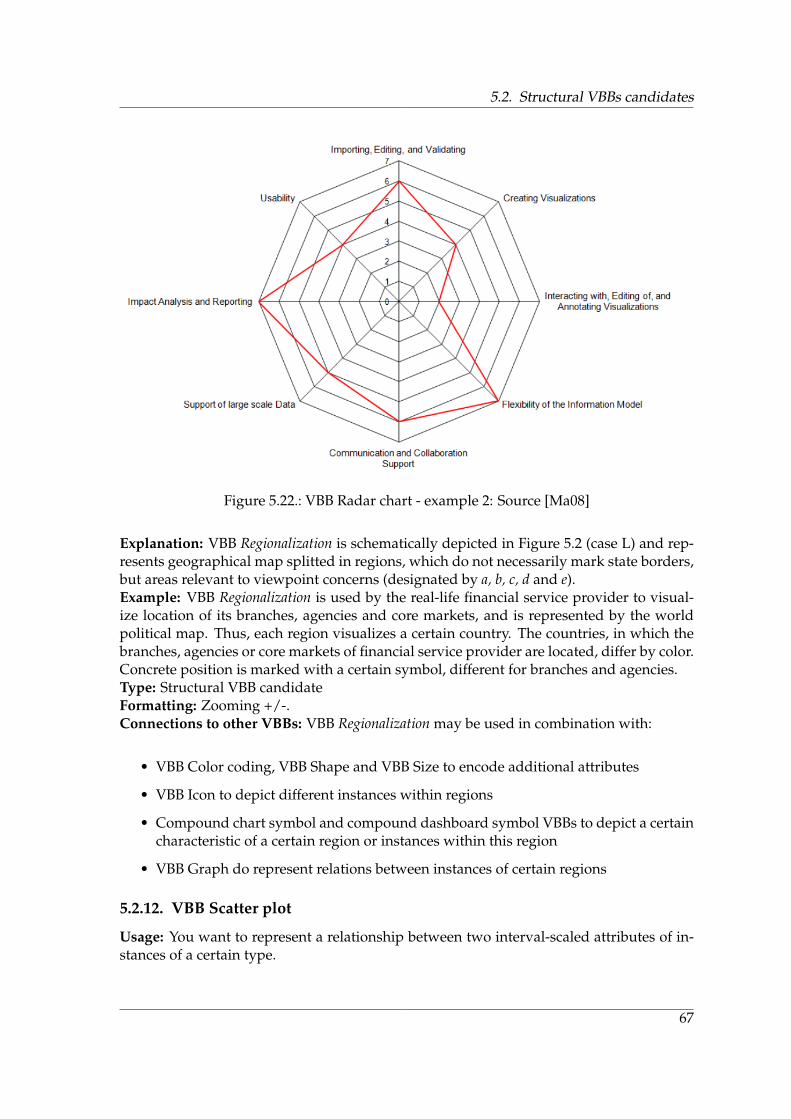
5.2. Structural VBBs candidates
Figure 5.22.: VBB Radar chart - example 2: Source [Ma08]
Explanation: VBB Regionalization is schematically depicted in Figure 5.2 (case L) and rep-resents geographical map splitted in regions, which do not necessarily mark state borders,but areas relevant to viewpoint concerns (designated by a, b, c, d and e).Example: VBB Regionalization is used by the real-life financial service provider to visual-ize location of its branches, agencies and core markets, and is represented by the worldpolitical map. Thus, each region visualizes a certain country. The countries, in which thebranches, agencies or core markets of financial service provider are located, differ by color.Concrete position is marked with a certain symbol, different for branches and agencies.Type: Structural VBB candidateFormatting: Zooming +/-.Connections to other VBBs: VBB Regionalization may be used in combination with:
• VBB Color coding, VBB Shape and VBB Size to encode additional attributes
• VBB Icon to depict different instances within regions
• Compound chart symbol and compound dashboard symbol VBBs to depict a certaincharacteristic of a certain region or instances within this region
• VBB Graph do represent relations between instances of certain regions
5.2.12. VBB Scatter plot
Usage: You want to represent a relationship between two interval-scaled attributes of in-stances of a certain type.
67

5. Extending BEAMS with new viewpoint building blocks candidates
Explanation: VBB Scatter plot is schematically depicted in Figure 5.2 (case M). x-coordinatedepicts values of the first attribute, and y-coordinate represents values of the second at-tribute. Dots in central part of scatter plot represent values combinations of both attributesas taken by the different instances in the collection. All these instances are of one particulartype.Example: As shown in Figure 5.2 (case M), instances a, b, c, d, e, f, g, h, i and j of type Z (a:Z;b:Z; c:Z; d:Z; e:Z; f:Z; g:Z; g:Z; h:Z; i:Z; j:Z) have two attributes x and y. Attributes x and y ofinstance a take values x1 and y1, respectively, and the corresponding dot is placed on theintersection of these two coordinate values.A concrete use of this VBB is demonstrated on the following example: type Z representsclass of projects, whereas instances a, b, c, d, e, f, g, h, i and j express concrete projects. Classof projects has two attributes: x - development effort in man-days, and y - total projectcosts. Figure 5.2 (case M) shows then that development effort for project a is equal to x1man-days, while its total costs are y1.Type: Structural VBB candidateFormatting: Following format settings may be applied to VBB Scatter plot:
• Switch on/off the gridlines
• Fade in/down the axes
• Axes rotation
Connections to other VBBs: VBB Scatter plot may be used in combination with VBB Sizecoding and VBB Color coding to encode additional attributes. VBB Shape coding may beapplied to the dots of scatter plot to encode additionally the instances of other types.Abstract viewmodel: Information model of VBB Scatter plot is shown in Figure 5.23.
Figure 5.23.: VBB Scatter plot information model
5.2.13. VBB Scheduling
Usage: You want to visualize scheduling of activities, dependencies between them andimportant milestones. This VBB is also known as Gantt chart.Explanation: VBB Scheduling is schematically depicted in Figure 5.2 (case N). Header rowof this VBB represents time scale, and its header column shows activities and phases,which combine several subordinate activities under one umbrella activity. Bars placed
68

5.2. Structural VBBs candidates
in the central part of VBB Scheduling represent duration of each individual activity: thelonger the bar is, the longer the corresponding activity lasts. Multiple activities may beperformed simultaneously. Dependencies between activities are represented by arrows,black diamonds visualize milestones, and thick black bars with arrows at the beginningand at the end depict duration of the corresponding phase.Example: Shown in Figure 5.2 (case N) VBB Scheduling represents scheduling of threephases: X, Y and Z, and their subordinated activities x1, x2, x3, z1, z2. t1, t2, t3 and t4,placed in header row, represent time units.Type: Structural VBB candidateFormatting: Following format settings are applicable to VBB Scheduling:
• show/hide grid
• place column headers above/beneath lifecycle diagram
• set cells text color
• set cells frame color
Connections to other VBBs: VBB Scheduling may be used in combination with VBB Shapeand VBB Color coding to differentiate between such graphic elements as milestone (blackdiamond), activity (blue bar) and phase (black bar with arrows on its sides), and VBBArrow to depict dependencies between activities.Abstract viewmodel: Information model of VBB Scheduling is shown in Figure 5.24.
Figure 5.24.: VBB Scheduling information model
69

5. Extending BEAMS with new viewpoint building blocks candidates
Figure 5.25.: VBB Set diagram
5.2.14. VBB Set diagram
Usage: You want to visualize membership of instances of a certain type in collection ofsets. This VBB is also known as Venn diagram.Explanation: VBB Set diagram is schematically depicted in Figure 5.2 (case O). A, B, and Crepresent sets, and x1, x2, x3, x4, x5, x6, x7 and x8 visualize instances of a certain type Z.Four scenarios of instances membership are possible in case of three sets:
• a certain instance belong to only one set, and do not belong to the other two: x1 ∈ A,x2 ∈ B, x3 ∈ C
• a certain instance belong to two sets, and do not belong to remaining third set: x5 ∈(A ∩B), x4 ∈ (B ∩ C), x8 ∈ (A ∩ C)
• a certain instance belong to all three sets: x7 ∈ (A ∩B ∩ C)
• a certain instance do not belong to any of sets: x6 /∈ (A ∪B ∪ C)
Example: VBB Set diagram shown in Figure 5.25 visualizes conformity to a programminglanguage specific corporate standard by distance to center [La08]. a1, a2, a3, a4, a5, a6 anda8 represent business applications, icons l1, l2,l3 and l4 encode programming languages,different business applications are written in. Concentric circles represent sets of instanceswith different values of attribute ”degree of conformity with a specific corporate standard”from 100% (completely conform) to 0% (absolutely non-conform):A1: 76%-100% conform: a1A2: 51%-75% conform: a2, a3, a4A3: 26%-50% conform: a5, a6
70

5.2. Structural VBBs candidates
A4: 0%-25% conform: a8Circles, which represent sets, are concentric according to their nature: instances which are80% conform to a certain standard, are also 60% conform to this standard, and thus belongto both sets A1 and A2.Type: Structural VBB candidateFormatting: Following decorators can be applied to the VBB Set diagram:
• set/remove sets headers
• set fill color of circles
• set circles color
Connections to other VBBs: VBB Set diagram may be used in combination with VBB Shapeand VBB Icon to depict instances of types. This VBB can be used alternatively to non-exclusive VBB Clustering.Abstract viewmodel: Information model of VBB Set diagram is shown in Figure 5.26.
Figure 5.26.: VBB Set diagram information model
5.2.15. VBB Time interval map
Usage: You want to show how instances of a certain type are affected by instances ofanother type in time.Explanation: VBB Time interval map is schematically depicted in Figure 5.2 (case P). Headerrow displays time scale, whereas header column represents instances w, x, y, z of a certaintype Z: w:Z, x:Z, y:Z, z:Z. Instances of type Z affect versions of instances of type A (e.g.a.v3 is a version of instance a and b.v1 is a version of instance b of type A, c.v5 displays aversion of instance c of type A, etc). Here four scenarios are possible:
• Scenario 1: A certain instance of type Z initiates the replacement of a certain versionof a certain instance of type A by another one (e.g. version v3 of instance a of typeA is replaced by version v1 of instance b of type A due to instance w of type Z (seeFigure 5.2))
• Scenario 2: A certain instance of type Z modifies a certain version of instance of typeA (e.g. version v5 of instance c of type A is modified by instance x of type Z (seeFigure 5.2))
71

5. Extending BEAMS with new viewpoint building blocks candidates
Figure 5.27.: Example of time interval map (Source: [Bu08])
• Scenario 3: A certain instance of type Z initiates creation of a certain version of in-stance of type A (e.g. version v1 of instance d of type A is created by instance y oftype Z as shown Figure 5.2)
• Scenario 4: A certain instance of type Z initiates deletion of a certain version of in-stance of type A (e.g. version v7 of instance e of type A is deleted by instance z oftype Z)
VBB Time interval map also differentiates between different lifecycle phases of versions ofinstances, namely: planned, in development, in production and to be retired.Example: Example of VBB Time interval map shown in Figure 5.27 displays how project
72

5.2. Structural VBBs candidates
proposals intend to affect services with time [Bu08]. In this example type Z representsproject proposals, whereas type A displays services.Type: Structural VBB candidateFormatting: Following decorators can be applied to VBB Time interval map:
• show/hide vertical gridlines
• put/remove breaks between horizontal gridlines
• tabular/axial/superscribed time scale
• timescale above/beneath the graphic area
• set background color
• set gridlines/axis color
• show instances names in header column / depict instances names direct on thegraphical elements
Connections to other VBBs: VBB Time interval map is used in combination with VBB Colorcoding to depict different statuses of instances, as well as VBB Shape and VBB Icon todifferentiate between the instances of different types.Abstract viewmodel: Information model of VBB Time interval map is shown in Figure 5.28.
Figure 5.28.: VBB Time interval map information model
5.2.16. Structural VBBs optimization recommendations
After introducing new structural viewpoint building block candidates in previous sub-sections, this subsection briefly reviews existing structural VBBs and makes optimizationproposal on their reorganization.As already mentioned in Subsection 2.3.2, currently 8 structural VBBs are available inBEAMS collection, namely:
73

5. Extending BEAMS with new viewpoint building blocks candidates
• VBB Binary matrix
• VBB Clustering
• VBB Matrix (continuous)
• VBB Ordering
• VBB Recursive clustering
• VBB Swimlane
• VBB Ternary matrix
• VBB Tree diagram
VBBs Binary matrix and VBB Matrix (continuous) should not be considered any more asseparate viewpoint building blocks, as they are included in VBB Matrix as special cases.The same applies to VBB Recursive clustering, as this building block can be also consideredas special case of VBB Clustering along with another two special cases regarded above.VBB Ternary matrix, on the contrary, does not belong to VBB Matrix and its special casesfor the reason that its elements may be stretched out among several rows and columnselements, which is not allowed by VBB Matrix. On the other hand, VBB Ternary matrix inconcept is very similar to VBB Swimlane with the only difference, that its interior instancesare aligned with instances of two other types, and not only one type, as it is in case of VBBSwimlane. For that reason VBB Ternary matrix is better to rename to VBB 2D-Swimlanethat reflects the similarities and differences between these VBBs. Following this, reorga-nized BEAMS structural VBBs collection is shown in Figure 5.29.
Figure 5.29.: Reorganized structural BEAMS VBBs
5.3. Symbol VBBs candidates
During the viewpoints decomposition phase also the need for symbol viewpoints buildingblocks arose, which are not yet available in BEAMS. Although a plurality of additionalsymbols is needed, they all can be categorized in four groups:
• Shapes
74

5.3. Symbol VBBs candidates
• Icons
• Compound chart symbols
• Compound dashboard symbols
Subsections below describe briefly each of these groups and provide detailed specificationof each representative of the groups. Hence not only the introduction of new symbol view-points building blocks candidates, but also the incorporation of existing BEAMS VBBs innew viewpoints building blocks structure are provided.In the same way as for structural VBB candidates symbol VBB candidates descriptionsare based on layout used in [Se11] (see Subsection 2.3.2). Layout sections ”Name”, ”Ex-planation”, ”Examples”, ”Visual variables” and ”Type” are incorporated into viewpointbuilding blocks candidates layout one-to-one. Section ”Usage” for structural VBBs de-scription is used in the same meaning as by structural VBB candidates description (seeSection 5.2). Furthermore, the issue named ”Connections to other VBBs” is described foreach symbol VBB candidate to show which building blocks may be used as a base map forthe candidate under consideration. On the contrary, BEAMS VBBs layout section ”Tags”was omitted in VBBs candidates descriptions.This section concludes with subsection which integrates the existing symbol VBBs into cer-tain groups and gives an overview on extended BEAMS collection of symbol viewpointsbuilding blocks.
5.3.1. Shape
This group includes all shapes identified during the viewpoints decomposition phase,which can be divided into the following building blocks (see Figure 5.30):
• VBB Polygon
• VBB Ellipse
• VBB Rounded rectangle
• VBB Line
• VBB Arrow
Subsections below consider these building blocks in detail.
VBB Polygon
Usage: You want to visualize some instances of types.Explanation: This VBB may be used in combination with structural VBBs to indicate in-stances of certain type, or it can be used as a part of compound symbols. VBB Polygon aswell as its most frequent special cases, among which are triangle, rectangle, square andrhomb, are schematically depicted in Figure 5.31. All special cases are obtained from VBBPolygon by visual variables adjustments
75

5. Extending BEAMS with new viewpoint building blocks candidates
Figure 5.30.: VBBs of the group ”Shape”
Type: Symbol VBB candidateConnections to other VBBs: Different special cases of VBB Polygon are often used in com-bination with VBB Graph and VBB Tree. Its special case Rectangle is a part of VBB Swimlaneand VBB 2D-Swimlane. Another example of use for Rectangle is VBB Bar chart (see SectionVBB Traffic light).Visual variables: In relation to VBB Polygon following visual variables may be used toencode additional information:
• border color
• border style
• border thickness
• fill color
• fill texture
• shape size (side lengths)
• angle sizes
By setting the number of vertices, defining angle sizes, side lengths and shape rotation anyspecial case shown in Figure 5.31 can be generated from VBB Polygon. Special case of VBBPolygon rectangle is already a part of BEAMS collection [Se11].
VBB Ellipse
This VBB is already described in BEAMS [Se11]. It is also important to mention, in rela-tion to VBB Ellipse the same visual variables as by VBB Polygon may be applied to encodeadditional information. This viewpoint building block as well as its special case Circle arevery often used in combination with VBB Graph and VBB Tree in order to depict instancesof particular type. VBB Ellipse is also a constitute part of VBB Traffic light.
76

5.3. Symbol VBBs candidates
Figure 5.31.: VBB Polygon and its special cases
VBB Rounded rectangle
The characteristics of VBB Rounded rectangle are very close to the ones of special case ofVBB Polygon - Rectangle. This VBB is also used to represent some instances of particulartype from EA information model, has very similar cooperative VBBs and the same visualvariables with an additional visual variable: roundness. If the roundness is equal to zero,rounded rectangle transforms into usual rectangle considered within special cases of VBBPolygon.
VBB Line
Usage: You want to visualize relations between some instances of types.Explanation: VBB Line may be used in combination with structural VBBs to indicate rela-tionships between instances of one particular type or different types.Type: Symbol VBB candidateConnections to other VBBs: This VBB is an embedded part of VBB Graph.Visual variables: In relation to VBB Line following visual variables may be used to encodeadditional information:
• line color
• line style
• line thickness
By setting the number of endpoints and their position different polylines as special casesof VBB Line may be defined (see Figure 5.32).
77
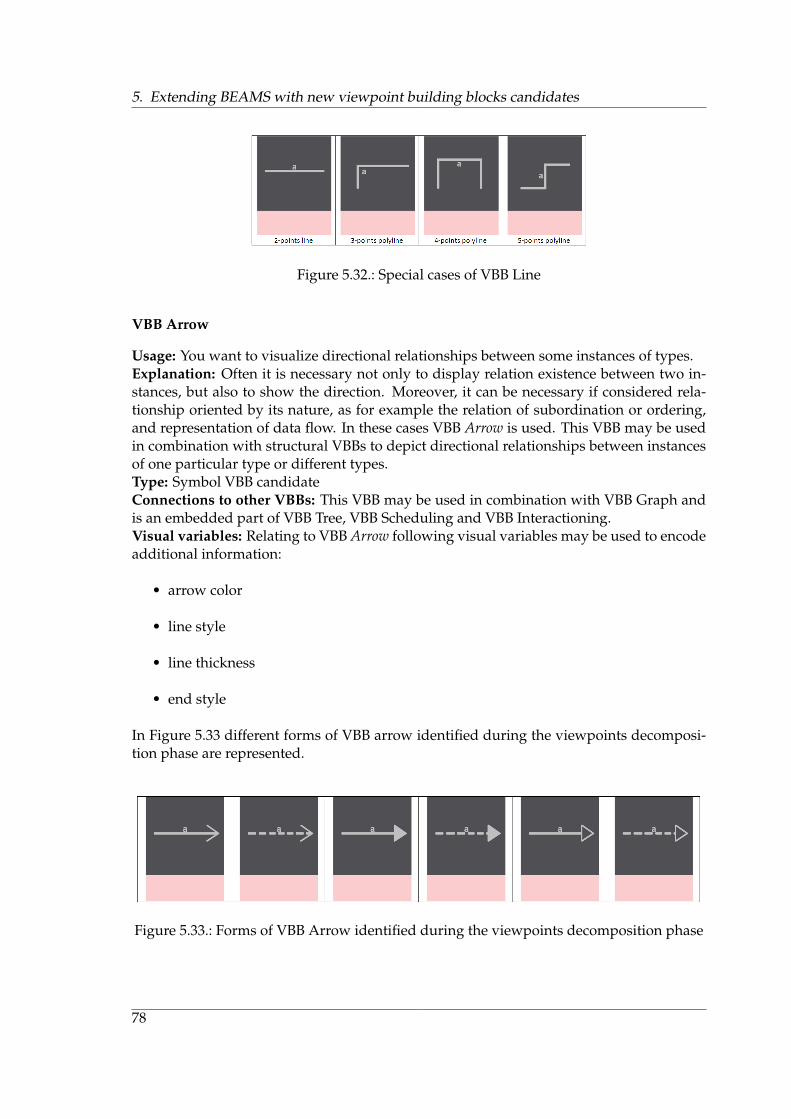
5. Extending BEAMS with new viewpoint building blocks candidates
Figure 5.32.: Special cases of VBB Line
VBB Arrow
Usage: You want to visualize directional relationships between some instances of types.Explanation: Often it is necessary not only to display relation existence between two in-stances, but also to show the direction. Moreover, it can be necessary if considered rela-tionship oriented by its nature, as for example the relation of subordination or ordering,and representation of data flow. In these cases VBB Arrow is used. This VBB may be usedin combination with structural VBBs to depict directional relationships between instancesof one particular type or different types.Type: Symbol VBB candidateConnections to other VBBs: This VBB may be used in combination with VBB Graph andis an embedded part of VBB Tree, VBB Scheduling and VBB Interactioning.Visual variables: Relating to VBB Arrow following visual variables may be used to encodeadditional information:
• arrow color
• line style
• line thickness
• end style
In Figure 5.33 different forms of VBB arrow identified during the viewpoints decomposi-tion phase are represented.
Figure 5.33.: Forms of VBB Arrow identified during the viewpoints decomposition phase
78

5.3. Symbol VBBs candidates
5.3.2. Icon
Usage: You want to visualize some instances of some types and thereby to use symbols,which resemble the instances they are representing.Explanation: Whereas shapes are abstract instance representations, for which it is almostalways necessary to have explanatory legends, VBB Icons usually have a resemblance tothe instances they are representing, and are relatively self-explanatory. Since many authorsand organizations often use their own icon representations, a huge variety of them exist. InFigure 5.34 the most common icons identified during the viewpoints decomposition stepare represented. The last figure ”Icon” signifies the multitude of remaining icons, whichare not considered in detail in this thesis through their specificity.Type: Symbol VBB candidateConnections to other VBBs: This VBB may be used in combination with VBB Matrix, VBBClustering, VBB Graph and VBB 2D-Swimlane.Visual variables: Usually no visual variables are used by VBB Icon to encode additionalinformation, as icons are often depicted as pictures. However, in some cases (e.g., databaseicon, lollipop icon, tick icon, etc.) shown in Figure 5.34 such visual variables as line color,line style, line thickness, fill color and fill texture may be applied.
Figure 5.34.: Most common representatives of VBB Icons detected during the viewpointsdecomposition step
5.3.3. Compound chart symbol
This group includes symbol VBBs composed from a number of simple shapes, which takeon a new meaning being combined in particular way, namely form certain chart. The rep-resentatives of this group are VBB bar chart and VBB pie chart, which are already presentin BEAMS [Se11]. However, during the viewpoints decomposition several special cases ofthese two building blocks have been identified. In Figure 5.35 all new candidates of this
79

5. Extending BEAMS with new viewpoint building blocks candidates
group are shown.
Figure 5.35.: Symbol VBBs: compound chart symbols candidates
VBB Bar chart
VBB Bar chart together with its two special cases, namely VBB Multiple bar chart and VBBBar chart with variable width, are already parts of BEAMS collection and considered in detailin [Se11]. This subsection is concerned with three further special cases of VBB Bar chart:
• VBB Stacked bar chart
• VBB Subset bar chart
• VBB Mirrored bar chart
VBB Stacked bar chartUsage: You want to display the values taken by a certain interval-scaled attribute, andthereby to show how different part attributes contribute to the values of this attribute.Size of a bar chart is further used to display attribute values and contributions of part at-tributes.Explanation: VBB Stacked bar chart is schematically depicted in Figure 5.35 (case A). TheFigure indicates four different values as taken by a certain interval-scaled attribute. Sym-bols labeled a, b, c and d represent instances of a certain type Z (a:Z, b:Z, c:Z and d:Z), wheretype Z has an interval-scaled attribute z, taking values as follows:a.z = 4.0b.z = 5.0c.z = 4.5d.z = 3.0z1, z2 and z3 signify part attributes of attribute z, i.e. represent the same attribute as z, yettaken not for the whole set of elements, but for its subsets. That means that the sum ofpart attribute values of a certain instance is equal to the value of its attribute. Part attributevalues for each instance are represented in a form of stack, which serves as a basis for thename of this VBB candidate. Part attributes shown in Figure 5.35 (case A) take values as
80

5.3. Symbol VBBs candidates
follows:a.z1 = 1.6; a.z2 = 1.4; a.z3 = 1.0→ a.z1 + a.z2 + a.z3 = a.z = 4.0b.z1 = 2.0; b.z2 = 1.8; b.z3 = 1.2→ b.z1 + b.z2 + b.z3 = b.z = 5.0c.z1 = 1.9; c.z2 = 1.4; c.z3 = 1.2→ c.z1 + c.z2 + c.z3 = c.z = 4.5d.z1 = 0.9; d.z2 = 1.1; d.z3 = 1.0→ d.z1 + d.z2 + d.z3 = d.z = 3.0Example: VBB Stacked bar chart is used by the real-life global financial service provider torepresent the following scenario:
• Instances a, b, c, d display organizational units of an enterprise
• Attribute z visualizes activities performed in a certain year in this organization andmeasured in million euro
• Part attributes z1, z2 and z3 represent expenditures for different types of activities:z1 refers to internal projects implemented, z2 depicts volumes of application supportprojects, and z3 shows amount of product maintenance projects.
Type: Symbol VBB candidateConnections to other VBBs: VBB Stacked bar chart may be used in combination with VBBMatrix, VBB Clustering, VBB Graph, VBB Regionalization, VBB Swimlane and VBB 2D-Swimlane to represent additional information of their elements.Visual variables: VBB Color coding is used in combination with VBB Stacked bar chart todifferentiate between its part attributes, and VBB Size coding (length of bars) visualizesattribute and part attribute values.
VBB Subset bar chartUsage:You want to display values taken by a certain interval-scaled attribute, and therebyto highlight a value of particular part attribute of this attribute. Size of a bar chart is usedto display attribute and part attribute values.Explanation: VBB Subset bar chart is schematically depicted in Figure 5.35 (case B). The fig-ure indicates four different values as taken by a certain interval-scaled attribute. Symbolslabeled a, b, c and d represent instances of a certain type Z (a:Z, b:Z, c:Z and d:Z), wheretype Z has an interval-scaled attribute z, taking values as follows:a.z = 4.0b.z = 5.0c.z = 4.5d.z = 3.0z1 signifies part attribute of attribute z, i.e. represent the same attribute as z, yet taken notfor the whole set of elements, but for its certain subset, which should be highlighted. Partattribute is represented within attribute for each instance, and its value is always less thanthe value of attribute for the corresponding instance, as it is calculated for a part of the set.Part attribute z1 shown in Figure 5.35 (case B) takes values as follows:a.z1 = 2.9→ a.z1 < a.z = 4.0b.z1 = 3.7→ b.z1 < b.z = 5.0c.z1 = 1.1→ c.z1 < c.z = 4.5d.z1 = 0.5→ d.z1 < d.z = 3.0Example: VBB Subset bar chart is used by the real-life global financial service provider torepresent the following scenario:
81

5. Extending BEAMS with new viewpoint building blocks candidates
• Instances a, b, c, d display organizational units of an enterprise
• Attribute z visualizes all activities planned for a certain year in this organization andmeasured in million euro
• Part attribute z1 represents the part of planned activities, which is already performed
Type: Symbol VBB candidateConnections to other VBBs: VBB Subset bar chart may be used in combination with VBBMatrix, VBB Clustering, VBB Graph, VBB Regionalization, VBB Swimlane and VBB 2D-Swimlane to represent additional information of their elements.Visual variables: VBB Color coding is used in combination with VBB Subset bar chart tohighlight its part attribute values, and VBB Size coding (length of bars) visualizes attributeand part attribute values.
VBB Mirrored bar chartUsage: You want to visualize values taken by two interval-scaled attributes. Size of a barchart is used to display attribute values.Explanation: VBB Mirrored bar chart, schematically shown in Figure 5.35 (case C), is usedanalogically to another special case of VBB Bar chart, namely VBB Multiple bar chart. Sym-bols labeled a, b, c and d represent instances of type Z (a:Z, b:Z, c:Z and d:Z), where type Zhas two interval-scaled attributes y and z, taking values as follows:a.z = 4.0a.y = 2.5b.z = 5.0b.y = 0.8c.z = 4.5c.y = 0.5d.z = 3.0d.y = 0.8Values of attribute z are represented by the upper bars, whereas values of attribute y aredisplayed by the bars placed under the x-axis.Example: VBB Mirrored bar chart is used by the real-life global financial service provider totrack numbers of ordered personal days involved in projects and application support (z)and product maintenance (y) per month (type Z represent type ”Date”, whereas a, b, c, dare concrete instances of this type, i.e. concrete months of the current year).Type: Symbol VBB candidateConnections to other VBBs: VBB Mirrored bar chart may be used in combination with VBBMatrix, VBB Clustering, VBB Graph, VBB Regionalization, VBB Swimlane and VBB 2D-Swimlane to represent additional information of their elements.Visual variables: VBB Size coding (length of bars) visualizes attribute values.
VBB Pie chart
VBB Pie chart is already included in BEAMS collection and considered in detail in [Se11].This subsection is concerned with its special case VBB Doughnut.
82

5.3. Symbol VBBs candidates
VBB DoughnutUsage: You want to visualize ratios between values taken by one or more interval-scaledattributes. Sector sizes are used to display attribute values.Explanation: VBB Doughnut is schematically shown in Figure 5.35 (case D) and may beused to represent two scenarios:
• Scenario 1: Each ring of VBB Doughnut visualizes a certain instance of type, whereasring sectors represent ratios among interval-scaled attributes of the correspondinginstance
• Scenario 2: Each ring of VBB Doughnut visualizes a certain interval-scaled attributeof type, whereas ring sectors represent ratios among values of the correspondingattribute taken on different instances of type
In principle VBB Doughnut may contain any number of rings. In the case of one ring VBBDoughnut is equivalent to VBB Pie chart in its characteristics.Example:Scenario 1: The rings of VBB Doughnut, shown in Figure 5.35 (case D), represent instancesa and b of type Z (a:Z, b:Z), where type Z has four interval-scaled attributes w, x, y and z,taking values that sum up to 100% as follows:a.w = 40%a.x = 40%a.y = 15%a.z = 5%b.w = 40%b.x = 35%b.y = 18%b.z = 7%In this case each ring of VBB Doughnut visualizes a certain instance of type Z, whereas ringsectors represent ratios between values of different attributes for a certain instance.Scenario 2: In the second scenario the rings of VBB Doughnut visualize attributes a and bof type Z, whereas ring sectors represent ratios among attribute values taken on differentinstances w, x, y and z of type Z (w:Z, x:Z, y:Z and z:Z) as follows: w.a = 40%x.a = 40%y.a = 15%z.a = 5%w.b = 40%x.b = 35%y.b = 18%z.b = 7%VBB Doughnut with only one ring is used by the real-life global financial service providerto visualize number of locations per region (in %). In this case Scenario 2 is used. Instancesw, x, y and z represent the countries, and the whole ring displays values of attribute ”Ratioof locations per region” taken on different values of class ”Region”.Type: Symbol VBB candidateConnections to other VBBs: VBB Doughnut may be used in combination with VBB Matrix,
83

5. Extending BEAMS with new viewpoint building blocks candidates
VBB Clustering, VBB Graph, VBB Regionalization, VBB Swimlane and VBB 2D-Swimlaneto represent additional information of their elements.Visual variables: VBB Size coding (sector sizes) visualizes attribute values. Additionally,VBB Color coding may be used to differentiate between different attributes (Scenario 1) orinstances of type (Scenario 2).
5.3.4. Compound dashboard symbol
This group includes symbol VBBs formed by a number of simple shapes, which take ona new meaning being combined in particular way, namely represent dashboard charts.VBBs of this group are used to visualize status, trend or degree to which a particular itemmeets a particular criterion. They also allow to compare two or more values. Further, it isdistinguished between two types of compound dashboard symbols, namely:
• discrete scaled compound dashboard symbols
• continuously scaled compound dashboard symbols
The representatives of continuously scaled compound dashboard symbols are able to de-pict each value taken by some interval-scaled variable, whereas discrete scaled compounddashboard symbols possess less visual power than number of values of interval-scaledvariable exist, and thus is more appropriate for visualization of ordinally scaled values.If, however, discrete scaled compound dashboard symbols should be used for interval-scaled attribute values representation, a certain transformation of interval-scaled valuesinto ordinally scaled ones should be performed. The transformation implies that certainmultitudes of interval-scaled values are set in correspondence to certain ordinally scaledvalues.Compound dashboard symbol VBBs are shown in Figure 5.36 and are considered in detailin subsequent subsections.
VBB Battery
Usage: You want to visualize key measure relevant for particular objective, business object,business process or technical component.Explanation: VBB Battery belongs to discrete scaled type, takes only three different values,namely full, half-full and empty (see Table 5.9), and is used to visualize ordinally scaledvalues. To be able to use this VBB to visualize interval-scaled values, it is necessary toperform the following transformation. Usually, two values for quantitative key measureare defined: target level and acceptance level. The usage of three different forms of VBBBattery is defined by the following rules:
• If the actual value of a certain KPI is greater/lower than its target value, then emptyVBB Battery is used
• If the actual value of a certain KPI is lower/greater than its target value, but isgreater/lower than its acceptance value, then half-full VBB Battery is used
84

5.3. Symbol VBBs candidates
Figure 5.36.: Symbol VBBs: compound dashboard symbols
• If the actual value of a certain KPI is lower/greater than its acceptance value, thenfull VBB Battery is used
Example: Concrete example of VBB Battery usage is considered by [La08]. This VBB isapplied in combination with VBB Graph and denotes a failure propagation probabilityof the interface’s technical realization. Full battery corresponds to a high failure propa-gation probability, half-full battery represents an average failure propagation probability,and empty battery depicts a low failure propagation probability.Type: Symbol VBB candidateConnections to other VBBs: This VBB may be used in combination with VBB Matrix, VBBClustering, VBB Graph, VBB Swimlane, VBB 2D-Swimlane and VBB Regionalization.Visual variables: No additional visual variables are used.
Table 5.9.: VBB Battery
VBB Bricks
Usage: You want to visualize two or more quantitative key measures for the purpose ofcomparison in such a way that it can be recognized and evaluated at a glance.Explanation: VBB Bricks (see Figure 5.36) visualizes two or more comparable quantitative
85

5. Extending BEAMS with new viewpoint building blocks candidates
key measures by the use of groups of different colored bricks. Thereby, each value is repre-sented by the whole collection of bricks of the corresponding color: the greater the numberof bricks, the greater the value of the corresponding key measure. Bricks shown in Figure5.36 are colored two different colors, and thus depict two different values.As interval-scaled variables to be visualized by this VBB take any value whereas the num-ber of bricks is limited, scaling should be used. Scale s can be calculated by the use of thefollowing formula:
s =vmax − vmin
nbricks
where vmax is the maximal value certain quantitative variable takes, vmin is the minimalvalue of the variable, and nbricks is a number of bricks of particular color corresponding tothis variable. Calculated in this way s is a number of key measure units equivalent to onebrick of the corresponding color. Scale s should be the same for all values within the VBB,otherwise their comparison is not possible.Example: VBB Bricks is used in [Be04] to compare the actual number of incidents with thetarget value (see Figure 5.37). Collection of green bricks depicts the as-is incidents number,whereas collection of rose-colored ones represents to-be value. In this example the scale10 incidents per brick is used. That means, that the actual number of incidents is 70 (as 7green bricks are depicted), whilst target incidents number is 10 (only 1 rose-colored brick).So the actual incidents number is seven times greater then its target.Type: Symbol VBB candidateConnections to other VBBs: This VBB may be used in combination with VBB Clustering,VBB Graph, VBB Swimlane, VBB 2D-Swimlane and VBB Regionalization.Visual variables: Fill color of the bricks is used to differentiate between different key mea-sures values. No additional visual variables are used.
Figure 5.37.: An example of VBB Bricks
VBB Comparing circles
Usage: You want to visualize two comparable interval-scaled key measures being in rela-tion ”one is a part of another” in such a way that it can be recognized and evaluated at aglance.Explanation: VBB Comparing circles (see Table 5.10) visualizes two interval-scaled key mea-sures, one of which is a part of another (part attribute and generalization attribute, respec-tively), by the use of two concentric circles of different colors. Thereby, each value is repre-sented by a circle of the corresponding color: the greater the radius of the circle, the greaterthe value of the corresponding key measure. Part attribute is represented by the smallercircle, whereas generalization attribute is depicted by the bigger one.
86

5.3. Symbol VBBs candidates
This VBB belongs to continuously scaled type, as part attribute can take any value betweenzero and value of generalized attribute. Mapping of attribute values on VBB Comparing cir-cles representations is defined in the following way:
• If the value of the part attribute is equal to zero, the radius of the inner circle is equalto zero as well, i.e. representation of VBB Comparing circles for this extreme caseconsists only from the outer circle
• If the value of the part attribute is equal to the value of the generalization attribute,then the radius of the inner circle is equal to the radius of the outer circle and VBBComparing circles for this extreme case consists solely from the inner circle
• Representations of VBB Comparing circles for remaining values of the part attributeare evenly distributed between aforementioned two extremes
Example: VBB Comparing circles is used to compare the value of total planned budget withthe value of already consumed budget [Be04], thereby the value of consumed budget formsa part of the whole planned budget, i.e the relation ”one is a part of another” between con-sidered two key measures exists.Type: Symbol VBB candidateConnections to other VBBs: This VBB may be used in combination with VBB Clustering,VBB Graph, VBB Swimlane, VBB 2D-Swimlane and VBB Regionalization.Visual variables: Fill color of the circles is used to differentiate between different key mea-sures values, and their size represents the values of key measures. No additional visualvariables are used.
Table 5.10.: VBB Comparing circles: three exemplary values
VBB Harvey balls
Usage: You want to visualize ordinally scaled or interval-scaled key measure relevant forparticular objective, business object, business process or technical component in such away that an overall status can be recognized at a glance.Explanation: VBBs Harvey balls of two types exist: the one with a discrete scale and the onewith a continuous scale. Discrete scaled harvey balls take five forms (see Table 5.11) andare usually used to represent ordinally scaled values of key metrics, whereas continuouslyscaled ones can take any value between completely empty and completely filled circle, andthus visualize interval-scaled values. For both types the amount of filled area corresponds
87

5. Extending BEAMS with new viewpoint building blocks candidates
to the value of key measure. Harvey balls are used to visualize a certain value of just onekey measure.If discrete scaled harvey balls are used, each of five possible harvey balls forms corre-sponds to a certain value of some key metric. If continuously scaled harvey balls are used,a certain kind of scaling should be performed to define which harvey balls form representswhich key metric value. Thereto the minimal value of a certain variable is assigned to com-pletely empty harvey ball, and the maximal value is associated with completely filled one.Representations of values in between are evenly distributed between these two extremes.Example:Example 1: Discrete scaled VBB Harvey balls is used to represent usability of certain busi-ness application. This key measure takes values: very low, low, ordinary, high, very high.Following mapping of the values of usability on VBB Harvey balls representations can beperformed (see Table 5.11):
• very low usability corresponds to empty harvey ball
• low usability corresponds to a quarter-filled harvey ball
• ordinary usability is represented by half-filled harvey ball
• high usability is represented by three-quarter filled harvey ball
• very high usability is represented by completely filled harvey ball
Table 5.11.: Discrete scaled VBB Harvey balls
Example 2: Continuously scaled VBB Harvey balls is used to represent degree of match toa standard for a certain infrastructure component. This key indicator can take any valuefrom 0% to 100%. Following mapping of key indicator values on VBB Harvey balls repre-sentations can be performed (see Table 5.12):
• no match to a standard ( 0% ) is depicted by completely empty harvey ball
• absolute match to a standard (100%) is depicted by completely filled harvey ball
• intermediate values of match to a standard (between 0% and 100%) are representedby partly filled harvey balls with the corresponding amount of filled area
Type: Symbol VBB candidateConnections to other VBBs: This VBB may be used in combination with VBB Matrix, VBBClustering, VBB Graph, VBB Swimlane, VBB 2D-Swimlane and VBB Regionalization.Visual variables: Size of filled sector of a circle is used to differentiate between differentkey measure values. No additional visual variables are used.
88

5.3. Symbol VBBs candidates
Table 5.12.: Continuously scaled VBB Harvey balls: exemplarily values
VBB Progress bar
Usage: You want to visualize degree to which a particular item meets a particular criterionin such a way that not only an overall status can be recognized at a glance, but also aconcrete key measure value is represented.Explanation: VBB Progress bar belongs to continuously scaled type. Visually a certain valueof a certain key measure is represented by arrow position on progress bar scale betweenits maximum and minimum (see Table 5.13). Maximum and minimum are often definedas 100% and 0%, respectively. These are also extreme values of degree variable, which isto be depicted by progress bar.Example: VBB Progress bar is used to represent the progress of particular project (degree ofprojects readiness).Type: Symbol VBB candidateConnections to other VBBs: This VBB may be used in combination with VBB Matrix, VBBClustering, VBB Graph, VBB Swimlane, VBB 2D-Swimlane and VBB Regionalization.Visual variables: Arrow y-coordinate represents the value of key measure. No additionalvisual variables are used.
Table 5.13.: VBB Progress bar: three exemplary values
89
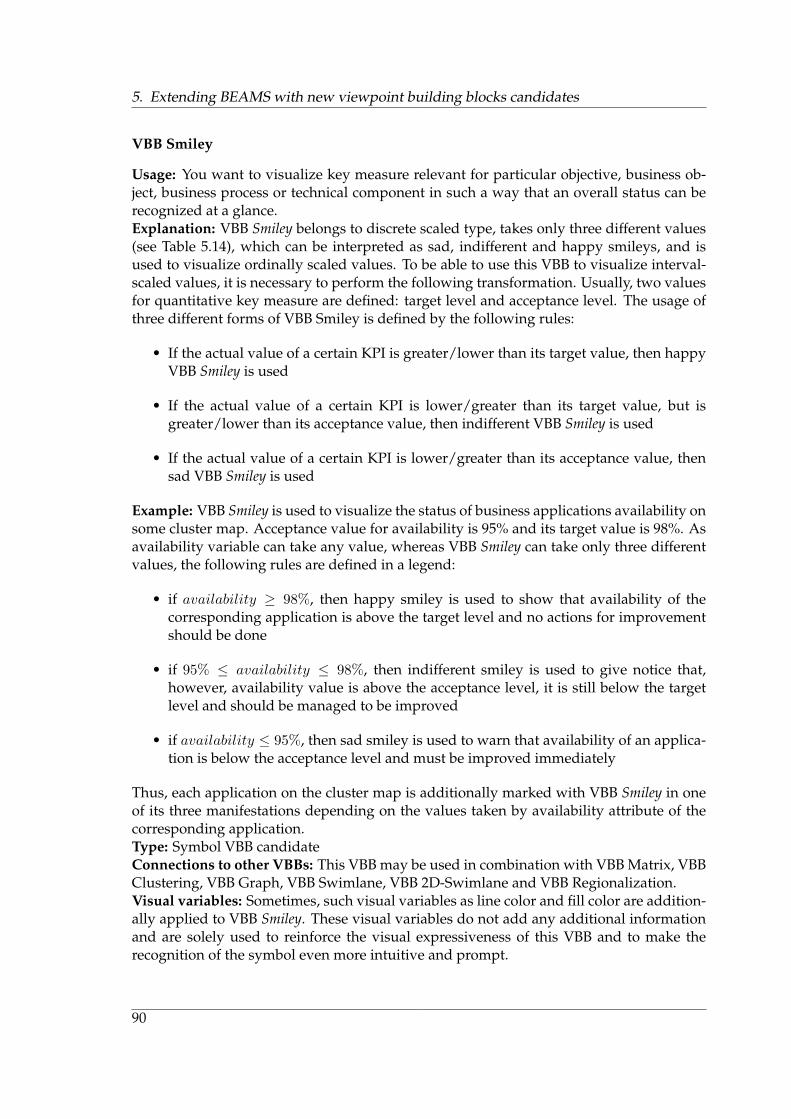
5. Extending BEAMS with new viewpoint building blocks candidates
VBB Smiley
Usage: You want to visualize key measure relevant for particular objective, business ob-ject, business process or technical component in such a way that an overall status can berecognized at a glance.Explanation: VBB Smiley belongs to discrete scaled type, takes only three different values(see Table 5.14), which can be interpreted as sad, indifferent and happy smileys, and isused to visualize ordinally scaled values. To be able to use this VBB to visualize interval-scaled values, it is necessary to perform the following transformation. Usually, two valuesfor quantitative key measure are defined: target level and acceptance level. The usage ofthree different forms of VBB Smiley is defined by the following rules:
• If the actual value of a certain KPI is greater/lower than its target value, then happyVBB Smiley is used
• If the actual value of a certain KPI is lower/greater than its target value, but isgreater/lower than its acceptance value, then indifferent VBB Smiley is used
• If the actual value of a certain KPI is lower/greater than its acceptance value, thensad VBB Smiley is used
Example: VBB Smiley is used to visualize the status of business applications availability onsome cluster map. Acceptance value for availability is 95% and its target value is 98%. Asavailability variable can take any value, whereas VBB Smiley can take only three differentvalues, the following rules are defined in a legend:
• if availability ≥ 98%, then happy smiley is used to show that availability of thecorresponding application is above the target level and no actions for improvementshould be done
• if 95% ≤ availability ≤ 98%, then indifferent smiley is used to give notice that,however, availability value is above the acceptance level, it is still below the targetlevel and should be managed to be improved
• if availability ≤ 95%, then sad smiley is used to warn that availability of an applica-tion is below the acceptance level and must be improved immediately
Thus, each application on the cluster map is additionally marked with VBB Smiley in oneof its three manifestations depending on the values taken by availability attribute of thecorresponding application.Type: Symbol VBB candidateConnections to other VBBs: This VBB may be used in combination with VBB Matrix, VBBClustering, VBB Graph, VBB Swimlane, VBB 2D-Swimlane and VBB Regionalization.Visual variables: Sometimes, such visual variables as line color and fill color are addition-ally applied to VBB Smiley. These visual variables do not add any additional informationand are solely used to reinforce the visual expressiveness of this VBB and to make therecognition of the symbol even more intuitive and prompt.
90

5.3. Symbol VBBs candidates
Table 5.14.: VBB Smiley
VBB Speedometer
Usage: You want to visualize interval-scaled key measure relevant for particular objective,business object, business process or technical component in such a way that not only theoverall status can be recognized at a glance, but also a concrete key measure value is rep-resented.Explanation: VBB Speedometer belongs to continuously scaled type. Visually a certainvalue of a certain key measure is represented by arrow position on speedometer scale be-tween its maximum and minimum (see Table 5.15). The scale of VBB Speedometer is dividedin three segments of different colors (usually green, yellow and red). All values taken bythis VBB (and, of course, also the values taken by the corresponding key measure), arethus categorized in three groups depending on the color of the scale segment, in which thearrow is positioned. Categorization of the scale is performed on the basis of two valuesdefined for the variable, namely target level and acceptance level, in the following way:
• Scale segment between the minimum/maximum and the acceptance level is coloredin red
• Scale segment between the acceptance level and the target level is colored in yellow
• Scale segment between the target level and maximum/minimum is colored in green
Extreme values of the key measure are assigned to the extreme positions of speedometerarrow, and representations of the values in between are evenly distributed between thesetwo extreme arrow positions. VBB Speedometer is used to visualize a certain value for justone key measure.Example: VBB Speedometer is used to represent response time of a certain application. Thiskey indicator can take any value: theoretically from 0s to infinity. However, it is not reason-able to place all these possible values on speedometer scale, even if a certain big numberis taken instead of infinity for maximal value of the measure, because real values usuallytaken by response time variable are near to 0, and thus can not be seen on such a largescale. It would also contradict to reality, where nobody will wait forever waiting for a sys-tem to reply. In this example it is recommended to define the maximum for response timeartificially and assume, that all values taken by response time variable, which are greaterthan this value, are also visualized with the arrow positioned on this maximum. Artifi-cially defined maximum value should be selected in accordance to target and acceptancelevels, so that sizes of the scale categories are comparable with each other. Otherwise it isdifficult to differentiate between visualizations of different values. Target value and accep-tance level are defined for response time as 0,1s and 5s, respectively. Thus, the maximum
91

5. Extending BEAMS with new viewpoint building blocks candidates
for response time scale can be defined as 10s. On the basis of minimum, maximum, targetand acceptance values, scale categorization is performed as follows:
• Scale segment (0s; 0, 1s) is colored in green, which means that the values from thisinterval have a low response time so that the user feel that the system is reactinginstantaneously
• Scale segment (0, 1s; 5s) is colored in yellow, which means that although the usernotices the delay, the limit for the user’s flow of thought is not exceeded
• Scale segment (5s; 10s) (which in reality means a response time greater than 5s) iscolored in red. It means that the limit for keeping user’s attention is exceeded andhe will probably want to perform other tasks rather than wait for the computer tofinish.
Type: Symbol VBB candidateConnections to other VBBs: This VBB may be used in combination with VBB Matrix, VBBClustering, VBB Graph, VBB Swimlane, VBB 2D-Swimlane and VBB Regionalization.Visual variables: Fill color is used to perform speedometer scale categorization, and arroworientation represents the value of the key measure. No additional visual variables areused.
Table 5.15.: VBB Speedometer: three exemplary values
VBB Traffic light
Usage: You want to visualize key measure relevant for particular objective, business ob-ject, business process or technical component in such a way that an overall status can berecognized at a glance.Explanation: VBB Traffic light belongs to discrete scaled type, takes only three differentvalues: red, yellow and green (see Table 5.16), and is used to visualize ordinally scaledvalues. To be able to use this VBB to visualize interval-scaled values, it is necessary toperform the following transformation. Usually, two values for quantitative key measureare defined: target level and acceptance level. The usage of three different forms of VBBTraffic light is defined by the following rules:
• If the actual value of a certain KPI is greater/lower than its target value, then greenVBB Traffic light is used
• If the actual value of a certain KPI is lower/greater than its target value, but isgreater/lower than its acceptance value, then yellow VBB Traffic light is used
92

5.3. Symbol VBBs candidates
• If the actual value of a certain KPI is lower/greater than its acceptance value, thenred VBB Traffic light is used
Example: VBB Traffic light is used to visualize an overall staff workload rate for a certainorganization, i.e. the relation of number of actual working days of employees to the totalnumber of working days in a year. Acceptance value for staff workload rate is 77% andits target value is 82%. As workload rate variable can take any value, whereas VBB Trafficlight can take only three different values, the following rules are defined in a legend:
• if workload ≥ 82%, then green traffic light is used to show that the staff workload isabove the target level and no actions for improvement should be done
• if 77% ≤ workload ≤ 82%, then yellow traffic light is used to give notice that eventhough staff workload rate is above the acceptance level, it is still below the targetlevel and should be managed to be improved
• if workload ≤ 77%, then red traffic light is used to warn that staff workload rate inorganization is below the acceptance level and must be improved immediately
Type: Symbol VBB candidateConnections to other VBBs: This VBB may be used in combination with VBB Matrix, VBBClustering, VBB Graph, VBB Swimlane, VBB 2D-Swimlane and VBB Regionalization.Visual variables: No additional visual variables are used.
Table 5.16.: VBB Traffic light
VBB Trend arrow
Usage: You want to visualize trend for particular key measure in such a way that it can berecognized at a glance.Explanation: VBB Trend arrow belongs to discrete scaled type and takes three different val-ues: head-up, horizontal and head-down (see Table 5.17). This VBB visualizes the trendvalue, calculated on the basis of a key measure value, registered in previous timeframe (orseveral earlier timeframes) and its current value. If the trend value should be calculatedonly for two timeframes (the current and the previous ones), then the trend value t is cal-culated as follows:
t = (vcurrentvprevious
− 1) ∗ 100%
where vcurrent designates the value of the key measure in the current timeframe and vcurrent
93

5. Extending BEAMS with new viewpoint building blocks candidates
represents the value from the previous one.The usage of three different forms of VBB Trend arrow is defined then by the followingrules:
• If t ≥ 0, then up directed arrow is used
• If t = 0, then horizontal arrow is used
• If t ≤ 0, then down directed arrow is used
If the trend value should be calculated for multiple timeframes (e.g. to show an overalltrend from the beginning of the year or since several years) linear regression may be usedto construct a regression line. In this case representations of VBB Trend arrow are definedin the following way:
• If angle α between regression line and positive x-axis is acute, then up directed arrowis used
• If regression line is parallel to the x-axis, then horizontal arrow is used
• If angle α between regression line and positive x-axis is obtuse, then up directedarrow is used
VBB Trend arrow is used to visualize a trend for just one key measure.Example: VBB Trend axis is used to visualize the trend for project costs key measure. Theactual costs of projects sum up to 150 million euro, and project costs in previous monthamount to 100 million euro.
t = (150
100− 1) ∗ 100% = 50%
As t ≥ 0, directed up arrow is used to show that the trend is positive in comparison withthe previous month in a sense that project costs increased since last month. VBB Trend donot give any estimations of the actual status and only shows the trend of the key measurevalues. Project costs status in this example got rather worse in a result of costs increase.Type: Symbol VBB candidateConnections to other VBBs: This VBB may be used in combination with VBB Matrix, VBBClustering, VBB Graph, VBB Swimlane, VBB 2D-Swimlane and VBB Regionalization.Visual variables: Arrow orientation represents the trend value of a certain key measure.Fill color may be additionally used to depict the status of current key measure value, e.g.green in case the target value is achieved, yellow if current value is between the target andthe acceptance levels, and red in case it is below the acceptance level.
5.3.5. Symbol VBBs optimization recommendations
After introducing the groups of symbol viewpoints building blocks and new VBB can-didates in previous subsections, this subsection briefly reviews symbol VBBs already in-cluded in BEAMS collection and makes proposal on their reorganization and integration
94

5.3. Symbol VBBs candidates
Table 5.17.: VBB Trend arrow
in symbol VBBs groups introduced above.As already listed in Subsection 2.3.2, currently 4 symbol VBBs are available in BEAMScollection, namely:
• VBB Bar chart
• VBB Ellipse
• VBB Pie chart
• VBB Rectangle
VBB Bar chart and VBB Pie chart together with their special cases form the group of com-pound chart symbols, whereas VBB Ellipse is a representative of the group of shapes. VBBRectangle is considered as a special case of VBB Polygon.
95

5. Extending BEAMS with new viewpoint building blocks candidates
96

6. Summary and Outlook
This chapter summarizes the findings of this work and gives an outlook on future researchpossibilities that can build on the results of this thesis.
6.1. Summary
In this work reorganization and extension of BEAMS viewpoint building blocks frame-work was suggested based on the Viewpoint Catalog collected from theory and practice inthe field of EA management.The first chapter of this thesis provides an introduction to the topic of EA management,explains its significance in the context of contemporary rapid development and increas-ing role of information technology in business, and highlights importance of visual as-pect within EA management function realization. On the other hand, Chapter 1 revealsthe problems of plethora of existing literature and approaches in the field as well as lackof uniform terminology, the modern research in the area of EA management has to dealwith, and introduces best-practice BEAMS approach, recently developed on sebis chairof the Technische Universitat Munchen in order to address these research problems. Fi-nally, Chapter 1 formulates the goal of the thesis, which consists in applying and evolvingBEAMS viewpoint buildings blocks framework, and outlines the structure of the thesis.Chapter 2 introduces theoretical foundations of the work by considering the topic of EAmanagement in Section 2.1 and providing terminological basis of this thesis according tothe definitions of ISO standard in Section 2.2, and discusses two best-practice approachesfor visualizations in the area of EA management in Section 2.3, namely Enterprise Ar-chitecture Management Pattern Catalog (EAMPC) and Building Blocks for Enterprise Ar-chitecture Management Solutions (BEAMS). The section briefly describes motivations ofthese approaches, their structure and use, with particular focus on visualization aspect,and concludes with an overview of viewpoint building blocks available in BEAMS collec-tion as well as a detalization of layout fields used for their description.Chapter 3 provides an overview on viewpoints collected from EA management related ar-eas such as business intelligence, which goes into practice areas of EA management, datamining, that provides technical solutions for EA management related scope, urban plan-ning, often used as a metaphor for it, as well as from classic literature on data visualization.Chapter 4 is concerned with Viewpoint Catalog construction, collecting viewpoints fromtheory and practice. Section 4.1 is focused on the theoretical part of the Viewpoint Catalog,which was constituted based on results of explorative literature analysis in the field of EAmanagement, and gives an overview on the literature that deals with the problem area,and thus was used for the construction of the catalog. Section 4.2 describes the conductedcase study for the practical part of the Viewpoint Catalog and introduces involved enter-prise. Viewpoints from both theoretical and practical parts of the Viewpoint Catalog are
97

6. Summary and Outlook
decomposed in Section 4.3 into nonintersecting modular components, so called viewpointcatalog building blocks (VCBB). The section explains the principles used in the course ofdecomposition process and illustrates this process on concrete examples. Complete list ofdecomposed viewpoints, together with the corresponding VCBBs, may be found in Ap-pendix A for EA management viewpoints from theory and Appendix B for viewpointsobtained in the course of case study by the real-life global financial service provider.Based on the outcomes from decomposition process, Chapter 5 analyzes in Section 5.1BEAMS VBBs participation in this process and states that BEAMS VBBs collection is in-cluded in the set of VCBBs. Sections 5.2 and 5.3 use VCBBs distinct from VBBs as a ba-sis for extension of structural and symbol BEAMS VBBs, respectively, and describe newBEAMS VBBs candidates in detail based on layout of BEAMS viewpoint building blocks.Reorganized and extended BEAMS VBBs collection is shown in Figure 6.1.
Figure 6.1.: BEAMS VBBs collection reorganized and extended with new viewpoint build-ing block candidates
98

6.2. Outlook
6.2. Outlook
This thesis provides the first step in the direction of BEAMS VBBs evaluation and evolve-ment by ascertaining viewpoint building blocks candidates from theory and practice ob-served in the field of EA management. However, practical significance of each buildingblock candidate should be initially proven, as it should be observed at least three timesbefore it can be included in BEAMS best-practice collection. Thus, further observations ofnew candidates have to be made with the prospect to include them into BEAMS.On the other hand, viewpoints for Viewpoint Catalog construction, further used as a ba-sis for BEAMS VBBs reorganization and extension, were collected from a limited numberof sources: the outcomes of the case study performed in just one organization, as wellas solely the findings from selected literature sources on EA management, were used todevelop BEAMS knowledge base. Thus, the further prospect of this thesis is to broadensearch possibilities for building block candidates identification.Additionally, evaluation and extension of BEAMS building blocks is not a one-time-onlyinitiative, but the recurrent one according to BEAMS nature of best-practice solutions.Rapid development of information systems, as well as permanent increase of IT complex-ity in enterprise, foster visualization techniques development used to support EA manage-ment function realization by providing transparency and enhancing communication andcollaboration between different stakeholders. Thus, it is recommended to review view-points from theory and practice periodically in order to complement BEAMS collectionwith up-to-date best-practice solutions, and in this way to maintain it at the state of the artlevel.
99

6. Summary and Outlook
100

Appendix
101


A. Decomposition of viewpoints found in EAmanagement literature
Viewpoint Decomposition into building blocks VBB candidates
1
[Bu08, Ma08]
2
[Bu08]
Symbol VBBs →Shapes → VBBPolygon
3
[La08]
Structural VBBs→VBB Line chart
4
[Ma08]
Structural VBBs→ VBB Scatterplot
103

A. Decomposition of viewpoints found in EA management literature
Viewpoint Decomposition into building blocks VBB candidates
5
[Ma08]
1.Structural VBBs→ VBB Scatterplot2.Symbol VBBs→ Shapes→ VBBPolygon
6
[Bu08, Ma08, Wi07]
Structural VBBs→ VBB Scatterplot
7
[Be04, Ma08]
8
[La08, Ma08]
1.Structural VBBs→ VBB Radarchart2.Symbol VBBs→ Shapes→ VBBLine
104

Viewpoint Decomposition into building blocks VBB candidates
9
[Wi07]
1.Structural VBBs→ VBB Radarchart2.Symbol VBBs→ Shapes→ VBBLine
10
[La08]
1.Structural VBBs→ VBB Set dia-gram2.Symbol VBBs→ Shapes→ VBBPolygon3.Symbol VBBs→ VBB Icon
11
[Se05]
1.Structural VBBs→ VBB Cluster-ing: special case2.Symbol VBBs→ Shapes→ VBBPolygon
12
[Bu08, Ma08, Wi07]
105

A. Decomposition of viewpoints found in EA management literature
Viewpoint Decomposition into building blocks VBB candidates
13
[Wi07]
Symbol VBBs →Symbol VBBs →Shapes → VBBPolygon
14
[Wi07]
15
[La08]
16
[Be04, Se05, Wi07]
17
[Wi07]
Structural VBBs→ VBB Graph
106

Viewpoint Decomposition into building blocks VBB candidates
18
[Bu08, La08, Ma08,Wi07]
19
[La08, Wi07]
20
[La08, Ma08]
21
[Se05]
Symbol VBBs →VBB Icon→ Database
107
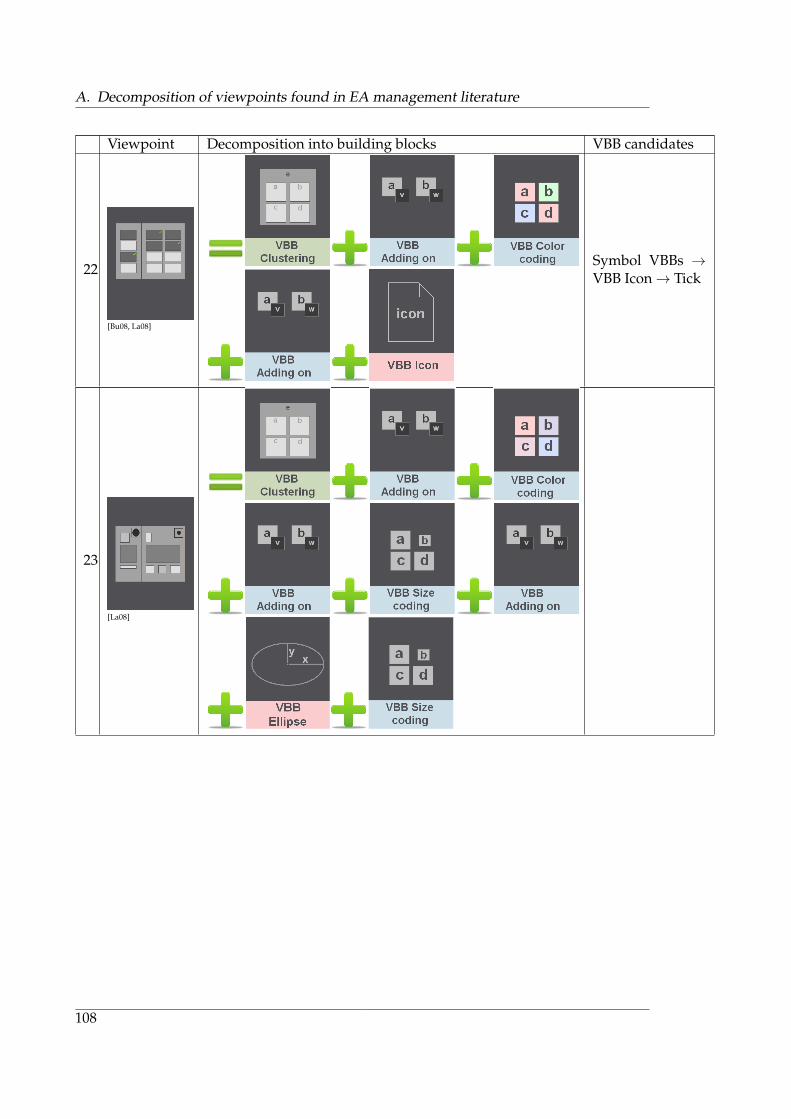
A. Decomposition of viewpoints found in EA management literature
Viewpoint Decomposition into building blocks VBB candidates
22
[Bu08, La08]
Symbol VBBs →VBB Icon→ Tick
23
[La08]
108

Viewpoint Decomposition into building blocks VBB candidates
24
[Wi07]
25
[Bu08, Ma08]
Symbol VBBs →VBB Icon→ Database
26
[Be04, La08, Ma08,Wi07]
Symbol VBBs →Compound dash-board symbols→VBB Traffic light
109

A. Decomposition of viewpoints found in EA management literature
Viewpoint Decomposition into building blocks VBB candidates
27
[Se05]
Symbol VBBs →Compound dash-board symbols→VBB Traffic light
28
[Ma08, Wi07]
Symbol VBBs →Compound dash-board symbols→VBB Traffic light
29
[Ma08]
110

Viewpoint Decomposition into building blocks VBB candidates
30
[Be04]
Symbol VBBs →Compound dash-board symbols→VBB Bricks
31
[Be04]
Symbol VBBs →Compound dash-board symbols→VBB Smiley
32
[Be04]
Symbol VBBs →Compound dash-board symbols→VBB Comparingcircles
111

A. Decomposition of viewpoints found in EA management literature
Viewpoint Decomposition into building blocks VBB candidates
33
[Ma08]
Symbol VBBs →VBB Icon→ Database, Bars
34
[La08]
Structural VBBs→ VBB Graph
112

Viewpoint Decomposition into building blocks VBB candidates
35
[Bu08, Wi07]
1.Structural VBBs→ VBB Graph2.Symbol VBBs→ Shapes→ VBBArrow
36
[Bu08, Ma08]
1.Symbol VBBs→ VBB Icon →Lollipop2.Structural VBBs→ VBB Graph
113

A. Decomposition of viewpoints found in EA management literature
Viewpoint Decomposition into building blocks VBB candidates
37
[Bu08, Ma08]
1.Symbol VBBs→ VBB Icon →Lollipop2.Structural VBBs→ VBB Graph3.Symbol VBBs→ Shapes→ VBBPolygon
38
[Ma08]
39
[Bu08, Ma08]
Structural VBBs→ VBB Matrix
40
[Bu08, La08, Ma08,Wi07]
Structural VBBs→ VBB Matrix
114

Viewpoint Decomposition into building blocks VBB candidates
41
[Bu08, Ma08]
1.Structural VBBs→ VBB Matrix2.Symbol VBBs→ Shapes→ VBBArrow3.Symbol VBBs→ Shapes→ VBBPolygon
42
[Ma08, Se05, Wi07]
Structural VBBs→ VBB Matrix
43
[Bu08]
1.Structural VBBs→ VBB Matrix2.Symbol VBBs→ Shapes→ VBBPolygon
44
[Ma08]
Structural VBBs→ VBB Graph
115

A. Decomposition of viewpoints found in EA management literature
Viewpoint Decomposition into building blocks VBB candidates
45
[Ma08]
1.Symbol VBBs→ VBB Icon2.Structural VBBs→ VBB Graph
46
[Ma08]
1.Symbol VBBs→ Shapes→ VBBPolygon1.Symbol VBBs→ VBB Icon2.Structural VBBs→ VBB Graph
47
[Ma08]
1.Symbol VBBs→ VBB Icon2.Structural VBBs→ VBB Graph
116

Viewpoint Decomposition into building blocks VBB candidates
48
[Ma08]
1.Symbol VBBs→ VBB Icon2.Structural VBBs→ VBB Graph
49
[Bu08, La08]
Symbol VBBs→ VBB Icon →Chevron
50
[Ma08, Se05, Wi07]
1.Structural VBBs→ VBB Grouping2.Symbol VBBs→ VBB Icon →Chevron
117
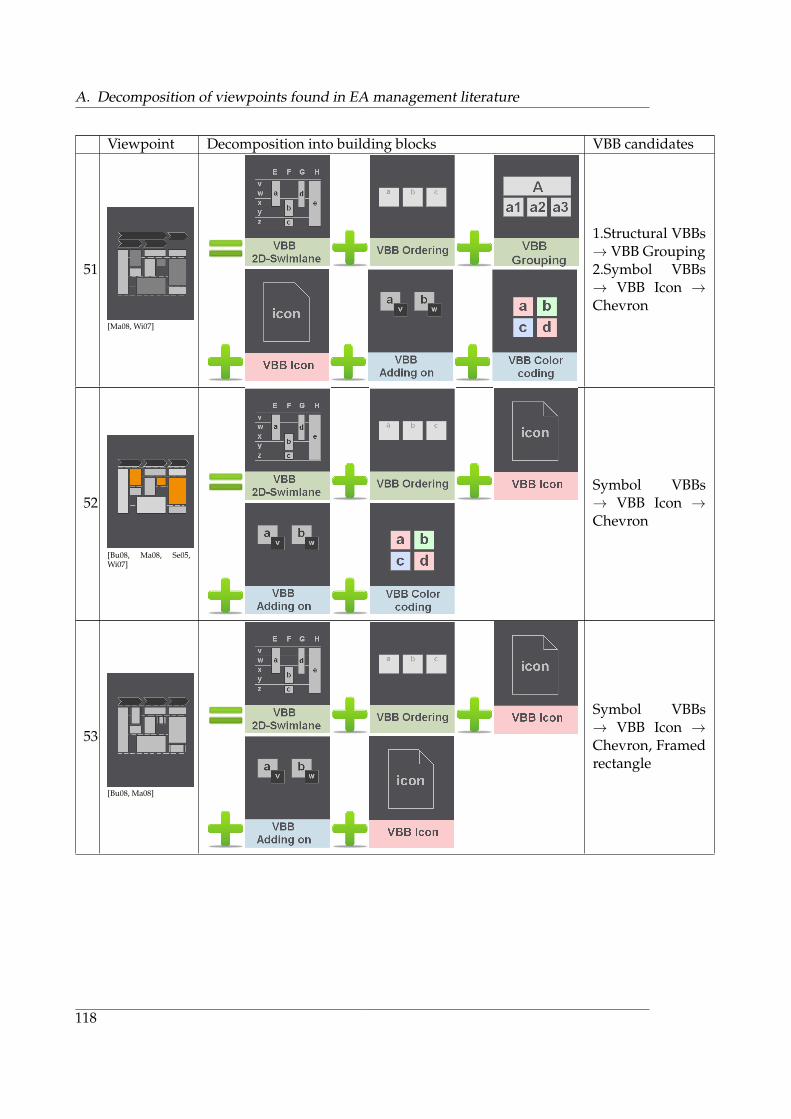
A. Decomposition of viewpoints found in EA management literature
Viewpoint Decomposition into building blocks VBB candidates
51
[Ma08, Wi07]
1.Structural VBBs→ VBB Grouping2.Symbol VBBs→ VBB Icon →Chevron
52
[Bu08, Ma08, Se05,Wi07]
Symbol VBBs→ VBB Icon →Chevron
53
[Bu08, Ma08]
Symbol VBBs→ VBB Icon →Chevron, Framedrectangle
118
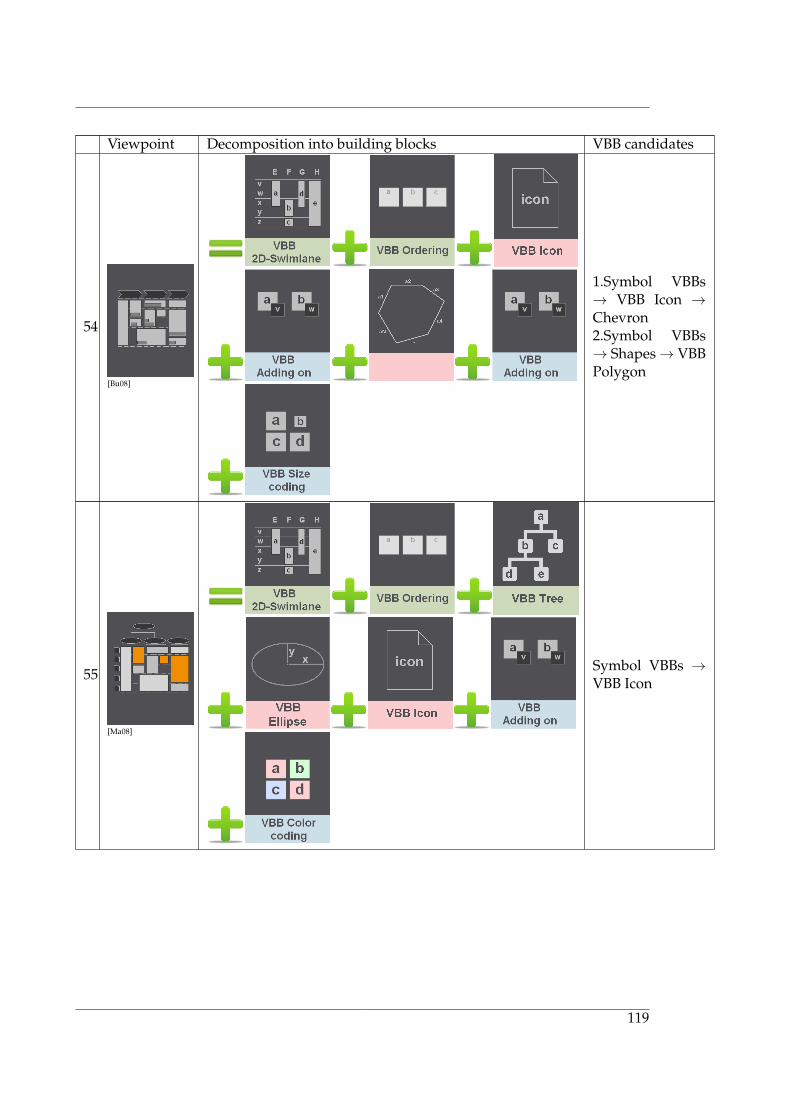
Viewpoint Decomposition into building blocks VBB candidates
54
[Bu08]
1.Symbol VBBs→ VBB Icon →Chevron2.Symbol VBBs→ Shapes→ VBBPolygon
55
[Ma08]
Symbol VBBs →VBB Icon
119

A. Decomposition of viewpoints found in EA management literature
Viewpoint Decomposition into building blocks VBB candidates
56
[Ma08]
Symbol VBBs→ VBB Icon →Chevron
57
[Ma08]
Symbol VBBs →Shapes → VBBRounded rectan-gle
120
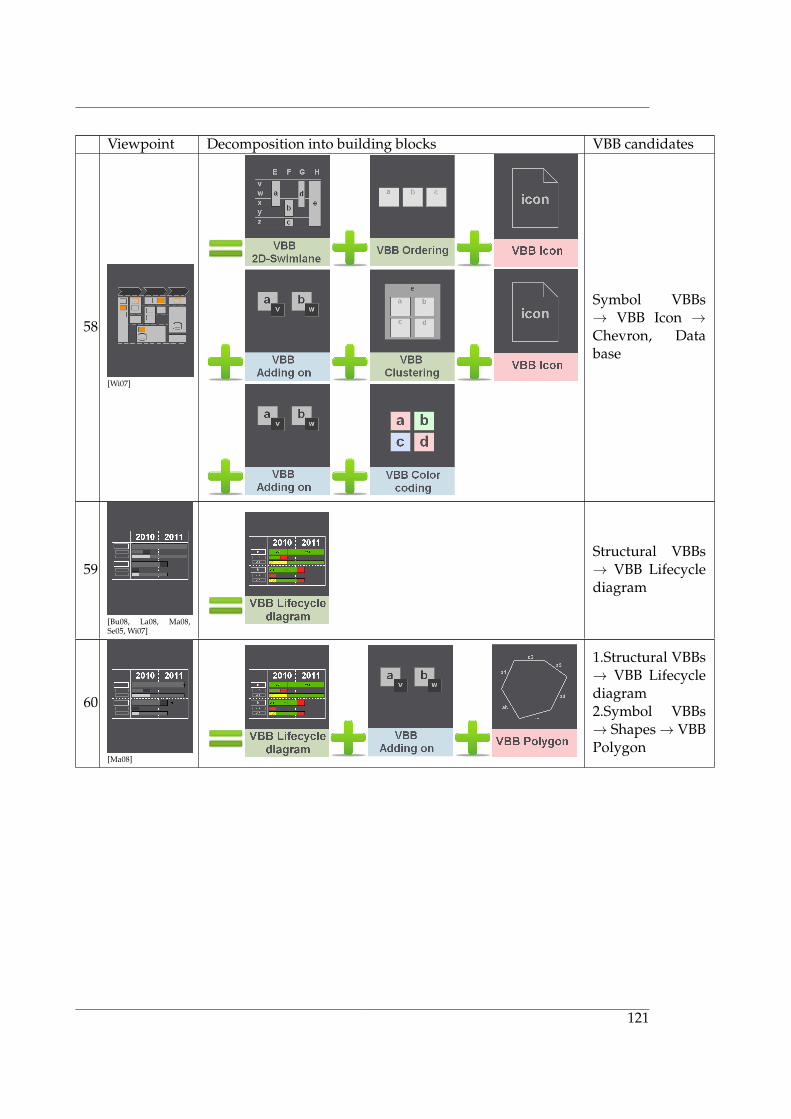
Viewpoint Decomposition into building blocks VBB candidates
58
[Wi07]
Symbol VBBs→ VBB Icon →Chevron, Database
59
[Bu08, La08, Ma08,Se05, Wi07]
Structural VBBs→ VBB Lifecyclediagram
60
[Ma08]
1.Structural VBBs→ VBB Lifecyclediagram2.Symbol VBBs→ Shapes→ VBBPolygon
121

A. Decomposition of viewpoints found in EA management literature
Viewpoint Decomposition into building blocks VBB candidates
61
[Ma08]
Structural VBBs→ VBB Lifecyclediagram
62
[Bu08]
Structural VBBs→ VBB Lifecyclediagram
63
[Bu08, Ma08]
Structural VBBs→VBB Migrationdiagram
64
[Bu08]
Structural VBBs→ VBB Timeinterval map
65
[Bu08]
Structural VBBs→ VBB Interac-tioning
122

Viewpoint Decomposition into building blocks VBB candidates
66
[Ma08]
1.Structural VBBs→ VBB Graph2.Symbol VBBs→ Shapes→ VBBPolygon
67
[Ma08]
1.Structural VBBs→ VBB Graph2.Symbol VBBs→ Shapes→ VBBPolygon
68
[La08,Ma08, Wi07]
1.Structural VBBs→ VBB Graph2.Symbol VBBs→ Shapes→ VBBArrow
69
[Ma08]
1.Structural VBBs→ VBB Graph2.Symbol VBBs→ VBB Icon →Framed rectangle3.Symbol VBBs→ Shapes→ VBBPolygon4.Symbol VBBs→ Shapes→ VBBArrow
123

A. Decomposition of viewpoints found in EA management literature
Viewpoint Decomposition into building blocks VBB candidates
70
[La08]
1.Structural VBBs→ VBB Graph2.Symbol VBBs→ VBB Icon →Chevron, Lol-lipop, Depressedlollipop3.Symbol VBBs→ Shapes→ VBBPolygon
124

Viewpoint Decomposition into building blocks VBB candidates
71
[La08]
1.Structural VBBs→ VBB Graph2.Symbol VBBs→ VBB Icon →Chevron, Lol-lipop, Depressedlollipop3.Symbol VBBs→ Shapes→ VBBPolygon4.Symbol VBBs→ Compounddashboard sym-bols → VBBBattery
72
[Ma08]
1.Structural VBBs→ VBB Graph2.Symbol VBBs→ VBB Icon3.Symbol VBBs→ Compounddashboard sym-bols → VBBTraffic light
125

A. Decomposition of viewpoints found in EA management literature
Viewpoint Decomposition into building blocks VBB candidates
73
[Bu08]
1.Structural VBBs→ VBB Graph2.Symbol VBBs→ Shapes→ VBBPolygon
74
[Bu08]
1.Structural VBBs→ VBB Cluster-ing: special case2.Symbol VBBs→ VBB Icon →ArchiMate
126

Viewpoint Decomposition into building blocks VBB candidates
75
[Bu08]
1.Structural VBBs→ VBB Cluster-ing: special case2.Symbol VBBs→ VBB Icon →ArchiMate3.Symbol VBBs→ Shapes→ VBBArrow
127
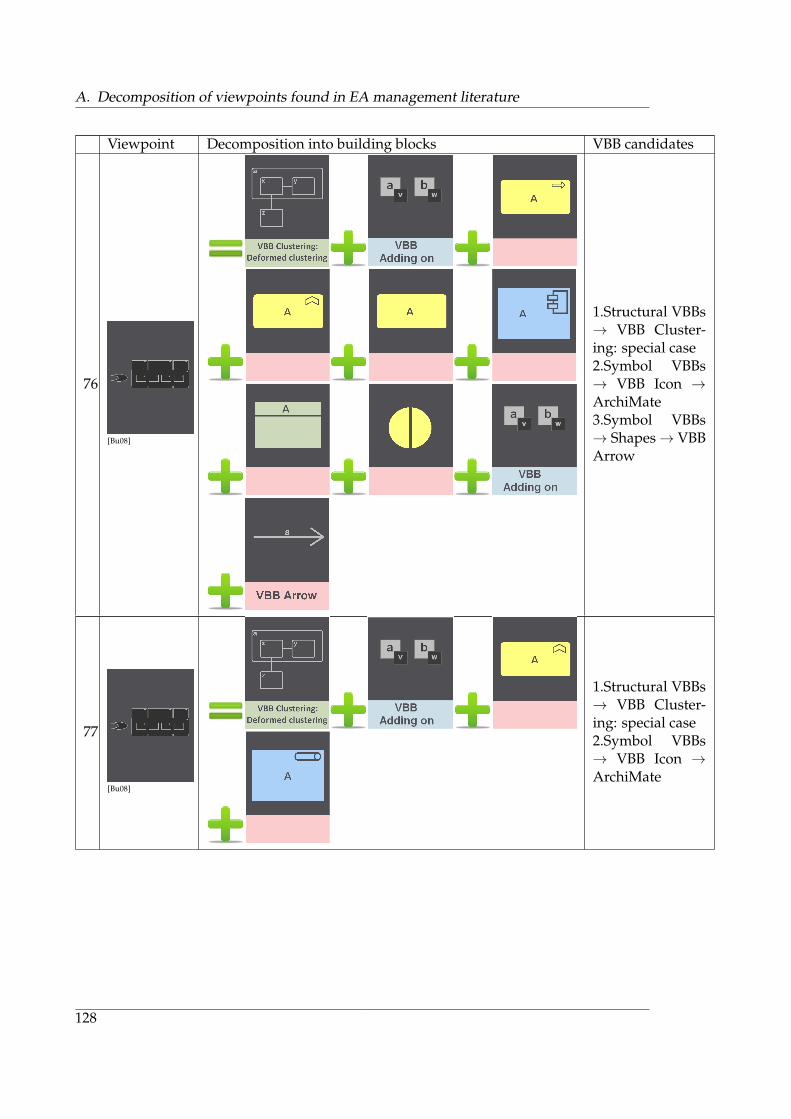
A. Decomposition of viewpoints found in EA management literature
Viewpoint Decomposition into building blocks VBB candidates
76
[Bu08]
1.Structural VBBs→ VBB Cluster-ing: special case2.Symbol VBBs→ VBB Icon →ArchiMate3.Symbol VBBs→ Shapes→ VBBArrow
77
[Bu08]
1.Structural VBBs→ VBB Cluster-ing: special case2.Symbol VBBs→ VBB Icon →ArchiMate
128

Viewpoint Decomposition into building blocks VBB candidates
78
[Bu08]
1.Structural VBBs→ VBB Cluster-ing: special case2.Symbol VBBs→ VBB Icon →ArchiMate3.Symbol VBBs→ Shapes→ VBBArrow
79
[Se05]
Symbol VBBs →Compound dash-board symbol →VBB Harvey ball
Table A.1.: Decomposition of viewpoints found in EA management literature
129

A. Decomposition of viewpoints found in EA management literature
130

B. Decomposition of viewpoints ascertainedin the course of case study
Viewpoint Decomposition into building blocksNew VBB candi-dates
1Symbol VBBs →Shapes → VBBPolygon
2
Symbol VBBs →Compound dash-board symbols→VBB Trend arrow
3
Symbol VBBs →Compound dash-board symbols→VBB Trend arrow
4
Symbol VBBs→ Compounddashboard sym-bols → VBBSpeedometer
5
131

B. Decomposition of viewpoints ascertained in the course of case study
Viewpoint Decomposition into building blocksNew VBB candi-dates
6
7
Symbol VBBs →Compound chartsymbols → VBBBar chart → VBBStacked bar chart
8Structural VBBs→VBB Line chart
9
1.Structural VBBs→ VBB Dot plot2.Symbol VBBs→ Shapes→ VBBPolygon
10
Symbol VBBs →Compound chartsymbols → VBBBar chart → VBBSubset bar chart
132

Viewpoint Decomposition into building blocksNew VBB candi-dates
11Structural VBBs→VBB Line chart
12
Symbol VBBs →Compound chartsymbols → VBBBar chart → VBBStacked bar chart
13
1.Symbol VBBs→ Compoundchart symbols →VBB Bar chart →VBB Stacked barchart2.Symbol VBBs→ Compoundchart symbols →VBB Bar chart →VBB Subset barchart3.Structural VBBs→ VBB Dot plot4.Symbol VBBs→ Shapes→ VBBPolygon
133

B. Decomposition of viewpoints ascertained in the course of case study
Viewpoint Decomposition into building blocksNew VBB candi-dates
14
1.Symbol VBBs→ Compoundchart symbols →VBB Bar chart →VBB Stacked barchart2.Structural VBBs→ VBB Dot plot3.Symbol VBBs→ Shapes→ VBBPolygon
15
1.Symbol VBBs→ Compoundchart symbols →VBB Bar chart→ VBB Mirroredbar chart2.Symbol VBBs→ Compoundchart symbols →VBB Bar chart →VBB Stacked barchart3.Structural VBBs→VBB Line chart
16
134

Viewpoint Decomposition into building blocksNew VBB candi-dates
17
Symbol VBBs →Compound chartsymbols → VBBBar chart → VBBStacked bar chart
18
Symbol VBBs →Compound chartsymbols → VBBBar chart → VBBStacked bar chart
19
135

B. Decomposition of viewpoints ascertained in the course of case study
Viewpoint Decomposition into building blocksNew VBB candi-dates
20
1.Symbol VBBs→ Compoundchart symbols →VBB Bar chart →VBB Stacked barchart2.Symbol VBBs→ Compounddashboard sym-bols → VBBTrend arrow
21
Symbol VBBs →Compound dash-board symbols→VBB Trend arrow
136

Viewpoint Decomposition into building blocksNew VBB candi-dates
22
23
24
25
26Structural VBBs→VBB Line chart
27Structural VBBs→ VBB Scatterplot
137
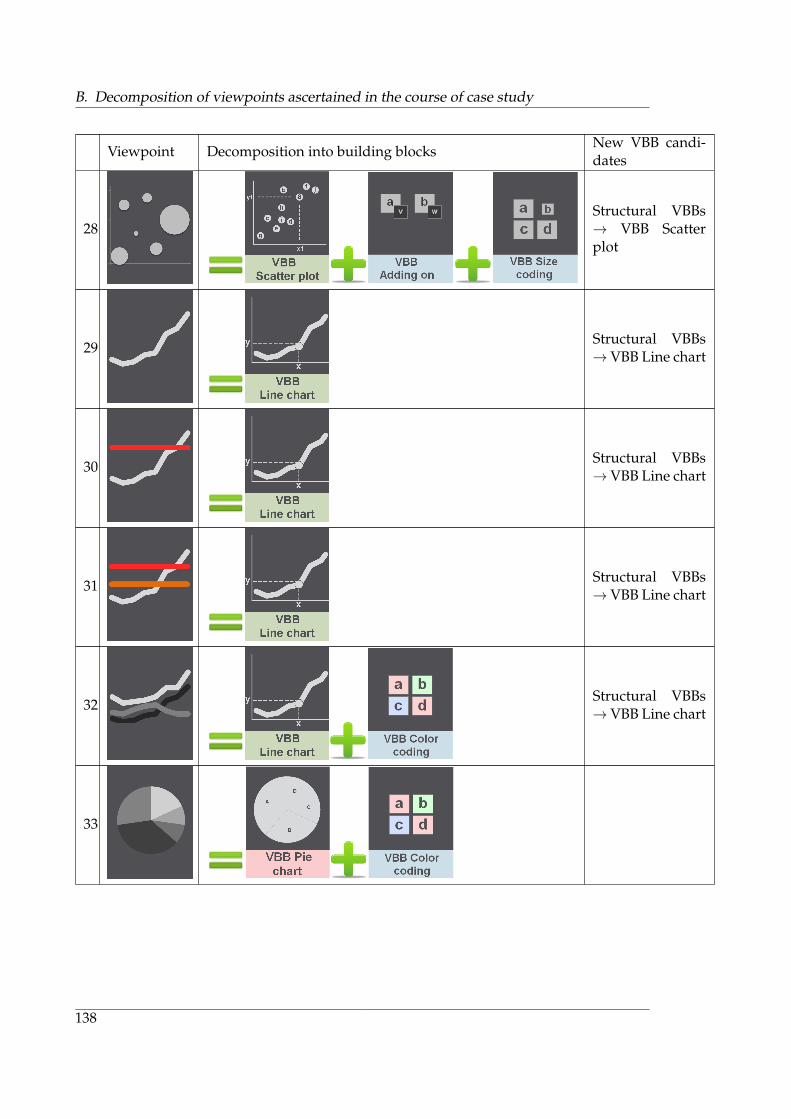
B. Decomposition of viewpoints ascertained in the course of case study
Viewpoint Decomposition into building blocksNew VBB candi-dates
28Structural VBBs→ VBB Scatterplot
29Structural VBBs→VBB Line chart
30Structural VBBs→VBB Line chart
31Structural VBBs→VBB Line chart
32Structural VBBs→VBB Line chart
33
138

Viewpoint Decomposition into building blocksNew VBB candi-dates
34
Symbol VBBs →Compound chartsymbols → VBBPie chart → VBBDoughnut chart
35
1.Structural VBBs→ VBB Radarchart2.Symbol VBBs→ Shapes→ VBBPolygon
36Structural VBBs→ VBB Radarchart
37Structural VBBs→ VBB Regional-ization
38Structural VBBs→ VBB Matrix
139

B. Decomposition of viewpoints ascertained in the course of case study
Viewpoint Decomposition into building blocksNew VBB candi-dates
39Structural VBBs→ VBB Matrix
40Structural VBBs→ VBB Matrix
41Structural VBBs→ VBB Matrix
42
1.Structural VBBs→ VBB Matrix2.Structural VBBs→ VBB Grouping
140

Viewpoint Decomposition into building blocksNew VBB candi-dates
43
1.Structural VBBs→ VBB Matrix2.Structural VBBs→ VBB Grouping
44Structural VBBs→ VBB Matrix
45Structural VBBs→ VBB Matrix
46
1.Structural VBBs→ VBB Matrix2.Symbol VBBs→ Compounddashboard sym-bols → VBBSmiley
47
1.Structural VBBs→ VBB Matrix2.Symbol VBBs→ Compounddashboard sym-bols → VBBTrend arrow
141

B. Decomposition of viewpoints ascertained in the course of case study
Viewpoint Decomposition into building blocksNew VBB candi-dates
46
Symbol VBBs →Compound dash-board symbols→VBB Traffic light
49
Symbol VBBs →Compound dash-board symbols→VBB Progress bar
50Structural VBBs→ VBB Matrix
51Structural VBBs→ VBB Matrix
52Structural VBBs→ VBB Matrix
53
1.Structural VBBs→ VBB Graph2.Symbol VBBs→ VBB Icon
142

Viewpoint Decomposition into building blocksNew VBB candi-dates
54
1.Structural VBBs→ VBB Graph2.Symbol VBBs→ Shapes→ VBBPolygon3.Symbol VBBs→ Shapes →VBB Roundedrectangle4.Symbol VBBs→ Compounddashboard sym-bols → VBBSmiley
55
1.Structural VBBs→ VBB Graph2.Symbol VBBs→ VBB Icon →Chevron, Xor
56
1.Structural VBBs→ VBB Graph2.Symbol VBBs→ VBB Icon →Chevron, Xor,Curved rectagle,Cutted rectangle
143

B. Decomposition of viewpoints ascertained in the course of case study
Viewpoint Decomposition into building blocksNew VBB candi-dates
57
1.Structural VBBs→ VBB Graph2.Symbol VBBs→ VBB Icon →Framed rectangle
58
59Structural VBBs→ VBB Schedul-ing
60
1.Symbol VBBs→ VBB Icon →Framed rectangle2.Symbol VBBs→ Shapes→ VBBPolygon
144

Viewpoint Decomposition into building blocksNew VBB candi-dates
61
1.Structural VBBs→ VBB Graph2.Symbol VBBs→ Shapes→ VBBPolygon3.Symbol VBBs→ VBB Icon →Xor, Cutted rect-angle, Curvedrectangle
62
Table B.1.: Decomposition of viewpoints used by a real-life global financial serviceprovider
145

B. Decomposition of viewpoints ascertained in the course of case study
146

C. List of abbreviations
BEAMS Building Blocks for Enterprise Architecture Management SolutionsDFD Data Flow DiagramsEA Enterprise ArchitectureEAMPC Enterprise Architecture Management Pattern CatalogEBITDA Earnings Before Interest, Taxes, Depreciation, and AmortizationEV Enterprise ValueIBB Information model building blockIEEE-SA Institute of Electrical and Electronics Engineers Standards AssociationIEC International Electrotechnical CommissionISO International Organization for StandardizationIT Information technologyKPI Key performance indicatorLBB Language building blockMBB Method building blockSE Software engineeringUML Unified modeling languageVBB Viewpoint building blockVCBB Viewpoint catalog building block
147


Bibliography
[Ab08] Abela, A.: Advanced Presentations by Design: Creating Communication that DrivesAction. Pfeiffer, 2008.
[Al77] Alexander, C.: A Pattern Language: Towns, Buildings, Construction. Oxford Univer-sity Press, 1977.
[Ac10] Achenbach, P.: Eine domanenspezifische Sprache zur Generierung von Sichten der Un-ternehmensarchitektur. Bachelorarbeit, Technische Universitat Munchen, Fakultat fur In-formatik, 2010.
[AW10] Alexander, M.; Walkenbach, J.: Excel Dashboards and Reports. John Wiley & Sons,2010.
[Be04] Beyer, N.: Kennzahlen zur Beschreibung von Anwendungslandschaften und ihre Visual-isierung auf Softwarekarten. Bachelorarbeit, Technische Universitat Munchen, Fakultatfur Informatik, 2004.
[Be08] Behrens, C.: The Form of Facts and Figures: Design Patterns for Interactive InformationVisualization. Masterarbeit, Fachhochschule Potsdam, 2008.
[BMS10] Buckl, S.; Matthes, F.; Schweda, C.M.: Utilizing Patterns in Developing Design The-ories. In: 2010 International Conference on Information Systems (ICIS 2010), St. Louis,MI, USA, paper 122, 2010.
[Br05] Brendebach, K.: Integrierte Modelle und Sichten fur das IT-Management: Analyse undEntwicklung in Zusammenarbeit mit der HVB Systems. Diplomarbeit, Technische Univer-sitat Munchen, Fakultat fur Informatik, 2005.
[Bu08] Buckl, S. et al.: Enterprise Architecture Management Pattern Catalog (Version 1.0,February 2008). Technical Report TB0801, Chair for Informatics 19 (sebis), TechnischeUniversitat Munchen, 2008.
[Bu07] Buckl, S. et al.: A Pattern based Approach for constructing Enterprise Architecture Man-agement Information Models. In: 8. Internationale Tagung Wirtschaftsinformatik, Karl-sruhe, p. 145-162, 2007.
[Bu10] Buckl, S. et al.: Building Blocks for Enterprise Architecture Management Solutions. In:Harmsen, F. et al. (Edt.): Practice-Driven Research on Enterprise Tramsformation, sec-ond working conference, PRET 2010, Delft, Springer, Lecture Notes in Business Infor-mation Processing (LNBIP), Vol. 69, p. 17-46, 2010.
[Bu11] Buckl, S. et al.: A meta-language for enterprise architecture analysis. In: 16th Interna-tional Conference on Exploring Modeling Methods for Systems Analysis and Design(EMMSAD 2011), London, United Kingdom, 2011.
149

Bibliography
[De06] Dern, G.: Management von IT-Architekturen: Leitlinien fur die Ausrichtung, Planungund Gestaltung von Informationssystemen. 2., verbesserte und erweiterte Auflage, Friedr.Viewweg & Sohn Verlag, 2006.
[Er08] Ernst, A.M.: Enterprise Architecture Management Patterns. In: Proceedings of the 15thConference on Pattern Languages of Programs (PLoP’08), ACM New York, NY, USA,2008.
[Fe04] Few, S.: Show Me the Numbers: Designing Tables and Graphs to Enlighten. AnalyticsPress, 2004.
[Fe09] Few, S.: Now You See It: Simple Visualization Techniques for Quantitative Analysis.Analytics Press, 2009.
[IE00] IEEE: Systems and software engineering - Recommended practice for architectural descrip-tion of software-intensive systems. The Institute of Electrical and Electronics Engineers,Inc., 2000.
[Kr05] Krcmar, H.: Informationsmanagement. 4., uberarb. und erw. Auflage, Springer, 2005.
[La08] Lankes, J.: Metrics for Application Landscapes: Status Quo, Development, and a CaseStudy. Dissertation, Technische Universitat Munchen, Lehrstuhl fur Informatik 19,2008.
[LLS10] Laudon, K.C.; Laudon, J.P.; Schoder, D.: Wirtschaftsinformatik: Eine Einfuhrung. 2.,aktualisierte Auflage,Pearson Studium, 2010.
[Lu04] Luftman, J. N. et al.: Managing the Information Technology Resource: Leadership in theInformation Age. Pearson Prentice Hall, 2004.
[Ma08] Matthes, F. et al.: Enterprise Architecture Management Tool Survey 2008. TechnischeUniversitat Munchen, Chair for Informatics 19, Prof. Matthes (sebis), 2008.
[Mo09] Moody, D.: The ’Physics’ of Notations: Toward a Scientific Basis for Constructing VisualNotations in Software Engineering. In: IEEE Transactions on Software Engineering, Vol.35, Nr. 6, Nov/Dec 2009.
[MJ09] Myatt, G.; Johnson, W.: Making Sense of Data II: A Practical Guide to Data Visualiza-tion, Advanced Data Mining Methods, and Applications. Wiley, 2009.
[My11] Mykhashchuk, M. et al.: Charting the landscape of enterprise architecture management -An extensive literature analysis. In: 10.Internationale Tagung Wirtschaftsinformatik 2011,Zurich, Switzerland, 2011.
[OMG06] Object management group (OMG): Meta object facility (mof) core specification, ver-sion 2.0. http://www.omg.org/spec/MOF/2.0/PDF (cited 2011-08-23). 2006.
[Po98] Porter, M. E.: Competitive Advantage: Creating and Sustaining Superior Performance.Free Press, 1998.
150

Bibliography
[Se05] Sekatzek, P.: Visualisierung von IT-Bebauungsplanen in Form von Softwarekarten- Konzeption und prototypische Umsetzung. Diplomarbeit, Technische UniversitatMunchen, Fakultat fur Informatik, 2005.
[Se11] Sebis: Building Blocks for Enterprise Architecture Management Solutions(BEAMS). Technische Universitat Munchen, Lehrstuhl fur Informatik 19.http://wwwmatthes.in.tum.de/wikis/beams/home (cited 2011-08-15). 2011.
[Tu01] Tufte, E.: Visual Display of Quantitative Information. Graphics Press, 2001.
[Tu90] Tufte, E.: Envisioning Information. Graphics Press, 1990.
[WGK10] Ward, M.; Grinstein, G.; Keim, D.: Interactive Data Visualizations: Foundations,Techniques, and Application. A K Peters Ltd, 2010.
[Wi07] Wittenburg, A.: Softwarekartographie: Modelle und Methoden zur systematischen Visu-alisierung von Anwendungslandschaften. Dissertation, Technische Universitat Munchen,Lehrstuhl fur Informatik 19, 2007.
[WP02] Ward, J.; Peppard, J.: Strategic Planning for Information Systems. 3rd edition, JohnWiley & Sohns, 2002.
151