Embed Size (px)
Citation preview
Crash Data Management
Fall 2015
Crash data remains the number one indicator of network deficiencies (others: traffic conflicts, driving task analysis)
Crash data used for:◦ Identification of hazardous sites◦ Benefit-costs analysis◦ Safety relationships (statistical models)◦ Highway design process◦ Policy development
Crash Data
Traffic Engineers: elimination of hazardous sites; highway design, etc.
Police force: enforcement location, etc. Researchers: understanding the crash
process; safety relationships, etc. Decision-makers: alcohol measures, speed
limit Prosecutors: transportation-related
criminal lawsuits, eye witness statements, etc.
Insurance companies: set premiums, types of vehicles, age of drivers,
Vehicle manufacturers: research for safer vehicles
Data Users
Quality of data highly dependent on the officer at the scene of the crash
Most important data are collected for potential criminal prosecution; other data less important
Sometimes officers fill out the report on the scene while others do it at the end of the day (see next overheads)
Important to have an open line of communication between the engineering and police departments
Crash Report
Portable computers: improve legibility and could reduce errors; increase workload at the scene of the crash
Pen-based computers: officer writes on a notepad and software transform characters written on the pad
Palmtop computers: pen-based screen; takes little space on the computer
Bar codes: read information off the drivers’ license, vehicle, vehicle registration, etc.
Modems: upload information directly to the police station
Some issues: prosecution may need handwritten statement; some officers may not have the skills necessary for handling computers (less an issue now, but was probably 10 or 15 years ago)
Computerized Crash Report

Geographical location (intersections, mile-point, GIS)
Date (year, day of week, time of day, etc.) Type of involvement (vehicle, driver,
occupants, etc.) Outcome (severity) Environmental conditions (weather,
lighting, road surface conditions) Characteristics of collision (direction of
road users, errors, collision type)
Critical Information
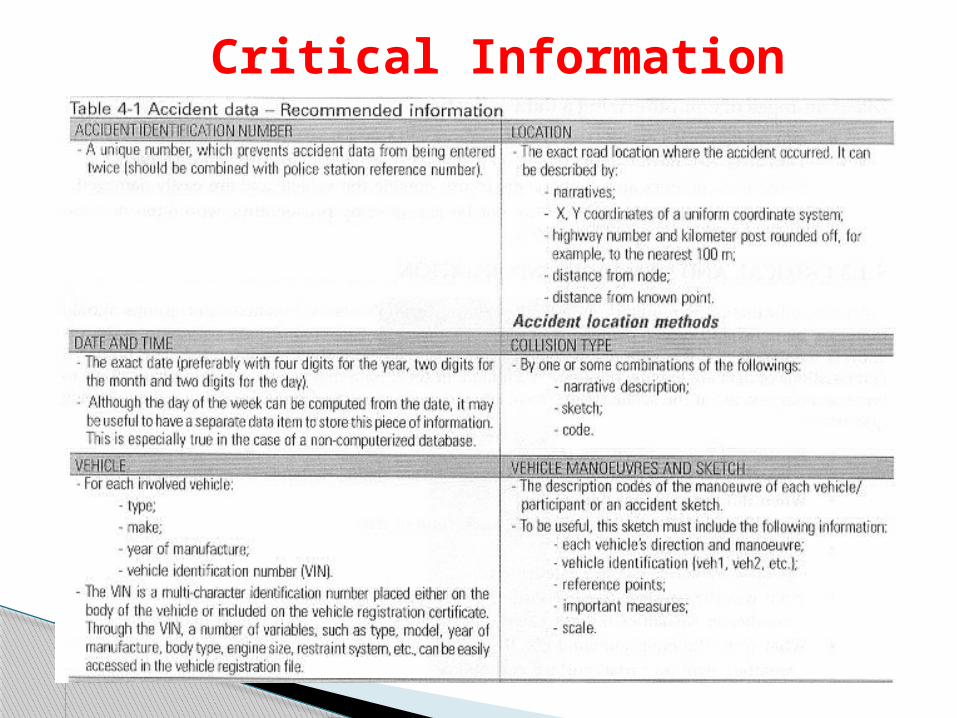
Critical Information
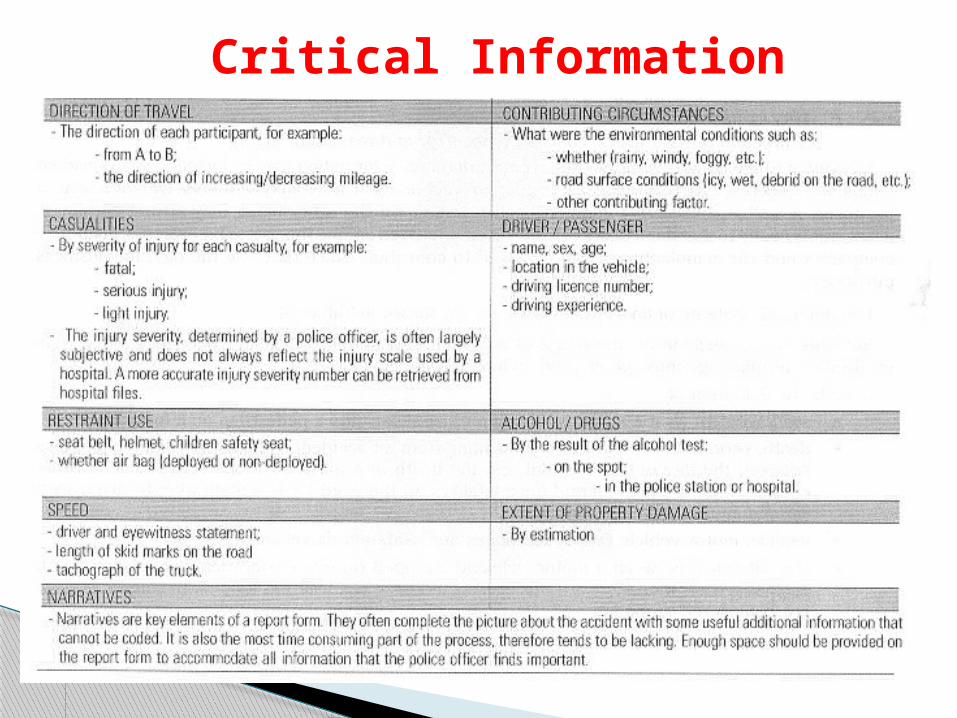
Critical Information
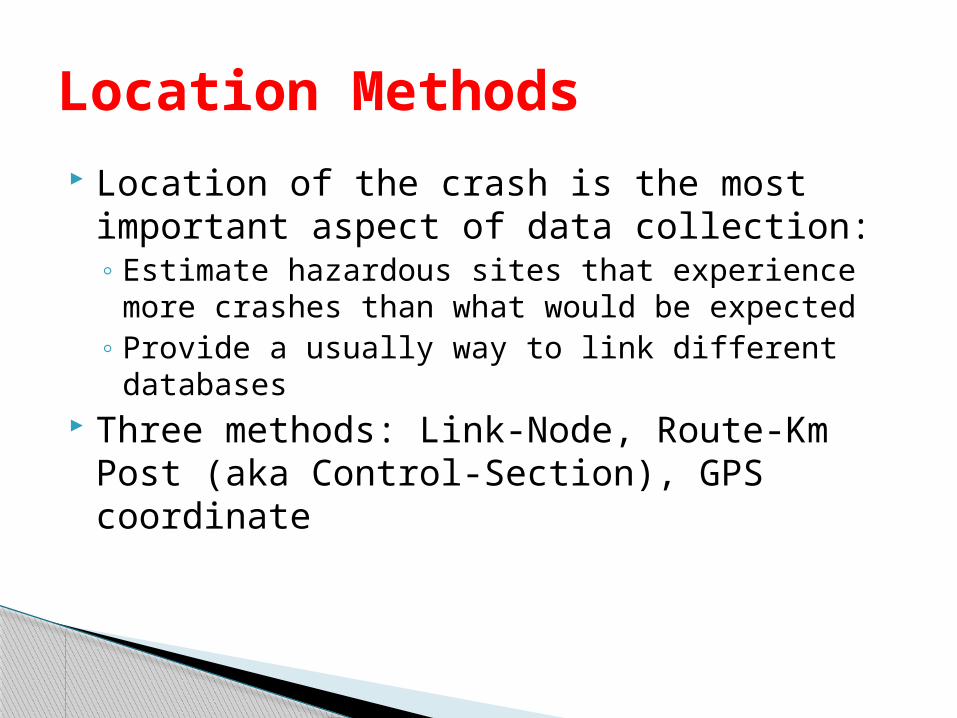
Location of the crash is the most important aspect of data collection:◦ Estimate hazardous sites that experience more
crashes than what would be expected◦ Provide a usually way to link different databases
Three methods: Link-Node, Route-Km Post (aka Control-Section), GPS coordinate
Location Methods
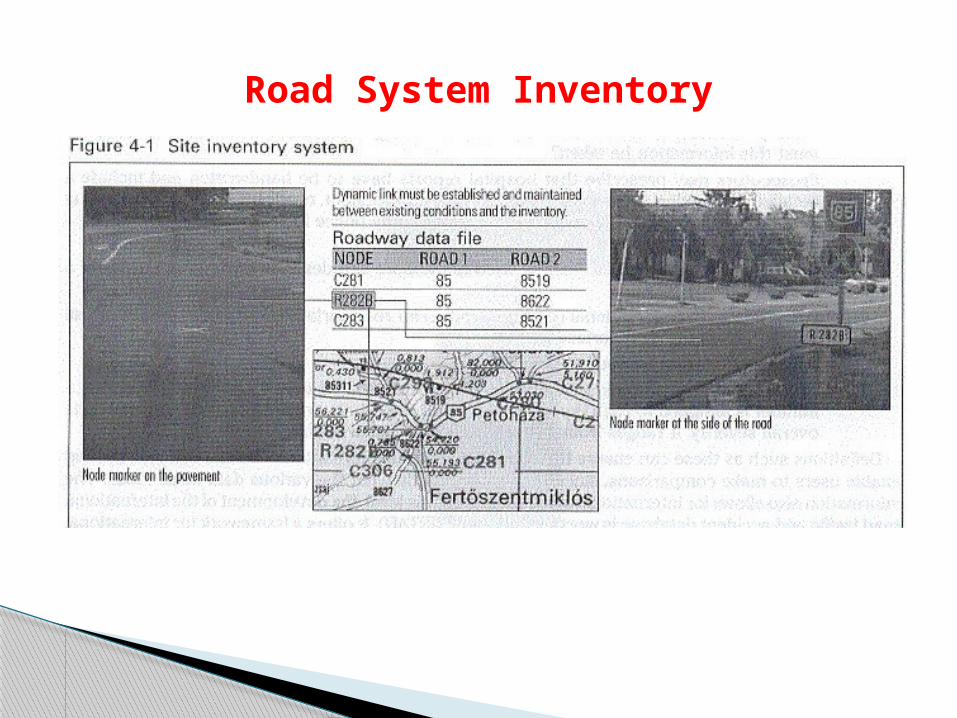
Road System Inventory

Link-Node
Link
Nodes
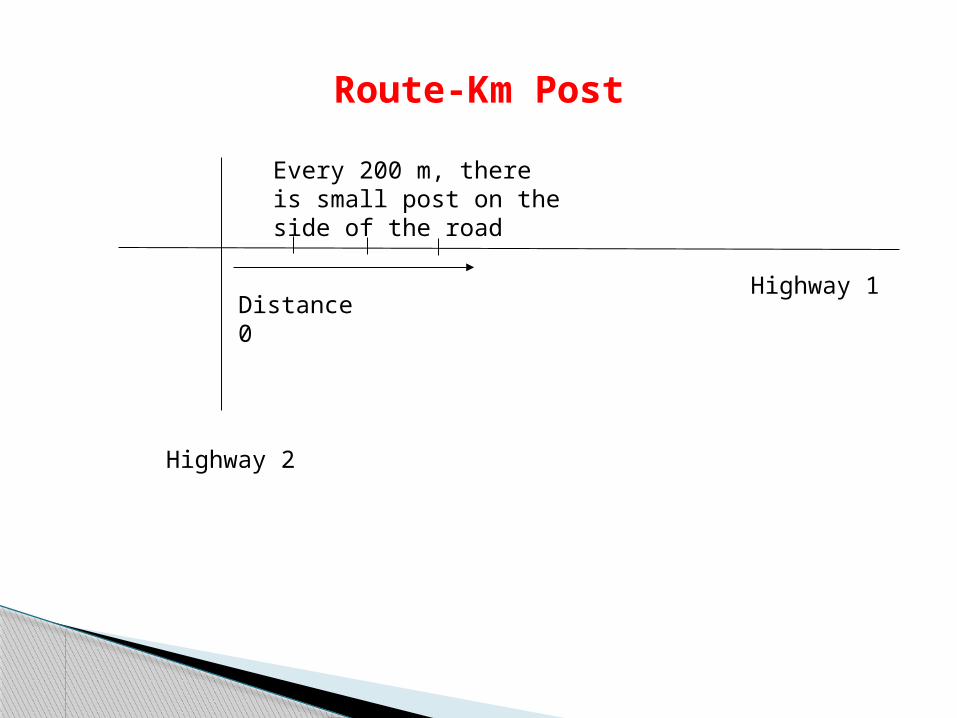
Route-Km Post
Distance 0
Every 200 m, there is small post on the side of the road
Highway 2
Highway 1
Provides X and Y coordinates of a given geographical coordinate system
Two methods: with and without differential processing against a base station (the first is more accurate)
Advantages: human error free; many software tools include GPS coordinate; can estimate in the Z-coordinate (depth)
Disadvantages: “sky-view” problems (buildings, mountains, etc.); algorithm needed to convert GPS to other referencing systems; depending on equipment, human errors could contribute to accuracy problems.◦ Note: May not be issues in 2015.
GPS System
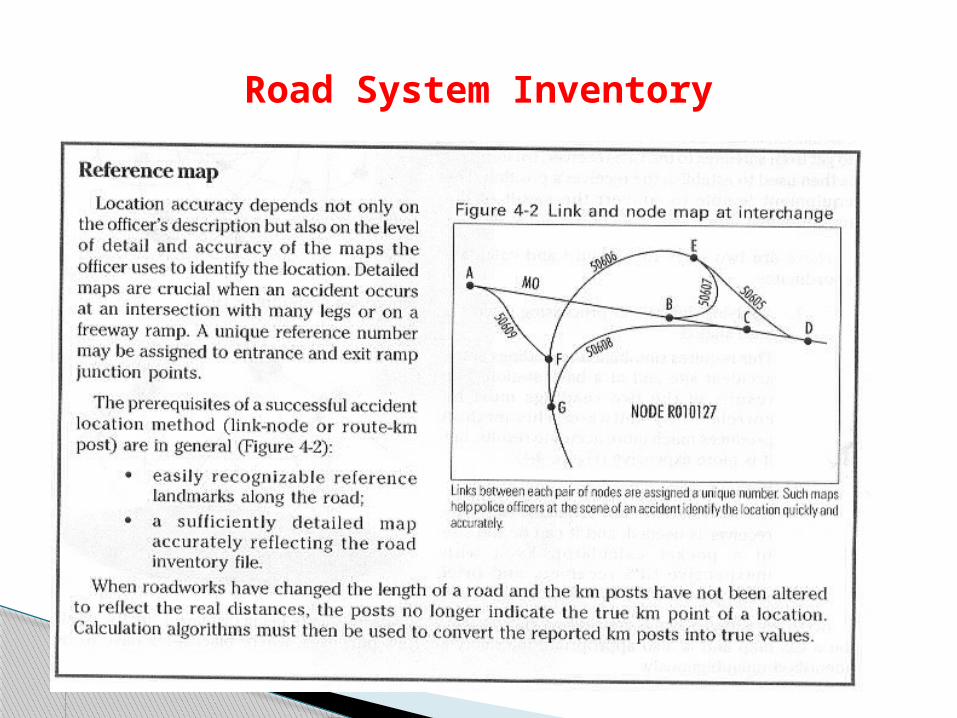
Road System Inventory
Old way: paper trails All crashes are coded electronically (e.g.,
CRIS in Texas; FHWA’s HSIS) Now, commercial programs available that
displays visually simple crash statistics Internet-based visual tools (using GIS/GPS
capabilities: ARCView, etc.)
Crash Data Storage
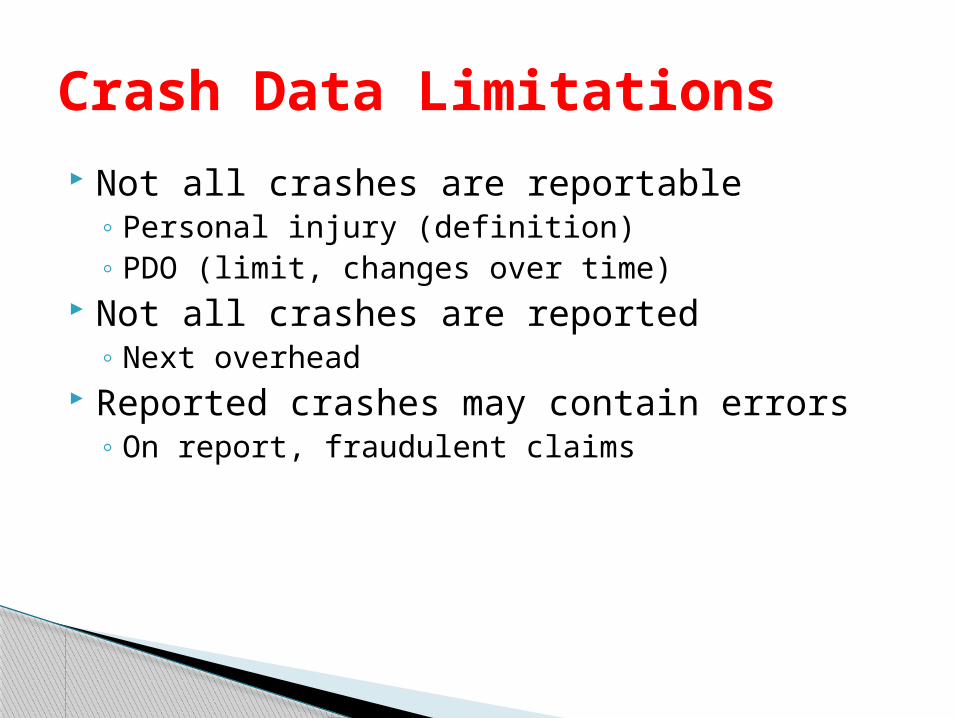
Not all crashes are reportable◦ Personal injury (definition)◦ PDO (limit, changes over time)
Not all crashes are reported◦ Next overhead
Reported crashes may contain errors◦ On report, fraudulent claims
Crash Data Limitations
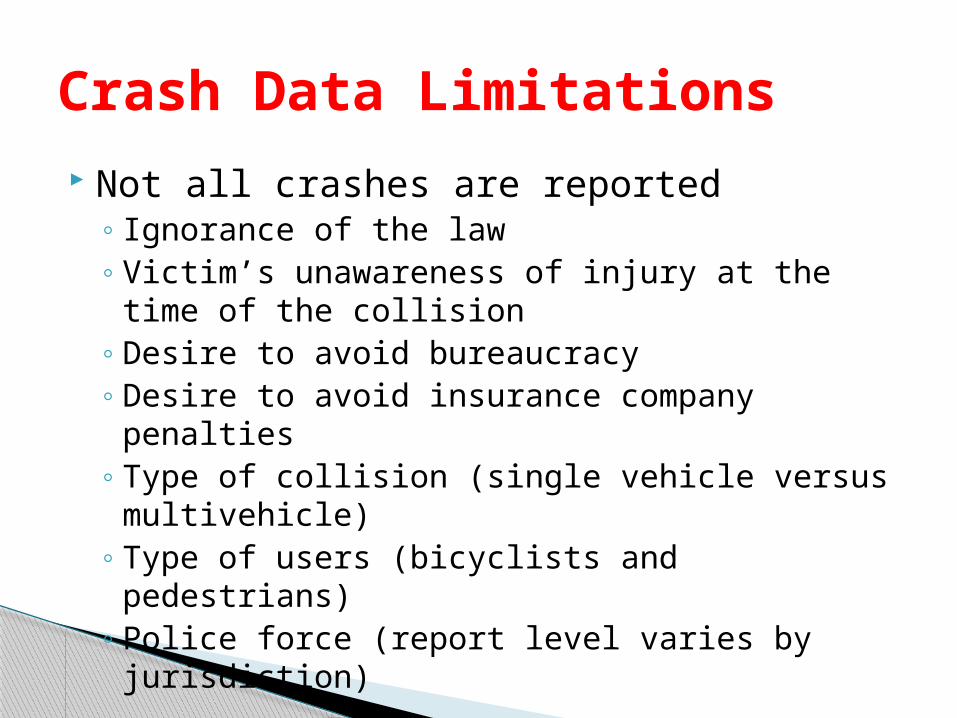
Not all crashes are reported◦ Ignorance of the law◦ Victim’s unawareness of injury at the time of
the collision◦ Desire to avoid bureaucracy◦ Desire to avoid insurance company penalties ◦ Type of collision (single vehicle versus
multivehicle)◦ Type of users (bicyclists and pedestrians)◦ Police force (report level varies by jurisdiction)
Crash Data Limitations
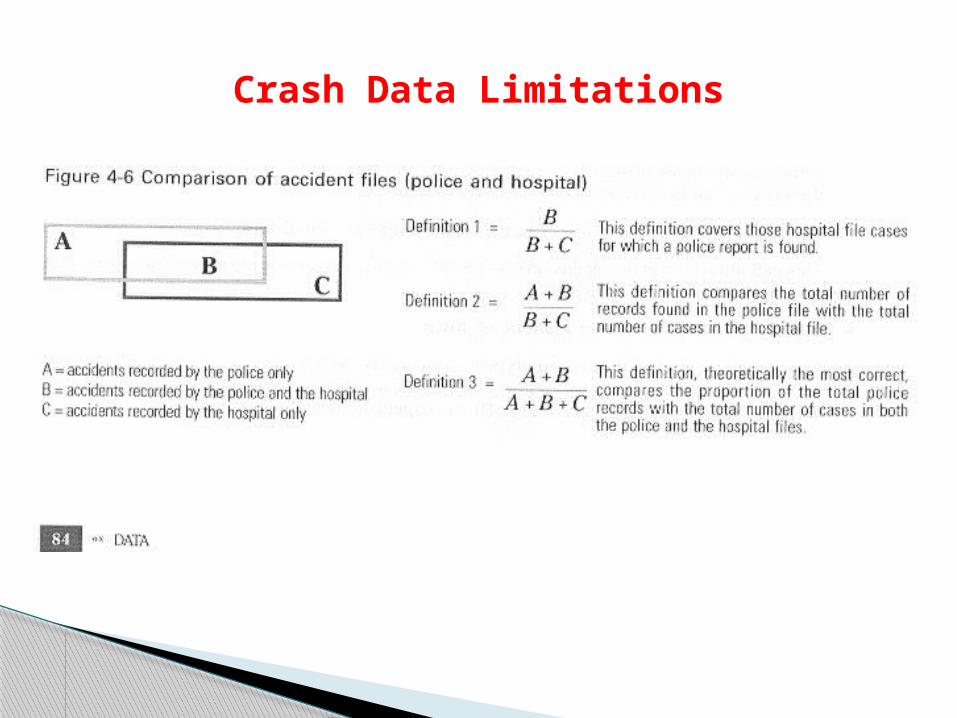
Crash Data Limitations
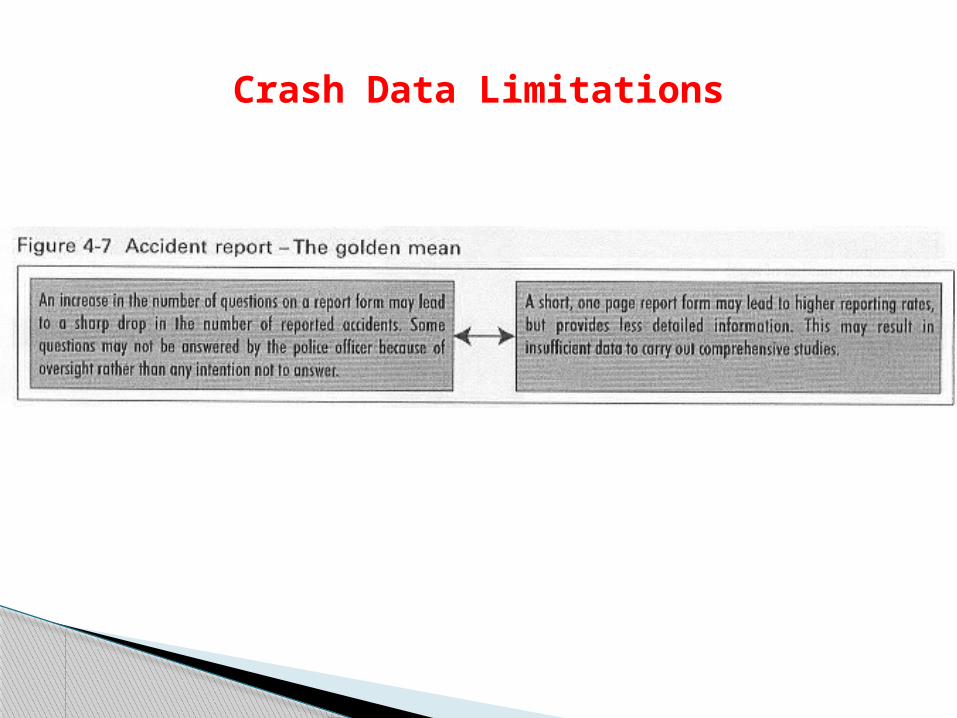
Crash Data Limitations
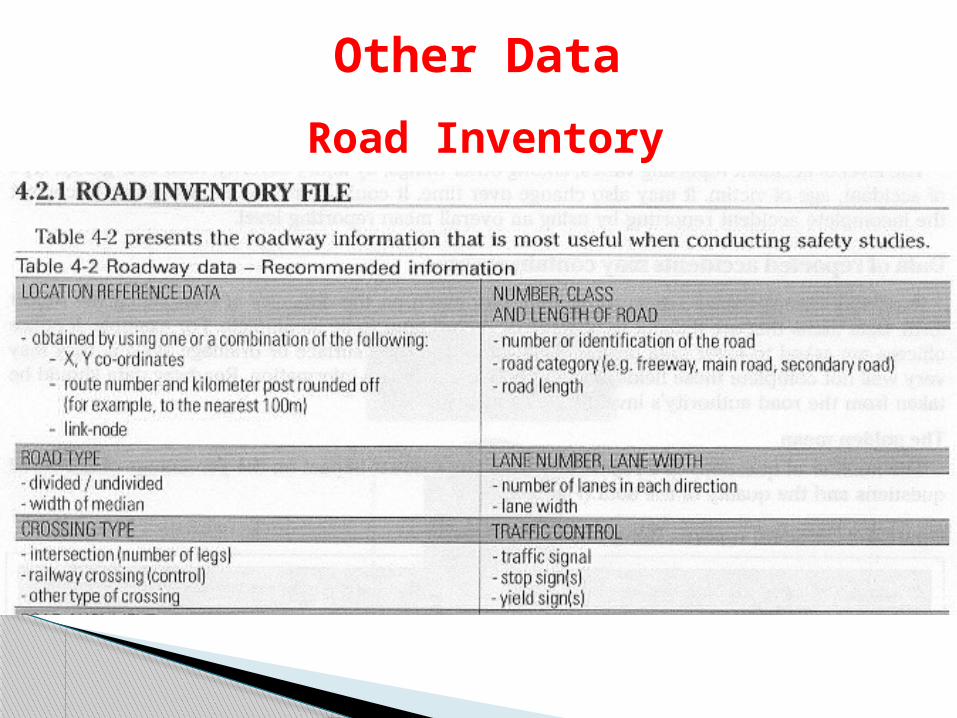
Other Data
Road Inventory
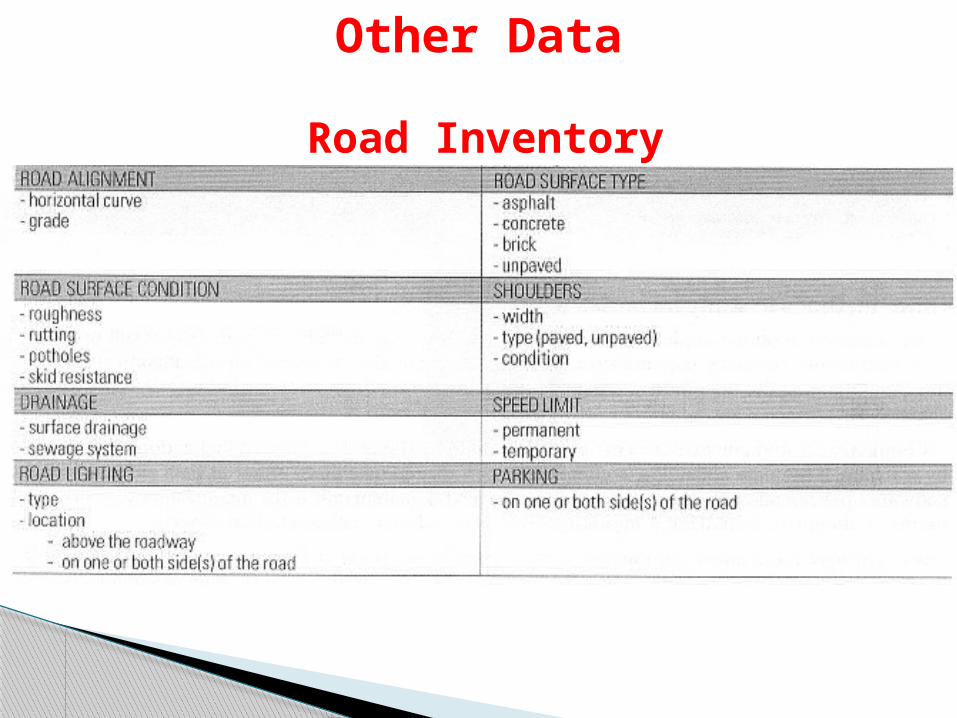
Other Data
Road Inventory
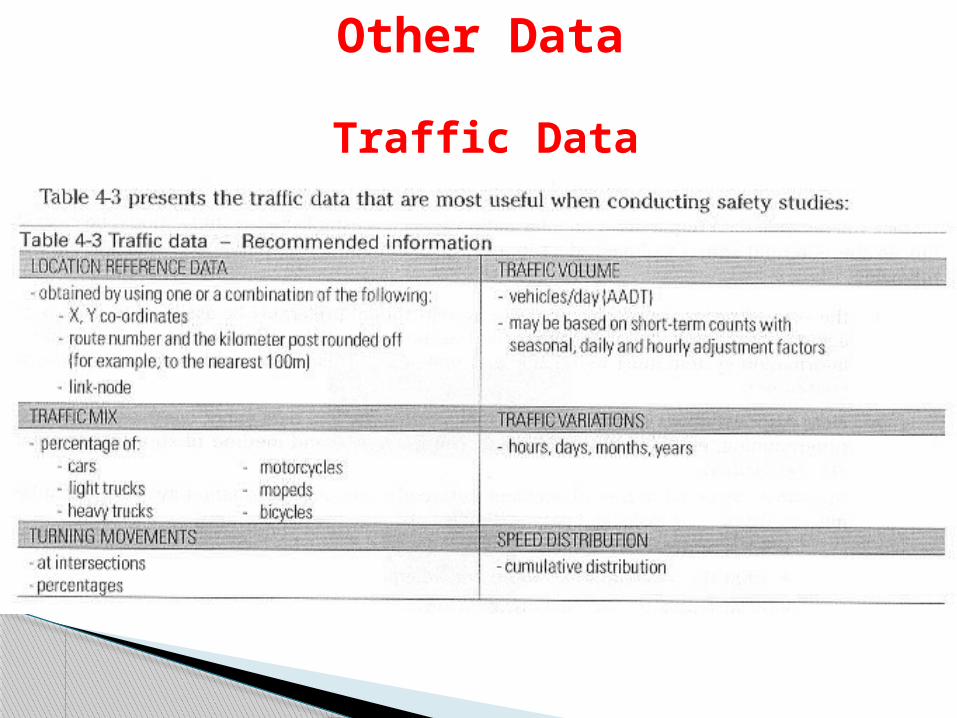
Other Data
Traffic Data
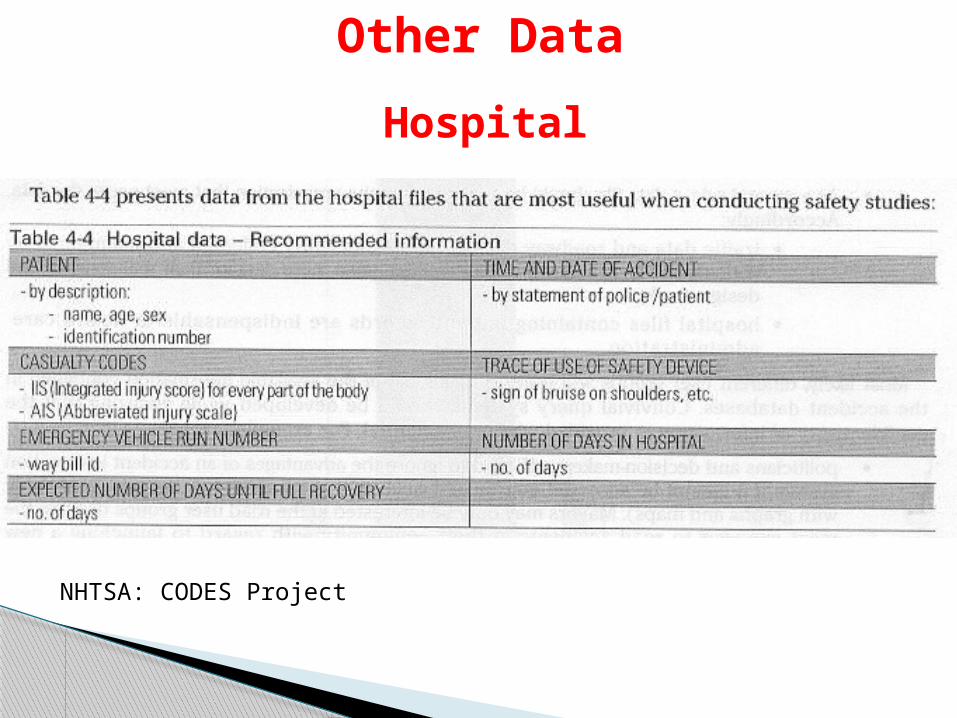
Hospital
Other Data
NHTSA: CODES Project

Other data files:◦ Photolog and videolog◦ Maintenance and operation files◦ Project history (construction period) ◦ Insurance companies (usually private)◦ Weather reports
Other Data
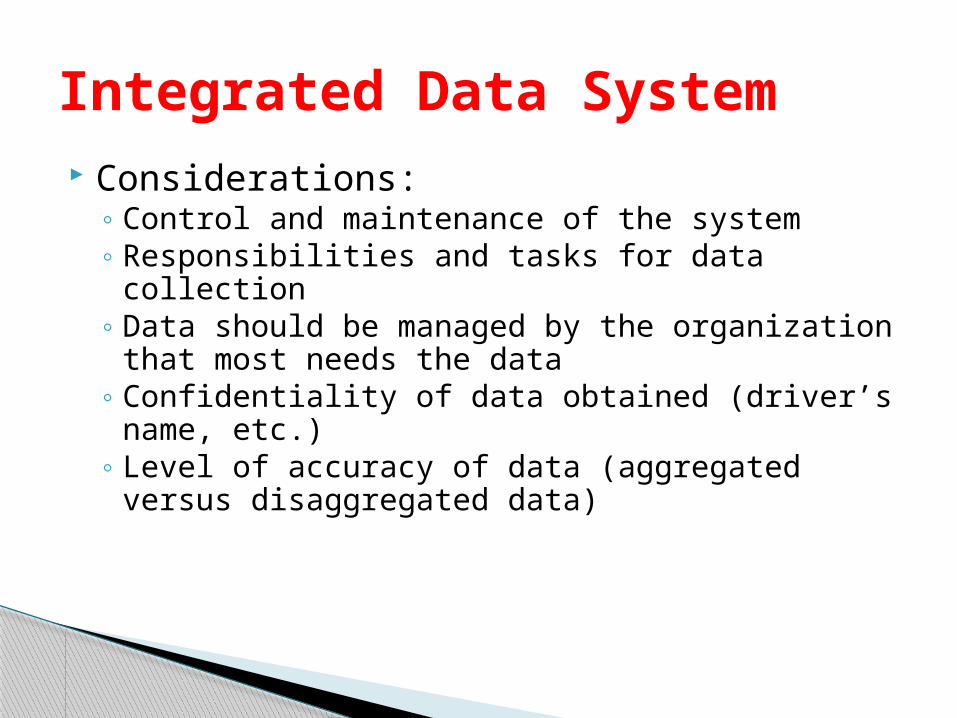
Considerations:◦ Control and maintenance of the system◦ Responsibilities and tasks for data collection◦ Data should be managed by the organization that
most needs the data◦ Confidentiality of data obtained (driver’s name,
etc.)◦ Level of accuracy of data (aggregated versus
disaggregated data)
Integrated Data System
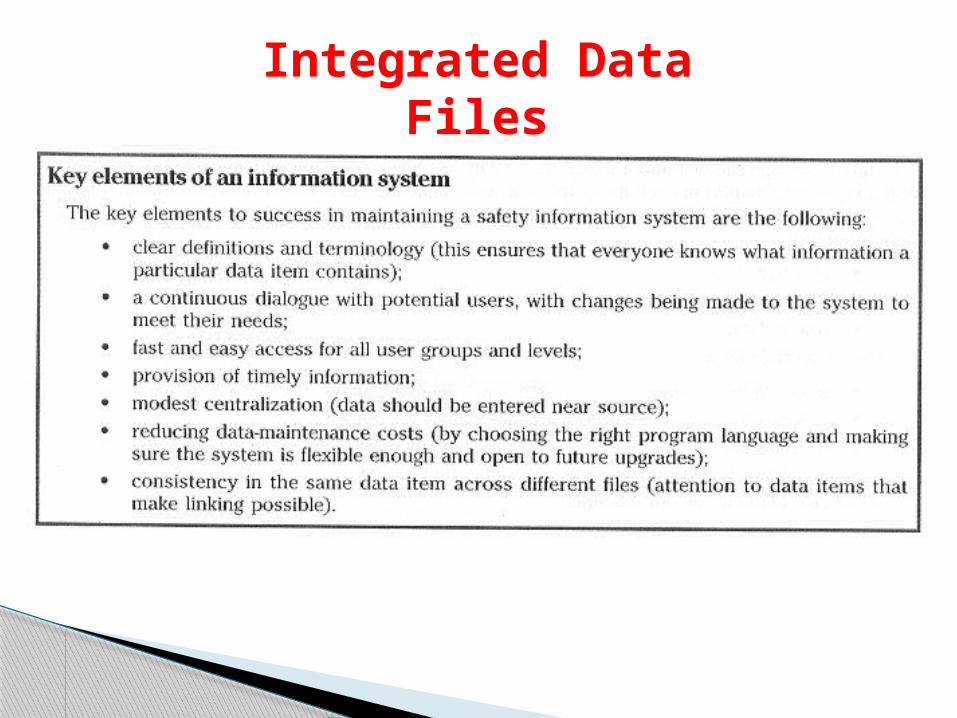
Integrated Data Files
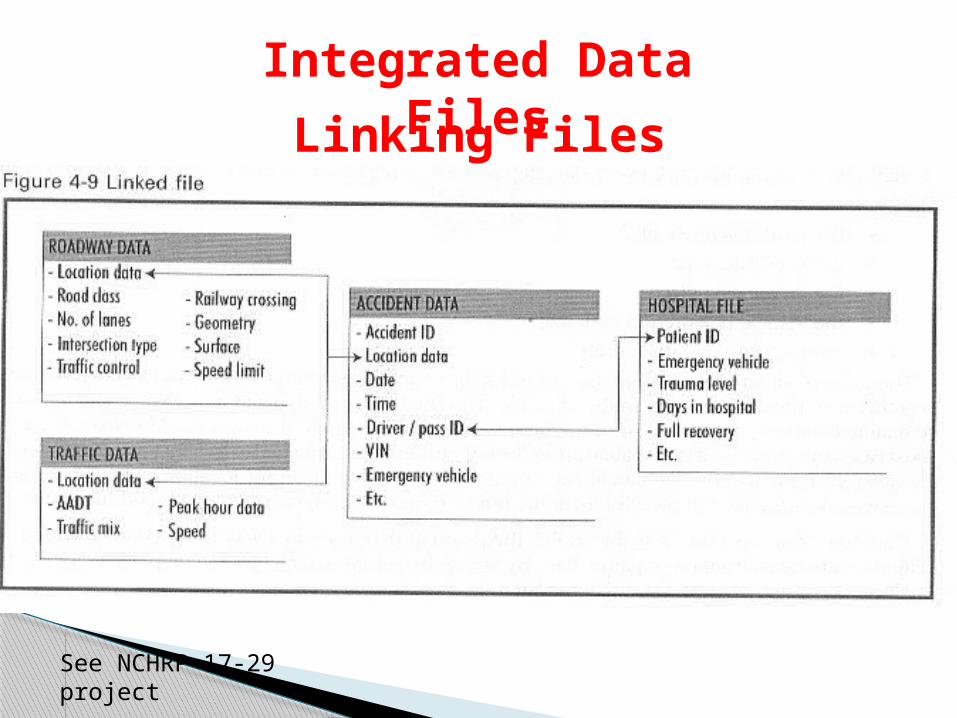
Integrated Data FilesLinking Files
See NCHRP 17-29 project
HSM Data Need
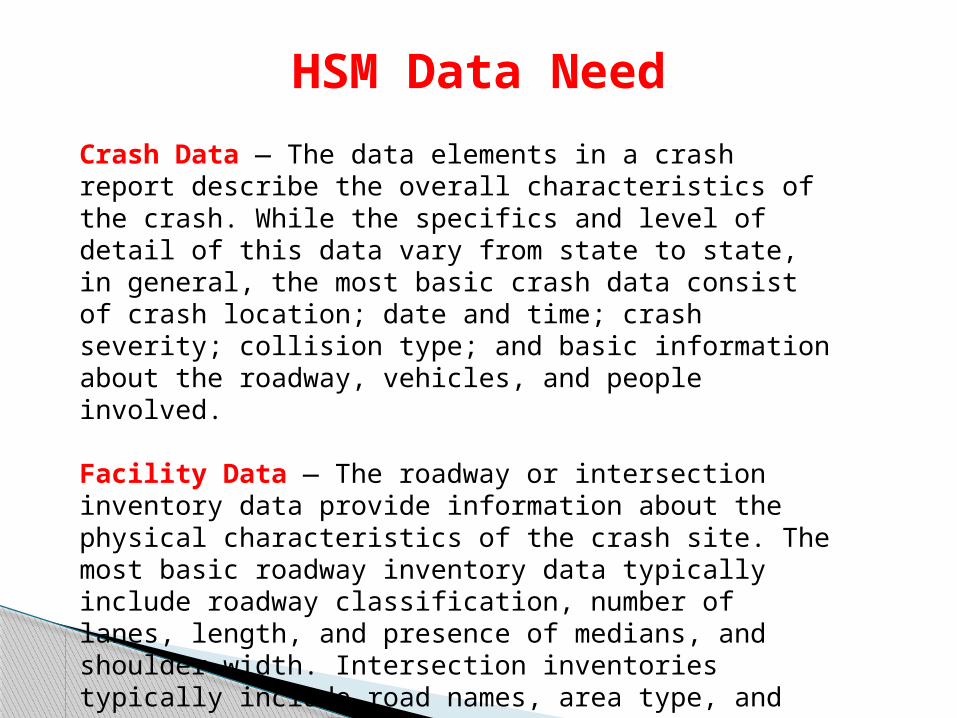
Crash Data — The data elements in a crash report describe the overall characteristics of the crash. While the specifics and level of detail of this data vary from state to state, in general, the most basic crash data consist of crash location; date and time; crash severity; collision type; and basic information about the roadway, vehicles, and people involved.
Facility Data — The roadway or intersection inventory data provide information about the physical characteristics of the crash site. The most basic roadway inventory data typically include roadway classification, number of lanes, length, and presence of medians, and shoulder width. Intersection inventories typically include road names, area type, and traffic control and lane configurations.
HSM Data Need
Traffic Volume Data — In most cases, the traffic volume data required for the methods in the HSM are annual average daily traffic (AADT). Some organizations may use ADT (average daily traffic) as precise data may not be available to determine AADT. If AADT data are unavailable, ADT can be used to estimate AADT. Other data that may be used for crash analysis includes intersection total entering vehicles (TEV), and vehicle- miles traveled (VMT) on a roadway segment, which is a measure of segment length and traffic volume. In some cases, additional volume data, such as pedestrian crossing counts or turning movement volumes, may be necessary.
Research Results Digest 329HIGHWAY SAFETY MANUAL DATA NEEDS GUIDE (June 2008)http://onlinepubs.trb.org/onlinepubs/nchrp/nchrp_rrd_329.pdf
HSM Data NeedLimitations of observed crash data include:• Data quality and accuracy
Data entry—typographic errors;Imprecise entry—the use of general terms to describe a location;Incorrect entry —entry of road names, road surface, level of crash severity, vehicle types, impact
description, etc.;Incorrect training—lack of training in use of collision codes;Subjectivity—Where data collection relies on the subjective opinion of an individual, inconsistency is likely. For example, estimation of property damage thresholds or excessive speed for conditions may vary.
• Crash reporting thresholds and the frequency-severity indeterminacy• Differences in data collection methods and definitions used by jurisdictions
Sources of Data
Highway Safety Information System: http://www.hsisinfo.org/
Fatality Analysis Reporting System: http://www-fars.nhtsa.dot.gov/
National Automotive Sampling System: http://www.nhtsa.gov/NASS
General Estimates System: http://www.nhtsa.gov/NASS
Crashworthiness Data System: http://www.nhtsa.gov/Data/National+Automotive+Sampling+System+(NASS)/NASS+Crashworthiness+Data+System
Crash Outcome Evaluation System: http://www.nhtsa.dot.gov/people/ncsa/codes/CODESindex.htm
Model Minimum Uniform Crash Criteria: http://www.mmucc.us/
Bureau of Transportation Statistics: http://www.bts.gov/programs/safety_data_initiative/
Each State Agency should have data available.
Local cities or counties may have data available.