Embed Size (px)
Citation preview

CRASH DATA SAFETY FACTORS EVALUATION
FINAL REPORT
November 30, 2017
By Eric Donnell, Vikash Gayah, Kristin Kersavage and Zhengyao Yu The Pennsylvania State University
COMMONWEALTH OF PENNSYLVANIA DEPARTMENT OF TRANSPORTATION
CONTRACT # 4400015622/511601 WORK ORDER # 003
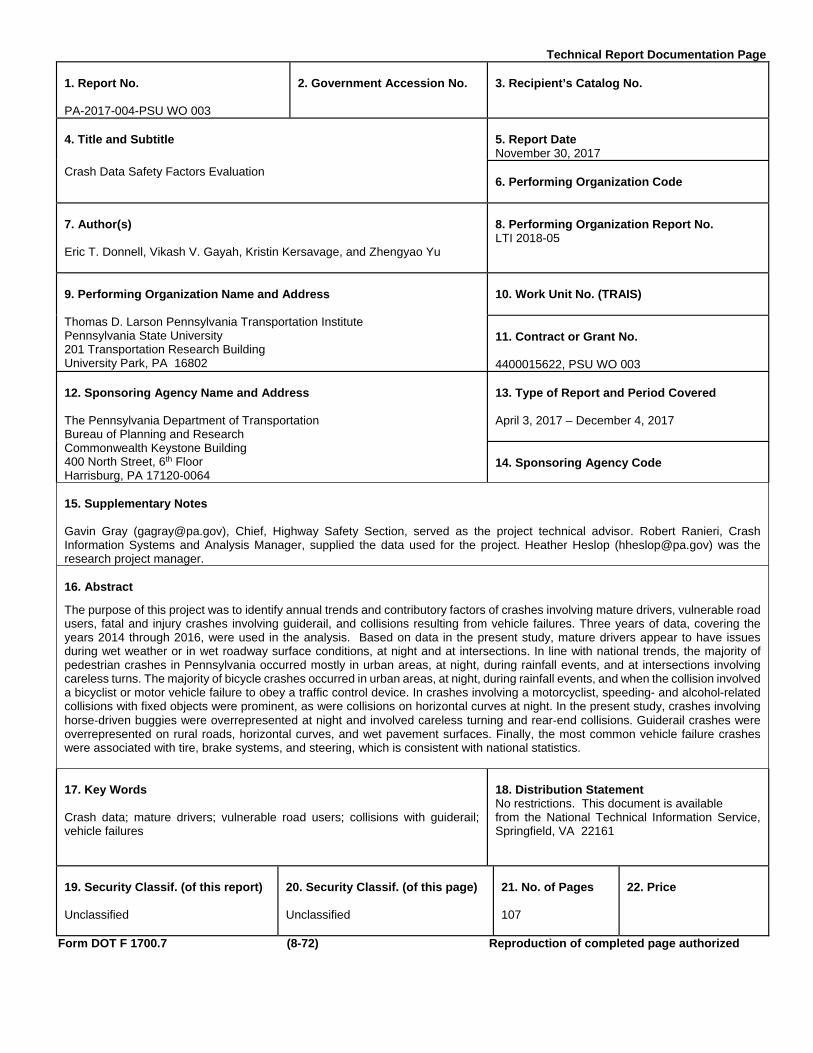
Technical Report Documentation Page 1. Report No. PA-2017-004-PSU WO 003
2. Government Accession No.
3. Recipient’s Catalog No.
4. Title and Subtitle
Crash Data Safety Factors Evaluation
5. Report Date November 30, 2017 6. Performing Organization Code
7. Author(s) Eric T. Donnell, Vikash V. Gayah, Kristin Kersavage, and Zhengyao Yu
8. Performing Organization Report No. LTI 2018-05
9. Performing Organization Name and Address Thomas D. Larson Pennsylvania Transportation Institute Pennsylvania State University 201 Transportation Research Building University Park, PA 16802
10. Work Unit No. (TRAIS) 11. Contract or Grant No. 4400015622, PSU WO 003
12. Sponsoring Agency Name and Address The Pennsylvania Department of Transportation Bureau of Planning and Research Commonwealth Keystone Building 400 North Street, 6th Floor Harrisburg, PA 17120-0064
13. Type of Report and Period Covered April 3, 2017 – December 4, 2017 14. Sponsoring Agency Code
15. Supplementary Notes Gavin Gray ([email protected]), Chief, Highway Safety Section, served as the project technical advisor. Robert Ranieri, Crash Information Systems and Analysis Manager, supplied the data used for the project. Heather Heslop ([email protected]) was the research project manager. 16. Abstract
The purpose of this project was to identify annual trends and contributory factors of crashes involving mature drivers, vulnerable road users, fatal and injury crashes involving guiderail, and collisions resulting from vehicle failures. Three years of data, covering the years 2014 through 2016, were used in the analysis. Based on data in the present study, mature drivers appear to have issues during wet weather or in wet roadway surface conditions, at night and at intersections. In line with national trends, the majority of pedestrian crashes in Pennsylvania occurred mostly in urban areas, at night, during rainfall events, and at intersections involving careless turns. The majority of bicycle crashes occurred in urban areas, at night, during rainfall events, and when the collision involved a bicyclist or motor vehicle failure to obey a traffic control device. In crashes involving a motorcyclist, speeding- and alcohol-related collisions with fixed objects were prominent, as were collisions on horizontal curves at night. In the present study, crashes involving horse‐driven buggies were overrepresented at night and involved careless turning and rear‐end collisions. Guiderail crashes were overrepresented on rural roads, horizontal curves, and wet pavement surfaces. Finally, the most common vehicle failure crashes were associated with tire, brake systems, and steering, which is consistent with national statistics. 17. Key Words Crash data; mature drivers; vulnerable road users; collisions with guiderail; vehicle failures
18. Distribution Statement No restrictions. This document is available from the National Technical Information Service, Springfield, VA 22161
19. Security Classif. (of this report) Unclassified
20. Security Classif. (of this page) Unclassified
21. No. of Pages 107
22. Price
Form DOT F 1700.7 (8-72) Reproduction of completed page authorized

Acknowledgement The authors wish to acknowledge Mr. Gavin Gray, PennDOT Highway Safety Section Chief, for his helpful insights and technical guidance during this project. The authors are also grateful for the technical support of Mr. Robert Ranieri, PennDOT’s Crash Information and Systems Analysis Manager, during the project. Ms. Heather Heslop, PennDOT Research Project Manager, is acknowledged for her project management assistance. Disclaimer This work was sponsored by the Pennsylvania Department of Transportation and the U.S. Department of Transportation, Federal Highway Administration. The contents of this report reflect the views of the authors, who are responsible for the facts and the accuracy of the data presented herein. The contents do not necessarily reflect the official views or policies of either the Federal Highway Administration, U.S. Department of Transportation, or the Commonwealth of Pennsylvania at the time of publication. This report does not constitute a standard, specification, or regulation.
iii
TABLEOFCONTENTS
ListofTables............................................................................................................iv ExecutiveSummary................................................................................................1 ProjectPurposeandOjectives............................................................................3 ResearchTasks........................................................................................................3 OrganizationoftheReport..................................................................................4 DataRequestandCrashTypeIdentification.................................................4 MatureDrivers...............................................................................................................................................5
VulnerableRoadUsers...............................................................................................................................6
Guiderail‐relatedFatalandSeriousInjuryCrashes.......................................................................6
MotorVehicleFailures................................................................................................................................7
SummaryStatistics.......................................................................................................................................7
AnalysisResults.....................................................................................................10 StatisticalMethodology...........................................................................................................................11
MatureDrivers............................................................................................................................................12
VulnerableRoadUsers............................................................................................................................16
FatalandSeriousInjuryCrasheswithGuiderail..........................................................................22
MotorVehicleFailures.............................................................................................................................25
Discussion................................................................................................................25 MatureDrivers............................................................................................................................................25
VulnerableRoadUsers............................................................................................................................27
FatalandSeriousInjuryCrashesatGuiderails.............................................................................29
VehicleFailures...........................................................................................................................................29
Conclusions.............................................................................................................30 References...............................................................................................................32 AppendixA..............................................................................................................34 AppendixB..............................................................................................................55 AppendixC...............................................................................................................59 AppendixD..............................................................................................................64 AppendixE...............................................................................................................74 AppendixF...............................................................................................................79 AppendixG...........................................................................................................102

iv
LIST OF TABLES
Table1.SummaryofTotalCrashesandFourCrashTypes....................................................................9 Table2.CrashRatePer100LicensedDriversinPennsylvania.........................................................10 Table3.CrashRatePer1BillionVehicleMilesTraveledinPennsylvania...................................10 Table4.CrashCharacteristicsforat‐faultMatureDriversAged65andOver............................35 Table5.CrashCharacteristicsforat‐faultMatureDriversAged75andOver............................40 Table6.CrashCharacteristicsfornotat‐faultMatureDriversAged65andOver....................45 Table7.CrashCharacteristicsfornotat‐faultMatureDriversAged75andOver....................50 Table8.CrashCharacteristicsforCrashesInvolvingPedestriansinwhich
Pedestriansareat‐fault................................................................................................................................56 Table9.CrashCharacteristicsforCrashesInvolvingPedestriansinwhich
Pedestriansarenotat‐fault........................................................................................................................57 Table10.CrashCharacteristicsforCrashesInvolvingBicyclistsinwhichBicyclists
areat‐fault..........................................................................................................................................................60 Table11.CrashCharacteristicsforCrashesInvolvingBicyclistsinwhichBicyclists
arenotat‐fault..................................................................................................................................................62 Table12.CrashCharacteristicsforSingle‐VehicleMotorcycleCrashes........................................65 Table13.CrashCharacteristicsforMulti‐VehicleCrashesInvolvingMotorcyclesin
whichMotorcyclesareat‐fault..................................................................................................................68 Table14.CrashCharacteristicsforMulti‐VehicleCrashesInvolvingMotorcyclesin
whichMotorcyclesarenotat‐fault..........................................................................................................71 Table15.CrashCharacteristicsforCrashesInvolvingHorse‐DrivenBuggiesinwhich
Buggiesareat‐fault.........................................................................................................................................75 Table16.CrashCharacteristicsforCrashesInvolvingHorse‐DrivenBuggiesinwhich
Buggiesarenotat‐fault................................................................................................................................77 Table17.CrashCharacteristicsforSingle‐VehicleFatalorSeriousInjuryCrashes
InvolvingGuiderails(ReferenceGroup:Single‐VehicleNon‐FatalorSeriousInjuryCrashesInvolvingGuiderails)......................................................................................................80
Table18.CrashCharacteristicsforSingle‐VehicleFatalorSeriousInjuryCrashesInvolvingGuiderails(ReferenceGroup:Single‐VehicleFatalorSeriousInjuryCrashesInvolvingOtherFixedObjects)................................................................................................86
Table19.CrashCharacteristicsforMulti‐VehicleFatalorSeriousInjuryCrashesInvolvingGuiderails(ReferenceGroup:Multi‐VehicleNon‐FatalorSeriousInjuryCrashesInvolvingGuiderails)....................................................................................................................92
Table20.CrashCharacteristicsforMulti‐VehicleFatalorSeriousInjuryCrashesInvolvingGuiderails(ReferenceGroup:Multi‐VehicleFatalorSeriousInjuryCrashesInvolvingOtherFixedObjects)................................................................................................97
Table21.CrashCharacteristicsforMotorVehicleFailureCrashes..............................................103

1
EXECUTIVE SUMMARY
Thepurposeofthisprojectwastoidentifyannualtrendsandcontributoryfactorsofcrashesinvolvingmaturedrivers,vulnerableroadusers,fatalandinjurycrashesinvolvingguiderail,andcollisionsresultingfromvehiclefailures.Maturedriverswerethosedefinedascrashesinvolvingdriversaged65andolder,aswellasdriversaged75andolder.Vulnerableroadusers included pedestrians, bicyclists, motorcyclists, and non‐motorized horse‐drivenbuggies.Effortswereundertakentoidentifywhenmaturedriversorvulnerableroaduserswereat‐faultinacrash.
Three years of electronic crash and roadway inventory data, covering the years 2014through2016,wereusedtoinvestigatethetrendsamongthefourcrashtypesofinterest,aswellasthecontributoryfactorsassociatedwithallfourcrashtypes.Theannualnumberoftotal crashes and each crash type of interestweredeterminedusing the crashdata. Thefrequencyoftotalandseriousinjurycrashesincreasedduringtheanalysisperiod;however,thenumberoffatalcrashesdeclinedoverthissameperiod.Statisticalcomparisonsbetweenthecrashtypeofinterestandabaselineorcomparisoncrashtypeweremadetodetermineifcertaincontributoryfactorswereoverrepresentedinthecrashtypeofinterest.
Crashesinvolvingmaturedriversincreasedduringtheanalysisperiod.Driversaged65andolderrepresentedapproximately15.5percentoftotalcrashesin2014,15.7percentoftotalcrashesin2015,and16.3percentoftotalcrashesin2016,whiledriversaged75andolderrepresentedapproximately6.2percentoftotalcrashesin2014,6.2percentoftotalcrashesin 2015, and 6.4 percent of total crashes in 2016. National studies suggest thatmaturedriversaremore likely tobe involved incrashesat intersections, includingdrivewaysoralleys.Further,maturedriversaremorelikelytobeinvolvedincrashesduringdaylight,andincrashesinvolvingafailuretoyieldtoconflictingtraffic.Basedondatainthepresentstudy,crashesinvolvingmaturedriversoccurredlessoftenduringinclementweatherconditionsor inclementroadwaysurfaceconditions,whichsuggest thatmaturedriversmight travellessfrequentlywhenroadwayorweatherconditionsarenotideal.However,amongcrashesthat occur during inclement weather or during wet roadway conditions, mature drivercrasheswereoverrepresented in crashes that occurredduring rainor onwet roadways.Nighttimevisibilitymayalsobeanissueformaturedrivers,asmaturedrivercrasheswereoverrepresentedduringduskandatnightatlocationswithstreetlights.Additionally,maturedriverswerealsooverrepresentedincrashesatintersections,includingatdrivewaysandinparkinglots,whichisconsistentwithnationalcrashtrends.Inthesecrashes,maturedriversoftenmidjudgethespeedorturningpathofconflictingdrivers.Finally,maturedriverswhowereat‐faultwereoverrepresentedincrashesatstop‐controlledintersectionsduringtheanalysis period. This is likely the result of issues associated with judging the gap inconflictingtraffic.
Thenumberofcrashesinvolvingvulnerableroadusersincreasedduringtheanalysisperiod.Thiscrashtyperepresentedapproximately7.1,6.8,and6.9percentoftotalcrashesin2014,2015, and 2016, respectively. National crash statistics found that fatal crashes involvingpedestrians often occur in urban areas, at non‐intersection locations, and during non‐

2
daylighthours.Morethanone‐thirdofpedestrianskilledinacrashwerefoundtobeundertheinfluenceofalcohol.Inlinewithnationaltrends,themajorityofpedestriancrashesinPennsylvaniaoccurredmostly inurbanareas.Thiswasexpectedbecausenon‐motorizedusers aremore prevalent in urban areas. Pedestrian crashes in Pennsylvania were alsooverrepresentedatnightandduringrainfallevents,whichsuggeststhatvisibilityisanissue.Overrepresentationwasalsoobservedforimproperorcarelessturnsatintersectionswhenpedestrianswerenotat‐fault,which suggests thatmotorvehicledriversmightalsohavevisibility problems and not see pedestrians at intersections during these non‐idealconditions.
Withregardtobicyclists,nationalstatistics indicatethat fatalcrashes involvingbicyclistsoccurfrequentlyatintersections.Amongthecontributoryfactors,themostcommonamongnationalstatisticsareafailuretoyieldtorightofway;limitedvisibility(darkclothingornolighting); failure toobey traffic controldevices; operatingunder the influenceof alcohol,drugs, or medication; and improper crossing of roadway or intersection. In the presentstudy, themajority of bicycle crashes occurred in urban areas, which is consistentwithnational trends. This was expected because non‐motorized users are more prevalent inurbanareas.Amongthebicyclecrashes inPennsylvania, therewasoverrepresentationatnightandduringrainfallevents,whichsuggests thatvisibility isan issue.Failuretoobeytrafficcontroldeviceswasacontributoryfactorinseveralbicyclecrashes,particularlywhenthebicyclistwasat‐fault,which is also consistentwithnational crash statistics involvingbicyclists.
National crash statistics indicate that motorcyclists are more likely to be involved incollisions with fixed objects, and motorcycle crashes are likely to involve speeding andalcoholrelativetocrashesinvolvingothervehicletypes.InPennsylvania,crashesinvolvingmotorcyclistsgenerallyoccurredoncurvesatnight.Wetroadwayconditionsanddrivingunderintheinfluenceofalcoholwereotherfactorsthatwereoverrepresentedincrashesinvolvingmotorcyclists.
Littlenationaldataareavailablerelatedtothe frequencyorseverityofcrashes involvinghorse‐driven buggies. In the present study, crashes involving horse‐driven buggieswereoverrepresented at night and involved careless turning and rear‐end collisions. Thissuggeststhatbuggiesmaynotbeadequatelyvisibletomotorvehicledriversatnight,andthatthespeeddifferentialbetweenhorse‐drivenbuggiesandmotorvehiclescontributestorear‐endcollisions.
Fatalandinjuryguiderailcrashesincreasedthroughouttheanalysisperiodandrepresented0.2percentoftotalcrashesin2014to0.3percentoftotalcrashesin2016.Amongnationalcrashstatistics,collisionswithguiderailrepresented2.8percentofthetotalfatalcrashesintheUnitedStates.in2015.Arolloveroccurredin19percentofthecrashes.Inthepresentstudy, guiderail crasheswereoverrepresentedon rural roadsandhorizontal curves, andmulti‐vehicleguiderailcrasheswereoverrepresentedonwetpavementsurfacesatnight.This suggests that drivers fail to adequately adjust their travel speeds along horizontalcurves of two‐lane rural highways. Improved delineation (e.g., signs and pavementmarkings) may reduce these crash types. Further, fatal and injury collisions involving

3
guiderailweremorelikelywhendriverswereoperatingtheirvehicleundertheinfluenceofalcoholorwereotherwiseimpaired.DUIcheckpointsonruralhighwaysmaymitigatethiscrashtype.
About 2 percent of crashes in the United States are attributed to vehicle failures. InPennsylvania,about2.3percentoftotalcrasheswereattributedtovehiclefailures.Nationalstatisticsindicatedthatvehiclefailure‐relatedcrashesaremostfrequentlycausedbytires(43percent),brakes (25percent),andsteering/suspension/ transmission/engine (10.5percent)breakdowns.Inthepresentstudy,themostcommonvehiclefailurecrasheswereassociatedwithtire,brakesystems,andsteering,whichisconsistentwithnationalstatistics.Anincreasedfocusonthesesystemsduringannualinspectionsmayhelptomitigatethesefailuresandreducethiscrashtype.
PROJECT PURPOSE AND OBJECTIVES
Fatalitiesresulting fromtrafficcrashes inPennsylvaniaduringthemostrecent fiveyearsrangedfromalowof1,089in2016toahighof1,310in2012.Duringthissametimeperiod,injuriesresultingfromtrafficcrashesrangedfromalowof79,758in2014toahighof87,839in2011.Morethan120,000trafficcrasheswerereportedannuallyduringthissamefive‐yearperiod, suggesting thatmany incidents result inproperty‐damageonly.These crashstatisticsrepresentasignificantcosttosociety.Inordertoeffectivelyapplyfederalfundingto manage safety programs in the Commonwealth, the Pennsylvania Department ofTransportation(PennDOT)seeksinformationaboutthecontributoryfactorsassociatedwithtrafficcrashes.
Thepurposeofthisprojectwastoidentifyannualtrendsandcontributoryfactorsoffourspecificcrashtypes.Thecrashtypesaredefinedasfollows:
1. Olderormaturedrivers:Thiscrashtypeinvolvesdriversaged65andolder,aswellasdriversaged75andolder.
2. Vulnerableroadusers:Thiscrashtypeprimarilyincludespedestrians,bicyclists,andmotorcyclists,butalsoincludesnon‐motorizedhorse‐drivenbuggies.
3. Guiderailfatalandseriousinjurycrashes:Thiscrashtypeincludesthosethatinvolvevehiclescollidingwithguiderailalongtheoutside(right‐side)ofthetraveledwayoralongtheinside(median)ofadividedhighway.
4. Motorvehicle failures:This crash type involves collisions that result fromamotorvehiclefailure(e.g.,brakefailure,tireeruption,etc.).
Research Tasks
Thisprojectwascompletedintwophases.ThefirstphaseoftheprojectinvolvedcompilingthemostrecentthreeyearsofcrashdataonroadwaysinPennsylvaniainordertoidentifythefourcrashtypesofinterestforthestudy.Thesampleofcrashdataincludedallcrashes

4
includedinPennDOT’scrashreportingsystemdatafiles.Roadwayinventory,trafficvolume,andothersite‐specificdatawerethenappendedtothecrashdatainordertoidentifytherangeoffactorscontributingtothefourcrashtypesofinterest.
Thepurposeofthesecondphaseofworkwastoundertakeacomprehensiveanalysisofthecrashdatafilescompiledduringthefirstphase.Thisincludedeffortstosummarizethetotalnumberofcrashesforthefourcrashtypesincludedinthestudy.Thecontributoryfactorsidentified in the electronic data files were summarized in tabular form (e.g., location ofcrashes, timeofday,etc.).Additionally, foreachof the four crash types identifiedabove,proportionsorfrequenciesofthecrashtypesofinterestwerecomparedtoareferencegrouptodetermine if therewasoverrepresentationof theparticularcrash typeof interest.Forexample, theproportionof rear‐end crashes at signalized intersections involving at‐faultmaturedriversovertheageof65yearswascomparedtotheproportionofrear‐endcrashesnotinvolvingmaturedriversatsignalizedintersections.
Theprimaryoutcomeoftheanalysiswastoidentifypossiblecausalfactorsassociatedwiththe four crash types of interest, and to determine if these factorswere overrepresentedrelativetothebaselineorcomparisoncategory.Theresultsof thestatistical testswillbeused to identify the locationsor circumstances thatmaybe consideredwhendevelopingcrashmitigationstrategiesforthefourcrashtypesofinterest.
Organization of the Report
Thisreport isorganized into foursubsequentsections.The firstsectionreviewsthedatarequestandthecodesthatwereusedtoidentifythefourcrashtypesincludedintheanalysis.Thesecondsectionprovidestheresultsofthedetaileddataanalyses.Inthissection,thedataare summarized in tabular form, and the statistical tests thatwere used to perform thecomparisonsbetweenthecrashtypesofinterestandthereferencegroupareshown.Thethirdsectionprovidesadiscussionoftheresults,includingcomparisonstonationaltrendsforthefourcrashtypesincludedinthepresentstudy.Thefourthsectionisasummaryofthemainfindingsfromtheproject.
DATA REQUEST AND CRASH TYPE IDENTIFICATION
Three data sources were requested for the present study. A description of each issummarizedbelow:
CrashData: All crashes occurring on roadways for the years 2014 through 2016(inclusive)wereincludedinthisrequest.AmongthePennDOTcrashdatafileswereinformationrelatedtotheevent,vehicles,andoccupantsinvolvedinthecrash.Allofthedifferentdatatables includedauniquecrashrecordnumbersothattheevent,vehicle, and occupant information could be linked. Additionally, the crash data

5
includedwhere theeventoccurredalongPennDOT’s linearreferencingsystem,sothatthecrashdatacouldbeappendedtotheroadwayinventorydata.
RoadwayInventoryData:Threeyearsofroadwayinventorydata(2014through2016,inclusive)werealsorequestedinordertoidentifyroadwaycharacteristicsassociatedwith each crash event. This file included information about the linear referencingsystem (in order to append crash data to the files), traffic volume, cross‐sectionelements,postedspeedlimit,androadsidehardwaredetails.
DriverLicenseData:Thedistributionofdriverlicensesbyvehicleclasscategoryandage for the years 2014 to 2016 (inclusive) was provided in order to develop anexposuremeasureforthematuredriverandmotorcyclistcrashtypesincludedintheanalysis.Forexample,thesedatawereusedtocomputestatisticssuchasthenumberofcrashesinvolvingmaturedriversasafunctionofthenumberofmaturelicenseddriversinPennsylvania.
Thefollowingstepsweretakentoidentifythefourcrashtypesconsideredintheanalysis:
Mature Drivers
Thematuredrivercrashanalysisinvolvedscreeningthedatatoidentifycrashesinvolvingdriverswhowere 65 years of age and older, aswell as drivers aged 75 and older. Thisinvolved using the DRIVER_COUNT_65_74 variable flag and the DRIVER_COUNT_75PLUSvariable flag located in thecrashdatabase.Anewvariable,DRIVER_COUNT_65PLUS,wascreatedtocaptureallmaturedriversaged65andolder.Thisprovidedthelistofallcrashesthatinvolvedamaturedriver(eitheraged65andolderor75andolder).
Inadditiontotheageflag,effortswereundertakentodetermineifthematuredriverwasat‐faultinthecrash,orifthematuredriverwasinvolvedinthecrash,butnotat‐fault.Thiswasdonetoidentifysituationsinwhichmaturedriversmighthavedifficultyorconfusionthatmight leadtoacrash.Theprocess to identifysuchcrashes fordriversaged65andolderrequiredjoiningthecrashreportnumbers(CRNs)fromthecrashdatabasewiththepersondatabase.ForeachCRN,recordswiththesamevalueofPRIME_FACTOR_UNIT(fromcrashtable)andUNIT_NUM(frompersontable)providedthelistofallpassengersintheat‐faultvehicle.ThePERSON_TYPE=1codewasusedtoidentifythedriveroftheat‐faultvehicleandtheAGE>=65(orAGE>=75)wasusedtodetermineifthematuredriverwasat‐fault.ThecrasheswerefurtherscreenedtoonlyconsiderthosewithPRIME_FACTOR_TYPE=D,whichrepresentedcrashescausedbyadrivererror(comparedtoenvironmentorvehicle‐relatedreasons).
Inordertoconfirmthatthesemethodsaccuratelyidentifiedmaturedriversthatwereat‐fault or not at‐fault in the crash using the electronic databases, a random sample of 40crashesinvolvingmaturedriversweresampledandreviewedusingPennDOT’sonlinecrashreportingtool.Thistoolprovidesanarrativesummaryofthecrashfromtheperspectiveoftheinvestigatingpoliceofficerwhorespondedtothecrashscene.Thenarrativesummariesconfirmed thatmaturedriverswereat‐fault inallof the40crashes identified.A random

6
sampleof20crashesinvolvingmaturedriverswhowerenotdeemedat‐faultinthecrashalsoconfirmedthattheelectroniccodeswereconsistentwiththenarrativesummariesofthecrashevent.
Vulnerable Road Users
The vulnerable road user crash analysis involved screening the data to identify crashesinvolvingmotorcycles,bicycles,pedestrians,andhorse‐drivenbuggies.Thisinvolvedusingthe MOTORCYCLE_COUNT variable, the BICYCLE_COUNT variable, and the PED_COUNTvariable located in the crash database for motorcycle, bicycle, and pedestrian crashes,respectively. To identify crashes involving non‐motorized horse‐driven buggies, theVEH_TYPEcodeinthevehicledatabasewasused.AVEH_TYPE=22foranyCRNrepresentedacrashinvolvinganon‐motorizedhorse‐drivenbuggy.NewvariablesMOTORCYCLE_FLAG,BICYCLE_FLAG,PED_FLAG,andHORSEBUGGY_FLAGwerecreatedforeachCRN,indicatingifacrashwasassociatedwithacertaintypeofvulnerableroaduser.Separatedatasetsforeach of the four vulnerable road user crash types were then extracted using the newlycreatedflagvariables.
Inaddition,theat‐faultvehicleorunitineachcrashwasdeterminedusingtheVEH_TYPEorUNIT_TYPE variables in the vehicle database. This process required joining the crashdatabasewiththevehicledatabasebasedonCRNvalues.ForeachCRN,recordswiththesamevalueofPRIME_FACTOR_UNIT(fromcrashtable)andUNIT_NUM(fromvehicletable)providedtheat‐faultvehicleinformationinthecrash.ValuesofVEH_TYPEandUNIT_TYPEvariables involved in this step included VEH_TYPE = 2 (motorcycle), VEH_TYPE = 20(unicycle, bicycle, or tricycle), VEH_TYPE = 21 (other pedalcycle), UNIT_TYPE = 31(pedestrian),andVEH_TYPE=22(horseandbuggy).Single‐unitmotorcyclecrasheswereidentified using the TOTAL_UNITS variable in the crash table. Note that, aswithmaturedrivercrashes,onlycrasheswithPRIME_FACTOR_TYPE=Dwereincludedintheanalysis.
Guiderail-related Fatal and Serious Injury Crashes
Theguiderailcrashanalysisinvolvedscreeningthedatatoidentifymotorvehiclecrashesthatinvolvedavehiclehittingaguiderailorguiderailend,resultinginafatalityorseriousinjuryamongmotorvehicleoccupants.Toidentifythesecrashes,thecrashdatabasewasfirstjoinedwiththeflagdatabasebasedonCRNs.Then,anewdatasetwascreatedbasedonthevaluesofvariablesHIT_GDRAIL,HIT_GDRAIL_END,andFATAL_OR_MAJ_INJ.Theresultingcrashes had a value of FATAL_OR_MAJ_INJ = 1 and either HIT_GDRAIL = 1 orHIT_GDRAIL_END=1.
Withinthenewdataset,thecrasheswerefurthersplitintosingle‐vehicleandmulti‐vehiclecrashes.CrasheswithVEHICLE_COUNT=1wereidentifiedassingle‐vehiclecrashesandtherest were consideredmulti‐vehicle crashes.Within the single‐vehicle crashes, 5 recordsinvolved pedestrians and 4 records involved phantom vehicles. A manual check of the

7
PennDOTCrashReportingSystemconfirmedthatnomotorvehicleoccupantwaskilledorseriously injured in the crashes involving pedestrians, so thesewere removed from theanalysis database. Phantom vehicle crashes were crashes in which the driver claimedanothervehiclecausedthecrash.Sincetherewasnosolidevidencefortheexistenceofaphantomvehicle,single‐vehicleguiderailcrashesinvolvingphantomvehicleswerekeptinthe single‐vehicle category. Again, only crashes with PRIME_FACTOR_TYPE = D wereincludedinthefinalanalysisdatabase.
Motor Vehicle Failures
Several selection criteria were considered to identify crashes involving motor vehiclefailures.TheVEHICLE_FAILUREflagintheflagdatabaseandtheVEH_FAILURE1codeinthevehicledatabasewerebothconsideredtoidentifythiscrashtype.However,bothwerefoundtoprovideanunusuallylargenumberofmotorvehiclefailurecrashes.AmanualcheckoftheseCRNsusingthePennDOTCrashReportingSystemrevealedthatneitherofthesetwofieldsservedasagoodindicatorofcrashescausedbyvehiclefailures,sincemanytimesthesecodeswereusedtoindicateamotorvehiclefailurethatoccurredasaresultofacrash(i.e.,thecrashcausedthemotorvehiclefailureandthemotorvehiclefailuredidnotcausethecrash).Finally,thePRIME_FACTOR_TYPE=Vcodeinthecrashdatabasewasusedtoidentifycrashesthatoccurredasaconsequenceofmotorvehiclefailures.
Summary Statistics
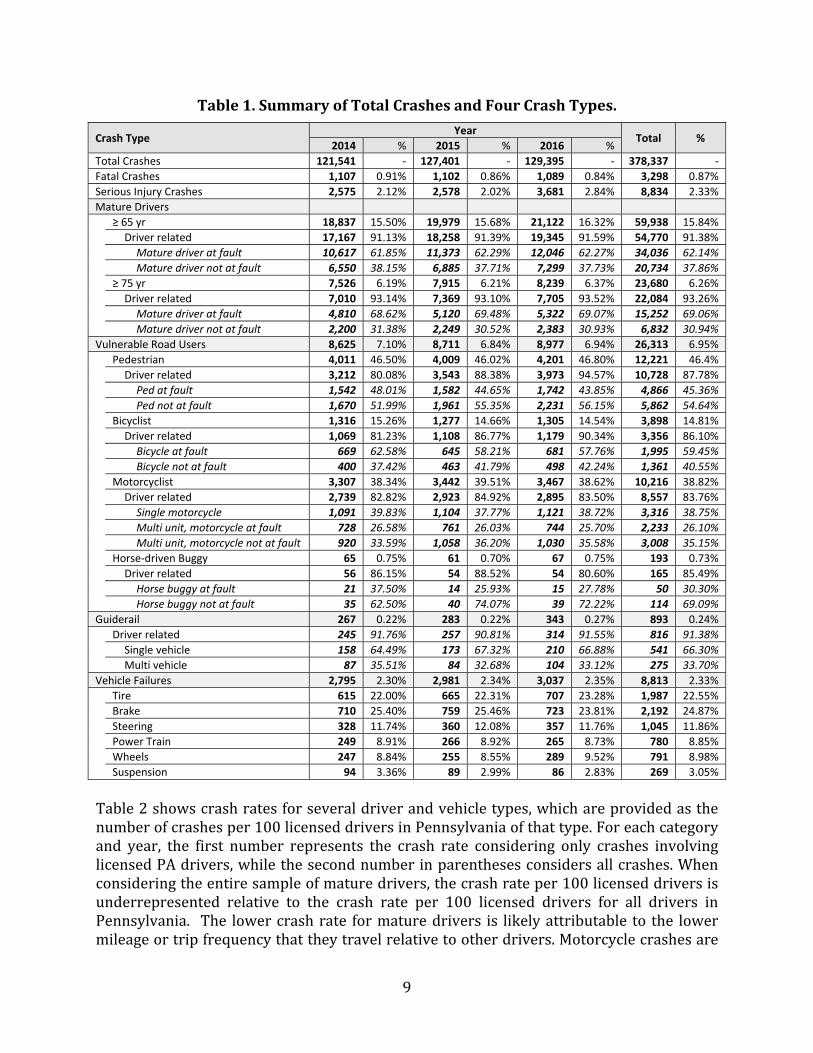
Theannualnumberoftotalcrashesandeachcrashtypeofinterestweredeterminedusingthecrashdata.Table1providesasummaryofthesedata.ThedatashowninTable1indicatethattotalcrasheshaveincreasedduringtheanalysisperiod;however,thenumberoffatalcrasheshasdeclinedoverthissameperiod.Seriousinjurycrashesappeartohaveincreasedduringthistime,butthisislikelyduetochangesinhowseriousinjurycrasheswerecodifiedbyinvestigatingofficersin2016.
Crashesinvolvingmaturedriversincreasedduringtheanalysisperiod.Driversaged65andolderrepresentapproximately15.5percentoftotalcrashesin2014,15.7percentoftotalcrashesin2015,and16.3percentoftotalcrashesin2016,whiledriversaged75andolderrepresentapproximately6.2percentoftotalcrashesin2014,6.2percentoftotalcrashesin2015,and6.4percentoftotalcrashesin2016.
Crashes involvingvulnerable roadusers increasedduring theanalysisperiod.This crashtyperepresentsapproximately7.1,6.8,and6.9percentoftotalcrashesin2014,2015,and2016,respectively.Fatalandseriousinjurycrashesinvolvingguiderailincreasedduringtheanalysisperiod.Thesecrashesrepresented7.3percentofthetotalfatalandseriousinjurycrashes in2014,7.7percentof thetotal fatalandserious injurycrashes in2015,and7.2percentofthetotalfatalandseriousinjurycrashesin2016.
8
Fatal and serious injury guiderail crashes increased throughout the analysis period, andrepresented 0.2 percent of total crashes in 2014 to 0.3 percent of total crashes 2016. Asignificantincreaseinthiscrashtypewasobservedbetween2015and2016.
Vehiclefailurecrashesalsoincreasedduringtheanalysisperiod.Thesecrashesrepresented2.3percentof the totalcrashes in2014,2.3percentof the totalcrashes in2015,and2.4percentof the total crashes in2016.All of thevehicle failure types increasedduring theanalysisperiod.Themostsignificantincreaseoccurredbetween2015and2016.
9
Table1.SummaryofTotalCrashesandFourCrashTypes.
Crash Type Year
Total % 2014 % 2015 % 2016 %
Total Crashes 121,541 ‐ 127,401 ‐ 129,395 ‐ 378,337 ‐
Fatal Crashes 1,107 0.91% 1,102 0.86% 1,089 0.84% 3,298 0.87%
Serious Injury Crashes 2,575 2.12% 2,578 2.02% 3,681 2.84% 8,834 2.33%
Mature Drivers
≥ 65 yr 18,837 15.50% 19,979 15.68% 21,122 16.32% 59,938 15.84%
Driver related 17,167 91.13% 18,258 91.39% 19,345 91.59% 54,770 91.38%
Mature driver at fault 10,617 61.85% 11,373 62.29% 12,046 62.27% 34,036 62.14%
Mature driver not at fault 6,550 38.15% 6,885 37.71% 7,299 37.73% 20,734 37.86%
≥ 75 yr 7,526 6.19% 7,915 6.21% 8,239 6.37% 23,680 6.26%
Driver related 7,010 93.14% 7,369 93.10% 7,705 93.52% 22,084 93.26%
Mature driver at fault 4,810 68.62% 5,120 69.48% 5,322 69.07% 15,252 69.06%
Mature driver not at fault 2,200 31.38% 2,249 30.52% 2,383 30.93% 6,832 30.94%
Vulnerable Road Users 8,625 7.10% 8,711 6.84% 8,977 6.94% 26,313 6.95%
Pedestrian 4,011 46.50% 4,009 46.02% 4,201 46.80% 12,221 46.4%
Driver related 3,212 80.08% 3,543 88.38% 3,973 94.57% 10,728 87.78%
Ped at fault 1,542 48.01% 1,582 44.65% 1,742 43.85% 4,866 45.36%
Ped not at fault 1,670 51.99% 1,961 55.35% 2,231 56.15% 5,862 54.64%
Bicyclist 1,316 15.26% 1,277 14.66% 1,305 14.54% 3,898 14.81%
Driver related 1,069 81.23% 1,108 86.77% 1,179 90.34% 3,356 86.10%
Bicycle at fault 669 62.58% 645 58.21% 681 57.76% 1,995 59.45%
Bicycle not at fault 400 37.42% 463 41.79% 498 42.24% 1,361 40.55%
Motorcyclist 3,307 38.34% 3,442 39.51% 3,467 38.62% 10,216 38.82%
Driver related 2,739 82.82% 2,923 84.92% 2,895 83.50% 8,557 83.76%
Single motorcycle 1,091 39.83% 1,104 37.77% 1,121 38.72% 3,316 38.75%
Multi unit, motorcycle at fault 728 26.58% 761 26.03% 744 25.70% 2,233 26.10%
Multi unit, motorcycle not at fault 920 33.59% 1,058 36.20% 1,030 35.58% 3,008 35.15%
Horse‐driven Buggy 65 0.75% 61 0.70% 67 0.75% 193 0.73%
Driver related 56 86.15% 54 88.52% 54 80.60% 165 85.49%
Horse buggy at fault 21 37.50% 14 25.93% 15 27.78% 50 30.30%
Horse buggy not at fault 35 62.50% 40 74.07% 39 72.22% 114 69.09%
Guiderail 267 0.22% 283 0.22% 343 0.27% 893 0.24%
Driver related 245 91.76% 257 90.81% 314 91.55% 816 91.38%
Single vehicle 158 64.49% 173 67.32% 210 66.88% 541 66.30%
Multi vehicle 87 35.51% 84 32.68% 104 33.12% 275 33.70%
Vehicle Failures 2,795 2.30% 2,981 2.34% 3,037 2.35% 8,813 2.33%
Tire 615 22.00% 665 22.31% 707 23.28% 1,987 22.55%
Brake 710 25.40% 759 25.46% 723 23.81% 2,192 24.87%
Steering 328 11.74% 360 12.08% 357 11.76% 1,045 11.86%
Power Train 249 8.91% 266 8.92% 265 8.73% 780 8.85%
Wheels 247 8.84% 255 8.55% 289 9.52% 791 8.98%
Suspension 94 3.36% 89 2.99% 86 2.83% 269 3.05%
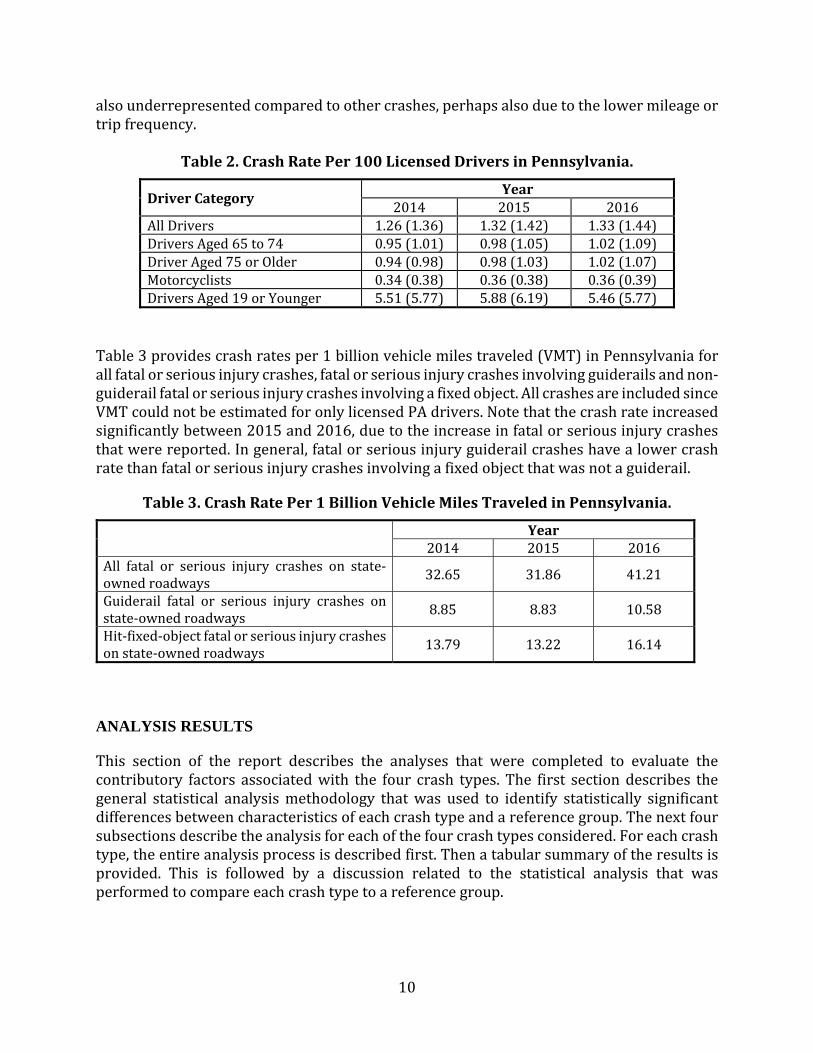
Table2showscrashratesforseveraldriverandvehicletypes,whichareprovidedasthenumberofcrashesper100licenseddriversinPennsylvaniaofthattype.Foreachcategoryand year, the first number represents the crash rate considering only crashes involvinglicensedPAdrivers,whilethesecondnumberinparenthesesconsidersallcrashes.Whenconsideringtheentiresampleofmaturedrivers,thecrashrateper100licenseddriversisunderrepresented relative to the crash rate per 100 licensed drivers for all drivers inPennsylvania. The lowercrashrate formaturedrivers is likelyattributable to the lowermileageortripfrequencythattheytravelrelativetootherdrivers.Motorcyclecrashesare
10
alsounderrepresentedcomparedtoothercrashes,perhapsalsoduetothelowermileageortripfrequency.
Table2.CrashRatePer100LicensedDriversinPennsylvania.
DriverCategoryYear
2014 2015 2016AllDrivers 1.26(1.36) 1.32(1.42) 1.33(1.44)DriversAged65to74 0.95(1.01) 0.98(1.05) 1.02(1.09)DriverAged75orOlder 0.94(0.98) 0.98(1.03) 1.02(1.07)Motorcyclists 0.34(0.38) 0.36(0.38) 0.36(0.39)DriversAged19orYounger 5.51(5.77) 5.88(6.19) 5.46(5.77)
Table3providescrashratesper1billionvehiclemilestraveled(VMT)inPennsylvaniaforallfatalorseriousinjurycrashes,fatalorseriousinjurycrashesinvolvingguiderailsandnon‐guiderailfatalorseriousinjurycrashesinvolvingafixedobject.AllcrashesareincludedsinceVMTcouldnotbeestimatedforonlylicensedPAdrivers.Notethatthecrashrateincreasedsignificantlybetween2015and2016,duetotheincreaseinfatalorseriousinjurycrashesthatwerereported.Ingeneral,fatalorseriousinjuryguiderailcrasheshavealowercrashratethanfatalorseriousinjurycrashesinvolvingafixedobjectthatwasnotaguiderail.
Table3.CrashRatePer1BillionVehicleMilesTraveledinPennsylvania.
Year
2014 2015 2016All fatal or serious injury crashes on state‐ownedroadways
32.65 31.86 41.21
Guiderail fatal or serious injury crashes onstate‐ownedroadways
8.85 8.83 10.58
Hit‐fixed‐objectfatalorseriousinjurycrashesonstate‐ownedroadways 13.79 13.22 16.14
ANALYSIS RESULTS
This section of the report describes the analyses that were completed to evaluate thecontributory factors associatedwith the four crash types. The first sectiondescribes thegeneral statistical analysismethodology thatwas used to identify statistically significantdifferencesbetweencharacteristicsofeachcrashtypeandareferencegroup.Thenextfoursubsectionsdescribetheanalysisforeachofthefourcrashtypesconsidered.Foreachcrashtype,theentireanalysisprocessisdescribedfirst.Thenatabularsummaryoftheresultsisprovided. This is followed by a discussion related to the statistical analysis that wasperformedtocompareeachcrashtypetoareferencegroup.
11
Statistical Methodology
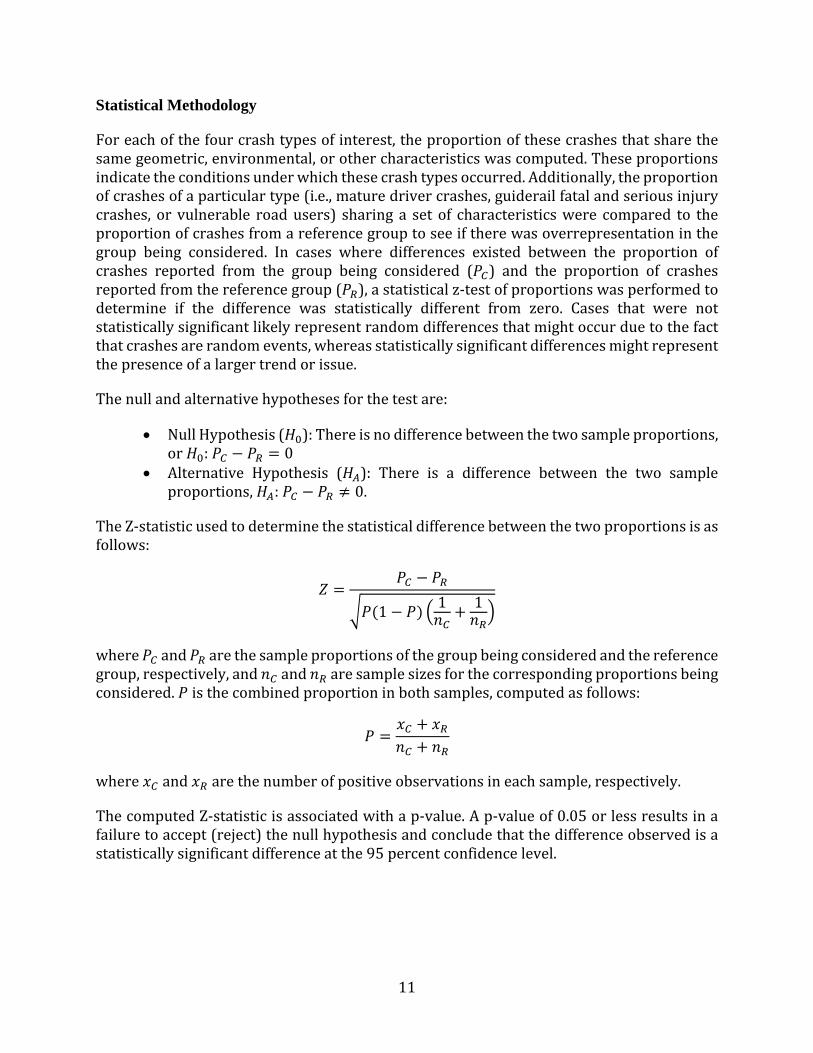
Foreachofthefourcrashtypesofinterest,theproportionofthesecrashesthatsharethesamegeometric,environmental,orothercharacteristicswascomputed.Theseproportionsindicatetheconditionsunderwhichthesecrashtypesoccurred.Additionally,theproportionofcrashesofaparticulartype(i.e.,maturedrivercrashes,guiderailfatalandseriousinjurycrashes, or vulnerable roadusers) sharing a set of characteristicswere compared to theproportionofcrashesfromareferencegrouptoseeiftherewasoverrepresentationinthegroup being considered. In cases where differences existed between the proportion ofcrashes reported from the group being considered ( ) and the proportion of crashesreportedfromthereferencegroup( ),astatisticalz‐testofproportionswasperformedtodetermine if the difference was statistically different from zero. Cases that were notstatisticallysignificantlikelyrepresentrandomdifferencesthatmightoccurduetothefactthatcrashesarerandomevents,whereasstatisticallysignificantdifferencesmightrepresentthepresenceofalargertrendorissue.
Thenullandalternativehypothesesforthetestare:
NullHypothesis( ):Thereisnodifferencebetweenthetwosampleproportions,or : 0
Alternative Hypothesis ( ): There is a difference between the two sampleproportions, : 0.
TheZ‐statisticusedtodeterminethestatisticaldifferencebetweenthetwoproportionsisasfollows:
1 1 1
where and arethesampleproportionsofthegroupbeingconsideredandthereferencegroup,respectively,and and aresamplesizesforthecorrespondingproportionsbeingconsidered. isthecombinedproportioninbothsamples,computedasfollows:
where and arethenumberofpositiveobservationsineachsample,respectively.
ThecomputedZ‐statisticisassociatedwithap‐value.Ap‐valueof0.05orlessresultsinafailuretoaccept(reject)thenullhypothesisandconcludethatthedifferenceobservedisastatisticallysignificantdifferenceatthe95percentconfidencelevel.

12
Mature Drivers
Appendix A provides four tables containing the crash characteristics formature drivers.Table4providesthecharacteristicsforat‐faultmaturedriversaged65andolderandTable5provides the characteristics forat‐faultmaturedriversaged75andolder.Table6andTable7providethecharacteristicsformaturedriversaged65andolderand75andolder,respectively,whoweredeemednotat‐faultinthereportedcrash.Inallcases,thereferencegroupthatwasusedtocomparethematuredrivercrashesisthesetofcrashesnotinvolvinganydriversaged65andolder.
Each of the tables is organized as follows. The first column represents the category thatdescribes a specific crash characteristic. The indentation and justification of numericalvaluesshowthelevelofdetailforeachcategory.Thedescriptionsthatarenotindentedrefertoprimarycategoriesthatareasubsetofthetotalreportedcrashes;thesenumericalvaluesareleft‐justified.Thedescriptionsindentedoncearesecondarycategoriesthatareasubsetoftheprimarycategory.Theassociatednumericalvaluesarecenter‐justifiedandthetextisalso italicized. Descriptions indented twice are tertiary categories that are presented assubsets of the preceding secondary category. The associated numerical values are right‐justifiedandthesecellsareshaded.
Eachoftheremainingcolumnsisdescribedasfollows:
Thesecondcolumnprovidesthecountofmaturedrivercrasheswithineachcategory. The third column provides the proportion of mature driver crashes that is
representedbythecategory.Forprimarycategories,thisispresentedasaproportionofallmaturedriver‐relatedcrashes,whereasforsecondaryandtertiarycategories,this ispresentedasaproportionof theassociatedprimaryorsecondarycategory,respectively.
Thefourthcolumnrepresentsthetotalnumberofcrashesfromthereferencegroupthatfallswithinthiscategory.Formaturedriver‐relatedcrashes,thereferencegroupreferstoallnon‐maturedriver‐relatedcrashes.
Thefifthcolumnprovidestheproportionofcrashesfromthereferencegroupthatfallswithinthiscategory.Aswiththesecondcolumn,thisispresentedasaproportionofallmaturedriver‐relatedcrashes,whereasforsecondaryandtertiarycategories,this ispresentedasaproportionof theassociatedprimaryorsecondarycategory,respectively.
Thesixthcolumnprovidesthedifferenceinproportionbetweenthematuredriver‐relatedcrashesandthereferencegroupcrashes foreachcategory.Positivevaluesrepresentcasesinwhichthematuredrivercrashcategoryisoverrepresentedrelativetothereferencecategory.
Furthermore, a red color is used to differentiate rows with a positive difference inproportionsbetweenthematuredrivergroupandthereferencegroupthatarestatisticallysignificantasobtainedfromthez‐testofproportions.Boldtextisusedtoidentifyrowsforwhichthisdifferenceisalsopracticallysignificant,asidentifiedbytheresearchteam.Rows
13
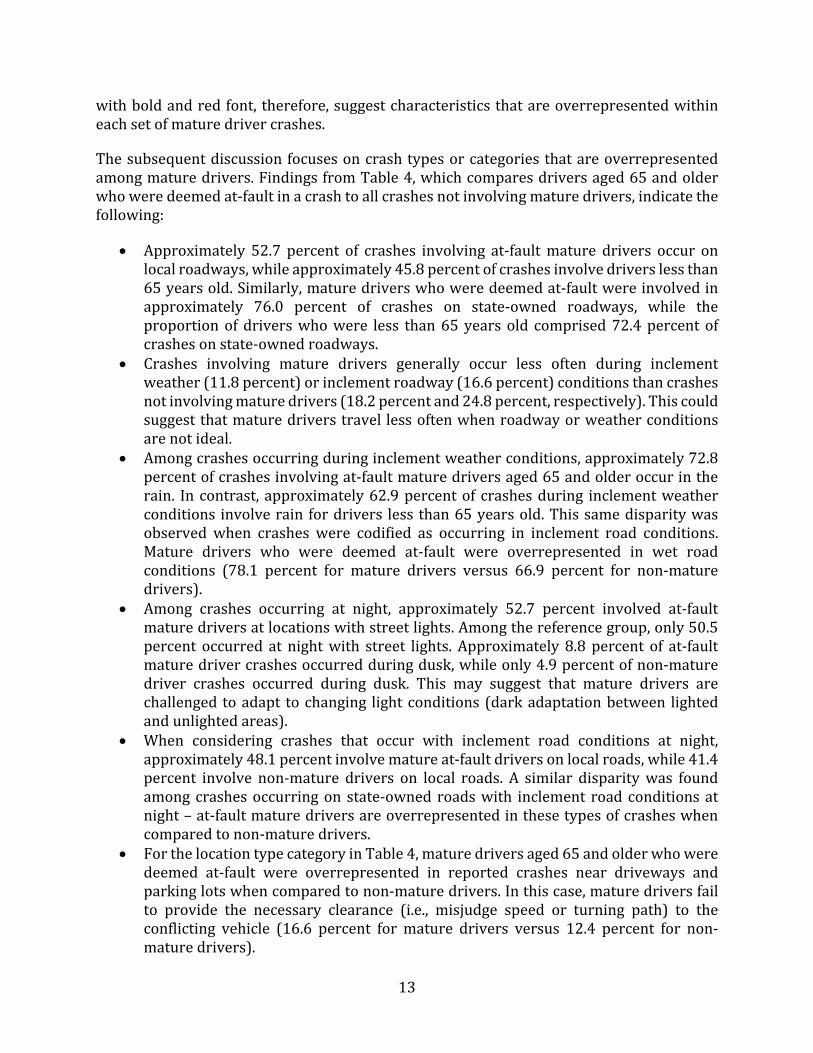
withboldandredfont,therefore,suggestcharacteristicsthatareoverrepresentedwithineachsetofmaturedrivercrashes.
Thesubsequentdiscussionfocusesoncrashtypesorcategoriesthatareoverrepresentedamongmaturedrivers.FindingsfromTable4,whichcomparesdriversaged65andolderwhoweredeemedat‐faultinacrashtoallcrashesnotinvolvingmaturedrivers,indicatethefollowing:
Approximately 52.7 percent of crashes involving at‐faultmature drivers occur onlocalroadways,whileapproximately45.8percentofcrashesinvolvedriverslessthan65yearsold.Similarly,maturedriverswhoweredeemedat‐faultwereinvolvedinapproximately 76.0 percent of crashes on state‐owned roadways, while theproportionofdriverswhowere less than65yearsold comprised72.4percentofcrashesonstate‐ownedroadways.
Crashes involving mature drivers generally occur less often during inclementweather(11.8percent)orinclementroadway(16.6percent)conditionsthancrashesnotinvolvingmaturedrivers(18.2percentand24.8percent,respectively).Thiscouldsuggestthatmaturedriverstravel lessoftenwhenroadwayorweatherconditionsarenotideal.
Amongcrashesoccurringduringinclementweatherconditions,approximately72.8percentofcrashesinvolvingat‐faultmaturedriversaged65andolderoccurintherain. Incontrast, approximately62.9percentof crashesduring inclementweatherconditions involverain fordrivers less than65yearsold.Thissamedisparitywasobserved when crashes were codified as occurring in inclement road conditions.Mature drivers who were deemed at‐fault were overrepresented in wet roadconditions (78.1 percent for mature drivers versus 66.9 percent for non‐maturedrivers).
Among crashes occurring at night, approximately 52.7 percent involved at‐faultmaturedriversatlocationswithstreetlights.Amongthereferencegroup,only50.5percent occurred at nightwith street lights. Approximately 8.8 percent of at‐faultmaturedrivercrashesoccurredduringdusk,whileonly4.9percentofnon‐maturedriver crashes occurred during dusk. This may suggest that mature drivers arechallengedtoadapt tochanging lightconditions (darkadaptationbetween lightedandunlightedareas).
When considering crashes that occur with inclement road conditions at night,approximately48.1percentinvolvematureat‐faultdriversonlocalroads,while41.4percent involve non‐mature drivers on local roads. A similar disparitywas foundamongcrashesoccurringon state‐owned roadswith inclement roadconditionsatnight–at‐faultmaturedriversareoverrepresentedinthesetypesofcrasheswhencomparedtonon‐maturedrivers.
ForthelocationtypecategoryinTable4,maturedriversaged65andolderwhoweredeemed at‐fault were overrepresented in reported crashes near driveways andparkinglotswhencomparedtonon‐maturedrivers.Inthiscase,maturedriversfailto provide the necessary clearance (i.e., misjudge speed or turning path) to theconflicting vehicle (16.6 percent for mature drivers versus 12.4 percent for non‐maturedrivers).
14
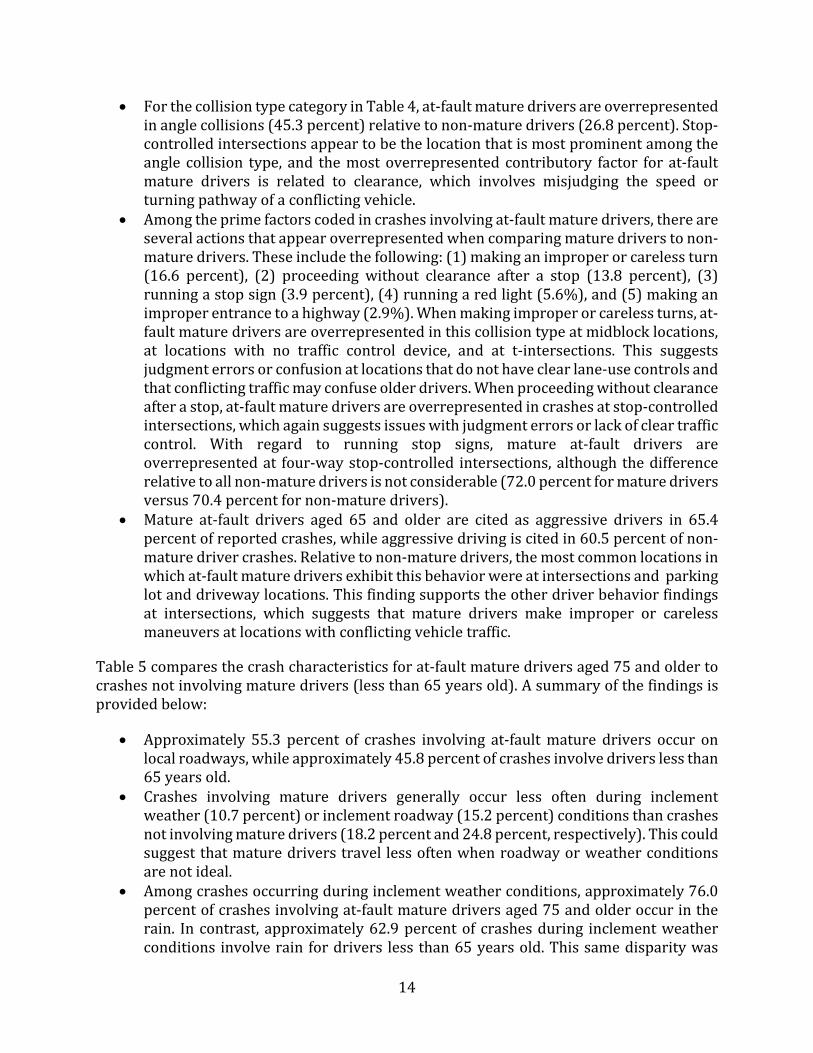
ForthecollisiontypecategoryinTable4,at‐faultmaturedriversareoverrepresentedinanglecollisions(45.3percent)relativetonon‐maturedrivers(26.8percent).Stop‐controlledintersectionsappeartobethelocationthatismostprominentamongtheangle collision type, and themostoverrepresented contributory factor forat‐faultmature drivers is related to clearance, which involves misjudging the speed orturningpathwayofaconflictingvehicle.
Amongtheprimefactorscodedincrashesinvolvingat‐faultmaturedrivers,thereareseveralactionsthatappearoverrepresentedwhencomparingmaturedriverstonon‐maturedrivers.Theseincludethefollowing:(1)makinganimproperorcarelessturn(16.6 percent), (2) proceeding without clearance after a stop (13.8 percent), (3)runningastopsign(3.9percent),(4)runningaredlight(5.6%),and(5)makinganimproperentrancetoahighway(2.9%).Whenmakingimproperorcarelessturns,at‐faultmaturedriversareoverrepresentedinthiscollisiontypeatmidblocklocations,at locations with no traffic control device, and at t‐intersections. This suggestsjudgmenterrorsorconfusionatlocationsthatdonothaveclearlane‐usecontrolsandthatconflictingtrafficmayconfuseolderdrivers.Whenproceedingwithoutclearanceafterastop,at‐faultmaturedriversareoverrepresentedincrashesatstop‐controlledintersections,whichagainsuggestsissueswithjudgmenterrorsorlackofcleartrafficcontrol. With regard to running stop signs, mature at‐fault drivers areoverrepresentedat four‐waystop‐controlled intersections,although thedifferencerelativetoallnon‐maturedriversisnotconsiderable(72.0percentformaturedriversversus70.4percentfornon‐maturedrivers).
Mature at‐fault drivers aged 65 and older are cited as aggressive drivers in 65.4percentofreportedcrashes,whileaggressivedrivingiscitedin60.5percentofnon‐maturedrivercrashes.Relativetonon‐maturedrivers,themostcommonlocationsinwhichat‐faultmaturedriversexhibitthisbehaviorwereatintersectionsandparkinglotanddrivewaylocations.Thisfindingsupportstheotherdriverbehaviorfindingsat intersections, which suggests that mature drivers make improper or carelessmaneuversatlocationswithconflictingvehicletraffic.
Table5comparesthecrashcharacteristicsforat‐faultmaturedriversaged75andoldertocrashesnotinvolvingmaturedrivers(lessthan65yearsold).Asummaryofthefindingsisprovidedbelow:
Approximately 55.3 percent of crashes involving at‐faultmature drivers occur onlocalroadways,whileapproximately45.8percentofcrashesinvolvedriverslessthan65yearsold.
Crashes involving mature drivers generally occur less often during inclementweather(10.7percent)orinclementroadway(15.2percent)conditionsthancrashesnotinvolvingmaturedrivers(18.2percentand24.8percent,respectively).Thiscouldsuggestthatmaturedriverstravel lessoftenwhenroadwayorweatherconditionsarenotideal.
Amongcrashesoccurringduringinclementweatherconditions,approximately76.0percentofcrashesinvolvingat‐faultmaturedriversaged75andolderoccurintherain. Incontrast, approximately62.9percentof crashesduring inclementweatherconditions involverain fordrivers less than65yearsold.Thissamedisparitywas

15
observedwhencrasheswerecodifiedasoccurringduringinclementroadconditions.Mature drivers who were deemed at‐fault were overrepresented in wet roadconditions (81.7 percent for mature drivers versus 66.9 percent for non‐maturedrivers).
Among crashes occurring at night, approximately 53.6 percent involved at‐faultmaturedriversatlocationswithstreetlights.Amongthereferencegroup,only50.5percent occurred at nightwith street lights. Approximately 9.5 percent of at‐faultmaturedrivercrashesoccurredduringdusk,whileonly4.9percentofnon‐maturedriver crashes occurred during dusk. This may suggest that mature drivers arechallengedtoadapt tochanging lightconditions (darkadaptationbetween lightedandunlightedareas).
When considering crashes that occur with inclement road conditions, crashesinvolvingat‐faultmaturedriversweremorelikelytooccuronlocalorstate‐ownedroads than other crashes. With respect to those crashes occurring during bothinclementroadconditionsandatnight,maturedriversareoverrepresentedonlocalroads.
ForthelocationtypecategoryinTable5,maturedriversaged75andolderwhoweredeemed at‐fault were overrepresented in reported crashes near driveways andparkinglotswhencomparedtonon‐maturedrivers.Inthiscase,maturedriversfailto provide the necessary clearance (i.e., misjudge speed or turning path) of theconflicting vehicle (16.5 percent for mature drivers versus 12.4 percent for non‐maturedrivers).
ForthecollisiontypecategoryinTable5,at‐faultmaturedriversareoverrepresentedinanglecollisions(48.7percent)relativetonon‐maturedrivers(26.8percent).Stop‐controlledintersectionsappeartobethelocationthatismostprominentamongtheangle collision type, and themostoverrepresented contributory factor forat‐faultmature drivers is related to clearance, which involves misjudging the speed orturningpathwayofaconflictingvehicle.
Amongtheprimefactorscodedincrashesinvolvingat‐faultmaturedrivers,thereareseveralactionsthatappearoverrepresentedwhencomparingmaturedriverstonon‐maturedrivers.Theseincludethefollowing:(1)makinganimproperorcarelessturn(18.3 percent), (2) proceeding without clearance after a stop (15.0 percent), (3)runningastopsign(4.5percent),(4)runningaredlight(5.4%),and(5)makinganimproperentrancetoahighway(3.5%).Whenmakingimproperorcarelessturns,at‐faultmaturedriversareoverrepresentedinthiscollisiontypeatmidblocklocations,at locations with no traffic control device, and at t‐intersections. This suggestsjudgmenterrorsorconfusionatlocationsthatdonothaveclearlane‐usecontrolsandthatconflictingtrafficmayconfuseolderdrivers.Whenproceedingwithoutclearanceafterastop,at‐faultmaturedriversareoverrepresentedincrashesatstop‐controlledintersections,whichagainsuggestsissueswithjudgmenterrorsorlackofcleartrafficcontrol.
Mature at‐fault drivers aged 75 and older are cited as aggressive drivers in 66.0percentofreportedcrashes,whileaggressivedrivingiscitedin60.5percentofnon‐maturedrivercrashes.Relativetonon‐maturedrivers,themostcommonlocationsinwhichat‐faultmaturedriversexhibitthisbehaviorwereintersectionsandparking

16
lotanddrivewaylocations.Thisfindingsupportstheotherdriverbehaviorfindingsat intersections, which suggests that mature drivers make improper or carelessmaneuversatlocationswithconflictingvehicletraffic.
Table6andTable7showthecrashcharacteristicsformaturedriversaged65andolderandaged75andolder, respectively,when thematuredriverwasnotdeemedat‐faultby theinvestigating police officer. As expected, the findings are similar to the at‐fault analysesdescribedforat‐faultmaturedrivers.Majordifferencesbetweentheat‐faultandnot‐at‐faultanalysesaredescribedbelow:
Among the collision types, at‐faultmature driverswere overrepresented in anglecollisions.Maturedriversthatweredeemednotat‐faultwerealsooverrepresentedforthiscollisiontype(44.8percentfornonat‐faultdriversaged65andolderversus26.8percentfordriverslessthan65yearsoldinTable6;50.1percentfornonat‐faultdriversaged75andolderversus26.8percentfordriverslessthan65yearsoldinTable7).Rear‐endcollisionswerealsooverrepresentedincrashesinvolvingnot‐at‐faultmaturedrivers.Amongthematuredriversaged65andolderwhowerenotat‐fault,40.3percentofcrasheswererear‐end,whileonly24.2percentofcrashesinthereferencegroupwererear‐end.Amongthematuredriversaged75andolderwhowerenotat‐faultinacrash,35.6percentwerecodedasrear‐endcollisions.
Amongtheprimecontributoryfactorsinvolvingmaturedriverswhowerenotat‐faultinthecrash,approximately12.9percentwerecodedasdistracteddrivingfordrivers65andolder,and12.2percentwerecodedasdistracteddrivingfordrivers75andolder.Thereferencegroupfoundthatonly10.0percentofdriversweredistracted.
Tailgatingwasalsoafactorcitedmorefrequentlyincrashesinvolvingmaturedriversnotat‐faultinareportablecrash.
Crashes involvinganimproperorcarelessturnwereoverrepresentedatmidblocklocations and at traffic signals when not‐at‐faultmature driverswere consideredrelativetoareferencegroup.
Vulnerable Road Users
Theanalysisofvulnerableroadusersissplitintofoursubsectionsrepresentingthedifferenttypes of vulnerable road users that exist: pedestrians, bicyclists,motorcyclists, and non‐motorized,horse‐drivenbuggies.
Pedestrians
AppendixBprovidestwotablescontainingthecrashcharacteristicsforcrashesinvolvingpedestrians.Table8providesthecharacteristicsforcrashesinvolvingpedestriansinwhichthepedestrianwasat‐fault,andTable9providesthecharacteristicsforcrashesinvolvingpedestriansinwhichthepedestrianwasnotat‐fault.Inbothcases,thereferencegroupthat

17
wasusedtocomparethepedestriancrashesisthesetofcrashesnotinvolvinganyvulnerableroadusers.Eachofthetablesisorganizedthesameasforthematuredrivercrashes.
Table 8 shows the crash characteristics or contributory factors in crashes involvingpedestrians inwhich the pedestrianwas determined to be at‐fault. The reference groupincludestheproportionofcrashesnotinvolvingvulnerableroadusers.Thefindingsfromthiscomparisonareprovidedbelow:
At‐faultpedestriancrashesareoverrepresentedonlocalroads(65.5percent)whencomparedtocrashesinvolvinglessvulnerableroadusers(45.7percent).
At‐fault pedestrian crashes are overrepresented in urban locations (81.9 percent)when compared to crashes involving other road users in urban locations (41.0percent).
Approximately 73.9 percent of at‐fault pedestrian crashes occurring duringinclementweatherarereportedduringarainfallevent,whileonly61.2percentofinclementweather‐relatedcrashesinvolvingotherroadusersoccurduringarainfallevent.Similarly,at‐faultpedestriancrashesareoverrepresentedatlocationswithwetroadwaysurfaceswhencomparedtocrashesinvolvinglessvulnerableroadusers.
Approximately 41.4 percent of at‐fault pedestrian crashes occur in non‐daylightperiods,whileonly35.2percentofcrashesinvolvinglessvulnerableroadusersoccurduringnon‐daylightperiods.Themajorityofat‐faultpedestriancrashesoccurringinnon‐daylight periods occur in urban areas (78.2 percent) at locationswith streetlights.While a lowproportionof at‐faultpedestrian crashesoccur in suburbanorruralareas(21.8percent),locationsthataredarkwithnostreetlightingexperiencea high proportion of at‐fault pedestrian crashes relative to crashes not involvingvulnerableroadusers.
Among the crashes occurring at intersections, at‐fault pedestrian crashes (53.1percent)areoverrepresentedatsignalizedintersectionswhencomparedtocrashesatintersectionsinvolvinglessvulnerableroadusers(39.6percent).
At‐fault pedestrian crashes are overrepresented at mid‐block locations (64.9percent)whencomparedtomid‐blockcrashesinvolvinglessvulnerableroadusers(60.2 percent). At the mid‐block locations, at‐fault pedestrian crashes areoverrepresentedatnight at locationswith street lightswhen compared to similarcrashtypesinvolvinglessvulnerableroadusers.
Table 9 shows the crash characteristics or contributory factors in crashes involvingpedestriansinwhichthepedestrianwasdeterminednottobeat‐fault.Thereferencegroupincludestheproportionofcrashesnotinvolvingvulnerableroadusers.Manyofthefindingsareconsistentwiththeat‐faultpedestriancrashanalysis(i.e.,nighttime,inclementweatherconditionsandatsignalizedintersections),althoughtherearesomedifferences,whicharesummarizedbelow:
Whenpedestrianswerenotconsideredat‐faultinvulnerableroadusercrashes,themostoverrepresenteddriveractionswereimproperorcarelessturnsatintersections(35.7percent).
18
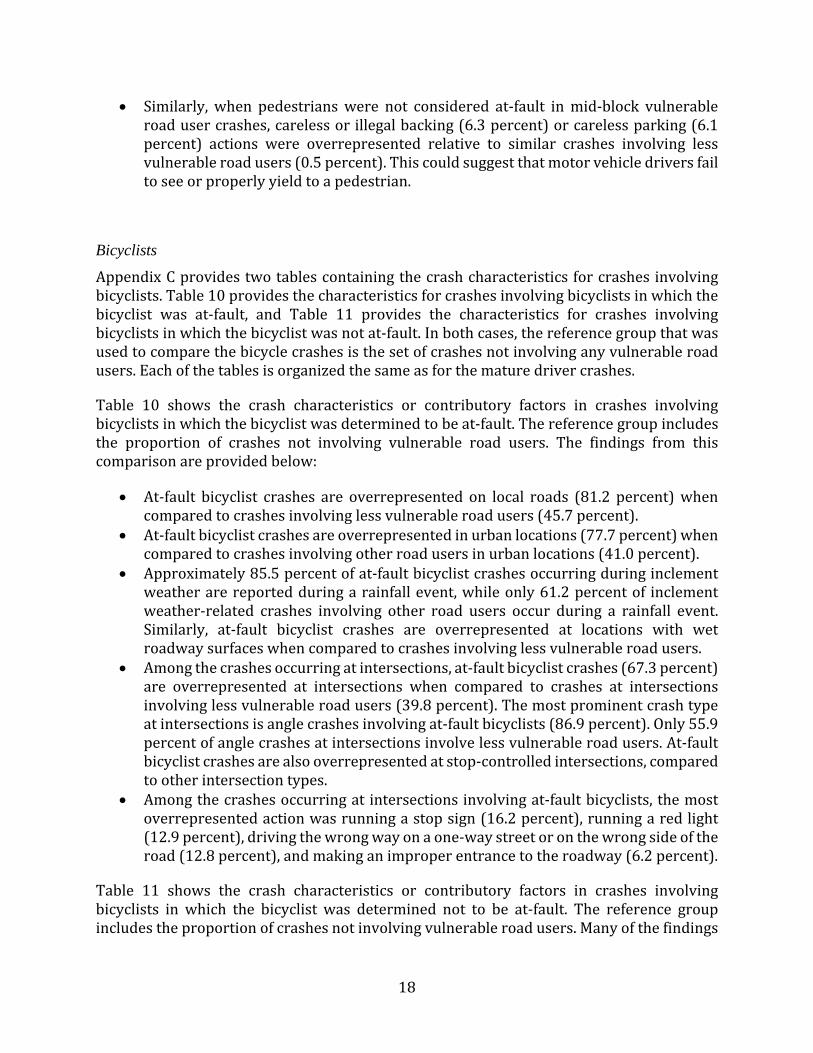
Similarly,when pedestrianswere not considered at‐fault inmid‐block vulnerableroadusercrashes,carelessorillegalbacking(6.3percent)orcarelessparking(6.1percent) actions were overrepresented relative to similar crashes involving lessvulnerableroadusers(0.5percent).Thiscouldsuggestthatmotorvehicledriversfailtoseeorproperlyyieldtoapedestrian.
Bicyclists
AppendixCprovidestwotablescontainingthecrashcharacteristicsforcrashesinvolvingbicyclists.Table10providesthecharacteristicsforcrashesinvolvingbicyclistsinwhichthebicyclist was at‐fault, and Table 11 provides the characteristics for crashes involvingbicyclistsinwhichthebicyclistwasnotat‐fault.Inbothcases,thereferencegroupthatwasusedtocomparethebicyclecrashesisthesetofcrashesnotinvolvinganyvulnerableroadusers.Eachofthetablesisorganizedthesameasforthematuredrivercrashes.
Table 10 shows the crash characteristics or contributory factors in crashes involvingbicyclistsinwhichthebicyclistwasdeterminedtobeat‐fault.Thereferencegroupincludesthe proportion of crashes not involving vulnerable road users. The findings from thiscomparisonareprovidedbelow:
At‐fault bicyclist crashes are overrepresented on local roads (81.2 percent)whencomparedtocrashesinvolvinglessvulnerableroadusers(45.7percent).
At‐faultbicyclistcrashesareoverrepresentedinurbanlocations(77.7percent)whencomparedtocrashesinvolvingotherroadusersinurbanlocations(41.0percent).
Approximately85.5percentofat‐faultbicyclistcrashesoccurringduringinclementweatherarereportedduringarainfallevent,whileonly61.2percentof inclementweather‐related crashes involving other road users occur during a rainfall event.Similarly, at‐fault bicyclist crashes are overrepresented at locations with wetroadwaysurfaceswhencomparedtocrashesinvolvinglessvulnerableroadusers.
Amongthecrashesoccurringatintersections,at‐faultbicyclistcrashes(67.3percent)are overrepresented at intersections when compared to crashes at intersectionsinvolvinglessvulnerableroadusers(39.8percent).Themostprominentcrashtypeatintersectionsisanglecrashesinvolvingat‐faultbicyclists(86.9percent).Only55.9percentofanglecrashesatintersectionsinvolvelessvulnerableroadusers.At‐faultbicyclistcrashesarealsooverrepresentedatstop‐controlledintersections,comparedtootherintersectiontypes.
Amongthecrashesoccurringatintersectionsinvolvingat‐faultbicyclists,themostoverrepresentedactionwasrunningastopsign(16.2percent),runningaredlight(12.9percent),drivingthewrongwayonaone‐waystreetoronthewrongsideoftheroad(12.8percent),andmakinganimproperentrancetotheroadway(6.2percent).
Table 11 shows the crash characteristics or contributory factors in crashes involvingbicyclists in which the bicyclist was determined not to be at‐fault. The reference groupincludestheproportionofcrashesnotinvolvingvulnerableroadusers.Manyofthefindings

19
areconsistentwiththeat‐faultbicyclistcrashanalysis;however,thebicyclistactionswerenotoverrepresentedinthiscrashtype.
Motorcyclists
AppendixDprovidesthreetablescontainingthecrashcharacteristicsforcrashesinvolvingmotorcycles. Table 12 provides the characteristics for single‐vehiclemotorcycle crashes,Table 13 provides the characteristics for multi‐vehicle crashes involvingmotorcycles inwhich the motorcycle was at‐fault, and Table 14 provides the characteristics for multi‐vehiclecrashesinvolvingmotorcyclesinwhichthemotorcyclewasnotat‐fault.Inallthreecases, thereferencegroupthatwasusedtocompare themotorcyclecrashes is thesetofcrashesnotinvolvinganyvulnerableroadusers.Eachofthetablesisorganizedthesameasforthematuredrivercrashes.
Table12showsthecrashcharacteristicsassociatedwithsingle‐vehiclemotorcyclecrashes.The reference group was crashes involving all road users that were not consideredvulnerableusersinthepresentstudy.Asummaryofthefindingsfromthecomparisonaredescribedbelow:
Single‐vehicle motorcycle crashes are overrepresented (53.5 percent) on curvedroadwayswhencomparedtocrashesoncurvedroadwaysinvolvinglessvulnerableroadusers(18.8percent).Amongthesecrashes,45.9percentarenon‐collisions(e.g.,riderlosescontrolofmotorcycleandslidesacrossroadway)involvingmotorcyclists.Inthereferencegroup,only4.5percentofcrashesinvolvingalessvulnerableroaduserwerecodifiedasnon‐collisions.
Amongthesingle‐vehiclemotorcyclistcrashesoccurringoncurvedroadwaysections,themostoverrepresentedactionwasover‐orunder‐compensationofthecurve(25.8percent).Speedinganddriverinexperiencewerealsooverrepresentedamongsingle‐vehiclemotorcyclecrashes.
Among crashes occurring during inclement weather conditions, single‐vehiclemotorcycle crashes were overrepresented during rainfall events (78.9 percent)relativetocrashesinvolvinglessvulnerableroadusers(61.2percent).
Among crashes occurring on an inclement roadway surface, single‐vehiclemotorcyclecrasheswereoverrepresentedwhentheroadsurfacewascoveredwithsandormud (21.1 percent)when compared to similar crash contributory factorsinvolvinglessvulnerableroadusers(0.9percent).
Single‐vehiclemotorcyclecrasheswereoverrepresentedincrashesalongcurvesatnight(16.8percent)whencomparedtothesamecrashtypeinvolvinglessvulnerableroadusers(8.3percent).
Single‐vehicle motorcycle crashes were overrepresented in crashes along curveswhenthedriverwasspeedingordrivingtoofastforconditions(19.7percent)relativetothesamecrashtypeinvolvinglessvulnerableroadusers(8.2percent).
Single‐vehiclemotorcyclecrasheswereoverrepresentedinhit‐fixed‐objectcrashes(43.3percent)whencomparedtothesamecrashtypeinvolvinglessvulnerableroad

20
users (30.9 percent). The most prominent contributory factor in single‐vehiclemotorcyclecrasheswithfixedobjectswasspeeding.
Driving under the influence of alcohol was cited as a contributory factor in 17.9percentofsingle‐vehiclemotorcyclecrashes,whichwassignificantlyhigherthanthesamecrashcauseforlessvulnerableroadusers(8.4percent).
Table 13 compares multi‐vehicle crashes involving at‐fault motorcyclists to a referencegroupofroadusersthatwerenotincludedinthevulnerableroadusersgroupincludedinthepresentstudy.Themajorfindingsfromthiscomparisonaresummarizedbelow:
At‐faultmotorcyclecrashesinvolvingmultiplevehiclesareoverrepresentedonlocalroads(48.7percent)whencomparedtocrashesinvolvinglessvulnerableroadusers(45.7percent).
Among the multi‐vehicle crashes involving an at‐fault motorcyclist on curvedroadway sections, sideswipe collisions were overrepresented relative to similarcrash types among the reference group of crashes involving less vulnerable roadusers. The primary contributory factors that were identified in multi‐vehiclemotorcyclecrasheswereover‐orundercompensationat thecurve(19.7percent),drivingonthewrongsideoftheroad(8.5percent),andspeeding(8.5percent).
Traveling on wet roadway surfaces or during rainfall events were contributoryfactors that were overrepresented in multi‐vehicle motorcycle crashes duringinclementweatheror inclement roadway surface crashes relative to similar crashtypesnotinvolvingvulnerableroadusers.
Multi‐vehicle motorcycle crashes were overrepresented at intersections (42.8percent)relative to intersectioncrashesnot involvingvulnerableroadusers (39.8percent).Themostoverrepresentedcontributoryfactorsatintersectionsinvolvingat‐fault motorcyclists were careless passing or lane changing (11.2 percent) andspeeding(8.5percent).
Multi‐vehiclemotorcyclecrasheswereoverrepresentedneardrivewaysandparkinglots(9.3percent)relativetothereferencegroup(5.0percent)oflessvulnerableroadusers.
Multi‐vehicle motorcycle crashes involving an at‐fault motorcyclist under theinfluenceofalcoholmostoftenresultinfatalitiesandmajorinjuries(17.1percentand29.4percent,respectively)relativetothesamecrashtypeinvolvinglessvulnerableroadusers.
Table14comparesmulti‐vehiclecrashesinvolvingnot‐at‐faultmotorcycliststoareferencegroupofroadusersthatwerenotincludedinthevulnerableroadusersgroupinthepresentstudy.Thefindingsfromthisanalysiswereverysimilartotheat‐faultmotorcyclistanalysisdescribedabove.Afewdifferences,however,wereidentified,whicharedescribedbelow:
Not‐at‐faultmotorcyclecrashesinvolvingmultiplevehiclesareoverrepresentedonlocalroads(53.9percent)whencomparedtocrashesinvolvinglessvulnerableroadusers(45.7percent).
Oncurvedroadwaysections,multi‐vehiclecrashesinvolvingmotorcyclistsinwhichthemotorcyclistwasnotat‐faultinvolvedahighproportionofimproperorcareless
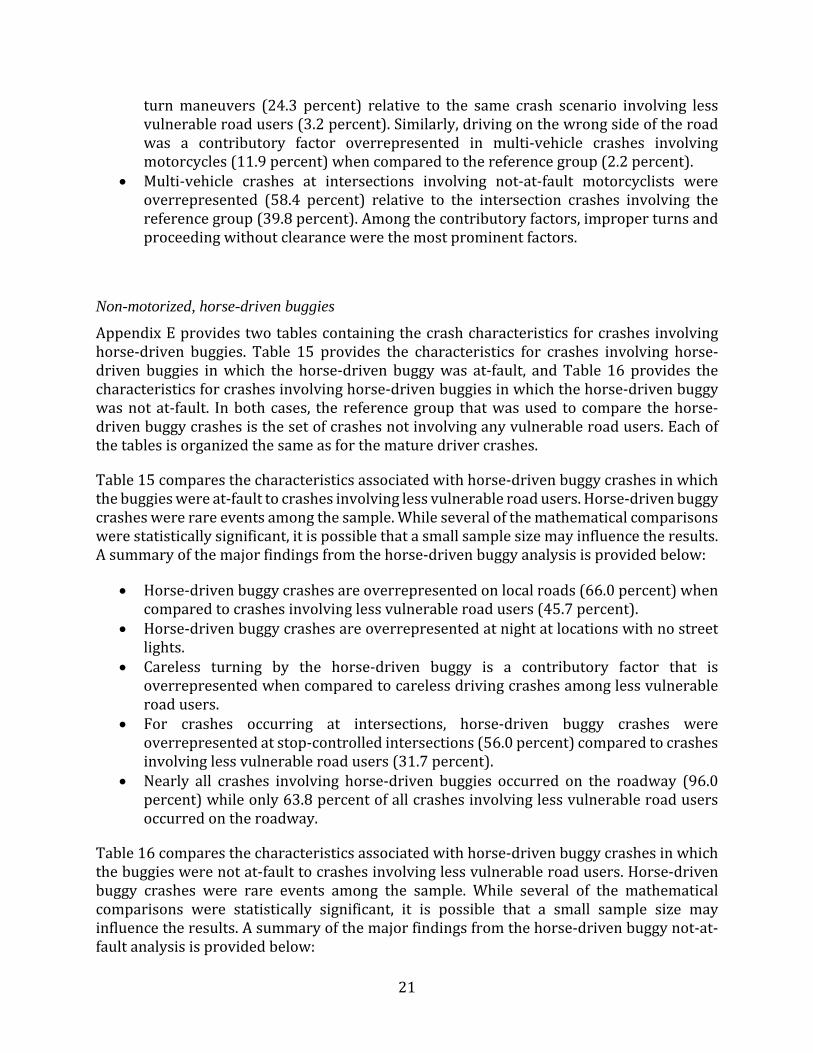
21
turnmaneuvers (24.3 percent) relative to the same crash scenario involving lessvulnerableroadusers(3.2percent).Similarly,drivingonthewrongsideoftheroadwas a contributory factor overrepresented in multi‐vehicle crashes involvingmotorcycles(11.9percent)whencomparedtothereferencegroup(2.2percent).
Multi‐vehicle crashes at intersections involving not‐at‐fault motorcyclists wereoverrepresented (58.4 percent) relative to the intersection crashes involving thereferencegroup(39.8percent).Amongthecontributoryfactors,improperturnsandproceedingwithoutclearancewerethemostprominentfactors.
Non-motorized, horse-driven buggies
AppendixEprovidestwotablescontainingthecrashcharacteristicsforcrashesinvolvinghorse‐driven buggies. Table 15 provides the characteristics for crashes involving horse‐driven buggies inwhich the horse‐driven buggywas at‐fault, andTable 16 provides thecharacteristicsforcrashesinvolvinghorse‐drivenbuggiesinwhichthehorse‐drivenbuggywasnotat‐fault. Inbothcases, the referencegroup thatwasused tocompare thehorse‐drivenbuggycrashesisthesetofcrashesnotinvolvinganyvulnerableroadusers.Eachofthetablesisorganizedthesameasforthematuredrivercrashes.
Table15comparesthecharacteristicsassociatedwithhorse‐drivenbuggycrashesinwhichthebuggieswereat‐faulttocrashesinvolvinglessvulnerableroadusers.Horse‐drivenbuggycrasheswererareeventsamongthesample.Whileseveralofthemathematicalcomparisonswerestatisticallysignificant,itispossiblethatasmallsamplesizemayinfluencetheresults.Asummaryofthemajorfindingsfromthehorse‐drivenbuggyanalysisisprovidedbelow:
Horse‐drivenbuggycrashesareoverrepresentedonlocalroads(66.0percent)whencomparedtocrashesinvolvinglessvulnerableroadusers(45.7percent).
Horse‐drivenbuggycrashesareoverrepresentedatnightatlocationswithnostreetlights.
Careless turning by the horse‐driven buggy is a contributory factor that isoverrepresentedwhencomparedtocarelessdrivingcrashesamonglessvulnerableroadusers.
For crashes occurring at intersections, horse‐driven buggy crashes wereoverrepresentedatstop‐controlledintersections(56.0percent)comparedtocrashesinvolvinglessvulnerableroadusers(31.7percent).
Nearly all crashes involving horse‐driven buggies occurred on the roadway (96.0percent)whileonly63.8percentofallcrashesinvolvinglessvulnerableroadusersoccurredontheroadway.
Table16comparesthecharacteristicsassociatedwithhorse‐drivenbuggycrashesinwhichthebuggieswerenotat‐faulttocrashesinvolvinglessvulnerableroadusers.Horse‐drivenbuggy crashes were rare events among the sample. While several of the mathematicalcomparisons were statistically significant, it is possible that a small sample size mayinfluencetheresults.Asummaryofthemajorfindingsfromthehorse‐drivenbuggynot‐at‐faultanalysisisprovidedbelow:

22
Nearly all horse‐driven buggy crashes occurred on state roadways (90.4 percent)whencomparedtocrashesonstateroadsinvolvinglessvulnerableroadusers(73.9percent).
Amongthemid‐blockcrashesinvolvinghorse‐drivenbuggycrashes,manyinvolvedrear‐endcrashes(68.3percent).Whencomparedtothereferencegroup,only28.3percentofmid‐blockcrashesinvolvedlessvulnerableroadusers(28.3percent).
Crashes involvingat‐faulthorse‐drivenbuggiesweremainlyclassifiedas rear‐endcollisions(65.8percent),whichrepresentsasignificantlylargerproportionthanthereferencegroup(25.9percentarerear‐endcollisions).
Nearly all at‐fault horse‐driven buggy crashes occurred on the roadway (94.7percent),whilethereferencegroupcrashesoccurredlessfrequentlyontheroadway(63.8percent).
Fatal and Serious Injury Crashes with Guiderail
AppendixFprovidesfourtablescontainingcrashcharacteristicsforfatalandseriousinjurycrashes(hereafterreferredtoasjustfatalandinjurycrashes)involvingguiderails.Table17and Table 18 provide the crash characteristics for single‐vehicle fatal or injury crashesinvolvingguiderails.Theformerusesthegroupofsingle‐vehiclenon‐fatalorinjurycrashesinvolvingguiderailsasareferencegroupwhile the latterusesthegroupofsingle‐vehiclefatalorinjurycrashesatother(non‐guiderail)fixedobjectsasthereferencegroup.Table19and Table 20 provide the crash characteristics for multi‐vehicle fatal or injury crashesinvolvingguiderails.Theformerusesthegroupofmulti‐vehiclenon‐fatalorinjurycrashesinvolvingguiderailsasareferencegroupwhilethelatterusesthegroupofmulti‐vehiclefatalorinjurycrashesatother(non‐guiderail)fixedobjectsasthereferencegroup.
Table17comparesthecrashcharacteristicsofsingle‐vehiclefatalandinjurycrasheswithguiderailtosingle‐vehiclenon‐fatalormajorinjurycrashesinvolvingguiderail.Asummaryofthemajorfindingsfromthiscomparisonisdescribedbelow:
Single‐vehicle fatal and injury crashes involving guiderail are overrepresented inruralareas(71.9percent)whencomparedtosingle‐vehiclepropertydamageonly(PDO)andlessseverecrashesinvolvingguiderailinruralareas(60.2percent).
Single‐vehicle fatal and injury crashes involving guiderail are overrepresented oncurved roadways (55.1 percent) when compared to single‐vehicle PDO and lessseverecrashesinvolvingguiderailoncurvedroadways(45.5percent).
Whenconsideringthecombinationofcurvedroadwaysinruralareas,single‐vehiclefataland injurycrashes involvingguiderailaresignificantlyoverrepresented(75.5percent)relativetosimilarcrashtypeswithalesssevereoutcome(61.0percent).
Whenconsideringtheprimefactorassociatedwithguiderailcrashes,speeding(6.7percent)oncurvedroadways(69.4percentofspeeding‐relatedcrashes)appearstobeoverrepresentedinfatalandinjurycrashesinvolvingguiderailwhencomparedtosimilarprimefactorsforPDOandlessseverecrashesinvolvingguiderail.

23
When considering speeding as the prime factor in single‐vehicle fatal and injurycrasheswithguiderail,acurvedroadway(69.4percent)appearsoverrepresentedtothereferencegroup(56.6percent).Atnighttime,speedingonacurvedroadwayisoverrepresented(60.0percent)relativetothereferencegroup(50.2percent).
Whenconsideringdrivingtoofastforconditionsastheprimefactorinfatalandinjurycrashes involving guiderail, events on curved roadways (70.0 percent) areoverrepresentedrelativetothereferencegroup(52.7percent).
Whenconsideringdrivingtoofastforconditionsastheprimefactor,andthenhittingthe guiderail as the first harmful event, overturning as themost harmful event isoverrepresented (35.2 percent) in fatal and injury crashes involving guiderail,relativetothereferencegroup(7.3percent).
Amongthesingle‐vehiclefatalandinjurycrashesinvolvingguiderail,approximately22.9 percent involve a driver affected by physical condition, which is a higherproportionthanthereferencegroup(16.9percent).Amongthesecrashes,impaireddrivers are overrepresented (59.7 percent) relative to the reference group (50.5percent).
Amongthespeeding‐relatedcrashesinvolvingasingle‐vehiclefatalorinjurycrashwith guiderail, events occurring on a curved roadway are overrepresented (66.8percent)relativetothereferencegroup(53.4percent).
Among the aggressive driving‐related crashes involving a single‐vehicle fatal orinjury crash with guiderail, events occurring on a curved roadway areoverrepresented(63.4percent)relativetothereferencegroup(50.2percent).
In Table 18, single‐vehicle fatal and injury crashes involving guiderail are compared tosingle‐vehiclefatalandinjurycrashesinvolvingotherfixedobjects.Manyofthefindingsarethe same as when the previous reference group was used. A few key differences aredescribedbelow:
Single‐vehiclefatalandinjurycrasheswithguiderailoccurinhigherproportionsonInterstate roadways (16.6 percent) when compared to the reference group (4.9percent).Similarly,fatalandinjurycrasheswithguiderailoccurinhigherproportionon state roadways (87.1 percent) when compared to the reference group (72.6percent).
Single‐vehiclefatalandinjurycrasheswithguiderailoccurinhigherproportionsinrural areas (71.9 percent)when compared to the reference group (68.1 percent).Similarly,fatalandinjurycrasheswithguiderailoccurinhigherproportiononcurvedroadways(55.1percent)whencomparedtothereferencegroup(49.3percent).
Table19comparesthecrashcharacteristicsofmulti‐vehiclefatalandinjurycrasheswithguiderailtomulti‐vehiclenon‐fatalorseriousinjurycrashesinvolvingguiderail.Asummaryofthemajorfindingsfromthiscomparisonisdescribedbelow:
Multi‐vehiclefatalandinjurycrashesinvolvingguiderailareoverrepresentedinruralareas (66.5 percent)when compared tomulti‐vehicle PDO or less severe crashesinvolvingguiderailinruralareas(51.4percent).
24
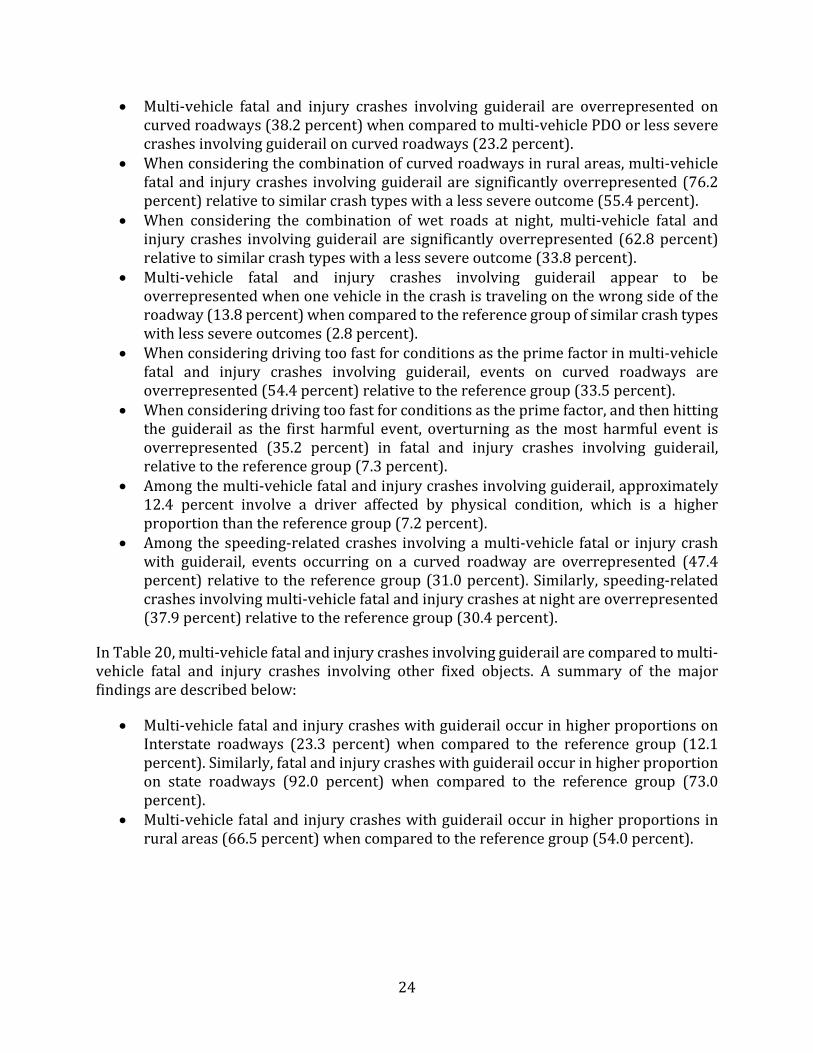
Multi‐vehicle fatal and injury crashes involving guiderail are overrepresented oncurvedroadways(38.2percent)whencomparedtomulti‐vehiclePDOorlessseverecrashesinvolvingguiderailoncurvedroadways(23.2percent).
Whenconsideringthecombinationofcurvedroadwaysinruralareas,multi‐vehiclefataland injurycrashes involvingguiderailaresignificantlyoverrepresented(76.2percent)relativetosimilarcrashtypeswithalesssevereoutcome(55.4percent).
When considering the combination of wet roads at night, multi‐vehicle fatal andinjury crashes involvingguiderail are significantlyoverrepresented (62.8percent)relativetosimilarcrashtypeswithalesssevereoutcome(33.8percent).
Multi‐vehicle fatal and injury crashes involving guiderail appear to beoverrepresentedwhenonevehicleinthecrashistravelingonthewrongsideoftheroadway(13.8percent)whencomparedtothereferencegroupofsimilarcrashtypeswithlesssevereoutcomes(2.8percent).
Whenconsideringdrivingtoofastforconditionsastheprimefactorinmulti‐vehiclefatal and injury crashes involving guiderail, events on curved roadways areoverrepresented(54.4percent)relativetothereferencegroup(33.5percent).
Whenconsideringdrivingtoofastforconditionsastheprimefactor,andthenhittingthe guiderail as the first harmful event, overturning as themost harmful event isoverrepresented (35.2 percent) in fatal and injury crashes involving guiderail,relativetothereferencegroup(7.3percent).
Amongthemulti‐vehiclefatalandinjurycrashesinvolvingguiderail,approximately12.4 percent involve a driver affected by physical condition, which is a higherproportionthanthereferencegroup(7.2percent).
Among thespeeding‐relatedcrashes involvingamulti‐vehicle fatalor injurycrashwith guiderail, events occurring on a curved roadway are overrepresented (47.4percent)relativetothereferencegroup(31.0percent).Similarly,speeding‐relatedcrashesinvolvingmulti‐vehiclefatalandinjurycrashesatnightareoverrepresented(37.9percent)relativetothereferencegroup(30.4percent).
InTable20,multi‐vehiclefatalandinjurycrashesinvolvingguiderailarecomparedtomulti‐vehicle fatal and injury crashes involving other fixed objects. A summary of the majorfindingsaredescribedbelow:
Multi‐vehiclefatalandinjurycrasheswithguiderailoccurinhigherproportionsonInterstate roadways (23.3 percent) when compared to the reference group (12.1percent).Similarly,fatalandinjurycrasheswithguiderailoccurinhigherproportionon state roadways (92.0 percent) when compared to the reference group (73.0percent).
Multi‐vehiclefatalandinjurycrasheswithguiderailoccurinhigherproportionsinruralareas(66.5percent)whencomparedtothereferencegroup(54.0percent).

25
Motor Vehicle Failures
Table 21 in Appendix G shows the characteristics for motor vehicle failure crashes. Noreferencegroupisusedforthiscrashtypeduetoitsuniqueness.Themajorfindingsfromthisassessmentaredescribedbelow:
Approximately 22.5 percent of the 8,813 vehicle failures between2014and2016involvedtires.Amongthese, themost frequentcharacteristicsassociatedwith tirefailureswerethattheyoccurredatnight(30.6percent),wereoncurvedroadways(26.3percent),orinvolvedinclementweather(25.3percent).
Approximately 24.9 percent of the 8,813 vehicle failures between2014and2016involved brakes. Among these, the most frequent characteristics associated withbrake system failures were that they occurred at intersections (45.5 percent) oroccurredatnight(20.5percent).
Approximately 11.9 percent of the 8,813 vehicle failures between2014and2016involved steering.Among these, themost frequent characteristics associatedwithsteeringsystemfailureswerethattheyoccurredatnight(34.1percent)oroccurredoncurvedroadways(22.6percent).
Approximately 3.1 percent of the 8,813 vehicle failures between 2014 and 2016involvedthevehiclesuspension.Approximately30.9percentofcrashesassociatedwithvehiclesuspensionfailuresoccurredatnight,whileapproximately19.7percentoccurredoncurvedroadways.
Approximately 8.9 percent of the 8,813 vehicle failures between 2014 and 2016involvedthevehiclepowertrain.Amongthesecrashes,25.4percentoccurredatnightwhile20.9percentoccurredatintersections.
Approximately 9.0 percent of the 8,813 vehicle failures between 2014 and 2016involved the vehicle wheels. Among these crashes, approximately 31.1 percentoccurredatnightand16.7percentoccurredoncurvedroadways.
DISCUSSION
Thissectionofthereportcomparesthesafetytrendsforthefourcrashtypesinthepresentstudytonationaltrendsforthesamefourcrashtypes.
Mature Drivers
Generally across the United States, the number of mature drivers aged 65 and olderincreasedby29percentbetween2006and2015,witha33percentincreaseinthenumberof older licensed drivers during this same period (NHTSA 2017a). The number of totallicenseddriversintheUnitedStatesonlyincreased8percentduringthatsametimeperiod(NHTSA2017a).Duetothedecreasedphysicalandmentalfitnessthataccompaniesaging,itisexpectedthatstudies investigatingthecontributingcharacteristicsofcrashes involvingmaturedriverswillprovidemeaningfulinsightsaboutthepossiblemeasuresthatmaybe

26
consideredtomitigatecrashesinvolvingthesedrivers.Maturedriverstypicallyexperiencereducedphysicalskills,suchasstrength,flexibility,andrangeofmotion,aswellascognitiveskills,suchasmemoryandprocessingspeed,andvisualfunctions(Pottsetal.2004).Thesedeteriorations can result in more crashes with increased rates of injury severities andfatalities.
ForallcrashesintheUnitedStates,driversaged65andolderwerefoundat‐faultinbetween45and68percentofcrashesinvolvingmaturedrivers–theproportionofat‐faultdriversincreasedasaged increased.For fatalcrashes,driversaged65andolderwereat‐fault inbetween 52 and 73 percent of crashes involving mature drivers. This proportion alsoincreased as driver age increased (Potts et al. 2004).Mature driverswere involved in agreaterpercentageofanglecrasheswhencomparedtoalldrivingagesinanglecrashes;45percentofcrashesforallageswereanglecrashes,while50to64percentofcrashesinvolvingolderdriverswereangle collisions (Stutts et al. 2009).Maturedriverswerealso3 to13percentmorelikelytobeinvolvedincrashesatintersections;1to6percentmorelikelytobeinvolvedincrashesatstop‐controlledintersections;and1to6percentmorelikelytobeinvolvedincrashesatdrivewaysoralleys(Stuttsetal.2009).
Nationally, when compared to the overall driving population, the occurrence of crashesinvolvingmaturedriversdiffered for certainenvironmental characteristics.Most crashesinvolvingmaturedriversoccurredduringnoadverseweatherconditions.Approximately85percentofmaturedrivercrashesoccurredduringnoadverseconditions,while79percentof crashes for all drivers occurred during no adverse conditions (Stutts et al. 2009).Additionally, older drivers were 6 to 17 percent more likely to be involved in crashesbetween10a.m.and2p.m.thanthetotalpopulation,andwere12to30percentmorelikelytobeinvolvedincrashesduringdaylight(Stuttsetal.2009).Alcoholordrugsandspeedingwerealsolesslikelytobecontributingfactorsincrashesformaturedrivers,whilefailuretoyieldwasmorelikelytobeamaturedrivercontributingfactorincrashes(Stuttsetal.2009).
Inthepresentstudy,maturedriversaged65andolderwerefoundtobeinvolvedin15.8percentofcrashesandmaturedriversaged75andolderwerefoundtobeinvolvedin6.3percent of crashes. Thesemature drivers were at‐fault in 62.1 percent of crashes (69.1percentfortheoldergroup).Thisseemstobeconsistentwiththehighersideofthenationaltrends. In Pennsylvania, crashes involving mature drivers occurred less often duringinclementweatherconditionsorinclementroadwaysurfaceconditions,whichsuggeststhatmaturedriversmighttravel less frequentlywhenroadwayorweatherconditionsarenotideal.However,amongcrashesthatoccurduringinclementweatherorroadwayconditions,maturedrivercrasheswereoverrepresentedincrashesthatoccurredduringrainoronwetroadways.Nighttimevisibilitymayalsobe an issue formaturedrivers, asmaturedrivercrasheswereoverrepresentedduringdusk and at night at locationswith street lights.Atemporal analysis revealed that the frequencyof crashes involvingmaturedriverspeaksduringOctober,NovemberandDecember,whichmightsuggestvisibilityissuesrelatedtofoliage. Additionally,maturedriversarealsooverrepresentedincrashesatintersections,includingatdrivewaysandinparkinglots.Inthesecrashes,maturedriversoftenmidjudgethespeedorturningpathofconflictingdrivers.Finally,maturedriverswhowereat‐faultareoverrepresented in crashes at stop‐controlled intersections. This is likely the results of
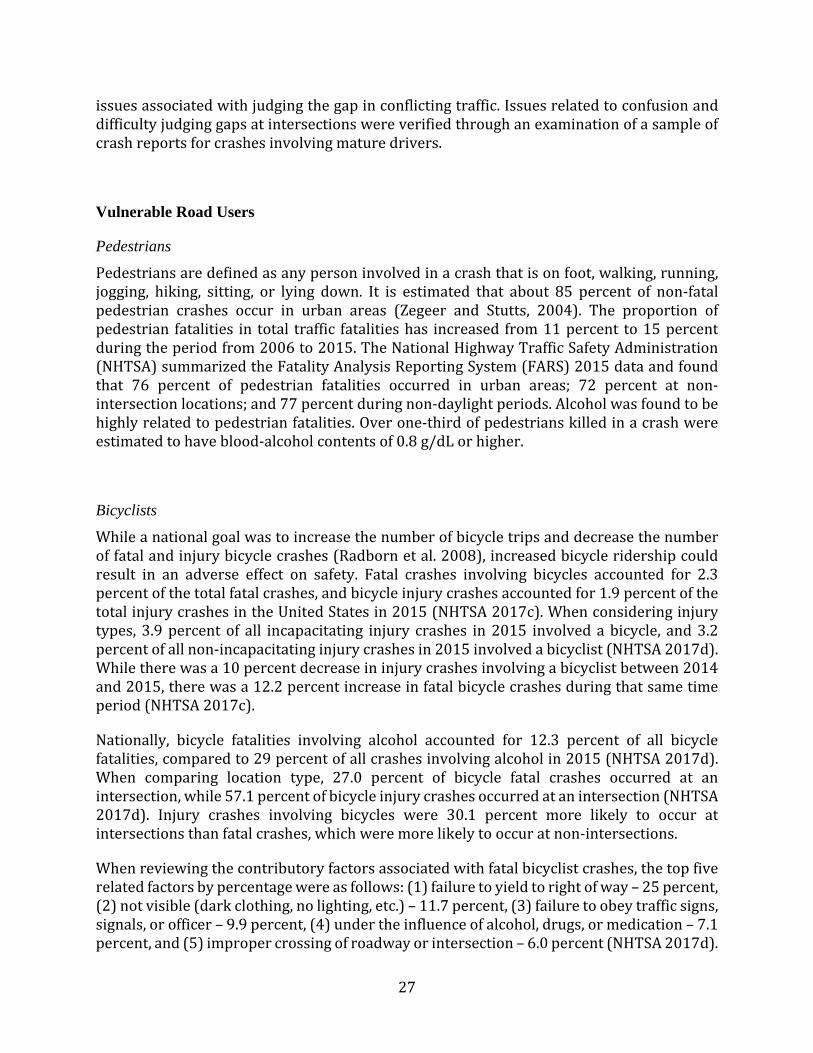
27
issuesassociatedwithjudgingthegapinconflictingtraffic.Issuesrelatedtoconfusionanddifficultyjudginggapsatintersectionswereverifiedthroughanexaminationofasampleofcrashreportsforcrashesinvolvingmaturedrivers.
Vulnerable Road Users
Pedestrians
Pedestriansaredefinedasanypersoninvolvedinacrashthatisonfoot,walking,running,jogging, hiking, sitting, or lying down. It is estimated that about 85 percent of non‐fatalpedestrian crashes occur in urban areas (Zegeer and Stutts, 2004). The proportion ofpedestrian fatalities in total traffic fatalitieshas increased from11percent to15percentduringtheperiodfrom2006to2015.TheNationalHighwayTrafficSafetyAdministration(NHTSA)summarizedtheFatalityAnalysisReportingSystem(FARS)2015dataandfoundthat 76 percent of pedestrian fatalities occurred in urban areas; 72 percent at non‐intersectionlocations;and77percentduringnon‐daylightperiods.Alcoholwasfoundtobehighlyrelatedtopedestrianfatalities.Overone‐thirdofpedestrianskilledinacrashwereestimatedtohaveblood‐alcoholcontentsof0.8g/dLorhigher.
Bicyclists
Whileanationalgoalwastoincreasethenumberofbicycletripsanddecreasethenumberoffatalandinjurybicyclecrashes(Radbornetal.2008),increasedbicycleridershipcouldresult in an adverse effect on safety. Fatal crashes involving bicycles accounted for 2.3percentofthetotalfatalcrashes,andbicycleinjurycrashesaccountedfor1.9percentofthetotalinjurycrashesintheUnitedStatesin2015(NHTSA2017c).Whenconsideringinjurytypes, 3.9percentof all incapacitating injury crashes in2015 involvedabicycle, and3.2percentofallnon‐incapacitatinginjurycrashesin2015involvedabicyclist(NHTSA2017d).Whiletherewasa10percentdecreaseininjurycrashesinvolvingabicyclistbetween2014and2015,therewasa12.2percentincreaseinfatalbicyclecrashesduringthatsametimeperiod(NHTSA2017c).
Nationally, bicycle fatalities involving alcohol accounted for 12.3 percent of all bicyclefatalities,comparedto29percentofallcrashesinvolvingalcoholin2015(NHTSA2017d).When comparing location type, 27.0 percent of bicycle fatal crashes occurred at anintersection,while57.1percentofbicycleinjurycrashesoccurredatanintersection(NHTSA2017d). Injury crashes involving bicycles were 30.1 percent more likely to occur atintersectionsthanfatalcrashes,whichweremorelikelytooccuratnon‐intersections.
Whenreviewingthecontributoryfactorsassociatedwithfatalbicyclistcrashes,thetopfiverelatedfactorsbypercentagewereasfollows:(1)failuretoyieldtorightofway–25percent,(2)notvisible(darkclothing,nolighting,etc.)–11.7percent,(3)failuretoobeytrafficsigns,signals,orofficer–9.9percent,(4)undertheinfluenceofalcohol,drugs,ormedication–7.1percent,and(5)impropercrossingofroadwayorintersection–6.0percent(NHTSA2017d).

28
Motorcycles
According to NHTSA, motorcycles include two‐ or three‐wheeled motorcycles, off‐roadmotorcycles,mopeds,scooters,minibikes,andpocketbikes.Thefatalityandinjuryratesformotorcyclecrasheshavedecreasedbasedonregisteredvehicleorpervehiclemile‐traveledbetween2006and2015(NHTSA2017).
Incomparisontoothervehicletypes,motorcyclecrashesaremorelikelytobeinvolvedinhittingfixedobjects.Accordingto2015FARSdata,24percentoffatalmotorcyclecrashesinvolved hitting fixed objects. In addition, motorcycle crashes have higher percentagesinvolvingspeedingandalcoholusethanothervehicletypes.Over40percentofsingle‐unitmotorcycle fatal crashes involve driving under the influence, which is consistent withfindingsbyShaheedetal.(2014).
Summary of study findings related to vulnerable road users
Inthepresentstudy,3.2percentofallcrashesinvolvedpedestrians,1.0percentofallcrashesinvolvedbicyclists,and2.7percentofallcrashesinvolvedmotorcyclists.Inlinewithnationaltrends,themajorityofpedestrianandbicyclecrashesoccurredmostlyinurbanareas.Thiswasexpectedbecausenon‐motorizedusersaremoreprevalentinurbanareas.Amongthepedestrianandbicyclecrashes, therewasoverrepresentationatnightandduringrainfallevents,which suggests that visibility is an issue. Concerningpedestrian crashes, a closerexaminationrevealedthatapproximately47percentofpedestriansinvolvedincrashesatnight were wearing dark clothing, compared to only about 25 percent of pedestriansinvolved in crashes during the day. Although approximately 40 percent of pedestriansinvolvedincrashes(bothdayandnight)had“unknown”clothing,thisfindingmayprovidefurther evidence that pedestrian visibility at night may be an issue. Concerning bicyclecrashes,theresearchteamexaminedtheuseofbicycleheadlightsandrearreflectorsduringdaytimeandnighttimecrashes.Althoughbothheadlightsandrearreflectorswereobservedmoreinnighttimecrashes,thevastmajorityoftherecordsindicatedunknownuseforeitherdevice (over 52 percent for headlights and 60 percent for rear reflectors). Thus, furtherconclusionscouldnotbedrawn.
Overrepresentationwasalsoobservedforimproperorcarelessturnsatintersectionswhenpedestrianswerenotat‐fault,which suggests thatmotorvehicledriversmightalsohavevisibility problems and not see pedestrians at intersections during these non‐idealconditions.Theresearchteamexaminedvehicletypesinvolvedinthesecrashes,butfoundno large differences between the vehicle types involved in pedestrian crashes involvingimproperorcarelessturningcomparedtotheoverallpopulationofvehiclesinvolvedinallcrashesduringtheanalysisperiod.Failuretoobeytrafficcontroldeviceswasacontributoryfactor in several bicycle crashes, particularly when the bicyclist was at‐fault. Crashesinvolvingmotorcyclistsgenerallyoccurredoncurvesatnight.Wetroadwayconditionsanddrivingunderintheinfluenceofalcoholwereotherfactorsthatwereoverrepresentedin
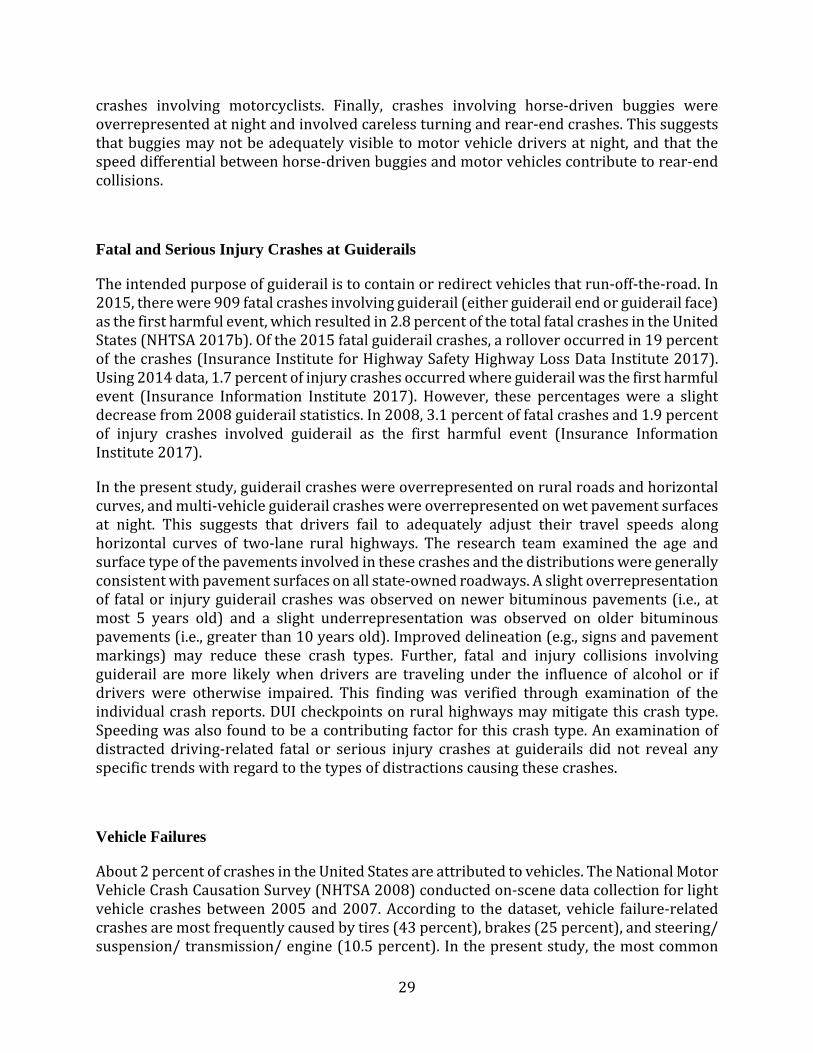
29
crashes involving motorcyclists. Finally, crashes involving horse‐driven buggies wereoverrepresentedatnightandinvolvedcarelessturningandrear‐endcrashes.Thissuggeststhatbuggiesmaynotbeadequatelyvisibletomotorvehicledriversatnight,andthatthespeeddifferentialbetweenhorse‐drivenbuggiesandmotorvehiclescontributetorear‐endcollisions.
Fatal and Serious Injury Crashes at Guiderails
Theintendedpurposeofguiderailistocontainorredirectvehiclesthatrun‐off‐the‐road.In2015,therewere909fatalcrashesinvolvingguiderail(eitherguiderailendorguiderailface)asthefirstharmfulevent,whichresultedin2.8percentofthetotalfatalcrashesintheUnitedStates(NHTSA2017b).Ofthe2015fatalguiderailcrashes,arolloveroccurredin19percentofthecrashes(InsuranceInstituteforHighwaySafetyHighwayLossDataInstitute2017).Using2014data,1.7percentofinjurycrashesoccurredwhereguiderailwasthefirstharmfulevent (Insurance Information Institute 2017). However, these percentageswere a slightdecreasefrom2008guiderailstatistics.In2008,3.1percentoffatalcrashesand1.9percentof injury crashes involved guiderail as the first harmful event (Insurance InformationInstitute2017).
Inthepresentstudy,guiderailcrasheswereoverrepresentedonruralroadsandhorizontalcurves,andmulti‐vehicleguiderailcrasheswereoverrepresentedonwetpavementsurfacesat night. This suggests that drivers fail to adequately adjust their travel speeds alonghorizontal curves of two‐lane rural highways. The research team examined the age andsurfacetypeofthepavementsinvolvedinthesecrashesandthedistributionsweregenerallyconsistentwithpavementsurfacesonallstate‐ownedroadways.Aslightoverrepresentationof fatalor injuryguiderailcrasheswasobservedonnewerbituminouspavements(i.e.,atmost 5 years old) and a slight underrepresentation was observed on older bituminouspavements(i.e.,greaterthan10yearsold).Improveddelineation(e.g.,signsandpavementmarkings) may reduce these crash types. Further, fatal and injury collisions involvingguiderail aremore likelywhen drivers are traveling under the influence of alcohol or ifdrivers were otherwise impaired. This finding was verified through examination of theindividualcrashreports.DUIcheckpointsonruralhighwaysmaymitigatethiscrashtype.Speedingwasalsofoundtobeacontributingfactorforthiscrashtype.Anexaminationofdistracted driving‐related fatal or serious injury crashes at guiderails did not reveal anyspecifictrendswithregardtothetypesofdistractionscausingthesecrashes.
Vehicle Failures
About2percentofcrashesintheUnitedStatesareattributedtovehicles.TheNationalMotorVehicleCrashCausationSurvey(NHTSA2008)conductedon‐scenedatacollectionforlightvehicle crashesbetween2005and2007.According to thedataset, vehicle failure‐relatedcrashesaremostfrequentlycausedbytires(43percent),brakes(25percent),andsteering/suspension/transmission/engine(10.5percent).Inthepresentstudy,themostcommon

30
vehicle failure crashes were associated with tire, brake systems, and steering, which isconsistent with national statistics. An increased focus on these systems during annualinspectionsmayhelptomitigatethesefailuresandreducethiscrashtype.Theresearchteamalsoexaminedthedistributionofthesevehiclefailuresacrossthestateandnoticedhigherratesofvehicle failurecrashes (in termsofvehicle failurecrashesper lane‐mileof state‐owned roadway) in the urban areas located in the southwest, southeast and northeastregionsofPennsylvania.
CONCLUSIONS
Thepurposeofthisprojectwastoidentifyannualtrendsandcontributoryfactorsinvolvingmaturedrivers;vulnerableroadusers;fatalandinjurycrasheswithguiderail;andcollisionsresulting from vehicle failures. When an adequate sample of crashes was available tocomparethecrashtypeofinteresttoareferencegroup,statisticaltestswereperformedtodetermine if the difference in proportions between the two groups was statisticallysignificant.Thefindingsfromthisresearcheffortaresummarizedbelow:Mature Drivers
Crashesinvolvingmaturedriversoccurredlessoftenduringinclementroadwayorweatherconditions.Thissuggests thatmaturedriversmight travel less frequentlywhenroadwayconditionsarenotideal.
Amongcrashesthatoccurduringinclementweatherorroadwayconditions,maturedriverswereoverrepresentedincrashesduringperiodsofrainoronwetroadways.
Nighttimevisibilitymayalsobeanissueformaturedrivers,asmaturedrivercrasheswereoverrepresentedduringduskandatnightatlocationswithstreetlights.
Mature drivers were overrepresented in crashes at intersections, including atdrivewaysandinparkinglots,whichisconsistentwithnationalcrashtrends.Inthesecrashes, mature drivers often midjudge the speed or turning path of conflictingdrivers.
Maturedriverswhowereat‐faultwereoverrepresentedincrashesatstop‐controlledintersectionsduringtheanalysisperiod.Thisislikelytheresultofissuesassociatedwithjudgingthegapinconflictingtrafficandisconsistentwiththeissuesobservedatdrivewaysandparkinglots.
Vulnerable Road Users
ThemajorityofpedestriancrashesinPennsylvaniaoccurredmostlyinurbanareas.Thiswasexpectedbecausenon‐motorizedusersaremoreprevalentinurbanareas.
PedestriancrashesinPennsylvaniawereoverrepresentedatnightandduringrainfallevents,whichsuggeststhatpedestrianvisibilityisanissue.
Pedestriancrasheswereoverrepresentedincollisionsinvolvingimproperorcarelessturnsatintersectionswhenpedestrianswerenotat‐fault,whichfurthersuggeststhat

31
pedestrian visibility is an issue. It appears thatmotor vehicle driversmay have adifficulttimeseeingpedestriansatintersectionsduringthesenon‐idealconditions.
Themajorityofbicycle crashes inPennsylvaniaoccurred inurbanareas,which isconsistentwithnationaltrends.Thiswasexpectedbecausenon‐motorizedusersaremoreprevalentinurbanareas.
Bicycle crashes were overrepresented at night and during rainfall events, whichsuggeststhatbicyclevisibilityisanissue.
Failure toobey traffic controldeviceswasa contributory factor in severalbicyclecrashes, particularlywhen the bicyclistwas at‐fault,which is also consistentwithnationalcrashstatisticsinvolvingbicyclists.Strongerenforcementattheselocationsmayhelpreducecrashesinvolvingbicyclists.
Crashesinvolvingmotorcyclistsgenerallyoccurredoncurvesatnight. Wetroadwayconditionsanddrivingundertheinfluenceofalcoholwereotherfactors
thatwereoverrepresentedincrashesinvolvingmotorcyclists.
Crashesinvolvinghorse‐drivenbuggieswereoverrepresentedatnightandinvolvedcareless turning and rear‐end collisions. This suggests that buggies may not beadequatelyvisibletomotorvehicledriversatnight,andthatthespeeddifferentialbetweenhorse‐drivenbuggiesandmotorvehiclescontributestorear‐endcollisions.
Fatal and Injury Crashes involving Guiderail
Guiderailcrasheswereoverrepresentedonruralroadsandhorizontalcurves,andmulti‐vehicleguiderailcrasheswereoverrepresentedonwetpavementsurfacesatnight.Thissuggests thatdrivers fail toadequatelyadjust theirtravelspeedsalonghorizontalcurvesoftwo‐laneruralhighways.Improveddelineation(e.g.,signsandpavementmarkings)mayreducethesecrashtypes.
Fataland injurycollisions involvingguiderailweremore likelywhendriverswereoperating their vehicle under the influence of alcohol or drivers were otherwiseimpaired.DUIcheckpointsonruralhighwaysmaymitigatethiscrashtype.
Vehicle Failure Crashes
Themostcommonvehiclefailurecrasheswereassociatedwithtire,brakesystems,andsteering,whichisconsistentwithnationalstatistics.Anincreasedfocusonthesesystemsduringannualinspectionsmayhelptomitigatethesefailuresandreducethiscrashtype.
32
REFERENCES
FederalHighwayAdministration(2014).Guardrail101.Washington,DC.
InsuranceInformationInstitute(2017).Facts+Statistics:HighwaySafety.NewYork,NY.
InsuranceInstituteforHighwaySafetyHighwayLossDataInstitute(2017).Roadwayandenvironment:Collisionswithfixedobjectsandanimals.Arlington,VA.
NationalCenterforStatisticsandAnalysis.(2017).Motorcycles:2015data(Updated,TrafficSafetyFacts.ReportNo.DOTHS812353).Washington,DC:NationalHighwayTrafficSafetyAdministration.
NationalHighwayTrafficSafetyAdministration(2017b).FatalityAnalysisReportingSystem(FARS)Encyclopedia.Washington,DC.
National Highway Traffic Safety Administration (2017a). Traffic Safety Facts 2015 Data:OlderPopulation.Washington,DC.
National Highway Traffic Safety Administration (2017c). Traffic Safety Facts 2015 Data:OlderPopulation.Washington,DC.
National Highway Traffic Safety Administration (2017d). Traffic Safety Facts 2015: ACompilationofMotorVehicleCrashDatafromtheFatalityAnalysisReportingSystemandtheGeneralEstimatesSystem.Washington,DC.
National Highway Traffic Safety Administration (2008). National Motor Vehicle CrashCausationSurvey:ReporttoCongress.NationalHighwayTrafficSafetyAdministrationTechnicalReportDOTHS811059,Washington,DC.
Potts,I.,S.Garets,T.Smith,R.Pfefer,T.R.Neuman,K.L.Slack,andJ.Nichols(2008).GuidanceforImplementationoftheAASHTOStrategicHighwaySafetyPlan,Volume22:AGuidefor Addressing Collisions Involving Motorcycles. National Cooperative HighwayResearch Program (NCHRP) Report 500, Transportation Research Board,Washington,DC.
Potts, I., J. Stutts, R. Pfefer, T.R.Neuman, K.L. Slack, andK.K.Hardy (2004).Guidance forImplementationoftheAASHTOStrategicHighwaySafetyPlan,Volume9:AGuideforReducingCollisionsInvolvingOlderDrivers.NationalCooperativeHighwayResearchProgram(NCHRP)Report500,TransportationResearchBoard,Washington,DC.
Radborn,C.,D.J.Torbic,D.K.Gilmore,L.J.Thomas,J.M.Hutton,R.Pfefer,T.R.Neuman,K.L.Slack,V.Bond,andK.K.Hardy(2008).Guidance forImplementationoftheAASHTOStrategicHighwaySafetyPlan,Volume18:AGuide forReducingCollisions InvolvingBicycles. National Cooperative Highway Research Program (NCHRP) Report 500,TransportationResearchBoard,Washington,DC.

33
Shaheed,M.S., andK. Gkritza (2014). A latent class analysis of single‐vehiclemotorcyclecrashseverityoutcomes.AnalyticMethodsinAccidentResearch,Vol.2,30‐38.
Stutts, J., C.Martell, andL. Staplin (2009). IdentifyingBehaviorsandSituationsAssociatedWith Increased Crash Risk for Older Drivers. National Highway Traffic SafetyAdministration(NHTSA),Washington,DC.
Zeeger,C.,andStutts,J.(2004).AGuideforReducingCollisionsInvolvingPedestrians.NationalCooperativeHighwayResearchProgramReport500,TransportationResearchBoard,Washington,D.C.

34
APPENDIX A

35
Table4.CrashCharacteristicsforat‐faultMatureDriversAged65andOver.
Category # Crashes 65+ drivers at‐fault
% within each group
# Crashes not involving
mature drivers
% within each group
% Difference
Total 34036 ‐ 271545 ‐ ‐
Interstate 1367 4.0% 22120 8.1% ‐4.1%
Local road 17952 52.7% 124496 45.8% 6.9%
Curved road 4064 11.9% 54734 20.2% ‐8.3%
Rural 14041 41.3% 110046 40.5% 0.8%
Turnpike 308 0.9% 4691 1.7% ‐0.8%
State road 25871 76.0% 196480 72.4% 3.6%
State road, 2 lane, no divisor, rural, non‐intersection
4377 12.9% 37341 13.8% ‐0.9%
Inclement weather 4009 11.8% 49343 18.2% ‐6.4%
Rain 2919 72.8% 31052 62.9% 9.9%
Sleet (hail) 46 1.1% 1113 2.3% ‐1.2%
Snow 847 21.1% 14587 29.6% ‐8.5%
Fog 116 2.9% 1425 2.9% 0.0%
Rain and fog 72 1.8% 975 2.0% ‐0.2%
Sleet and fog 9 0.2% 191 0.4% ‐0.2%
Dark illumination 5943 17.5% 103832 38.2% ‐20.7%
Dark (no street lights) 1972 33.2% 40623 39.1% ‐5.9%
Dark (street lights) 3132 52.7% 52452 50.5% 2.2%
Dusk 524 8.8% 5122 4.9% 3.9%
Dawn 236 4.0% 4277 4.1% ‐0.1%
Dark – unknown roadway lighting 79 1.3% 1358 1.3% 0.0%
Inclement road condition 5656 16.6% 67437 24.8% ‐8.2%
Wet 4415 78.1% 45110 66.9% 11.2%
Snow covered 576 10.2% 10224 15.2% ‐5.0%
Slush 243 4.3% 3988 5.9% ‐1.6%
Ice 137 2.4% 2695 4.0% ‐1.6%
Ice patches 243 4.3% 4730 7.0% ‐2.7%
Water standing or moving 42 0.7% 690 1.0% ‐0.3%
Wet road 4415 13.0% 45110 16.6% ‐3.6%
Dark (no street lights) 395 8.9% 7556 16.8% ‐7.9%
Dark (street lights) 633 14.3% 9686 21.5% ‐7.2%
Dusk 88 2.0% 1103 2.4% ‐0.4%
Dawn 46 1.0% 932 2.1% ‐1.1%
Dark (unknown roadway lighting) 16 0.4% 266 0.6% ‐0.2%
Snow/slush road 819 2.4% 14212 5.2% ‐2.8%
Dark (no street lights) 104 12.7% 3274 23.0% ‐10.3%
Dark (street lights) 66 8.1% 1801 12.7% ‐4.6%
Dusk 9 1.1% 249 1.8% ‐0.7%
Dawn 8 1.0% 286 2.0% ‐1.0%
Dark (unknown roadway lighting) 3 0.4% 61 0.4% 0.0%
Icy road 380 1.1% 7425 2.7% ‐1.6%
Dark (no street lights) 67 17.6% 2161 29.1% ‐11.5%
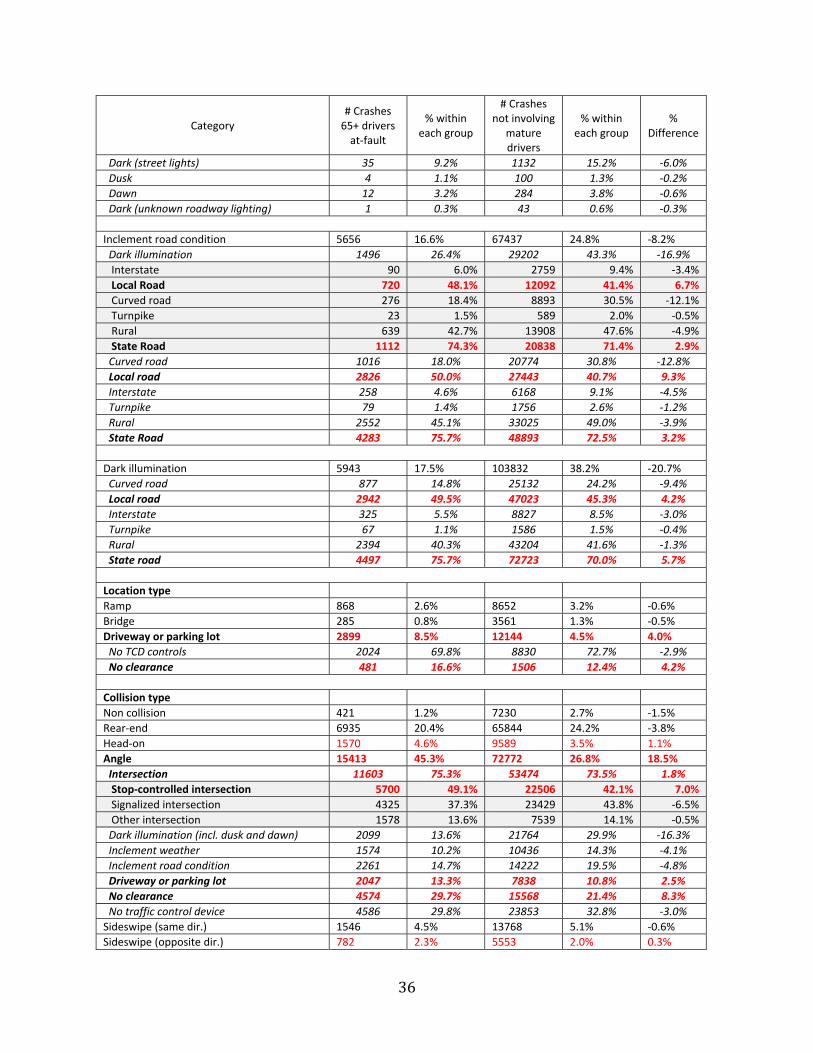
36
Category # Crashes 65+ drivers at‐fault
% within each group
# Crashes not involving
mature drivers
% within each group
% Difference
Dark (street lights) 35 9.2% 1132 15.2% ‐6.0%
Dusk 4 1.1% 100 1.3% ‐0.2%
Dawn 12 3.2% 284 3.8% ‐0.6%
Dark (unknown roadway lighting) 1 0.3% 43 0.6% ‐0.3%
Inclement road condition 5656 16.6% 67437 24.8% ‐8.2%
Dark illumination 1496 26.4% 29202 43.3% ‐16.9%
Interstate 90 6.0% 2759 9.4% ‐3.4%
Local Road 720 48.1% 12092 41.4% 6.7%
Curved road 276 18.4% 8893 30.5% ‐12.1%
Turnpike 23 1.5% 589 2.0% ‐0.5%
Rural 639 42.7% 13908 47.6% ‐4.9%
State Road 1112 74.3% 20838 71.4% 2.9%
Curved road 1016 18.0% 20774 30.8% ‐12.8%
Local road 2826 50.0% 27443 40.7% 9.3%
Interstate 258 4.6% 6168 9.1% ‐4.5%
Turnpike 79 1.4% 1756 2.6% ‐1.2%
Rural 2552 45.1% 33025 49.0% ‐3.9%
State Road 4283 75.7% 48893 72.5% 3.2%
Dark illumination 5943 17.5% 103832 38.2% ‐20.7%
Curved road 877 14.8% 25132 24.2% ‐9.4%
Local road 2942 49.5% 47023 45.3% 4.2%
Interstate 325 5.5% 8827 8.5% ‐3.0%
Turnpike 67 1.1% 1586 1.5% ‐0.4%
Rural 2394 40.3% 43204 41.6% ‐1.3%
State road 4497 75.7% 72723 70.0% 5.7%
Location type
Ramp 868 2.6% 8652 3.2% ‐0.6%
Bridge 285 0.8% 3561 1.3% ‐0.5%
Driveway or parking lot 2899 8.5% 12144 4.5% 4.0%
No TCD controls 2024 69.8% 8830 72.7% ‐2.9%
No clearance 481 16.6% 1506 12.4% 4.2%
Collision type
Non collision 421 1.2% 7230 2.7% ‐1.5%
Rear‐end 6935 20.4% 65844 24.2% ‐3.8%
Head‐on 1570 4.6% 9589 3.5% 1.1%
Angle 15413 45.3% 72772 26.8% 18.5%
Intersection 11603 75.3% 53474 73.5% 1.8%
Stop‐controlled intersection 5700 49.1% 22506 42.1% 7.0%
Signalized intersection 4325 37.3% 23429 43.8% ‐6.5%
Other intersection 1578 13.6% 7539 14.1% ‐0.5%
Dark illumination (incl. dusk and dawn) 2099 13.6% 21764 29.9% ‐16.3%
Inclement weather 1574 10.2% 10436 14.3% ‐4.1%
Inclement road condition 2261 14.7% 14222 19.5% ‐4.8%
Driveway or parking lot 2047 13.3% 7838 10.8% 2.5%
No clearance 4574 29.7% 15568 21.4% 8.3%
No traffic control device 4586 29.8% 23853 32.8% ‐3.0%
Sideswipe (same dir.) 1546 4.5% 13768 5.1% ‐0.6%
Sideswipe (opposite dir.) 782 2.3% 5553 2.0% 0.3%

37
Category # Crashes 65+ drivers at‐fault
% within each group
# Crashes not involving
mature drivers
% within each group
% Difference
Hit fixed object 6502 19.1% 89656 33.0% ‐13.9%
Hit pedestrian 682 2.0% 5672 2.1% ‐0.1%
Prime factor
D1 Driver was distracted 2910 8.5% 27273 10.0% ‐1.5%
D4 Making illegal U‐turn 183 0.5% 1098 0.4% 0.1%
D5 Making improper or careless turn 5666 16.6% 23980 8.8% 7.8%
Intersection 4036 71.2% 17863 74.5% ‐3.3%
Signalized intersection 2213 54.8% 10457 58.5% ‐3.7%
Other intersection 1099 27.2% 4431 24.8% 2.4%
Stop‐controlled intersection 724 17.9% 2975 16.7% 1.2%
No traffic control device 2465 43.5% 9560 39.9% 3.6%
Midblock 1630 28.8% 6117 25.5% 3.3%
Four way intersection 2261 39.9% 10400 43.4% ‐3.5%
Traffic signal 1713 75.8% 7981 76.7% ‐0.9%
Stop sign 220 9.7% 982 9.4% 0.3%
"T" intersection 1566 27.6% 6214 25.9% 1.7%
No traffic control device 667 42.6% 2560 41.2% 1.4%
Traffic signal 407 26.0% 1786 28.7% ‐2.7%
Stop sign 470 30.0% 1795 28.9% 1.1%
"Y" intersection 112 2.0% 522 2.2% ‐0.2%
Multi‐leg intersection 51 0.9% 453 1.9% ‐1.0%
Ramp 27 0.5% 160 0.7% ‐0.2%
Single vehicle 234 4.1% 1620 6.8% ‐2.7%
Angle Collision type 4424 78.1% 17535 73.1% 5.0%
Driveway or parking lot 924 16.3% 3348 14.0% 2.3%
Dark illumination (incl. dusk and dawn) 944 16.7% 7959 33.2% ‐16.5%
Inclement weather 539 9.5% 2893 12.1% ‐2.6%
Inclement road condition 754 13.3% 3927 16.4% ‐3.1%
No clearance 168 3.0% 592 2.5% 0.5%
D6 Turning from wrong lane 129 0.4% 933 0.3% 0.1%
D7 Proceeding w/o clearance after stop 4696 13.8% 16505 6.1% 7.7%
Intersection 4144 88.2% 14589 88.4% ‐0.2%
Other intersection 279 6.7% 1111 7.6% ‐0.9%
Signalized intersection 198 4.8% 843 5.8% ‐1.0%
Stop‐controlled intersection 3667 88.5% 12635 86.6% 1.9%
Four way intersection 2602 55.4% 9200 55.7% ‐0.3%
No traffic control device 120 4.6% 514 5.6% ‐1.0%
Traffic signal 104 4.0% 487 5.3% ‐1.3%
Stop sign 2320 89.2% 7974 86.7% 2.5%
"T" intersection 1327 28.3% 4546 27.5% 0.8%
No traffic control device 123 9.3% 396 8.7% 0.6%
Traffic signal 29 2.2% 113 2.5% ‐0.3%
Stop sign 1166 87.9% 3999 88.0% ‐0.1%
"Y" intersection 120 2.6% 405 2.5% 0.1%
Angle Collision type 4256 90.6% 14431 87.4% 3.2%
Driveway or parking lot 421 9.0% 1256 7.6% 1.4%
Dark illumination (incl. dusk and dawn) 571 12.2% 3476 21.1% ‐8.9%
Inclement weather 478 10.2% 2043 12.4% ‐2.2%
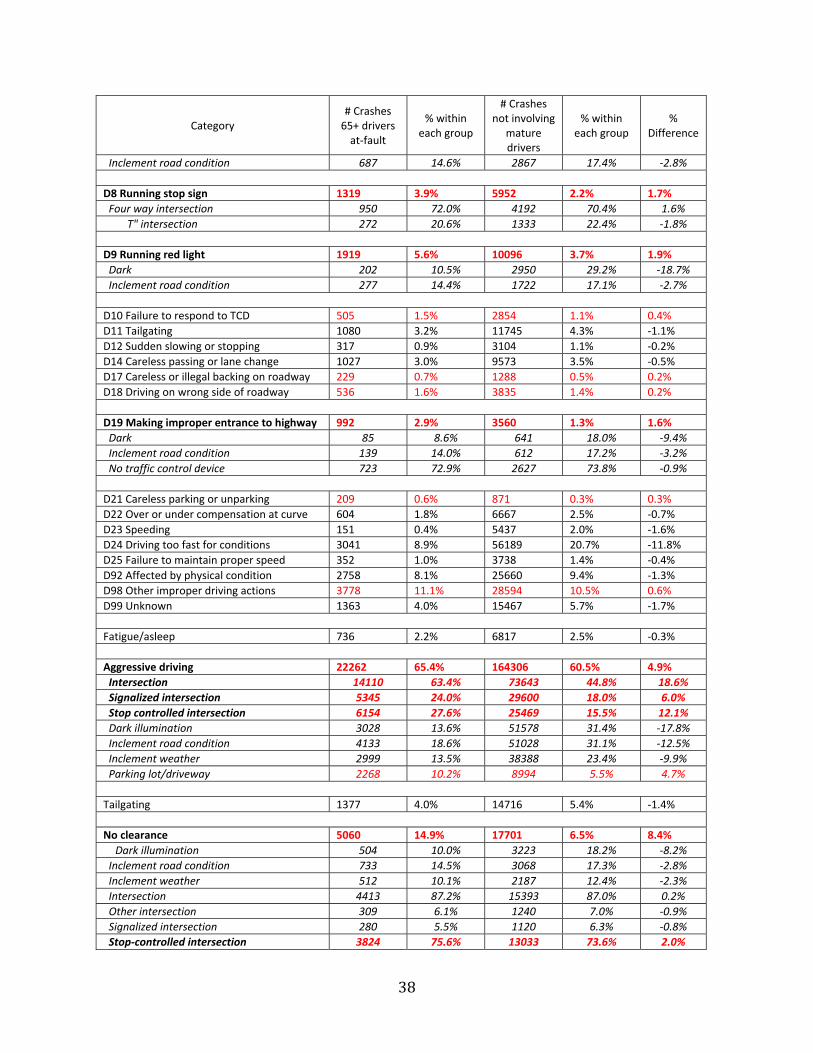
38
Category # Crashes 65+ drivers at‐fault
% within each group
# Crashes not involving
mature drivers
% within each group
% Difference
Inclement road condition 687 14.6% 2867 17.4% ‐2.8%
D8 Running stop sign 1319 3.9% 5952 2.2% 1.7%
Four way intersection 950 72.0% 4192 70.4% 1.6%
T" intersection 272 20.6% 1333 22.4% ‐1.8%
D9 Running red light 1919 5.6% 10096 3.7% 1.9%
Dark 202 10.5% 2950 29.2% ‐18.7%
Inclement road condition 277 14.4% 1722 17.1% ‐2.7%
D10 Failure to respond to TCD 505 1.5% 2854 1.1% 0.4%
D11 Tailgating 1080 3.2% 11745 4.3% ‐1.1%
D12 Sudden slowing or stopping 317 0.9% 3104 1.1% ‐0.2%
D14 Careless passing or lane change 1027 3.0% 9573 3.5% ‐0.5%
D17 Careless or illegal backing on roadway 229 0.7% 1288 0.5% 0.2%
D18 Driving on wrong side of roadway 536 1.6% 3835 1.4% 0.2%
D19 Making improper entrance to highway 992 2.9% 3560 1.3% 1.6%
Dark 85 8.6% 641 18.0% ‐9.4%
Inclement road condition 139 14.0% 612 17.2% ‐3.2%
No traffic control device 723 72.9% 2627 73.8% ‐0.9%
D21 Careless parking or unparking 209 0.6% 871 0.3% 0.3%
D22 Over or under compensation at curve 604 1.8% 6667 2.5% ‐0.7%
D23 Speeding 151 0.4% 5437 2.0% ‐1.6%
D24 Driving too fast for conditions 3041 8.9% 56189 20.7% ‐11.8%
D25 Failure to maintain proper speed 352 1.0% 3738 1.4% ‐0.4%
D92 Affected by physical condition 2758 8.1% 25660 9.4% ‐1.3%
D98 Other improper driving actions 3778 11.1% 28594 10.5% 0.6%
D99 Unknown 1363 4.0% 15467 5.7% ‐1.7%
Fatigue/asleep 736 2.2% 6817 2.5% ‐0.3%
Aggressive driving 22262 65.4% 164306 60.5% 4.9%
Intersection 14110 63.4% 73643 44.8% 18.6%
Signalized intersection 5345 24.0% 29600 18.0% 6.0%
Stop controlled intersection 6154 27.6% 25469 15.5% 12.1%
Dark illumination 3028 13.6% 51578 31.4% ‐17.8%
Inclement road condition 4133 18.6% 51028 31.1% ‐12.5%
Inclement weather 2999 13.5% 38388 23.4% ‐9.9%
Parking lot/driveway 2268 10.2% 8994 5.5% 4.7%
Tailgating 1377 4.0% 14716 5.4% ‐1.4%
No clearance 5060 14.9% 17701 6.5% 8.4%
Dark illumination 504 10.0% 3223 18.2% ‐8.2%
Inclement road condition 733 14.5% 3068 17.3% ‐2.8%
Inclement weather 512 10.1% 2187 12.4% ‐2.3%
Intersection 4413 87.2% 15393 87.0% 0.2%
Other intersection 309 6.1% 1240 7.0% ‐0.9%
Signalized intersection 280 5.5% 1120 6.3% ‐0.8%
Stop‐controlled intersection 3824 75.6% 13033 73.6% 2.0%
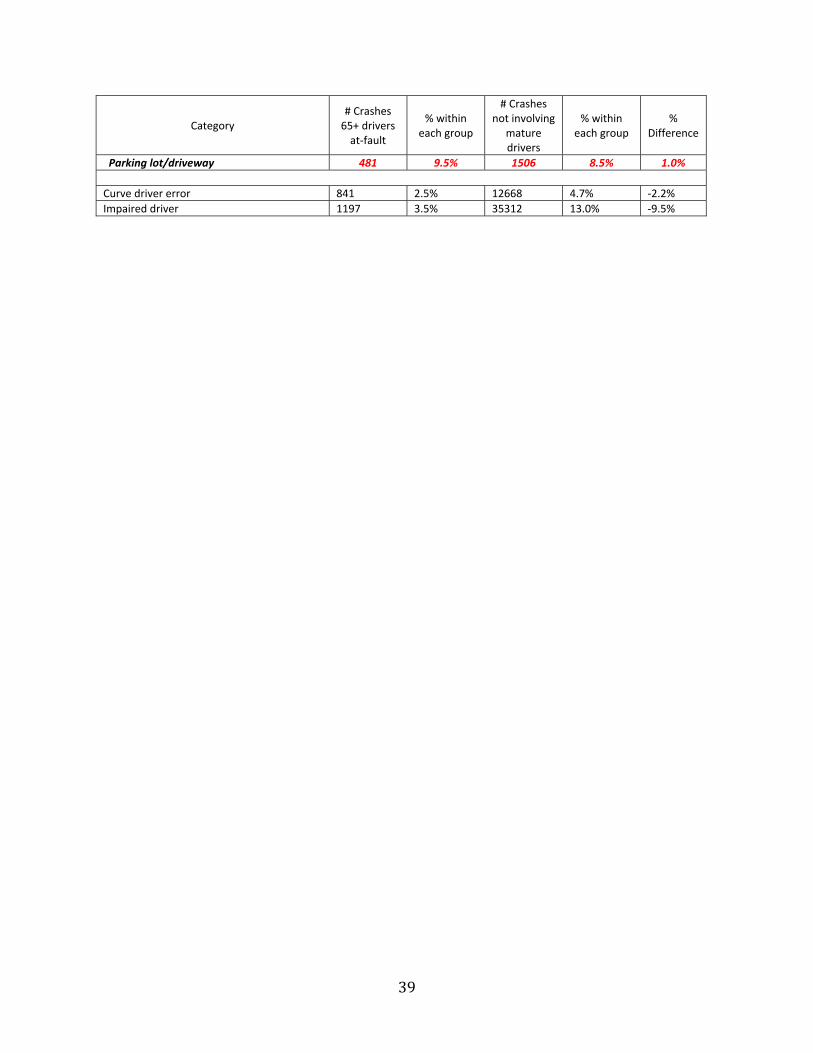
39
Category # Crashes 65+ drivers at‐fault
% within each group
# Crashes not involving
mature drivers
% within each group
% Difference
Parking lot/driveway 481 9.5% 1506 8.5% 1.0%
Curve driver error 841 2.5% 12668 4.7% ‐2.2%
Impaired driver 1197 3.5% 35312 13.0% ‐9.5%

40
Table5.CrashCharacteristicsforat‐faultMatureDriversAged75andOver.
Category # Crashes 75+ drivers at‐fault
% within each group
# Crashes not involving
mature drivers
% within each group
% Difference
Total 15252 ‐ 271545 ‐ ‐
Interstate 436 2.9% 22120 8.1% ‐5.2%
Local road 8434 55.3% 124496 45.8% 9.5%
Curved road 1581 10.4% 54734 20.2% ‐9.8%
Rural 6208 40.7% 110046 40.5% 0.2%
Turnpike 86 0.6% 4691 1.7% ‐1.1%
State road 11535 75.6% 196480 72.4% 3.2%
State road, 2 lane, no divisor, rural, non‐intersection
1829 12.0% 37341 13.8% ‐1.8%
Inclement weather 1631 10.7% 49343 18.2% ‐7.5%
Rain 1240 76.0% 31052 62.9% 13.1%
Sleet (hail) 15 0.9% 1113 2.3% ‐1.4%
Snow 295 18.1% 14587 29.6% ‐11.5%
Fog 48 2.9% 1425 2.9% 0.0%
Rain and fog 31 1.9% 975 2.0% ‐0.1%
Sleet and fog 2 0.1% 191 0.4% ‐0.3%
Dark illumination 2202 14.4% 103832 38.2% ‐23.8%
Dark (no street lights) 702 31.9% 40623 39.1% ‐7.2%
Dark (street lights) 1181 53.6% 52452 50.5% 3.1%
Dusk 210 9.5% 5122 4.9% 4.6%
Dawn 76 3.5% 4277 4.1% ‐0.6%
Dark – unknown roadway lighting 33 1.5% 1358 1.3% 0.2%
Inclement road condition 2317 15.2% 67437 24.8% ‐9.6%
Wet 1894 81.7% 45110 66.9% 14.8%
Snow covered 187 8.1% 10224 15.2% ‐7.1%
Slush 89 3.8% 3988 5.9% ‐2.1%
Ice 44 1.9% 2695 4.0% ‐2.1%
Ice patches 84 3.6% 4730 7.0% ‐3.4%
Water standing or moving 19 0.8% 690 1.0% ‐0.2%
Wet road 1894 12.4% 45110 16.6% ‐4.2%
Dark (no street lights) 140 7.4% 7556 16.8% ‐9.4%
Dark (street lights) 245 12.9% 9686 21.5% ‐8.6%
Dusk 30 1.6% 1103 2.4% ‐0.8%
Dawn 17 0.9% 932 2.1% ‐1.2%
Dark (unknown roadway lighting) 6 0.3% 266 0.6% ‐0.3%
Snow/slush road 276 1.8% 14212 5.2% ‐3.4%
Dark (no street lights) 29 10.5% 3274 23.0% ‐12.5%
Dark (street lights) 16 5.8% 1801 12.7% ‐6.9%
Dusk 3 1.1% 249 1.8% ‐0.7%
Dawn 0 0.0% 286 2.0% ‐2.0%
Dark (unknown roadway lighting) 1 0.4% 61 0.4% 0.0%
Icy road 128 0.8% 7425 2.7% ‐1.9%
Dark (no street lights) 15 11.7% 2161 29.1% ‐17.4%
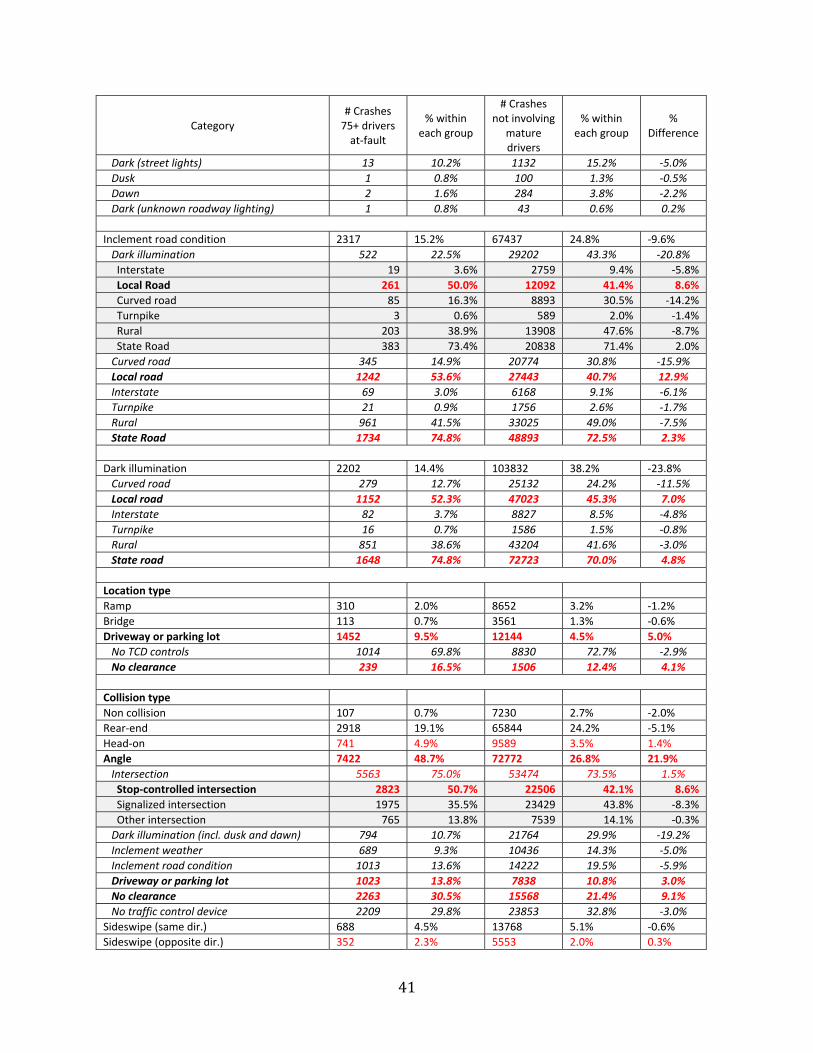
41
Category # Crashes 75+ drivers at‐fault
% within each group
# Crashes not involving
mature drivers
% within each group
% Difference
Dark (street lights) 13 10.2% 1132 15.2% ‐5.0%
Dusk 1 0.8% 100 1.3% ‐0.5%
Dawn 2 1.6% 284 3.8% ‐2.2%
Dark (unknown roadway lighting) 1 0.8% 43 0.6% 0.2%
Inclement road condition 2317 15.2% 67437 24.8% ‐9.6%
Dark illumination 522 22.5% 29202 43.3% ‐20.8%
Interstate 19 3.6% 2759 9.4% ‐5.8%
Local Road 261 50.0% 12092 41.4% 8.6%
Curved road 85 16.3% 8893 30.5% ‐14.2%
Turnpike 3 0.6% 589 2.0% ‐1.4%
Rural 203 38.9% 13908 47.6% ‐8.7%
State Road 383 73.4% 20838 71.4% 2.0%
Curved road 345 14.9% 20774 30.8% ‐15.9%
Local road 1242 53.6% 27443 40.7% 12.9%
Interstate 69 3.0% 6168 9.1% ‐6.1%
Turnpike 21 0.9% 1756 2.6% ‐1.7%
Rural 961 41.5% 33025 49.0% ‐7.5%
State Road 1734 74.8% 48893 72.5% 2.3%
Dark illumination 2202 14.4% 103832 38.2% ‐23.8%
Curved road 279 12.7% 25132 24.2% ‐11.5%
Local road 1152 52.3% 47023 45.3% 7.0%
Interstate 82 3.7% 8827 8.5% ‐4.8%
Turnpike 16 0.7% 1586 1.5% ‐0.8%
Rural 851 38.6% 43204 41.6% ‐3.0%
State road 1648 74.8% 72723 70.0% 4.8%
Location type
Ramp 310 2.0% 8652 3.2% ‐1.2%
Bridge 113 0.7% 3561 1.3% ‐0.6%
Driveway or parking lot 1452 9.5% 12144 4.5% 5.0%
No TCD controls 1014 69.8% 8830 72.7% ‐2.9%
No clearance 239 16.5% 1506 12.4% 4.1%
Collision type
Non collision 107 0.7% 7230 2.7% ‐2.0%
Rear‐end 2918 19.1% 65844 24.2% ‐5.1%
Head‐on 741 4.9% 9589 3.5% 1.4%
Angle 7422 48.7% 72772 26.8% 21.9%
Intersection 5563 75.0% 53474 73.5% 1.5%
Stop‐controlled intersection 2823 50.7% 22506 42.1% 8.6%
Signalized intersection 1975 35.5% 23429 43.8% ‐8.3%
Other intersection 765 13.8% 7539 14.1% ‐0.3%
Dark illumination (incl. dusk and dawn) 794 10.7% 21764 29.9% ‐19.2%
Inclement weather 689 9.3% 10436 14.3% ‐5.0%
Inclement road condition 1013 13.6% 14222 19.5% ‐5.9%
Driveway or parking lot 1023 13.8% 7838 10.8% 3.0%
No clearance 2263 30.5% 15568 21.4% 9.1%
No traffic control device 2209 29.8% 23853 32.8% ‐3.0%
Sideswipe (same dir.) 688 4.5% 13768 5.1% ‐0.6%
Sideswipe (opposite dir.) 352 2.3% 5553 2.0% 0.3%

42
Category # Crashes 75+ drivers at‐fault
% within each group
# Crashes not involving
mature drivers
% within each group
% Difference
Hit fixed object 2634 17.3% 89656 33.0% ‐15.7%
Hit pedestrian 301 2.0% 5672 2.1% ‐0.1%
Prime factor
D1 Driver was distracted 1174 7.7% 27273 10.0% ‐2.3%
D4 Making illegal U‐turn 77 0.5% 1098 0.4% 0.1%
D5 Making improper or careless turn 2796 18.3% 23980 8.8% 9.5%
Intersection 2002 71.6% 17863 74.5% ‐2.9%
Signalized intersection 1089 54.4% 10457 58.5% ‐4.1%
Other intersection 562 28.1% 4431 24.8% 3.3%
Stop‐controlled intersection 351 17.5% 2975 16.7% 0.8%
No traffic control device 1222 43.7% 9560 39.9% 3.8%
Midblock 794 28.4% 6117 25.5% 2.9%
Four way intersection 1097 39.2% 10400 43.4% ‐4.2%
Traffic signal 840 76.6% 7981 76.7% ‐0.1%
Stop sign 94 8.6% 982 9.4% ‐0.8%
"T" intersection 812 29.0% 6214 25.9% 3.1%
No traffic control device 354 43.6% 2560 41.2% 2.4%
Traffic signal 208 25.6% 1786 28.7% ‐3.1%
Stop sign 239 29.4% 1795 28.9% 0.5%
"Y" intersection 51 1.8% 522 2.2% ‐0.4%
Multi‐leg intersection 24 0.9% 453 1.9% ‐1.0%
Ramp 64 2.3% 160 0.7% 1.6%
Single vehicle 120 4.3% 1620 6.8% ‐2.5%
Angle Collision type 2208 79.0% 17535 73.1% 5.9%
Driveway or parking lot 449 16.1% 3348 14.0% 2.1%
Dark illumination (incl. dusk and dawn) 382 13.7% 7959 33.2% ‐19.5%
Inclement weather 265 9.5% 2893 12.1% ‐2.6%
Inclement road condition 374 13.4% 3927 16.4% ‐3.0%
No clearance 82 2.9% 592 2.5% 0.4%
D6 Turning from wrong lane 48 0.3% 933 0.3% 0.0%
D7 Proceeding w/o clearance after stop 2291 15.0% 16505 6.1% 8.9%
Intersection 2002 87.4% 14589 88.4% ‐1.0%
Other intersection 120 6.0% 1111 7.6% ‐1.6%
Signalized intersection 96 4.8% 843 5.8% ‐1.0%
Stop‐controlled intersection 1786 89.2% 12635 86.6% 2.6%
Four way intersection 1268 55.3% 9200 55.7% ‐0.4%
No traffic control device 54 4.3% 514 5.6% ‐1.3%
Traffic signal 52 4.1% 487 5.3% ‐1.2%
Stop sign 1135 89.5% 7974 86.7% 2.8%
"T" intersection 642 28.0% 4546 27.5% 0.5%
No traffic control device 53 8.3% 396 8.7% ‐0.4%
Traffic signal 12 1.9% 113 2.5% ‐0.6%
Stop sign 570 88.8% 3999 88.0% 0.8%
"Y" intersection 55 2.4% 405 2.5% ‐0.1%
Angle Collision type 2109 92.1% 14431 87.4% 4.7%
Driveway or parking lot 217 9.5% 1256 7.6% 1.9%
Dark illumination (incl. dusk and dawn) 227 9.9% 3476 21.1% ‐11.2%
Inclement weather 214 9.3% 2043 12.4% ‐3.1%

43
Category # Crashes 75+ drivers at‐fault
% within each group
# Crashes not involving
mature drivers
% within each group
% Difference
Inclement road condition 323 14.1% 2867 17.4% ‐3.3%
D8 Running stop sign 686 4.5% 5952 2.2% 2.3%
Four way intersection 490 71.4% 4192 70.4% 1.0%
"T" intersection 151 22.0% 1333 22.4% ‐0.4%
D9 Running red light 831 5.4% 10096 3.7% 1.7%
Dark 67 8.1% 2950 29.2% ‐21.1%
Inclement road condition 102 12.3% 1722 17.1% ‐4.8%
D10 Failure to respond to TCD 230 1.5% 2854 1.1% 0.4%
D11 Tailgating 410 2.7% 11745 4.3% ‐1.6%
D12 Sudden slowing or stopping 123 0.8% 3104 1.1% ‐0.3%
D14 Careless passing or lane change 393 2.6% 9573 3.5% ‐0.9%
D17 Careless or illegal backing on roadway 100 0.7% 1288 0.5% 0.2%
D18 Driving on wrong side of roadway 262 1.7% 3835 1.4% 0.3%
D19 Making improper entrance to highway 528 3.5% 3560 1.3% 2.2%
Dark 33 6.3% 641 18.0% ‐11.7%
Inclement road condition 59 11.2% 612 17.2% ‐6.0%
No traffic control device 389 73.7% 2627 73.8% ‐0.1%
D21 Careless parking or unparking 109 0.7% 871 0.3% 0.4%
D22 Over or under compensation at curve 254 1.7% 6667 2.5% ‐0.8%
D23 Speeding 48 0.3% 5437 2.0% ‐1.7%
D24 Driving too fast for conditions 1068 7.0% 56189 20.7% ‐13.7%
D25 Failure to maintain proper speed 158 1.0% 3738 1.4% ‐0.4%
D92 Affected by physical condition 1160 7.6% 25660 9.4% ‐1.8%
D98 Other improper driving actions 1799 11.8% 28594 10.5% 1.3%
D99 Unknown 606 4.0% 15467 5.7% ‐1.7%
Fatigue/asleep 311 2.0% 6817 2.5% ‐0.5%
Aggressive driving 10061 66.0% 164306 60.5% 5.5%
Intersection 6630 65.9% 73643 44.8% 21.1%
Signalized intersection 2425 24.1% 29600 18.0% 6.1%
Stop controlled intersection 3023 30.0% 25469 15.5% 14.5%
Dark illumination 1094 10.9% 51578 31.4% ‐20.5%
Inclement road condition 1652 16.4% 51028 31.1% ‐14.7%
Inclement weather 1165 11.6% 38388 23.4% ‐11.8%
Parking lot/driveway 1118 11.1% 8994 5.5% 5.6%
Tailgating 529 3.5% 14716 5.4% ‐1.9%
No clearance 2466 16.2% 17701 6.5% 9.7%
Dark illumination 197 8.0% 3223 18.2% ‐10.2%
Inclement road condition 344 13.9% 3068 17.3% ‐3.4%
Inclement weather 228 9.2% 2187 12.4% ‐3.2%
Intersection 2137 86.7% 15393 87.0% ‐0.3%
Other intersection 135 5.5% 1240 7.0% ‐1.5%
Signalized intersection 135 5.5% 1120 6.3% ‐0.8%
Stop‐controlled intersection 1867 75.7% 13033 73.6% 2.1%

44
Category # Crashes 75+ drivers at‐fault
% within each group
# Crashes not involving
mature drivers
% within each group
% Difference
Parking lot/driveway 239 9.7% 1506 8.5% 1.2%
Curve driver error 330 2.2% 12668 4.7% ‐2.5%
Impaired driver 258 1.7% 35312 13.0% ‐11.3%

45
Table6.CrashCharacteristicsfornotat‐faultMatureDriversAged65andOver.
Category # Crashes 65+ drivers not at‐fault
% within each group
# Crashes not involving
mature drivers
% within each group
% Difference
Total 20734 ‐ 271545 ‐ ‐
Interstate 1284 6.2% 22120 8.1% ‐2.0%
Local road 10240 49.4% 124496 45.8% 3.5%
Curved road 1645 7.9% 54734 20.2% ‐12.2%
Rural 7239 34.9% 110046 40.5% ‐5.6%
Turnpike 189 0.9% 4691 1.7% ‐0.8%
State road 16655 80.3% 196480 72.4% 8.0%
State road, 2 lane, no divisor, rural, non‐intersection
6391 30.8% 37341 13.8% 17.1%
Inclement weather 2504 12.1% 49343 18.2% ‐6.1%
Rain 1900 75.9% 31052 62.9% 12.9%
Sleet (hail) 28 1.1% 1113 2.3% ‐1.1%
Snow 486 19.4% 14587 29.6% ‐10.2%
Fog 47 1.9% 1425 2.9% ‐1.0%
Rain and fog 38 1.5% 975 2.0% ‐0.5%
Sleet and fog 5 0.2% 191 0.4% ‐0.2%
Dark illumination 3329 16.1% 103832 38.2% ‐22.2%
Dark (no street lights) 897 26.9% 40623 39.1% ‐12.2%
Dark (street lights) 1890 56.8% 52452 50.5% 6.3%
Dusk 360 10.8% 5122 4.9% 5.9%
Dawn 144 4.3% 4277 4.1% 0.2%
Dark – unknown roadway lighting 38 1.1% 1358 1.3% ‐0.2%
Inclement road condition 3489 16.8% 67437 24.8% ‐8.0%
Wet 2819 80.8% 45110 66.9% 13.9%
Snow covered 329 9.4% 10224 15.2% ‐5.7%
Slush 114 3.3% 3988 5.9% ‐2.6%
Ice 75 2.1% 2695 4.0% ‐1.8%
Ice patches 132 3.8% 4730 7.0% ‐3.2%
Water standing or moving 20 0.6% 690 1.0% ‐0.4%
Wet road 2819 13.6% 45110 16.6% ‐3.0%
Dark (no street lights) 164 5.8% 7556 16.8% ‐10.9%
Dark (street lights) 383 13.6% 9686 21.5% ‐7.9%
Dusk 67 2.4% 1103 2.4% ‐0.1%
Dawn 35 1.2% 932 2.1% ‐0.8%
Dark (unknown roadway lighting) 10 0.4% 266 0.6% ‐0.2%
Snow/slush road 443 2.1% 14212 5.2% ‐3.1%
Dark (no street lights) 35 7.9% 3274 23.0% ‐15.1%
Dark (street lights) 39 8.8% 1801 12.7% ‐3.9%
Dusk 12 2.7% 249 1.8% 1.0%
Dawn 5 1.1% 286 2.0% ‐0.9%
Dark (unknown roadway lighting) 0 0.0% 61 0.4% ‐0.4%
Icy road 207 1.0% 7425 2.7% ‐1.7%
Dark (no street lights) 20 9.7% 2161 29.1% ‐19.4%

46
Category # Crashes 65+ drivers not at‐fault
% within each group
# Crashes not involving
mature drivers
% within each group
% Difference
Dark (street lights) 32 15.5% 1132 15.2% 0.2%
Dusk 3 1.4% 100 1.3% 0.1%
Dawn 4 1.9% 284 3.8% ‐1.9%
Dark (unknown roadway lighting) 0 0.0% 43 0.6% ‐0.6%
Inclement road condition 3489 16.8% 67437 24.8% ‐8.0%
Dark illumination 813 23.3% 29202 43.3% ‐20.0%
Interstate 59 7.3% 2759 9.4% ‐2.2%
Local Road 374 46.0% 12092 41.4% 4.6%
Curved road 97 11.9% 8893 30.5% ‐18.5%
Turnpike 12 1.5% 589 2.0% ‐0.5%
Rural 289 35.5% 13908 47.6% ‐12.1%
State Road 662 81.4% 20838 71.4% 10.1%
Curved road 491 14.1% 20774 30.8% ‐16.7%
Local road 1725 49.4% 27443 40.7% 8.7%
Interstate 203 5.8% 6168 9.1% ‐3.3%
Turnpike 45 1.3% 1756 2.6% ‐1.3%
Rural 1313 37.6% 33025 49.0% ‐11.3%
State Road 2702 77.4% 48893 72.5% 4.9%
Dark illumination 3329 16.1% 103832 38.2% ‐22.2%
Curved road 279 8.4% 25132 24.2% ‐15.8%
Local road 1534 46.1% 47023 45.3% 0.8%
Interstate 289 8.7% 8827 8.5% 0.2%
Turnpike 47 1.4% 1586 1.5% ‐0.1%
Rural 1122 33.7% 43204 41.6% ‐7.9%
State road 2755 82.8% 72723 70.0% 12.7%
Location type
Ramp 644 3.1% 8652 3.2% ‐0.1%
Bridge 230 1.1% 3561 1.3% ‐0.2%
Driveway or parking lot 1593 7.7% 12144 4.5% 3.2%
No TCD controls 1122 70.4% 8830 72.7% ‐2.3%
No clearance 232 14.6% 1506 12.4% 2.2%
Collision type
Non collision 71 0.3% 7230 2.7% ‐2.3%
Rear‐end 8360 40.3% 65844 24.2% 16.1%
Head‐on 1074 5.2% 9589 3.5% 1.6%
Angle 9280 44.8% 72772 26.8% 18.0%
Intersection 7064 76.1% 53474 73.5% 2.6%
Stop‐controlled intersection 3067 43.4% 22506 42.1% 1.3%
Signalized intersection 3170 44.9% 23429 43.8% 1.1%
Other intersection 827 11.7% 7539 14.1% ‐2.4%
Dark illumination (incl. dusk and dawn) 1477 15.9% 21764 29.9% ‐14.0%
Inclement weather 1150 12.4% 10436 14.3% ‐1.9%
Inclement road condition 1612 17.4% 14222 19.5% ‐2.2%
Driveway or parking lot 1108 11.9% 7838 10.8% 1.2%
No clearance 2137 23.0% 15568 21.4% 1.6%
No traffic control device 2634 28.4% 23853 32.8% ‐4.4%
Sideswipe (same dir.) 845 4.1% 13768 5.1% ‐1.0%
Sideswipe (opposite dir.) 617 3.0% 5553 2.0% 0.9%

47
Category # Crashes 65+ drivers not at‐fault
% within each group
# Crashes not involving
mature drivers
% within each group
% Difference
Hit fixed object 307 1.5% 89656 33.0% ‐31.5%
Hit pedestrian 81 0.4% 5672 2.1% ‐1.7%
Prime factor
D1 Driver was distracted 2675 12.9% 27273 10.0% 2.9%
D4 Making illegal U‐turn 62 0.3% 1098 0.4% ‐0.1%
D5 Making improper or careless turn 2285 11.0% 23980 8.8% 2.2%
Intersection 1645 72.0% 17863 74.5% ‐2.5%
Signalized intersection 965 58.7% 10457 58.5% 0.1%
Other intersection 382 23.2% 4431 24.8% ‐1.6%
Stop‐controlled intersection 298 18.1% 2975 16.7% 1.5%
No traffic control device 916 40.1% 9560 39.9% 0.2%
Midblock 640 28.0% 6117 25.5% 2.5%
Four way intersection 948 41.5% 10400 43.4% ‐1.9%
Traffic signal 719 75.8% 7981 76.7% ‐0.9%
Stop sign 99 10.4% 982 9.4% 1.0%
"T" intersection 600 26.3% 6214 25.9% 0.3%
No traffic control device 217 36.2% 2560 41.2% ‐5.0%
Traffic signal 195 32.5% 1786 28.7% 3.8%
Stop sign 179 29.8% 1795 28.9% 0.9%
"Y" intersection 49 2.1% 522 2.2% 0.0%
Multi‐leg intersection 31 1.4% 453 1.9% ‐0.5%
Ramp 11 0.5% 160 0.7% ‐0.2%
Single vehicle 0 0.0% 1620 6.8% ‐6.8%
Angle Collision type 1867 81.7% 17535 73.1% 8.6%
Driveway or parking lot 377 16.5% 3348 14.0% 2.5%
Dark illumination (incl. dusk and dawn) 405 17.7% 7959 33.2% ‐15.5%
Inclement weather 235 10.3% 2893 12.1% ‐1.8%
Inclement road condition 311 13.6% 3927 16.4% ‐2.8%
No clearance 66 2.9% 592 2.5% 0.4%
D6 Turning from wrong lane 80 0.4% 933 0.3% 0.0%
D7 Proceeding w/o clearance after stop 2200 10.6% 16505 6.1% 4.5%
Intersection 1922 87.4% 14589 88.4% ‐1.0%
Other intersection 130 6.8% 1111 7.6% ‐0.9%
Signalized intersection 109 5.7% 843 5.8% ‐0.1%
Stop‐controlled intersection 1683 87.6% 12635 86.6% 1.0%
Four way intersection 1250 56.8% 9200 55.7% 1.1%
No traffic control device 64 5.1% 514 5.6% ‐0.5%
Traffic signal 59 4.7% 487 5.3% ‐0.6%
Stop sign 1094 87.5% 7974 86.7% 0.8%
"T" intersection 567 25.8% 4546 27.5% ‐1.8%
No traffic control device 38 6.7% 396 8.7% ‐2.0%
Traffic signal 16 2.8% 113 2.5% 0.3%
Stop sign 510 89.9% 3999 88.0% 2.0%
"Y" intersection 48 2.2% 405 2.5% ‐0.3%
Angle Collision type 2006 91.2% 14431 87.4% 3.7%
Driveway or parking lot 195 8.9% 1256 7.6% 1.3%
Dark illumination (incl. dusk and dawn) 295 13.4% 3476 21.1% ‐7.7%
Inclement weather 251 11.4% 2043 12.4% ‐1.0%

48
Category # Crashes 65+ drivers not at‐fault
% within each group
# Crashes not involving
mature drivers
% within each group
% Difference
Inclement road condition 364 16.5% 2867 17.4% ‐0.8%
D8 Running stop sign 773 3.7% 5952 2.2% 1.5%
Four way intersection 596 77.1% 4192 70.4% 6.7%
"T" intersection 134 17.3% 1333 22.4% ‐5.1%
D9 Running red light 1654 8.0% 10096 3.7% 4.3%
Dark 218 13.2% 2950 29.2% ‐16.0%
Inclement road condition 220 13.3% 1722 17.1% ‐3.8%
D10 Failure to respond to TCD 259 1.2% 2854 1.1% 0.2%
D11 Tailgating 1497 7.2% 11745 4.3% 2.9%
D12 Sudden slowing or stopping 366 1.8% 3104 1.1% 0.6%
D14 Careless passing or lane change 792 3.8% 9573 3.5% 0.3%
D17 Careless or illegal backing on roadway 122 0.6% 1288 0.5% 0.1%
D18 Driving on wrong side of roadway 348 1.7% 3835 1.4% 0.3%
D19 Making improper entrance to highway 485 2.3% 3560 1.3% 1.0%
Dark 49 10.1% 641 18.0% ‐7.9%
Inclement road condition 78 16.1% 612 17.2% ‐1.1%
No traffic control device 354 73.0% 2627 73.8% ‐0.8%
D21 Careless parking or unparking 72 0.3% 871 0.3% 0.0%
D22 Over or under compensation at curve 125 0.6% 6667 2.5% ‐1.9%
D23 Speeding 250 1.2% 5437 2.0% ‐0.8%
D24 Driving too fast for conditions 2636 12.7% 56189 20.7% ‐8.0%
D25 Failure to maintain proper speed 353 1.7% 3738 1.4% 0.3%
D92 Affected by physical condition 635 3.1% 25660 9.4% ‐6.4%
D98 Other improper driving actions 1717 8.3% 28594 10.5% ‐2.3%
D99 Unknown 974 4.7% 15467 5.7% ‐1.0%
Fatigue/asleep 222 1.1% 6817 2.5% ‐1.4%
Aggressive driving 14165 68.3% 164306 60.5% 7.8%
Intersection 8295 58.6% 73643 44.8% 13.7%
Signalized intersection 3606 25.5% 29600 18.0% 7.4%
Stop controlled intersection 3123 22.0% 25469 15.5% 6.5%
Dark illumination 1885 13.3% 51578 31.4% ‐18.1%
Inclement road condition 2751 19.4% 51028 31.1% ‐11.6%
Inclement weather 1971 13.9% 38388 23.4% ‐9.4%
Parking lot/driveway 1197 8.5% 8994 5.5% 3.0%
Tailgating 1903 9.2% 14716 5.4% 3.8%
No clearance 2346 11.3% 17701 6.5% 4.8%
Dark illumination 257 11.0% 3223 18.2% ‐7.3%
Inclement road condition 394 16.8% 3068 17.3% ‐0.5%
Inclement weather 273 11.6% 2187 12.4% ‐0.7%
Intersection 2009 85.6% 15393 87.0% ‐1.3%
Other intersection 156 6.6% 1240 7.0% ‐0.4%
Signalized intersection 140 6.0% 1120 6.3% ‐0.4%
Stop‐controlled intersection 1713 73.0% 13033 73.6% ‐0.6%

49
Category # Crashes 65+ drivers not at‐fault
% within each group
# Crashes not involving
mature drivers
% within each group
% Difference
Parking lot/driveway 232 9.9% 1506 8.5% 1.4%
Curve driver error 220 1.1% 12668 4.7% ‐3.6%
Impaired driver 1019 4.9% 35312 13.0% ‐8.1%
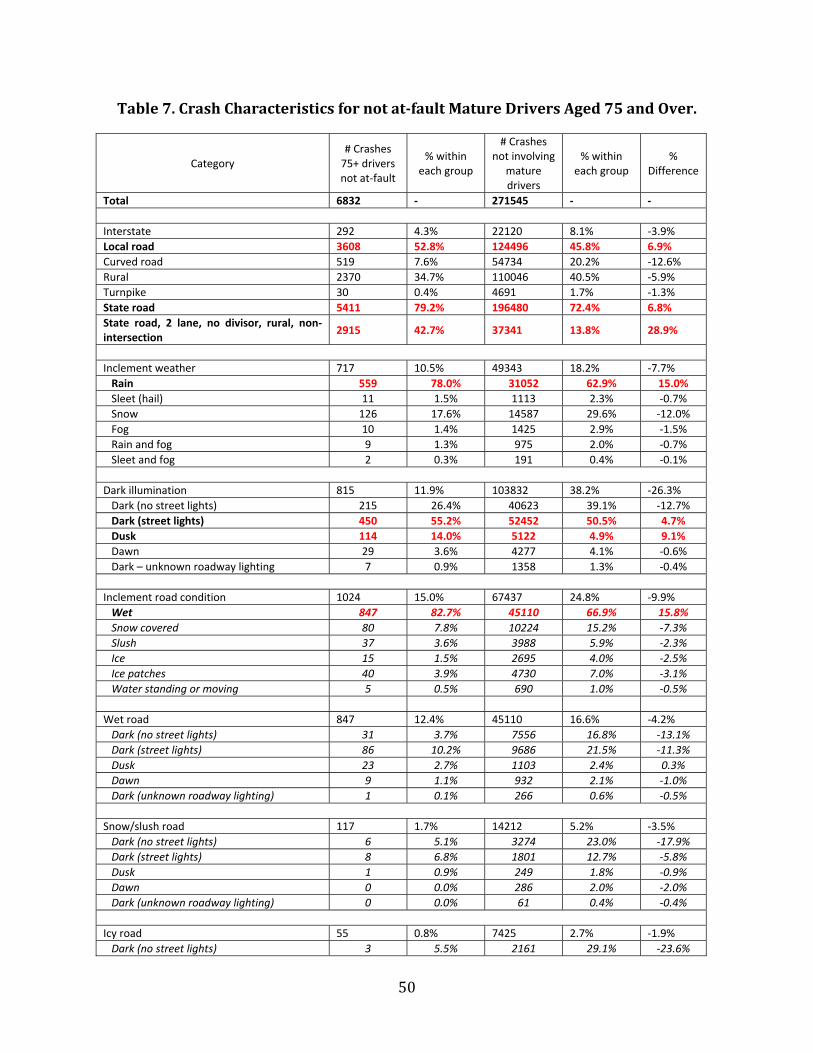
50
Table7.CrashCharacteristicsfornotat‐faultMatureDriversAged75andOver.
Category # Crashes 75+ drivers not at‐fault
% within each group
# Crashes not involving
mature drivers
% within each group
% Difference
Total 6832 ‐ 271545 ‐ ‐
Interstate 292 4.3% 22120 8.1% ‐3.9%
Local road 3608 52.8% 124496 45.8% 6.9%
Curved road 519 7.6% 54734 20.2% ‐12.6%
Rural 2370 34.7% 110046 40.5% ‐5.9%
Turnpike 30 0.4% 4691 1.7% ‐1.3%
State road 5411 79.2% 196480 72.4% 6.8%
State road, 2 lane, no divisor, rural, non‐intersection
2915 42.7% 37341 13.8% 28.9%
Inclement weather 717 10.5% 49343 18.2% ‐7.7%
Rain 559 78.0% 31052 62.9% 15.0%
Sleet (hail) 11 1.5% 1113 2.3% ‐0.7%
Snow 126 17.6% 14587 29.6% ‐12.0%
Fog 10 1.4% 1425 2.9% ‐1.5%
Rain and fog 9 1.3% 975 2.0% ‐0.7%
Sleet and fog 2 0.3% 191 0.4% ‐0.1%
Dark illumination 815 11.9% 103832 38.2% ‐26.3%
Dark (no street lights) 215 26.4% 40623 39.1% ‐12.7%
Dark (street lights) 450 55.2% 52452 50.5% 4.7%
Dusk 114 14.0% 5122 4.9% 9.1%
Dawn 29 3.6% 4277 4.1% ‐0.6%
Dark – unknown roadway lighting 7 0.9% 1358 1.3% ‐0.4%
Inclement road condition 1024 15.0% 67437 24.8% ‐9.9%
Wet 847 82.7% 45110 66.9% 15.8%
Snow covered 80 7.8% 10224 15.2% ‐7.3%
Slush 37 3.6% 3988 5.9% ‐2.3%
Ice 15 1.5% 2695 4.0% ‐2.5%
Ice patches 40 3.9% 4730 7.0% ‐3.1%
Water standing or moving 5 0.5% 690 1.0% ‐0.5%
Wet road 847 12.4% 45110 16.6% ‐4.2%
Dark (no street lights) 31 3.7% 7556 16.8% ‐13.1%
Dark (street lights) 86 10.2% 9686 21.5% ‐11.3%
Dusk 23 2.7% 1103 2.4% 0.3%
Dawn 9 1.1% 932 2.1% ‐1.0%
Dark (unknown roadway lighting) 1 0.1% 266 0.6% ‐0.5%
Snow/slush road 117 1.7% 14212 5.2% ‐3.5%
Dark (no street lights) 6 5.1% 3274 23.0% ‐17.9%
Dark (street lights) 8 6.8% 1801 12.7% ‐5.8%
Dusk 1 0.9% 249 1.8% ‐0.9%
Dawn 0 0.0% 286 2.0% ‐2.0%
Dark (unknown roadway lighting) 0 0.0% 61 0.4% ‐0.4%
Icy road 55 0.8% 7425 2.7% ‐1.9%
Dark (no street lights) 3 5.5% 2161 29.1% ‐23.6%

51
Category # Crashes 75+ drivers not at‐fault
% within each group
# Crashes not involving
mature drivers
% within each group
% Difference
Dark (street lights) 7 12.7% 1132 15.2% ‐2.5%
Dusk 1 1.8% 100 1.3% 0.5%
Dawn 0 0.0% 284 3.8% ‐3.8%
Dark (unknown roadway lighting) 0 0.0% 43 0.6% ‐0.6%
Inclement road condition 1024 15.0% 67437 24.8% ‐9.9%
Dark illumination 177 17.3% 29202 43.3% ‐26.0%
Interstate 5 2.8% 2759 9.4% ‐6.6%
Local Road 88 49.7% 12092 41.4% 8.3%
Curved road 20 11.3% 8893 30.5% ‐19.2%
Turnpike 4 2.3% 589 2.0% 0.2%
Rural 59 33.3% 13908 47.6% ‐14.3%
State Road 143 80.8% 20838 71.4% 9.4%
Curved road 135 13.2% 20774 30.8% ‐17.6%
Local road 574 56.1% 27443 40.7% 15.4%
Interstate 34 3.3% 6168 9.1% ‐5.8%
Turnpike 8 0.8% 1756 2.6% ‐1.8%
Rural 366 35.7% 33025 49.0% ‐13.2%
State Road 773 75.5% 48893 72.5% 3.0%
Dark illumination 815 11.9% 103832 38.2% ‐26.3%
Curved road 63 7.7% 25132 24.2% ‐16.5%
Local road 380 46.6% 47023 45.3% 1.3%
Interstate 60 7.4% 8827 8.5% ‐1.1%
Turnpike 12 1.5% 1586 1.5% ‐0.1%
Rural 260 31.9% 43204 41.6% ‐9.7%
State road 664 81.5% 72723 70.0% 11.4%
Location type
Ramp 207 3.0% 8652 3.2% ‐0.2%
Bridge 61 0.9% 3561 1.3% ‐0.4%
Driveway or parking lot 611 8.9% 12144 4.5% 4.5%
No TCD controls 424 69.4% 8830 72.7% ‐3.3%
No clearance 94 15.4% 1506 12.4% 3.0%
Collision type
Non collision 15 0.2% 7230 2.7% ‐2.4%
Rear‐end 2430 35.6% 65844 24.2% 11.3%
Head‐on 366 5.4% 9589 3.5% 1.8%
Angle 3424 50.1% 72772 26.8% 23.3%
Intersection 2621 76.5% 53474 73.5% 3.1%
Stop‐controlled intersection 1186 45.2% 22506 42.1% 3.2%
Signalized intersection 1163 44.4% 23429 43.8% 0.6%
Other intersection 272 10.4% 7539 14.1% ‐3.7%
Dark illumination (incl. dusk and dawn) 378 11.0% 21764 29.9% ‐18.9%
Inclement weather 382 11.2% 10436 14.3% ‐3.2%
Inclement road condition 545 15.9% 14222 19.5% ‐3.6%
Driveway or parking lot 450 13.1% 7838 10.8% 2.4%
No clearance 836 24.4% 15568 21.4% 3.0%
No traffic control device 924 27.0% 23853 32.8% ‐5.8%
Sideswipe (same dir.) 255 3.7% 13768 5.1% ‐1.3%
Sideswipe (opposite dir.) 204 3.0% 5553 2.0% 0.9%
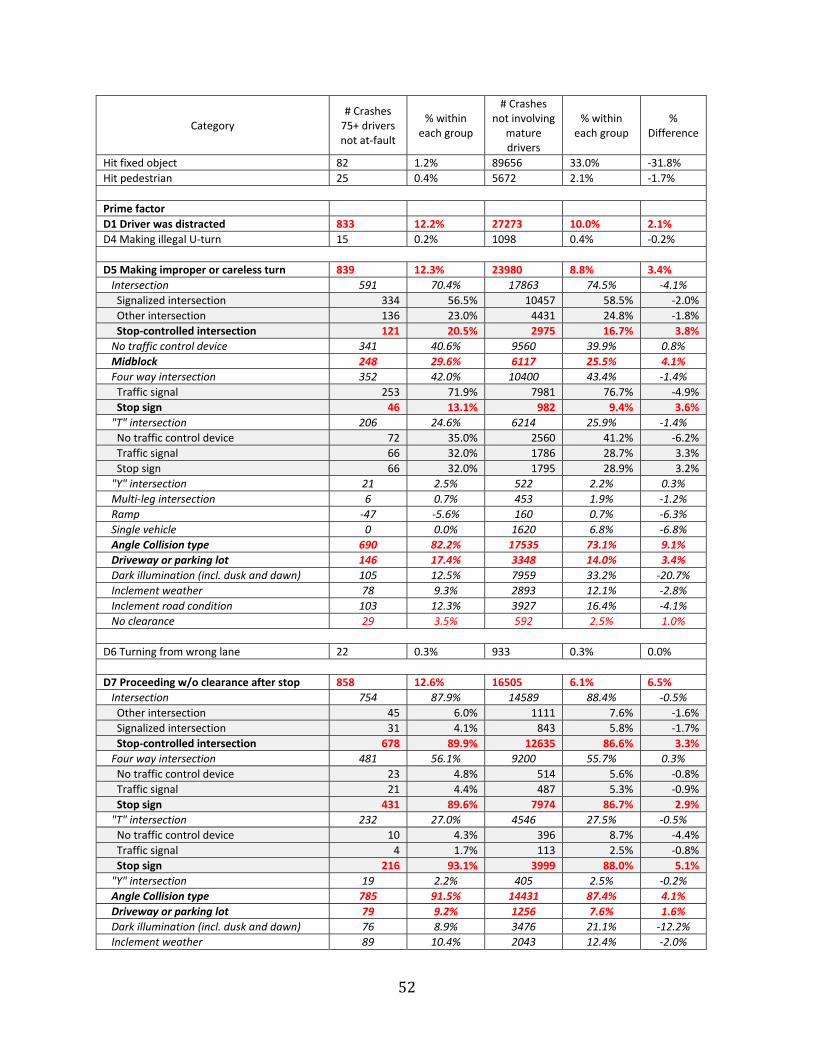
52
Category # Crashes 75+ drivers not at‐fault
% within each group
# Crashes not involving
mature drivers
% within each group
% Difference
Hit fixed object 82 1.2% 89656 33.0% ‐31.8%
Hit pedestrian 25 0.4% 5672 2.1% ‐1.7%
Prime factor
D1 Driver was distracted 833 12.2% 27273 10.0% 2.1%
D4 Making illegal U‐turn 15 0.2% 1098 0.4% ‐0.2%
D5 Making improper or careless turn 839 12.3% 23980 8.8% 3.4%
Intersection 591 70.4% 17863 74.5% ‐4.1%
Signalized intersection 334 56.5% 10457 58.5% ‐2.0%
Other intersection 136 23.0% 4431 24.8% ‐1.8%
Stop‐controlled intersection 121 20.5% 2975 16.7% 3.8%
No traffic control device 341 40.6% 9560 39.9% 0.8%
Midblock 248 29.6% 6117 25.5% 4.1%
Four way intersection 352 42.0% 10400 43.4% ‐1.4%
Traffic signal 253 71.9% 7981 76.7% ‐4.9%
Stop sign 46 13.1% 982 9.4% 3.6%
"T" intersection 206 24.6% 6214 25.9% ‐1.4%
No traffic control device 72 35.0% 2560 41.2% ‐6.2%
Traffic signal 66 32.0% 1786 28.7% 3.3%
Stop sign 66 32.0% 1795 28.9% 3.2%
"Y" intersection 21 2.5% 522 2.2% 0.3%
Multi‐leg intersection 6 0.7% 453 1.9% ‐1.2%
Ramp ‐47 ‐5.6% 160 0.7% ‐6.3%
Single vehicle 0 0.0% 1620 6.8% ‐6.8%
Angle Collision type 690 82.2% 17535 73.1% 9.1%
Driveway or parking lot 146 17.4% 3348 14.0% 3.4%
Dark illumination (incl. dusk and dawn) 105 12.5% 7959 33.2% ‐20.7%
Inclement weather 78 9.3% 2893 12.1% ‐2.8%
Inclement road condition 103 12.3% 3927 16.4% ‐4.1%
No clearance 29 3.5% 592 2.5% 1.0%
D6 Turning from wrong lane 22 0.3% 933 0.3% 0.0%
D7 Proceeding w/o clearance after stop 858 12.6% 16505 6.1% 6.5%
Intersection 754 87.9% 14589 88.4% ‐0.5%
Other intersection 45 6.0% 1111 7.6% ‐1.6%
Signalized intersection 31 4.1% 843 5.8% ‐1.7%
Stop‐controlled intersection 678 89.9% 12635 86.6% 3.3%
Four way intersection 481 56.1% 9200 55.7% 0.3%
No traffic control device 23 4.8% 514 5.6% ‐0.8%
Traffic signal 21 4.4% 487 5.3% ‐0.9%
Stop sign 431 89.6% 7974 86.7% 2.9%
"T" intersection 232 27.0% 4546 27.5% ‐0.5%
No traffic control device 10 4.3% 396 8.7% ‐4.4%
Traffic signal 4 1.7% 113 2.5% ‐0.8%
Stop sign 216 93.1% 3999 88.0% 5.1%
"Y" intersection 19 2.2% 405 2.5% ‐0.2%
Angle Collision type 785 91.5% 14431 87.4% 4.1%
Driveway or parking lot 79 9.2% 1256 7.6% 1.6%
Dark illumination (incl. dusk and dawn) 76 8.9% 3476 21.1% ‐12.2%
Inclement weather 89 10.4% 2043 12.4% ‐2.0%

53
Category # Crashes 75+ drivers not at‐fault
% within each group
# Crashes not involving
mature drivers
% within each group
% Difference
Inclement road condition 124 14.5% 2867 17.4% ‐2.9%
D8 Running stop sign 283 4.1% 5952 2.2% 1.9%
Four way intersection 212 74.9% 4192 70.4% 4.5%
"T" intersection 51 18.0% 1333 22.4% ‐4.4%
D9 Running red light 628 9.2% 10096 3.7% 5.5%
Dark 64 10.2% 2950 29.2% ‐19.0%
Inclement road condition 79 12.6% 1722 17.1% ‐4.5%
D10 Failure to respond to TCD 71 1.0% 2854 1.1% 0.0%
D11 Tailgating 441 6.5% 11745 4.3% 2.1%
D12 Sudden slowing or stopping 104 1.5% 3104 1.1% 0.4%
D14 Careless passing or lane change 227 3.3% 9573 3.5% ‐0.2%
D17 Careless or illegal backing on roadway 45 0.7% 1288 0.5% 0.2%
D18 Driving on wrong side of roadway 119 1.7% 3835 1.4% 0.3%
D19 Making improper entrance to highway 191 2.8% 3560 1.3% 1.5%
Dark 9 4.7% 641 18.0% ‐13.3%
Inclement road condition 31 16.2% 612 17.2% ‐1.0%
No traffic control device 136 71.2% 2627 73.8% ‐2.6%
D21 Careless parking or unparking 30 0.4% 871 0.3% 0.1%
D22 Over or under compensation at curve 37 0.5% 6667 2.5% ‐1.9%
D23 Speeding 87 1.3% 5437 2.0% ‐0.7%
D24 Driving too fast for conditions 712 10.4% 56189 20.7% ‐10.3%
D25 Failure to maintain proper speed 109 1.6% 3738 1.4% 0.2%
D92 Affected by physical condition 190 2.8% 25660 9.4% ‐6.7%
D98 Other improper driving actions 528 7.7% 28594 10.5% ‐2.8%
D99 Unknown 355 5.2% 15467 5.7% ‐0.5%
Fatigue/asleep 57 0.8% 6817 2.5% ‐1.7%
Aggressive driving 4736 69.3% 164306 60.5% 8.8%
Intersection 2955 62.4% 73643 44.8% 17.6%
Signalized intersection 1262 26.6% 29600 18.0% 8.6%
Stop controlled intersection 1198 25.3% 25469 15.5% 9.8%
Dark illumination 455 9.6% 51578 31.4% ‐21.8%
Inclement road condition 792 16.7% 51028 31.1% ‐14.3%
Inclement weather 560 11.8% 38388 23.4% ‐11.5%
Parking lot/driveway 467 9.9% 8994 5.5% 4.4%
Tailgating 572 8.4% 14716 5.4% 2.9%
No clearance 911 13.3% 17701 6.5% 6.8%
Dark illumination 69 7.6% 3223 18.2% ‐10.6%
Inclement road condition 133 14.6% 3068 17.3% ‐2.7%
Inclement weather 97 10.6% 2187 12.4% ‐1.7%
Intersection 788 86.5% 15393 87.0% ‐0.5%
Other intersection 57 6.3% 1240 7.0% ‐0.7%
Signalized intersection 51 5.6% 1120 6.3% ‐0.7%
Stop‐controlled intersection 680 74.6% 13033 73.6% 1.0%

54
Category # Crashes 75+ drivers not at‐fault
% within each group
# Crashes not involving
mature drivers
% within each group
% Difference
Parking lot/driveway 94 10.3% 1506 8.5% 1.8%
Curve driver error 65 1.0% 12668 4.7% ‐3.7%
Impaired driver 319 4.7% 35312 13.0% ‐8.3%

55
APPENDIX B

56
Table8.CrashCharacteristicsforCrashesInvolvingPedestriansinwhichPedestriansareat‐fault.
Category # Pedestrian Crashes, Ped
at‐fault
% within each group
# Crashes not involving vulnerable road user
% within each group
% Difference
Total 4866 ‐ 307027 ‐ ‐
Interstate 32 0.7% 24333 7.9% ‐7.3%
State road 2549 52.4% 227029 73.9% ‐21.6%
Local road 3186 65.5% 140260 45.7% 19.8%
Urban area 3983 81.9% 125803 41.0% 40.9%
Curved road 133 2.7% 57635 18.8% ‐16.0%
Inclement weather 682 14.0% 56665 18.5% ‐4.4%
Rain 504 73.9% 34665 61.2% 12.7%
Sleet 8 1.2% 1170 2.1% ‐0.9%
Snow 82 12.0% 15775 27.8% ‐15.8%
Fog 19 2.8% 1546 2.7% 0.1%
Others 69 10.1% 3509 6.2% 3.9%
Non day‐light 2015 41.4% 108012 35.2% 6.2%
Urban area 1575 78.2% 45646 42.3% 35.9%
Dark ‐ no street lights 229 14.5% 30540 66.9% ‐52.4%
Dark ‐ street lights 1159 73.6% 9402 20.6% 53.0%
Surburban/rural area 440 21.8% 62366 57.7% ‐35.9%
Dark ‐ no street lights 222 50.5% 11736 18.8% 31.6%
Dark ‐ street lights 182 41.4% 44515 71.4% ‐30.0%
Inclement surface 853 17.5% 76083 24.8% ‐7.3%
Wet 726 85.1% 50654 66.6% 18.5%
Sand/mud etc. 7 0.8% 718 0.9% ‐0.1%
Snow covered 42 4.9% 11057 14.5% ‐9.6%
Slush 19 2.2% 4308 5.7% ‐3.4%
Others 59 6.9% 9346 12.3% ‐5.4%
Intersection 1707 35.1% 122066 39.8% ‐4.7%
Signalized intersection 906 53.1% 48343 39.6% 13.5%
Stop‐controlled intersection 283 16.6% 38733 31.7% ‐15.2%
Others 518 30.3% 34990 28.7% 1.7%
Mid Block 3159 64.9% 184961 60.2% 4.7%
State road 1512 47.9% 133503 72.2% ‐24.3%
2 lane 817 54.0% 69739 52.2% 1.8%
Divided road 559 37.0% 50780 38.0% ‐1.1%
Intersection + non day‐light 683 14.0% 36261 11.8% 2.2%
Dark ‐ no street lights 77 11.3% 7557 20.8% ‐9.6%
Dark ‐ street lights 533 78.0% 24492 67.5% 10.5%
Mid block + non day‐light 1332 27.4% 71751 23.4% 4.0%
Dark ‐ no street lights 374 28.1% 34719 48.4% ‐20.3%
Dark ‐ street lights 808 60.7% 29425 41.0% 19.7%
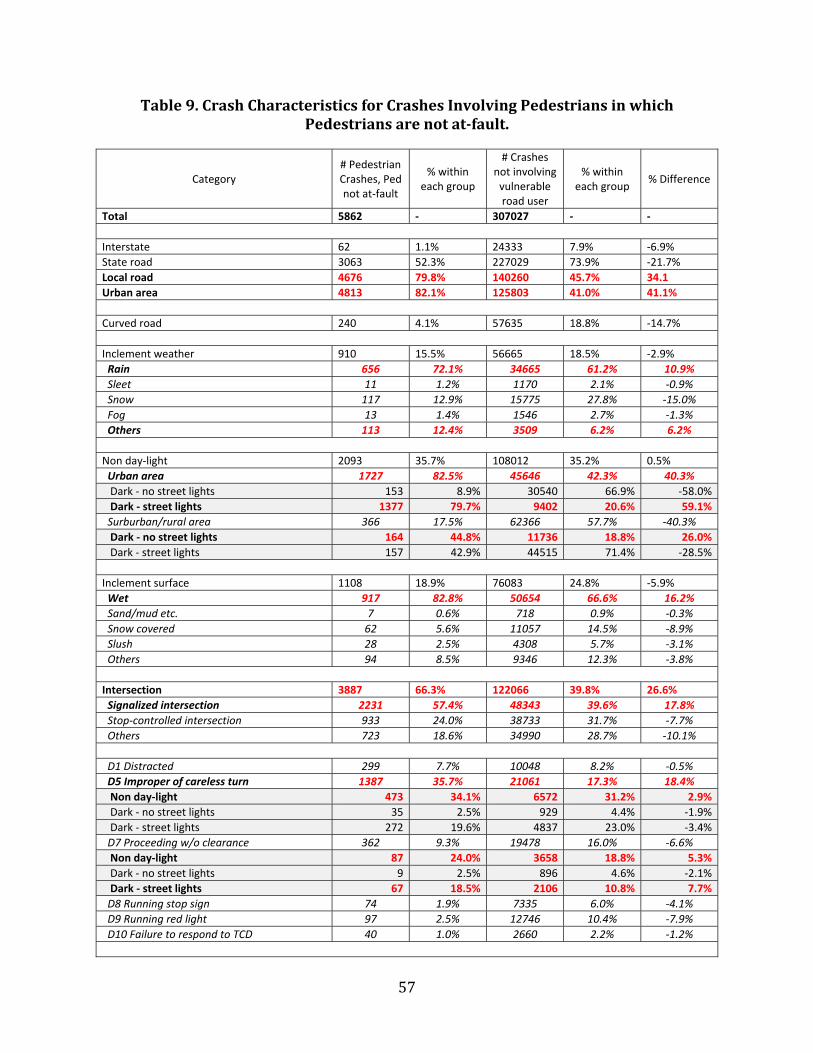
57
Table9.CrashCharacteristicsforCrashesInvolvingPedestriansinwhichPedestriansarenotat‐fault.
Category # Pedestrian Crashes, Ped not at‐fault
% within each group
# Crashes not involving vulnerable road user
% within each group
% Difference
Total 5862 ‐ 307027 ‐ ‐
Interstate 62 1.1% 24333 7.9% ‐6.9%
State road 3063 52.3% 227029 73.9% ‐21.7%
Local road 4676 79.8% 140260 45.7% 34.1
Urban area 4813 82.1% 125803 41.0% 41.1%
Curved road 240 4.1% 57635 18.8% ‐14.7%
Inclement weather 910 15.5% 56665 18.5% ‐2.9%
Rain 656 72.1% 34665 61.2% 10.9%
Sleet 11 1.2% 1170 2.1% ‐0.9%
Snow 117 12.9% 15775 27.8% ‐15.0%
Fog 13 1.4% 1546 2.7% ‐1.3%
Others 113 12.4% 3509 6.2% 6.2%
Non day‐light 2093 35.7% 108012 35.2% 0.5%
Urban area 1727 82.5% 45646 42.3% 40.3%
Dark ‐ no street lights 153 8.9% 30540 66.9% ‐58.0%
Dark ‐ street lights 1377 79.7% 9402 20.6% 59.1%
Surburban/rural area 366 17.5% 62366 57.7% ‐40.3%
Dark ‐ no street lights 164 44.8% 11736 18.8% 26.0%
Dark ‐ street lights 157 42.9% 44515 71.4% ‐28.5%
Inclement surface 1108 18.9% 76083 24.8% ‐5.9%
Wet 917 82.8% 50654 66.6% 16.2%
Sand/mud etc. 7 0.6% 718 0.9% ‐0.3%
Snow covered 62 5.6% 11057 14.5% ‐8.9%
Slush 28 2.5% 4308 5.7% ‐3.1%
Others 94 8.5% 9346 12.3% ‐3.8%
Intersection 3887 66.3% 122066 39.8% 26.6%
Signalized intersection 2231 57.4% 48343 39.6% 17.8%
Stop‐controlled intersection 933 24.0% 38733 31.7% ‐7.7%
Others 723 18.6% 34990 28.7% ‐10.1%
D1 Distracted 299 7.7% 10048 8.2% ‐0.5%
D5 Improper of careless turn 1387 35.7% 21061 17.3% 18.4%
Non day‐light 473 34.1% 6572 31.2% 2.9%
Dark ‐ no street lights 35 2.5% 929 4.4% ‐1.9%
Dark ‐ street lights 272 19.6% 4837 23.0% ‐3.4%
D7 Proceeding w/o clearance 362 9.3% 19478 16.0% ‐6.6%
Non day‐light 87 24.0% 3658 18.8% 5.3%
Dark ‐ no street lights 9 2.5% 896 4.6% ‐2.1%
Dark ‐ street lights 67 18.5% 2106 10.8% 7.7%
D8 Running stop sign 74 1.9% 7335 6.0% ‐4.1%
D9 Running red light 97 2.5% 12746 10.4% ‐7.9%
D10 Failure to respond to TCD 40 1.0% 2660 2.2% ‐1.2%

58
Category # Pedestrian Crashes, Ped not at‐fault
% within each group
# Crashes not involving vulnerable road user
% within each group
% Difference
Mid Block 1975 33.7% 184961 60.2% ‐26.6%
State road 915 46.3% 133503 72.2% ‐25.8%
2 lane 514 56.2% 69739 52.2% 3.9%
Divided road 323 35.3% 50780 38.0% ‐2.7%
D1 Distracted 204 10.3% 21781 11.8% ‐1.4%
D5 Improper of careless turn 83 4.2% 7768 4.2% 0.0%
D14 Careless passing or lane change 80 4.1% 8386 4.5% ‐0.5%
D17 Careless or illegal backing on roadway 125 6.3% 1011 0.5% 5.8%
D21 Careless parking or unparking 121 6.1% 856 0.5% 5.7%
Intersection + non day‐light 1313 22.4% 36261 11.8% 10.6%
Dark ‐ no street lights 102 7.8% 7557 20.8% ‐13.1%
Dark ‐ street lights 1056 80.4% 24492 67.5% 12.9%
Mid block + non day‐light 780 13.3% 71751 23.4% ‐10.1%
Dark ‐ no street lights 215 27.6% 34719 48.4% ‐20.8%
Dark ‐ street lights 478 61.3% 29425 41.0% 20.3%

59
APPENDIX C

60
Table10.CrashCharacteristicsforCrashesInvolvingBicyclistsinwhichBicyclistsareat‐fault.
Category
# Bicyclist Crashes,
Bicyclist at‐fault
% within each group
# Crashes not involving vulnerable road user
% within each group
% Difference
Total 1995 ‐ 307027 ‐ ‐
State road 875 43.9% 227029 73.9% ‐30.1%
Local road 1620 81.2% 140260 45.7% 35.5%
Urban area 1550 77.7% 125803 41.0% 36.7%
Curved road 64 3.2% 57635 18.8% ‐15.6%
Inclement weather 117 5.9% 56665 18.5% ‐12.6%
Rain 100 85.5% 34665 61.2% 24.3%
Sleet 0 0.0% 1170 2.1% ‐2.1%
Snow 3 2.6% 15775 27.8% ‐25.3%
Fog 1 0.9% 1546 2.7% ‐1.9%
Others 13 11.1% 3509 6.2% 4.9%
Non day‐light 444 22.3% 108012 35.2% ‐12.9%
Urban area 377 84.9% 45646 42.3% 42.6%
Dark ‐ no street lights 28 7.4% 30540 66.9% ‐59.5%
Dark ‐ street lights 297 78.8% 9402 20.6% 58.2%
Surburban/rural area 67 15.1% 62366 57.7% ‐42.6%
Dark ‐ no street lights 21 31.3% 11736 18.8% 12.5%
Dark ‐ street lights 29 43.3% 44515 71.4% ‐28.1%
Inclement surface 150 7.5% 76083 24.8% ‐17.3%
Wet 138 92.0% 50654 66.6% 25.4%
Sand/mud etc. 2 1.3% 718 0.9% 0.4%
Snow covered 3 2.0% 11057 14.5% ‐12.5%
Slush 3 2.0% 4308 5.7% ‐3.7%
Others 4 2.7% 9346 12.3% ‐9.6%
Intersection 1343 67.3% 122066 39.8% 27.6%
Signalized intersection 502 37.4% 48343 39.6% ‐2.2%
Stop‐controlled intersection 543 40.4% 38733 31.7% 8.7%
Others 298 22.2% 34990 28.7% ‐6.5%
Rear‐end crashes 23 1.7% 27209 22.3% ‐20.6%
Head‐on crashes 37 2.8% 5189 4.3% ‐1.5%
Angle crashes 1167 86.9% 68234 55.9% 31.0%
Sideswipe (same direction) 40 3.0% 2873 2.4% 0.6%
D1 Distracted 44 3.3% 10048 8.2% ‐5.0%
D5 Improper of careless turn 64 4.8% 21061 17.3% ‐12.5%
Non day‐light 12 18.8% 6572 31.2% ‐12.5%
Dark ‐ no street lights 1 1.6% 929 4.4% ‐2.8%
Dark ‐ street lights 7 10.9% 4837 23.0% ‐12.0%
D7 Proceeding w/o clearance 57 4.2% 19478 16.0% ‐11.7%
Non day‐light 12 21.1% 3658 18.8% 2.3%
Dark ‐ no street lights 0 0.0% 896 4.6% ‐4.6%
Dark ‐ street lights 11 19.3% 2106 10.8% 8.5%
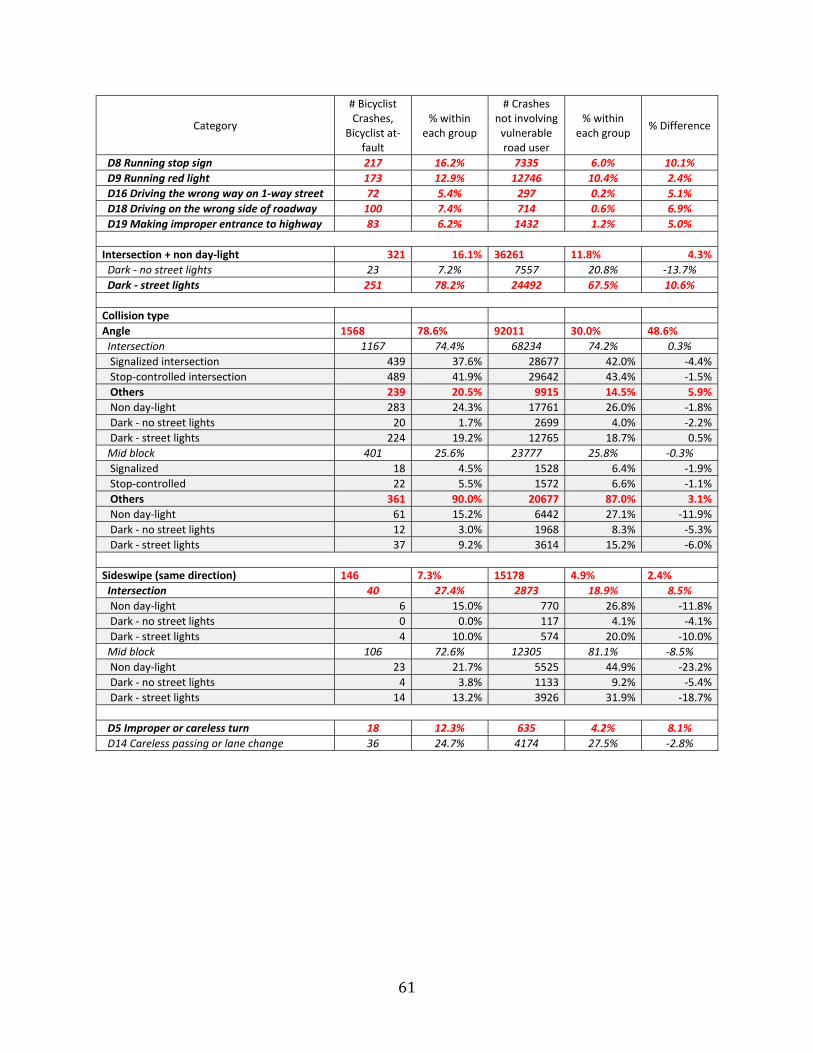
61
Category
# Bicyclist Crashes,
Bicyclist at‐fault
% within each group
# Crashes not involving vulnerable road user
% within each group
% Difference
D8 Running stop sign 217 16.2% 7335 6.0% 10.1%
D9 Running red light 173 12.9% 12746 10.4% 2.4%
D16 Driving the wrong way on 1‐way street 72 5.4% 297 0.2% 5.1%
D18 Driving on the wrong side of roadway 100 7.4% 714 0.6% 6.9%
D19 Making improper entrance to highway 83 6.2% 1432 1.2% 5.0%
Intersection + non day‐light 321 16.1% 36261 11.8% 4.3%
Dark ‐ no street lights 23 7.2% 7557 20.8% ‐13.7%
Dark ‐ street lights 251 78.2% 24492 67.5% 10.6%
Collision type
Angle 1568 78.6% 92011 30.0% 48.6%
Intersection 1167 74.4% 68234 74.2% 0.3%
Signalized intersection 439 37.6% 28677 42.0% ‐4.4%
Stop‐controlled intersection 489 41.9% 29642 43.4% ‐1.5%
Others 239 20.5% 9915 14.5% 5.9%
Non day‐light 283 24.3% 17761 26.0% ‐1.8%
Dark ‐ no street lights 20 1.7% 2699 4.0% ‐2.2%
Dark ‐ street lights 224 19.2% 12765 18.7% 0.5%
Mid block 401 25.6% 23777 25.8% ‐0.3%
Signalized 18 4.5% 1528 6.4% ‐1.9%
Stop‐controlled 22 5.5% 1572 6.6% ‐1.1%
Others 361 90.0% 20677 87.0% 3.1%
Non day‐light 61 15.2% 6442 27.1% ‐11.9%
Dark ‐ no street lights 12 3.0% 1968 8.3% ‐5.3%
Dark ‐ street lights 37 9.2% 3614 15.2% ‐6.0%
Sideswipe (same direction) 146 7.3% 15178 4.9% 2.4%
Intersection 40 27.4% 2873 18.9% 8.5%
Non day‐light 6 15.0% 770 26.8% ‐11.8%
Dark ‐ no street lights 0 0.0% 117 4.1% ‐4.1%
Dark ‐ street lights 4 10.0% 574 20.0% ‐10.0%
Mid block 106 72.6% 12305 81.1% ‐8.5%
Non day‐light 23 21.7% 5525 44.9% ‐23.2%
Dark ‐ no street lights 4 3.8% 1133 9.2% ‐5.4%
Dark ‐ street lights 14 13.2% 3926 31.9% ‐18.7%
D5 Improper or careless turn 18 12.3% 635 4.2% 8.1%
D14 Careless passing or lane change 36 24.7% 4174 27.5% ‐2.8%
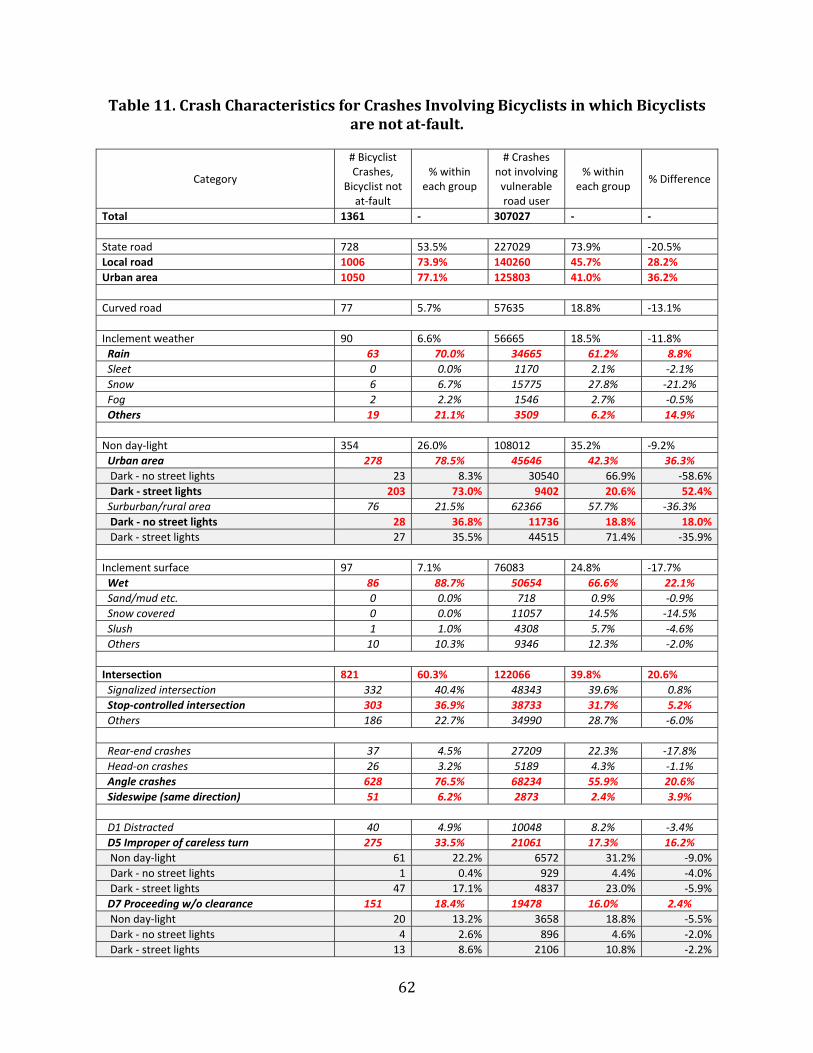
62
Table11.CrashCharacteristicsforCrashesInvolvingBicyclistsinwhichBicyclistsarenotat‐fault.
Category
# Bicyclist Crashes,
Bicyclist not at‐fault
% within each group
# Crashes not involving vulnerable road user
% within each group
% Difference
Total 1361 ‐ 307027 ‐ ‐
State road 728 53.5% 227029 73.9% ‐20.5%
Local road 1006 73.9% 140260 45.7% 28.2%
Urban area 1050 77.1% 125803 41.0% 36.2%
Curved road 77 5.7% 57635 18.8% ‐13.1%
Inclement weather 90 6.6% 56665 18.5% ‐11.8%
Rain 63 70.0% 34665 61.2% 8.8%
Sleet 0 0.0% 1170 2.1% ‐2.1%
Snow 6 6.7% 15775 27.8% ‐21.2%
Fog 2 2.2% 1546 2.7% ‐0.5%
Others 19 21.1% 3509 6.2% 14.9%
Non day‐light 354 26.0% 108012 35.2% ‐9.2%
Urban area 278 78.5% 45646 42.3% 36.3%
Dark ‐ no street lights 23 8.3% 30540 66.9% ‐58.6%
Dark ‐ street lights 203 73.0% 9402 20.6% 52.4%
Surburban/rural area 76 21.5% 62366 57.7% ‐36.3%
Dark ‐ no street lights 28 36.8% 11736 18.8% 18.0%
Dark ‐ street lights 27 35.5% 44515 71.4% ‐35.9%
Inclement surface 97 7.1% 76083 24.8% ‐17.7%
Wet 86 88.7% 50654 66.6% 22.1%
Sand/mud etc. 0 0.0% 718 0.9% ‐0.9%
Snow covered 0 0.0% 11057 14.5% ‐14.5%
Slush 1 1.0% 4308 5.7% ‐4.6%
Others 10 10.3% 9346 12.3% ‐2.0%
Intersection 821 60.3% 122066 39.8% 20.6%
Signalized intersection 332 40.4% 48343 39.6% 0.8%
Stop‐controlled intersection 303 36.9% 38733 31.7% 5.2%
Others 186 22.7% 34990 28.7% ‐6.0%
Rear‐end crashes 37 4.5% 27209 22.3% ‐17.8%
Head‐on crashes 26 3.2% 5189 4.3% ‐1.1%
Angle crashes 628 76.5% 68234 55.9% 20.6%
Sideswipe (same direction) 51 6.2% 2873 2.4% 3.9%
D1 Distracted 40 4.9% 10048 8.2% ‐3.4%
D5 Improper of careless turn 275 33.5% 21061 17.3% 16.2%
Non day‐light 61 22.2% 6572 31.2% ‐9.0%
Dark ‐ no street lights 1 0.4% 929 4.4% ‐4.0%
Dark ‐ street lights 47 17.1% 4837 23.0% ‐5.9%
D7 Proceeding w/o clearance 151 18.4% 19478 16.0% 2.4%
Non day‐light 20 13.2% 3658 18.8% ‐5.5%
Dark ‐ no street lights 4 2.6% 896 4.6% ‐2.0%
Dark ‐ street lights 13 8.6% 2106 10.8% ‐2.2%

63
Category
# Bicyclist Crashes,
Bicyclist not at‐fault
% within each group
# Crashes not involving vulnerable road user
% within each group
% Difference
D8 Running stop sign 46 5.6% 7335 6.0% ‐0.4%
D9 Running red light 42 5.1% 12746 10.4% ‐5.3%
D16 Driving the wrong way on 1‐way street 7 0.9% 297 0.2% 0.6%
D18 Driving on the wrong side of roadway 5 0.6% 714 0.6% 0.0%
D19 Making improper entrance to highway 3 0.4% 1432 1.2% ‐0.8%
Intersection + non day‐light 201 14.8% 36261 11.8% 3.0%
Dark ‐ no street lights 15 7.5% 7557 20.8% ‐13.4%
Dark ‐ street lights 148 73.6% 24492 67.5% 6.1%
Collision type
Angle 780 57.3% 92011 30.0% 27.3%
Intersection 628 80.5% 68234 74.2% 6.4%
Signalized intersection 256 40.8% 28677 42.0% ‐1.3%
Stop‐controlled intersection 253 40.3% 29642 43.4% ‐3.2%
Others 119 18.9% 9915 14.5% 4.4%
Non day‐light 144 22.9% 17761 26.0% ‐3.1%
Dark ‐ no street lights 107 17.0% 2699 4.0% 13.1%
Dark ‐ street lights 20 3.2% 12765 18.7% ‐15.5%
Mid block 152 19.5% 23777 25.8% ‐6.4%
Signalized 10 6.6% 1528 6.4% 0.2%
Stop‐controlled 7 4.6% 1572 6.6% ‐2.0%
Others 135 88.8% 20677 87.0% 1.9%
Non day‐light 26 17.1% 6442 27.1% ‐10.0%
Dark ‐ no street lights 4 2.6% 1968 8.3% ‐5.6%
Dark ‐ street lights 16 10.5% 3614 15.2% ‐4.7%
Sideswipe (same direction) 263 19.3% 15178 4.9% 14.4%
Intersection 51 19.4% 2873 18.9% 0.5%
Non day‐light 13 25.5% 770 26.8% ‐1.3%
Dark ‐ no street lights 1 2.0% 117 4.1% ‐2.1%
Dark ‐ street lights 6 11.8% 574 20.0% ‐8.2%
Mid block 212 80.6% 12305 81.1% ‐0.5%
Non day‐light 59 27.8% 5525 44.9% ‐17.1%
Dark ‐ no street lights 13 6.1% 1133 9.2% ‐3.1%
Dark ‐ street lights 30 14.2% 3926 31.9% ‐17.8%
D5 Improper or careless turn 8 3.0% 635 4.2% ‐1.1%
D14 Careless passing or lane change 44 16.7% 4174 27.5% ‐10.8%

64
APPENDIX D
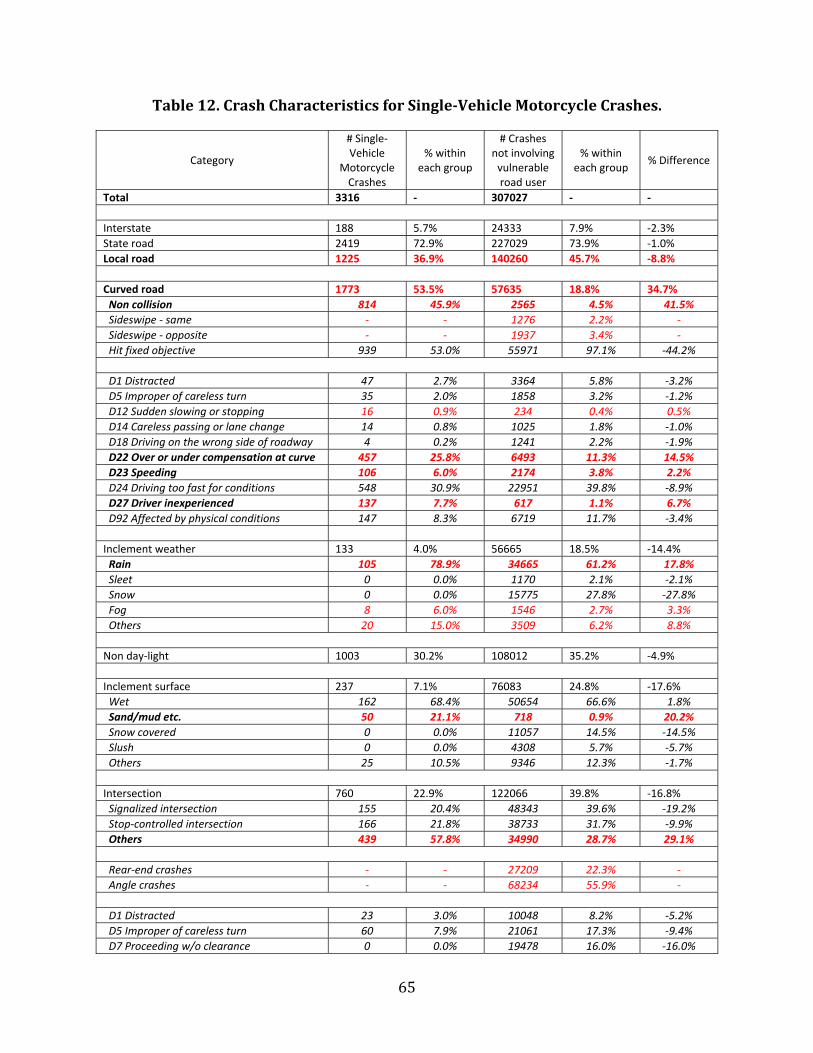
65
Table12.CrashCharacteristicsforSingle‐VehicleMotorcycleCrashes.
Category
# Single‐Vehicle
Motorcycle Crashes
% within each group
# Crashes not involving vulnerable road user
% within each group
% Difference
Total 3316 ‐ 307027 ‐ ‐
Interstate 188 5.7% 24333 7.9% ‐2.3%
State road 2419 72.9% 227029 73.9% ‐1.0%
Local road 1225 36.9% 140260 45.7% ‐8.8%
Curved road 1773 53.5% 57635 18.8% 34.7%
Non collision 814 45.9% 2565 4.5% 41.5%
Sideswipe ‐ same ‐ ‐ 1276 2.2% ‐
Sideswipe ‐ opposite ‐ ‐ 1937 3.4% ‐
Hit fixed objective 939 53.0% 55971 97.1% ‐44.2%
D1 Distracted 47 2.7% 3364 5.8% ‐3.2%
D5 Improper of careless turn 35 2.0% 1858 3.2% ‐1.2%
D12 Sudden slowing or stopping 16 0.9% 234 0.4% 0.5%
D14 Careless passing or lane change 14 0.8% 1025 1.8% ‐1.0%
D18 Driving on the wrong side of roadway 4 0.2% 1241 2.2% ‐1.9%
D22 Over or under compensation at curve 457 25.8% 6493 11.3% 14.5%
D23 Speeding 106 6.0% 2174 3.8% 2.2%
D24 Driving too fast for conditions 548 30.9% 22951 39.8% ‐8.9%
D27 Driver inexperienced 137 7.7% 617 1.1% 6.7%
D92 Affected by physical conditions 147 8.3% 6719 11.7% ‐3.4%
Inclement weather 133 4.0% 56665 18.5% ‐14.4%
Rain 105 78.9% 34665 61.2% 17.8%
Sleet 0 0.0% 1170 2.1% ‐2.1%
Snow 0 0.0% 15775 27.8% ‐27.8%
Fog 8 6.0% 1546 2.7% 3.3%
Others 20 15.0% 3509 6.2% 8.8%
Non day‐light 1003 30.2% 108012 35.2% ‐4.9%
Inclement surface 237 7.1% 76083 24.8% ‐17.6%
Wet 162 68.4% 50654 66.6% 1.8%
Sand/mud etc. 50 21.1% 718 0.9% 20.2%
Snow covered 0 0.0% 11057 14.5% ‐14.5%
Slush 0 0.0% 4308 5.7% ‐5.7%
Others 25 10.5% 9346 12.3% ‐1.7%
Intersection 760 22.9% 122066 39.8% ‐16.8%
Signalized intersection 155 20.4% 48343 39.6% ‐19.2%
Stop‐controlled intersection 166 21.8% 38733 31.7% ‐9.9%
Others 439 57.8% 34990 28.7% 29.1%
Rear‐end crashes ‐ ‐ 27209 22.3% ‐
Angle crashes ‐ ‐ 68234 55.9% ‐
D1 Distracted 23 3.0% 10048 8.2% ‐5.2%
D5 Improper of careless turn 60 7.9% 21061 17.3% ‐9.4%
D7 Proceeding w/o clearance 0 0.0% 19478 16.0% ‐16.0%

66
Category
# Single‐Vehicle
Motorcycle Crashes
% within each group
# Crashes not involving vulnerable road user
% within each group
% Difference
D9 Running red light 1 0.1% 12746 10.4% ‐10.3%
D12 Sudden slowing or stopping 36 4.7% 1246 1.0% 3.7%
D14 Careless passing or lane change 17 2.2% 2217 1.8% 0.4%
D22 Over or under compensation at curve 72 9.5% 898 0.7% 8.7%
D23 Speeding 33 4.3% 1340 1.1% 3.2%
D24 Driving too fast for conditions 150 19.7% 11035 9.0% 10.7%
D27 Driver inexperienced 119 15.7% 829 0.7% 15.0%
Curve + non day‐light 556 16.8% 25591 8.3% 8.4%
Dark ‐ no street lights 326 58.6% 15281 59.7% ‐1.1%
Dark ‐ street lights 157 28.2% 7682 30.0% ‐1.8%
Curve + (speeding or driving too fast) 654 19.7% 25125 8.2% 11.5%
Intersection + non day‐light 218 6.6% 36261 11.8% ‐5.2%
Dark ‐ no street lights 73 33.5% 7557 20.8% 12.6%
Dark ‐ street lights 125 57.3% 24492 67.5% ‐10.2%
Location type
Ramp 148 4.5% 9830 3.2% 1.3%
Bridge 34 1.0% 3957 1.3% ‐0.3%
Driveway or parking lot 46 1.4% 15347 5.0% ‐3.6%
Collision type
Non collision 1817 54.8% 5463 1.8% 53.0%
D23 Speeding 68 3.7% 196 3.6% 0.2%
D24 Driving too fast for conditions 437 24.1% 2308 42.2% ‐18.2%
Curve 814 44.8% 2565 47.0% ‐2.2%
Non day‐light 468 25.8% 2389 43.7% ‐18.0%
Rear‐end 0 0.0% 79532 25.9% ‐25.9%
Intersection ‐ ‐ 27209 34.2% ‐
Signalized intersection ‐ ‐ 12644 46.5% ‐
Stop‐controlled intersection ‐ ‐ 3082 11.3% ‐
Others ‐ ‐ 11483 42.2% ‐
Non day‐light ‐ ‐ 19981 25.1% ‐
Head‐on 0 0.0% 11715 3.8% ‐3.8%
Angle 0 0.0% 92011 30.0% ‐30.0%
Intersection ‐ ‐ 68234 74.2% ‐
Signalized intersection ‐ ‐ 28677 42.0% ‐
Stop‐controlled intersection ‐ ‐ 29642 43.4% ‐
Others ‐ ‐ 9915 14.5% ‐
Non day‐light ‐ ‐ 24203 26.3% ‐
Sideswipe (same dir.) 0 0.0% 15178 4.9% ‐4.9%
Sideswipe (Opposite dir.) 0 0.0% 6672 2.2% ‐2.2%
Hit fixed object 1435 43.3% 94845 30.9% 12.4%
D23 Speeding 103 7.2% 3246 3.4% 3.8%
D24 Driving too fast for conditions 367 25.6% 33486 35.3% ‐9.7%

67
Category
# Single‐Vehicle
Motorcycle Crashes
% within each group
# Crashes not involving vulnerable road user
% within each group
% Difference
Curve 939 65.4% 38874 41.0% 24.4%
Non day‐light 507 35.3% 47691 50.3% ‐15.0%
Drinking driver 593 17.9% 29058 9.5% 8.4%
Fatal 98 16.5% 624 2.1% 14.4%
Major injury 141 23.8% 1372 4.7% 19.1%
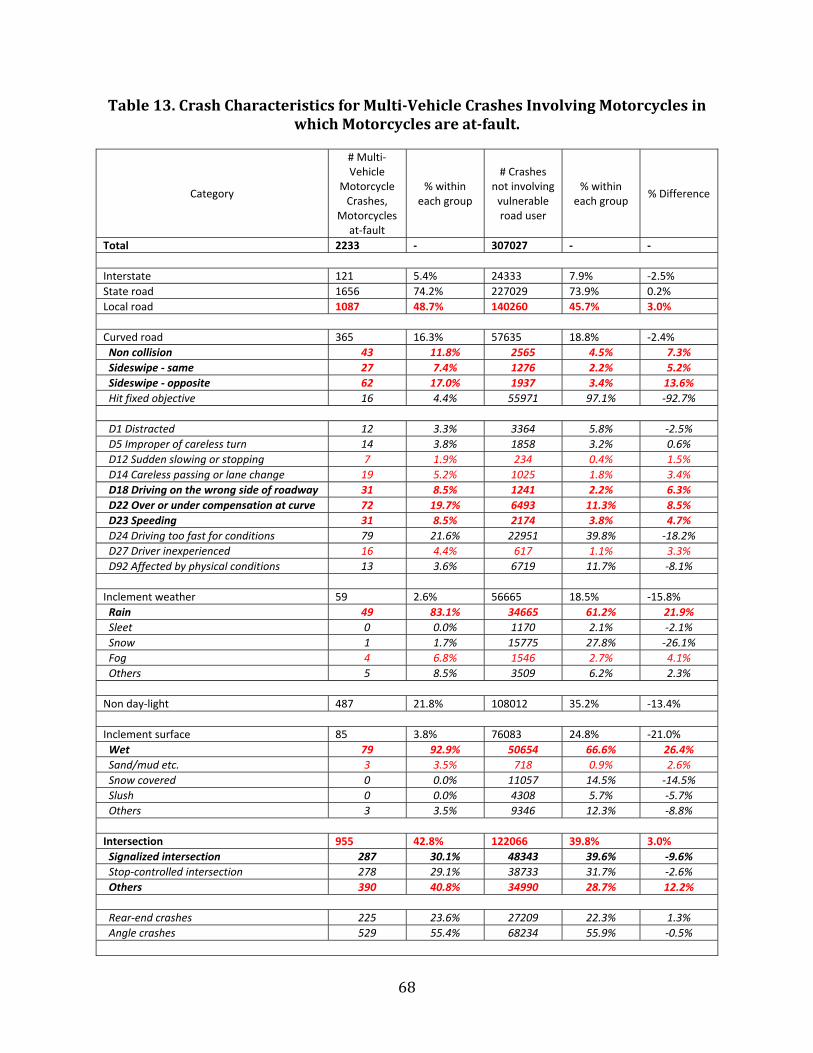
68
Table13.CrashCharacteristicsforMulti‐VehicleCrashesInvolvingMotorcyclesinwhichMotorcyclesareat‐fault.
Category
# Multi‐Vehicle
Motorcycle Crashes,
Motorcycles at‐fault
% within each group
# Crashes not involving vulnerable road user
% within each group
% Difference
Total 2233 ‐ 307027 ‐ ‐
Interstate 121 5.4% 24333 7.9% ‐2.5%
State road 1656 74.2% 227029 73.9% 0.2%
Local road 1087 48.7% 140260 45.7% 3.0%
Curved road 365 16.3% 57635 18.8% ‐2.4%
Non collision 43 11.8% 2565 4.5% 7.3%
Sideswipe ‐ same 27 7.4% 1276 2.2% 5.2%
Sideswipe ‐ opposite 62 17.0% 1937 3.4% 13.6%
Hit fixed objective 16 4.4% 55971 97.1% ‐92.7%
D1 Distracted 12 3.3% 3364 5.8% ‐2.5%
D5 Improper of careless turn 14 3.8% 1858 3.2% 0.6%
D12 Sudden slowing or stopping 7 1.9% 234 0.4% 1.5%
D14 Careless passing or lane change 19 5.2% 1025 1.8% 3.4%
D18 Driving on the wrong side of roadway 31 8.5% 1241 2.2% 6.3%
D22 Over or under compensation at curve 72 19.7% 6493 11.3% 8.5%
D23 Speeding 31 8.5% 2174 3.8% 4.7%
D24 Driving too fast for conditions 79 21.6% 22951 39.8% ‐18.2%
D27 Driver inexperienced 16 4.4% 617 1.1% 3.3%
D92 Affected by physical conditions 13 3.6% 6719 11.7% ‐8.1%
Inclement weather 59 2.6% 56665 18.5% ‐15.8%
Rain 49 83.1% 34665 61.2% 21.9%
Sleet 0 0.0% 1170 2.1% ‐2.1%
Snow 1 1.7% 15775 27.8% ‐26.1%
Fog 4 6.8% 1546 2.7% 4.1%
Others 5 8.5% 3509 6.2% 2.3%
Non day‐light 487 21.8% 108012 35.2% ‐13.4%
Inclement surface 85 3.8% 76083 24.8% ‐21.0%
Wet 79 92.9% 50654 66.6% 26.4%
Sand/mud etc. 3 3.5% 718 0.9% 2.6%
Snow covered 0 0.0% 11057 14.5% ‐14.5%
Slush 0 0.0% 4308 5.7% ‐5.7%
Others 3 3.5% 9346 12.3% ‐8.8%
Intersection 955 42.8% 122066 39.8% 3.0%
Signalized intersection 287 30.1% 48343 39.6% ‐9.6%
Stop‐controlled intersection 278 29.1% 38733 31.7% ‐2.6%
Others 390 40.8% 34990 28.7% 12.2%
Rear‐end crashes 225 23.6% 27209 22.3% 1.3%
Angle crashes 529 55.4% 68234 55.9% ‐0.5%

69
Category
# Multi‐Vehicle
Motorcycle Crashes,
Motorcycles at‐fault
% within each group
# Crashes not involving vulnerable road user
% within each group
% Difference
D1 Distracted 61 6.4% 10048 8.2% ‐1.8%
D5 Improper of careless turn 69 7.2% 21061 17.3% ‐10.0%
D7 Proceeding w/o clearance 43 4.5% 19478 16.0% ‐11.5%
D9 Running red light 70 7.3% 12746 10.4% ‐3.1%
D12 Sudden slowing or stopping 18 1.9% 1246 1.0% 0.9%
D14 Careless passing or lane change 107 11.2% 2217 1.8% 9.4%
D22 Over or under compensation at curve 11 1.2% 898 0.7% 0.4%
D23 Speeding 81 8.5% 1340 1.1% 7.4%
D24 Driving too fast for conditions 93 9.7% 11035 9.0% 0.7%
D27 Driver inexperienced 35 3.7% 829 0.7% 3.0%
Curve + non day‐light 81 3.6% 25591 8.3% ‐4.7%
Dark ‐ no street lights 43 53.1% 15281 59.7% ‐6.6%
Dark ‐ street lights 27 33.3% 7682 30.0% 3.3%
Curve + (speeding or driving too fast) 110 4.9% 25125 8.2% ‐3.3%
Intersection + non day‐light 204 9.1% 36261 11.8% ‐2.7%
Dark ‐ no street lights 32 15.7% 7557 20.8% ‐5.2%
Dark ‐ street lights 146 71.6% 24492 67.5% 4.0%
Location type
Ramp 51 2.3% 9830 3.2% ‐0.9%
Bridge 25 1.1% 3957 1.3% ‐0.2%
Driveway or parking lot 208 9.3% 15347 5.0% 4.3%
Collision type
Non collision 143 6.4% 5463 1.8% 4.6%
D23 Speeding 9 6.3% 196 3.6% 2.7%
D24 Driving too fast for conditions 34 23.8% 2308 42.2% ‐18.5%
Curve 43 30.1% 2565 47.0% ‐16.9%
Non day‐light 27 18.9% 2389 43.7% ‐24.8%
Rear‐end 726 32.5% 79532 25.9% 6.6%
Intersection 225 31.0% 27209 34.2% ‐3.2%
Signalized intersection 54 7.4% 12644 46.5% ‐39.0%
Stop‐controlled intersection 34 4.7% 3082 11.3% ‐6.6%
Others 137 18.9% 11483 42.2% ‐23.3%
Non day‐light 122 16.8% 19981 25.1% ‐8.3%
Head‐on 145 6.5% 11715 3.8% 2.7%
Angle 835 37.4% 92011 30.0% 7.4%
Intersection 529 63.4% 68234 74.2% ‐10.8%
Signalized intersection 182 34.4% 28677 42.0% ‐7.6%
Stop‐controlled intersection 195 36.9% 29642 43.4% ‐6.6%
Others 152 28.7% 9915 14.5% 14.2%
Non day‐light 172 20.6% 24203 26.3% ‐5.7%
Sideswipe (same dir.) 206 9.2% 15178 4.9% 4.3%

70
Category
# Multi‐Vehicle
Motorcycle Crashes,
Motorcycles at‐fault
% within each group
# Crashes not involving vulnerable road user
% within each group
% Difference
Sideswipe (Opposite dir.) 97 4.3% 6672 2.2% 2.2%
Hit fixed object 46 2.1% 94845 30.9% ‐28.8%
D23 Speeding 4 8.7% 3246 3.4% 5.3%
D24 Driving too fast for conditions 9 19.6% 33486 35.3% ‐15.7%
Curve 16 34.8% 38874 41.0% ‐6.2%
Non day‐light 14 30.4% 47691 50.3% ‐19.8%
Drinking driver 187 8.4% 29058 9.5% ‐1.1%
Fatal 32 17.1% 624 2.1% 15.0%
Major injury 55 29.4% 1372 4.7% 24.7%

71
Table14.CrashCharacteristicsforMulti‐VehicleCrashesInvolvingMotorcyclesinwhichMotorcyclesarenotat‐fault.
Category
# Multi‐Vehicle
Motorcycle Crashes,
Motorcycles not at‐fault
% within each group
# Crashes not involving vulnerable road user
% within each group
% Difference
Total 3008 ‐ 307027 ‐ ‐
Interstate 67 2.2% 24333 7.9% ‐5.7%
State road 2399 79.8% 227029 73.9% 5.8%
Local road 1621 53.9% 140260 45.7% 8.2%
Curved road 243 8.1% 57635 18.8% ‐10.7%
Non collision 25 10.3% 2565 4.5% 5.8%
Sideswipe ‐ same 13 5.3% 1276 2.2% 3.1%
Sideswipe ‐ opposite 18 7.4% 1937 3.4% 4.0%
Hit fixed objective 8 3.3% 55971 97.1% ‐93.8%
D1 Distracted 9 3.7% 3364 5.8% ‐2.1%
D5 Improper of careless turn 59 24.3% 1858 3.2% 21.1%
D12 Sudden slowing or stopping 3 1.2% 234 0.4% 0.8%
D14 Careless passing or lane change 10 4.1% 1025 1.8% 2.3%
D18 Driving on the wrong side of roadway 29 11.9% 1241 2.2% 9.8%
D22 Over or under compensation at curve 9 3.7% 6493 11.3% ‐7.6%
D23 Speeding 1 0.4% 2174 3.8% ‐3.4%
D24 Driving too fast for conditions 4 1.6% 22951 39.8% ‐38.2%
D27 Driver inexperienced 0 0.0% 617 1.1% ‐1.1%
D92 Affected by physical conditions 8 3.3% 6719 11.7% ‐8.4%
Inclement weather 75 2.5% 56665 18.5% ‐16.0%
Rain 59 78.7% 34665 61.2% 17.5%
Sleet 0 0.0% 1170 2.1% ‐2.1%
Snow 0 0.0% 15775 27.8% ‐27.8%
Fog 9 12.0% 1546 2.7% 9.3%
Others 7 9.3% 3509 6.2% 3.1%
Non day‐light 658 21.9% 108012 35.2% ‐13.3%
Inclement surface 97 3.2% 76083 24.8% ‐21.6%
Wet 89 91.8% 50654 66.6% 25.2%
Sand/mud etc. 5 5.2% 718 0.9% 4.2%
Snow covered 1 1.0% 11057 14.5% ‐13.5%
Slush 1 1.0% 4308 5.7% ‐4.6%
Others 1 1.0% 9346 12.3% ‐11.3%
Intersection 1757 58.4% 122066 39.8% 18.7%
Signalized intersection 551 31.4% 48343 39.6% ‐8.2%
Stop‐controlled intersection 731 41.6% 38733 31.7% 9.9%
Others 475 27.0% 34990 28.7% ‐1.6%
Rear‐end crashes 194 11.0% 27209 22.3% ‐11.2%
Angle crashes 1181 67.2% 68234 55.9% 11.3%

72
Category
# Multi‐Vehicle
Motorcycle Crashes,
Motorcycles not at‐fault
% within each group
# Crashes not involving vulnerable road user
% within each group
% Difference
D1 Distracted 76 4.3% 10048 8.2% ‐3.9%
D5 Improper of careless turn 618 35.2% 21061 17.3% 17.9%
D7 Proceeding w/o clearance 538 30.6% 19478 16.0% 14.7%
D9 Running red light 54 3.1% 12746 10.4% ‐7.4%
D12 Sudden slowing or stopping 11 0.6% 1246 1.0% ‐0.4%
D14 Careless passing or lane change 42 2.4% 2217 1.8% 0.6%
D22 Over or under compensation at curve 1 0.1% 898 0.7% ‐0.7%
D23 Speeding 8 0.5% 1340 1.1% ‐0.6%
D24 Driving too fast for conditions 20 1.1% 11035 9.0% ‐7.9%
D27 Driver inexperienced 3 0.2% 829 0.7% ‐0.5%
Curve + non day‐light 51 1.7% 25591 8.3% ‐6.6%
Dark ‐ no street lights 12 23.5% 15281 59.7% ‐36.2%
Dark ‐ street lights 23 45.1% 7682 30.0% 15.1%
Curve + (speeding or driving too fast) 5 0.2% 25125 8.2% ‐8.0%
Intersection + non day‐light 388 12.9% 36261 11.8% 1.1%
Dark ‐ no street lights 56 14.4% 7557 20.8% ‐6.4%
Dark ‐ street lights 264 68.0% 24492 67.5% 0.5%
Location type
Ramp 77 2.6% 9830 3.2% ‐0.6%
Bridge 19 0.6% 3957 1.3% ‐0.7%
Driveway or parking lot 397 13.2% 15347 5.0% 8.2%
Collision type
Non collision 270 9.0% 5463 1.8% 7.2%
D23 Speeding 0 0.0% 196 3.6% ‐3.6%
D24 Driving too fast for conditions 0 0.0% 2308 42.2% ‐42.2%
Curve 25 9.3% 2565 47.0% ‐37.7%
Non day‐light 39 14.4% 2389 43.7% ‐29.3%
Rear‐end 472 15.7% 79532 25.9% ‐10.2%
Intersection 194 41.1% 27209 34.2% 6.9%
Signalized intersection 94 48.5% 12644 46.5% 2.0%
Stop‐controlled intersection 34 17.5% 3082 11.3% 6.2%
Others 66 34.0% 11483 42.2% ‐8.2%
Non day‐light 122 25.8% 19981 25.1% 0.7%
Head‐on 211 7.0% 11715 3.8% 3.2%
Angle 1763 58.6% 92011 30.0% 28.6%
Intersection 1181 67.0% 68234 74.2% ‐7.2%
Signalized intersection 341 28.9% 28677 42.0% ‐13.2%
Stop‐controlled intersection 552 46.7% 29642 43.4% 3.3%
Others 288 24.4% 9915 14.5% 9.9%
Non day‐light 371 21.0% 24203 26.3% ‐5.3%
Sideswipe (same dir.) 151 5.0% 15178 4.9% 0.1%
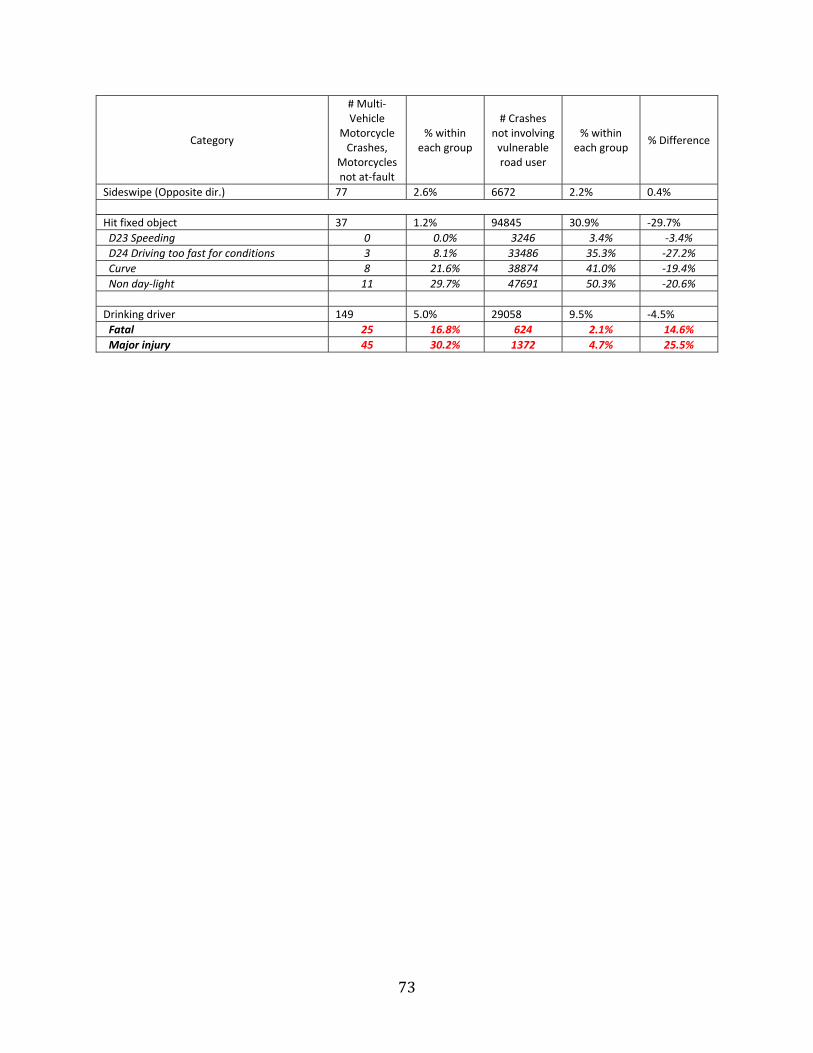
73
Category
# Multi‐Vehicle
Motorcycle Crashes,
Motorcycles not at‐fault
% within each group
# Crashes not involving vulnerable road user
% within each group
% Difference
Sideswipe (Opposite dir.) 77 2.6% 6672 2.2% 0.4%
Hit fixed object 37 1.2% 94845 30.9% ‐29.7%
D23 Speeding 0 0.0% 3246 3.4% ‐3.4%
D24 Driving too fast for conditions 3 8.1% 33486 35.3% ‐27.2%
Curve 8 21.6% 38874 41.0% ‐19.4%
Non day‐light 11 29.7% 47691 50.3% ‐20.6%
Drinking driver 149 5.0% 29058 9.5% ‐4.5%
Fatal 25 16.8% 624 2.1% 14.6%
Major injury 45 30.2% 1372 4.7% 25.5%

74
APPENDIX E

75
Table15.CrashCharacteristicsforCrashesInvolvingHorse‐DrivenBuggiesinwhichBuggiesareat‐fault.
Category # Horse and
Buggy Crashes, H&B at‐fault
% within each group
# Crashes not involving
vulnerable road user
% within each group
% Difference
Total 50 ‐ 307027 ‐ ‐
State road 39 78.0% 227029 73.9% 4.1%
Local road 33 66.0% 140260 45.7% 20.3%
Urban area 3 6.0% 125803 41.0% ‐35.0%
Curved road 1 2.0% 57635 18.8% ‐16.8%
Inclement weather 6 12.0% 56665 18.5% ‐6.5%
Rain 4 66.7% 34665 61.2% 5.5%
Sleet 0 0.0% 1170 2.1% ‐2.1%
Snow 1 16.7% 15775 27.8% ‐11.2%
Fog 1 16.7% 1546 2.7% 13.9%
Others 0 0.0% 3509 6.2% ‐6.2%
Non day‐light 18 36.0% 108012 35.2% 0.8%
Dark ‐ no street lights 13 72.2% 42276 39.1% 33.1%
Dark ‐ street lights 3 16.7% 53917 49.9% ‐33.3%
Inclement surface 7 14.0% 76083 24.8% ‐10.8%
Wet 5 71.4% 50654 66.6% 4.9%
Sand/mud etc. 0 0.0% 718 0.9% ‐0.9%
Snow covered 1 14.3% 11057 14.5% ‐0.2%
Slush 0 0.0% 4308 5.7% ‐5.7%
Others 1 14.3% 9346 12.3% 2.0%
Intersection 25 50.0% 122066 39.8% 10.2%
Signalized intersection 4 16.0% 48343 39.6% ‐23.6%
Stop‐controlled intersection 14 56.0% 38733 31.7% 24.3%
Others 7 28.0% 34990 28.7% ‐0.7%
Rear‐end crashes 3 12.0% 27209 22.3% ‐10.3%
Angle crashes 20 80.0% 68234 55.9% 24.1%
D5 Improper of careless turn 7 28.0% 21061 17.3% 10.7%
Non day‐light 4 57.1% 6572 31.2% 25.9%
Dark ‐ no street lights 3 42.9% 929 4.4% 38.4%
Dark ‐ street lights 0 0.0% 4837 23.0% ‐23.0%
D7 Proceeding w/o clearance 8 32.0% 19478 16.0% 16.0%
Non day‐light 4 50.0% 3658 18.8% 31.2%
Dark ‐ no street lights 3 37.5% 896 4.6% 32.9%
Dark ‐ street lights 1 12.5% 2106 10.8% 1.7%
D8 Running stop sign 5 20.0% 7335 6.0% 14.0%
D14 Careless passing or lane change 0 0.0% 2217 1.8% ‐1.8%
D24 Driving too fast 0 0.0% 11035 9.0% ‐9.0%
Mid block 25 50.0% 184961 60.2% ‐10.2%
Rear‐end crashes 2 8.0% 52323 28.3% ‐20.3%
Head‐on 2 8.0% 6526 3.5% 4.5%

76
Category # Horse and
Buggy Crashes, H&B at‐fault
% within each group
# Crashes not involving
vulnerable road user
% within each group
% Difference
Angle 16 64.0% 23777 12.9% 51.1%
D1 Distracted 1 4.0% 21781 11.8% ‐7.8%
D5 Improper of careless turn 5 20.0% 7768 4.2% 15.8%
Non day‐light 1 20.0% 1890 24.3% ‐4.3%
Dark ‐ no street lights 0 0.0% 515 6.6% ‐6.6%
Dark ‐ street lights 0 0.0% 1087 14.0% ‐14.0%
D7 Proceeding w/o clearance 3 12.0% 2582 1.4% 10.6%
Non day‐light 1 20.0% 460 5.9% 14.1%
Dark ‐ no street lights 1 20.0% 105 1.4% 18.6%
Dark ‐ street lights 0 0.0% 269 3.5% ‐3.5%
D11 Tailgating 0 0.0% 9681 5.2% ‐5.2%
D14 Careless passing or lane change 1 4.0% 8386 4.5% ‐0.5%
D19 Making improper entrance to highway 6 24.0% 3197 1.7% 22.3%
D24 Driving too fast 0 0.0% 49300 26.7% ‐26.7%
Intersection + non day‐light 10 20.0% 36261 11.8% 8.2%
Dark ‐ no street lights 6 60.0% 7557 20.8% 39.2%
Dark ‐ street lights 3 30.0% 24492 67.5% ‐37.5%
Mid block + non day‐light 8 16.0% 71751 23.4% ‐7.4%
Dark ‐ no street lights 7 87.5% 34719 48.4% 39.1%
Dark ‐ street lights 0 0.0% 29425 41.0% ‐41.0%
Collision type
Rear‐end 5 10.0% 79532 25.9% ‐15.9%
Intersection 3 60.0% 27209 34.2% 25.8%
Mid block 2 40.0% 52323 65.8% ‐25.8%
Non day‐light 3 60.0% 19981 25.1% 34.9%
Dark ‐ no street lights 2 40.0% 5434 6.8% 33.2%
Dark ‐ street lights 1 20.0% 11861 14.9% 5.1%
Dusk 0 0.0% 1414 1.8% ‐1.8%
Head‐on 3 6.0% 11715 3.8% 2.2%
Angle 36 72.0% 92011 30.0% 42.0%
Non day‐light 14 38.9% 24203 26.3% 12.6%
Dark ‐ no street lights 10 27.8% 4667 5.1% 22.7%
Dark ‐ street lights 2 5.6% 16379 17.8% ‐12.2%
Sideswipe (same dir.) 2 4.0% 15178 4.9% ‐0.9%
Sideswipe (Opposite dir.) 3 6.0% 6672 2.2% 3.8%
Hit fixed object 1 2.0% 94845 30.9% ‐28.9%
Relation to road
On roadway 48 96.0% 195916 63.8% 32.2%
Shoulder 0 0.0% 20652 6.7% ‐6.7%
Roadside 1 2.0% 52801 17.2% ‐15.2%
Outside trafficway 1 2.0% 24510 8.0% ‐6.0%

77
Table16.CrashCharacteristicsforCrashesInvolvingHorse‐DrivenBuggiesinwhichBuggiesarenotat‐fault.
Category # Horse and
Buggy Crashes, H&B not at‐fault
% within each group
# Crashes not involving
vulnerable road user
% within each group
% Difference
Total 114 ‐ 307027 ‐
State road 103 90.4% 227029 73.9% 16.4%
Local road 20 17.5% 140260 45.7% ‐28.2%
Urban area 3 2.6% 125803 41.0% ‐38.3%
Curved road 11 9.6% 57635 18.8% ‐9.1%
Inclement weather 12 10.5% 56665 18.5% ‐7.9%
Rain 10 83.3% 34665 61.2% 22.2%
Sleet 0 0.0% 1170 2.1% ‐2.1%
Snow 0 0.0% 15775 27.8% ‐27.8%
Fog 1 8.3% 1546 2.7% 5.6%
Others 1 8.3% 3509 6.2% 2.1%
Non day‐light 31 27.2% 108012 35.2% ‐8.0%
Dark ‐ no street lights 16 51.6% 42276 39.1% 12.5%
Dark ‐ street lights 3 9.7% 53917 49.9% ‐40.2%
Inclement surface 15 13.2% 76083 24.8% ‐11.6%
Wet 14 93.3% 50654 66.6% 26.8%
Sand/mud etc. 0 0.0% 718 0.9% ‐0.9%
Snow covered 1 6.7% 11057 14.5% ‐7.9%
Slush 0 0.0% 4308 5.7% ‐5.7%
Others 0 0.0% 9346 12.3% ‐12.3%
Intersection 10 8.8% 122066 39.8% ‐31.0%
Signalized intersection 0 0.0% 48343 39.6% ‐39.6%
Stop‐controlled intersection 1 10.0% 38733 31.7% ‐21.7%
Others 9 90.0% 34990 28.7% 61.3%
Rear‐end crashes 4 40.0% 27209 22.3% 17.7%
Angle crashes 4 40.0% 68234 55.9% ‐15.9%
D5 Improper of careless turn 0 0.0% 21061 17.3% ‐17.3%
Non day‐light 0 0.0% 6572 31.2% ‐31.2%
Dark ‐ no street lights 0 0.0% 929 4.4% ‐4.4%
Dark ‐ street lights 0 0.0% 4837 23.0% ‐23.0%
D7 Proceeding w/o clearance 1 10.0% 19478 16.0% ‐6.0%
Non day‐light 0 0.0% 3658 18.8% ‐18.8%
Dark ‐ no street lights 0 0.0% 896 4.6% ‐4.6%
Dark ‐ street lights 0 0.0% 2106 10.8% ‐10.8%
D8 Running stop sign 0 0.0% 7335 6.0% ‐6.0%
D14 Careless passing or lane change 2 20.0% 2217 1.8% 18.2%
D24 Driving too fast 3 30.0% 11035 9.0% 21.0%
Mid block 104 91.2% 184961 60.2% 31.0%
Rear‐end crashes 71 68.3% 52323 28.3% 40.0%
Head‐on 6 5.8% 6526 3.5% 2.2%

78
Category # Horse and
Buggy Crashes, H&B not at‐fault
% within each group
# Crashes not involving
vulnerable road user
% within each group
% Difference
Angle 10 9.6% 23777 12.9% ‐3.2%
D1 Distracted 13 12.5% 21781 11.8% 0.7%
D5 Improper of careless turn 1 1.0% 7768 4.2% ‐3.2%
Non day‐light 1 100.0% 1890 24.3% 75.7%
Dark ‐ no street lights 0 0.0% 515 6.6% ‐6.6%
Dark ‐ street lights 1 100.0% 1087 14.0% 86.0%
D7 Proceeding w/o clearance 0 0.0% 2582 1.4% ‐1.4%
Non day‐light 0 0.0% 460 5.9% ‐5.9%
Dark ‐ no street lights 0 0.0% 105 1.4% ‐1.4%
Dark ‐ street lights 0 0.0% 269 3.5% ‐3.5%
D11 Tailgating 8 7.7% 9681 5.2% 2.5%
D14 Careless passing or lane change 16 15.4% 8386 4.5% 10.9%
D19 Making improper entrance to highway 0 0.0% 3197 1.7% ‐1.7%
D24 Driving too fast 24 23.1% 49300 26.7% ‐3.6%
Intersection + non day‐light 3 2.6% 36261 11.8% ‐9.2%
Dark ‐ no street lights 1 33.3% 7557 20.8% 12.5%
Dark ‐ street lights 0 0.0% 24492 67.5% ‐67.5%
Mid block + non day‐light 28 24.6% 71751 23.4% 1.2%
Dark ‐ no street lights 15 53.6% 34719 48.4% 5.2%
Dark ‐ street lights 3 10.7% 29425 41.0% ‐30.3%
Collision type
Rear‐end 75 65.8% 79532 25.9% 39.9%
Intersection 4 5.3% 27209 34.2% ‐28.9%
Mid block 71 94.7% 52323 65.8% 28.9%
Non day‐light 21 28.0% 19981 25.1% 2.9%
Dark ‐ no street lights 13 17.3% 5434 6.8% 10.5%
Dark ‐ street lights 1 1.3% 11861 14.9% ‐13.6%
Dusk 6 8.0% 1414 1.8% 6.2%
Head‐on 6 5.3% 11715 3.8% 1.4%
Angle 14 12.3% 92011 30.0% ‐17.7%
Non day‐light 2 14.3% 24203 26.3% ‐12.0%
Dark ‐ no street lights 0 0.0% 4667 5.1% ‐5.1%
Dark ‐ street lights 0 0.0% 16379 17.8% ‐17.8%
Sideswipe (same dir.) 14 12.3% 15178 4.9% 7.3%
Sideswipe (Opposite dir.) 4 3.5% 6672 2.2% 1.3%
Hit fixed object 1 0.9% 94845 30.9% ‐30.0%
Relation to road
On roadway 108 94.7% 195916 63.8% 30.9%
Shoulder 3 2.6% 20652 6.7% ‐4.1%
Roadside 3 2.6% 52801 17.2% ‐14.6%
Outside trafficway 0 0.0% 24510 8.0% ‐8.0%

79
APPENDIX F
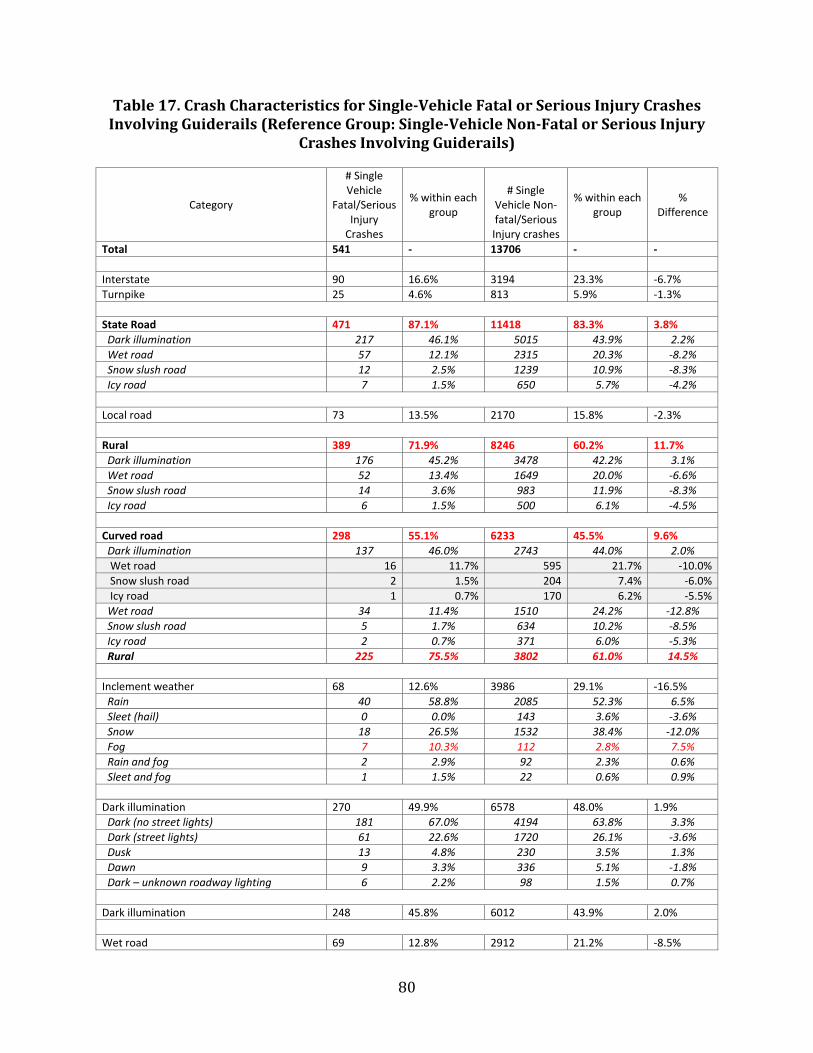
80
Table17.CrashCharacteristicsforSingle‐VehicleFatalorSeriousInjuryCrashesInvolvingGuiderails(ReferenceGroup:Single‐VehicleNon‐FatalorSeriousInjury
CrashesInvolvingGuiderails)
Category
# Single Vehicle
Fatal/Serious Injury Crashes
% within each group
# Single Vehicle Non‐fatal/Serious Injury crashes
% within each group
% Difference
Total 541 ‐ 13706 ‐ ‐
Interstate 90 16.6% 3194 23.3% ‐6.7%
Turnpike 25 4.6% 813 5.9% ‐1.3%
State Road 471 87.1% 11418 83.3% 3.8%
Dark illumination 217 46.1% 5015 43.9% 2.2%
Wet road 57 12.1% 2315 20.3% ‐8.2%
Snow slush road 12 2.5% 1239 10.9% ‐8.3%
Icy road 7 1.5% 650 5.7% ‐4.2%
Local road 73 13.5% 2170 15.8% ‐2.3%
Rural 389 71.9% 8246 60.2% 11.7%
Dark illumination 176 45.2% 3478 42.2% 3.1%
Wet road 52 13.4% 1649 20.0% ‐6.6%
Snow slush road 14 3.6% 983 11.9% ‐8.3%
Icy road 6 1.5% 500 6.1% ‐4.5%
Curved road 298 55.1% 6233 45.5% 9.6%
Dark illumination 137 46.0% 2743 44.0% 2.0%
Wet road 16 11.7% 595 21.7% ‐10.0%
Snow slush road 2 1.5% 204 7.4% ‐6.0%
Icy road 1 0.7% 170 6.2% ‐5.5%
Wet road 34 11.4% 1510 24.2% ‐12.8%
Snow slush road 5 1.7% 634 10.2% ‐8.5%
Icy road 2 0.7% 371 6.0% ‐5.3%
Rural 225 75.5% 3802 61.0% 14.5%
Inclement weather 68 12.6% 3986 29.1% ‐16.5%
Rain 40 58.8% 2085 52.3% 6.5%
Sleet (hail) 0 0.0% 143 3.6% ‐3.6%
Snow 18 26.5% 1532 38.4% ‐12.0%
Fog 7 10.3% 112 2.8% 7.5%
Rain and fog 2 2.9% 92 2.3% 0.6%
Sleet and fog 1 1.5% 22 0.6% 0.9%
Dark illumination 270 49.9% 6578 48.0% 1.9%
Dark (no street lights) 181 67.0% 4194 63.8% 3.3%
Dark (street lights) 61 22.6% 1720 26.1% ‐3.6%
Dusk 13 4.8% 230 3.5% 1.3%
Dawn 9 3.3% 336 5.1% ‐1.8%
Dark – unknown roadway lighting 6 2.2% 98 1.5% 0.7%
Dark illumination 248 45.8% 6012 43.9% 2.0%
Wet road 69 12.8% 2912 21.2% ‐8.5%
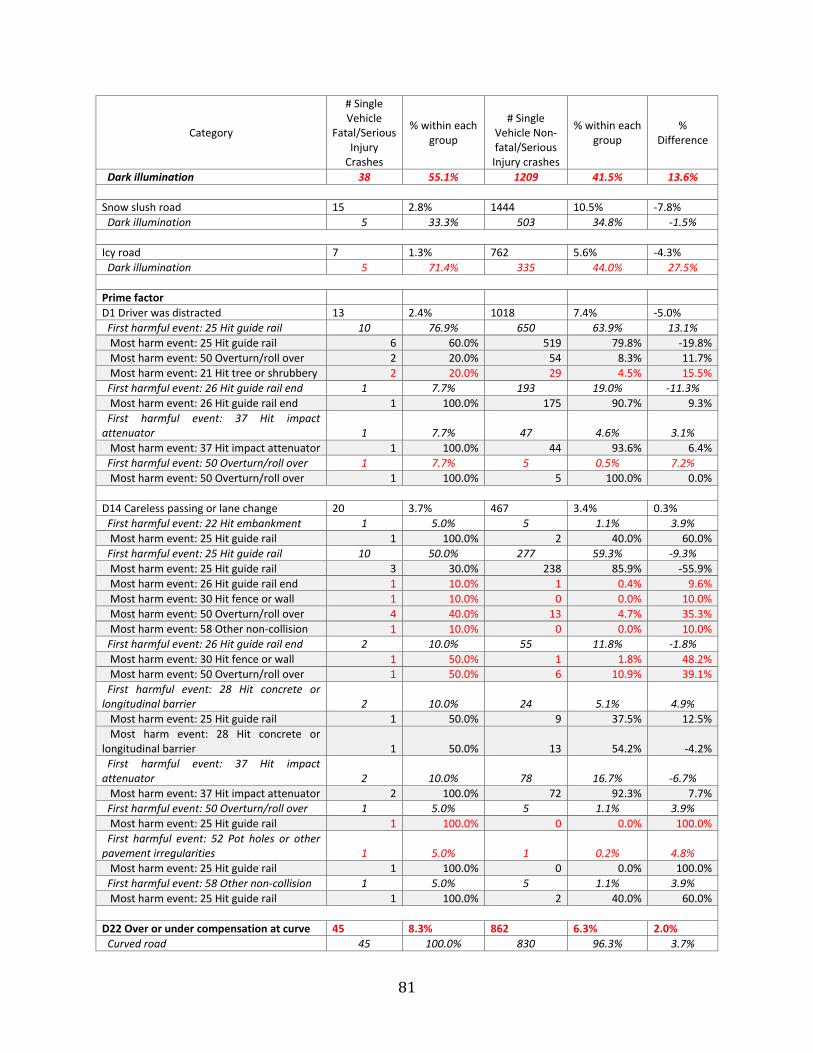
81
Category
# Single Vehicle
Fatal/Serious Injury Crashes
% within each group
# Single Vehicle Non‐fatal/Serious Injury crashes
% within each group
% Difference
Dark illumination 38 55.1% 1209 41.5% 13.6%
Snow slush road 15 2.8% 1444 10.5% ‐7.8%
Dark illumination 5 33.3% 503 34.8% ‐1.5%
Icy road 7 1.3% 762 5.6% ‐4.3%
Dark illumination 5 71.4% 335 44.0% 27.5%
Prime factor
D1 Driver was distracted 13 2.4% 1018 7.4% ‐5.0%
First harmful event: 25 Hit guide rail 10 76.9% 650 63.9% 13.1%
Most harm event: 25 Hit guide rail 6 60.0% 519 79.8% ‐19.8%
Most harm event: 50 Overturn/roll over 2 20.0% 54 8.3% 11.7%
Most harm event: 21 Hit tree or shrubbery 2 20.0% 29 4.5% 15.5%
First harmful event: 26 Hit guide rail end 1 7.7% 193 19.0% ‐11.3%
Most harm event: 26 Hit guide rail end 1 100.0% 175 90.7% 9.3%
First harmful event: 37 Hit impact attenuator 1 7.7% 47 4.6% 3.1%
Most harm event: 37 Hit impact attenuator 1 100.0% 44 93.6% 6.4%
First harmful event: 50 Overturn/roll over 1 7.7% 5 0.5% 7.2%
Most harm event: 50 Overturn/roll over 1 100.0% 5 100.0% 0.0%
D14 Careless passing or lane change 20 3.7% 467 3.4% 0.3%
First harmful event: 22 Hit embankment 1 5.0% 5 1.1% 3.9%
Most harm event: 25 Hit guide rail 1 100.0% 2 40.0% 60.0%
First harmful event: 25 Hit guide rail 10 50.0% 277 59.3% ‐9.3%
Most harm event: 25 Hit guide rail 3 30.0% 238 85.9% ‐55.9%
Most harm event: 26 Hit guide rail end 1 10.0% 1 0.4% 9.6%
Most harm event: 30 Hit fence or wall 1 10.0% 0 0.0% 10.0%
Most harm event: 50 Overturn/roll over 4 40.0% 13 4.7% 35.3%
Most harm event: 58 Other non‐collision 1 10.0% 0 0.0% 10.0%
First harmful event: 26 Hit guide rail end 2 10.0% 55 11.8% ‐1.8%
Most harm event: 30 Hit fence or wall 1 50.0% 1 1.8% 48.2%
Most harm event: 50 Overturn/roll over 1 50.0% 6 10.9% 39.1%
First harmful event: 28 Hit concrete or longitudinal barrier 2 10.0% 24 5.1% 4.9%
Most harm event: 25 Hit guide rail 1 50.0% 9 37.5% 12.5%
Most harm event: 28 Hit concrete or longitudinal barrier 1 50.0% 13 54.2% ‐4.2%
First harmful event: 37 Hit impact attenuator 2 10.0% 78 16.7% ‐6.7%
Most harm event: 37 Hit impact attenuator 2 100.0% 72 92.3% 7.7%
First harmful event: 50 Overturn/roll over 1 5.0% 5 1.1% 3.9%
Most harm event: 25 Hit guide rail 1 100.0% 0 0.0% 100.0%
First harmful event: 52 Pot holes or other pavement irregularities 1 5.0% 1 0.2% 4.8%
Most harm event: 25 Hit guide rail 1 100.0% 0 0.0% 100.0%
First harmful event: 58 Other non‐collision 1 5.0% 5 1.1% 3.9%
Most harm event: 25 Hit guide rail 1 100.0% 2 40.0% 60.0%
D22 Over or under compensation at curve 45 8.3% 862 6.3% 2.0%
Curved road 45 100.0% 830 96.3% 3.7%

82
Category
# Single Vehicle
Fatal/Serious Injury Crashes
% within each group
# Single Vehicle Non‐fatal/Serious Injury crashes
% within each group
% Difference
Dark illumination 17 37.8% 405 48.8% ‐11.0%
Wet road 3 6.7% 149 17.3% ‐10.6%
Icy road 1 2.2% 14 1.6% 0.6%
Speeding related 12 26.7% 177 20.5% 6.1%
First harmful event: 22 Hit embankment 2 4.4% 24 2.8% 1.7%
Most harm event: 21 Hit tree or shrubbery 1 50.0% 0 0.0% 50.0%
Most harm event: 29 Hit ditch 1 50.0% 0 0.0% 50.0%
First harmful event: 23 Hit utility pole 1 2.2% 7 0.8% 1.4%
Most harm event: 21 Hit tree or shrubbery 1 100.0% 0 0.0% 100.0%
First harmful event: 25 Hit guide rail 30 66.7% 629 73.0% ‐6.3%
Most harm event: 21 Hit tree or shrubbery 3 10.0% 17 2.7% 7.3%
Most harm event: 22 Hit embankment 1 3.3% 11 1.7% 1.6%
Most harm event: 23 Hit utility pole 1 3.3% 8 1.3% 2.1%
Most harm event: 25 Hit guide rail 18 60.0% 493 78.4% ‐18.4%
Most harm event: 28 Hit concrete or longitudinal barrier 1 3.3% 10 1.6% 1.7%
Most harm event: 29 Hit ditch 1 3.3% 6 1.0% 2.4%
Most harm event: 50 Overturn/roll over 4 13.3% 65 10.3% 3.0%
Most harm event: 58 Other non‐collision 1 3.3% 3 0.5% 2.9%
First harmful event: 26 Hit guide rail end 10 22.2% 121 14.0% 8.2%
Most harm event: 21 Hit tree or shrubbery 2 20.0% 3 2.5% 17.5%
Most harm event: 23 Hit utility pole 1 10.0% 2 1.7% 8.3%
Most harm event: 26 Hit guide rail end 5 50.0% 97 80.2% ‐30.2%
Most harm event: 35 Hit bridge rail 1 10.0% 1 0.8% 9.2%
Most harm event: 58 Other non‐collision 1 10.0% 0 0.0% 10.0%
First harmful event: 29 Hit ditch 1 2.2% 9 1.0% 1.2%
Most harm event: 25 Hit guide rail 1 100.0% 6 66.7% 33.3%
First harmful event: 48 Hit other fixed object 1 2.2% 4 0.5% 1.8%
Most harm event: 50 Overturn/roll over 1 100.0% 0 0.0% 100.0%
D23 Speeding 36 6.7% 366 2.7% 4.0%
Curved road 25 69.4% 207 56.6% 12.9%
Dark illumination 15 60.0% 104 50.2% 9.8%
Dark illumination 20 55.6% 181 49.5% 6.1%
Wet road 3 8.3% 34 9.3% ‐1.0%
First harmful event: 22 Hit embankment 3 8.3% 13 3.6% 4.8%
Most harm event: 22 Hit embankment 2 66.7% 3 23.1% 43.6%
Most harm event: 50 Overturn/roll over 1 33.3% 3 23.1% 10.3%
First harmful event: 25 Hit guide rail 18 50.0% 274 74.9% ‐24.9%
Most harm event: 21 Hit tree or shrubbery 3 16.7% 9 3.3% 13.4%
Most harm event: 25 Hit guide rail 10 55.6% 211 77.0% ‐21.5%
Most harm event: 37 Hit impact attenuator 1 5.6% 0 0.0% 5.6%
Most harm event: 50 Overturn/roll over 4 22.2% 23 8.4% 13.8%
First harmful event: 26 Hit guide rail end 6 16.7% 26 7.1% 9.6%
Most harm event: 21 Hit tree or shrubbery 1 16.7% 0 0.0% 16.7%
Most harm event: 25 Hit guide rail 1 16.7% 0 0.0% 16.7%
Most harm event: 26 Hit guide rail end 3 50.0% 20 76.9% ‐26.9%
Most harm event: 50 Overturn/roll over 1 16.7% 6 23.1% ‐6.4%
First harmful event: 27 Hit curb 2 5.6% 9 2.5% 3.1%
Most harm event: 23 Hit utility pole 1 50.0% 1 11.1% 38.9%
Most harm event: 50 Overturn/roll over 1 50.0% 0 0.0% 50.0%
First harmful event: 32 Hit culvert 1 2.8% 0 0.0% 2.8%

83
Category
# Single Vehicle
Fatal/Serious Injury Crashes
% within each group
# Single Vehicle Non‐fatal/Serious Injury crashes
% within each group
% Difference
Most harm event: 25 Hit guide rail 1 100.0% 0 0.0% 100.0%
First harmful event: 37 Hit impact attenuator 2 5.6% 4 1.1% 4.5%
Most harm event: 50 Overturn/roll over 1 50.0% 0 0.0% 50.0%
Most harm event: 54 Fire in vehicle 1 50.0% 0 0.0% 50.0%
First harmful event: 48 Hit other fixed object 1 2.8% 1 0.3% 2.5%
Most harm event: 28 Hit concrete or longitudinal barrier 1 100.0% 0 0.0% 100.0%
First harmful event: 58 Other non‐collision 3 8.3% 1 0.3% 8.1%
Most harm event: 25 Hit guide rail 2 66.7% 1 100.0% ‐33.3%
Most harm event: 58 Other non‐collision 1 33.3% 0 0.0% 33.3%
D24 Driving too fast for conditions 150 27.7% 5237 38.2% ‐10.5%
Curved road 105 70.0% 2761 52.7% 17.3%
Dark illumination 40 38.1% 1066 38.6% ‐0.5%
Dark illumination 60 40.0% 2042 39.0% 1.0%
Wet road 28 18.7% 1816 34.7% ‐16.0%
Snow slush road 12 8.0% 1254 23.9% ‐15.9%
Icy road 6 4.0% 654 12.5% ‐8.5%
First harmful event: 21 Hit tree or shrubbery 1 0.7% 18 0.3% 0.3%
First harmful event: 22 Hit embankment 5 3.3% 113 2.2% 1.2%
First harmful event: 23 Hit utility pole 1 0.7% 18 0.3% 0.3%
First harmful event: 24 Hit traffic sign 1 0.7% 45 0.9% ‐0.2%
First harmful event: 25 Hit guide rail 108 72.0% 4002 76.4% ‐4.4%
Most harm event: 21 Hit tree or shrubbery 12 11.1% 84 2.1% 9.0%
Most harm event: 25 Hit guide rail 45 41.7% 3335 83.3% ‐41.7%
Most harm event: 50 Overturn/roll over 38 35.2% 294 7.3% 27.8%
First harmful event: 26 Hit guide rail end 14 9.3% 455 8.7% 0.6%
Most harm event: 26 Hit guide rail end 7 50.0% 379 83.3% ‐33.3%
First harmful event: 27 Hit curb 1 0.7% 39 0.7% ‐0.1%
First harmful event: 28 Hit concrete or longitudinal barrier 5 3.3% 263 5.0% ‐1.7%
First harmful event: 29 Hit ditch 2 1.3% 21 0.4% 0.9%
First harmful event: 37 Hit impact attenuator 1 0.7% 95 1.8% ‐1.1%
First harmful event: 40 Hit mailbox 1 0.7% 14 0.3% 0.4%
First harmful event: 42 Hit snow bank 1 0.7% 6 0.1% 0.6%
First harmful event: 50 Overturn/roll over 2 1.3% 43 0.8% 0.5%
First harmful event: 58 Other non‐collision 6 4.0% 14 0.3% 3.7%
D92 Affected by physical condition 124 22.9% 2323 16.9% 6.0%
Fatigue asleep 13 10.5% 605 26.0% ‐15.6%
Dark illumination 73 58.9% 1342 57.8% 1.1%
Impaired driver 74 59.7% 1173 50.5% 9.2%
Curved road 54 43.5% 863 37.2% 6.4%
First harmful event: 25 Hit guide rail 86 69.4% 1578 67.9% 1.4%
Most harm event: 21 Hit tree or shrubbery 17 19.8% 59 3.7% 16.0%
Most harm event: 25 Hit guide rail 36 41.9% 1223 77.5% ‐35.6%
Most harm event: 50 Overturn/roll over 21 24.4% 121 7.7% 16.8%
First harmful event: 26 Hit guide rail end 14 11.3% 383 16.5% ‐5.2%
Most harm event: 26 Hit guide rail end 6 42.9% 306 79.9% ‐37.0%
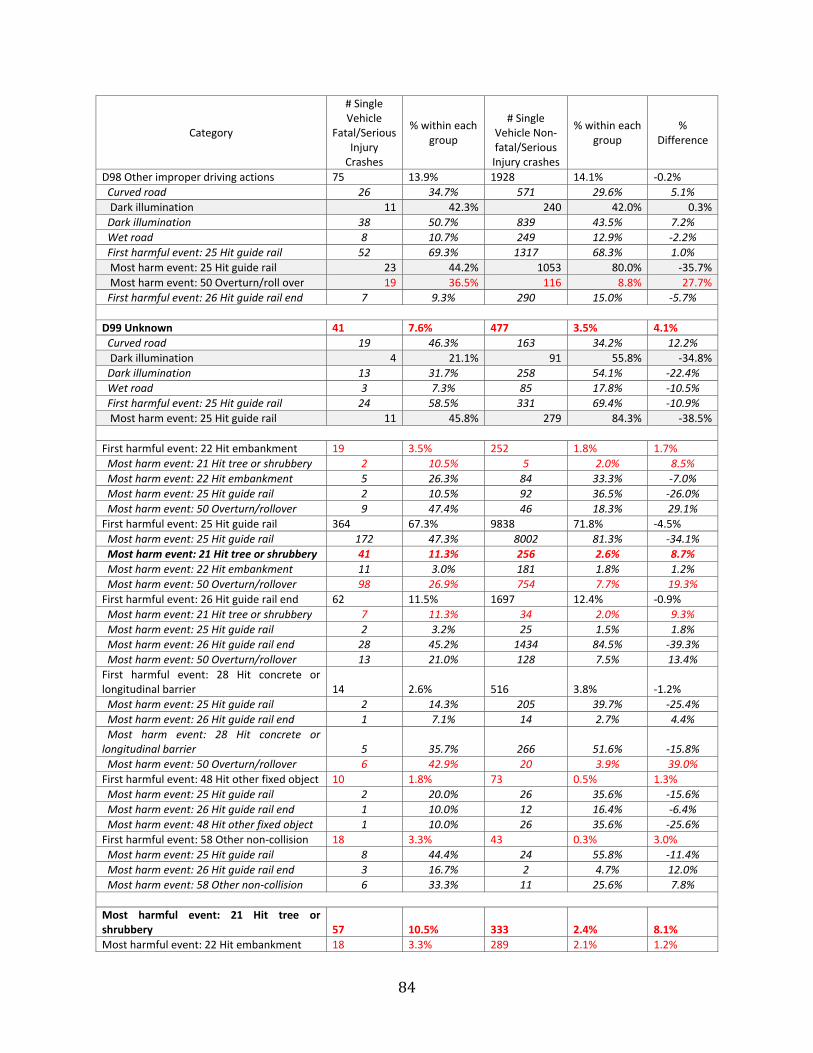
84
Category
# Single Vehicle
Fatal/Serious Injury Crashes
% within each group
# Single Vehicle Non‐fatal/Serious Injury crashes
% within each group
% Difference
D98 Other improper driving actions 75 13.9% 1928 14.1% ‐0.2%
Curved road 26 34.7% 571 29.6% 5.1%
Dark illumination 11 42.3% 240 42.0% 0.3%
Dark illumination 38 50.7% 839 43.5% 7.2%
Wet road 8 10.7% 249 12.9% ‐2.2%
First harmful event: 25 Hit guide rail 52 69.3% 1317 68.3% 1.0%
Most harm event: 25 Hit guide rail 23 44.2% 1053 80.0% ‐35.7%
Most harm event: 50 Overturn/roll over 19 36.5% 116 8.8% 27.7%
First harmful event: 26 Hit guide rail end 7 9.3% 290 15.0% ‐5.7%
D99 Unknown 41 7.6% 477 3.5% 4.1%
Curved road 19 46.3% 163 34.2% 12.2%
Dark illumination 4 21.1% 91 55.8% ‐34.8%
Dark illumination 13 31.7% 258 54.1% ‐22.4%
Wet road 3 7.3% 85 17.8% ‐10.5%
First harmful event: 25 Hit guide rail 24 58.5% 331 69.4% ‐10.9%
Most harm event: 25 Hit guide rail 11 45.8% 279 84.3% ‐38.5%
First harmful event: 22 Hit embankment 19 3.5% 252 1.8% 1.7%
Most harm event: 21 Hit tree or shrubbery 2 10.5% 5 2.0% 8.5%
Most harm event: 22 Hit embankment 5 26.3% 84 33.3% ‐7.0%
Most harm event: 25 Hit guide rail 2 10.5% 92 36.5% ‐26.0%
Most harm event: 50 Overturn/rollover 9 47.4% 46 18.3% 29.1%
First harmful event: 25 Hit guide rail 364 67.3% 9838 71.8% ‐4.5%
Most harm event: 25 Hit guide rail 172 47.3% 8002 81.3% ‐34.1%
Most harm event: 21 Hit tree or shrubbery 41 11.3% 256 2.6% 8.7%
Most harm event: 22 Hit embankment 11 3.0% 181 1.8% 1.2%
Most harm event: 50 Overturn/rollover 98 26.9% 754 7.7% 19.3%
First harmful event: 26 Hit guide rail end 62 11.5% 1697 12.4% ‐0.9%
Most harm event: 21 Hit tree or shrubbery 7 11.3% 34 2.0% 9.3%
Most harm event: 25 Hit guide rail 2 3.2% 25 1.5% 1.8%
Most harm event: 26 Hit guide rail end 28 45.2% 1434 84.5% ‐39.3%
Most harm event: 50 Overturn/rollover 13 21.0% 128 7.5% 13.4%
First harmful event: 28 Hit concrete or longitudinal barrier 14 2.6% 516 3.8% ‐1.2%
Most harm event: 25 Hit guide rail 2 14.3% 205 39.7% ‐25.4%
Most harm event: 26 Hit guide rail end 1 7.1% 14 2.7% 4.4%
Most harm event: 28 Hit concrete or longitudinal barrier 5 35.7% 266 51.6% ‐15.8%
Most harm event: 50 Overturn/rollover 6 42.9% 20 3.9% 39.0%
First harmful event: 48 Hit other fixed object 10 1.8% 73 0.5% 1.3%
Most harm event: 25 Hit guide rail 2 20.0% 26 35.6% ‐15.6%
Most harm event: 26 Hit guide rail end 1 10.0% 12 16.4% ‐6.4%
Most harm event: 48 Hit other fixed object 1 10.0% 26 35.6% ‐25.6%
First harmful event: 58 Other non‐collision 18 3.3% 43 0.3% 3.0%
Most harm event: 25 Hit guide rail 8 44.4% 24 55.8% ‐11.4%
Most harm event: 26 Hit guide rail end 3 16.7% 2 4.7% 12.0%
Most harm event: 58 Other non‐collision 6 33.3% 11 25.6% 7.8%
Most harmful event: 21 Hit tree or shrubbery 57 10.5% 333 2.4% 8.1%
Most harmful event: 22 Hit embankment 18 3.3% 289 2.1% 1.2%
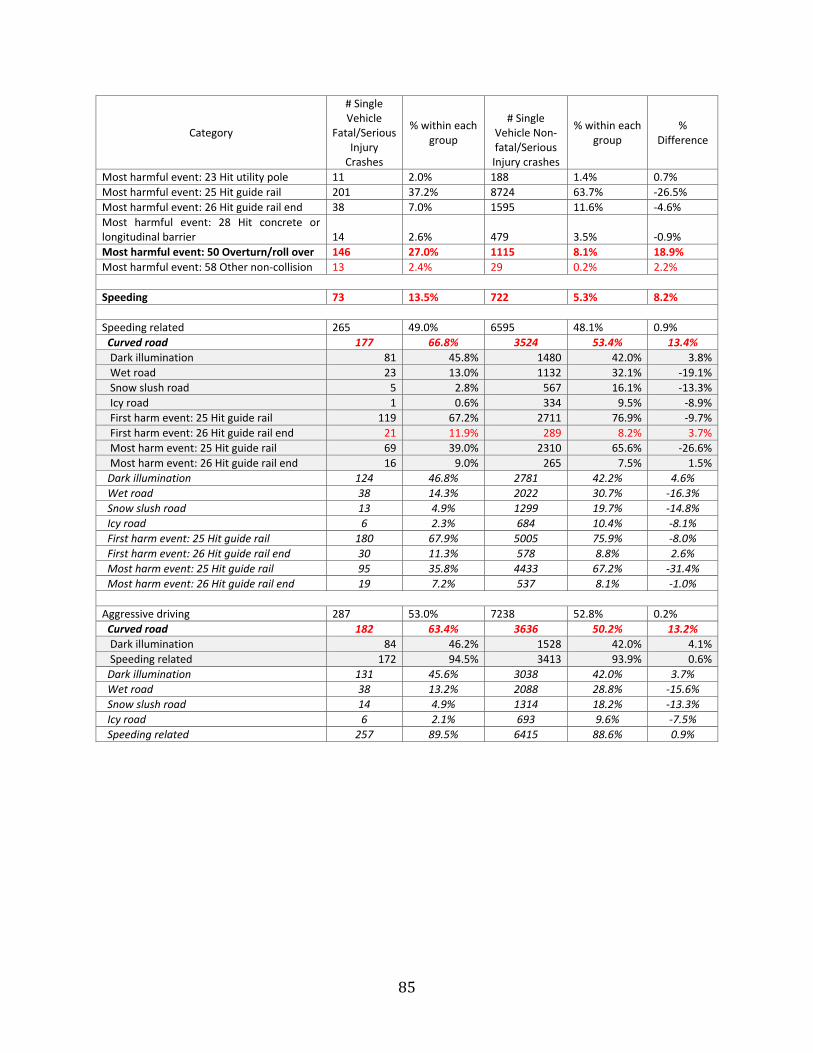
85
Category
# Single Vehicle
Fatal/Serious Injury Crashes
% within each group
# Single Vehicle Non‐fatal/Serious Injury crashes
% within each group
% Difference
Most harmful event: 23 Hit utility pole 11 2.0% 188 1.4% 0.7%
Most harmful event: 25 Hit guide rail 201 37.2% 8724 63.7% ‐26.5%
Most harmful event: 26 Hit guide rail end 38 7.0% 1595 11.6% ‐4.6%
Most harmful event: 28 Hit concrete or longitudinal barrier 14 2.6% 479 3.5% ‐0.9%
Most harmful event: 50 Overturn/roll over 146 27.0% 1115 8.1% 18.9%
Most harmful event: 58 Other non‐collision 13 2.4% 29 0.2% 2.2%
Speeding 73 13.5% 722 5.3% 8.2%
Speeding related 265 49.0% 6595 48.1% 0.9%
Curved road 177 66.8% 3524 53.4% 13.4%
Dark illumination 81 45.8% 1480 42.0% 3.8%
Wet road 23 13.0% 1132 32.1% ‐19.1%
Snow slush road 5 2.8% 567 16.1% ‐13.3%
Icy road 1 0.6% 334 9.5% ‐8.9%
First harm event: 25 Hit guide rail 119 67.2% 2711 76.9% ‐9.7%
First harm event: 26 Hit guide rail end 21 11.9% 289 8.2% 3.7%
Most harm event: 25 Hit guide rail 69 39.0% 2310 65.6% ‐26.6%
Most harm event: 26 Hit guide rail end 16 9.0% 265 7.5% 1.5%
Dark illumination 124 46.8% 2781 42.2% 4.6%
Wet road 38 14.3% 2022 30.7% ‐16.3%
Snow slush road 13 4.9% 1299 19.7% ‐14.8%
Icy road 6 2.3% 684 10.4% ‐8.1%
First harm event: 25 Hit guide rail 180 67.9% 5005 75.9% ‐8.0%
First harm event: 26 Hit guide rail end 30 11.3% 578 8.8% 2.6%
Most harm event: 25 Hit guide rail 95 35.8% 4433 67.2% ‐31.4%
Most harm event: 26 Hit guide rail end 19 7.2% 537 8.1% ‐1.0%
Aggressive driving 287 53.0% 7238 52.8% 0.2%
Curved road 182 63.4% 3636 50.2% 13.2%
Dark illumination 84 46.2% 1528 42.0% 4.1%
Speeding related 172 94.5% 3413 93.9% 0.6%
Dark illumination 131 45.6% 3038 42.0% 3.7%
Wet road 38 13.2% 2088 28.8% ‐15.6%
Snow slush road 14 4.9% 1314 18.2% ‐13.3%
Icy road 6 2.1% 693 9.6% ‐7.5%
Speeding related 257 89.5% 6415 88.6% 0.9%

86
Table18.CrashCharacteristicsforSingle‐VehicleFatalorSeriousInjuryCrashesInvolvingGuiderails(ReferenceGroup:Single‐VehicleFatalorSeriousInjury
CrashesInvolvingOtherFixedObjects)
Category
# Single Vehicle
Fatal/Serious Injury Crashes
% within each group
# Single Vehicle Fatal/Serious Injury Hit Fixed Object Crashes (Non‐guiderail)
% within each group
% Difference
Total 541 ‐ 13706 ‐ ‐
Interstate 90 16.6% 159 4.9% 11.7%
Turnpike 25 4.6% 34 1.1% 3.6%
State Road 471 87.1% 2343 72.6% 14.4%
Dark illumination 217 46.1% 1224 52.2% ‐6.2%
Wet road 57 12.1% 375 16.0% ‐3.9%
Snow slush road 12 2.5% 70 3.0% ‐0.4%
Icy road 7 1.5% 53 2.3% ‐0.8%
Local road 73 13.5% 1052 32.6% ‐19.1%
Rural 389 71.9% 2197 68.1% 3.8%
Dark illumination 176 45.2% 1103 50.2% ‐5.0%
Wet road 52 13.4% 346 15.7% ‐2.4%
Snow slush road 14 3.6% 80 3.6% 0.0%
Icy road 6 1.5% 45 2.0% ‐0.5%
Curved road 298 55.1% 1590 49.3% 5.8%
Dark illumination 137 46.0% 867 54.5% ‐8.6%
Wet road 16 11.7% 134 15.5% ‐3.8%
Snow slush road 2 1.5% 16 1.8% ‐0.4%
Icy road 1 0.7% 13 1.5% ‐0.8%
Wet road 34 11.4% 271 17.0% ‐5.6%
Snow slush road 5 1.7% 33 2.1% ‐0.4%
Icy road 2 0.7% 17 1.1% ‐0.4%
Rural 225 75.5% 1173 73.8% 1.7%
Inclement weather 68 12.6% 419 13.0% ‐0.4%
Rain 40 58.8% 280 66.8% ‐8.0%
Sleet (hail) 0 0.0% 7 1.7% ‐1.7%
Snow 18 26.5% 84 20.0% 6.4%
Fog 7 10.3% 35 8.4% 1.9%
Rain and fog 2 2.9% 13 3.1% ‐0.2%
Sleet and fog 1 1.5% 0 0.0% 1.5%
Dark illumination 270 49.9% 1811 56.1% ‐6.2%
Dark (no street lights) 181 67.0% 1190 65.7% 1.3%
Dark (street lights) 61 22.6% 489 27.0% ‐4.4%
Dusk 13 4.8% 71 3.9% 0.9%
Dawn 9 3.3% 43 2.4% 1.0%
Dark – unknown roadway lighting 6 2.2% 18 1.0% 1.2%
Dark illumination 248 45.8% 1697 52.6% ‐6.8%

87
Category
# Single Vehicle
Fatal/Serious Injury Crashes
% within each group
# Single Vehicle Fatal/Serious Injury Hit Fixed Object Crashes (Non‐guiderail)
% within each group
% Difference
Wet road 69 12.8% 498 15.4% ‐2.7%
Dark illumination 38 55.1% 262 52.6% 2.5%
Snow slush road 15 2.8% 92 2.9% ‐0.1%
Dark illumination 5 33.3% 48 52.2% ‐18.8%
Icy road 7 1.3% 63 2.0% ‐0.7%
Dark illumination 5 71.4% 41 65.1% 6.3%
Prime factor
D1 Driver was distracted 13 2.4% 120 3.7% ‐1.3%
First harmful event: 25 Hit guide rail 10 76.9% 0 0.0% 76.9%
Most harm event: 25 Hit guide rail 6 60.0% 0 0.0% 60.0%
Most harm event: 50 Overturn/roll over 2 20.0% 0 0.0% 20.0%
Most harm event: 21 Hit tree or shrubbery 2 20.0% 0 0.0% 20.0%
First harmful event: 26 Hit guide rail end 1 7.7% 0 0.0% 7.7%
Most harm event: 26 Hit guide rail end 1 100.0% 0 0.0% 100.0%
First harmful event: 37 Hit impact attenuator 1 7.7% 0 0.0% 7.7%
Most harm event: 37 Hit impact attenuator 1 100.0% 0 0.0% 100.0%
First harmful event: 50 Overturn/roll over 1 7.7% 0 0.0% 7.7%
Most harm event: 50 Overturn/roll over 1 100.0% 0 0.0% 100.0%
D14 Careless passing or lane change 20 3.7% 57 1.8% 1.9%
First harmful event: 22 Hit embankment 1 5.0% 14 24.6% ‐19.6%
Most harm event: 25 Hit guide rail 1 100.0% 0 0.0% 100.0%
First harmful event: 25 Hit guide rail 10 50.0% 0 0.0% 50.0%
Most harm event: 25 Hit guide rail 3 30.0% 0 0.0% 30.0%
Most harm event: 26 Hit guide rail end 1 10.0% 0 0.0% 10.0%
Most harm event: 30 Hit fence or wall 1 10.0% 0 0.0% 10.0%
Most harm event: 50 Overturn/roll over 4 40.0% 0 0.0% 40.0%
Most harm event: 58 Other non‐collision 1 10.0% 0 0.0% 10.0%
First harmful event: 26 Hit guide rail end 2 10.0% 0 0.0% 10.0%
Most harm event: 30 Hit fence or wall 1 50.0% 0 0.0% 50.0%
Most harm event: 50 Overturn/roll over 1 50.0% 0 0.0% 50.0%
First harmful event: 28 Hit concrete or longitudinal barrier 2 10.0% 12 21.1% ‐11.1%
Most harm event: 25 Hit guide rail 1 50.0% 0 0.0% 50.0%
Most harm event: 28 Hit concrete or longitudinal barrier 1 50.0% 8 66.7% ‐16.7%
First harmful event: 37 Hit impact attenuator 2 10.0% 0 0.0% 10.0%
Most harm event: 37 Hit impact attenuator 2 100.0% 0 0.0% 100.0%
First harmful event: 50 Overturn/roll over 1 5.0% 0 0.0% 5.0%
Most harm event: 25 Hit guide rail 1 100.0% 0 0.0% 100.0%
First harmful event: 52 Pot holes or other pavement irregularities 1 5.0% 0 0.0% 5.0%
Most harm event: 25 Hit guide rail 1 100.0% 0 0.0% 100.0%
First harmful event: 58 Other non‐collision 1 5.0% 0 0.0% 5.0%
Most harm event: 25 Hit guide rail 1 100.0% 0 0.0% 100.0%
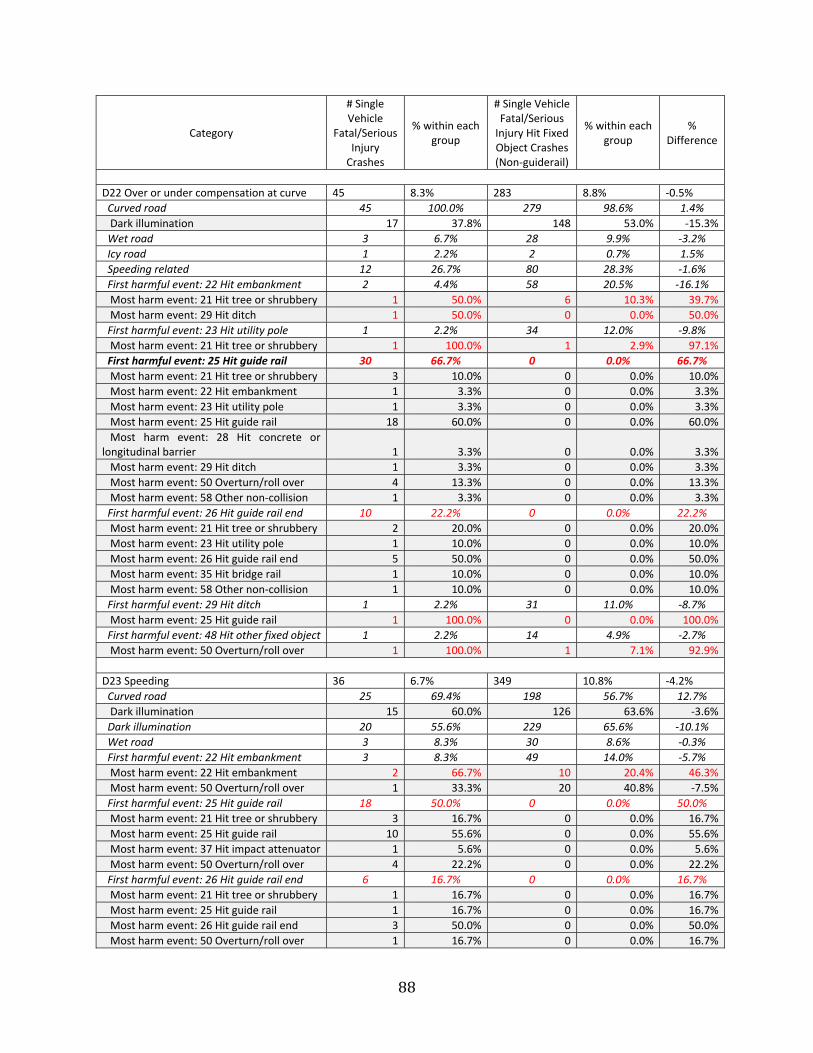
88
Category
# Single Vehicle
Fatal/Serious Injury Crashes
% within each group
# Single Vehicle Fatal/Serious Injury Hit Fixed Object Crashes (Non‐guiderail)
% within each group
% Difference
D22 Over or under compensation at curve 45 8.3% 283 8.8% ‐0.5%
Curved road 45 100.0% 279 98.6% 1.4%
Dark illumination 17 37.8% 148 53.0% ‐15.3%
Wet road 3 6.7% 28 9.9% ‐3.2%
Icy road 1 2.2% 2 0.7% 1.5%
Speeding related 12 26.7% 80 28.3% ‐1.6%
First harmful event: 22 Hit embankment 2 4.4% 58 20.5% ‐16.1%
Most harm event: 21 Hit tree or shrubbery 1 50.0% 6 10.3% 39.7%
Most harm event: 29 Hit ditch 1 50.0% 0 0.0% 50.0%
First harmful event: 23 Hit utility pole 1 2.2% 34 12.0% ‐9.8%
Most harm event: 21 Hit tree or shrubbery 1 100.0% 1 2.9% 97.1%
First harmful event: 25 Hit guide rail 30 66.7% 0 0.0% 66.7%
Most harm event: 21 Hit tree or shrubbery 3 10.0% 0 0.0% 10.0%
Most harm event: 22 Hit embankment 1 3.3% 0 0.0% 3.3%
Most harm event: 23 Hit utility pole 1 3.3% 0 0.0% 3.3%
Most harm event: 25 Hit guide rail 18 60.0% 0 0.0% 60.0%
Most harm event: 28 Hit concrete or longitudinal barrier 1 3.3% 0 0.0% 3.3%
Most harm event: 29 Hit ditch 1 3.3% 0 0.0% 3.3%
Most harm event: 50 Overturn/roll over 4 13.3% 0 0.0% 13.3%
Most harm event: 58 Other non‐collision 1 3.3% 0 0.0% 3.3%
First harmful event: 26 Hit guide rail end 10 22.2% 0 0.0% 22.2%
Most harm event: 21 Hit tree or shrubbery 2 20.0% 0 0.0% 20.0%
Most harm event: 23 Hit utility pole 1 10.0% 0 0.0% 10.0%
Most harm event: 26 Hit guide rail end 5 50.0% 0 0.0% 50.0%
Most harm event: 35 Hit bridge rail 1 10.0% 0 0.0% 10.0%
Most harm event: 58 Other non‐collision 1 10.0% 0 0.0% 10.0%
First harmful event: 29 Hit ditch 1 2.2% 31 11.0% ‐8.7%
Most harm event: 25 Hit guide rail 1 100.0% 0 0.0% 100.0%
First harmful event: 48 Hit other fixed object 1 2.2% 14 4.9% ‐2.7%
Most harm event: 50 Overturn/roll over 1 100.0% 1 7.1% 92.9%
D23 Speeding 36 6.7% 349 10.8% ‐4.2%
Curved road 25 69.4% 198 56.7% 12.7%
Dark illumination 15 60.0% 126 63.6% ‐3.6%
Dark illumination 20 55.6% 229 65.6% ‐10.1%
Wet road 3 8.3% 30 8.6% ‐0.3%
First harmful event: 22 Hit embankment 3 8.3% 49 14.0% ‐5.7%
Most harm event: 22 Hit embankment 2 66.7% 10 20.4% 46.3%
Most harm event: 50 Overturn/roll over 1 33.3% 20 40.8% ‐7.5%
First harmful event: 25 Hit guide rail 18 50.0% 0 0.0% 50.0%
Most harm event: 21 Hit tree or shrubbery 3 16.7% 0 0.0% 16.7%
Most harm event: 25 Hit guide rail 10 55.6% 0 0.0% 55.6%
Most harm event: 37 Hit impact attenuator 1 5.6% 0 0.0% 5.6%
Most harm event: 50 Overturn/roll over 4 22.2% 0 0.0% 22.2%
First harmful event: 26 Hit guide rail end 6 16.7% 0 0.0% 16.7%
Most harm event: 21 Hit tree or shrubbery 1 16.7% 0 0.0% 16.7%
Most harm event: 25 Hit guide rail 1 16.7% 0 0.0% 16.7%
Most harm event: 26 Hit guide rail end 3 50.0% 0 0.0% 50.0%
Most harm event: 50 Overturn/roll over 1 16.7% 0 0.0% 16.7%

89
Category
# Single Vehicle
Fatal/Serious Injury Crashes
% within each group
# Single Vehicle Fatal/Serious Injury Hit Fixed Object Crashes (Non‐guiderail)
% within each group
% Difference
First harmful event: 27 Hit curb 2 5.6% 38 10.9% ‐5.3%
Most harm event: 23 Hit utility pole 1 50.0% 4 10.5% 39.5%
Most harm event: 50 Overturn/roll over 1 50.0% 6 15.8% 34.2%
First harmful event: 32 Hit culvert 1 2.8% 4 1.1% 1.6%
Most harm event: 25 Hit guide rail 1 100.0% 0 0.0% 100.0%
First harmful event: 37 Hit impact attenuator 2 5.6% 0 0.0% 5.6%
Most harm event: 50 Overturn/roll over 1 50.0% 0 0.0% 50.0%
Most harm event: 54 Fire in vehicle 1 50.0% 0 0.0% 50.0%
First harmful event: 48 Hit other fixed object 1 2.8% 17 4.9% ‐2.1%
Most harm event: 28 Hit concrete or longitudinal barrier 1 100.0% 0 0.0% 100.0%
First harmful event: 58 Other non‐collision 3 8.3% 0 0.0% 8.3%
Most harm event: 25 Hit guide rail 2 66.7% 0 0.0% 66.7%
Most harm event: 58 Other non‐collision 1 33.3% 0 0.0% 33.3%
D24 Driving too fast for conditions 150 27.7% 833 25.8% 1.9%
Curved road 105 70.0% 504 60.5% 9.5%
Dark illumination 40 38.1% 259 51.4% ‐13.3%
Dark illumination 60 40.0% 433 52.0% ‐12.0%
Wet road 28 18.7% 236 28.3% ‐9.7%
Snow slush road 12 8.0% 70 8.4% ‐0.4%
Icy road 6 4.0% 43 5.2% ‐1.2%
First harmful event: 21 Hit tree or shrubbery 1 0.7% 293 35.2% ‐34.5%
First harmful event: 22 Hit embankment 5 3.3% 168 20.2% ‐16.8%
First harmful event: 23 Hit utility pole 1 0.7% 100 12.0% ‐11.3%
First harmful event: 24 Hit traffic sign 1 0.7% 25 3.0% ‐2.3%
First harmful event: 25 Hit guide rail 108 72.0% 0 0.0% 72.0%
Most harm event: 21 Hit tree or shrubbery 12 11.1% 0 0.0% 11.1%
Most harm event: 25 Hit guide rail 45 41.7% 0 0.0% 41.7%
Most harm event: 50 Overturn/roll over 38 35.2% 0 0.0% 35.2%
First harmful event: 26 Hit guide rail end 14 9.3% 0 0.0% 9.3%
Most harm event: 26 Hit guide rail end 7 50.0% 0 0.0% 50.0%
First harmful event: 27 Hit curb 1 0.7% 38 4.6% ‐3.9%
First harmful event: 28 Hit concrete or longitudinal barrier 5 3.3% 33 4.0% ‐0.6%
First harmful event: 29 Hit ditch 2 1.3% 61 7.3% ‐6.0%
First harmful event: 37 Hit impact attenuator 1 0.7% 0 0.0% 0.7%
First harmful event: 40 Hit mailbox 1 0.7% 12 1.4% ‐0.8%
First harmful event: 42 Hit snow bank 1 0.7% 4 0.5% 0.2%
First harmful event: 50 Overturn/roll over 2 1.3% 0 0.0% 1.3%
First harmful event: 58 Other non‐collision 6 4.0% 0 0.0% 4.0%
D92 Affected by physical condition 124 22.9% 785 24.3% ‐1.4%
Fatigue asleep 13 10.5% 65 8.3% 2.2%
Dark illumination 73 58.9% 442 56.3% 2.6%
Impaired driver 74 59.7% 522 66.5% ‐6.8%
Curved road 54 43.5% 298 38.0% 5.6%
First harmful event: 25 Hit guide rail 86 69.4% 0 0.0% 69.4%
Most harm event: 21 Hit tree or shrubbery 17 19.8% 0 0.0% 19.8%

90
Category
# Single Vehicle
Fatal/Serious Injury Crashes
% within each group
# Single Vehicle Fatal/Serious Injury Hit Fixed Object Crashes (Non‐guiderail)
% within each group
% Difference
Most harm event: 25 Hit guide rail 36 41.9% 0 0.0% 41.9%
Most harm event: 50 Overturn/roll over 21 24.4% 0 0.0% 24.4%
First harmful event: 26 Hit guide rail end 14 11.3% 0 0.0% 11.3%
Most harm event: 26 Hit guide rail end 6 42.9% 0 0.0% 42.9%
D98 Other improper driving actions 75 13.9% 320 9.9% 3.9%
Curved road 26 34.7% 79 24.7% 10.0%
Dark illumination 11 42.3% 42 53.2% ‐10.9%
Dark illumination 38 50.7% 160 50.0% 0.7%
Wet road 8 10.7% 40 12.5% ‐1.8%
First harmful event: 25 Hit guide rail 52 69.3% 0 0.0% 69.3%
Most harm event: 25 Hit guide rail 23 44.2% 0 0.0% 44.2%
Most harm event: 50 Overturn/roll over 19 36.5% 0 0.0% 36.5%
First harmful event: 26 Hit guide rail end 7 9.3% 0 0.0% 9.3%
D99 Unknown 41 7.6% 259 8.0% ‐0.4%
Curved road 19 46.3% 92 35.5% 10.8%
Dark illumination 4 21.1% 33 35.9% ‐14.8%
Dark illumination 13 31.7% 102 39.4% ‐7.7%
Wet road 3 7.3% 32 12.4% ‐5.0%
First harmful event: 25 Hit guide rail 24 58.5% 0 0.0% 58.5%
Most harm event: 25 Hit guide rail 11 45.8% 0 0.0% 45.8%
First harmful event: 22 Hit embankment 19 3.5% 517 16.0% ‐12.5%
Most harm event: 21 Hit tree or shrubbery 2 10.5% 79 15.3% ‐4.8%
Most harm event: 22 Hit embankment 5 26.3% 154 29.8% ‐3.5%
Most harm event: 25 Hit guide rail 2 10.5% 0 0.0% 10.5%
Most harm event: 50 Overturn/rollover 9 47.4% 224 43.3% 4.0%
First harmful event: 25 Hit guide rail 364 67.3% 0 0.0% 67.3%
Most harm event: 25 Hit guide rail 172 47.3% 0 0.0% 47.3%
Most harm event: 21 Hit tree or shrubbery 41 11.3% 0 0.0% 11.3%
Most harm event: 22 Hit embankment 11 3.0% 0 0.0% 3.0%
Most harm event: 50 Overturn/rollover 98 26.9% 0 0.0% 26.9%
First harmful event: 26 Hit guide rail end 62 11.5% 0 0.0% 11.5%
Most harm event: 21 Hit tree or shrubbery 7 11.3% 0 0.0% 11.3%
Most harm event: 25 Hit guide rail 2 3.2% 0 0.0% 3.2%
Most harm event: 26 Hit guide rail end 28 45.2% 0 0.0% 45.2%
Most harm event: 50 Overturn/rollover 13 21.0% 0 0.0% 21.0%
First harmful event: 28 Hit concrete or longitudinal barrier 14 2.6% 133 4.1% ‐1.5%
Most harm event: 25 Hit guide rail 2 14.3% 0 0.0% 14.3%
Most harm event: 26 Hit guide rail end 1 7.1% 0 0.0% 7.1%
Most harm event: 28 Hit concrete or longitudinal barrier 5 35.7% 93 69.9% ‐34.2%
Most harm event: 50 Overturn/rollover 6 42.9% 27 20.3% 22.6%
First harmful event: 48 Hit other fixed object 10 1.8% 185 5.7% ‐3.9%
Most harm event: 25 Hit guide rail 2 20.0% 0 0.0% 20.0%
Most harm event: 26 Hit guide rail end 1 10.0% 0 0.0% 10.0%
Most harm event: 48 Hit other fixed object 1 10.0% 111 60.0% ‐50.0%
First harmful event: 58 Other non‐collision 18 3.3% 0 0.0% 3.3%
Most harm event: 25 Hit guide rail 8 44.4% 0 0.0% 44.4%
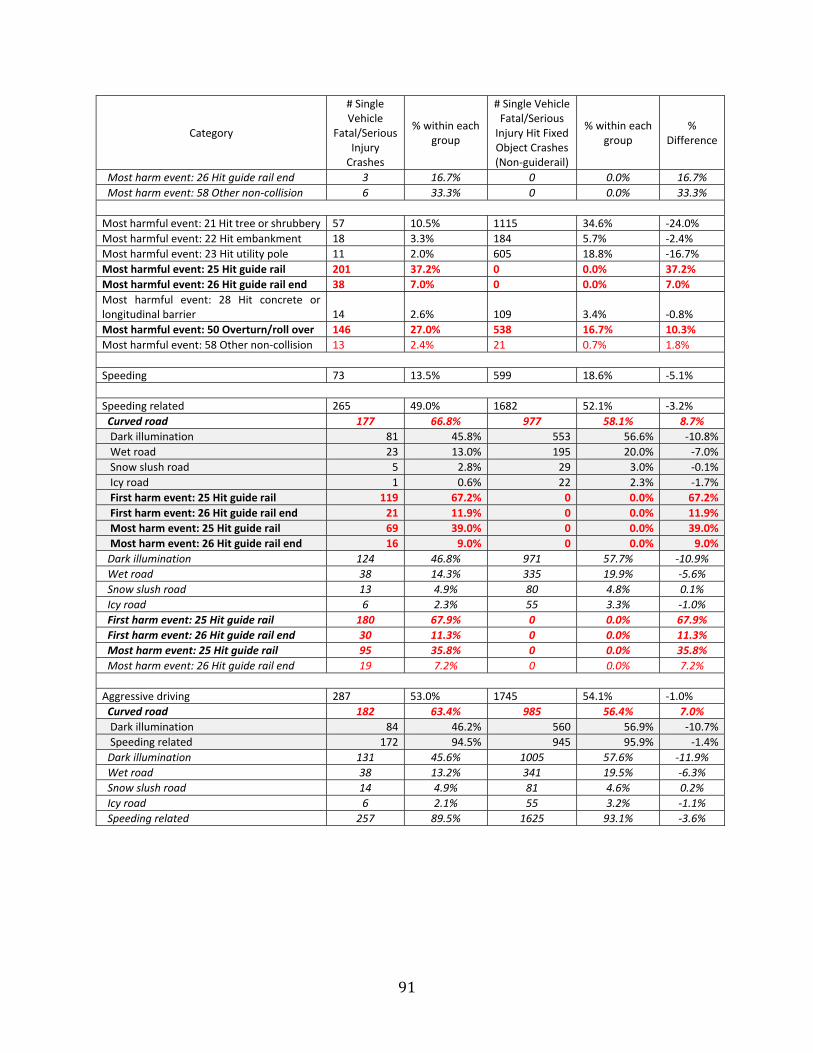
91
Category
# Single Vehicle
Fatal/Serious Injury Crashes
% within each group
# Single Vehicle Fatal/Serious Injury Hit Fixed Object Crashes (Non‐guiderail)
% within each group
% Difference
Most harm event: 26 Hit guide rail end 3 16.7% 0 0.0% 16.7%
Most harm event: 58 Other non‐collision 6 33.3% 0 0.0% 33.3%
Most harmful event: 21 Hit tree or shrubbery 57 10.5% 1115 34.6% ‐24.0%
Most harmful event: 22 Hit embankment 18 3.3% 184 5.7% ‐2.4%
Most harmful event: 23 Hit utility pole 11 2.0% 605 18.8% ‐16.7%
Most harmful event: 25 Hit guide rail 201 37.2% 0 0.0% 37.2%
Most harmful event: 26 Hit guide rail end 38 7.0% 0 0.0% 7.0%
Most harmful event: 28 Hit concrete or longitudinal barrier 14 2.6% 109 3.4% ‐0.8%
Most harmful event: 50 Overturn/roll over 146 27.0% 538 16.7% 10.3%
Most harmful event: 58 Other non‐collision 13 2.4% 21 0.7% 1.8%
Speeding 73 13.5% 599 18.6% ‐5.1%
Speeding related 265 49.0% 1682 52.1% ‐3.2%
Curved road 177 66.8% 977 58.1% 8.7%
Dark illumination 81 45.8% 553 56.6% ‐10.8%
Wet road 23 13.0% 195 20.0% ‐7.0%
Snow slush road 5 2.8% 29 3.0% ‐0.1%
Icy road 1 0.6% 22 2.3% ‐1.7%
First harm event: 25 Hit guide rail 119 67.2% 0 0.0% 67.2%
First harm event: 26 Hit guide rail end 21 11.9% 0 0.0% 11.9%
Most harm event: 25 Hit guide rail 69 39.0% 0 0.0% 39.0%
Most harm event: 26 Hit guide rail end 16 9.0% 0 0.0% 9.0%
Dark illumination 124 46.8% 971 57.7% ‐10.9%
Wet road 38 14.3% 335 19.9% ‐5.6%
Snow slush road 13 4.9% 80 4.8% 0.1%
Icy road 6 2.3% 55 3.3% ‐1.0%
First harm event: 25 Hit guide rail 180 67.9% 0 0.0% 67.9%
First harm event: 26 Hit guide rail end 30 11.3% 0 0.0% 11.3%
Most harm event: 25 Hit guide rail 95 35.8% 0 0.0% 35.8%
Most harm event: 26 Hit guide rail end 19 7.2% 0 0.0% 7.2%
Aggressive driving 287 53.0% 1745 54.1% ‐1.0%
Curved road 182 63.4% 985 56.4% 7.0%
Dark illumination 84 46.2% 560 56.9% ‐10.7%
Speeding related 172 94.5% 945 95.9% ‐1.4%
Dark illumination 131 45.6% 1005 57.6% ‐11.9%
Wet road 38 13.2% 341 19.5% ‐6.3%
Snow slush road 14 4.9% 81 4.6% 0.2%
Icy road 6 2.1% 55 3.2% ‐1.1%
Speeding related 257 89.5% 1625 93.1% ‐3.6%
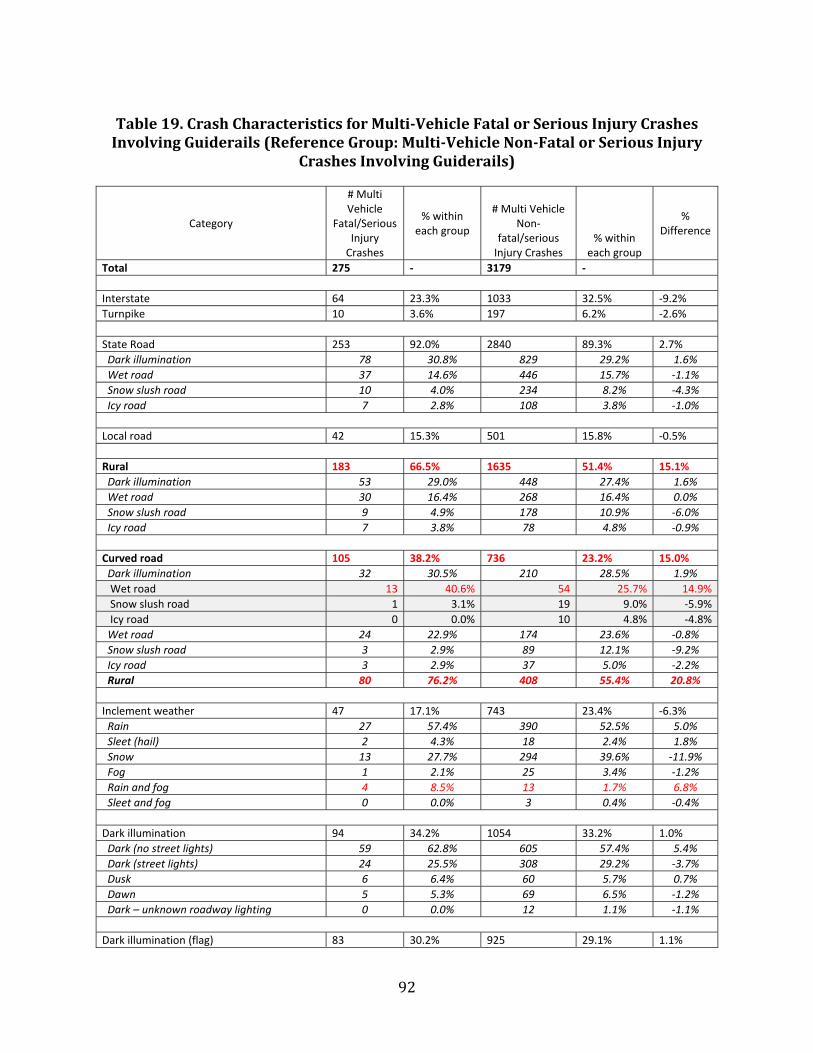
92
Table19.CrashCharacteristicsforMulti‐VehicleFatalorSeriousInjuryCrashesInvolvingGuiderails(ReferenceGroup:Multi‐VehicleNon‐FatalorSeriousInjury
CrashesInvolvingGuiderails)
Category
# Multi Vehicle
Fatal/Serious Injury Crashes
% within each group
# Multi Vehicle Non‐
fatal/serious Injury Crashes
% within each group
% Difference
Total 275 ‐ 3179 ‐
Interstate 64 23.3% 1033 32.5% ‐9.2%
Turnpike 10 3.6% 197 6.2% ‐2.6%
State Road 253 92.0% 2840 89.3% 2.7%
Dark illumination 78 30.8% 829 29.2% 1.6%
Wet road 37 14.6% 446 15.7% ‐1.1%
Snow slush road 10 4.0% 234 8.2% ‐4.3%
Icy road 7 2.8% 108 3.8% ‐1.0%
Local road 42 15.3% 501 15.8% ‐0.5%
Rural 183 66.5% 1635 51.4% 15.1%
Dark illumination 53 29.0% 448 27.4% 1.6%
Wet road 30 16.4% 268 16.4% 0.0%
Snow slush road 9 4.9% 178 10.9% ‐6.0%
Icy road 7 3.8% 78 4.8% ‐0.9%
Curved road 105 38.2% 736 23.2% 15.0%
Dark illumination 32 30.5% 210 28.5% 1.9%
Wet road 13 40.6% 54 25.7% 14.9%
Snow slush road 1 3.1% 19 9.0% ‐5.9%
Icy road 0 0.0% 10 4.8% ‐4.8%
Wet road 24 22.9% 174 23.6% ‐0.8%
Snow slush road 3 2.9% 89 12.1% ‐9.2%
Icy road 3 2.9% 37 5.0% ‐2.2%
Rural 80 76.2% 408 55.4% 20.8%
Inclement weather 47 17.1% 743 23.4% ‐6.3%
Rain 27 57.4% 390 52.5% 5.0%
Sleet (hail) 2 4.3% 18 2.4% 1.8%
Snow 13 27.7% 294 39.6% ‐11.9%
Fog 1 2.1% 25 3.4% ‐1.2%
Rain and fog 4 8.5% 13 1.7% 6.8%
Sleet and fog 0 0.0% 3 0.4% ‐0.4%
Dark illumination 94 34.2% 1054 33.2% 1.0%
Dark (no street lights) 59 62.8% 605 57.4% 5.4%
Dark (street lights) 24 25.5% 308 29.2% ‐3.7%
Dusk 6 6.4% 60 5.7% 0.7%
Dawn 5 5.3% 69 6.5% ‐1.2%
Dark – unknown roadway lighting 0 0.0% 12 1.1% ‐1.1%
Dark illumination (flag) 83 30.2% 925 29.1% 1.1%
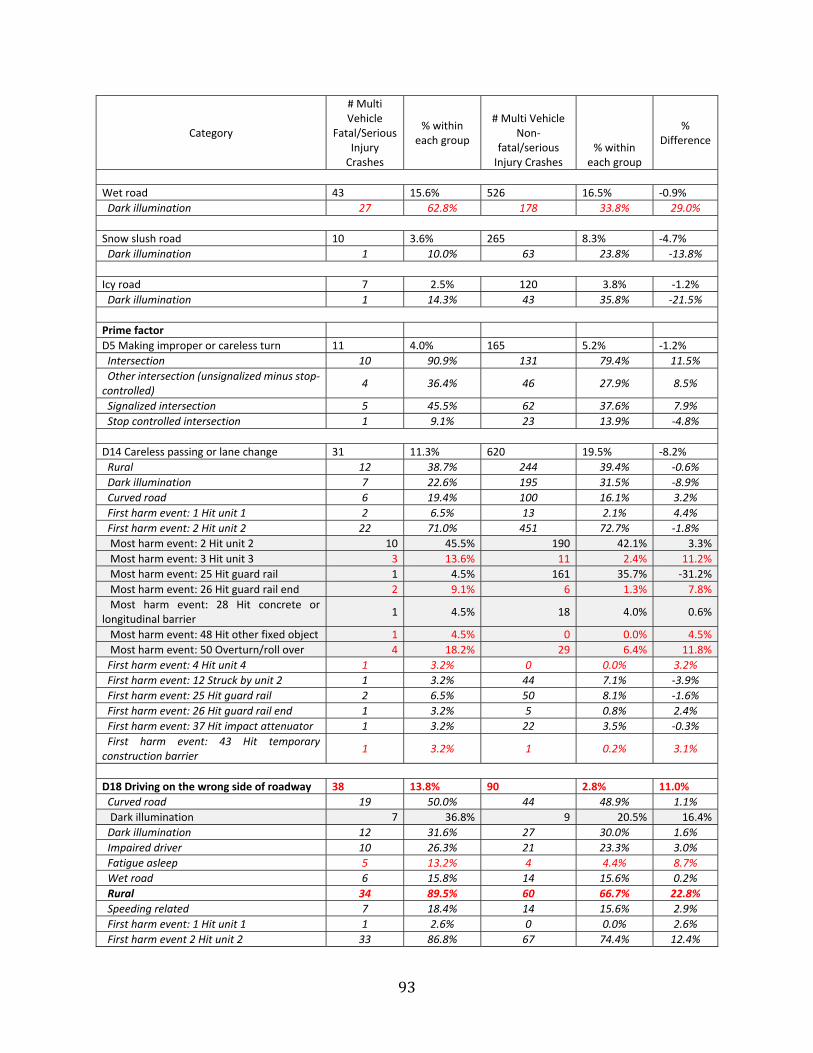
93
Category
# Multi Vehicle
Fatal/Serious Injury Crashes
% within each group
# Multi Vehicle Non‐
fatal/serious Injury Crashes
% within each group
% Difference
Wet road 43 15.6% 526 16.5% ‐0.9%
Dark illumination 27 62.8% 178 33.8% 29.0%
Snow slush road 10 3.6% 265 8.3% ‐4.7%
Dark illumination 1 10.0% 63 23.8% ‐13.8%
Icy road 7 2.5% 120 3.8% ‐1.2%
Dark illumination 1 14.3% 43 35.8% ‐21.5%
Prime factor
D5 Making improper or careless turn 11 4.0% 165 5.2% ‐1.2%
Intersection 10 90.9% 131 79.4% 11.5%
Other intersection (unsignalized minus stop‐controlled)
4 36.4% 46 27.9% 8.5%
Signalized intersection 5 45.5% 62 37.6% 7.9%
Stop controlled intersection 1 9.1% 23 13.9% ‐4.8%
D14 Careless passing or lane change 31 11.3% 620 19.5% ‐8.2%
Rural 12 38.7% 244 39.4% ‐0.6%
Dark illumination 7 22.6% 195 31.5% ‐8.9%
Curved road 6 19.4% 100 16.1% 3.2%
First harm event: 1 Hit unit 1 2 6.5% 13 2.1% 4.4%
First harm event: 2 Hit unit 2 22 71.0% 451 72.7% ‐1.8%
Most harm event: 2 Hit unit 2 10 45.5% 190 42.1% 3.3%
Most harm event: 3 Hit unit 3 3 13.6% 11 2.4% 11.2%
Most harm event: 25 Hit guard rail 1 4.5% 161 35.7% ‐31.2%
Most harm event: 26 Hit guard rail end 2 9.1% 6 1.3% 7.8%
Most harm event: 28 Hit concrete or longitudinal barrier
1 4.5% 18 4.0% 0.6%
Most harm event: 48 Hit other fixed object 1 4.5% 0 0.0% 4.5%
Most harm event: 50 Overturn/roll over 4 18.2% 29 6.4% 11.8%
First harm event: 4 Hit unit 4 1 3.2% 0 0.0% 3.2%
First harm event: 12 Struck by unit 2 1 3.2% 44 7.1% ‐3.9%
First harm event: 25 Hit guard rail 2 6.5% 50 8.1% ‐1.6%
First harm event: 26 Hit guard rail end 1 3.2% 5 0.8% 2.4%
First harm event: 37 Hit impact attenuator 1 3.2% 22 3.5% ‐0.3%
First harm event: 43 Hit temporary construction barrier
1 3.2% 1 0.2% 3.1%
D18 Driving on the wrong side of roadway 38 13.8% 90 2.8% 11.0%
Curved road 19 50.0% 44 48.9% 1.1%
Dark illumination 7 36.8% 9 20.5% 16.4%
Dark illumination 12 31.6% 27 30.0% 1.6%
Impaired driver 10 26.3% 21 23.3% 3.0%
Fatigue asleep 5 13.2% 4 4.4% 8.7%
Wet road 6 15.8% 14 15.6% 0.2%
Rural 34 89.5% 60 66.7% 22.8%
Speeding related 7 18.4% 14 15.6% 2.9%
First harm event: 1 Hit unit 1 1 2.6% 0 0.0% 2.6%
First harm event 2 Hit unit 2 33 86.8% 67 74.4% 12.4%
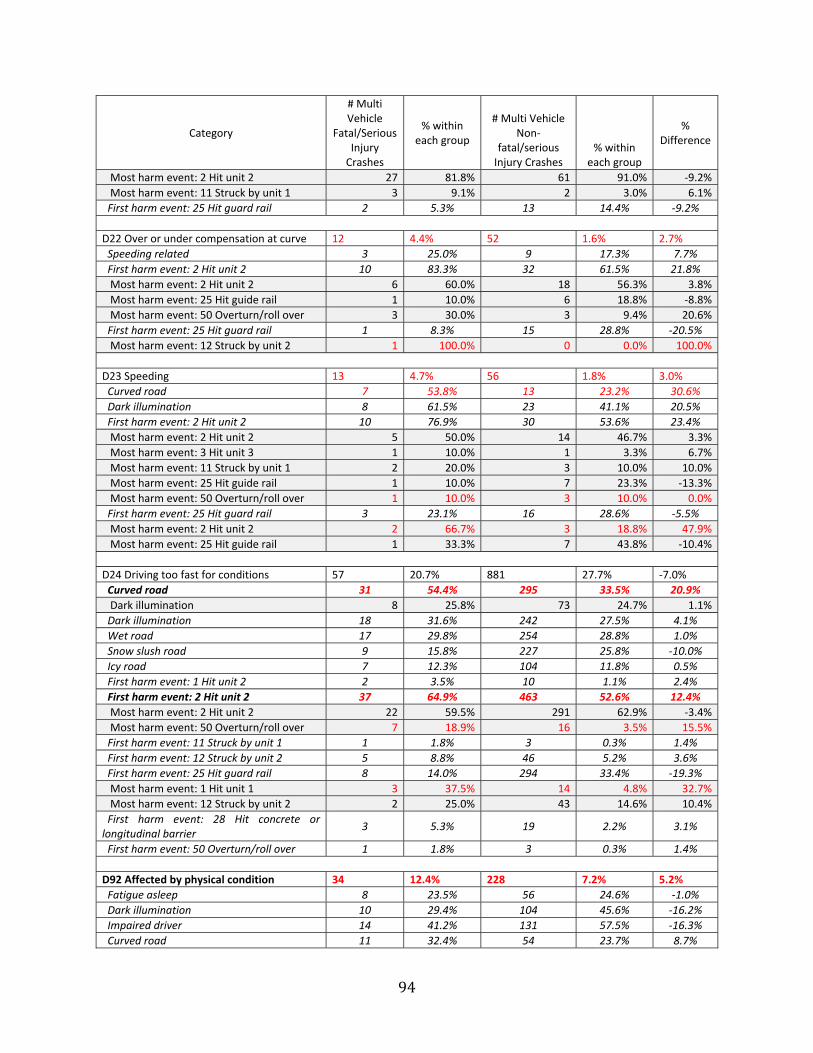
94
Category
# Multi Vehicle
Fatal/Serious Injury Crashes
% within each group
# Multi Vehicle Non‐
fatal/serious Injury Crashes
% within each group
% Difference
Most harm event: 2 Hit unit 2 27 81.8% 61 91.0% ‐9.2%
Most harm event: 11 Struck by unit 1 3 9.1% 2 3.0% 6.1%
First harm event: 25 Hit guard rail 2 5.3% 13 14.4% ‐9.2%
D22 Over or under compensation at curve 12 4.4% 52 1.6% 2.7%
Speeding related 3 25.0% 9 17.3% 7.7%
First harm event: 2 Hit unit 2 10 83.3% 32 61.5% 21.8%
Most harm event: 2 Hit unit 2 6 60.0% 18 56.3% 3.8%
Most harm event: 25 Hit guide rail 1 10.0% 6 18.8% ‐8.8%
Most harm event: 50 Overturn/roll over 3 30.0% 3 9.4% 20.6%
First harm event: 25 Hit guard rail 1 8.3% 15 28.8% ‐20.5%
Most harm event: 12 Struck by unit 2 1 100.0% 0 0.0% 100.0%
D23 Speeding 13 4.7% 56 1.8% 3.0%
Curved road 7 53.8% 13 23.2% 30.6%
Dark illumination 8 61.5% 23 41.1% 20.5%
First harm event: 2 Hit unit 2 10 76.9% 30 53.6% 23.4%
Most harm event: 2 Hit unit 2 5 50.0% 14 46.7% 3.3%
Most harm event: 3 Hit unit 3 1 10.0% 1 3.3% 6.7%
Most harm event: 11 Struck by unit 1 2 20.0% 3 10.0% 10.0%
Most harm event: 25 Hit guide rail 1 10.0% 7 23.3% ‐13.3%
Most harm event: 50 Overturn/roll over 1 10.0% 3 10.0% 0.0%
First harm event: 25 Hit guard rail 3 23.1% 16 28.6% ‐5.5%
Most harm event: 2 Hit unit 2 2 66.7% 3 18.8% 47.9%
Most harm event: 25 Hit guide rail 1 33.3% 7 43.8% ‐10.4%
D24 Driving too fast for conditions 57 20.7% 881 27.7% ‐7.0%
Curved road 31 54.4% 295 33.5% 20.9%
Dark illumination 8 25.8% 73 24.7% 1.1%
Dark illumination 18 31.6% 242 27.5% 4.1%
Wet road 17 29.8% 254 28.8% 1.0%
Snow slush road 9 15.8% 227 25.8% ‐10.0%
Icy road 7 12.3% 104 11.8% 0.5%
First harm event: 1 Hit unit 2 2 3.5% 10 1.1% 2.4%
First harm event: 2 Hit unit 2 37 64.9% 463 52.6% 12.4%
Most harm event: 2 Hit unit 2 22 59.5% 291 62.9% ‐3.4%
Most harm event: 50 Overturn/roll over 7 18.9% 16 3.5% 15.5%
First harm event: 11 Struck by unit 1 1 1.8% 3 0.3% 1.4%
First harm event: 12 Struck by unit 2 5 8.8% 46 5.2% 3.6%
First harm event: 25 Hit guard rail 8 14.0% 294 33.4% ‐19.3%
Most harm event: 1 Hit unit 1 3 37.5% 14 4.8% 32.7%
Most harm event: 12 Struck by unit 2 2 25.0% 43 14.6% 10.4%
First harm event: 28 Hit concrete or longitudinal barrier
3 5.3% 19 2.2% 3.1%
First harm event: 50 Overturn/roll over 1 1.8% 3 0.3% 1.4%
D92 Affected by physical condition 34 12.4% 228 7.2% 5.2%
Fatigue asleep 8 23.5% 56 24.6% ‐1.0%
Dark illumination 10 29.4% 104 45.6% ‐16.2%
Impaired driver 14 41.2% 131 57.5% ‐16.3%
Curved road 11 32.4% 54 23.7% 8.7%

95
Category
# Multi Vehicle
Fatal/Serious Injury Crashes
% within each group
# Multi Vehicle Non‐
fatal/serious Injury Crashes
% within each group
% Difference
First harm event: 2 Hit unit 2 20 58.8% 143 62.7% ‐3.9%
Most harm event: 2 Hit unit 2 13 65.0% 88 61.5% 3.5%
Most harm event: 3 Hit unit 3 2 10.0% 4 2.8% 7.2%
Most harm event: 11 Struck by unit 1 2 10.0% 4 2.8% 7.2%
First harm event: 25 Hit guard rail 7 20.6% 52 22.8% ‐2.2%
Most harm event: 2 Hit unit 2 3 42.9% 17 32.7% 10.2%
Most harm event: 25 Hit guide rail 1 14.3% 21 40.4% ‐26.1%
Most harm event: 50 Overturn/roll over 2 28.6% 1 1.9% 26.6%
D98 Other improper driving actions 21 7.6% 262 8.2% ‐0.6%
Curved road 5 23.8% 48 18.3% 5.5%
First harm event: 2 Hit unit 2 14 66.7% 160 61.1% 5.6%
Most harm event: 2 Hit unit 2 9 64.3% 88 55.0% 9.3%
Most harm event: 25 Hit guide rail 2 14.3% 49 30.6% ‐16.3%
First harm event: 25 Hit guard rail 4 19.0% 50 19.1% 0.0%
Most harm event: 1 Hit unit 1 1 25.0% 1 2.0% 23.0%
Most harm event: 2 Hit unit 2 0 0.0% 16 32.0% ‐32.0%
Most harm event: 3 Hit unit 3 1 25.0% 0 0.0% 25.0%
Most harm event: 12 Struck by unit 2 2 50.0% 4 8.0% 42.0%
First harm event: 26 Hit guard rail end 1 4.8% 10 3.8% 0.9%
First harmful event: 1 Hit unit 1 14 5.1% 81 2.5% 2.5%
Most harm event: 1 Hit unit 1 10 71.4% 62 76.5% ‐5.1%
Most harm event: 12 Struck by unit 2 3 21.4% 5 6.2% 15.3%
Most harm event: 50 Overturn/rollover 1 7.1% 2 2.5% 4.7%
First harmful event: 2 Hit unit 2 182 66.2% 1948 61.3% 4.9%
Most harm event: 2 Hit unit 2 123 67.6% 1154 59.2% 8.3%
Most harm event: 3 Hit unit 3 12 6.6% 34 1.7% 4.8%
Most harm event: 11 Struck by unit 1 9 4.9% 99 5.1% ‐0.1%
Most harm event: 21 Hit tree or shrubbery 3 1.6% 10 0.5% 1.1%
Most harm event: 25 Hit guide rail 7 3.8% 448 23.0% ‐19.2%
Most harm event: 26 Hit guide rail end 3 1.6% 32 1.6% 0.0%
Most harm event: 50 Overturn/rollover 19 10.4% 75 3.9% 6.6%
First harmful event: 12 Struck by unit 2 23 8.4% 303 9.5% ‐1.2%
Most harm event: 1 Hit unit 1 2 8.7% 26 8.6% 0.1%
Most harm event: 12 Struck by unit 2 19 82.6% 223 73.6% 9.0%
Most harm event: 25 Hit guide rail 1 4.3% 37 12.2% ‐7.9%
First harmful event: 25 Hit guide rail 32 11.6% 568 17.9% ‐6.2%
Most harm event: 1 Hit unit 1 4 12.5% 24 4.2% 8.3%
Most harm event: 2 Hit unit 2 12 37.5% 178 31.3% 6.2%
Most harm event: 3 Hit unit 3 2 6.3% 4 0.7% 5.5%
Most harm event: 12 Struck by unit 2 6 18.8% 53 9.3% 9.4%
Most harm event: 25 Hit guide rail 4 12.5% 211 37.1% ‐24.6%
First harmful event: 26 Hit guide rail end 3 1.1% 43 1.4% ‐0.3%
Most harm event: 11 Struck by unit 1 1 33.3% 1 2.3% 31.0%
Most harm event: 12 Struck by unit 2 2 66.7% 3 7.0% 59.7%
Most harmful event: 1 Hit unit 1 18 6.5% 129 4.1% 2.5%
Most harmful event: 2 Hit unit 2 141 51.3% 1379 43.4% 7.9%
Most harmful event: 3 Hit unit 3 14 5.1% 50 1.6% 3.5%
Most harmful event: 11 Struck by unit 1 10 3.6% 140 4.4% ‐0.8%

96
Category
# Multi Vehicle
Fatal/Serious Injury Crashes
% within each group
# Multi Vehicle Non‐
fatal/serious Injury Crashes
% within each group
% Difference
Most harmful event: 12 Struck by unit 2 32 11.6% 290 9.1% 2.5%
Most harmful event: 25 Hit guide rail 13 4.7% 766 24.1% ‐19.4%
Most harmful event: 26 Hit guide rail end 4 1.5% 63 2.0% ‐0.5%
Most harmful event: 50 Overturn/roll over 26 9.5% 120 3.8% 5.7%
Speeding 29 10.5% 168 5.3% 5.3%
Speeding related 116 42.2% 1217 38.3% 3.9%
Curved road 55 47.4% 377 31.0% 16.4%
Dark illumination 20 36.4% 103 27.3% 9.0%
Wet road 15 27.3% 119 31.6% ‐4.3%
Snow slush road 3 5.5% 82 21.8% ‐16.3%
Icy road 3 5.5% 36 9.5% ‐4.1%
First harm event: 25 Hit guide rail 13 23.6% 139 36.9% ‐13.2%
Most harm event: 25 Hit guide rail 3 5.5% 91 24.1% ‐18.7%
Dark illumination 44 37.9% 370 30.4% 7.5%
Wet road 24 20.7% 292 24.0% ‐3.3%
Snow slush road 9 7.8% 235 19.3% ‐11.6%
Icy road 7 6.0% 110 9.0% ‐3.0%
First harm event: 25 Hit guide rail 17 14.7% 358 29.4% ‐14.8%
Most harm event: 25 Hit guide rail 6 5.2% 310 25.5% ‐20.3%
Most harm event: 26 Hit guide rail end 2 1.7% 17 1.4% 0.3%
Aggressive driving 172 62.5% 2368 74.5% ‐11.9%
Curved road 61 35.5% 530 22.4% 13.1%
Dark illumination 20 32.8% 145 27.4% 5.4%
Speeding related 51 83.6% 371 70.0% 13.6%
Dark illumination 52 30.2% 656 27.7% 2.5%
Wet road 31 18.0% 431 18.2% ‐0.2%
Snow slush road 10 5.8% 246 10.4% ‐4.6%
Icy road 7 4.1% 117 4.9% ‐0.9%
Speeding related 110 64.0% 1179 49.8% 14.2%
Intersection (flag) 52 18.9% 795 25.0% ‐6.1%
Curved road 11 21.2% 142 17.9% 3.3%
Dark illumination 7 13.5% 172 21.6% ‐8.2%
Stop controlled intersection (flag) 25 48.1% 258 32.5% 15.6%
Signalized intersection (flag) 12 23.1% 200 25.2% ‐2.1%
Other intersection (unsignalized minus stop‐controlled)
15 28.8% 337 42.4% ‐13.5%
Curved road 3 20.0% 88 26.1% ‐6.1%

97
Table20.CrashCharacteristicsforMulti‐VehicleFatalorSeriousInjuryCrashesInvolvingGuiderails(ReferenceGroup:Multi‐VehicleFatalorSeriousInjuryCrashes
InvolvingOtherFixedObjects)
Category
# Multi Vehicle
Fatal/Serious Injury Crashes
% within each group
# Multi Vehicle Fatal/Serious Injury Hit Fixed Object Crashes (Non‐guiderail)
% within each group
% within each group
Total 275 ‐ 174 ‐ ‐
Interstate 64 23.3% 21 12.1% 11.2%
Turnpike 10 3.6% 8 4.6% ‐1.0%
State Road 253 92.0% 127 73.0% 19.0%
Dark illumination 78 30.8% 59 46.5% ‐15.6%
Wet road 37 14.6% 22 17.3% ‐2.7%
Snow slush road 10 4.0% 3 2.4% 1.6%
Icy road 7 2.8% 5 3.9% ‐1.2%
Local road 42 15.3% 52 29.9% ‐14.6%
Rural 183 66.5% 94 54.0% 12.5%
Dark illumination 53 29.0% 47 50.0% ‐21.0%
Wet road 30 16.4% 15 16.0% 0.4%
Snow slush road 9 4.9% 4 4.3% 0.7%
Icy road 7 3.8% 5 5.3% ‐1.5%
Curved road 105 38.2% 61 35.1% 3.1%
Dark illumination 32 30.5% 32 52.5% ‐22.0%
Wet road 13 40.6% 3 9.4% 31.3%
Snow slush road 1 3.1% 1 3.1% 0.0%
Icy road 0 0.0% 0 0.0% 0.0%
Wet road 24 22.9% 9 14.8% 8.1%
Snow slush road 3 2.9% 1 1.6% 1.2%
Icy road 3 2.9% 1 1.6% 1.2%
Rural 80 76.2% 37 60.7% 15.5%
Inclement weather 47 17.1% 30 17.2% ‐0.2%
Rain 27 57.4% 22 73.3% ‐15.9%
Sleet (hail) 2 4.3% 2 6.7% ‐2.4%
Snow 13 27.7% 3 10.0% 17.7%
Fog 1 2.1% 0 0.0% 2.1%
Rain and fog 4 8.5% 3 10.0% ‐1.5%
Sleet and fog 0 0.0% 0 0.0% 0.0%
Dark illumination 94 34.2% 84 48.3% ‐14.1%
Dark (no street lights) 59 62.8% 45 53.6% 9.2%
Dark (street lights) 24 25.5% 33 39.3% ‐13.8%
Dusk 6 6.4% 3 3.6% 2.8%
Dawn 5 5.3% 1 1.2% 4.1%
Dark – unknown roadway lighting 0 0.0% 2 2.4% ‐2.4%
Dark illumination (flag) 83 30.2% 80 46.0% ‐15.8%
Wet road 43 15.6% 30 17.2% ‐1.6%

98
Category
# Multi Vehicle
Fatal/Serious Injury Crashes
% within each group
# Multi Vehicle Fatal/Serious Injury Hit Fixed Object Crashes (Non‐guiderail)
% within each group
% within each group
Dark illumination 27 62.8% 13 43.3% 19.5%
Snow slush road 10 3.6% 4 2.3% 1.3%
Dark illumination 1 10.0% 3 75.0% ‐65.0%
Icy road 7 2.5% 6 3.4% ‐0.9%
Dark illumination 1 14.3% 2 33.3% ‐19.0%
Prime factor
D5 Making improper or careless turn 11 4.0% 5 2.9% 1.1%
Intersection 10 90.9% 2 40.0% 50.9%
Other intersection (unsignalized minus stop‐controlled)
4 36.4% 1 20.0% 16.4%
Signalized intersection 5 45.5% 0 0.0% 45.5%
Stop controlled intersection 1 9.1% 1 20.0% ‐10.9%
D14 Careless passing or lane change 31 11.3% 9 5.2% 6.1%
Rural 12 38.7% 7 77.8% ‐39.1%
Dark illumination 7 22.6% 4 44.4% ‐21.9%
Curved road 6 19.4% 0 0.0% 19.4%
First harm event: 1 Hit unit 1 2 6.5% 0 0.0% 6.5%
First harm event: 2 Hit unit 2 22 71.0% 0 0.0% 71.0%
Most harm event: 2 Hit unit 2 10 45.5% 0 0.0% 45.5%
Most harm event: 3 Hit unit 3 3 13.6% 0 0.0% 13.6%
Most harm event: 25 Hit guard rail 1 4.5% 0 0.0% 4.5%
Most harm event: 26 Hit guard rail end 2 9.1% 0 0.0% 9.1%
Most harm event: 28 Hit concrete or longitudinal barrier
1 4.5% 0 0.0% 4.5%
Most harm event: 48 Hit other fixed object
1 4.5% 0 0.0% 4.5%
Most harm event: 50 Overturn/roll over 4 18.2% 0 0.0% 18.2%
First harm event: 4 Hit unit 4 1 3.2% 0 0.0% 3.2%
First harm event: 12 Struck by unit 2 1 3.2% 0 0.0% 3.2%
First harm event: 25 Hit guard rail 2 6.5% 0 0.0% 6.5%
First harm event: 26 Hit guard rail end 1 3.2% 0 0.0% 3.2%
First harm event: 37 Hit impact attenuator 1 3.2% 0 0.0% 3.2%
First harm event: 43 Hit temporary construction barrier
1 3.2% 0 0.0% 3.2%
D18 Driving on the wrong side of roadway 38 13.8% 4 2.3% 11.5%
Curved road 19 50.0% 2 50.0% 0.0%
Dark illumination 7 36.8% 2 100.0% ‐63.2%
Dark illumination 12 31.6% 4 100.0% ‐68.4%
Impaired driver 10 26.3% 3 75.0% ‐48.7%
Fatigue asleep 5 13.2% 0 0.0% 13.2%
Wet road 6 15.8% 0 0.0% 15.8%
Rural 34 89.5% 2 50.0% 39.5%
Speeding related 7 18.4% 1 25.0% ‐6.6%
First harm event: 1 Hit unit 1 1 2.6% 0 0.0% 2.6%
First harm event 2 Hit unit 2 33 86.8% 0 0.0% 86.8%
Most harm event: 2 Hit unit 2 27 81.8% 0 0.0% 81.8%
Most harm event: 11 Struck by unit 1 3 9.1% 0 0.0% 9.1%

99
Category
# Multi Vehicle
Fatal/Serious Injury Crashes
% within each group
# Multi Vehicle Fatal/Serious Injury Hit Fixed Object Crashes (Non‐guiderail)
% within each group
% within each group
First harm event: 25 Hit guard rail 2 5.3% 0 0.0% 5.3%
D22 Over or under compensation at curve 12 4.4% 8 4.6% ‐0.2%
Speeding related 3 25.0% 4 50.0% ‐25.0%
First harm event: 2 Hit unit 2 10 83.3% 0 0.0% 83.3%
Most harm event: 2 Hit unit 2 6 60.0% 0 0.0% 60.0%
Most harm event: 25 Hit guide rail 1 10.0% 0 0.0% 10.0%
Most harm event: 50 Overturn/roll over 3 30.0% 0 0.0% 30.0%
First harm event: 25 Hit guard rail 1 8.3% 0 0.0% 8.3%
Most harm event: 12 Struck by unit 2 1 100.0% 0 0.0% 100.0%
D23 Speeding 13 4.7% 18 10.3% ‐5.6%
Curved road 7 53.8% 6 33.3% 20.5%
Dark illumination 8 61.5% 12 66.7% ‐5.1%
First harm event: 2 Hit unit 2 10 76.9% 0 0.0% 76.9%
Most harm event: 2 Hit unit 2 5 50.0% 0 0.0% 50.0%
Most harm event: 3 Hit unit 3 1 10.0% 0 0.0% 10.0%
Most harm event: 11 Struck by unit 1 2 20.0% 0 0.0% 20.0%
Most harm event: 25 Hit guide rail 1 10.0% 0 0.0% 10.0%
Most harm event: 50 Overturn/roll over 1 10.0% 0 0.0% 10.0%
First harm event: 25 Hit guard rail 3 23.1% 0 0.0% 23.1%
Most harm event: 2 Hit unit 2 2 66.7% 0 0.0% 66.7%
Most harm event: 25 Hit guide rail 1 33.3% 0 0.0% 33.3%
D24 Driving too fast for conditions 57 20.7% 39 22.4% ‐1.7%
Curved road 31 54.4% 13 33.3% 21.1%
Dark illumination 8 25.8% 5 38.5% ‐12.7%
Dark illumination 18 31.6% 16 41.0% ‐9.4%
Wet road 17 29.8% 15 38.5% ‐8.6%
Snow slush road 9 15.8% 3 7.7% 8.1%
Icy road 7 12.3% 4 10.3% 2.0%
First harm event: 1 Hit unit 2 2 3.5% 0 0.0% 3.5%
First harm event: 2 Hit unit 2 37 64.9% 0 0.0% 64.9%
Most harm event: 2 Hit unit 2 22 59.5% 0 0.0% 59.5%
Most harm event: 50 Overturn/roll over 7 18.9% 0 0.0% 18.9%
First harm event: 11 Struck by unit 1 1 1.8% 0 0.0% 1.8%
First harm event: 12 Struck by unit 2 5 8.8% 0 0.0% 8.8%
First harm event: 25 Hit guard rail 8 14.0% 0 0.0% 14.0%
Most harm event: 1 Hit unit 1 3 37.5% 0 0.0% 37.5%
Most harm event: 12 Struck by unit 2 2 25.0% 0 0.0% 25.0%
First harm event: 28 Hit concrete or longitudinal barrier
3 5.3% 14 35.9% ‐30.6%
First harm event: 50 Overturn/roll over 1 1.8% 0 0.0% 1.8%
D92 Affected by physical condition 34 12.4% 32 18.4% ‐6.0%
Fatigue asleep 8 23.5% 3 9.4% 14.2%
Dark illumination 10 29.4% 17 53.1% ‐23.7%
Impaired driver 14 41.2% 19 59.4% ‐18.2%
Curved road 11 32.4% 13 40.6% ‐8.3%
First harm event: 2 Hit unit 2 20 58.8% 0 0.0% 58.8%
Most harm event: 2 Hit unit 2 13 65.0% 0 0.0% 65.0%
Most harm event: 3 Hit unit 3 2 10.0% 0 0.0% 10.0%

100
Category
# Multi Vehicle
Fatal/Serious Injury Crashes
% within each group
# Multi Vehicle Fatal/Serious Injury Hit Fixed Object Crashes (Non‐guiderail)
% within each group
% within each group
Most harm event: 11 Struck by unit 1 2 10.0% 0 0.0% 10.0%
First harm event: 25 Hit guard rail 7 20.6% 0 0.0% 20.6%
Most harm event: 2 Hit unit 2 3 42.9% 0 0.0% 42.9%
Most harm event: 25 Hit guide rail 1 14.3% 0 0.0% 14.3%
Most harm event: 50 Overturn/roll over 2 28.6% 0 0.0% 28.6%
D98 Other improper driving actions 21 7.6% 27 15.5% ‐7.9%
Curved road 5 23.8% 4 14.8% 9.0%
First harm event: 2 Hit unit 2 14 66.7% 0 0.0% 66.7%
Most harm event: 2 Hit unit 2 9 64.3% 0 0.0% 64.3%
Most harm event: 25 Hit guide rail 2 14.3% 0 0.0% 14.3%
First harm event: 25 Hit guard rail 4 19.0% 0 0.0% 19.0%
Most harm event: 1 Hit unit 1 1 25.0% 0 0.0% 25.0%
Most harm event: 2 Hit unit 2 0 0.0% 0 0.0% 0.0%
Most harm event: 3 Hit unit 3 1 25.0% 0 0.0% 25.0%
Most harm event: 12 Struck by unit 2 2 50.0% 0 0.0% 50.0%
First harm event: 26 Hit guard rail end 1 4.8% 0 0.0% 4.8%
First harmful event: 1 Hit unit 1 14 5.1% 0 0.0% 5.1%
Most harm event: 1 Hit unit 1 10 71.4% 0 0.0% 71.4%
Most harm event: 12 Struck by unit 2 3 21.4% 0 0.0% 21.4%
Most harm event: 50 Overturn/rollover 1 7.1% 0 0.0% 7.1%
First harmful event: 2 Hit unit 2 182 66.2% 0 0.0% 66.2%
Most harm event: 2 Hit unit 2 123 67.6% 0 0.0% 67.6%
Most harm event: 3 Hit unit 3 12 6.6% 0 0.0% 6.6%
Most harm event: 11 Struck by unit 1 9 4.9% 0 0.0% 4.9%
Most harm event: 21 Hit tree or shrubbery 3 1.6% 0 0.0% 1.6%
Most harm event: 25 Hit guide rail 7 3.8% 0 0.0% 3.8%
Most harm event: 26 Hit guide rail end 3 1.6% 0 0.0% 1.6%
Most harm event: 50 Overturn/rollover 19 10.4% 0 0.0% 10.4%
First harmful event: 12 Struck by unit 2 23 8.4% 0 0.0% 8.4%
Most harm event: 1 Hit unit 1 2 8.7% 0 0.0% 8.7%
Most harm event: 12 Struck by unit 2 19 82.6% 0 0.0% 82.6%
Most harm event: 25 Hit guide rail 1 4.3% 0 0.0% 4.3%
First harmful event: 25 Hit guide rail 32 11.6% 0 0.0% 11.6%
Most harm event: 1 Hit unit 1 4 12.5% 0 0.0% 12.5%
Most harm event: 2 Hit unit 2 12 37.5% 0 0.0% 37.5%
Most harm event: 3 Hit unit 3 2 6.3% 0 0.0% 6.3%
Most harm event: 12 Struck by unit 2 6 18.8% 0 0.0% 18.8%
Most harm event: 25 Hit guide rail 4 12.5% 0 0.0% 12.5%
First harmful event: 26 Hit guide rail end 3 1.1% 0 0.0% 1.1%
Most harm event: 11 Struck by unit 1 1 33.3% 0 0.0% 33.3%
Most harm event: 12 Struck by unit 2 2 66.7% 0 0.0% 66.7%
Most harmful event: 1 Hit unit 1 18 6.5% 3 1.7% 4.8%
Most harmful event: 2 Hit unit 2 141 51.3% 53 30.5% 20.8%
Most harmful event: 3 Hit unit 3 14 5.1% 4 2.3% 2.8%
Most harmful event: 11 Struck by unit 1 10 3.6% 6 3.4% 0.2%
Most harmful event: 12 Struck by unit 2 32 11.6% 14 8.0% 3.6%
Most harmful event: 25 Hit guide rail 13 4.7% 0 0.0% 4.7%
Most harmful event: 26 Hit guide rail end 4 1.5% 0 0.0% 1.5%
Most harmful event: 50 Overturn/roll over 26 9.5% 20 11.5% ‐2.0%
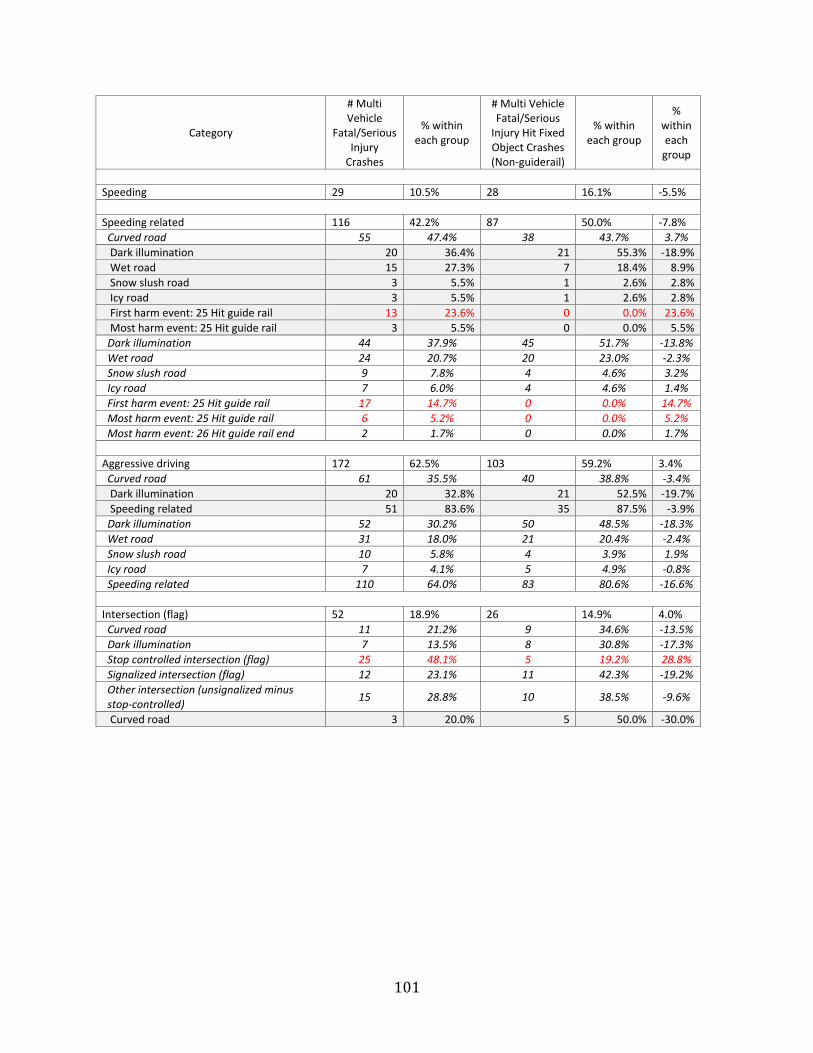
101
Category
# Multi Vehicle
Fatal/Serious Injury Crashes
% within each group
# Multi Vehicle Fatal/Serious Injury Hit Fixed Object Crashes (Non‐guiderail)
% within each group
% within each group
Speeding 29 10.5% 28 16.1% ‐5.5%
Speeding related 116 42.2% 87 50.0% ‐7.8%
Curved road 55 47.4% 38 43.7% 3.7%
Dark illumination 20 36.4% 21 55.3% ‐18.9%
Wet road 15 27.3% 7 18.4% 8.9%
Snow slush road 3 5.5% 1 2.6% 2.8%
Icy road 3 5.5% 1 2.6% 2.8%
First harm event: 25 Hit guide rail 13 23.6% 0 0.0% 23.6%
Most harm event: 25 Hit guide rail 3 5.5% 0 0.0% 5.5%
Dark illumination 44 37.9% 45 51.7% ‐13.8%
Wet road 24 20.7% 20 23.0% ‐2.3%
Snow slush road 9 7.8% 4 4.6% 3.2%
Icy road 7 6.0% 4 4.6% 1.4%
First harm event: 25 Hit guide rail 17 14.7% 0 0.0% 14.7%
Most harm event: 25 Hit guide rail 6 5.2% 0 0.0% 5.2%
Most harm event: 26 Hit guide rail end 2 1.7% 0 0.0% 1.7%
Aggressive driving 172 62.5% 103 59.2% 3.4%
Curved road 61 35.5% 40 38.8% ‐3.4%
Dark illumination 20 32.8% 21 52.5% ‐19.7%
Speeding related 51 83.6% 35 87.5% ‐3.9%
Dark illumination 52 30.2% 50 48.5% ‐18.3%
Wet road 31 18.0% 21 20.4% ‐2.4%
Snow slush road 10 5.8% 4 3.9% 1.9%
Icy road 7 4.1% 5 4.9% ‐0.8%
Speeding related 110 64.0% 83 80.6% ‐16.6%
Intersection (flag) 52 18.9% 26 14.9% 4.0%
Curved road 11 21.2% 9 34.6% ‐13.5%
Dark illumination 7 13.5% 8 30.8% ‐17.3%
Stop controlled intersection (flag) 25 48.1% 5 19.2% 28.8%
Signalized intersection (flag) 12 23.1% 11 42.3% ‐19.2%
Other intersection (unsignalized minus stop‐controlled)
15 28.8% 10 38.5% ‐9.6%
Curved road 3 20.0% 5 50.0% ‐30.0%

102
APPENDIX G
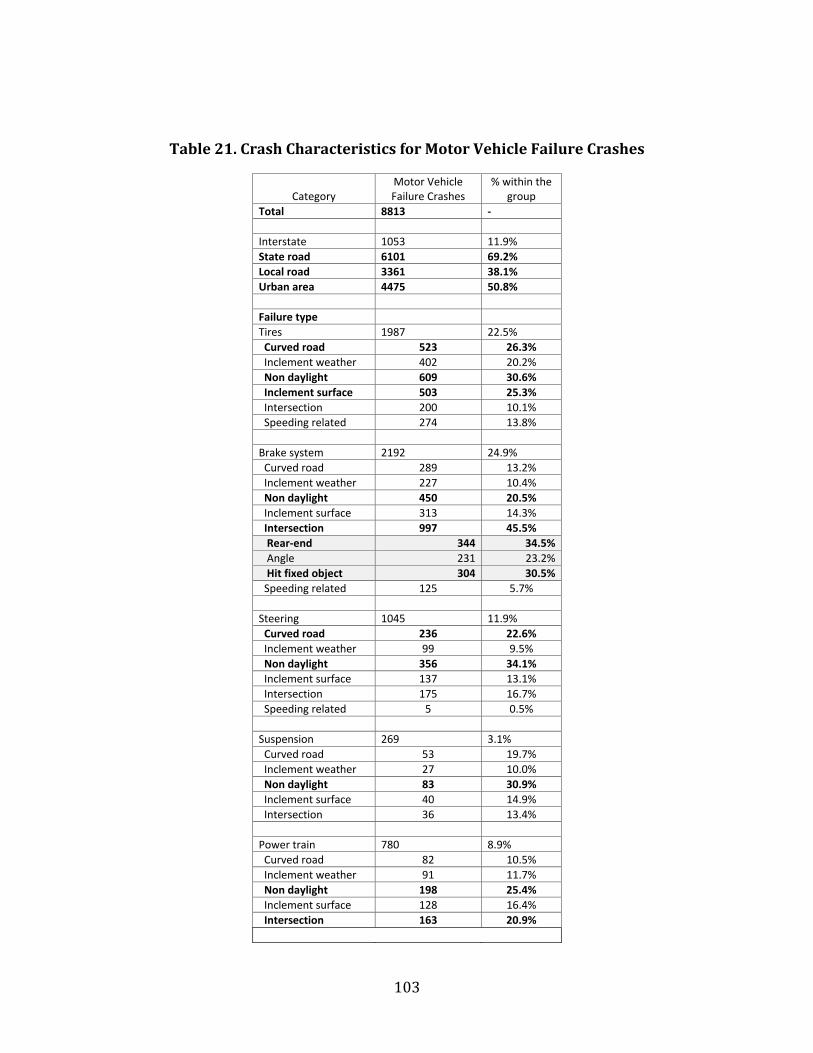
103
Table21.CrashCharacteristicsforMotorVehicleFailureCrashes
Category Motor Vehicle Failure Crashes
% within the group
Total 8813 ‐
Interstate 1053 11.9%
State road 6101 69.2%
Local road 3361 38.1%
Urban area 4475 50.8%
Failure type
Tires 1987 22.5%
Curved road 523 26.3%
Inclement weather 402 20.2%
Non daylight 609 30.6%
Inclement surface 503 25.3%
Intersection 200 10.1%
Speeding related 274 13.8%
Brake system 2192 24.9%
Curved road 289 13.2%
Inclement weather 227 10.4%
Non daylight 450 20.5%
Inclement surface 313 14.3%
Intersection 997 45.5%
Rear‐end 344 34.5%
Angle 231 23.2%
Hit fixed object 304 30.5%
Speeding related 125 5.7%
Steering 1045 11.9%
Curved road 236 22.6%
Inclement weather 99 9.5%
Non daylight 356 34.1%
Inclement surface 137 13.1%
Intersection 175 16.7%
Speeding related 5 0.5%
Suspension 269 3.1%
Curved road 53 19.7%
Inclement weather 27 10.0%
Non daylight 83 30.9%
Inclement surface 40 14.9%
Intersection 36 13.4%
Power train 780 8.9%
Curved road 82 10.5%
Inclement weather 91 11.7%
Non daylight 198 25.4%
Inclement surface 128 16.4%
Intersection 163 20.9%

104
Category Motor Vehicle Failure Crashes
% within the group
Wheels 791 9.0%
Curved road 132 16.7%
Inclement weather 84 10.6%
Non daylight 246 31.1%
Inclement surface 104 13.1%
Intersection 118 14.9%