Embed Size (px)
Citation preview

Fall 2015 Provost Meeting August 14, 2015

Academic Dashboard USC Columbia Update

Dashboard Metrics 1. Total Undergraduate Enrollment (Headcount) First-Time, Full-Time Freshman Enrollment 2. SAT Score 3. Freshman-Sophomore Retention Rate
4. 6-Year Graduation Rate
5. Student-to-Faculty Ratio Student-to-Tenure-and-Tenure-Track-Faculty Ratio 6. Research Expenditures Research Expenditures per Tenure-and-Tenure-Track Faculty 7. Faculty Productivity Index
8. Doctoral Degrees Produced
3

Comparison Groups
• Peer group – Rutgers University – University of Connecticut – University of Georgia – University of Kentucky – University of Tennessee
• Peer-aspirant group – Indiana University – University of Maryland – University of Missouri – University of North Carolina – University of Virginia
4

Total UG Enrollment*
6
* USC data point for 2015 is an early estimate.
20000
21000
22000
23000
24000
25000
26000
2009 2010 2011 2012 2013 2014 2015
Tota
l Und
ergr
adua
te E
nrol
lmen
t
Year
USC Columbia
USC Target
Peers
Aspirants

Total UG Enrollment (2015 estimated)
7
Actual (25,000 estimated) versus target (25,156) • Negligible difference versus target • Increasing freshman and transfer admits • Improved retention • Rapidly changing market (e.g., students apply to
more colleges; yields across institutions shrinking)

First-time, Full-time Freshmen*
9
* USC data point for 2015 is an early estimate.
3500
4000
4500
5000
5500
2009 2010 2011 2012 2013 2014 2015
Num
ber E
nrol
led
Year
USC Columbia
USC Target
Peers
Aspirants

First-time, Full-time Freshmen (2015 estimated)
10
Actual (5,200 estimated) versus target (4,469) • Enables overall undergraduate enrollment to meet
target • Drivers:
o Continued focus on in-state talent o Regional admissions representatives o Improved efficiency of admissions
• Need for more need- and merit-based aid

SAT Score*
12 * USC data point for 2015 is an early estimate.
1150
1200
1250
1300
2009 2010 2011 2012 2013 2014 2015
SAT
Scor
es
Year
USC Columbia
USC Target
Peers
Aspirants

SAT Score (2015 estimated)
13
Actual (1209 estimated) versus target (1227) Factors: • In-state versus out-of-state applicants • More need- and merit-based aid needed to improve
recruitment of top students • ACT now the national test of choice
• Est. ACT Fall 2015 = 27.3 (versus 25.4 for Fall 2007) • Unofficial conversion: SAT score 1232

Freshman-Sophomore Retention Rate
15
85
86
87
88
89
90
91
92
93
94
95
2009 2010 2011 2012 2013 2014 2015
Rete
ntio
n Ra
te
Year
USC Columbia
USC Target
Peers
Aspirants

Freshman-Sophomore Retention Rate (2014)
16
Actual (88%) versus target (89.1%) • Remarkable, positive change over time • Drivers:
o University 101 o Student Success Center o Expanded Orientation
• New tactics: o Predictive analytics o University Advising Center

6-Year Graduation Rate
18
65
70
75
80
85
2003 2004 2005 2006 2007 2008 2009
Gra
duat
ion
Rate
Cohort
USC Columbia
USC Target
Peers
Aspirants
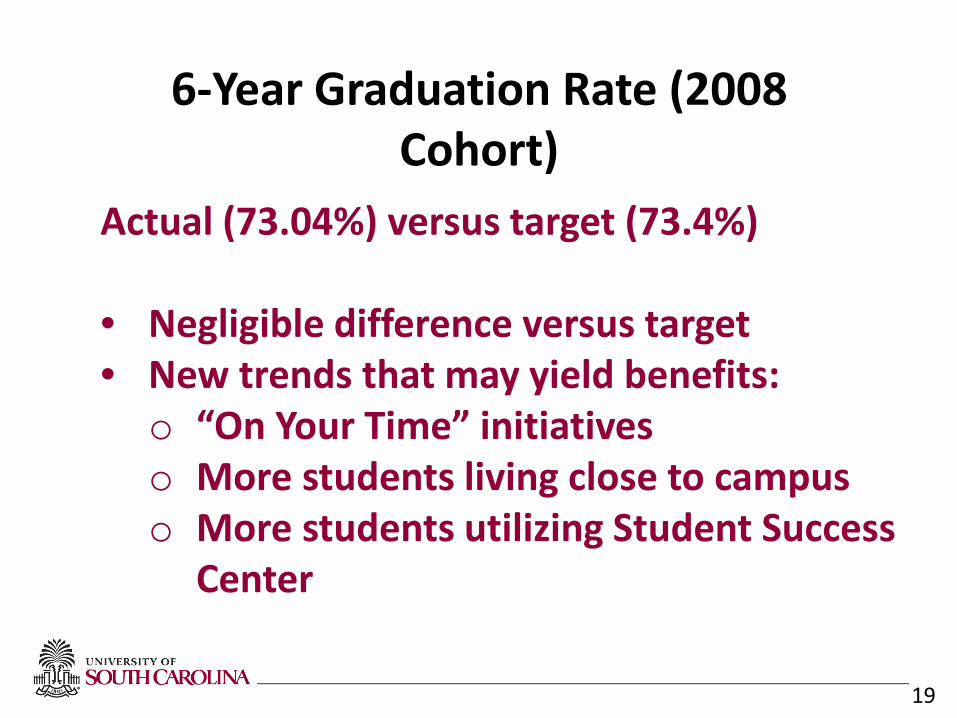
6-Year Graduation Rate (2008 Cohort)
19
Actual (73.04%) versus target (73.4%) • Negligible difference versus target • New trends that may yield benefits: o “On Your Time” initiatives o More students living close to campus o More students utilizing Student Success
Center

Student-to-Faculty Ratio
21
16
17
18
19
20
2009 2010 2011 2012 2013 2014 2015
Stud
ent t
o Fa
culty
Rat
io
Year
USC Columbia
USC Target
Peers
Aspirants

Student-to-Faculty Ratio (2014)
22
Actual (18) versus target (18) • Reversing the vector of change: o Hire aggressively to match enrollment
growth o Target in-demand disciplines o Assess salary bases o Assess start-up packages for research

Student-to-TTT Faculty Ratio
24
18
20
22
24
26
28
30
2009 2010 2011 2012 2013 2014 2015
FTE/
TTT
Rat
io
Fall Semester
USC Columbia
USC Target
Peers
Aspirants

Research Expenditures
25
0
50
100
150
200
250
300
350
400
450
500
2010 2011 2012 2013 2014
Mill
ions
of D
olla
rs
Fiscal Year
USC
USC Target
Peers
Aspirants

Research Expenditures (2013 Fiscal Year)
26
Actual ($203.4M) versus target ($220.7M) • Fluctuations around target trajectory • Improvements since 2005 ($130M, according to
NSF data) • Continued activity:
o Hiring and training o Pursuing grant opportunities o Focusing on areas of strength

Research Expenditures per TTT Faculty
27
0
50
100
150
200
250
300
350
400
2010 2011 2012 2013 2014
Thou
sand
s of D
olla
rs
Fiscal Year
USC
USC Target
Peers
Aspirants

Doctoral Degrees
30
200
250
300
350
400
450
500
550
2009 2010 2011 2012 2013 2014 2015
Doco
trat
es A
war
ded
Year
USC Columbia
USC Targets
Peers
Aspirants

Doctoral Degrees (2014)
31
Actual (325) versus target (292) • Tactics that enabled growth: o Presidential Doctoral Fellows o Provost Teaching Fellows o Graduate Student Research and Travel
Grants o Dissertation Defense Incentives

THANK YOU!


What and Why? What is the EAB Student Success Collaborative?
Technology, Research, Predictive Analytics, and Process Improvement to positively impact academically at-risk and off-path students at USC
Why Are We Engaged in this Effort?
To provide early information to students at risk of not succeeding in their majors
To identify and alter policies, procedures, and processes that do not support student success

So Why Are We REALLY Doing This?
Our retention and graduation rates can only improve by targeted efforts
We can’t afford to blanket all students with the same outreach, resources, etc. Plates are full, dollars are limited, every student doesn’t need identical support

So Why Are We REALLY Doing This?
If we have data that could assist students in timely degree completion, we have an obligation to act on it Resident cost of attendance approx. $27,000 Non-resident approx. $46,000
It’s the expectation – we are measured by outputs
Timely graduation, average student debt, cohort default rates, employability

29
From Insight to Action Two Major Deliverables
• Leverage data about: • Critical courses and timing • Programmatic trends • Patterns of student transitions
• Pinpoint areas of opportunity
Institution Reports Identifies Opportunities
Advising Platform Creates Vehicle for Action
• Proactively identify at-risk students • Compare individual student performance to peers • Access major guidance and career data
Administrators and Deans Advisors and Advising Directors

Two Primary Tools
Institutional Reports (previously predictive workbooks)
Historical student data Determine patterns in degree completion
Key/milestone courses (aka Success Markers) Course timing Course performance Transitions of students between majors/colleges University/college/dept level analysis
31
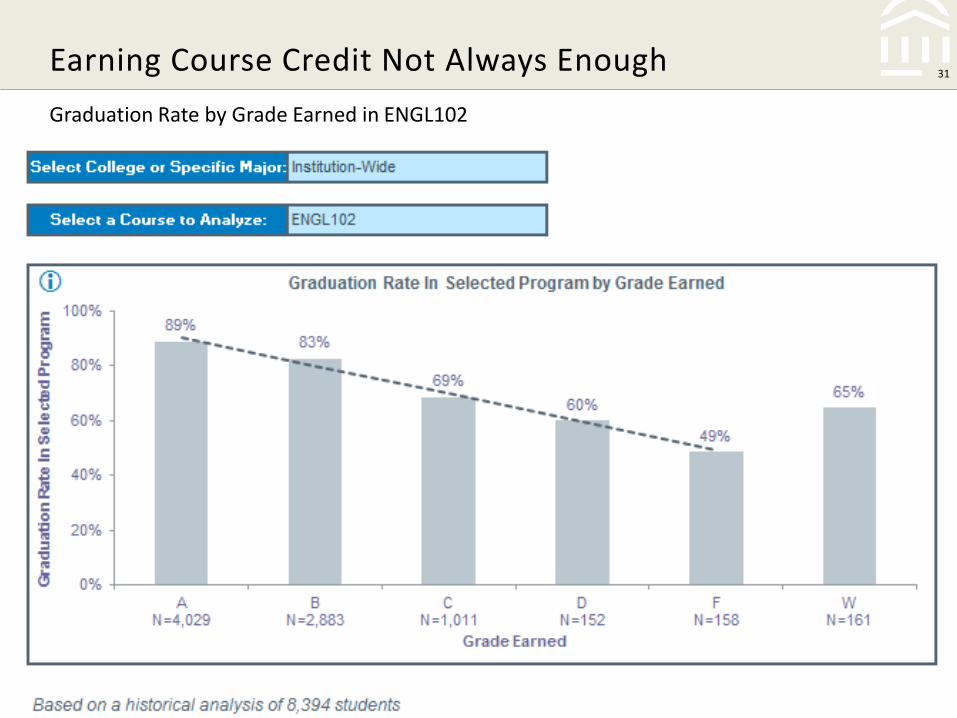
Graduation Rate by Grade Earned in ENGL102
Earning Course Credit Not Always Enough

32
%D/Fs of Top 10 Enrolled Courses Institution-Wide
Identifying Barriers to Completion

33 Institution Reports Historical Analytics to Support Strategy and Decision Making
Key Takeaways
• Ability to select historical timeframe
• Historical analysis to understand key predictive items by college or major, including:
• Critical course analysis
• GPA analysis
• Major performance and timing
• Major switching patterns analysis
• Student sub-group analysis
• Pre-enrollment factors

Two Primary Tools Advising Platform
Current students Risk levels for each student based on:
Predictive analysis of historical data, current student performance and characteristics
Flags if success markers are triggered Comparison to peers in 5 key skill areas Overview of GPA, credit hrs earned, Ds/Fs, Ws Drill down, customized work lists, “what if” feature

35 Student Overview Page
GPA Trends: New credit
and GPA trend visualizations
Notes: Notes displayed on
student profile
Overview: Critical academic
information highlighted at the top, with risk score analysis on the bottom


Project Details
Pilot Groups – Round I Chemistry Mathematics Business
Arts & Sciences dean’s office advising staff Student Success Center Career Center

Project Details Why Pilot?
Continue to review/validate data Provide insights into practical use Develop workflow Provide feedback for improvement Champions for broader implementation LOTS of technology changes in past few years

What Have We Learned?
Not one more tool – must integrate and coordinate technology
Approach for faculty and staff advisors should be different
Valuable to take time to validate data
Feedback is heard and action is taken

Where Are We Headed?
Continue roll-out - Round II of pilots
Incorporate platform into workflow
- Coordinate/integrate advising tools - Create shared expectations for usage
Demonstrate direct impact on student success

Also on the Horizon EAB Acquisitions:
Royall, Inc – anticipate insights from combined data sets by
fall 2015 GradesFirst – greater early intervention functionality,
appointment scheduling, feedback loops

THANK YOU!

Provost Retreat August 14th, 2015
Re-envisioning Academic Advising at the University of South Carolina

Advising Coordinating Taskforce Report
• Faculty, Staff, Student representatives • Advisor and Student survey information • Reference to national best practices • Six Recommendations
1. Establish Advising Center & First-Year Advisors 2. Support Colleges & Schools 3. Training & Certification 4. Technology & Online Resources 5. Faculty-led Student Programs 6. Student Responsibility

Survey Question: I feel well trained in my advising role.
Strongly disagree Disagree Agree Strongly agree
Faculty Staff
10.04%
20.82%
41.64%
27.51%

Making Effective Referrals
Important Competent Practice
Faculty (n=163) Staff (n=62)78%
54%
35%

Knowledge of University Policies and Policies
Important Competent Practice
Faculty (n=163) Staff (n=62)86%
65%
54%
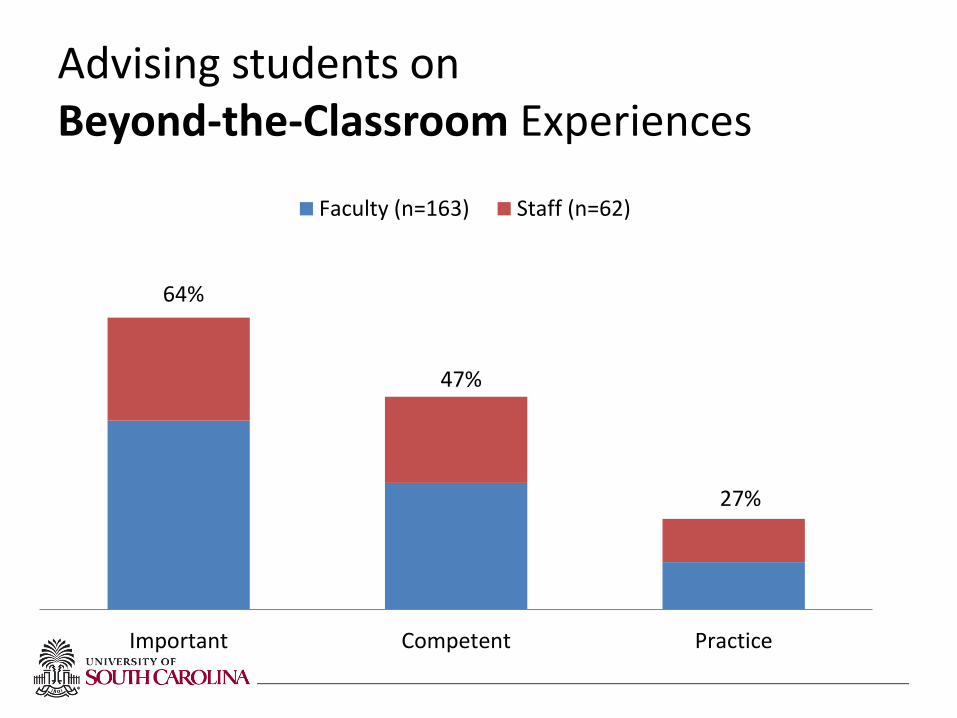
Advising students on Beyond-the-Classroom Experiences
Important Competent Practice
Faculty (n=163) Staff (n=62)
64%
47%
27%

• Formation of Advising Center, July 2015 • Dr. Claire Robinson, Director • Close-Hipp building • Change of Majors and Transfer Advising • www.sc.edu/Advising • Phone # 777-1222

First-Year Advisors • Professional staff advisors for all first-year
students – Target ratio 300:1 – UAC participates in hiring, training, evaluation – Advisor Office location: College or UAC
• Advising Training & Certification – 3 online training modules (projected) – First-Year Advisor certification

Technology & Online Resources – Streamline technologies and advising workflow
• Self-Service Carolina • DegreeWorks • Appointment scheduling • Student Success Collaborative: identifying high-risk
students
– Student Portal – Advisor Portal

Faculty-led student programs
Faculty expertise in the major or field area Graduate school and career opportunities Faculty mentor opportunities for first-year
students

Student Responsibility
• Student checklists • Completion of online modules • Preparation for advisement

THANK YOU!

Global Carolina

Strategic Reorganization
• Unified mission and budget permitting strategic planning.
• Greater faculty involvement. • Produce a university wide strategic plan.

Shorelight
• International Accelerator Program: First intake • Masters program • Future public private initiatives.

Academic Partnerships
• Finding and pursuing international partners for online educational content in collaboration with Senior Vice Provost Ford.

Study Abroad
• Emphasis on student service and collaboration with faculty.
• Emphasis on quality as well quantity. • USC branded programs in Italy and Costa Rica.

USC Global Health Initiative
• In December 2014, 40 USC faculty members from 7 colleges discussed improving collaborations across campus in fields related to global health and development
• USC accepted into the Consortium of Universities for Global Health www.cugh.org with support from multiple colleges and schools
• Grant funded by Walker Institute for International and Area Studies to host workshop for strategic planning October 22-23, 2015 – Four outside experts to share experiences and advice for furthering
global work at USC – Focused working groups to develop practical and concrete steps to
strengthen our global programs in the health and development fields • Contacts:
– Jeff Hall, School of Medicine, [email protected] – Ed Frongillo, Arnold School of Public Health, [email protected]

THANK YOU!

Provost Retreat
Fall 2015

• HR/Payroll PeopleSoft module
• Impacted areas
• Anticipated benefits
• What to expect in the near future
OneCarolina HR/Payroll Update

Our History HR/Payroll Systems at USC
1970s: Paper Process to
Homegrown Mainframe
1990s-2000s: From
Homegrown Mainframe to
Internet Systems
2015: Integrated Modern
Enterprise HCM System :
PeopleSoft
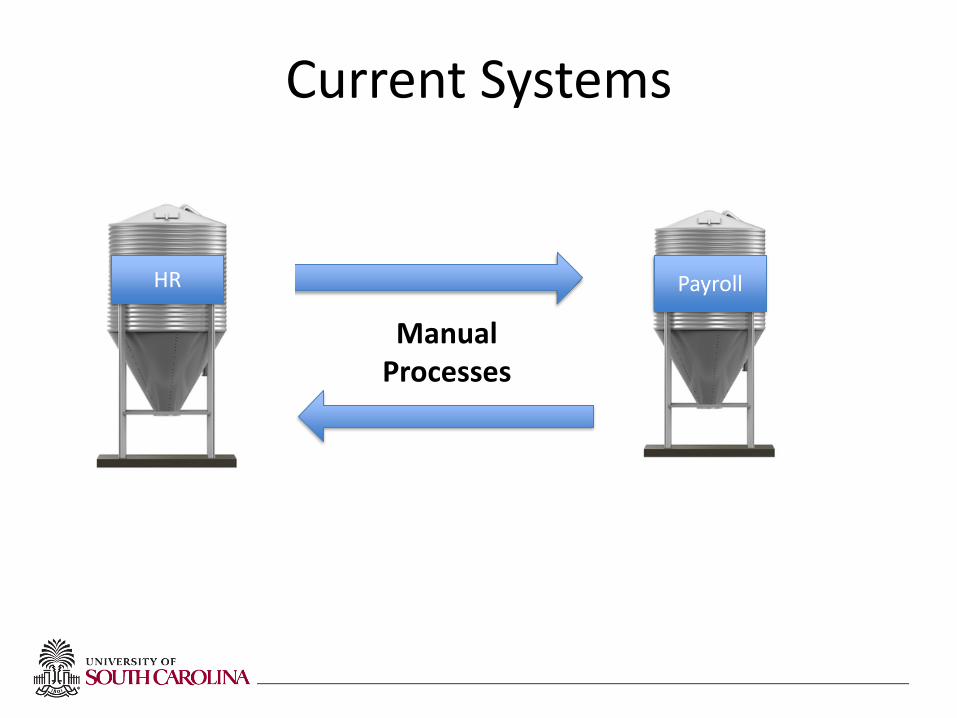
Current Systems
Manual Processes
HR Payroll

Human Capital Management
HCM
TAM
T&L
ABS
PY
CP
PM
BN
ESS/MSS

HCM Will Impact: • Core HR Processes
– Classification – Compensation – Position Management
• Recruiting and employment – Advertising – Selection – Onboarding
• Organizational management – Organizational hierarchy
• Benefits • Payroll • Student hiring process
• Position types –FTE, RGP, TEMP, TFAC
• Time reporting • Leave administration
–Annual Leave, Sick Leave –Holidays
• Employee self-service –Leave requests, overtime –Time reporting, paychecks
• Manager self-service –Leave and overtime approval –Initiate pay actions, etc.
PeopleSoft Benefits
• Improved processes, reduced errors
• Better tracking and accountability
• Increased efficiencies and integration
• Improved communication
• Better information for decision making
• Increased compliance

Next Steps
• System Testing
• User Acceptance Testing
• Communication • Training, training, training!

What else can you expect?
• Stabilization period after we go live
• Improved workflow • More integration (through the
system!) • Less paper (eventually…) • More discipline in our processes • Help adapting to the changes

Summary
• HR/Payroll system is on the way. • Lots of change is coming, but it is
positive change that will benefit the institution.
• We are your partners to help you
and your employees navigate the changes ahead.
Thank You!

Calendar and Space Reservation System

Space Reservation and Calendaring System
Efficiently manage and promote a wide variety of events to the community, improve institutional prestige and increase awareness of beyond-the-classroom (BTC) opportunities
Our Goal

Space Reservation and Calendaring System
Representatives from University colleges and divisions, Provost Office and other system campuses.
Project Team

Space Reservation and Calendaring System
Benefits • Space reservation and calendaring work together • Builds on a system we already use
– Class scheduling will not change – Requesting academic space for meetings will not change
• Enhanced ability to find venues for larger and special events and publish them to university calendars.
The System: 25 Live

How it works: Event entry/space request • “Requestors” (authorized users) search & request
space, time, resources • Events can be tagged by characteristics to help
others find them • Designated location “Schedulers” (gatekeepers)
approve requests
25 Live

How it works: Event entry/space request • “Requestors” (authorized users) search & request
space, time, resources • Events can be tagged by characteristics to help
others find them • Designated location “Schedulers” (gatekeepers)
approve requests
25 Live

Fall 2015: Space Reservations
Staff and faculty “Requestors” across the Columbia campus will begin to use 25Live to request non-academic space for their special events and meetings.

Fall 2015: Calendaring
Unit calendar coordinators and communications professionals begin to use 25Live Publisher to promote events to calendars on university websites.

Upcoming Changes:
• New look for USC-Connect calendar (Fall 2015)
• Improved coordination of event space
• Better data for University calendars

• September new user classes: First Priority: “Schedulers” who approve
space Second Priority: “Requestors” of space
• Refresher and new user training classes will be offered on a regular basis.
• Auxiliary training materials available throughout training and beyond.
Training Opportunities

Questions? Please contact
Roseanne Shaw Calendar & Space Reservation System
Office of the Provost Telephone: 803.777.2451
Email: [email protected]

THANK YOU!