Embed Size (px)
Citation preview

Fall Industrial Advisory Board
Meeting
October 28, 2016

Introduction & Welcome

Agenda
• Department Update • Industry Spotlight • ECE Faculty Spotlight • Break • Trends in Engineering Education/
Previous IAB Recommendations • Breakout Session • Report Results of Breakout Session • Lunch

Welcome Guests/New Members
• Jason Fritz, Rincon Research Corporation
• Richard Troksa, Gold Aspen Consulting
• Alan Wang, Pelco by Schneider Electric
Department Update
Prof. Tony Maciejewski Department Head Electrical and Computer Engineering Colorado State University

10 Years of Service – Thank You! • Dan Ferguson • Dana Kirchmar • Scott Lukes • Paul Monson • Kurt Rentel
Photos taken at Spring 2007 IAB

Two Early Career Endowed Professorships Awarded to ECE Faculty
Lisa and Desi Rhoden Professorship in ECE
Rockwell/Anderson Professorship

Professors Menoni and Rocca Named CSU Distinguished Alumni Employees
Jorge Rocca, Ph.D. EE, ’83; Carmen Menoni, Ph.D. Physics, ’87
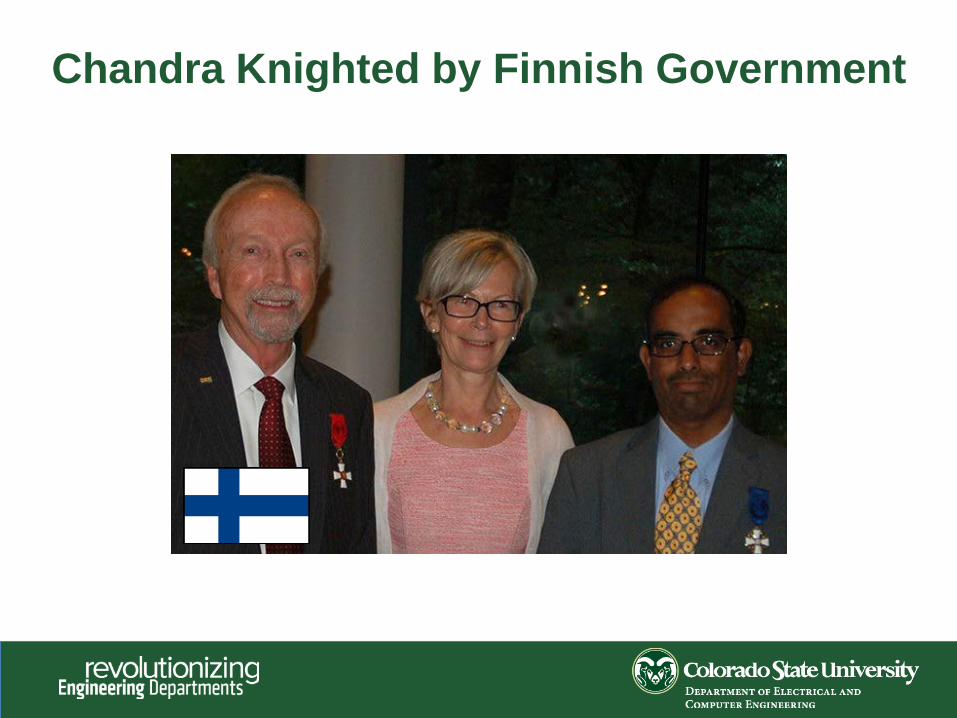
Chandra Knighted by Finnish Government

Sudeep Pasricha Monfort Professor
Melissa Reese Outstanding Administrative
Professional
Branislav Notaros CSU Distinguished Teaching Scholar
Faculty and Staff Honored at 2016 Celebrate! Colorado State Awards
Ceremony

Recent Online Features
• NSF-sponsored research aimed at keeping miners safe • Collaboration with Colorado
School of Mines
• ECE research in early melanoma detection featured on Denver’s Channel 7
• Student feature: ECE freshman loves math and juggling
engr.colostate.edu/ece

Results of 2016 Best Paper Contest
• Winner is …. Signal Manipulation for the Hearing Impaired o Thanks for your continued support of the contest!

• Engineer-in-Residence o Increased interactions with
students o Growing interest in program
from industry
• Keysight Mentoring Program o Unique pilot program to fill pipeline with talented
students o Experimenting with “tech interactions”
and product demos to replace tech talks
Industry-Student Engagement

COE Research Expenditures FY16
ATS 20%
CIRA 33%
ECE 14%
CEE 19%
ME 11%
CBE 3%
College of Engineering
46%
ATS CIRA ECE CEE ME CBE

COE Research Expenditures
$-
$2,000,000
$4,000,000
$6,000,000
$8,000,000
$10,000,000
$12,000,000
$14,000,000
2011 2012 2013 2014 2015 2016
CBEMEECECEE

ECE Research Expenditures
$0
$2,000,000
$4,000,000
$6,000,000
$8,000,000
$10,000,000
$12,000,000
$14,000,000
2001
2002
2003
2004
2005
2006
2007
2008
2009
2010
2011
2012
2013
2014
2015
2016

ECE Direct & Indirect Costs
$-
$2,000,000.00
$4,000,000.00
$6,000,000.00
$8,000,000.00
$10,000,000.00
$12,000,000.00
2011 2012 2013 2014 2015 2016
DirectExpenditures
IndirectExpenditures
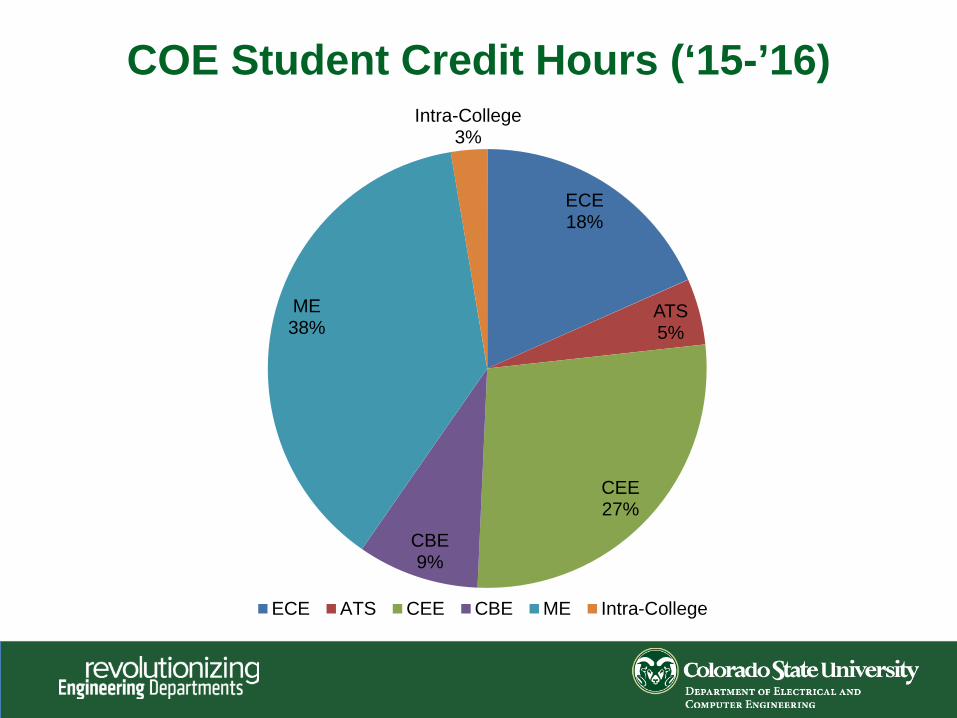
COE Student Credit Hours (‘15-’16)
ECE 18%
ATS 5%
CEE 27%
CBE 9%
ME 38%
Intra-College 3%
ECE ATS CEE CBE ME Intra-College

0
1,000
2,000
3,000
4,000
5,000
6,000
7,000
8,000
9,000
2011-2012 2012-2013 2013-2014 2014-2015 2015-2016
Grad
Undergrad
ECE Student Credit Hours

ECE Fall Enrollment
0
100
200
300
400
500
600
FA09 FA10 FA11 FA12 FA13 FA14 FA15 FA16
Num
ber o
f stu
dent
s
Undergraduate Primary Majors (includes BME) Masters PhD ME-Online

Freshmen Enrollment
0
20
40
60
80
100
120
FA11 FA12 FA13 FA14 FA15 FA16
Tota
l num
ber o
f stu
dent
s FreshmenBiom/EELO
FreshmenBiom/EE
FreshmenCpE
FreshmenEE

ECE Freshmen Enrollment: Colorado Institutions
0
20
40
60
80
100
120
2010 2011 2012 2013 2014 2015
Num
ber o
f Stu
dent
s
Year
Colorado School ofMines
Colorado StateUniversity
University ofColorado Boulder
University ofColorado ColoradoSprings
University ofColorado Denver
0
50
100
150
200
250
300
350
400
450
500
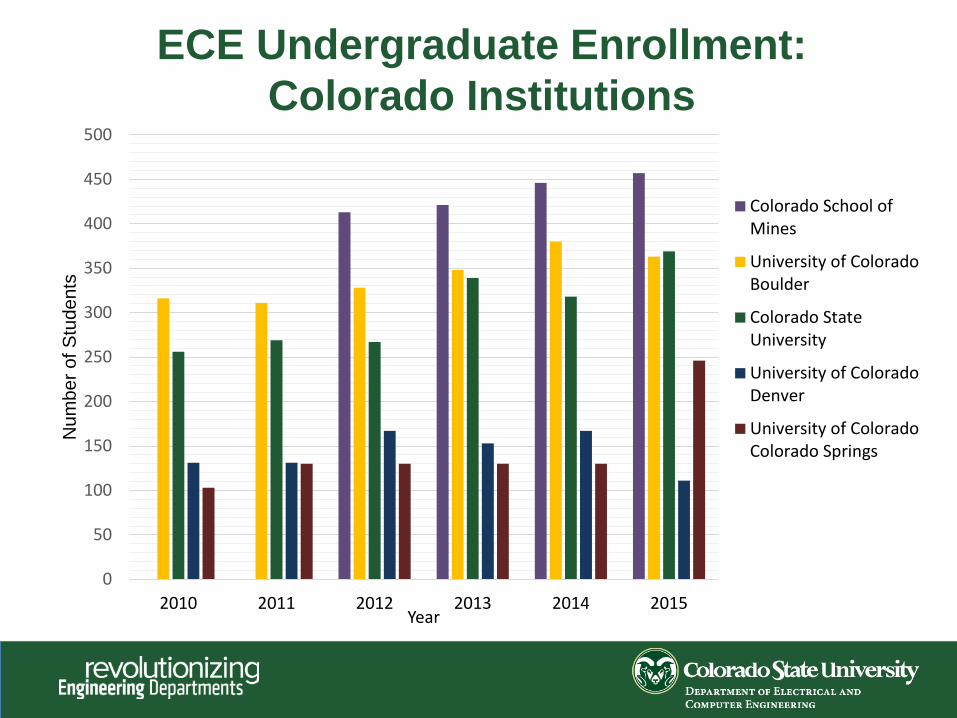
2010 2011 2012 2013 2014 2015
Num
ber o
f Stu
dent
s
Year
Colorado School ofMines
University of ColoradoBoulder
Colorado StateUniversity
University of ColoradoDenver
University of ColoradoColorado Springs
ECE Undergraduate Enrollment: Colorado Institutions

ECE Freshmen Retention to 2nd Fall
Cohort Size of First-Year ECE Students Persistence Rates of First-Year ECE Students through the 2nd Fall
Persistence Rates Within Department by Cohort Department and Cohort Term
Dot com bubble
“The World is Flat”
The Great Recession

ECE Freshmen Retention to 6th Fall
Persistence Rates Within Department by Cohort Department and Cohort Term
Cohort Size of First-Year ECE Students Persistence Rates of First-Year ECE
Students through the 6th Fall

Women in Engineering (FA16)
CBE, 15%
CEE, 28%
ME, 17%
Intra-College,
32%
ECE, 8%
Undergraduate
AS, 15% CBE,
5%
CEE, 38% ME,
7% Intra-
College 4%
BME, 9%
ECE, 23%
Graduate

Women in ECE at CSU
0
10
20
30
40
50
60
70
FA11 FA12 FA13 FA14 FA15 FA16
Number UG Women
Percent UG Women
Number GR Women
Percent GR Women

International Students in ECE at CSU
Num
ber o
f Stu
dent
s
0
50
100
150
200
250
FA07 FA08 FA09 FA10 FA11 FA12 FA13 FA14 FA15 FA16
Undergraduate Graduate

Undergraduate Degrees Awarded
0
10
20
30
40
50
60
70
2010-11 2011-12 2012-13 2013-14 2014-15 2015-16
Num
ber BSCpE
BSEE
Full Year

Graduate Degrees Awarded
0
10
20
30
40
50
60
70
80
90
2010-11 2011-12 2012-13 2013-14 2014-15 2015-16
Num
ber
Full Year
MS Ph.D. Online ME in ECE

Percent of International Degrees Awarded
0%
10%
20%
30%
40%
50%
60%
70%
80%
90%
100%
2010-11 2011-12 2012-13 2013-14 2014-15 2015-16Full Year
Ph.D. MS Online ME in ECE Total

Career Outlook for ECE Majors
• Among the top 10 majors in demand for B.S., M.S., and Ph.D. degrees*
• In 2015, 100% of ECE graduates had employment related to their major
– CSU average is 75%**
• ECE graduates earned the highest staring salaries in the College of Engineering**
*National Association of Colleges and Employers
Annual Job Outlook Reports **CSU First Destination Study, 2015

Average Starting Salaries for Recent CSU Bachelor’s Grads
2015 First Destination Survey Results
• Electrical Engineering – $71,125 • College of Engineering average – $60,497 • CSU average - $47,039

Current Status of RED Project
• Delivering junior-level Learning Studio Modules and Knowledge Integration activities for FA16
• Conducting formative assessment of new active learning components
• Graduate Teaching Fellow designated to interface with Math department
• Implemented cohort teams in freshmen and junior years

RED Next Steps
• Break up sophomore-level curriculum
• Deliver junior-level LSMs and KIs for SP17
• Develop dedicated web site for the project
• Conduct analyses, submit to conferences and journals, and continue data collection
• Focus on broader dissemination
• Continue to solicit IAB feedback about the project

Status of M.S. & Ph.D. in Computer Engineering
• Approved on campus – awaiting final approvals
• Recruitment for new
faculty member in progress

New ECE Certificates Available
Available online and on-campus: • Computer Systems Engineering • Embedded Systems • Power and Energy
Update on Spring Action Items
• Action item: For next year’s E-Days judging, implement the following: – allow for “n/a” – provide prompting questions – allow for .5 scoring
• Status: These ideas will be added to the judging form
• Action item: Share results of SP16 E-Days judging
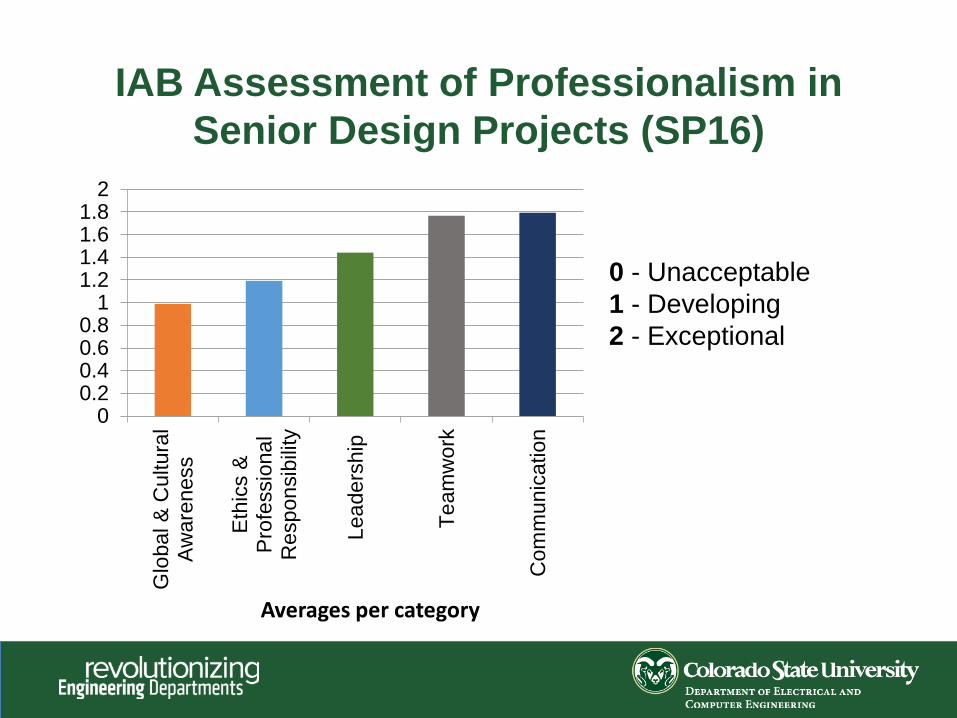
IAB Assessment of Professionalism in Senior Design Projects (SP16)
0 - Unacceptable
1 - Developing 2 - Exceptional
00.20.40.60.8
11.21.41.61.8
2G
loba
l & C
ultu
ral
Aw
aren
ess
Eth
ics
&P
rofe
ssio
nal
Res
pons
ibili
ty
Lead
ersh
ip
Team
wor
k
Com
mun
icat
ion
Averages per category

• Action item: Consider IAB’s ideas for instilling professionalism
– Short course on business – Emphasis on small and big teams, teambuilding exercises – Leadership training – Professional skills mentoring – Etiquette training – Multi-national experiences – Allow students to “feel” different workplace scenarios – Share case studies/storytelling – Book of Knowledge – Gate Modeling (fail fast, fail often) – Logical vs. emotional risk value

• Status: Team created to advise and assist with professionalism thread Industry Professionals o Pramit Rajkrishna o Jason Fegley o Jim Greener o Dan Ferguson o Richard Troksa o Lead: Alma Rosales
CSU
o Tony Maciejewski o Tom Siller o Zinta Byrne o Olivera Notaros o Alistair Cook (grad student) o Kelly Cave (grad student)

RED Professional Skills Focus
Areas
Leadership
Teamwork
Communication
Cultural Adaptability
Ethics
Foci of Professional Formation Team

Professional Formation Team’s Completed Actions
StrengthsFinder administered:
Freshmen: Aug 19
Juniors: Aug 30
Faculty and staff: Sept 24
Team Charters established:
Freshmen: Aug 13
Juniors: Aug 13

Professional Formation Team’s Activities in Progress
Research (Byrne) • Professional Learning Institute (PLI)
attitude survey week of Sept 19
Ethics (Ferguson/Greener) • Identified 12 ethics case studies • Ethics speaker will be scheduled
SP17 Communications (Fegley) • Located relevant online resources • Identified speaker evaluation forms Leadership (Greener) • Speaker from HP is scheduled on
10/24 to discuss conflict resolution
Teamwork (Rajkrishna) • Working with Kelly Cave to identify
teamwork activities • Goal is to roll out two team activities
for freshmen per month • True Colors (Spring 2017) ePortfolios (Siller) • Rolled out on a small scale in SP17 Social Communities (Greener, Troksa) • Identifying plans for SP17 Cultural Adaptability (Maciejewski) • Submitted NSF proposal with PUC
in Santiago, Chile

Jacob Sauer Director of Advanced Systems
Industry Spotlight Ball Aerospace

Professor Branislav Notaros University Distinguished Teaching Scholar IEEE Undergraduate Teaching Award Recipient
ECE Faculty Spotlight
Break
Engineering the Future:
Trends in engineering education and IAB
recommendations over the last decade

Visions of Engineering in the 21st Century 2004
What will, or should,
engineering be like in the 21st century?
2005 Preparing the
next generation of students for engagement in
global profession
2016 Preparing
young people to
solve “grand challenges”
2010 “Rapidly
approaching category 5” – innovation a
promising avenue
2007 Actions to
maintain global competitiveness
in the 21st century

NAE: The Grand Challenges 1. Advance personalized
learning 2. Make solar energy
economical 3. Enhance virtual reality 4. Reverse-engineer the brain 5. Engineer better medicines 6. Advance health informatics 7. Restore and improve urban
infrastructure 8. Secure cyberspace 9. Provide access to clean
water
10. Provide energy from fusion 11. Prevent nuclear terror 12. Manage the nitrogen cycle 13. Develop carbon
sequestration methods 14. Engineer the tools of
scientific discovery
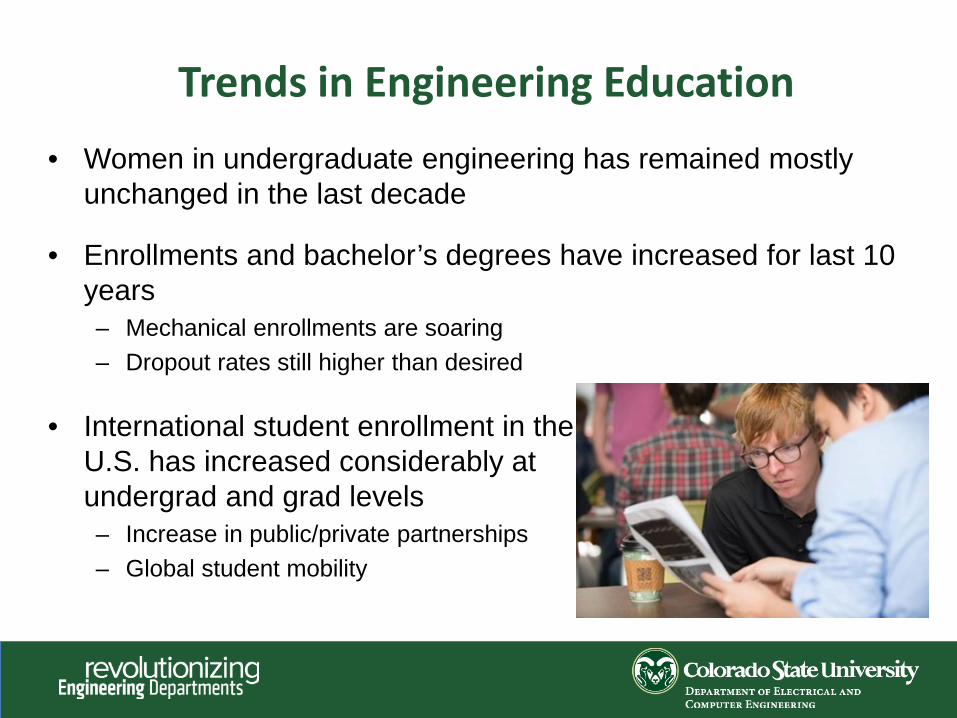
Trends in Engineering Education
• Women in undergraduate engineering has remained mostly unchanged in the last decade
• Enrollments and bachelor’s degrees have increased for last 10 years – Mechanical enrollments are soaring – Dropout rates still higher than desired
• International student enrollment in the U.S. has increased considerably at undergrad and grad levels – Increase in public/private partnerships – Global student mobility

National Enrollments by Discipline (‘05-’15)
0
50,000
100,000
150,000
200,000
250,000
300,000
350,000
400,000
450,000
0
20,000
40,000
60,000
80,000
100,000
120,000
140,000
160,000
2005 2006 2007 2008 2009 2010 2011 2012 2013 2014 2015
Information retrieved from ASEE Engineering by the Numbers
BiomedicalEngineeringChemicalEngineeringCivil Engineering
Electrical/ComputerEngineeringEngr. Science andEngr. PhysicsEnvironmentalEngineeringMechanicalEngineeringTotal
Tota
l Eng
inee
ring
Stu
dent
s by
Dis
cipl
ine

CSU Engineering Enrollments
481
433 566
1084
0
200
400
600
800
1000
1200
1400C
hem
& B
io
EC
E
Civ
il &
Env
.
Mec
h
Che
m &
Bio
EC
E
Civ
il &
Env
.
Mec
h
Che
m &
Bio
EC
E
Civ
il &
Env
.
Mec
h
Che
m &
Bio
EC
E
Civ
il &
Env
.
Mec
h
Che
m &
Bio
EC
E
Civ
il &
Env
.
Mec
h
2012 2013 2014 2015 2016
Num
ber o
f Stu
dent
s
Department by Year
Ph.D
M.S.
B.S.

Biomedical Dual Majors
0
20
40
60
80
100
120
140
160
180
200
2012 2013 2014 2015 2016
Num
ber o
f Stu
dent
s
Department by Year
Bio Eng w/ELBio Eng w/EEBio Eng w/CBBio Eng w/ME

National Persistence in Engineering
0%
10%
20%
30%
40%
50%
60%
70%
80%
90%
100%
Persisted to 2nd year Degree within 6 years Degree within 4 years
Perc
ent

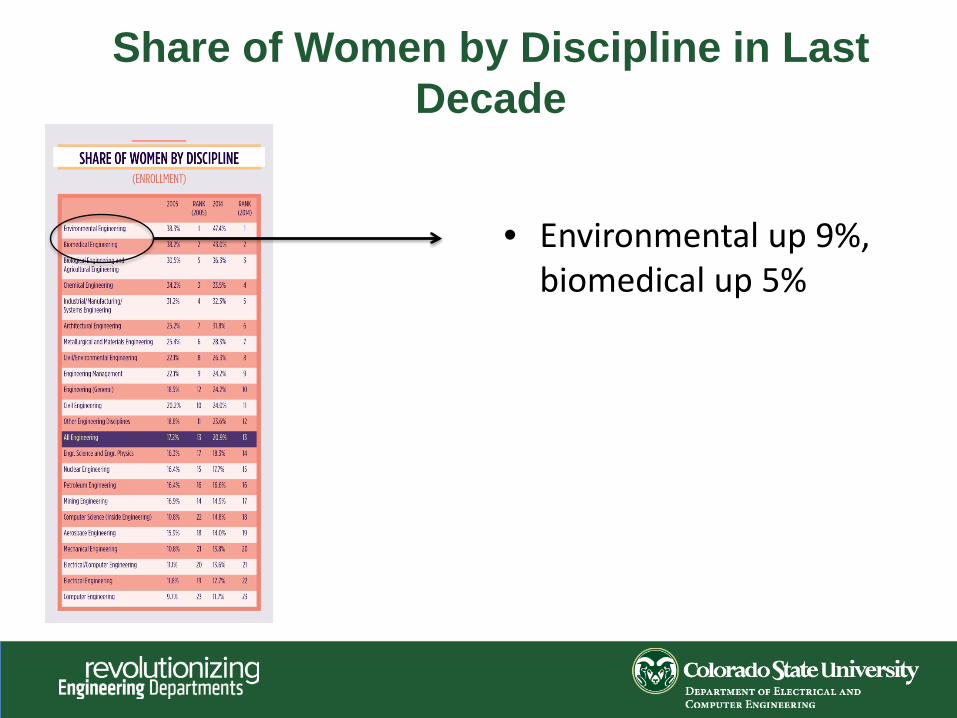
Share of Women by Discipline in Last Decade
Share of Women by Discipline in Last Decade
• Environmental up 9%,
biomedical up 5%

Share of Women by Discipline in Last Decade
• Environmental up 9%,
biomedical up 5%
• Total engineering up 3%

Share of Women by Discipline in Last Decade
• Environmental up 9%,
biomedical up 5%
• Total engineering up 3%
• Mechanical and ECE up about 2%

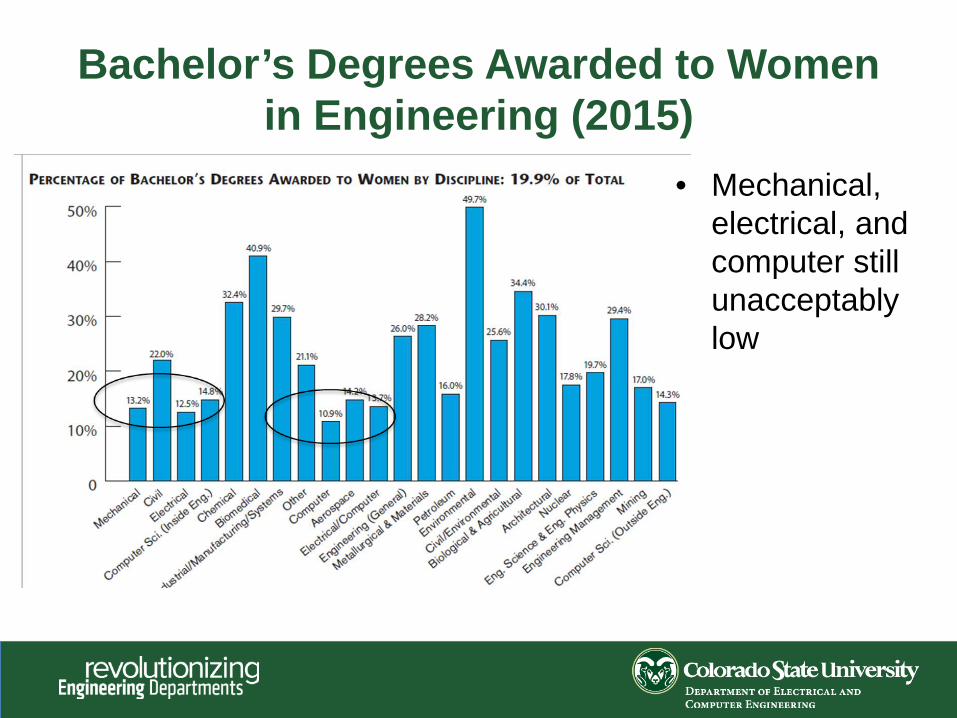
Bachelor’s Degrees Awarded to Women in Engineering (2015)

• Bio & environmental disciplines have largest share of women
Bachelor’s Degrees Awarded to Women in Engineering (2015)
Bachelor’s Degrees Awarded to Women in Engineering (2015)
• Mechanical, electrical, and computer still unacceptably low

Women’s Share of S&E Bachelor’s Degrees by Field (2000-2013)
0
10
20
30
40
50
60
70
80
90
2000 2001 2002 2003 2004 2005 2006 2007 2008 2009 2010 2011 2012 2013
Physical sciences Biological and agricultural sciencesMathematics Computer sciencesPsychology Social sciencesEngineering
Perc
ent

International Students Enrolled in U.S. Institutions, S&E Fields
0
50,000
100,000
150,000
200,000
250,000
300,000
350,000
400,000
2008 2009 2010 2011 2012 2013 2014
Undergraduate
Graduate
Num
ber o
f Stu
dent
s

First University S&E Degrees by Country (2000-2012)
0
200
400
600
800
1,000
1,200
1,400
2000 2001 2002 2003 2004 2005 2006 2007 2008 2009 2010 2011 2012
China United States Japan Germany
Mexico South Korea Taiwan United Kingdom
Thou
sand
s

Previous IAB recommendations (2005)
Questions • What curricular changes
should be made to address the changing face of engineering?
• How can we reach the right students and encourage their pursuit of engineering?
• What should the relationship with industry look like?
IAB Recommendations • Do not abandon the
fundamentals
• Provide wider range of continuing education opportunities for industry
• Continue to engage industry, particularly through senior design
• Idea of Best Paper Contest introduced

ECE’s Response to ’05 Suggestions
• Lectures, seminars shared with IAB; online courses and certificates now offered through department
• Deeper IAB engagement in all aspects of program – from serving as adjunct faculty to delivering lectures to securing equipment/ funding
• Best Paper Contest launched to emphasize and assess communication skills
Zach Blackwell, Inaugural
Recipient of ECE Best Paper Contest

Previous IAB recommendations (2011)
Questions • What programmatic
changes should be made? How do we plan for 2015, 2020, and beyond?
• How would you design the ECE curriculum, and what are the skills needed for future engineers?
• What should the relationship with industry look like?
IAB Recommendations • More collaboration with Math
department • Spark interest in ECE earlier
in curriculum • Partner with industry (e.g.,
IEEE) to generate interest in engineering
• Modernize teaching methods • Work on K-12 outreach
strategies to help engineering students enter the university better prepared

ECE’s Response to ’11 Suggestions
• Math collaboration strengthened – Special calculus recitations for ECE students – Math Foundations Thread established
• Student projects introduced at freshman and sophomore levels to spark interest in ECE
• Increased emphasis on industry engagement – Engineer in Residence program created in
partnership with IEEE
Zach Blackwell, Inaugural
Recipient of ECE Best Paper Contest

ECE’s Response to ’11 Suggestions (cont’d) • Active teaching and assessments are being implemented, e.g.,
flipped classroom approach
• Social media outlets utilized to share information with students – However, recent survey of ECE students indicated
low preference for social media for communicating department-specific info
• K-12 recruitment efforts bolstered – ECE recently received competitive institutional
grant to educate high school counselors about ECE

What’s Next? Breakout Session
Facilitators: Steve Martin and Art Lizotte

Realizing the Visions of Engineering in the 21st Century
• Do industry trends align with current issues in higher education?
• How are we doing in our efforts to generate globally-engaged engineers?
• Are you hiring CSU ECE students? Why or why not?
• How do our students compare to our peers nationwide?
• How can industry and ECE come together to address the grand challenges of our profession and the needs of our global economy?
• Are the needs and tactics different for undergraduate vs. graduate students?

Facilitators: Steve Martin and Art Lizotte
Report Results of Breakout Session

Tony Maciejewski
Closing Remarks Call to Action

Lunch