Embed Size (px)
Citation preview
Family Communication Patterns in Hong Kong
Press Conference
26th September, 2010
1
Part I FAMILY Project: Overview
Professor T. H. LamSir Robert Kotewall Professor in Public Health
Director, School of Public HealthThe University of Hong Kong
Principal Investigator, FAMILY Project Team
2
Introduction
FAMILY: A Jockey Club Initiative for a Harmonious Society is a citywide project launched by The Hong Kong Jockey Club Charities Trust with $250 million funding, in collaboration with the School of Public Health of The University of Hong Kong
The project aims to identify the source of family problems, devise suitable preventive measures and promote family Health, Happiness and Harmony (3Hs) through a territory-wide household survey, intervention projects and public education
3
Part II Study on Family Communication Patterns in Hong Kong
Professor Sophia ChanHead, School of Nursing
The University of Hong KongCo-Investigator, FAMILY Project Team
4
Background
At the end of 2009, a population-based survey was conducted entitled “Hong Kong Family and Health Information Trends Survey” (HK – FHInTS)
This survey explores a wide variety of topics related to family communication patterns, family relationships, and the indices of family Health, Happiness, and Harmony (3Hs)
This survey is the first of a series and the second survey will be conducted in November, 2010
5
Objectives
To describe communication patterns and family relationships among Hong Kong families
To analyze the relationship between family communication methods and family Health, Happiness and Harmony (3Hs)
6
Methodology
The survey was conducted during the period of November 19 to December 23, 2009
A random telephone survey was conducted by trained interviewers
Upon successful contact with a target household, one qualified member of the household was selected for interview
Respondents were Hong Kong residents aged 18 or above who speak Cantonese
7

Results
A total of 1,510 Cantonese-speaking Hong Kong residents of age 18 or above were successfully interviewed
Respondents' Characteristics PercentagesGender
Male 46.2Female 53.8
Age Group18-24 10.625-44 38.445-64 35.7
65 or above 15.3Living areas
Hong Kong Island 18.6Kowloon 29.8
New Territories 51.6Married 61.9Working 53.2 8
Measurement for mental health, happiness, and harmony
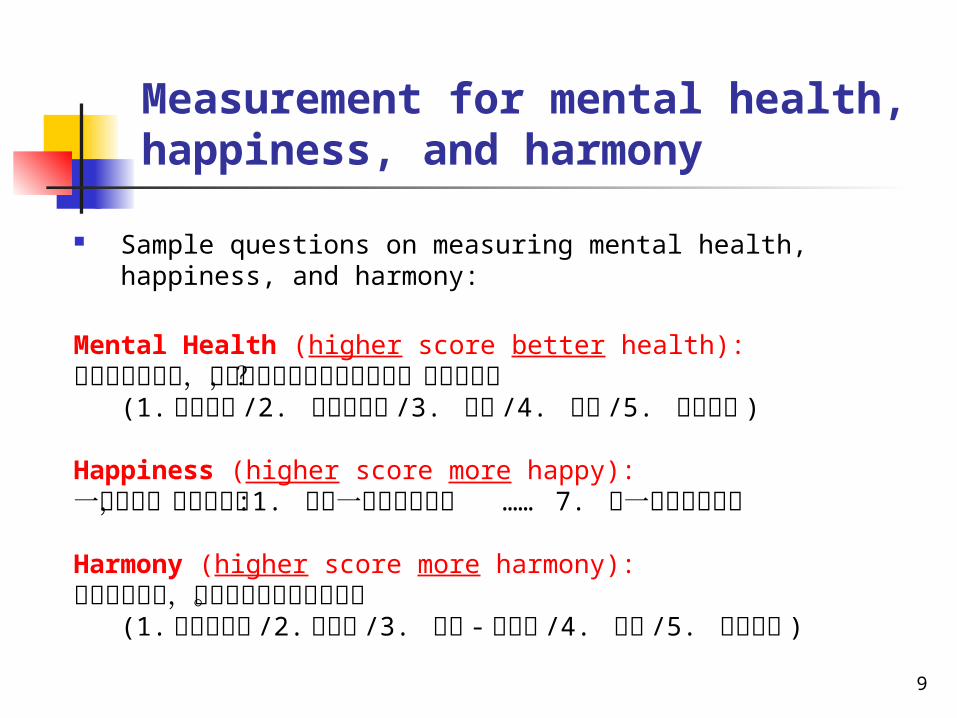
Sample questions on measuring mental health, happiness, and harmony:
Mental Health (higher score better health): 在過去四星期裏,有多少時間你覺得心情不好,悶悶不樂?
(1.常常如此 /2. 大部分時間 /3. 有時 /4. 偶爾 /5. 從來沒有 )
Happiness (higher score more happy): 一般而言,我覺得自己 :1. 不是一個很快樂的人 …… 7. 是一個很快樂的人
Harmony (higher score more harmony):相比其他家庭,我家各人的關係很密切。
(1.非常不同意 /2.不同意 /3. 中立 -冇意見 /4. 同意 /5. 非常同意 )
9
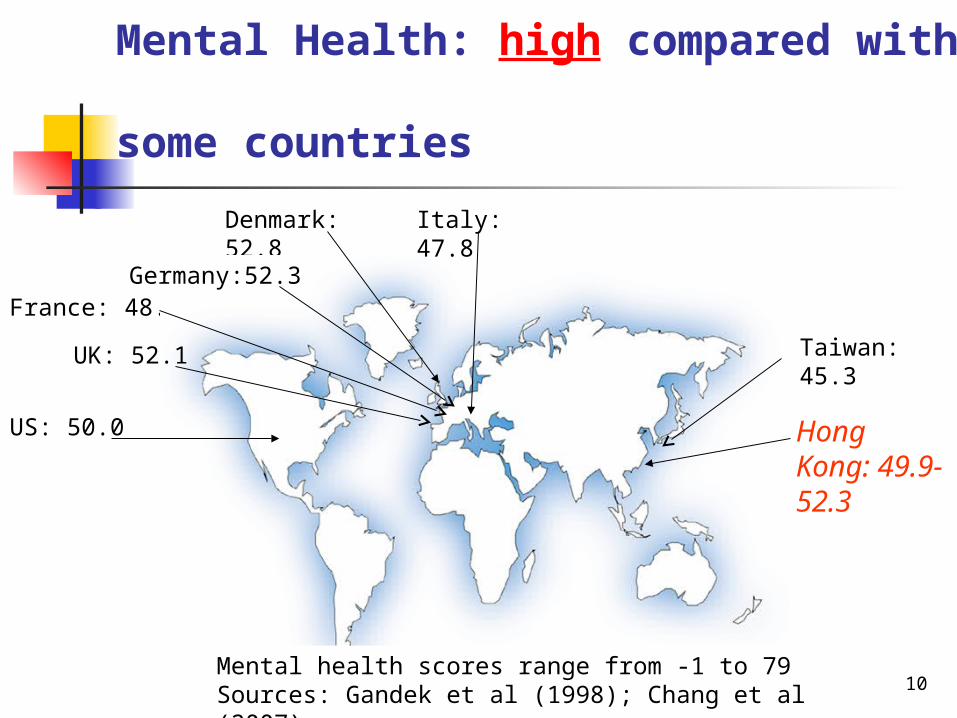
Mental Health: high compared with some countries
US: 50.0
France: 48.4
Denmark: 52.8
Hong Kong: 49.9-52.3
Mental health scores range from -1 to 79Sources: Gandek et al (1998); Chang et al (2007)
Germany:52.3
Italy: 47.8
UK: 52.1 Taiwan: 45.3
10
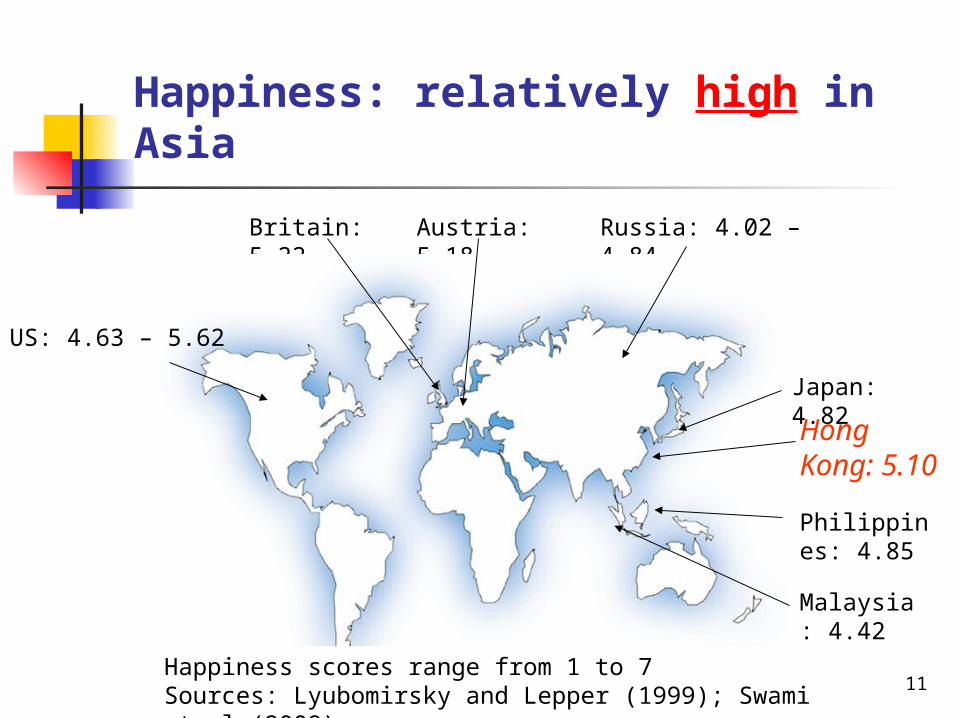
Happiness: relatively high in Asia
Russia: 4.02 – 4.84
Philippines: 4.85
Austria: 5.18 Britain: 5.22
Malaysia: 4.42
Hong Kong: 5.10
Japan: 4.82
Happiness scores range from 1 to 7Sources: Lyubomirsky and Lepper (1999); Swami et al (2009)
US: 4.63 – 5.62
11
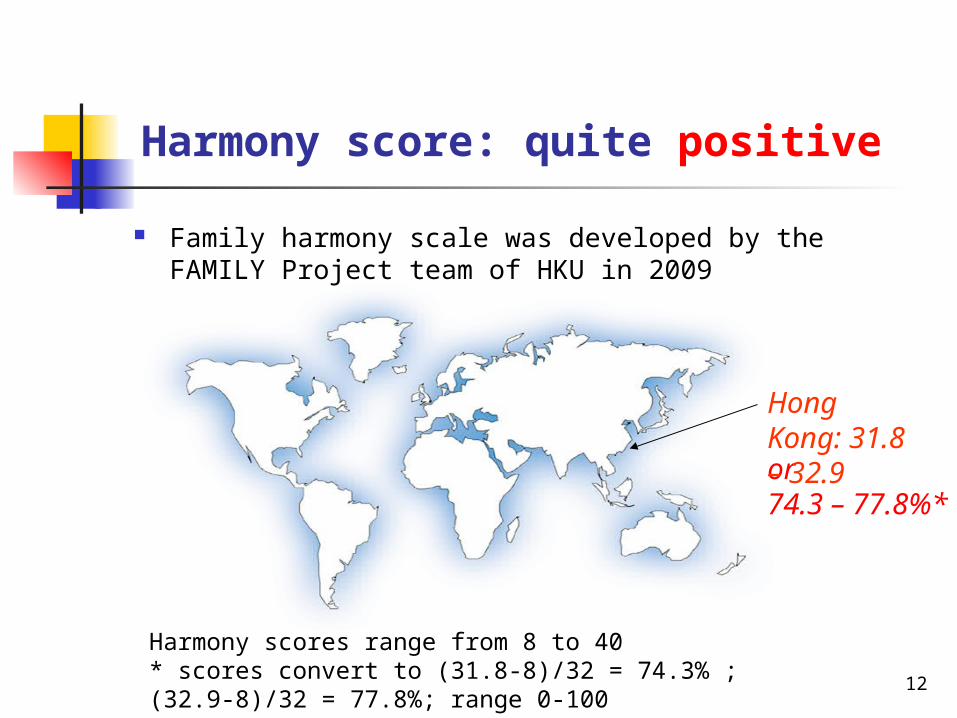
Harmony score: quite positive
Harmony scores range from 8 to 40 * scores convert to (31.8-8)/32 = 74.3% ; (32.9-8)/32 = 77.8%; range 0-100
or74.3 – 77.8%*
Family harmony scale was developed by the FAMILY Project team of HKU in 2009
Hong Kong: 31.8 – 32.9
12
Family Communication Patterns
13
• Time spent with family members
• Family relationship
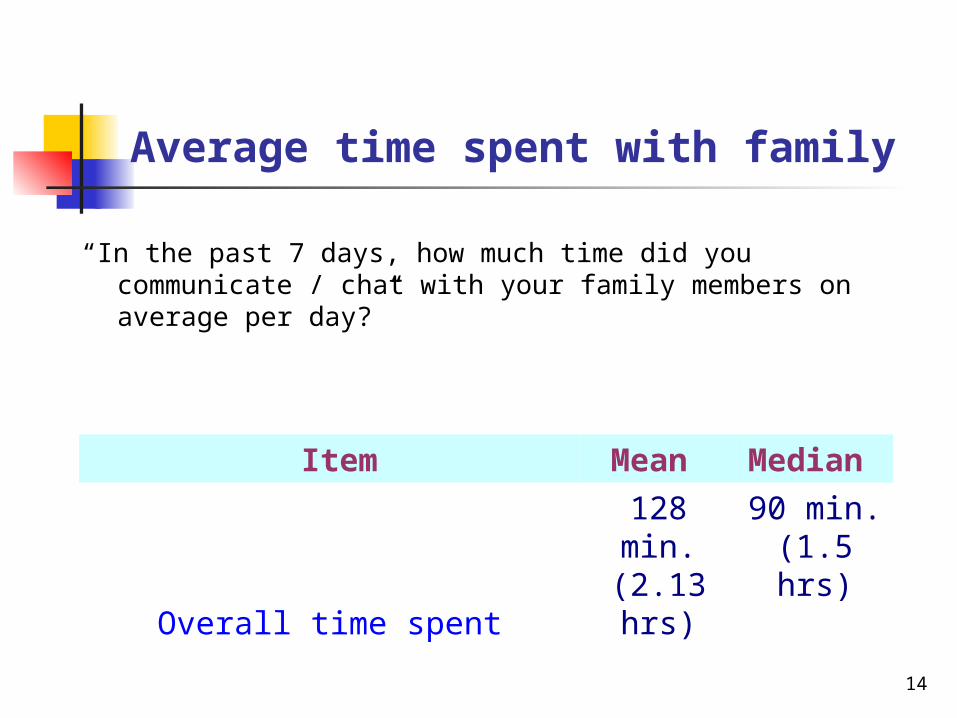
Average time spent with family
“In the past 7 days, how much time did you communicate / chat with your family members on average per day?”
Item Mean Median
Overall time spent128 min. (2.13 hrs)
90 min. (1.5 hrs)
14
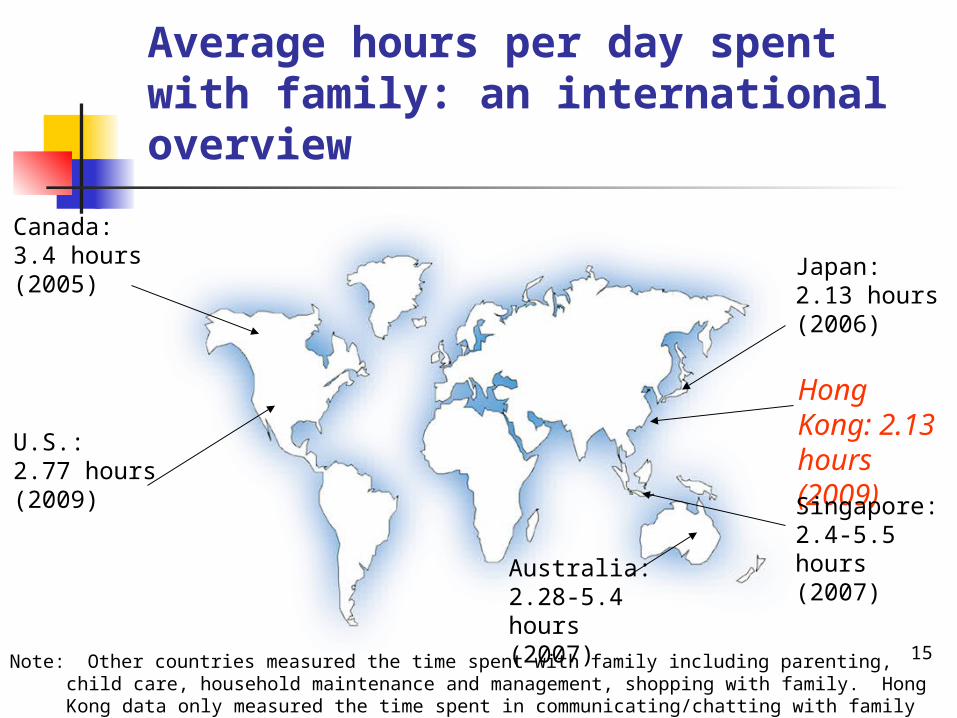
Average hours per day spent with family: an international overview
Canada: 3.4 hours (2005)
Hong Kong: 2.13 hours (2009)
U.S.: 2.77 hours (2009) Singapore:
2.4-5.5 hours (2007)Australia:
2.28-5.4 hours (2007)
Japan: 2.13 hours (2006)
Note: Other countries measured the time spent with family including parenting, child care, household maintenance and management, shopping with family. Hong Kong data only measured the time spent in communicating/chatting with family members.
15
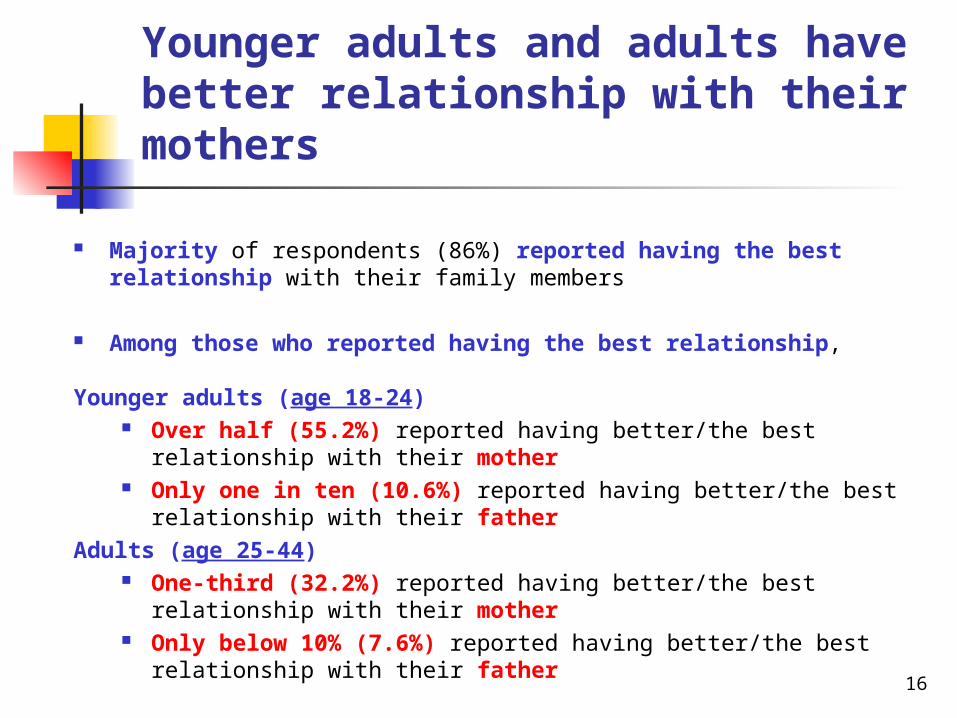
Younger adults and adults have better relationship with their mothers
Majority of respondents (86%) reported having the best relationship with their family members
Among those who reported having the best relationship,
Younger adults (age 18-24) Over half (55.2%) reported having better/the best relationship with their
mother Only one in ten (10.6%) reported having better/the best relationship with their
father
Adults (age 25-44) One-third (32.2%) reported having better/the best relationship with their
mother Only below 10% (7.6%) reported having better/the best relationship with their
father 16
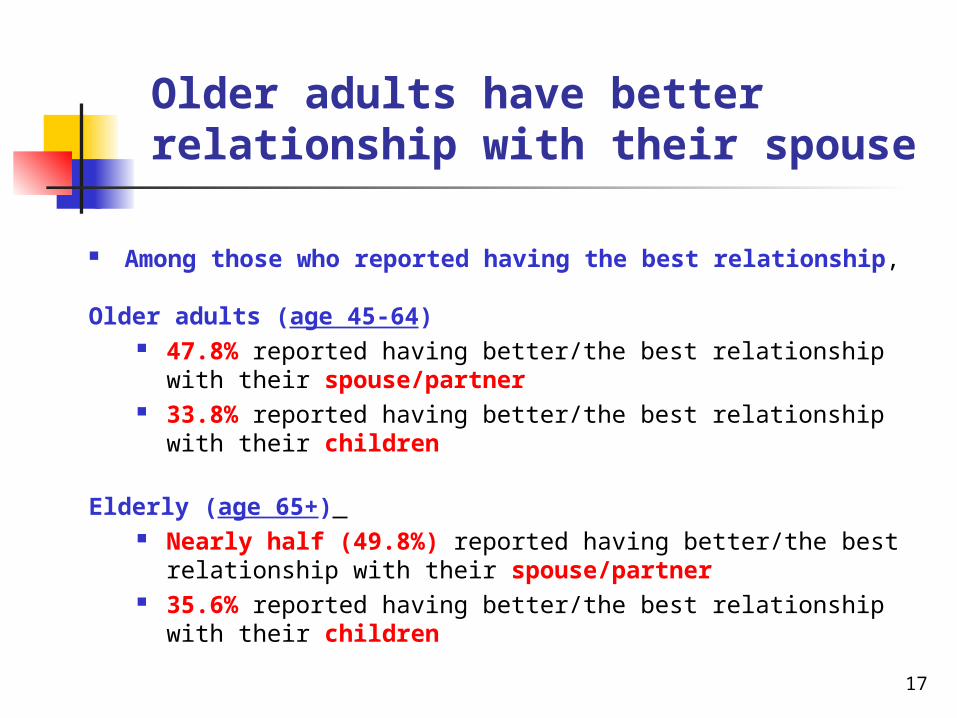
Older adults have better relationship with their spouse
Among those who reported having the best relationship,
Older adults (age 45-64) 47.8% reported having better/the best relationship with their
spouse/partner 33.8% reported having better/the best relationship with their children
Elderly (age 65+) Nearly half (49.8%) reported having better/the best relationship with
their spouse/partner 35.6% reported having better/the best relationship with their children
17
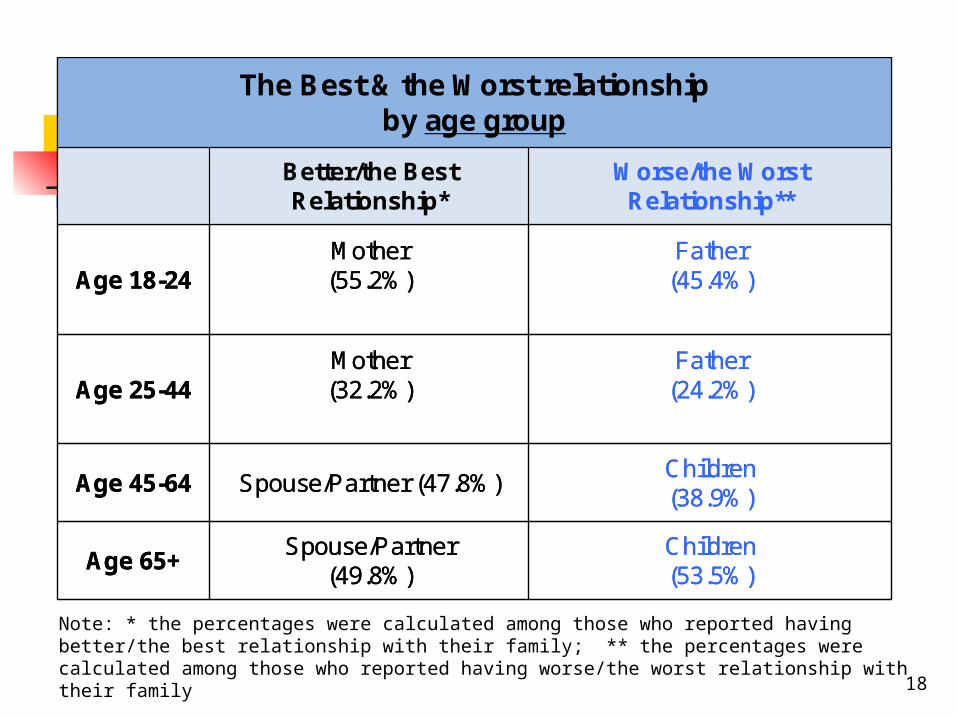
Note: * the percentages were calculated among those who reported having better/the best relationship with their family; ** the percentages were calculated among those who reported having worse/the worst relationship with their family
Father(24.2%)
Mother(32.2%)Age 25-44
Children(38.9%)
Spouse/Partner (47.8%)Age 45-64
Father(45.4%)
Mother(55.2%)Age 18-24
Worse/the Worst Relationship**
Better/the Best Relationship*
Children(53.5%)
Spouse/Partner (49.8%)
Age 65+
The Best & the Worst relationship by age group
Father(24.2%)
Mother(32.2%)Age 25-44
Children(38.9%)
Spouse/Partner (47.8%)Age 45-64
Father(45.4%)
Mother(55.2%)Age 18-24
Worse/the Worst Relationship**
Better/the Best Relationship*
Children(53.5%)
Spouse/Partner (49.8%)
Age 65+
The Best & the Worst relationship by age group
18
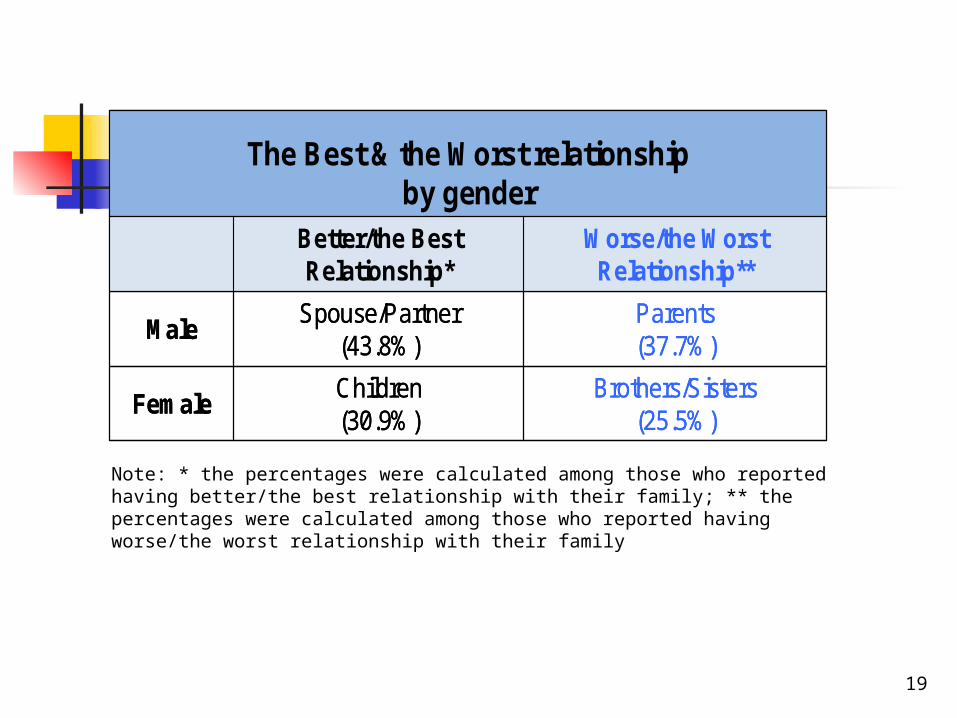
Note: * the percentages were calculated among those who reported having better/the best relationship with their family; ** the percentages were calculated among those who reported having worse/the worst relationship with their family
Parents(37.7%)
Spouse/Partner(43.8%)
Male
Worse/the Worst Relationship**
Better/the Best Relationship*
Brothers/Sisters(25.5%)
Children(30.9%)
Female
The Best & the Worst relationship by gender
Parents(37.7%)
Spouse/Partner(43.8%)
Male
Worse/the Worst Relationship**
Better/the Best Relationship*
Brothers/Sisters(25.5%)
Children(30.9%)
Female
The Best & the Worst relationship by gender
19
Factors associated with family health, happiness, and harmony
20
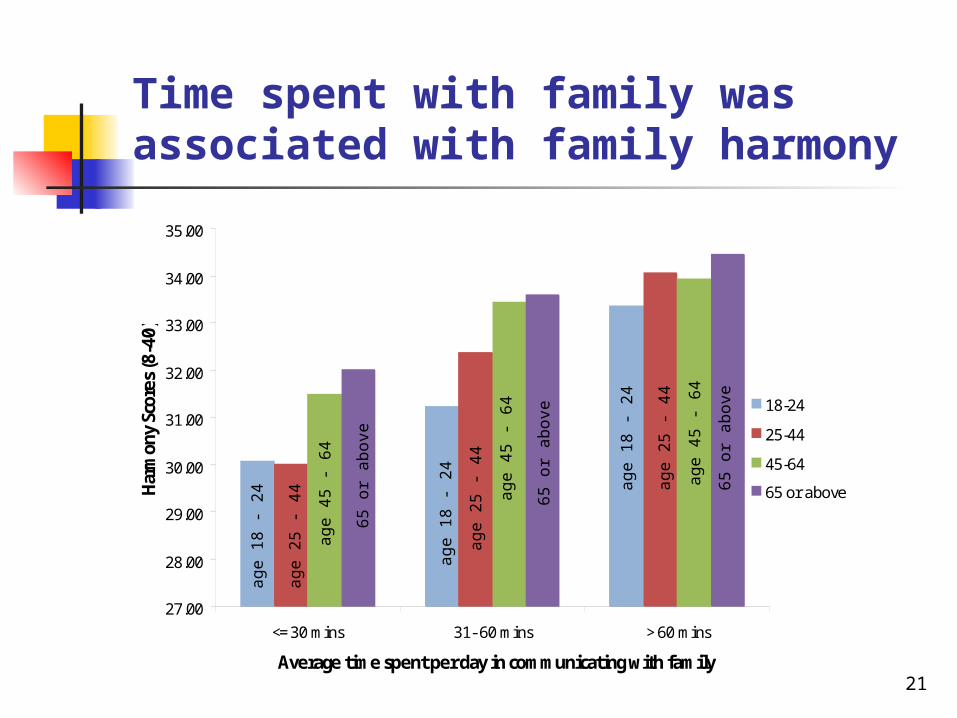
Time spent with family was associated with family harmony
27.00
28.00
29.00
30.00
31.00
32.00
33.00
34.00
35.00
<= 30 mins 31- 60 mins > 60 mins
Average time spent per day in communicating with family
Harm
ony
Scor
es (8
-40)
18-24
25-44
45-64
65 or above
age 1
8 -
24
age 2
5 -
44
age 4
5 -
64
65
or
above
age 1
8 -
24
age 2
5 -
44
age 4
5 -
64
65
or
above
age 1
8 -
24
age 2
5 -
44
age 4
5 -
64
65
or
above
21
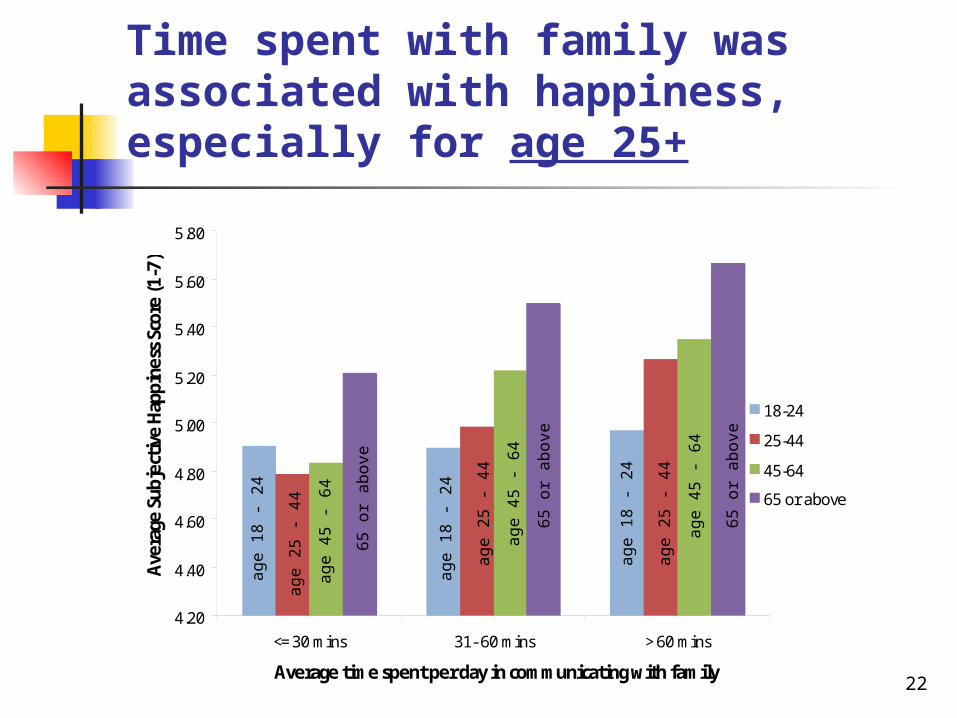
Time spent with family was associated with happiness, especially for age 25+
4.20
4.40
4.60
4.80
5.00
5.20
5.40
5.60
5.80
<= 30 mins 31- 60 mins > 60 mins
Average time spent per day in communicating with family
Aver
age
Subj
ectiv
e Ha
ppin
ess S
core
(1-7
)
18-24
25-44
45-64
65 or above
age 1
8 -
24
age 2
5 -
44
age 4
5 -
64
65
or
above
age 1
8 -
24
age 2
5 -
44
age 4
5 -
64
65
or
above
age 1
8 -
24
age 2
5 -
44
age 4
5 -
64
65
or
above
22
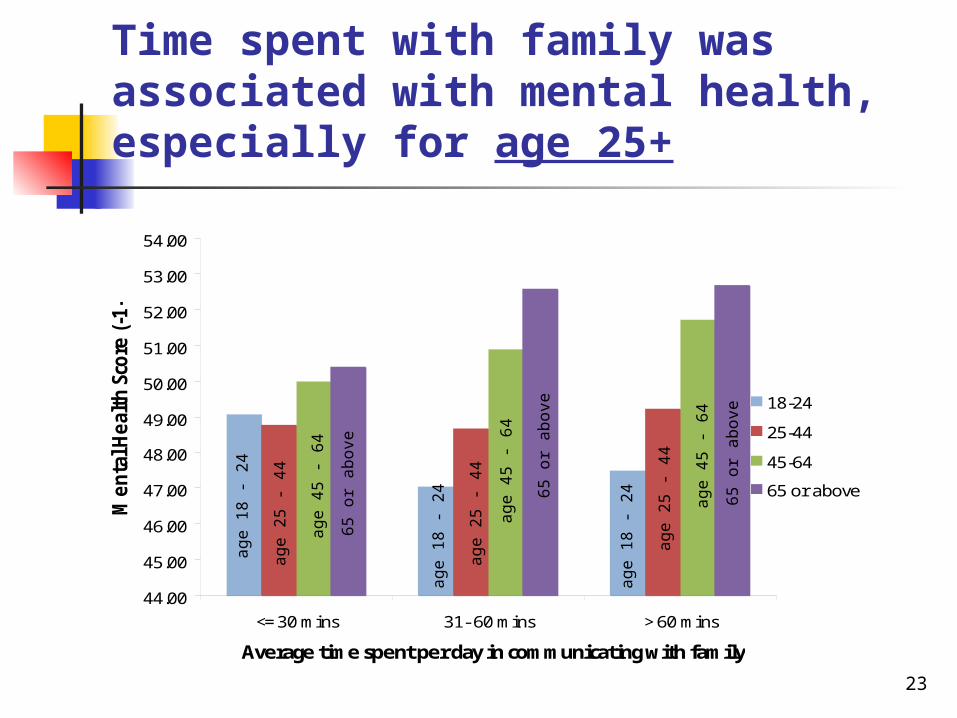
Time spent with family was associated with mental health, especially for age 25+
44.00
45.00
46.00
47.00
48.00
49.00
50.00
51.00
52.00
53.00
54.00
<= 30 mins 31- 60 mins > 60 mins
Average time spent per day in communicating with family
Men
tal H
ealt
h Sc
ore
(-1-
79)
18-24
25-44
45-64
65 or above
age 1
8 -
24
age 2
5 -
44
age 4
5 -
64
65
or
above
age 1
8 -
24
age 2
5 -
44
age 4
5 -
64
65
or
above
age 1
8 -
24
age 2
5 -
44
age 4
5 -
64
65
or
above
23
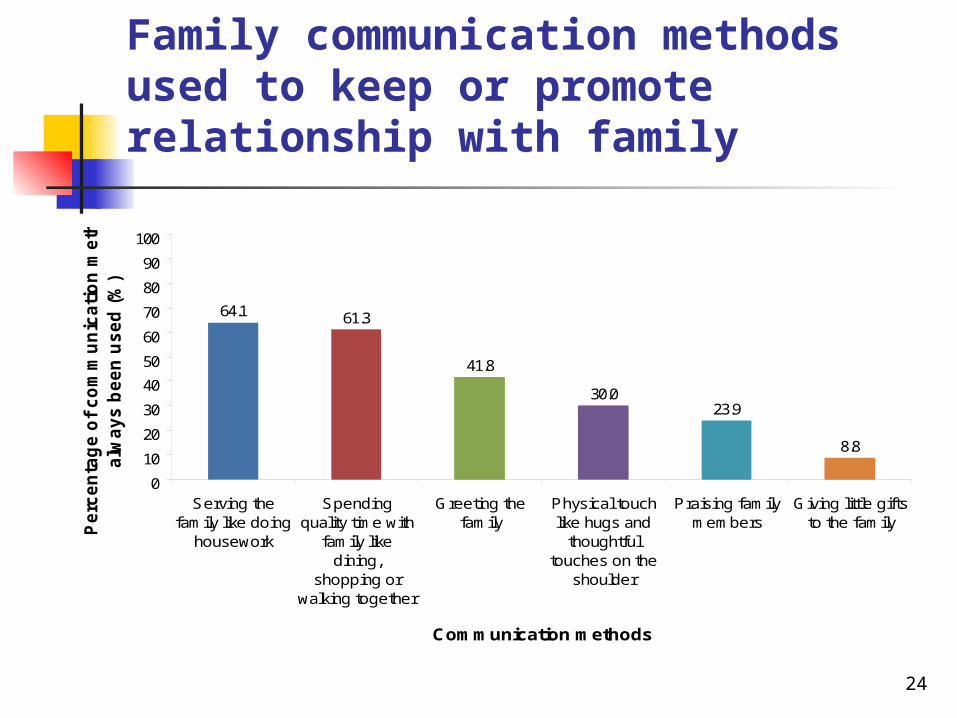
Family communication methods used to keep or promote relationship with family
64.1 61.3
41.8
30.023.9
8.8
0
10
20
30
40
50
60
70
80
90
100
Serving thefamily like doing
housework
Spendingquality time with
family likedining,
shopping orwalking together
Greeting thefamily
Physical touchlike hugs and
thoughtfultouches on the
shoulder
Praising familymembers
Giving little giftsto the family
Communication methods
Pe
rce
nta
ge
of
co
mm
un
ica
tio
n m
eth
od
alw
ay
s b
ee
n u
se
d (
%)
24
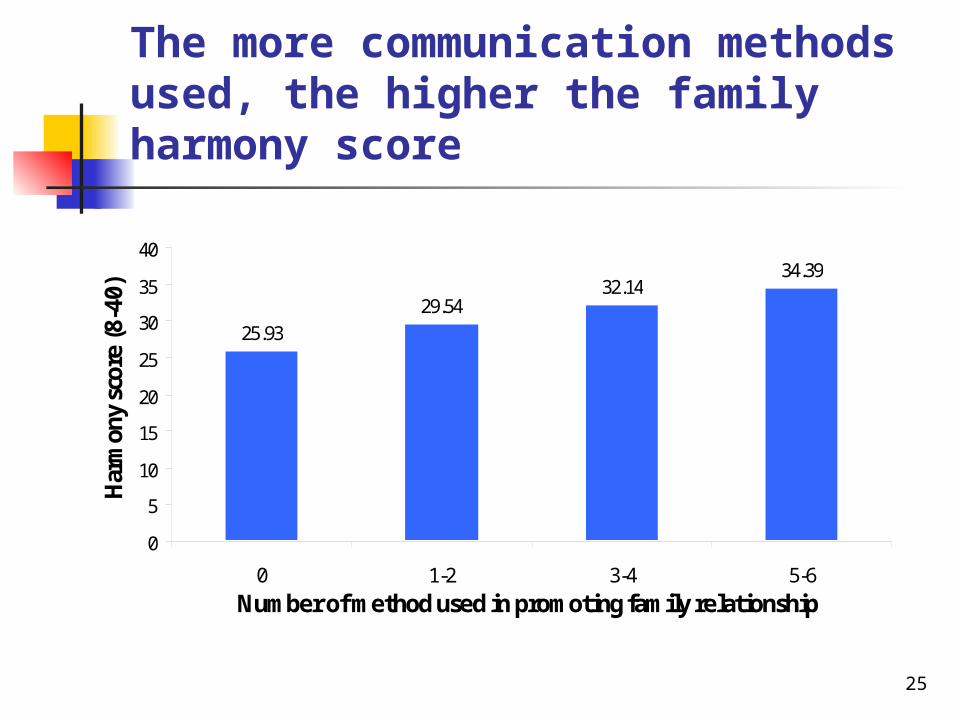
The more communication methods used, the higher the family harmony score
25
25.9329.54
32.1434.39
0
5
10
15
20
25
30
35
40
0 1-2 3-4 5-6Number of method used in promoting family relationship
Har
mon
y sc
ore
(8-4
0)

The more communication methods used, the higher the happiness score
26
4.314.70 4.92
5.38
0
1
2
3
4
5
6
0 1-2 3-4 5-6
Number of method used in promoting family relationship
Ave
rage
Sub
jecti
ve H
appi
ness
Sc
ore
(1-7
)
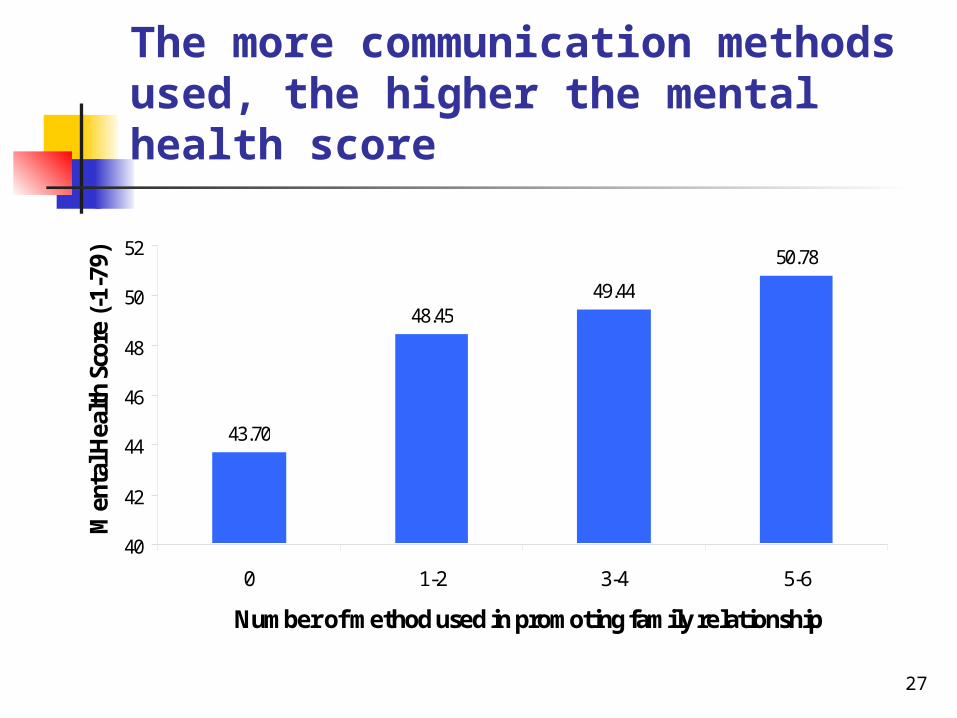
The more communication methods used, the higher the mental health score
27
43.70
48.4549.44
50.78
40
42
44
46
48
50
52
0 1-2 3-4 5-6
Number of method used in promoting family relationship
Men
tal H
ealt
h Sc
ore
(-1-
79)
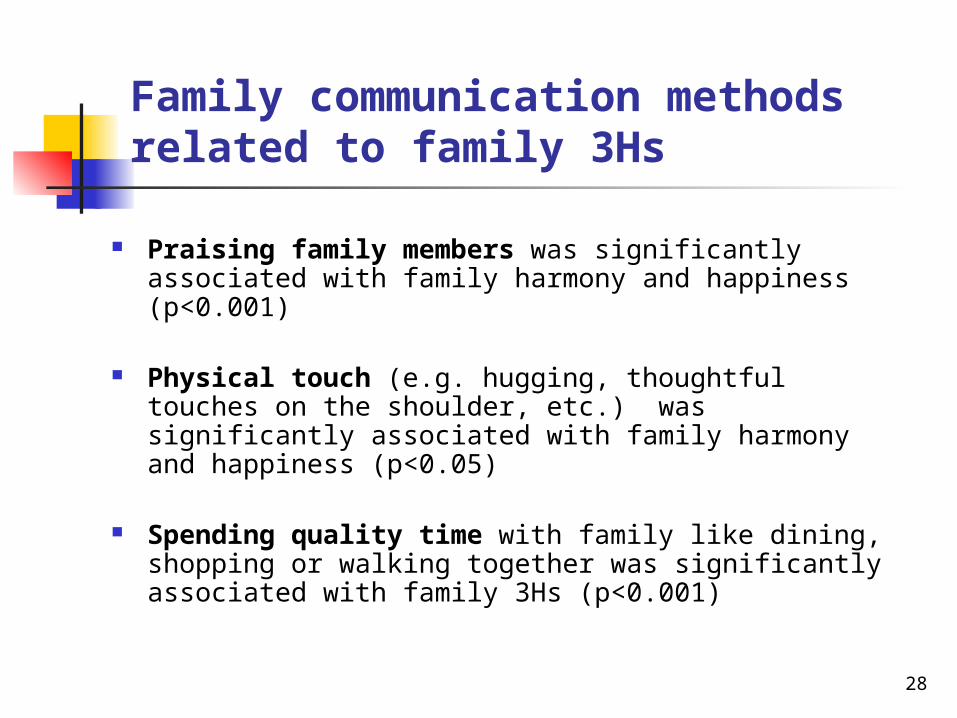
Family communication methods related to family 3Hs
Praising family members was significantly associated with family harmony and happiness (p<0.001)
Physical touch (e.g. hugging, thoughtful touches on the shoulder, etc.) was significantly associated with family harmony and happiness (p<0.05)
Spending quality time with family like dining, shopping or walking together was significantly associated with family 3Hs (p<0.001)
28
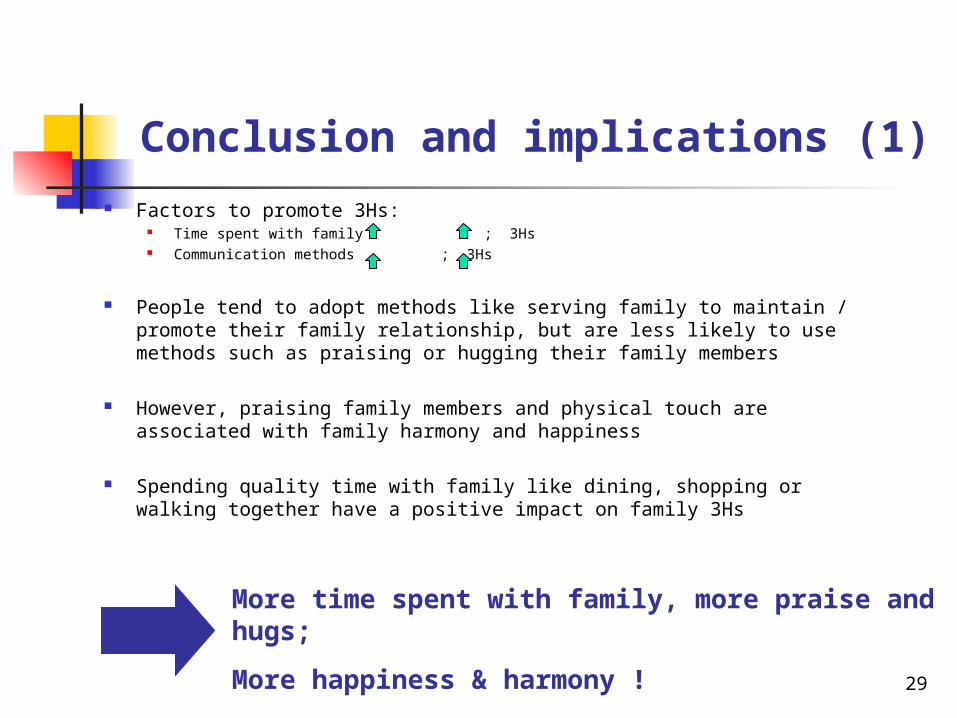
Conclusion and implications (1)
Factors to promote 3Hs: Time spent with family ; 3Hs Communication methods ; 3Hs
People tend to adopt methods like serving family to maintain / promote their family relationship, but are less likely to use methods such as praising or hugging their family members
However, praising family members and physical touch are associated with family harmony and happiness
Spending quality time with family like dining, shopping or walking together have a positive impact on family 3Hs
More time spent with family, more praise and hugs;
More happiness & harmony !29
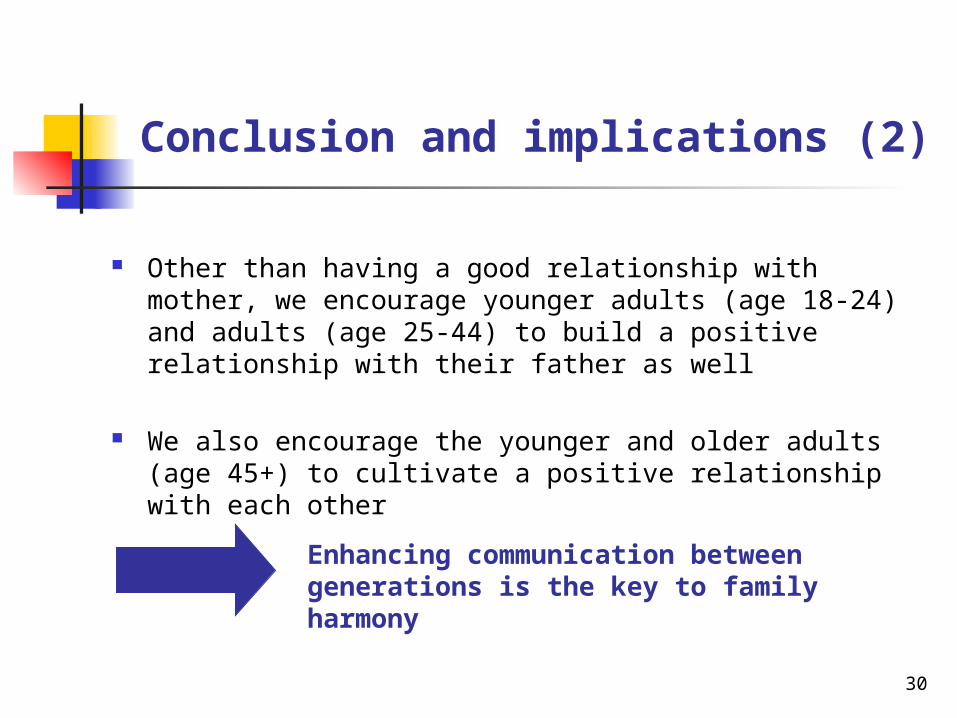
Conclusion and implications (2)
Other than having a good relationship with mother, we encourage younger adults (age 18-24) and adults (age 25-44) to build a positive relationship with their father as well
We also encourage the younger and older adults (age 45+) to cultivate a positive relationship with each other
Enhancing communication between generations is the key to family harmony
30
Acknowledgements
The 1,510 interviewees The Hong Kong Jockey Club Charities Trust The Public Opinion Programme,
The University of Hong Kong (HKU POP) HKJC Family Project Team members Dr. Vish Viswanath, Harvard School of Public Health
31
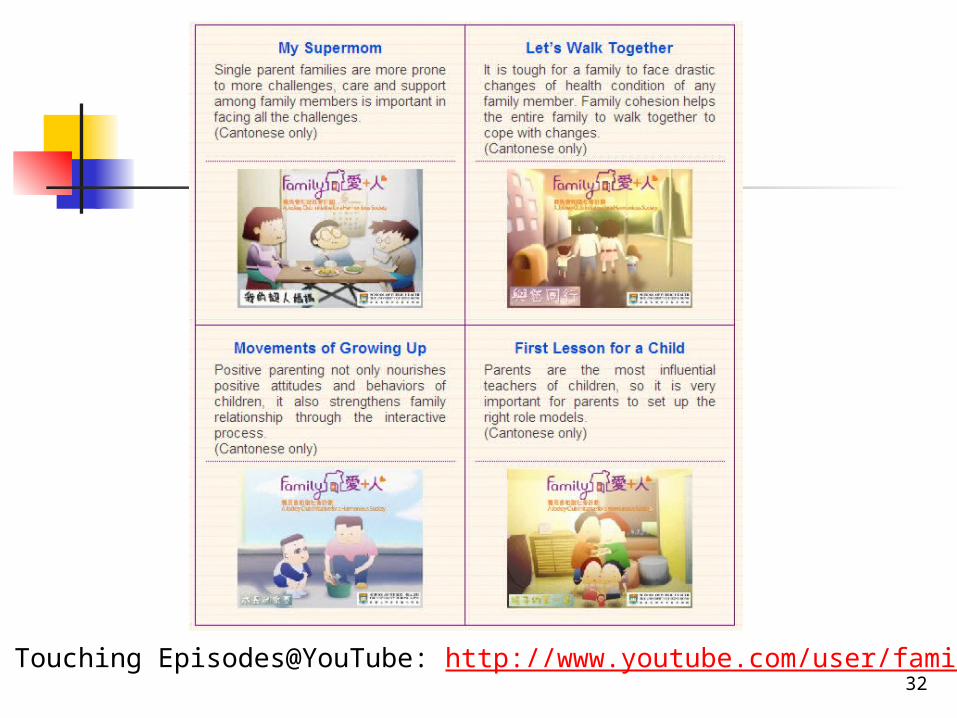
32Heart Touching Episodes@YouTube: http://www.youtube.com/user/familyhk3h
HAPPINESS( 快樂 )
HARMONY
( 和諧 )
HEALTH( 健康 )
- END - 33
FAMILY: A Jockey Club Initiative for a Harmonious Society
Website: http://www.family.org.hkHeart Touching Episodes@YouTube: http://www.youtube.com/user/familyhk3h