Embed Size (px)
Citation preview
Family Support Services in Michigan
Family Resources and Services Utilization
The Baseline on Family Support Services Evaluation Project
A Project of The Michigan
Developmental Disabilities Council
Conducted Jointly by
The Policy Studies Project The Service Research Unit
The College of Arts and Sciences Michigan Department of Mental Health
Western Michigan University Lansing, Michigan
Michigan
MDDC TEL : 1-517-334-7353 Apr 18,95 10:21 No.003 P.03
Family Support Services Family Resources
F A M I L Y R E S O U R C E S A N D S E R V I C E U T I L I Z A T I O N
The Michigan Developmental Disabilities Council funded the Baseline on Family Support Services III
Evaluation Project to assess the availability and accessibility of family support services In Michigan. One purpose of this study was to collect Information on family needs and community family support service networks that families use to meet these needs. This paper describes the needs of families and the service they used In nine community mental he alth catchment areas in Michigan.
Each family has internal resources (time, money, and people) that they use in rearing their children.
Much of the research on families or children with developmental disabilities has found that these resources may not be s ufficient to meet the care required by the children. Efforts to cope with the stress of a child's disabling conditions may threaten the family's Integrity, Interfere with the social and psychological growth of family members, restrict Individual family member's sense of personal freedom, and reduce the family's sense of control over the situation (1,2). One frequent result of these forms of stress is placement of the child outside of the home.
Research on families who place their children with disabilities outside their homes suggests that a family's decision to place or continue to raise their child Is determined by the complex Interaction of the child's characteristics, the social and psychological characteristics of the family, avalablllty of critical resources within the family, and the availability of social support systems and external resources (3 -8). This research has found that families are more likely to continue to raise their children when they do not perceive the burden of care as disruptive to f amily life; possess social support from extended social networks (kin, friends, neighbors, religious leaders, etc.) and social groups (church or place of worship, social dubs, block dubs, etc.); and have access to formal services and resources.
Families of children with developmental disabilities often need to access a diverse range of services
related to the physical care and education of their children. Much of the assistance familie s need cornea from formal family support programs. These programs include respite and child care , environmental adaptations, fa mily counseling, family support groups, parent training on behavior management and physical care. Information and referral s, in-home assistance (homemaker services, home health care, etc .). recreation, and resources to meet extraordinary needs (9). Fa milies also use traditional deve lopmental services for their children, case management and financial assis tance. For many families, however, the types and amounts of services available to them are Inadequate to prevent the erosion of Infra -family resources.
This paper presents findings on families' perceptions of the adequacy of their internal resource s (I.e. time, money, child care, basic survival resources). We examine how these perce ption differ for families based on services used, amounts of social supports, and characteristics of the family and their
WMU: Policy Studies Project 1 MDMH: Services Research Unit
Family Support Services Family Resources
child with developmental disabilities. Staffs perceptions of family resourced are also examined and
compared with family perceptions.
Method
The Baseline on Family Support III Evaluation collected Information through five major sources: a survey of community mental health (CMH) boards, Interview with families And family support program staff at multiple agencies In ten communities, a survey of these same staff, focus groups held with families In nine communities, and a mailed survey of a random sample of fa miles receiving the family support subsidy in the ten communities. This report draws primarily on data collected through the family and staff surveys and interviews. (See Appendix A for a summary of these procedures.)
As part of the family survey, families were asked about the services they had received, resources (ti me, money, energ y) required to meet the needs of their family and child With developmental disabilit ies. people and groups who helped th em (social support), and the characteristics of their family. Staff were asked to rate how adequately the "typical" family was meeting their own needs. Adequacy of resources
was measured with Dunst and Leefs Family Resource Scale (9,10) on both family and staff surveys. Social support was measured with Dunst, Trtvette, and Jenkins' Family Support Scale (10) only for families.
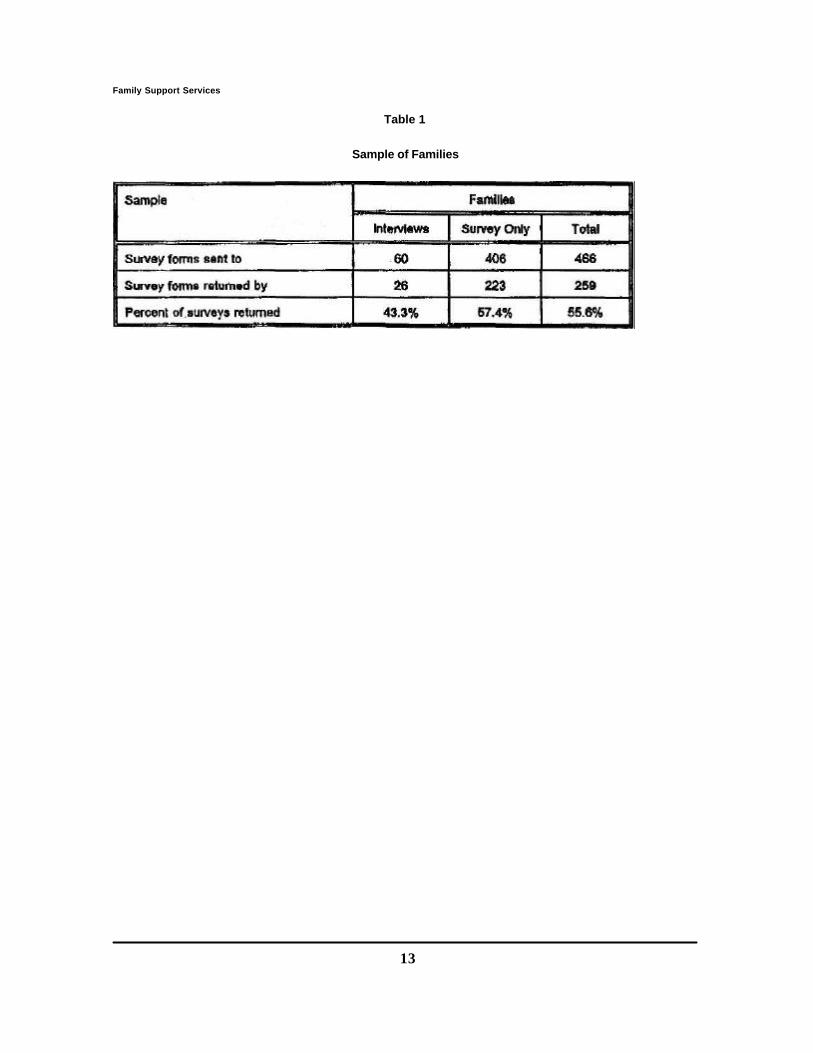
Sixty families were Interviewed or participated in the focus groups. Each of these families was asked to complete a survey as a follow -up on their participation these activities. Another 406 families enrolled in the Family Support Subsidy Program in the target communities were randomly selected and malted
surveys. Of this latter group, 223 families returned survey forms. A total of 259 surveys were received from all sources (Table 1).
Results
Family Characteristics
The majority of respondents were female (83.8%), e.g., mothers. Almost all were between the ages of 26 and 56 (90.7%) with 3.9% 2$ or younger and 2.7% over age 55. Almost half the respondents (47.1%) listed their occupation as homemaker. Family size ranged from 2 to 13 with the average family having 4.22 members (SD =1.48). Two parent families made up 71.8% of the responding families. The majority of families wore while (78.9%) with 13.9% havin g an African-American heritage, and 7.3% having other racial or ethnic heritages. The modal educational (aval for respondents was high school graduate or GED and one to three years of college for their spouses or partners. Families were distributed across Income categories: 25.1% with Incomes under $10,000; 18.1% between $10,000 and $19,999; 35.1% between $20,000 and $44,999; and 16.6% with Incomes of $45,000 or higher. 1
WMU: Policy Studies Project 2 MDMH:
Family Support Services Family Resources
Compared to Michigan households (see End Note 1), this group of families has more families at lower
Income levels and fewer families at higher Income levels than the general population. The distribution of responde nts ware similar in race/ethnic heritage and education level to all Michigan families,
of the children
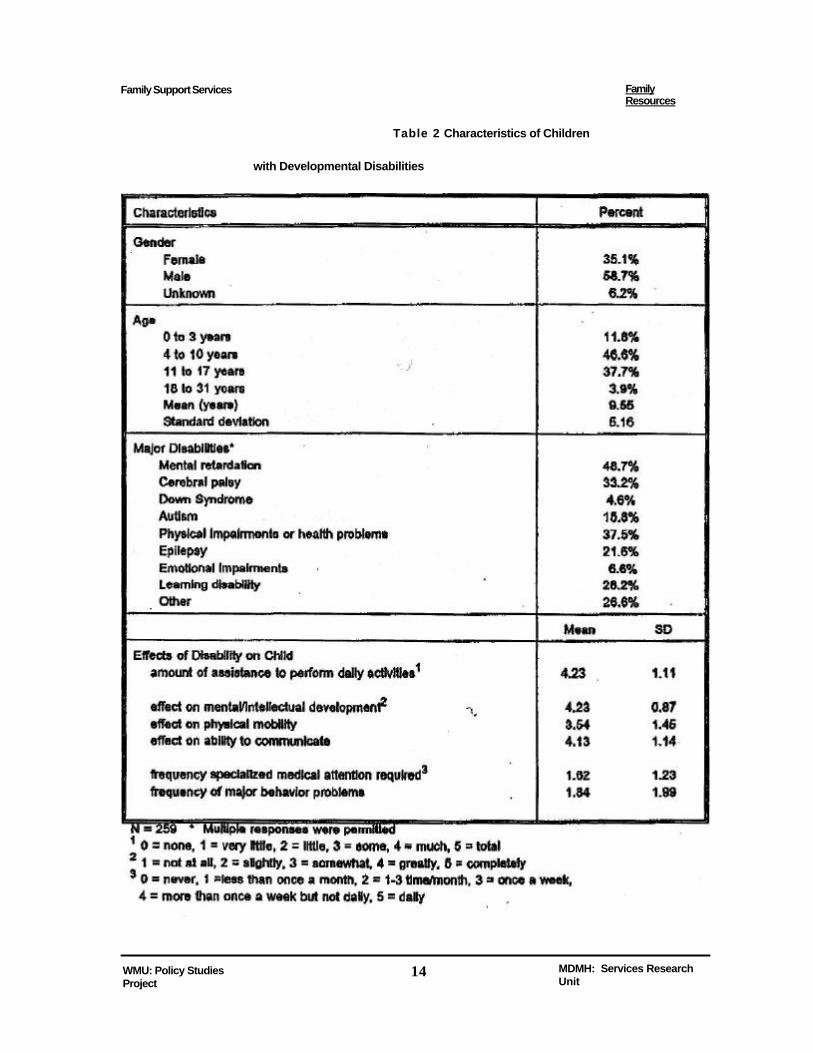
The children represented a mix of ages and disabilities (Table 2). More than half were male. The majority were under age 18 with a mean age of 9.6 years. Mental retardation was the moat frequently Identified disabling condition. Half the families Identified two or more conditions for their children. Families were asked to rate how much their children w ere affected by their disabilities (Table 2). The children were described as requiring much assistance to perform daily activities such as eating, dressing, bathing, and tooth brushing. Their mental or Intellectual development and ability to communicate we re rated as greatly affected by the disabilities while physical mobility was rated as somewhat to greatly impaired. Half the families Indicated that their children need specialized medical care or had major behavior problems more than once a month.
The child's level of disability has been found to be related to family perception of the burden of care, I.e., whether or not family resources are adequate to raise a child with disabilities. Three disability ratings (amount of assistance to perform daily activities, frequency of specialized medical attention, and frequency of major behavior problems) were summed to provide an Index of disability severity. The Index
ranged from 1 to 15 with a mean of 7.70 (SD = 2.82). Three disability groups were defined using the Index: low (17.4% of the children), medium (69.2%), and high (13.4%). 2
Formal Services and Supports
Services used. Families were provided a list of 28 services and asked to Indicate all that they had
used In the last year . Table 3 presents the percentage of families who Indicated using each service. The Family Support Subsidy was the most frequently used service. This reflects, In part, the source from which families were selected. Beyond the subsidy, sitters were the most frequently used services, followed by respite care, and adaptive equipment Less than a third of families Indicated using any of the other services.
On average, families used 5.32 services (8D = 3.40, range 0 to 18) with 12% using one service and 10% using 10 or more services. This suggests that some families received nothing beyond the subsidy while others had accessed relatively more services. The services were grouped Into four types: respite (5 services), professional (7 services), special needs related (13 services), and financial (2 services)3. Families used, on average, 1.24 respite services (SD = .03), 1.26 professional services (SD = 1.44), 2.15 special need services (SD - 1.96), and 0.86 financial services (SO = .37).
WMU: Policy Studies Project 3 MDMH: Services Research Unit
Family Support Services Family Resource
When families were asked which service was most Important to them, 47.5% picked the family support subsidy and 13.9% selected respite care, less than 5% selected any of the other services. Famines ware also asked to Indicate which service they used the most. They said that the family support subsidy was the most often used service (34.7%), followed by sitters 4(15.8%), and respite care (12.4%). The remaining services were selected by less than 5% of the families as the one they used most often.
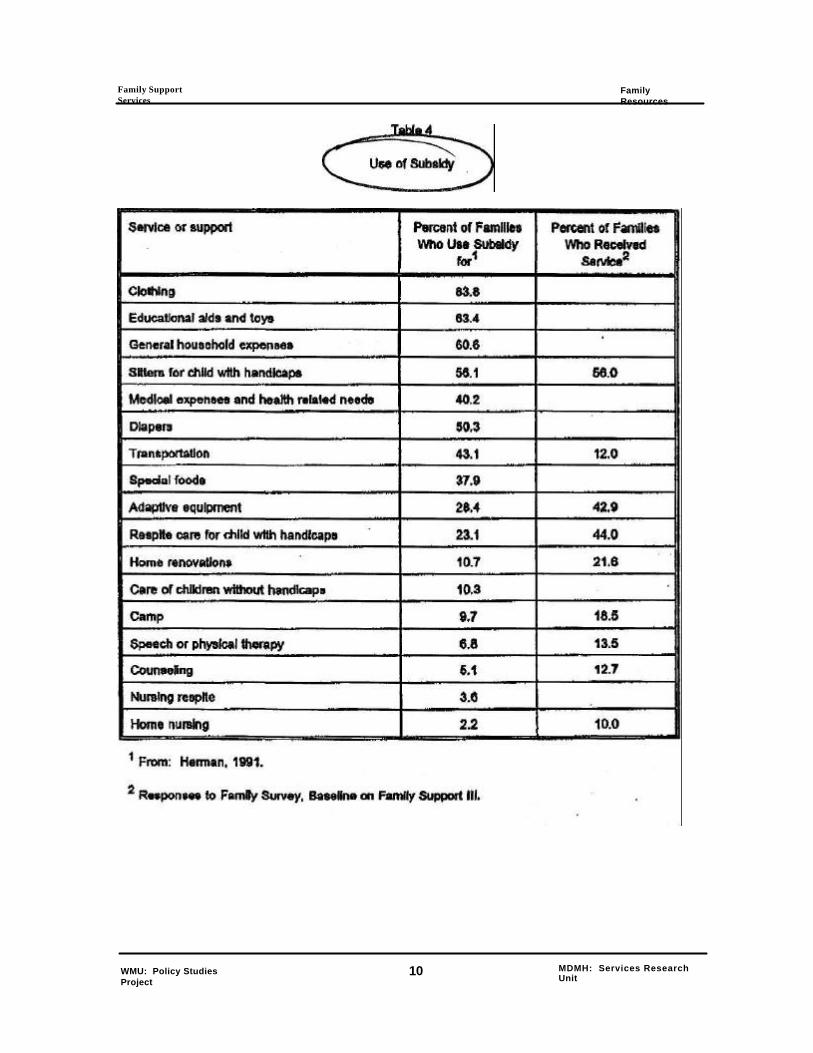
Families use the family support subsidy f or a variety of supports and services purchased Independently of formal programs (11). Among the uses for the subsidy are the purchase of clothing, educational aids and toys, sitters, diapers, respite care, and adaptive equipment (Table 4). Families also use the subsidy to pay general household expenses, medical expenses, and transportation costs. Families use of the subsidy also is compared with the types of services received In Table 4. Families use the subsidy to purchase a variety of services, supports, and supplies that formal programs do not address.
Fewer families purchase services or supports that formal programs do provide. This suggests that families can and will direct resources from a variety of sources to solutions of problems.
Community agencies. Families must go to a variety of agencies In order to get the services they and their children require. Families were given a list of 10 agencies or places where they may have gone for services (Table 5) and asked to Indicate how often in the last year they had gone to each. The school, community mental health, and Children's Special Health Care Services (Pubic Health) were used by over half of the families. The school was selected as the agency used the most by families. Families had three to six contac ts a year with the school. Families were not, however, in contact with only a single agency. Families Interacted with an average of 2.47 agencies (SD = 1.80) with half the families using three to seven agencies.
This provides only a limited picture of fami ly interactions with the community network of services and agencies. Families who were Interviewed or participate In the focus groups provided much more detailed histories of their Interactions with human service systems going back a number of years. Table 6 presents a summary of the sources of supports and services with whom families had contact during their chad's fife time. 5 Private health care providers (Le., physicians, clinics, hospitals, etc.) were nearly a third of all contacts. Schools and mental h ealth agencies were the next most frequent agencies from which families sought help. Examples of the variety and mix of services and providers used by families are presented In Figures 1 and 2, Each figure presents the path one family of a five year old ch ild with cerebral palsy took through their local service systems. The family experience described In Figure 1 is relatively simple with only 11 initial contacts within their child's five year life. (Where two numbers occur within the same agency, the famil y contacted or was referred to two different programs within the agency.) The second family's experience (Figure 2) to very different This family had a very complicated set of interactions with 37 contacts within five years). This family has clearly had mo re difficulty in finding the services they required as evidenced by the repeated contact with agencies and the Jumps back and
WMU: Policy Studies Protect 4 MDMH: Services Research Unit
Family Support Services Family Resources
forth among agencies. These two families were not isolated examples. Figure 3 displays the number of
Interactions for the 60 families who completed life histories with us. Half the families had contacted more
than 20 agencies over the course of their child's life.
Family Resources
Impact of the disability on the family. Raising a child with disabilities can have positive and negative
consequences for families. As part of our interviews, we asked families about how having a child with a
disability had affected their family. Table 7 summaries their responses. Almost a quarter of the responses
Identified limits on normal family life, e.g., can't do things as a family or do things spontaneously, etc. Lost
opportunities for jobs and education and financial stress were another frequently identified Impact Divorce,
spousal conflict*, and problems for siblings were mentioned along with a number of problems for the
primary caregiver which were related to the burden of caring for the child with disabilities, Despite all the
problems, many families also identified positive effects that they had experienced because of their child.
Social supports. Social supports are an Important family resource that can buffer a family from the
negative effects of the daily stresses associated with the Intense care required by children with disabilities.
In Interviews, we asked families, who helps. Families reported that Immediate and extended family
members and friends and neighbors helped and did not help them (Table 8). A few families cited formal
support groups as a source of help. For the most part families relied on their informal networks of family and
friends for help. Some families will make use of formal support groups when these are available. However,
such groups are not readily available In most communities (12).
In the family survey, we also asked families to rate the helpfulness of various people or groups who
might provide social support These sources of social support were grouped into three categories: Informal,
formal, and spouse. informal soda) supports included Immediate family (the respondent's children,
parents, and her relatives), friendship networks (friends, neighbors, and coworkers) and other members of
a personal social support network (religious leader, physician, social club, or other parents). Formal social
supports Included day care center, formal parent groups, and school. Spouse support Included spouse or
partner, spouse's parent and relative. Family respondents" ratings of the helpfulness of these people are
presented In Table 9. Only three of these sources of support were seen as generally helpful. The school
was seen as the most helpful followed by a spouse/partner and the family physician. Other children In the
family, friends, and grandparents were rated as only sometimes helpful.
adequacy of resources. Family perception of their Internal resources has bean shown to be
related to their ability to continue to care for a child with disability. We asked families to assess the
adequacy of specific resources on a five point scale: (1) not at ail adequate, (2) seldom adequate, (3)
sometimes adequate, (4) usually adequate, (6) almost always adequate. As the selected resources are
WMU: Policy Studies Project 5 MDMH: Services Research Unit
Family Support Services . Family Resources
the minimal associated with healthy family functioning, a score of less than 4, usually adequate, can be
interpreted to indicate resource levels Inadequate to sustain the family. We have selected a score of 4 as the criterion level for adequacy of family resourced, 6 A factor analysis of Item responses was used to determine the grouping of the items into these four scales: basic resources, time resources, financial resources, and child resources. 7 Staff were asked to complete the same items for "a typical family* in their famiy support program.
Basic survival resources Included heat, water/plumbing, furniture, housing, food, telephone, money to pay bills, money to buy necessities, clothes, medical cars. Families Indicated that basic survival resources were usually adequate to meet the needs of their family and child with developmental disabilities (Table 10 and Figure 4). Two basic Kerns were rated as less than usually adequate: money to pay bills a nd money to buy necessities. Staff rated the typical family's basic survival resources as less adequate than families rated themselves on all items. Differences between mean family and staff ratings were statistically significant for all items and for the overall scale score.
Time resources included items about the time the respondent had for herself to socialize, be with her other children, spouse, or friends. The time scale also included items about her time to do things for herself such as sleep, keep In shape, or be by herself. Time resources (Table 11 and Figure 4) were rated as only
sometimes adequate, More than half of the families rated time to socialize, time to be by yourself, time to be with close friends, and time to keep In shape as seldom or no t adequate. Nearly half rated time to with your spouse as seldom to not adequate. Staff rating for time resources were similar to family ratings. Families and staff ratings differed significantly on only two times: time to be with your children; adequacy of public assistance. Staff rated both Items as less adequate than families did,
Financial resource beyond basic survival are another critical element to a functioning family unit. The financial resources scale assessed the respondent's perception of the adequacy of her family's financial situation beyond the provision of basic survival resources. Items In this scale asked about money to save, money for travel or vacations, entertainment, and for buying things for herself. Dependable transportation, dental care, and a good Job were other Hems In this scale. Families rated all the financial resources Kerns (Table 12 and Figure 4) except for dependable transportation below the criterion level. Two-thirds rated 'money to save" and time and money for travel/vacation' as seldom adequate or not adequate. Staff and families differed significantly In their ratings for three Items: dependable transportation, dental care, and good Job. In each case, staff rated these resources as less adequate than families. Staff also differed significantly on the overall scale score.
The final set of resources, we asked families about, were those directly related to the care of their children (Table 13 end Figure 4). The child-related resource scale included Items about the adequacy of money to buy special equipment or supplies, baby sitting, day care, and toys for her children. Families rated these resource items below the criterion level. Day care and baby sitting were rated as seldom to sometimes adequate. Money for specia l equipment or supplies was rated as
WMU; Policy Studies Project
6 MDMH: Services Research Unit
Family Support Services Family Resources
sometimes adequate. Only toys for their children was rated as usually or always adequate by a majority of
families. Staff rated all the child-related resource items as less adequate than families. Staff ratings
differed significantly from family ratings on money to buy special equipment, toys for your children, and on
the overall scale score.
Family characteristics and perception of resources
Family perceptions of resource adequacy was further examined to determine If specific family
characteristics could be used to define those most at risk. Families were grouped based on Income level
(below $20,000, above $20,000), disability level of their child (low, medium, high), levels of informal,
formal, and spouse social support (low, medium, high8).
of families. Scores on the resource scales for families grouped by income, disability
level, and social support levels are presented in Table 14. Significant differences were found In the
perceptions of the adequacy of basic resources for families grouped by Income level (Figure 5), disability
level (Figure 6), and level of spouse social support (Figure 7).° For the adequacy of time resources,
differences were found for families grouped on disability level (Figure 6), Informal social support level
(Figure 8), and spouse social support level (Figure 7).10 Differences In the adequacy of financial resources
were found for families grouped on income (Figure 5), disability level (Figure 6), and spouse social support
level (Figure 7). Family perception of the adequacy of child-related resources differed by Income level
(Figure 6), disability level (Figure 6), and all types of social support {Figures 7 to 8).1Z
Relationship of family characteristics with resource adequacy. Multiple characteristics of
families are related to their perceptions of resource adequacy. Some combinations of these
characteristics are more likely to be associated with the perceived level of resource adequacy than other
combinations. Multiple regression is a technique that allows statistical relationships among variables to be
predicted and can be used to identify the combination or family characteristics most strongly related to each
measure of resource adequacy. Table 15 presents the results of multiple regression analyses for the four
resource scales. Variables used in the regression analysis were: Income group(< $20,000, >$ 20,000),
Disability Level (Index score 1 to 16), Informal Social Support Score, Formal Social Support Score,
Spouse Social Support Score, number respite services used, number professional services used, and
number special need services used.
Perception of basic resource adequacy was best predicted by income group, disability level, and
spouse social support. Perception of time resources was best predicated by the chad's disability level and
the amount of Informal social support available to the parent Families' perceptions of financial resources
were predicted by Income group, disability level, and formal social support. Child related resource
adequacy was predicted by amount of Informal social support, the child's disability level, and the amount of
formal social support.
WMU: Policy Studies Project 7 MDMH: Services Research Unit
Family Support Services Family Resources
The pattern of variables related to perception of resource adequacy Indicates that the child's disability level and family Income are key to families 1 perceptions of resource adequacy. This Is reinforced by the strong correlation (0.60) between the presence of a spouse and higher family Income levels. The child's level of disability was related to perceptions of the adequacy of all four types of resources. Income level was related to three types of resources, basic survival, financial, and child related. Some form of social support was related to the perception of the adequacy of each type of resource. Spouse social support was related to the adequacy of basic resources, informal soclal support was related to the adequacy of time and child related resources. Formal social support was related to the adequacy of financial and child related resources.
Conclusions
Families reported using few external services to supplement their Infra -family resources. Of those
they do use, the family support subsidy and respite care were viewed as the most Important Yet neither program has been sufficient to result in famines perceiving their time or financial resources as adequate. Families also Interact with multiple agencies. These multiple Interactions make demands on families time resources and effectively reduce the time families have for activities not related to the child's disability.
The results of this study Indicate that families have limited social support networks. O ver all, the perceived helpfulness of people In their support networks Is low. Their ratings suggest that many families are isolated from social networks and have few existing people resources to call on in support of healthy family functioning. The lack of these supports places them at risk for serious dysfunction and out -of-home placement of their children,
Families perceive thei r time, financial, and child-related resources to be less than adequate . Time resources were rated as the least adequate of all resources. The items included In the time resource scale are those associated with Individual family member's opportunities to rest and "recharge". Lack of adequate time resources contribute to individual family member bum out and the Inability of the fami ly unit to remain intact The ratings suggest tha t famines had few resources beyond those necessary for basic survival.
Although 85% of the families were receiving financial supports from the family support subsidy or through the adoption subsidy, their financial resources were limited. Taken together, the resource picture for thes e families is meager . While they may have sufficient basic resources to survive, their time, financial, and child -caring resources are not adequate. This places them at risk for family dysfunction and ultimately for dissolution of the family unit. Families' limited resources can be expected to continue to erode overtime unless there Is on going social and instrumental support This erosion increases their risk for serious dysfunction and the need for more extensive and Intensive Interventions in the future. Family support programs are uniquely position to be able to prevent this erosion and subsequent application of more costly interventions.
WMU: Policy Studies Project 8 MDMH: Services Research Unit
Family Support Services Family Resources
Staff perceived families' resource situations to be worse than families reported. There are several
possible explanation for this finding. Staff will be moat sensitive to the families with the greatest needs and
fewest resources. This may lead to a downward biasing of staff's responses. Alternatively, famines'
perceptions may be biased upwards reflecting their footings of success at coping with difficult situations
and multiple demands or reflecting denial of the situation. The discrepancy between family and staff
ratings also suggests that the full range of family situations may not be represented within the group of
responding families. This difference in perceptions signals a need for staff and families to work together to
identify challenges to the family's resource situation and achieve a common understanding of the family's
situation. It also suggest that staff should work with families to identify the strengths and gaps in a variety of
resource domains and then Jointly determining with families how to build on strengths to fill the gaps. To do
this may require parenting training or coaching, providing peer support and socialization options, engaging
extended kinship and frie ndship networks In the problem solving, or what ever else is required to maintain
or achieve a healthy family.
When families are grouped by characteristic, the importance of social support to the adequacy of
family resources is evident. Respondents who had low levels of spouse social support rate their basic,
financial and child resources as less adequate than families with medium or high levels of spouse social
support. Clearly, single parent famines of children with disabilities sea their resource base as less than
adequate which places them at risk for major family dysfunction and out-of-horne placement. The level of
spouse support Is also linked to how adequate the respondents saw their time resources. Respondents
with high level of spouse support saw their time resources as significantly more adequate than other other
group and respondents with medium level of spouse support rated their time resources as more adequate
than those with low levels of spouse support A strong source of social support within the family of origin
of a child with disabilities contributes to the perception of resource adequacy, Formal programs, however,
rarely address the problem of lack of Internal social support or attempt to help families create alternative
sources of such support when their is no spouse. This argues for a stronger focus on natural support
networks and the creation of "family circles of supports" for those families whose natural networks are
limited or unable to provide the needed social support This also argues for an ecological view of the
family.
Levels of Informal social supports were also related to the perception of resource adequacy. There
were significant differences among families at each level of Informal social support In terms of time
resources. Families at lower level of social support saw their time resources as less adequate. These
families also saw their child-related resources as lees adequate than families with higher levels of Informal
support. Again, It Is clear, that having someone to provide support and help will affect how resources are
viewed and ultimately a family's belief In their ability to care for their child with disabilities.
Families with lower income levels were likely to view their basic survival, financial, and child related
resources as less adequate than families with higher levels of Income. The relatively large differences
WMU: Policy Studies Project 9 MDMH: Services Research Unit
Family Support Sen/ lues Family Resources
between Income groups on each resource scale suggest that, even for families with supplemental Income
sources, such as the family support subsidy, the amount of money they can access falls short of what is
necessary for them to care tor their children. Such inadequacies will increase the pressure families
experience internally to reduce the demand on their resources by seeking out-of -home placement. Families of children with high levels of disability saw their basic and time resources as lose
adequate than families at either low or medium levels of disability. Families of children with high or
medium levels of disability viewed their financial and child-related resources as less adequate than
families whose children were at the low level of disability. The level of care required is known to increases
as the complexity or severity of the child's disability Increases. Here families are Indicating that as the
level of cars increase, the drain on resources is sufficient to result In a perception of resource
Inadequacy, Such perceptions again place a family at risk for dysfunction or dissolution.
The regression analyses Indicated that as the severity and complexity of the child's disability
Increase, the family will perceive all resources as less adequate. However, these perceptions are
amenable to change. Family Income levels should be high enough to obtain a comfortable existence and
cover the extra medical, physical care, and educational cost that result from the child's disability. The
appropriate level of Income must be a family decision. Family support programs should work with family
members to create a family situation that permits this to be achieved. The analyses suggest that the
sense of support that comes from spouse, Informal networks, or formal programs will have more effect on
family views than the number of services directed at them. Family support programs should work with
family as a unit on Intra- famlly dynamics 1o assist them to achieve a sense of mutual support among
immediate family members. This is a particularly tough challenge for single parent families where other
sources of support will need to be substituted. Family support programs will also need to work with
families around building Informal support networks, family circles of support, that can assist with child
care and offer friendships. Finally, formal services must be provided in a manner that to perceived as
helpful and that does not erode other family resources such as Income (dus to cott of respite or other
services) or time (due to a lengthy process of finding and qualifying).
Overall, (Ms look at family resources argues for the use of family centered programs that provide
levels of intervention that maximizes positive family functioning. To do so, those who work with families
will need to focus on diagnosing support needs. This will require better format assessments of family
resources and supports. There will need to be differential distribution of support* that matches levels of
supports to family situations. Family support programs should Incorporate the "circle of support* concept
and engage secondary personal and community systems In the care of children with severe disabilities.
Additionally, the array and absolute amount of reso urces available must be increased. To accomplish
this, mental health systems will need to work on resource Identification within their own and other public
systems as well as within private and community networks. To achieve this enhancement of resources,
case managers and family advocates will require additional skills that allow them to affectively organize
WMU: Policy Studies Project 10 MDMH:
Family Support Services Family Resources
their communities In support of families including emgaging employers and the business community In
support of families.
References
1. Cola. D.A. (1986). Out-of-home child placement and family adaptation: A theoretical framework. American Journal of, Menial Deficiency, 91,226-236.
2. Colo, DA & Meyer, LH. (1989). Impact of needs and resources on family plans to seek out-of-home placement American Journal on Mental Retardation 93,380-387.
3. Bromley, B. ft Blacher, J. (1989). Factors delaying out-of-home placement of children with severe. handicaps. American Journal on Mental Retardation. 04.264-291.
4. Bromley, B.E., & Blacher, J. (1991). Parental reasons for out-of-home placement of children with severe handicaps. Mental Retardation. 29, 275-280.
5. Kobe, F.H., Rojahn, J., Schroeder, S. R. (1991). Predictors of urgency of out-of-home placement need* Mental Retardation. 29, 323-328.
6. Rouaey, A.B., Blachar, J.B.. & Hanneman, RA (1990). Predictions of out-of-home placement of ' children with severe handicaps: A cross sectional analysis. American Journal on Mental
Retardation. 94,522-531.
7. Mlnnes, P.M. (1988). Family resources and stress associated with have a mentally retarded child.
8. Sherman, B.K (1988). Predictors of the decision to place developmentally disabled family members in residential care American Journal on Mental Retardation. 92,344-361.
9. Dunst, C, Lest, H. (1987). Measuring the adequacy of resources In household with young children. Child: Care Health and Development 13, 111-125
10. Dunst, C, Trivette, C, & Deal, A. (1966). Enabllnq and empowering families: Principles and guidelines for practice. Cambridge, MA: Brookline.
11. Herman, 8.E. (1991). Use and impact of a cash subsidy program, Mental Retardation. 29, 253- 268.
12. Herman, S.E., Hazel, K,H.. Thompson, T.I., & Linklater, A. (1992) Family support services in Michigan: Community mental health family support programs Lansing, Ml: Michigan Developmental Disabilities Council.
End Notes
1 A similar distribution of Income levels for all Michigan households In 1990 is: 15.6% under $10,000; 25% between 110,000 and $24,999; 34.0% between $25,000 and 49.899; and 25% above
WMU: Policy Studies Project 11 MDMH: Services Research Unit
Family Support Services ________________________________________________ Family Resources
$50,000. Racial/ethnic group membership In Michigan's population is: 85.4% white, 13.3% African-American, 13% other. 67.9% of Michigan's adult population graduated high school or have a GED. Among Michigan's women, 44.3% of women age 18 or older are not In the labor force.
2 Low, greater than one standard deviation below the moan {scores 1 to 5); medium, plus or minus one standard deviation about the mean (scorea 6 to 10); and high, more than one standard deviation above the mean {scores 11 to 16).
Respite Services: sitters, respite cam, day care, latch rare, In-home help with household chores or physical care. Professional services: counseling, case management, assessment, in-home physical therapy. In-home occupational therapy. In-home nursing. Information. Special needs services: support groups, parent-to-parent networks, training on physical care of child, training on how to teach child basic skids, training on managing behavior problems, parent education, adaptive equipment, homa modifications, modifications to car/van, Me planning, guardianship, recreation, transportation. Financial supports : family support subsidy, adoption subsidy.
4 Sitters could be used for any purpose. Le., as respite car* or as day care for working parents.
Only initial contacts or re-contacts were counted. I.e.. routine visits over extended time periods or continuing care visits were not Included In (has* counts.
8 In Dimst and Leef a validation study of this scale (9) with mothers of children with developmental disabilities, the mean score across all Items was 3.86 with a 0.6 SD.
7 Cronbach's alphae for families were: basic needs scale 0.92; time needs seal* 0.84; financial needs scale 0.85; child-related needs scale 0.60. Cronbach's alphas for staff were: basic needs scales 0.94; time need scale 0.94; financial needs scale 0.02; child-related need scales 0.77.
8 For informal, formal, and spouse social support scales, score less than or equal to 1.6 were labeled low; scores greater than 16 and teas than or equal to 3.8 were labeled medium; scores greater than 3.5 were labeled as high.
9 Income F(1,241)=31.12, p < .001; Disability Level F(1,246)=5.18, p < .01; Spouse Social Support Level F(2,23»)*6.21, p < .01; Interactions ns.
10 Disability Level F(2,247)si3.62,p<< .001; Informal Social Support Level F(2,22*)=s5,72 f p < .01; Spouse Social Support Level F(2,239}=S.64, p < .001; Interactions ns.
11 lncomeF<1,238)=27.26,p<.001; Disability Level F(2.246)=7.96, p < .001; Spouse Social Support F(2,238)=7.65, p < .001; Interactions ns,
12 Income F(1,237)=1S.27,p< .001; Disability Level F(2.10.24)=4. W, p<.06; Informal Social Support F(2,22&>8.28, p <.001; Formal Social Support F(2.233)=4.16, p «.O5; Spouse Social Support F(2,236)=7.39, p <.001; Interactions ns.
13 Multiple regression equations were examined for multi-collinearity, influential cases, non- Uneatfiy, and non-constant error varience. Variance inflation factors ranged from 1.009 to 1,666 for variable entered Into the solution. Cook's D values ranged from 0.0 to .1768. Scatterplote of predicted values with residual values and partial regression plots did not suggest serious violation of the assumptions of linearity and homogeneity of variance.
12 MDMH: Services Research Unit
Family Support Services
Table 1
Sample of Families
13
Family Support Services Family Resources
Table 2 Characteristics of Children
with Developmental Disabilities
WMU: Policy Studies Project
14 MDMH: Services Research Unit
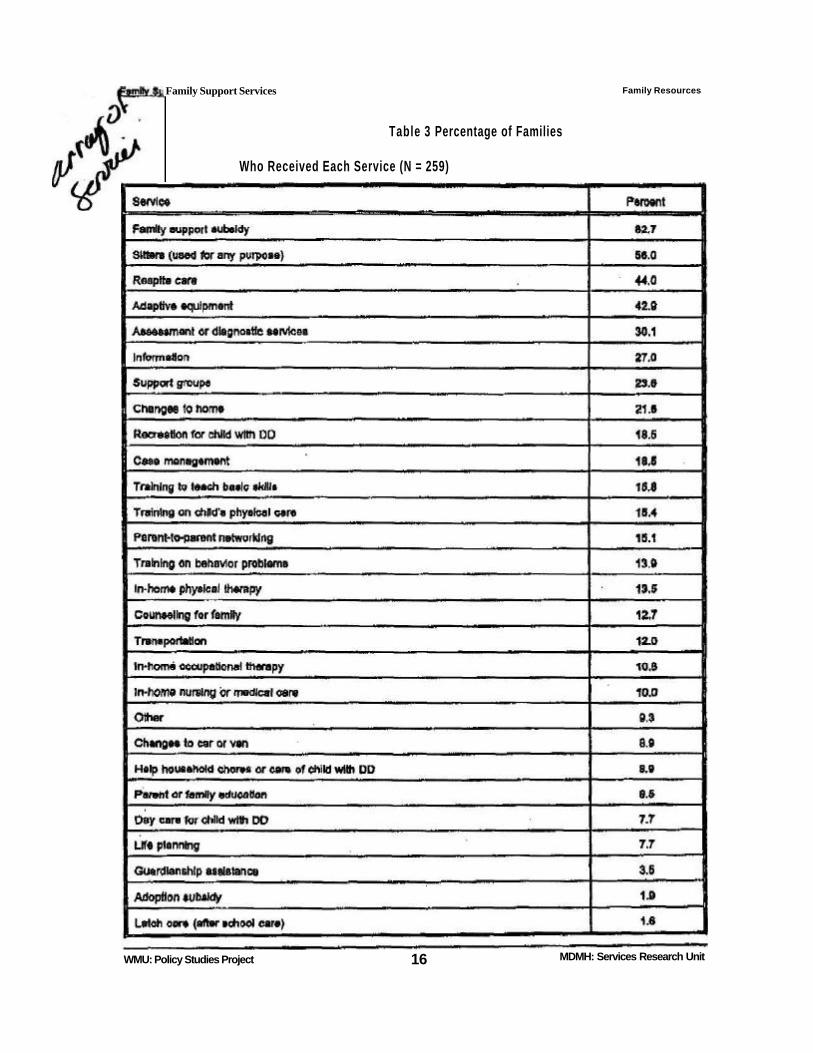
Table 3 Percentage of Families
Who Received Each Service (N = 259)
Family Resources
WMU: Policy Studies Project 16 MDMH: Services Research Unit
Family Support Services
Family Support Services
Family Resources
WMU: Policy Studies Project
10 MDMH: Services Research Unit