Embed Size (px)
Citation preview
Delhi
National Family Health 2005-06Survey (NFHS-3)India
Technical assistance for NFHS-3 was provided by Macro International and assistance for the HIV component was provided by NACO and NARI.
Funding assistance was provided by:
The opinions expressed in this publication do not necessarily reflect the views of the funding agencies.
For additional information on NFHS-3, visit www.nfhsindia.org. For related information, visit www.iipsindia.org or www.mohfw.nic.in.
International Institute for Population SciencesDeonar, Mumbai - 400 088
Ministry of Health andFamily Welfare
Government of India
NFH
S-3N
ational Family H
ealth SurveyD
elhi2005-06
Delhi_Cover.indd 1 03/04/09 4:49 PM
NATIONAL FAMILY HEALTH SURVEY (NFHS-3)
INDIA
2005-06
Delhi
February 2009
Delhi.indd 1 3/19/09 12:50:36 PM
Suggested citation: International Institute for Population Sciences (IIPS) and Macro International. 2009. National Family Health Survey (NFHS-3), India, 2005-06: Delhi. Mumbai: IIPS.
For additional information about the 2005-06 National Family Health Survey (NFHS-3), please contact: International Institute for Population Sciences (IIPS), Govandi Station Road, Deonar, Mumbai - 400 088 Telephone: 022-2556-4883, 022-2558-3778 Fax: 022-2558-3778 E-mail: [email protected], [email protected]: http://www.nfhsindia.org
For related information, visit http://www.iipsindia.org or http://www.mohfw.nic.in
Delhi.indd 2 3/19/09 12:50:36 PM
CONTRIBUTORS
Kamla Gupta Fred Arnold
Bhawna Malik
Delhi.indd 3 3/19/09 12:50:37 PM
Delhi.indd 4 3/19/09 12:50:37 PM
CONTENTS
Page
KEY FINDINGS .............................................................................................................. 1
TABLES
Table 1 Results of the household and individual interviews .................................................... 27 Table 2 Household population by age, education, sex, and residence .................................... 28 Table 3 Housing characteristics ..................................................................................................... 30 Table 4 Household possessions, ownership of agricultural land, and wealth index ............................................................................................................... 32 Table 5 Religion and caste/tribe by wealth index ....................................................................... 33 Table 6 School attendance .............................................................................................................. 33 Table 7 Children's living arrangements and orphanhood ........................................................ 34 Table 8 Birth registration of children under age five ................................................................. 35 Table 9 Children’s work.................................................................................................................. 36 Table 10 Background characteristics of respondents ................................................................... 37 Table 11 Current fertility .................................................................................................................. 38 Table 12 Fertility by background characteristics .......................................................................... 39Table 13 Teenage pregnancy and motherhood ............................................................................. 40 Table 14 Birth order .......................................................................................................................... 41 Table 15 Birth intervals ..................................................................................................................... 42 Table 16 Fertility preferences by number of living children ...................................................... 43 Table 17 Desire to limit childbearing ............................................................................................. 44 Table 18 Ideal number of children .................................................................................................. 45 Table 19 Indicators of sex preference ............................................................................................. 46 Table 20 Knowledge of contraceptive methods ........................................................................... .47 Table 21 Current use of contraception by background characteristics ..................................... 48 Table 22 Contraceptive use by men with last partner ................................................................. 50 Table 23 Use of social marketing brand pills and condoms ....................................................... 51 Table 24 Source of modern contraceptive methods ..................................................................... 52 Table 25 Informed choice ................................................................................................................. 54 Table 26 First-year contraceptive discontinuation rates .............................................................. 54 Table 27 Men’s contraception-related perceptions and knowledge........................................... 55 Table 28 Need for family planning among currently married women ..................................... 56 Table 29 Age at first marriage ......................................................................................................... 57 Table 30 Early childhood mortality rates ...................................................................................... 58 Table 31 Early childhood mortality rates by background characteristics ................................. 59 Table 32 High-risk fertility behaviour ............................................................................................ 60
Delhi.indd 5 3/19/09 12:50:37 PM
Page
Table 33 Antenatal care .................................................................................................................... 61 Table 34 Antenatal care services and information received ....................................................... 62 Table 35 Antenatal care indicators ................................................................................................. 63 Table 36 Pregnancies for which an ultrasound was done ........................................................... 64 Table 37 Delivery and postnatal care ............................................................................................. 65 Table 38 Delivery and postnatal care by background characteristics ....................................... 66 Table 39 Trends in maternal care indicators ................................................................................. 67 Table 40 Male involvement in maternal care: Men’s report ....................................................... 68 Table 41 Vaccinations by background characteristics ................................................................. 69 Table 42 Prevalence and treatment of symptoms of ARI and fever .......................................... 70 Table 43 Prevalence and treatment of diarrhoea........................................................................... 71 Table 44 Feeding practices during diarrhoea ................................................................................ 72Table 45 Knowledge of ORS packets .............................................................................................. 73 Table 46 ICDS coverage and utilization of ICDS services ........................................................... 74 Table 47 Utilization of ICDS services during pregnancy and while breastfeeding ..................................................................................................................... 76 Table 48 Nutritional status of children .......................................................................................... 77 Table 49 Initial breastfeeding ......................................................................................................... .79 Table 50 Breastfeeding status by age .............................................................................................. 80 Table 51 Median duration of breastfeeding and infant and young child feeding (IYCF) practices ......................................................................................... 81 Table 52 Prevalence of anaemia in children .................................................................................. 83 Table 53 Micronutrient intake among children ............................................................................. 84 Table 54 Presence of iodized salt in household ............................................................................ 86Table 55 Women’s and men’s food consumption......................................................................... 87 Table 56 Nutritional status of adults .............................................................................................. 88 Table 57 Prevalence of anaemia in adults ...................................................................................... 89 Table 58 Knowledge of HIV/AIDS and its prevention ................................................................. 90 Table 59 Accepting attitudes toward those living with HIV/AIDS ............................................ 92 Table 60 Sexual behaviour, blood transfusion, and injections ................................................... 94 Table 61 Knowledge of AIDS and sexual behaviour: Youth ...................................................... 95 Table 62 Attitudes toward family life education in school ......................................................... 96 Table 63 Prevalence of tuberculosis ............................................................................................... 97 Table 64 Knowledge and attitude toward tuberculosis .............................................................. 99 Table 65 Health problems .............................................................................................................. 100 Table 66 Tobacco and alcohol use by women and men ............................................................ 101 Table 67 Source of health care ........................................................................................................ 102 Table 68 Employment and cash earnings of currently married women and men............................................................................................................................. 103 Table 69 Control over and magnitude of cash earnings............................................................. 104 Table 70 Decision making ............................................................................................................... 105 Table 71 Decision making by background characteristics ......................................................... 106 Table 72 Women’s access to money and credit .......................................................................... 107 Table 73 Gender-role attitudes....................................................................................................... 108
Delhi.indd 6 3/19/09 12:50:37 PM
Page
Table 74 Gender-role attitudes by background characteristics ................................................. 109 Table 75 Experience of physical or sexual violence .................................................................... 110 Table 76 Forms of spousal violence............................................................................................... 111 Table 77 Spousal violence by background characteristics ......................................................... 112 Table 78 Spousal violence by husband’s characteristics and empowerment indicators........................................................................................................................... 113 Table 79 Injuries to women due to spousal violence .................................................................. 114 Table 80 Help seeking behaviour .................................................................................................. 114
APPENDIX
Estimates of sampling errors............................................................................................................. 115
Delhi.indd 7 3/19/09 12:50:38 PM

Delhi.indd 8 3/19/09 12:50:38 PM
�
1
INTRODUCTIONThe 2005-06 National Family Health Survey (NFHS-3) is the third in the NFHS series of surveys. The first NFHS was conducted in 1992-93 and the second (NFHS-2) was conducted in 1998-99. All three NFHS surveys were conducted under the stewardship of the Ministry of Health and Family Welfare (MOHFW), Government of India. The MOHFW designated the International Institute for Population Sciences (IIPS), Mumbai, as the nodal agency for the surveys. Funding for NFHS-3 was provided by the United States Agency for International Development (USAID), the United Kingdom Department for International Development (DFID), the Bill and Melinda Gates Foundation, UNICEF, UNFPA, and the Government of India. Technical assistance for NFHS-3 was provided by Macro International, Maryland, USA. Assistance for the HIV component of the survey was provided by the National AIDS Control Organization (NACO) and the National AIDS Research Institute (NARI), Pune.
The survey provides trend data on key indicators and includes information on several new topics, such as HIV/AIDS-related behaviour, attitudes toward family life education for girls and boys, use of the Integrated Child Development Services (ICDS) programme, men’s involvement in maternal care, and health insurance. For the first time, NFHS-3 provides information on men and unmarried women. In addition, NFHS-3 provides estimates of HIV prevalence for India as a whole based on blood samples collected in every state, including Delhi. Separate HIV prevalence estimates are also provided for Andhra Pradesh, Karnataka, Maharashtra, Manipur, Tamil Nadu, and Uttar Pradesh.
In Delhi, NFHS-3 interviewed 3,349 women age 15-49 and 1,436 men age 15-54 to obtain information on population, health, and nutrition in the state. The survey is based on a sample of 3,324 households that is representative at the state level, within the state at the urban and rural levels, and for the city of Delhi and its slum and non-slum populations. The household response rate in the state as a whole was 96 percent and the individual response rates were 91 percent for eligible women and 76 percent for eligible men.
In Delhi, height and weight measurements were taken for all children under age six years and all interviewed women and men in all the sample households. Haemoglobin levels were measured for all interviewed women and men and for all children age 6-59 months. In a subsample of households, all interviewed women and men were eligible to have their blood collected for HIV testing. All biomarkers were measured only after obtaining informed consent. The NFHS-3 fieldwork in Delhi was conducted by the Population Research Centre, Institute of Economic Growth (IEG), Delhi, between December 2005 and April 2006.
This report presents the key findings of the NFHS-3 survey in Delhi, followed by detailed tables and an appendix on sampling errors. More information about the definitions of indicators included in this report is contained in Volume I of the NFHS-3 National Report, and the questionnaires and details of the sampling procedure for NFHS-3 are contained in Volume II of the NFHS-3 National Report (available at www.nfhsindia.org).
Delhi.indd 1 3/19/09 12:50:38 PM
�
2
HOUSEHOLD CHARACTERISTICS
Household compositionA large majority of households in Delhi (93%) are in urban areas, with the remaining 7 percent in rural areas. On average, households in Delhi are comprised of 4.6 members. Ten percent of households are headed by women.
The vast majority of households in Delhi have household heads who are Hindu (86%). Nine percent of households are headed by Muslims and 3 percent of household heads are Sikhs. Two percent of household heads belong to other religions.
Seventeen percent of household heads belong to scheduled castes, 1 percent to scheduled tribes, and 14 percent to other backward classes (OBC). Two-thirds of Delhi’s households (67%) do not belong to scheduled castes, scheduled tribes, or other backward classes.
More than one-quarter (29%) of Delhi’s population is under age 15; only 4 percent is age 65 and over.
Among children under 18 years of age, 5 percent have experienced the death of one or both parents. In all, 90 percent of children under age 18 years live with both parents, 6 percent live with one parent, and 3 percent live with neither parent.
Housing characteristicsNinety-five percent of households in Delhi live in a pucca house. Ninety-nine percent of households (98% of rural households and 99% of urban households) have electricity, up slightly from 98 percent at the time of NFHS-2. Eight percent of households have no toilet facilities, up from 6 percent at the time of NFHS-2. More than one-quarter of rural households (28%) have no toilet facilities, compared with 6 percent of urban households.
Seventy-three percent of households in Delhi use drinking water that is piped into their dwelling, yard, or plot. Eight percent of households do not have any
toilet facility.
Ninety-two percent of households use an improved source of drinking water (93% of urban households and 88% of rural households), but only 73 percent have water piped into their dwelling, yard, or plot. Eleven percent of households (10% in urban areas and 17% in rural areas) get their drinking water from a public tap or standpipe. More than one-third of households (36%) treat their drinking water to make it potable; 15 percent of households use a ceramic, sand, or other water filter, 11 percent boil their water, and 2 percent strain the water through a cloth, 10 percent of households use some other treatment.
Delhi.indd 2 3/19/09 12:50:39 PM
�
3
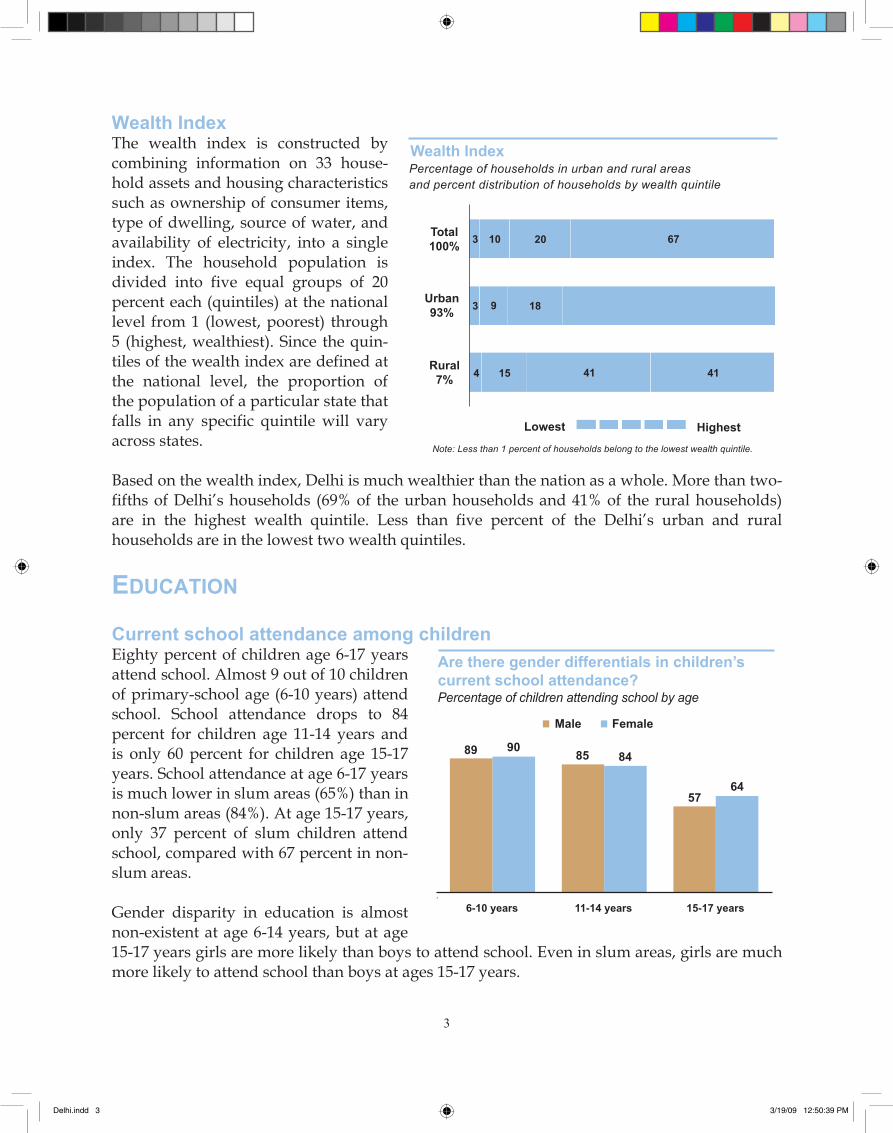
Wealth IndexThe wealth index is constructed by combining information on 33 house-hold assets and housing characteristics such as ownership of consumer items, type of dwelling, source of water, and availability of electricity, into a single index. The household population is divided into five equal groups of 20 percent each (quintiles) at the national level from 1 (lowest, poorest) through 5 (highest, wealthiest). Since the quin-tiles of the wealth index are defined at the national level, the proportion of the population of a particular state that falls in any specific quintile will vary across states.
Based on the wealth index, Delhi is much wealthier than the nation as a whole. More than two-fifths of Delhi’s households (69% of the urban households and 41% of the rural households) are in the highest wealth quintile. Less than five percent of the Delhi’s urban and rural households are in the lowest two wealth quintiles.
EDUCATION
Current school attendance among children Eighty percent of children age 6-17 years attend school. Almost 9 out of 10 children of primary-school age (6-10 years) attend school. School attendance drops to 84 percent for children age 11-14 years and is only 60 percent for children age 15-17 years. School attendance at age 6-17 years is much lower in slum areas (65%) than in non-slum areas (84%). At age 15-17 years, only 37 percent of slum children attend school, compared with 67 percent in non-slum areas.
Gender disparity in education is almost non-existent at age 6-14 years, but at age 15-17 years girls are more likely than boys to attend school. Even in slum areas, girls are much more likely to attend school than boys at ages 15-17 years.
18
20 6710
69
414115
Wealth IndexPercentage of households in urban and rural areasand percent distribution of households by wealth quintile
Total100%
Urban93%
Rural7%
Lowest Highest
Percentage of children attending school by age
Are there gender differentials in children’scurrent school attendance?
Male
89
6-10 years 11-14 years 15-17 years
9085 84
5764
Female
3
3 9
4
Note: Less than 1 percent of households belong to the lowest wealth quintile.
Delhi.indd 3 3/19/09 12:50:39 PM
�
4
Literacy and educational attainment In NFHS-3, literate persons are those who have either completed at least standard six or passed a simple literacy test conducted as part of the survey. According to this measure, 77 percent of women and 90 percent of men age 15-49 are literate.
Twenty-one percent of women and 10 percent of men age 15-49 have never attended school. More than half of adults (53% of women and 56% of men) have completed 10 or more years of education.
More than half of women and men have completed 10 or more years of education.
Attitudes toward family life education in school Virtually all adults agree that children should be taught moral values in school. A large majority of adults think that children should learn about the changes in their own bodies during puberty; but a smaller majority think that children should learn about puberty-related changes in the bodies of the opposite sex.
Men and women differ somewhat on whether they think that children should be taught in school about contraception. More than five-sixths of men (86-87%) believe that both girls and boys should be taught about contraception in school, whereas 77 percent of women think that girls should learn about contraception in school and 72 percent think that boys should learn about contraception in school.
More than 9 in 10 men (94-95%) think that boys and girls should learn about HIV/AIDS in school, compared with 86-87 percent of women. Among men, more than four-fifths feel that both boys and girls should be taught about sex and sexual behaviour in school, and 90-91percent feel that both boys and girls should be taught in school about condom use to avoid sexually transmitted diseases. By contrast, only about three-quarters of women (74-81%) feel that each of these topics is appropriate for children in school.
FERTILITY
Age at first marriageThe median age at first marriage is 19.7 years among women age 20-49 and 24.4 years among men age 25-49. On average, men get married five years later than women. More than one-fifth of women (23%) age 20-24 years got married before the legal minimum age of 18, and 19 percent of men age 25-29 years got married before the legal minimum age of 21.
Delhi.indd 4 3/19/09 12:50:40 PM
�
5
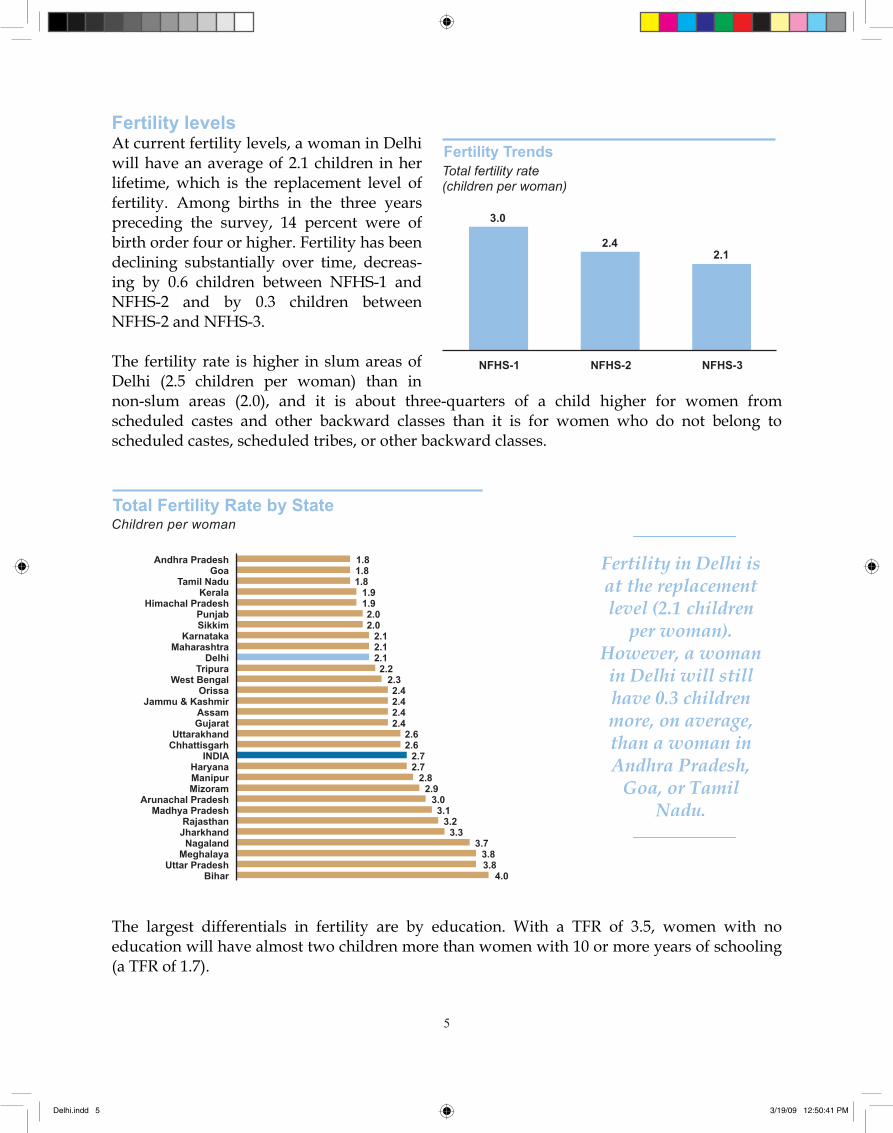
Fertility levels At current fertility levels, a woman in Delhi will have an average of 2.1 children in her lifetime, which is the replacement level of fertility. Among births in the three years preceding the survey, 14 percent were of birth order four or higher. Fertility has been declining substantially over time, decreas-ing by 0.6 children between NFHS-1 and NFHS-2 and by 0.3 children between NFHS-2 and NFHS-3.
The fertility rate is higher in slum areas of Delhi (2.5 children per woman) than in non-slum areas (2.0), and it is about three-quarters of a child higher for women from scheduled castes and other backward classes than it is for women who do not belong to scheduled castes, scheduled tribes, or other backward classes.
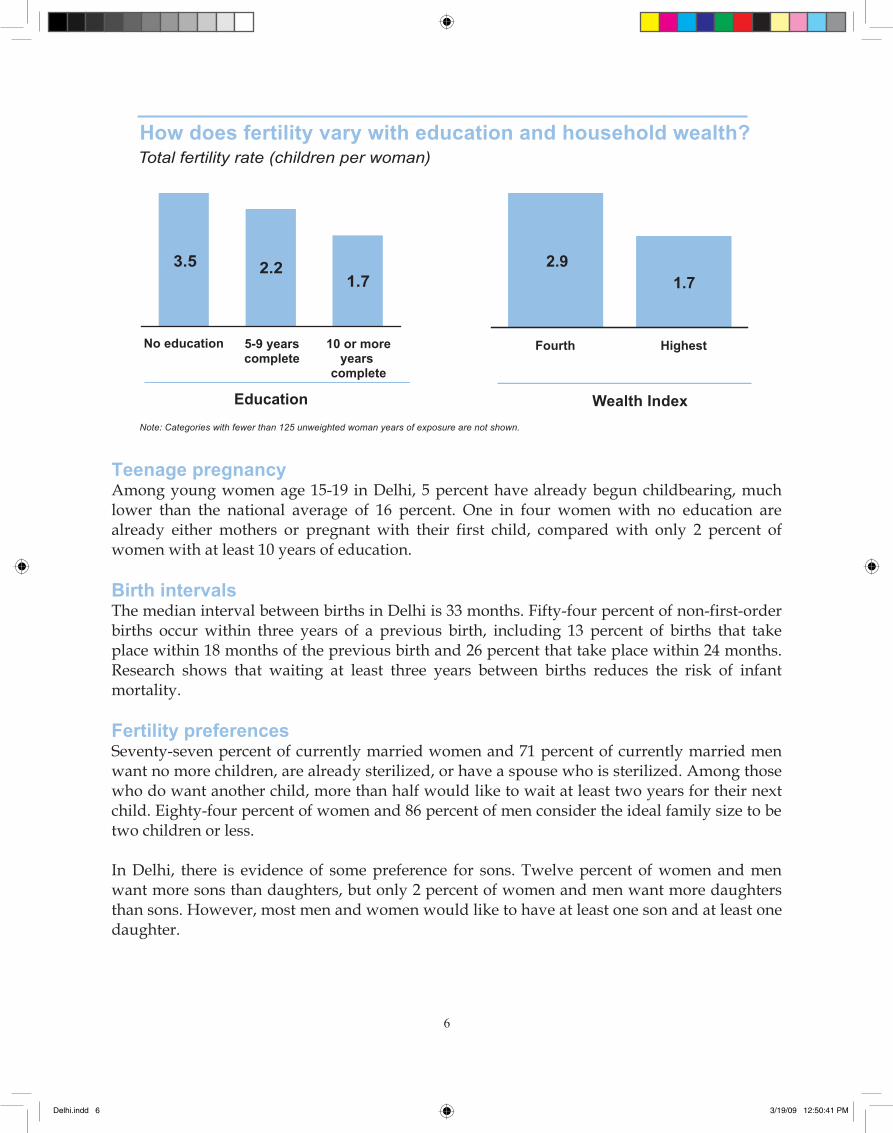
The largest differentials in fertility are by education. With a TFR of 3.5, women with no education will have almost two children more than women with 10 or more years of schooling (a TFR of 1.7).
Fertility in Delhi isat the replacement level (2.1 children
per woman). However, a woman in Delhi will still have 0.3 children more, on average, than a woman in Andhra Pradesh,
Goa, or Tamil Nadu.
Fertility TrendsTotal fertility rate(children per woman)
Total Fertility Rate by StateChildren per woman
NFHS-1 NFHS-2 NFHS-3
3.0
2.42.1
4.03.83.8
3.73.3
3.23.1
3.02.9
2.82.72.7
2.62.6
2.42.42.42.4
2.32.2
2.12.12.1
2.02.0
1.91.9
1.81.81.8
BiharUttar Pradesh
MeghalayaNagaland
JharkhandRajasthan
Madhya PradeshArunachal Pradesh
MizoramManipurHaryana
INDIAChhattisgarhUttarakhand
GujaratAssam
Jammu & KashmirOrissa
West BengalTripura
DelhiMaharashtra
KarnatakaSikkimPunjab
Himachal PradeshKerala
Tamil NaduGoa
Andhra Pradesh
Delhi.indd 5 3/19/09 12:50:41 PM
�
6
Teenage pregnancy Among young women age 15-19 in Delhi, 5 percent have already begun childbearing, much lower than the national average of 16 percent. One in four women with no education are already either mothers or pregnant with their first child, compared with only 2 percent of women with at least 10 years of education.
Birth intervalsThe median interval between births in Delhi is 33 months. Fifty-four percent of non-first-order births occur within three years of a previous birth, including 13 percent of births that take place within 18 months of the previous birth and 26 percent that take place within 24 months. Research shows that waiting at least three years between births reduces the risk of infant mortality.
Fertility preferences Seventy-seven percent of currently married women and 71 percent of currently married men want no more children, are already sterilized, or have a spouse who is sterilized. Among those who do want another child, more than half would like to wait at least two years for their next child. Eighty-four percent of women and 86 percent of men consider the ideal family size to be two children or less.
In Delhi, there is evidence of some preference for sons. Twelve percent of women and men want more sons than daughters, but only 2 percent of women and men want more daughters than sons. However, most men and women would like to have at least one son and at least one daughter.
2.91.7
Total fertility rate (children per woman)
3.5 2.21.7
No education 5-9 yearscomplete
10 or moreyears
complete
Fourth Highest
Education Wealth Index
How does fertility vary with education and household wealth?
Note: Categories with fewer than 125 unweighted woman years of exposure are not shown.
Delhi.indd 6 3/19/09 12:50:41 PM
�
7
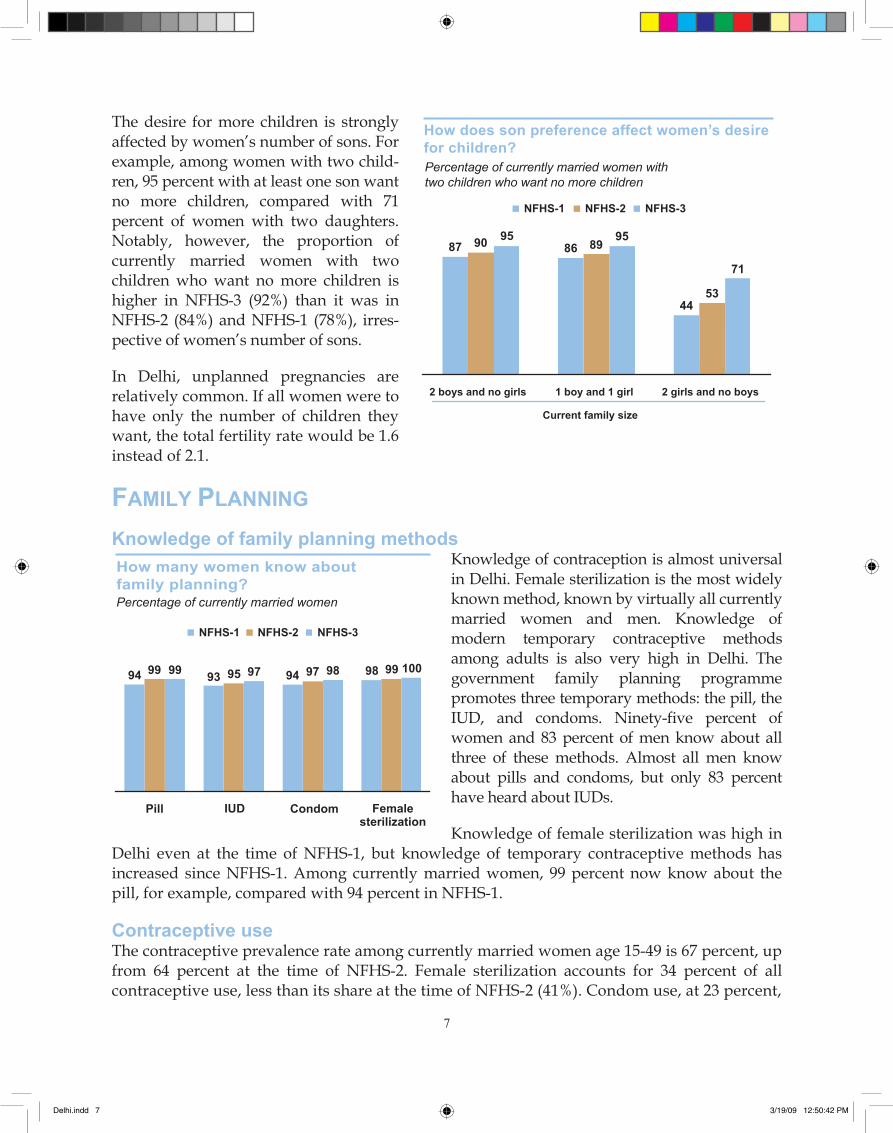
The desire for more children is strongly affected by women’s number of sons. For example, among women with two child-ren, 95 percent with at least one son want no more children, compared with 71 percent of women with two daughters. Notably, however, the proportion of currently married women with two children who want no more children is higher in NFHS-3 (92%) than it was in NFHS-2 (84%) and NFHS-1 (78%), irres-pective of women’s number of sons.
In Delhi, unplanned pregnancies are relatively common. If all women were to have only the number of children they want, the total fertility rate would be 1.6 instead of 2.1.
FAMILY PLANNING
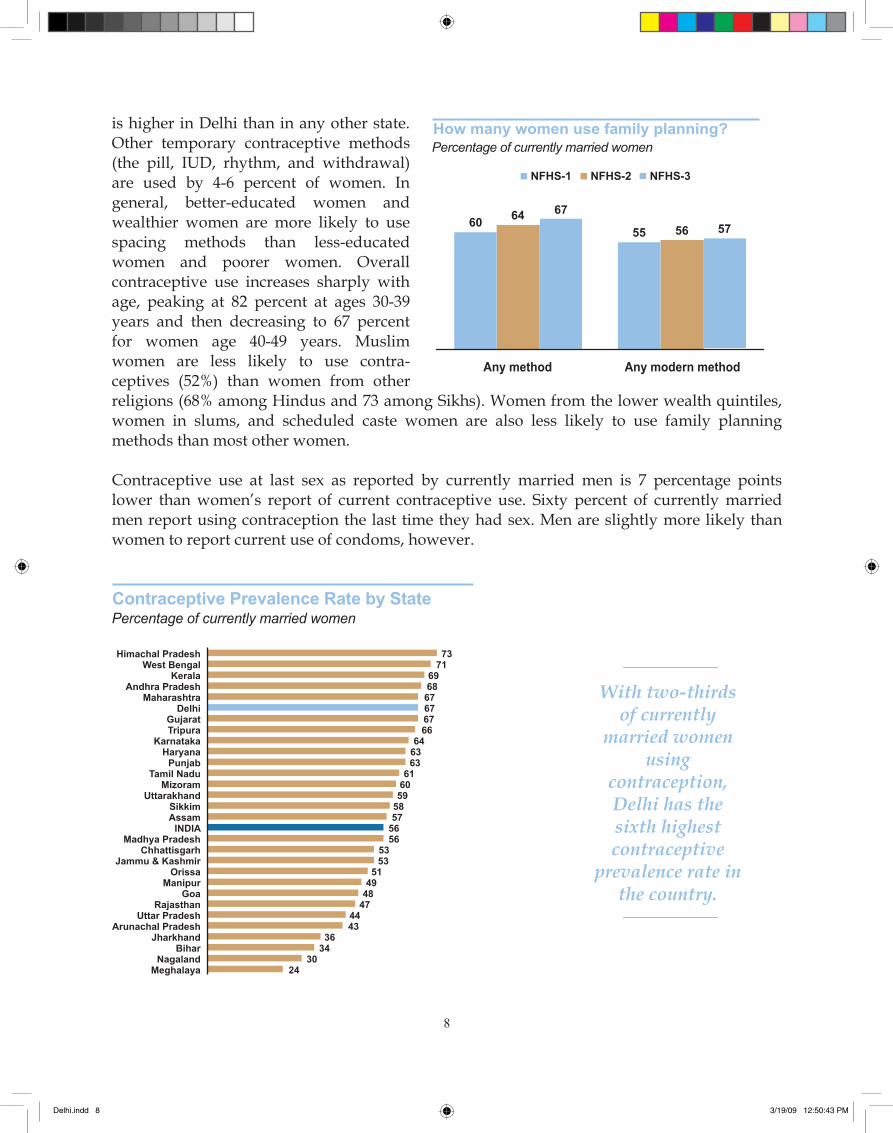
Knowledge of family planning methods Knowledge of contraception is almost universal in Delhi. Female sterilization is the most widely known method, known by virtually all currently married women and men. Knowledge of modern temporary contraceptive methods among adults is also very high in Delhi. The government family planning programme promotes three temporary methods: the pill, the IUD, and condoms. Ninety-five percent of women and 83 percent of men know about all three of these methods. Almost all men know about pills and condoms, but only 83 percent have heard about IUDs.
Knowledge of female sterilization was high in Delhi even at the time of NFHS-1, but knowledge of temporary contraceptive methods has increased since NFHS-1. Among currently married women, 99 percent now know about the pill, for example, compared with 94 percent in NFHS-1.
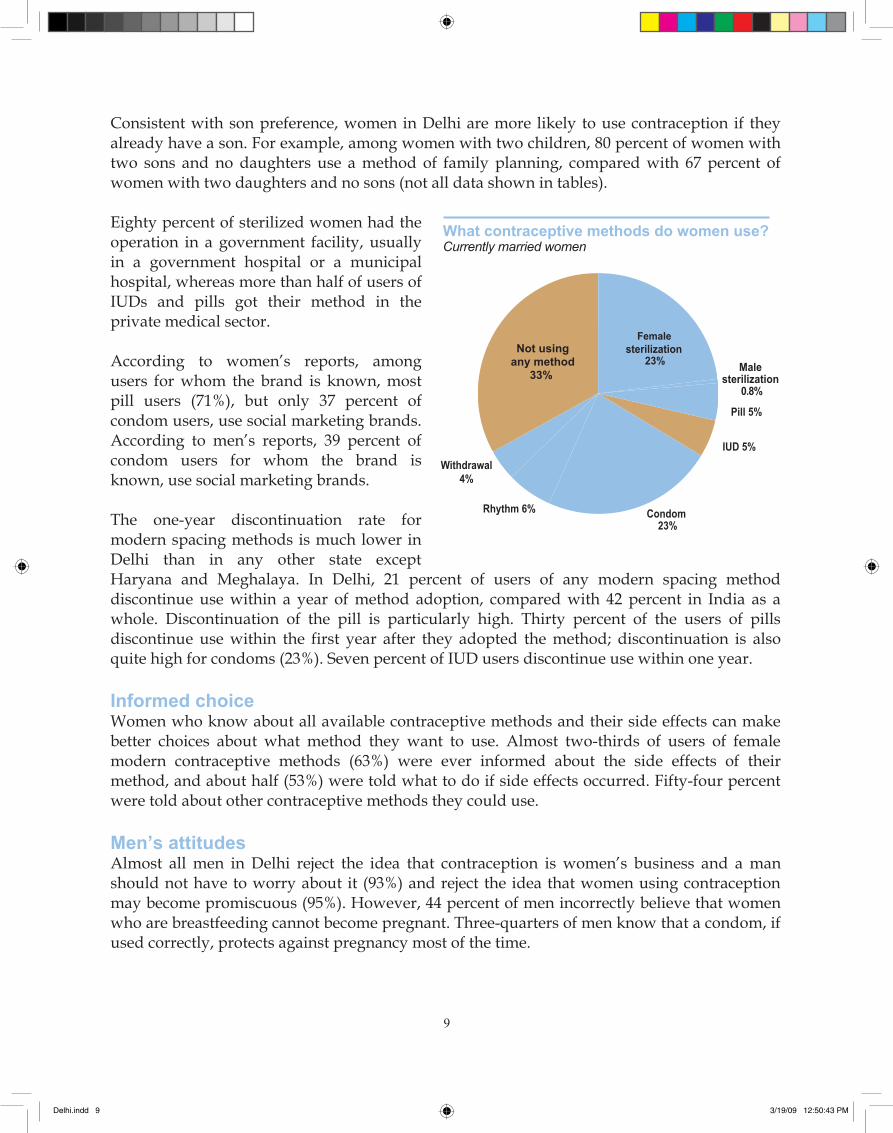
Contraceptive useThe contraceptive prevalence rate among currently married women age 15-49 is 67 percent, up from 64 percent at the time of NFHS-2. Female sterilization accounts for 34 percent of all contraceptive use, less than its share at the time of NFHS-2 (41%). Condom use, at 23 percent,
2 boys and no girls
Current family size
2 girls and no boys1 boy and 1 girl
8795
71
5344
86 8990 95
NFHS-1 NFHS-3NFHS-2
How does son preference affect women’s desirefor children?Percentage of currently married women withtwo children who want no more children
Pill IUD Condom Femalesterilization
94 97 98 99 10094 97 9893 959999
NFHS-1 NFHS-3NFHS-2
How many women know aboutfamily planning?Percentage of currently married women
Delhi.indd 7 3/19/09 12:50:42 PM
�
8
is higher in Delhi than in any other state. Other temporary contraceptive methods (the pill, IUD, rhythm, and withdrawal) are used by 4-6 percent of women. In general, better-educated women and wealthier women are more likely to use spacing methods than less-educated women and poorer women. Overall contraceptive use increases sharply with age, peaking at 82 percent at ages 30-39 years and then decreasing to 67 percent for women age 40-49 years. Muslim women are less likely to use contra-ceptives (52%) than women from other religions (68% among Hindus and 73 among Sikhs). Women from the lower wealth quintiles, women in slums, and scheduled caste women are also less likely to use family planning methods than most other women.
Contraceptive use at last sex as reported by currently married men is 7 percentage points lower than women’s report of current contraceptive use. Sixty percent of currently married men report using contraception the last time they had sex. Men are slightly more likely than women to report current use of condoms, however.
With two-thirdsof currently
married women using
contraception,Delhi has the sixth highest contraceptive
prevalence rate in the country.
Any modern method
6064
55 56 57
67
Any method
NFHS-1 NFHS-3NFHS-2
How many women use family planning?Percentage of currently married women
Contraceptive Prevalence Rate by StatePercentage of currently married women
MeghalayaNagaland
BiharJharkhand
Arunachal PradeshUttar Pradesh
RajasthanGoa
ManipurOrissa
Jammu & KashmirChhattisgarh
Madhya PradeshINDIA
AssamSikkim
UttarakhandMizoram
Tamil NaduPunjab
HaryanaKarnataka
TripuraGujarat
DelhiMaharashtra
Andhra PradeshKerala
West BengalHimachal Pradesh
2430
3436
4344
47484951
5353
56565758596061
636364
666767676869
7173
Delhi.indd 8 3/19/09 12:50:43 PM
�
9
Consistent with son preference, women in Delhi are more likely to use contraception if they already have a son. For example, among women with two children, 80 percent of women with two sons and no daughters use a method of family planning, compared with 67 percent of women with two daughters and no sons (not all data shown in tables).
Eighty percent of sterilized women had the operation in a government facility, usually in a government hospital or a municipal hospital, whereas more than half of users of IUDs and pills got their method in the private medical sector.
According to women’s reports, among users for whom the brand is known, most pill users (71%), but only 37 percent of condom users, use social marketing brands. According to men’s reports, 39 percent of condom users for whom the brand is known, use social marketing brands.
The one-year discontinuation rate for modern spacing methods is much lower in Delhi than in any other state except Haryana and Meghalaya. In Delhi, 21 percent of users of any modern spacing method discontinue use within a year of method adoption, compared with 42 percent in India as a whole. Discontinuation of the pill is particularly high. Thirty percent of the users of pills discontinue use within the first year after they adopted the method; discontinuation is also quite high for condoms (23%). Seven percent of IUD users discontinue use within one year.
Informed choiceWomen who know about all available contraceptive methods and their side effects can make better choices about what method they want to use. Almost two-thirds of users of female modern contraceptive methods (63%) were ever informed about the side effects of their method, and about half (53%) were told what to do if side effects occurred. Fifty-four percent were told about other contraceptive methods they could use.
Men’s attitudesAlmost all men in Delhi reject the idea that contraception is women’s business and a man should not have to worry about it (93%) and reject the idea that women using contraception may become promiscuous (95%). However, 44 percent of men incorrectly believe that women who are breastfeeding cannot become pregnant. Three-quarters of men know that a condom, if used correctly, protects against pregnancy most of the time.
What contraceptive methods do women use?Currently married women
Malesterilization
0.8%
sterilizationFemale
23%
Pill 5%
IUD 5%
Condom23%
Rhythm 6%
Withdrawal4%
Not usingany method
33%
Delhi.indd 9 3/19/09 12:50:43 PM
�0
10
Unmet needUnmet need for family planning is defined as the percentage of currently married women who either want to space their next birth or stop childbearing entirely but are not using contraception. According to this definition, 8 percent of currently married women have an unmet need for family planning (3% for spacing and 5% for limiting), down from 13 percent in NFHS-2 and 15 percent in NFHS-1. Currently, 90 percent of the demand for family planning is being satisfied, having risen from 80 percent in NFHS-1 and 83 percent in NFHS-2.
INFANT AND CHILD MORTALITY
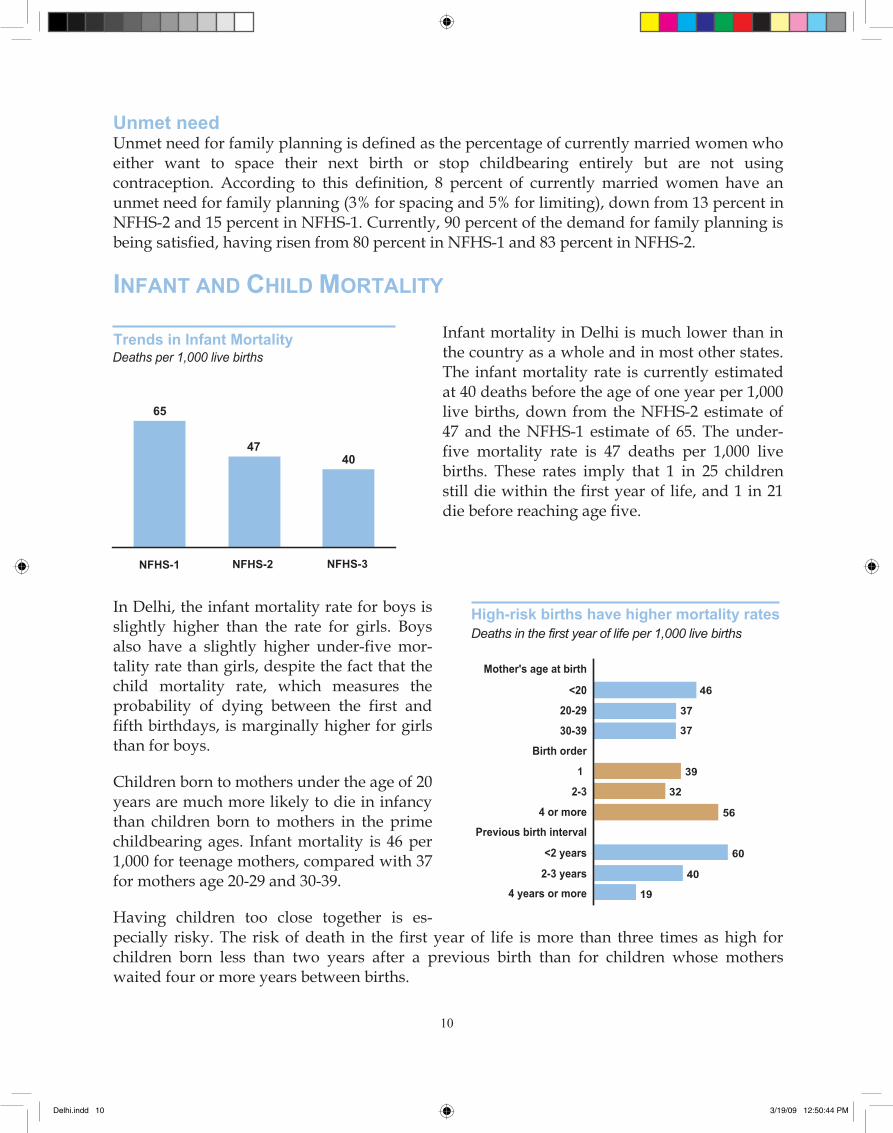
Infant mortality in Delhi is much lower than in the country as a whole and in most other states. The infant mortality rate is currently estimated at 40 deaths before the age of one year per 1,000 live births, down from the NFHS-2 estimate of 47 and the NFHS-1 estimate of 65. The under-five mortality rate is 47 deaths per 1,000 live births. These rates imply that 1 in 25 children still die within the first year of life, and 1 in 21 die before reaching age five.
In Delhi, the infant mortality rate for boys is slightly higher than the rate for girls. Boys also have a slightly higher under-five mor-tality rate than girls, despite the fact that the child mortality rate, which measures the probability of dying between the first and fifth birthdays, is marginally higher for girls than for boys.
Children born to mothers under the age of 20 years are much more likely to die in infancy than children born to mothers in the prime childbearing ages. Infant mortality is 46 per 1,000 for teenage mothers, compared with 37 for mothers age 20-29 and 30-39.
Having children too close together is es-pecially risky. The risk of death in the first year of life is more than three times as high for children born less than two years after a previous birth than for children whose mothers waited four or more years between births.
Trends in Infant MortalityDeaths per 1,000 live births
NFHS-3NFHS-2NFHS-1
65
4740
High-risk births have higher mortality ratesDeaths in the first year of life per 1,000 live births
40
19
32
37
56
37
46
39
60
2-3 years
4 years or more
<2 years
Previous birth interval
4 or more
2-3
1
Birth order
30-39
20-29
<20
Mother's age at birth
Delhi.indd 10 3/19/09 12:50:44 PM
��
11
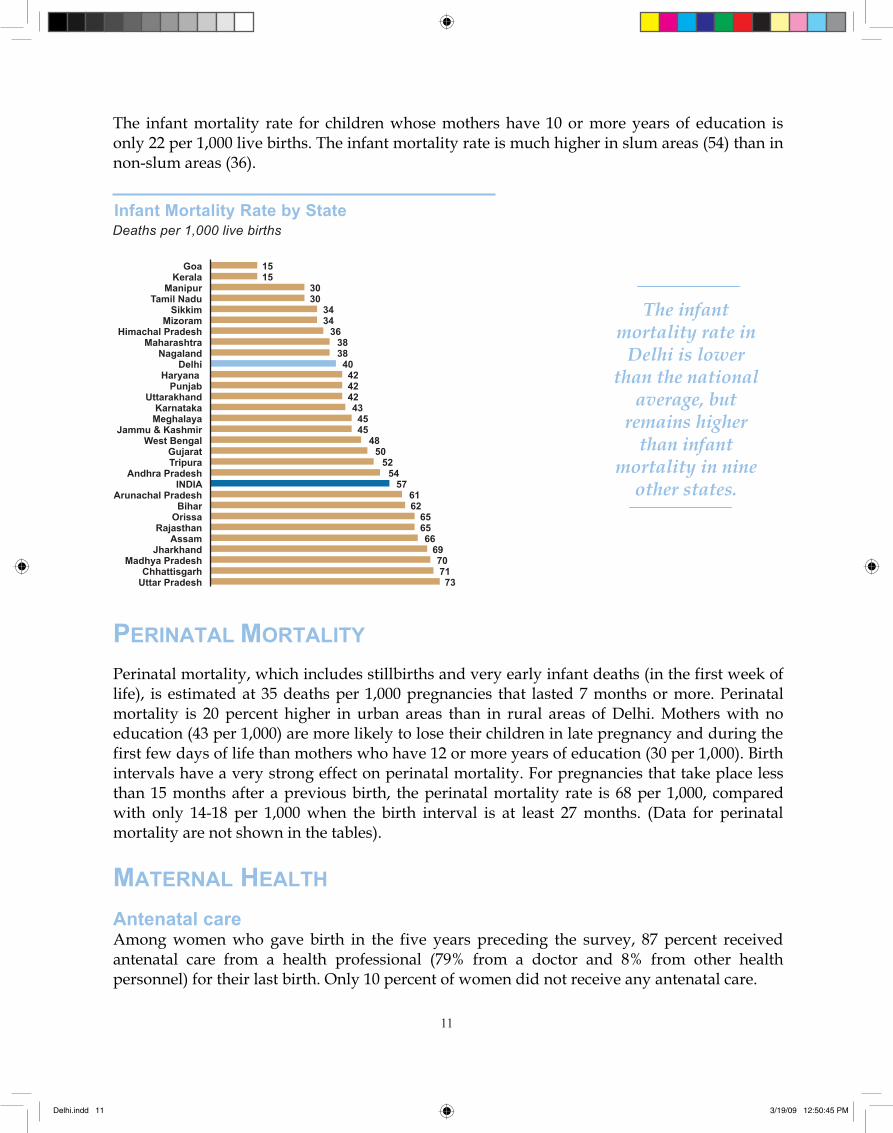
The infant mortality rate for children whose mothers have 10 or more years of education is only 22 per 1,000 live births. The infant mortality rate is much higher in slum areas (54) than in non-slum areas (36).
PERINATAL MORTALITY
Perinatal mortality, which includes stillbirths and very early infant deaths (in the first week of life), is estimated at 35 deaths per 1,000 pregnancies that lasted 7 months or more. Perinatal mortality is 20 percent higher in urban areas than in rural areas of Delhi. Mothers with no education (43 per 1,000) are more likely to lose their children in late pregnancy and during the first few days of life than mothers who have 12 or more years of education (30 per 1,000). Birth intervals have a very strong effect on perinatal mortality. For pregnancies that take place less than 15 months after a previous birth, the perinatal mortality rate is 68 per 1,000, compared with only 14-18 per 1,000 when the birth interval is at least 27 months. (Data for perinatal mortality are not shown in the tables).
MATERNAL HEALTH
Antenatal careAmong women who gave birth in the five years preceding the survey, 87 percent received antenatal care from a health professional (79% from a doctor and 8% from other health personnel) for their last birth. Only 10 percent of women did not receive any antenatal care.
The infantmortality rate in
Delhi is lower than the national
average, but remains higher
than infant mortality in nine
other states.
Infant Mortality Rate by StateDeaths per 1,000 live births
Uttar PradeshChhattisgarh
Madhya PradeshJharkhand
AssamRajasthan
OrissaBihar
Arunachal PradeshINDIA
Andhra PradeshTripuraGujarat
West BengalJammu & Kashmir
MeghalayaKarnataka
UttarakhandPunjab
HaryanaDelhi
NagalandMaharashtra
Himachal PradeshMizoram
SikkimTamil Nadu
ManipurKerala
Goa
737170
6966
6565
6261
5754
5250
484545
43424242
403838
363434
3030
1515
Delhi.indd 11 3/19/09 12:50:45 PM
��
12
Ninety percent of women in non-slum areas received antenatal care from a health professional for their last birth, compared with 78 percent of women in slum areas. More than 80 percent of women with 10 or more years of education, women who are having their first birth, and women in the higher wealth quintile received antenatal care. Women belonging to other backward classes were less likely than women belonging to any other caste/tribe category to have received antenatal care.
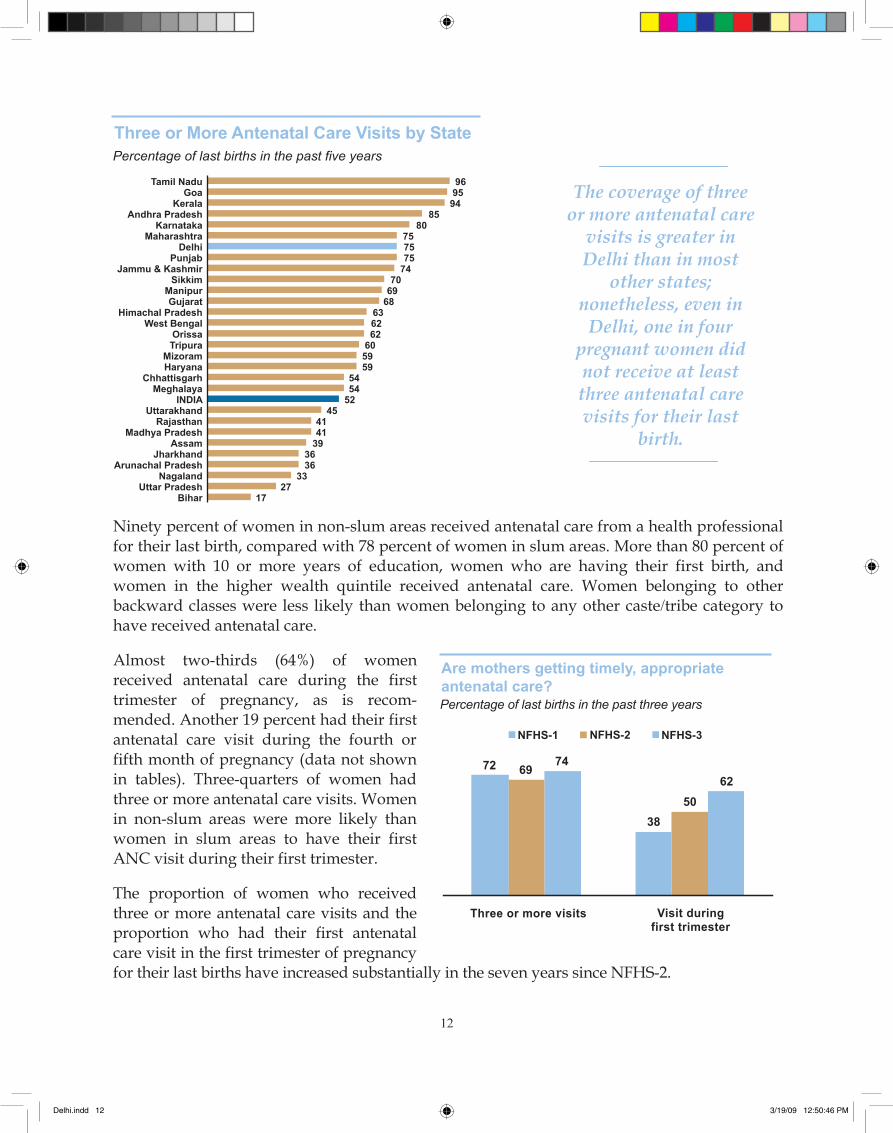
Almost two-thirds (64%) of women received antenatal care during the first trimester of pregnancy, as is recom-mended. Another 19 percent had their first antenatal care visit during the fourth or fifth month of pregnancy (data not shown in tables). Three-quarters of women had three or more antenatal care visits. Women in non-slum areas were more likely than women in slum areas to have their first ANC visit during their first trimester.
The proportion of women who received three or more antenatal care visits and the proportion who had their first antenatal care visit in the first trimester of pregnancy for their last births have increased substantially in the seven years since NFHS-2.
The coverage of threeor more antenatal care
visits is greater in Delhi than in most
other states; nonetheless, even in
Delhi, one in four pregnant women did not receive at least three antenatal care visits for their last
birth.
Three or More Antenatal Care Visits by StatePercentage of last births in the past five years
1727
333636
394141
45525454
595960626263
686970
74757575
8085
949596
BiharUttar Pradesh
NagalandArunachal Pradesh
JharkhandAssam
Madhya PradeshRajasthan
UttarakhandINDIA
MeghalayaChhattisgarh
HaryanaMizoram
TripuraOrissa
West BengalHimachal Pradesh
GujaratManipur
SikkimJammu & Kashmir
PunjabDelhi
MaharashtraKarnataka
Andhra PradeshKerala
GoaTamil Nadu
Are mothers getting timely, appropriateantenatal care?Percentage of last births in the past three years
Three or more visits Visit during first trimester
NFHS-1 NFHS-3NFHS-2
72 7469
38
6250
Delhi.indd 12 3/19/09 12:50:46 PM
��
13
For 78 percent of their last births, mothers received iron and folic acid supplements (IFA), but for only 40 percent of the births did mothers consume IFA for the recommended 90 days or more. Ninety percent of mothers received two or more doses of tetanus toxoid vaccine. Only 6 percent took a deworming drug during pregnancy.
In Delhi, more than four-fifths of women who received antenatal care received most of the services needed to monitor their pregnancy. Eighty-eight percent had their weight taken, 86 percent had their blood pressure measured, 85 percent had their abdomen examined, and 84-86 percent had blood and urine samples taken.
An ultrasound test was performed during more than half of pregnancies (51%) in the five years preceding the survey, more than twice as high as the national average (24%). Urban and rural women are equally likely to have had an ultrasound test for their most recent pregnancy, but women in slum areas (32%) are much less likely than women in non-slum areas (57%) to have had an ultrasound test. Even 26 percent of women with no education and more than one-third of scheduled-caste women (36%) had an ultrasound test. Notably, 8 percent of women who did not have any antenatal care for their most recent pregnancy had an ultrasound test. Almost three-quarters of women with 10 or more years of education and 68 percent of women in the highest wealth quintile had an ultrasound test during their pregnancies. Pregnant women with no living sons are much more likely to have an ultrasound test than women with one or more sons. For example, among women with two children, 54 percent with two daughters and no sons had an ultrasound test, compared with 31 percent with one son or two sons.
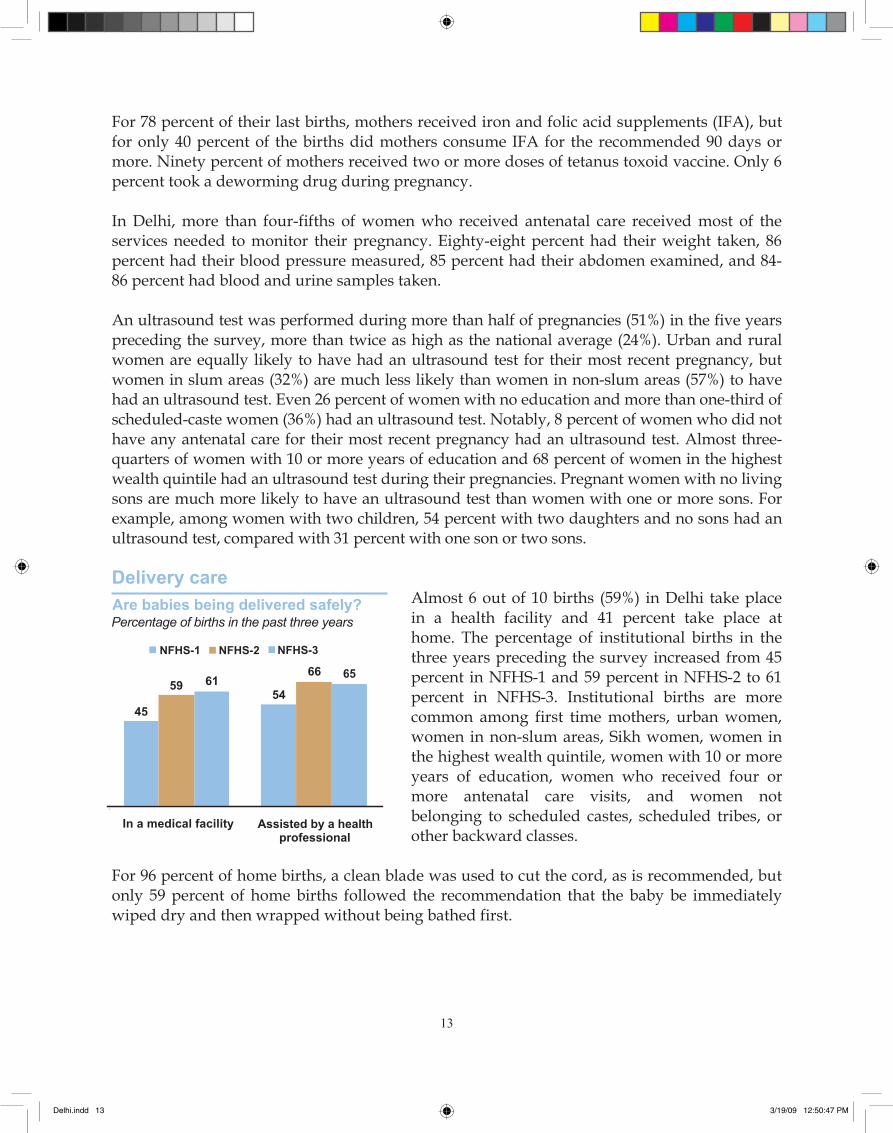
Delivery care Almost 6 out of 10 births (59%) in Delhi take place in a health facility and 41 percent take place at home. The percentage of institutional births in the three years preceding the survey increased from 45 percent in NFHS-1 and 59 percent in NFHS-2 to 61 percent in NFHS-3. Institutional births are more common among first time mothers, urban women, women in non-slum areas, Sikh women, women in the highest wealth quintile, women with 10 or more years of education, women who received four or more antenatal care visits, and women not belonging to scheduled castes, scheduled tribes, or other backward classes.
For 96 percent of home births, a clean blade was used to cut the cord, as is recommended, but only 59 percent of home births followed the recommendation that the baby be immediately wiped dry and then wrapped without being bathed first.
Are babies being delivered safely?Percentage of births in the past three years
In a medical facility Assisted by a health professional
NFHS-1 NFHS-3NFHS-2
45
59 61 6566
54
Delhi.indd 13 3/19/09 12:50:47 PM
��
14
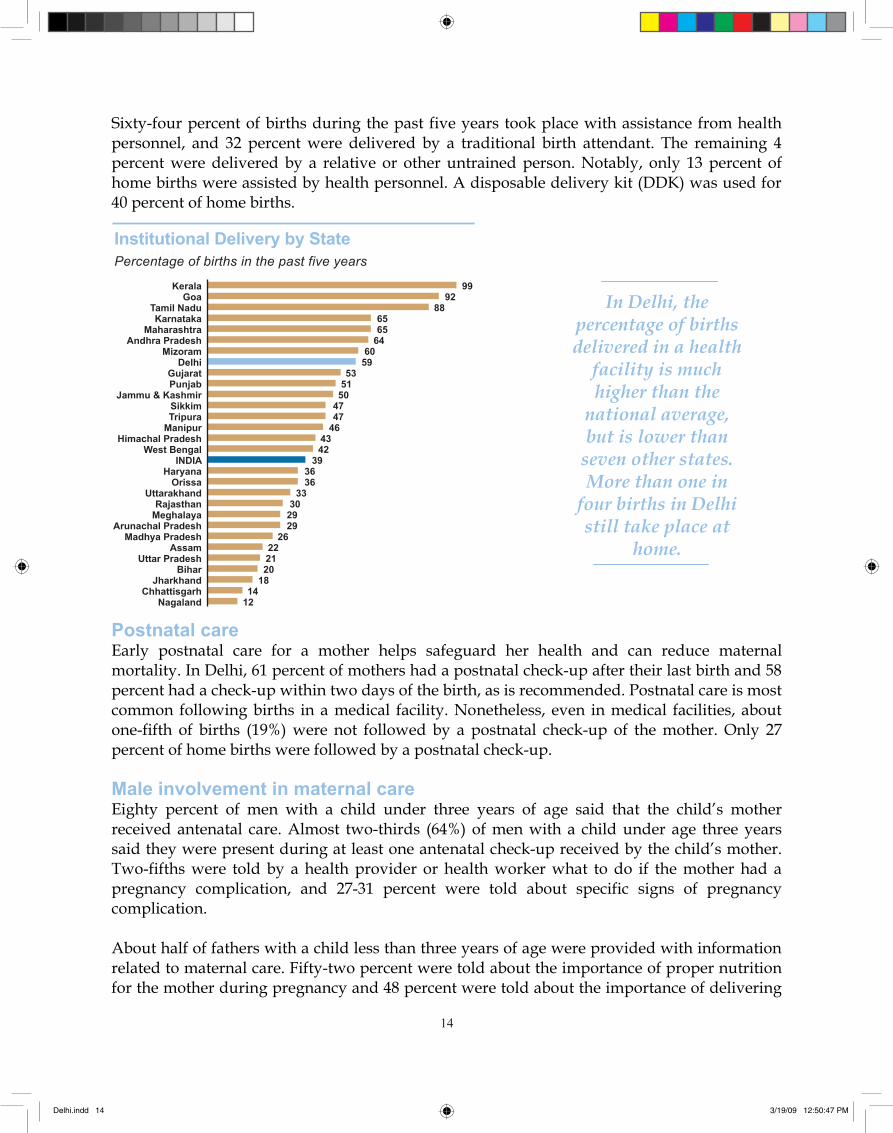
Sixty-four percent of births during the past five years took place with assistance from health personnel, and 32 percent were delivered by a traditional birth attendant. The remaining 4 percent were delivered by a relative or other untrained person. Notably, only 13 percent of home births were assisted by health personnel. A disposable delivery kit (DDK) was used for 40 percent of home births.
Postnatal careEarly postnatal care for a mother helps safeguard her health and can reduce maternal mortality. In Delhi, 61 percent of mothers had a postnatal check-up after their last birth and 58 percent had a check-up within two days of the birth, as is recommended. Postnatal care is most common following births in a medical facility. Nonetheless, even in medical facilities, about one-fifth of births (19%) were not followed by a postnatal check-up of the mother. Only 27 percent of home births were followed by a postnatal check-up.
Male involvement in maternal careEighty percent of men with a child under three years of age said that the child’s mother received antenatal care. Almost two-thirds (64%) of men with a child under age three years said they were present during at least one antenatal check-up received by the child’s mother. Two-fifths were told by a health provider or health worker what to do if the mother had a pregnancy complication, and 27-31 percent were told about specific signs of pregnancy complication.
About half of fathers with a child less than three years of age were provided with information related to maternal care. Fifty-two percent were told about the importance of proper nutrition for the mother during pregnancy and 48 percent were told about the importance of delivering
In Delhi, thepercentage of births delivered in a health
facility is much higher than the
national average, but is lower than
seven other states. More than one in
four births in Delhi still take place at
home.
Institutional Delivery by StatePercentage of births in the past five years
NagalandChhattisgarh
JharkhandBihar
Uttar PradeshAssam
Madhya PradeshArunachal Pradesh
MeghalayaRajasthan
UttarakhandOrissa
HaryanaINDIA
West BengalHimachal Pradesh
ManipurTripuraSikkim
Jammu & KashmirPunjabGujarat
DelhiMizoram
Andhra PradeshMaharashtra
KarnatakaTamil Nadu
GoaKerala
1214
18202122
26292930
333636
394243
464747505153
5960
646565
8892
99
Delhi.indd 14 3/19/09 12:50:47 PM
��
15
the baby in a health facility. Among fathers whose child was not delivered in a health facility, 39 percent each were told about the importance of using a new or unused blade to cut the umbilical cord and were told about the importance of breastfeeding the baby immediately after birth, and 38 percent each were told about the importance of cleanliness at the time of delivery and keeping the baby warm immediately after birth.
CHILD HEALTH
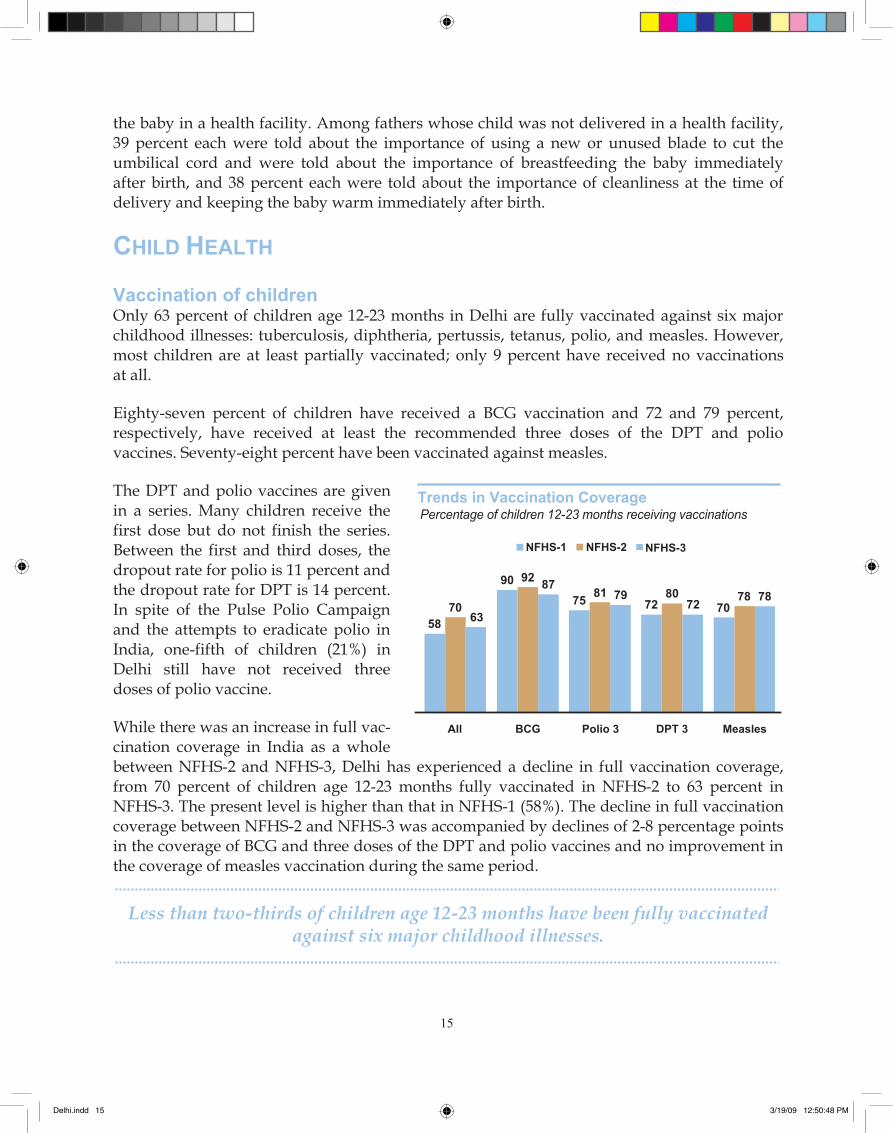
Vaccination of childrenOnly 63 percent of children age 12-23 months in Delhi are fully vaccinated against six major childhood illnesses: tuberculosis, diphtheria, pertussis, tetanus, polio, and measles. However, most children are at least partially vaccinated; only 9 percent have received no vaccinations at all.
Eighty-seven percent of children have received a BCG vaccination and 72 and 79 percent, respectively, have received at least the recommended three doses of the DPT and polio vaccines. Seventy-eight percent have been vaccinated against measles.
The DPT and polio vaccines are given in a series. Many children receive the first dose but do not finish the series. Between the first and third doses, the dropout rate for polio is 11 percent and the dropout rate for DPT is 14 percent. In spite of the Pulse Polio Campaign and the attempts to eradicate polio in India, one-fifth of children (21%) in Delhi still have not received three doses of polio vaccine.
While there was an increase in full vac-cination coverage in India as a whole between NFHS-2 and NFHS-3, Delhi has experienced a decline in full vaccination coverage, from 70 percent of children age 12-23 months fully vaccinated in NFHS-2 to 63 percent in NFHS-3. The present level is higher than that in NFHS-1 (58%). The decline in full vaccination coverage between NFHS-2 and NFHS-3 was accompanied by declines of 2-8 percentage points in the coverage of BCG and three doses of the DPT and polio vaccines and no improvement in the coverage of measles vaccination during the same period.
Less than two-thirds of children age 12-23 months have been fully vaccinated against six major childhood illnesses.
Trends in Vaccination CoveragePercentage of children 12-23 months receiving vaccinations
All BCG Polio 3 DPT 3 Measles
NFHS-3NFHS-2NFHS-1
7058 63
90
70787872
8072
7981758792
Delhi.indd 15 3/19/09 12:50:48 PM
��
16
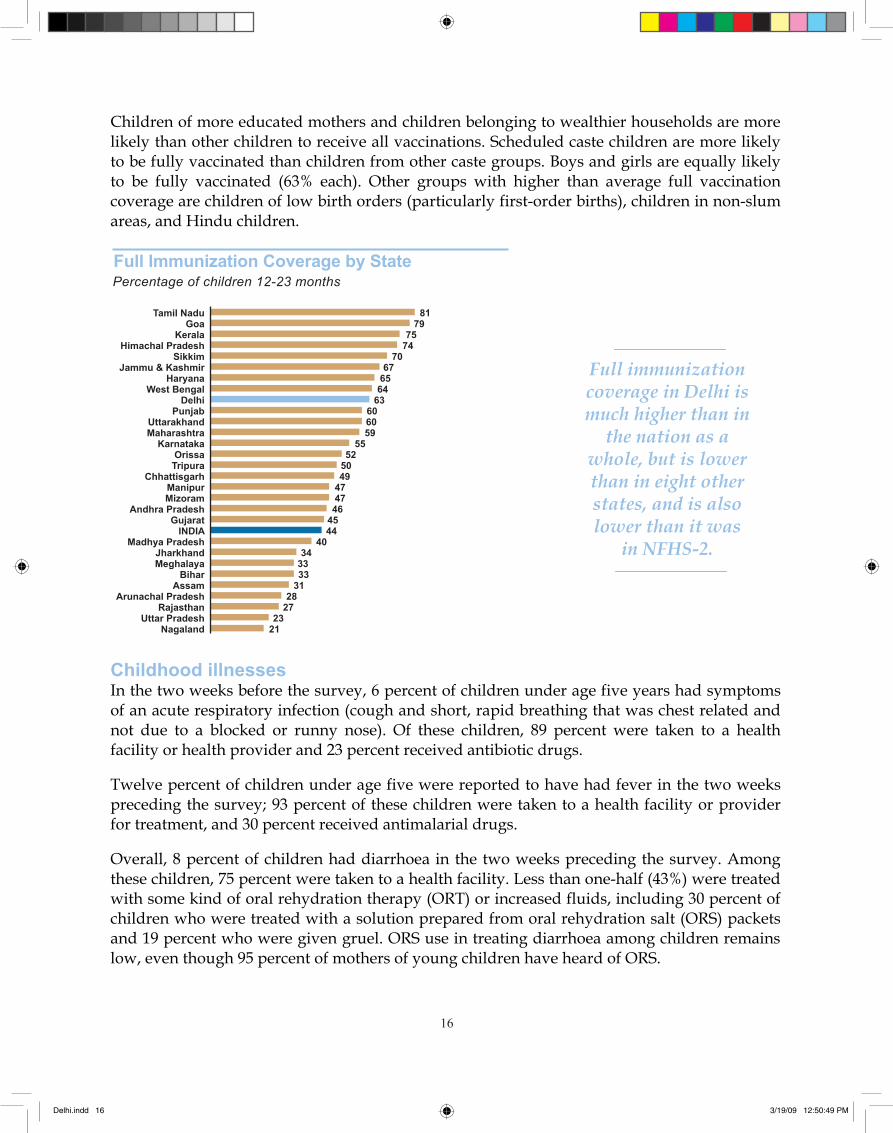
Children of more educated mothers and children belonging to wealthier households are more likely than other children to receive all vaccinations. Scheduled caste children are more likely to be fully vaccinated than children from other caste groups. Boys and girls are equally likely to be fully vaccinated (63% each). Other groups with higher than average full vaccination coverage are children of low birth orders (particularly first-order births), children in non-slum areas, and Hindu children.
Childhood illnessesIn the two weeks before the survey, 6 percent of children under age five years had symptoms of an acute respiratory infection (cough and short, rapid breathing that was chest related and not due to a blocked or runny nose). Of these children, 89 percent were taken to a health facility or health provider and 23 percent received antibiotic drugs.
Twelve percent of children under age five were reported to have had fever in the two weeks preceding the survey; 93 percent of these children were taken to a health facility or provider for treatment, and 30 percent received antimalarial drugs.
Overall, 8 percent of children had diarrhoea in the two weeks preceding the survey. Among these children, 75 percent were taken to a health facility. Less than one-half (43%) were treated with some kind of oral rehydration therapy (ORT) or increased fluids, including 30 percent of children who were treated with a solution prepared from oral rehydration salt (ORS) packets and 19 percent who were given gruel. ORS use in treating diarrhoea among children remains low, even though 95 percent of mothers of young children have heard of ORS.
Full immunizationcoverage in Delhi ismuch higher than in
the nation as a whole, but is lower than in eight other states, and is also lower than it was
in NFHS-2.
Full Immunization Coverage by StatePercentage of children 12-23 months
NagalandUttar Pradesh
RajasthanArunachal Pradesh
AssamBihar
MeghalayaJharkhand
Madhya PradeshINDIA
GujaratAndhra Pradesh
MizoramManipur
ChhattisgarhTripuraOrissa
KarnatakaMaharashtraUttarakhand
PunjabDelhi
West BengalHaryana
Jammu & KashmirSikkim
Himachal PradeshKerala
GoaTamil Nadu
2123
2728
31333334
404445464747495052
55596060
63646567
707475
7981
Delhi.indd 16 3/19/09 12:50:49 PM
��
17
More than one-quarter of children (26%) with diarrhoea did not receive any type of treatment at all. Thirty-one percent received antibiotics, which are not normally recommended for treating childhood diarrhoea.
Children should receive more fluids than usual during diarrhoeal illness, but only 9 percent of children with diarrhoea received more liquids than normal. Sixty-eight percent of children with diarrhoea received less to drink than normal or did not receive anything to drink, which can increase the risk of dehydration.
Integrated Child Development Services (ICDS)The ICDS programme provides nutrition and health services for children under age six years and pregnant or breastfeeding women, as well as preschool activities for children age 3-5 years. These services are provided through community-based anganwadi centres.
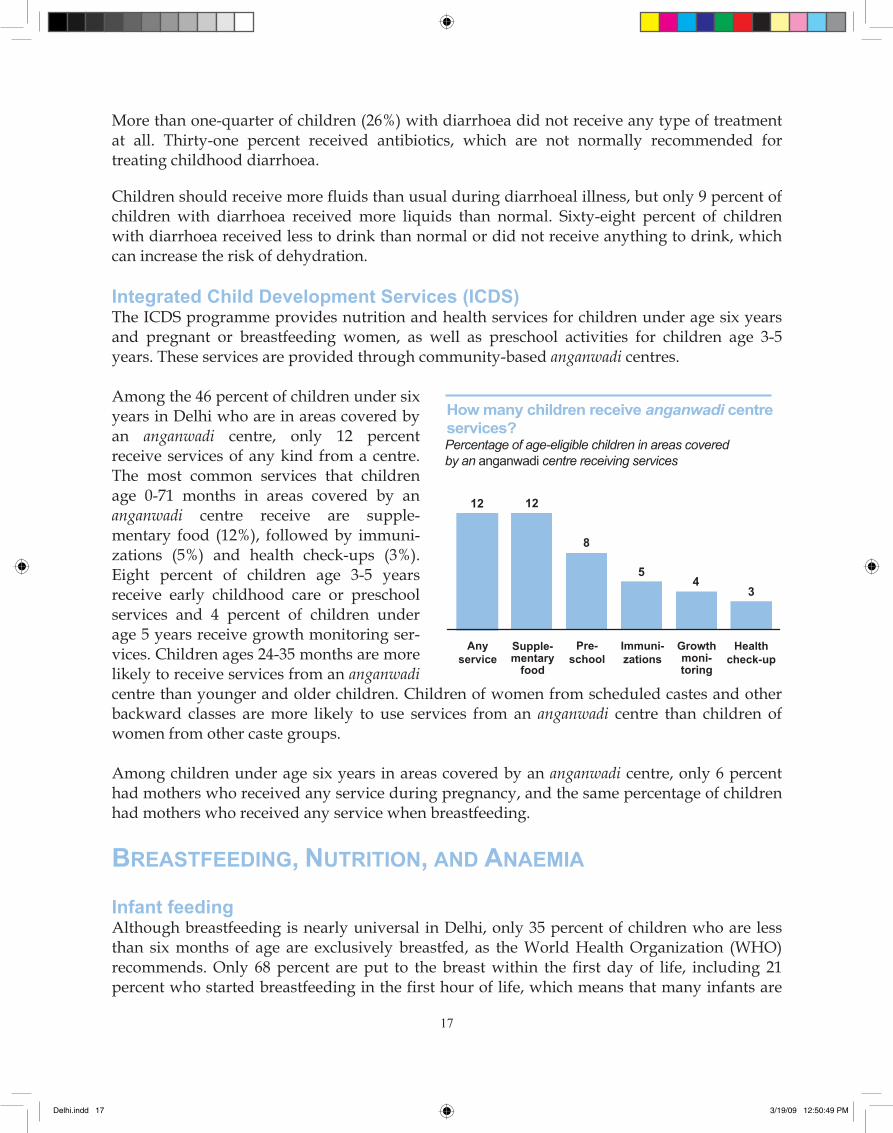
Among the 46 percent of children under six years in Delhi who are in areas covered by an anganwadi centre, only 12 percent receive services of any kind from a centre. The most common services that children age 0-71 months in areas covered by an anganwadi centre receive are supple-mentary food (12%), followed by immuni-zations (5%) and health check-ups (3%). Eight percent of children age 3-5 years receive early childhood care or preschool services and 4 percent of children under age 5 years receive growth monitoring ser-vices. Children ages 24-35 months are more likely to receive services from an anganwadicentre than younger and older children. Children of women from scheduled castes and other backward classes are more likely to use services from an anganwadi centre than children of women from other caste groups.
Among children under age six years in areas covered by an anganwadi centre, only 6 percent had mothers who received any service during pregnancy, and the same percentage of children had mothers who received any service when breastfeeding.
BREASTFEEDING, NUTRITION, AND ANAEMIA
Infant feedingAlthough breastfeeding is nearly universal in Delhi, only 35 percent of children who are less than six months of age are exclusively breastfed, as the World Health Organization (WHO) recommends. Only 68 percent are put to the breast within the first day of life, including 21 percent who started breastfeeding in the first hour of life, which means that many infants are
12 12
54
3
8
Anyservice
Immuni-zations
Pre-school
Supple-mentary
food
Growthmoni-toring
Healthcheck-up
How many children receive anganwadi centre services?Percentage of age-eligible children in areas coveredby an anganwadi centre receiving services
Delhi.indd 17 3/19/09 12:50:49 PM
��
18
deprived of the highly nutritious first milk (colostrum) and the antibodies it contains. Further, children are breastfed for an average of 21 months, which is shorter than the minimum of 24 months recommended by WHO for most children.
It is recommended that nothing be given to children other than breast milk in the first three days when the milk has not begun to flow regularly. However, about half of children (46%) are given something other than breast milk during that period.
WHO offers three recommendations for infant and young child feeding (IYCF) practices for children 6-23 months old: continued breastfeeding or feeding with appropriate calcium-rich foods if not breastfed; feeding solid or semi-solid food for a minimum number of times per day according to age and breastfeeding status; and including foods from a minimum number of food groups per day according to breastfeeding status. Only 55 percent of children age 6-23 months are fed the recommended minimum times per day and 48 percent are fed from the appropriate number of food groups. Only 34 percent are fed according to all three recommended practices.
Vitamin A deficiency can cause eye damage and a higher risk of dying from measles, diarrhoea, or malaria. The Government of India recommends that children under three years receive vitamin A supplements every six months, starting at age 9 months. However, only 20 percent of last-born children age 12-35 months were given a vitamin A supplement in the past six months, and only 49 percent of children age 6-35 months ate vitamin A-rich foods during the day or night before the interview.
Eating foods rich in iron and taking iron supplements can prevent anaemia. Only 16 percent of women’s youngest children age 6-35 months ate iron-rich foods during the day or night before the interview, and only 9 percent of children age 6-59 months were given iron supplements in the week before the interview.
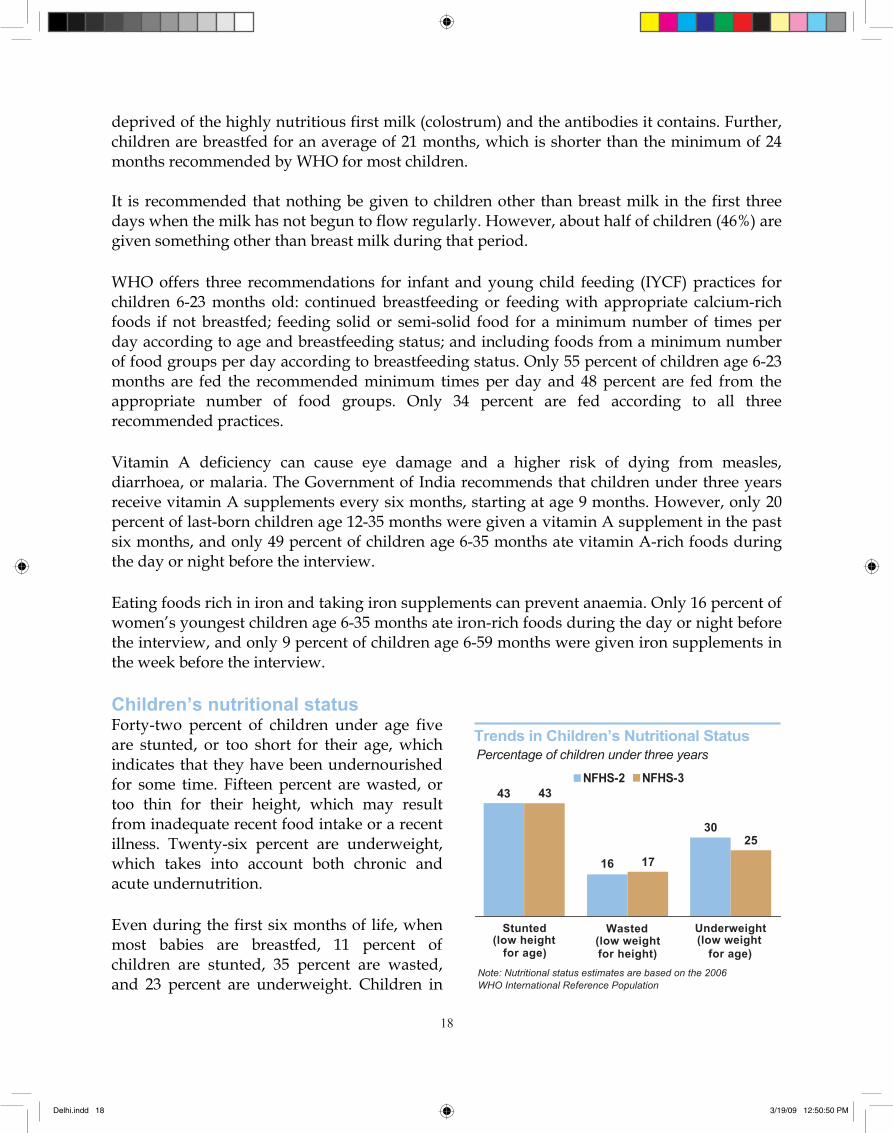
Children’s nutritional status Forty-two percent of children under age five are stunted, or too short for their age, which indicates that they have been undernourished for some time. Fifteen percent are wasted, or too thin for their height, which may result from inadequate recent food intake or a recent illness. Twenty-six percent are underweight, which takes into account both chronic and acute undernutrition.
Even during the first six months of life, when most babies are breastfed, 11 percent of children are stunted, 35 percent are wasted, and 23 percent are underweight. Children in
43 43
16 17
3025
Stunted(low height
for age)
Wasted (low weight for height)
Underweight (low weight
for age)
NFHS-3NFHS-2
Note: Nutritional status estimates are based on the 2006WHO International Reference Population
Trends in Children’s Nutritional StatusPercentage of children under three years
Delhi.indd 18 3/19/09 12:50:50 PM
��
19
slum areas are much more likely to be stunted and underweight than children in non-slum areas. Children in slum areas have a very high prevalence of severe stunting (31%). Even in the wealthiest households, one-third of children are stunted, 17 percent are wasted, and 20 percent are underweight. Girls are slightly less likely to be undernourished than boys.
Children’s nutritional status in Delhi has improved slightly since NFHS-2 by one measure (the prevalence of underweight), but not by all measures. Children under age three years (the age group for which nutritional status data are available in NFHS-2) are less likely to be too thin for their age, which means that acute undernutrition among children is less widespread today than it was seven years ago. However, children are equally likely to be too short for their age as they were at the time of NFHS-2, and they are slightly more likely to be too thin for their height.
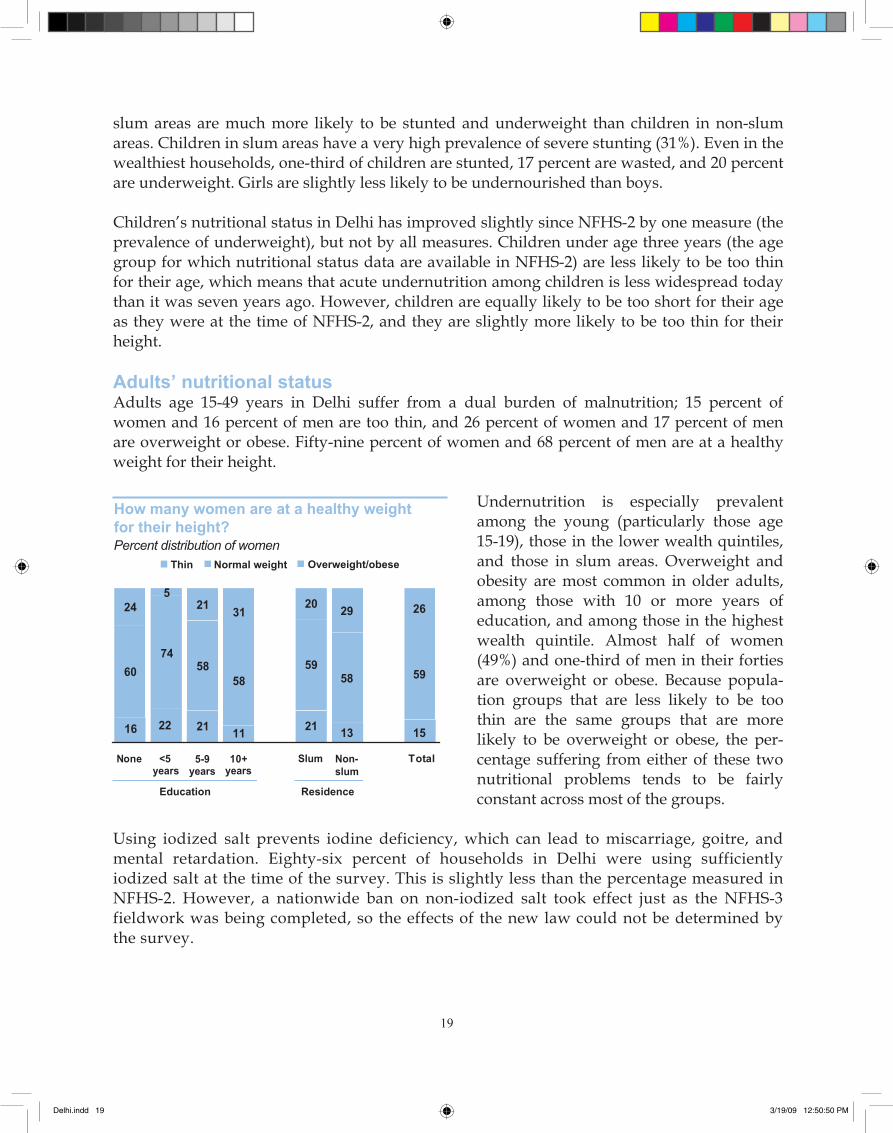
Adults’ nutritional status Adults age 15-49 years in Delhi suffer from a dual burden of malnutrition; 15 percent of women and 16 percent of men are too thin, and 26 percent of women and 17 percent of men are overweight or obese. Fifty-nine percent of women and 68 percent of men are at a healthy weight for their height.
Undernutrition is especially prevalent among the young (particularly those age 15-19), those in the lower wealth quintiles, and those in slum areas. Overweight and obesity are most common in older adults, among those with 10 or more years of education, and among those in the highest wealth quintile. Almost half of women (49%) and one-third of men in their forties are overweight or obese. Because popula-tion groups that are less likely to be too thin are the same groups that are more likely to be overweight or obese, the per-centage suffering from either of these two nutritional problems tends to be fairly constant across most of the groups.
Using iodized salt prevents iodine deficiency, which can lead to miscarriage, goitre, and mental retardation. Eighty-six percent of households in Delhi were using sufficiently iodized salt at the time of the survey. This is slightly less than the percentage measured in NFHS-2. However, a nationwide ban on non-iodized salt took effect just as the NFHS-3 fieldwork was being completed, so the effects of the new law could not be determined by the survey.
Normal weight
None <5years
5-9years
10+years
Slum Non-slum
Total
Education Residence
Thin Overweight/obese
How many women are at a healthy weight for their height?Percent distribution of women
16
24
74
521 31
58
11
58
21 21 13 15
59
26
58
29
59
20
60
22
Delhi.indd 19 3/19/09 12:50:50 PM
�0
20
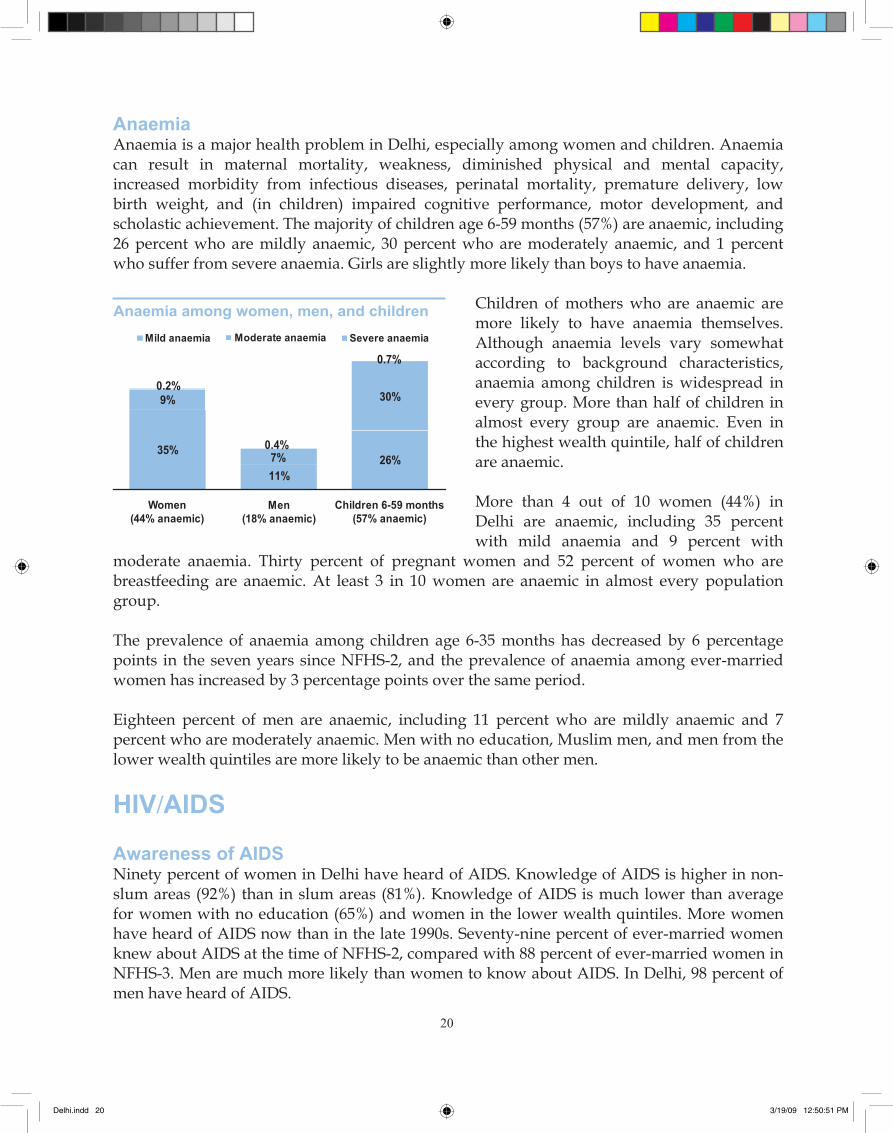
AnaemiaAnaemia is a major health problem in Delhi, especially among women and children. Anaemia can result in maternal mortality, weakness, diminished physical and mental capacity, increased morbidity from infectious diseases, perinatal mortality, premature delivery, low birth weight, and (in children) impaired cognitive performance, motor development, and scholastic achievement. The majority of children age 6-59 months (57%) are anaemic, including 26 percent who are mildly anaemic, 30 percent who are moderately anaemic, and 1 percent who suffer from severe anaemia. Girls are slightly more likely than boys to have anaemia.
Children of mothers who are anaemic are more likely to have anaemia themselves. Although anaemia levels vary somewhat according to background characteristics, anaemia among children is widespread in every group. More than half of children in almost every group are anaemic. Even in the highest wealth quintile, half of children are anaemic.
More than 4 out of 10 women (44%) in Delhi are anaemic, including 35 percent with mild anaemia and 9 percent with
moderate anaemia. Thirty percent of pregnant women and 52 percent of women who are breastfeeding are anaemic. At least 3 in 10 women are anaemic in almost every population group.
The prevalence of anaemia among children age 6-35 months has decreased by 6 percentage points in the seven years since NFHS-2, and the prevalence of anaemia among ever-married women has increased by 3 percentage points over the same period.
Eighteen percent of men are anaemic, including 11 percent who are mildly anaemic and 7 percent who are moderately anaemic. Men with no education, Muslim men, and men from the lower wealth quintiles are more likely to be anaemic than other men.
HIV/AIDS
Awareness of AIDSNinety percent of women in Delhi have heard of AIDS. Knowledge of AIDS is higher in non-slum areas (92%) than in slum areas (81%). Knowledge of AIDS is much lower than average for women with no education (65%) and women in the lower wealth quintiles. More women have heard of AIDS now than in the late 1990s. Seventy-nine percent of ever-married women knew about AIDS at the time of NFHS-2, compared with 88 percent of ever-married women in NFHS-3. Men are much more likely than women to know about AIDS. In Delhi, 98 percent of men have heard of AIDS.
Severe anaemia
Anaemia among women, men, and children
21%
Women(44% anaemic)
Men(18% anaemic)
Children 6-59 months(57% anaemic)
Mild anaemia Moderate anaemia
35%
9%
11%26%
30%
7%
0.2%
0.4%
0.7%
Delhi.indd 20 3/19/09 12:50:51 PM
��
21
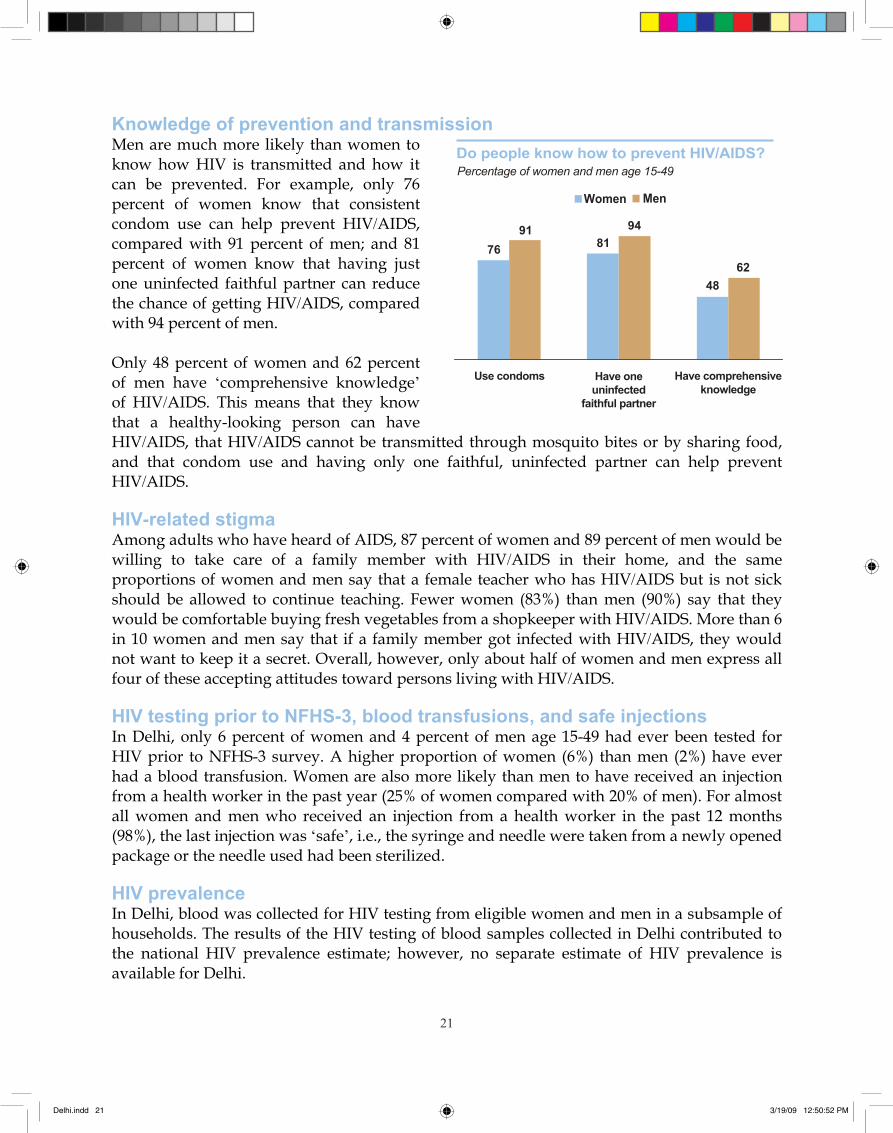
Knowledge of prevention and transmissionMen are much more likely than women to know how HIV is transmitted and how it can be prevented. For example, only 76 percent of women know that consistent condom use can help prevent HIV/AIDS,compared with 91 percent of men; and 81 percent of women know that having just one uninfected faithful partner can reduce the chance of getting HIV/AIDS, compared with 94 percent of men.
Only 48 percent of women and 62 percent of men have ‘comprehensive knowledge’of HIV/AIDS. This means that they know that a healthy-looking person can have HIV/AIDS, that HIV/AIDS cannot be transmitted through mosquito bites or by sharing food, and that condom use and having only one faithful, uninfected partner can help prevent HIV/AIDS.
HIV-related stigmaAmong adults who have heard of AIDS, 87 percent of women and 89 percent of men would be willing to take care of a family member with HIV/AIDS in their home, and the same proportions of women and men say that a female teacher who has HIV/AIDS but is not sick should be allowed to continue teaching. Fewer women (83%) than men (90%) say that they would be comfortable buying fresh vegetables from a shopkeeper with HIV/AIDS. More than 6 in 10 women and men say that if a family member got infected with HIV/AIDS, they would not want to keep it a secret. Overall, however, only about half of women and men express all four of these accepting attitudes toward persons living with HIV/AIDS.
HIV testing prior to NFHS-3, blood transfusions, and safe injections In Delhi, only 6 percent of women and 4 percent of men age 15-49 had ever been tested for HIV prior to NFHS-3 survey. A higher proportion of women (6%) than men (2%) have ever had a blood transfusion. Women are also more likely than men to have received an injection from a health worker in the past year (25% of women compared with 20% of men). For almost all women and men who received an injection from a health worker in the past 12 months (98%), the last injection was ‘safe’, i.e., the syringe and needle were taken from a newly opened package or the needle used had been sterilized.
HIV prevalenceIn Delhi, blood was collected for HIV testing from eligible women and men in a subsample of households. The results of the HIV testing of blood samples collected in Delhi contributed to the national HIV prevalence estimate; however, no separate estimate of HIV prevalence is available for Delhi.
7691
8194
4862
Use condoms Have oneuninfected
faithful partner
Have comprehensiveknowledge
MenWomen
Do people know how to prevent HIV/AIDS?Percentage of women and men age 15-49
Delhi.indd 21 3/19/09 12:50:52 PM
��
22
Nationally, NFHS-3 found that 0.28 percent of adults age 15-49 are infected with HIV, including 0.35 percent in urban areas and 0.25 percent in rural areas. If the six states considered by the National AIDS Control Organization (NACO) as having high HIV prevalence are excluded, the HIV prevalence estimate for the remaining 23 states combined, including Delhi, is only 0.12 percent overall, 0.08 among women age 15-49, and 0.16 among men age 15-49 (data not shown in tables).
SEXUAL BEHAVIOUR
NFHS-3 included questions on respondents’ sexual behaviour. Respondents were asked about their age at first sex, their current and previous sexual partners, and condom use. In addition, men were asked whether they had paid for sex in the past year. These questions are sensitive and subject to reporting bias, so the results should be interpreted with caution.
Age at first sexual intercourseHalf of the women age 25-49 in Delhi have had sexual intercourse by the time they are 19 years of age, while half of the men in that age group have had sexual intercourse by the time they are 24 years of age. Among youth 15-24 years of age, women are much more likely than men to have ever had sex. The earlier age at sexual intercourse for women than men is a consequence of the fact that first sexual intercourse largely occurs within marriage and women marry at younger ages than men.
Higher-risk sex and multiple sex partnersHigher-risk sex is sexual intercourse with someone who is neither a spouse nor a cohabiting partner. Among those who had sex in the past year, only 0.1 percent of women and 8 percent of men reported having had higher-risk sex during the year. Two percent of male respondents said they had multiple sex partners in the past year, but a negligible percentage of female respondents reported having multiple partners.
Use of condoms during higher-risk sex More than three out of five men (63%) who had higher-risk sex reported using a condom the last time they had higher-risk sex.
Paid sexOne percent of men said they had paid for sex in the past year.
ADULT HEALTH AND HEALTH CARE
TuberculosisIn Delhi, 231 persons per 100,000 are estimated to have medically treated tuberculosis based on reports from household respondents. The prevalence of tuberculosis is higher in slum areas (384) than in non-slum areas (197).
Delhi.indd 22 3/19/09 12:50:52 PM
��
23
Almost all respondents have heard of tuberculosis (98% of women and 99% of men). Among people who have heard of tuberculosis, more than three-quarters say that it is spread through the air by coughing or sneezing (76% of women and 79% of men). Seventy-eight percent of women and 69 percent of men have misconceptions about how tuberculosis is spread. However, almost all women and men know that tuberculosis can be cured (96% of women and 97% of men), and only 15 percent of women and 8 percent of men say that if a family member had tuberculosis, they would want to keep it a secret from the neighbours.
Diabetes, asthma, and goitreAccording to self reports, 2 percent of women and 1 percent of men age 15-49 suffer from diabetes. Diabetes is particularly prevalent in high wealth quintiles and at older ages. The prevalence of diabetes in the age group 35-49 is 4 percent among women and 3 percent among men. Less than 1 percent of adults suffer from asthma (547 per 100,000 women and 736 per 100,000 men). The prevalence of goitre or other thyroid disorders is much higher for women (1,481 per 100,000) than for men (133 per 100,000).
Tobacco and alcohol useForty percent of men and 3 percent of women use some form of tobacco. Men who use tobacco are most likely to smoke cigarettes or bidis, but a substantial proportion chew tobacco in the form of paan masala, gutkha, or other tobacco.
Women and men are more likely to use tobacco than to drink alcohol. One-third of men, but only 0.4 percent of women, drink alcohol. Twenty-two percent of men who drink consume alcohol once a week or more frequently.
Source of health careFor the majority of households (71%), the private medical sector is the main source of health care. Even in slum areas, more than two-thirds of households use the private medical sector. Among households that do not use government health facilities, the main reasons given for not doing so are long waiting times (57%), lack of a nearby facility (37%), and poor quality of care (36%) (data not shown in tables).
Health insuranceDespite the emergence of a number of health insurance programmes and health schemes, only 14 percent of households in Delhi report that they have any kind of health insurance that covers at least one member of the household. Three types of programmes dominate: a variety of private commercial health insurance schemes, the Central Government Health Scheme (CGHS), and the Employee State Insurance Scheme (ESIS). Households in non-slum areas (16%) are almost three times as likely as households in slum areas (6%) to have health insurance.
Delhi.indd 23 3/19/09 12:50:52 PM
��
24
WOMEN’S EMPOWERMENT
Employment and earnings Only one-fifth of currently married women (21%) age 15-49 were employed in the last year, compared with almost 100 percent of currently married men in the same age group. Overall, 91 percent of currently married employed women earn cash for their work, compared with 98 percent of currently married employed men. Five percent of employed women receive no payment for their work. Among currently married women who work and are paid in cash, 93 percent decide how their earnings will be used, either alone or together with their husbands. Twenty-nine percent of women who work for cash earn more than or about the same as their husbands.
Decision makingMarried women were asked who makes decisions about their own health care, making large household purchases, making purchases for daily household needs, and visiting their own family or relatives. About 7 out of 10 currently married women (67-76%) participate in making each of these decisions. However, only 52 percent participate in making all four of these decisions and 10 percent do not participate in making any of the four decisions. Older women, women in nuclear households, and women who are employed for cash are more likely than other women to participate in these household decisions.
Other indicators of women’s empowermentForty-three percent of women have some money that they can decide how to use. The proportion of women with money which they control is highest among women who are widowed, divorced, separated, or deserted, and women working for cash. Women in the highest wealth quintile, women with at least 10 years of education, Sikh women, and women belonging to ‘other’ religions are also more likely than other women to have money that they control.
Thirty percent of women (twice the national average) have a bank or savings account that they themselves use. Women’s knowledge and use of microcredit programmes is limited. More than one-quarter of women (29%) have heard of any microcredit programme in the area, but only 1 percent have ever used one.
Four-fifths of women (81%) are allowed to go by themselves to the market and 72 percent are allowed to go by themselves to a health facility, but only 37 percent have freedom to travel alone outside their own community (data not shown in tables). Only 37 percent of women are allowed to go alone to all three of these places. Muslim women, women in slums, scheduled-caste women, younger women, never married women, and women with no children have much lower freedom of movement than other women.
Delhi.indd 24 3/19/09 12:50:53 PM
��
25
Gender-role attitudes Almost one-third of women in Delhi (32%) believe that it is justifiable for a husband to beat his wife under specific circumstances. Women are most likely to say that wife-beating is justified if a woman shows disrespect for her in-laws (25%) or if she neglects the house or children or argues with him (14% each). Men are only slightly less likely than women to agree; 28 percent of men say wife-beating is justified in specific circumstances, including 25 percent who agree that disrespect for in-laws is justification for wife-beating. Even among women and men who have completed at least 10 years of schooling, 18-20 percent agree that a husband is justified in beating his wife for one or more specified reasons.
More than three-quarters of women (77%) and 90 percent of men believe that a woman is justified in refusing to have sex with her husband for all three of the following reasons: if she knows he has a sexually transmitted disease, if she knows he has intercourse with other women, or if she is tired or not in the mood.
DOMESTIC VIOLENCE
Among women age 15-49, 16 percent have ever experienced physical violence and 2 percent have ever experienced sexual violence. In all, 17 percent of women age 15-49 have experienced physical or sexual violence, including 19 percent of ever-married women.
Spousal violenceSixteen percent of ever-married women report having been slapped by their husband and 3-6 percent report being punched with their husbands’ fist or with something that could hurt them; having their arms twisted or hair pulled; being pushed, shaken, or having something thrown at them; and being kicked, dragged, or beaten up. One percent report that their husband tried to choke or burn them on purpose. Two percent report that their husband physically forced them to have sex. Overall, 16 percent of ever-married women have experienced spousal physical or sexual violence from their current husband or, if currently not married, their most recent husband. Five percent report spousal emotional violence. Only 1 percent of ever-married women have ever initiated violence against their husband.
Although the prevalence of spousal violence is lower among the more educated, seven percent of women who have at least 10 years of education have experienced spousal violence. Women whose mothers were beaten by their fathers are much more likely to be in abusive marriages themselves. Almost half of women whose mothers experienced spousal violence have themselves experienced spousal physical or sexual violence, compared with 11 percent of women whose mothers did not experience spousal violence. Women whose husbands consume alcohol and get drunk often are much more likely to experience spousal violence than women whose husbands do not consume any alcohol or drink but do not get drunk often. Sixty-four percent of women whose husbands get drunk often have experienced spousal violence. However, even among women whose husbands do not drink alcohol at all, 10 percent have experienced physical or sexual spousal violence.
Delhi.indd 25 3/19/09 12:50:53 PM
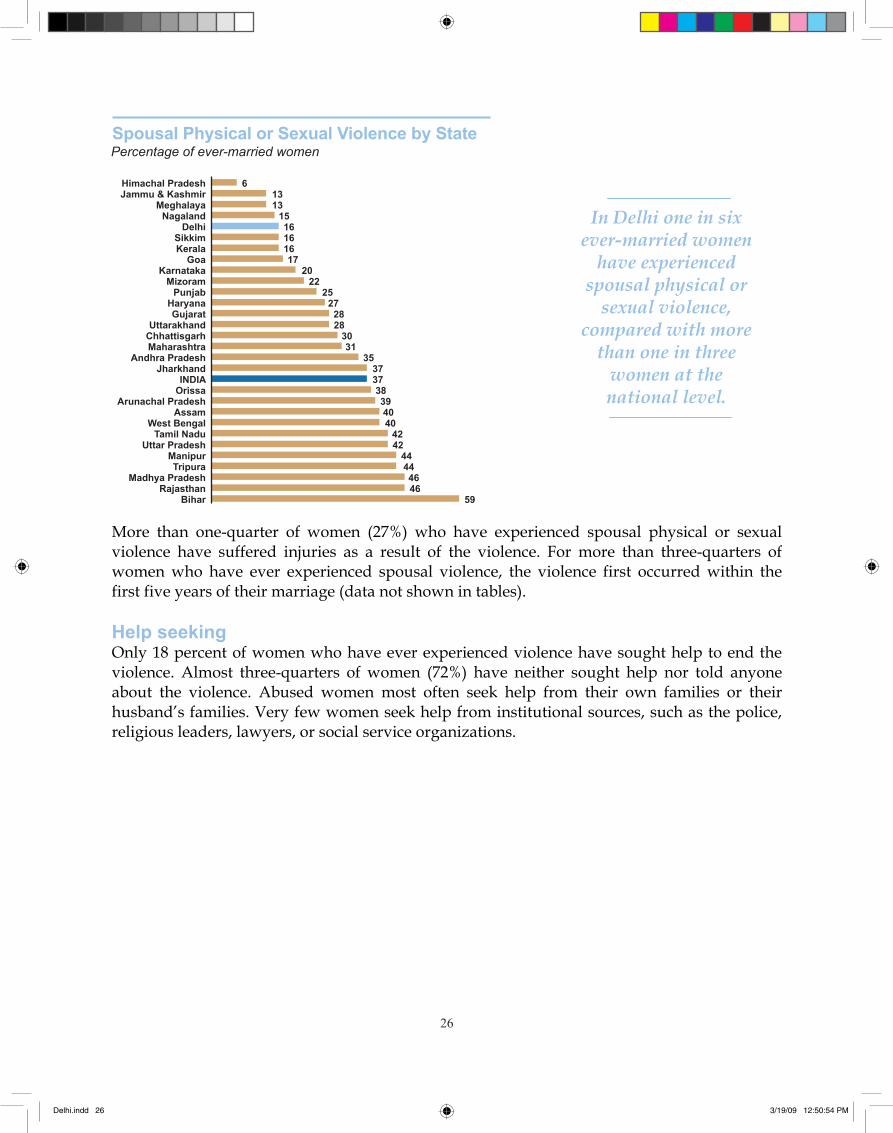
��
26
More than one-quarter of women (27%) who have experienced spousal physical or sexual violence have suffered injuries as a result of the violence. For more than three-quarters of women who have ever experienced spousal violence, the violence first occurred within the first five years of their marriage (data not shown in tables).
Help seekingOnly 18 percent of women who have ever experienced violence have sought help to end the violence. Almost three-quarters of women (72%) have neither sought help nor told anyone about the violence. Abused women most often seek help from their own families or their husband’s families. Very few women seek help from institutional sources, such as the police, religious leaders, lawyers, or social service organizations.
In Delhi one in sixever-married women
have experienced spousal physical or
sexual violence, compared with more
than one in three women at the national level.
Spousal Physical or Sexual Violence by StatePercentage of ever-married women
594646
4444
4242
4040
3938
3737
3531
302828
2725
2220
17161616
151313
6
BiharRajasthan
Madhya PradeshTripura
ManipurUttar Pradesh
Tamil NaduWest Bengal
AssamArunachal Pradesh
OrissaINDIA
JharkhandAndhra Pradesh
MaharashtraChhattisgarhUttarakhand
GujaratHaryana
PunjabMizoram
KarnatakaGoa
KeralaSikkim
DelhiNagaland
MeghalayaJammu & KashmirHimachal Pradesh
Delhi.indd 26 3/19/09 12:50:54 PM
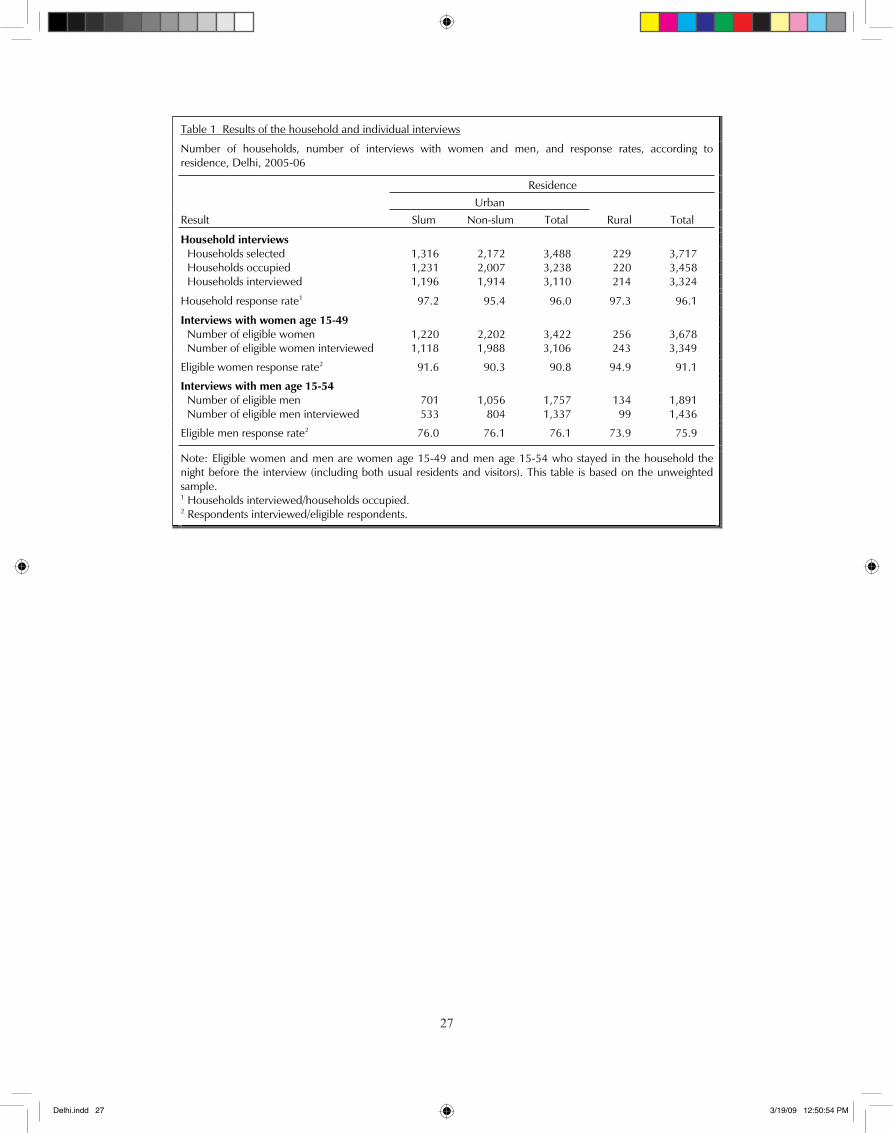
��
27
Table 1 Results of the household and individual interviews
Number of households, number of interviews with women and men, and response rates, according to residence, Delhi, 2005-06
Residence Urban Result Slum Non-slum Total Rural Total
Household interviews Households selected 1,316 2,172 3,488 229 3,717 Households occupied 1,231 2,007 3,238 220 3,458 Households interviewed 1,196 1,914 3,110 214 3,324
Household response rate1 97.2 95.4 96.0 97.3 96.1
Interviews with women age 15-49 Number of eligible women 1,220 2,202 3,422 256 3,678 Number of eligible women interviewed 1,118 1,988 3,106 243 3,349
Eligible women response rate2 91.6 90.3 90.8 94.9 91.1
Interviews with men age 15-54 Number of eligible men 701 1,056 1,757 134 1,891 Number of eligible men interviewed 533 804 1,337 99 1,436
Eligible men response rate2 76.0 76.1 76.1 73.9 75.9
Note: Eligible women and men are women age 15-49 and men age 15-54 who stayed in the household the night before the interview (including both usual residents and visitors). This table is based on the unweighted sample. 1 Households interviewed/households occupied. 2 Respondents interviewed/eligible respondents.
Delhi.indd 27 3/19/09 12:50:54 PM
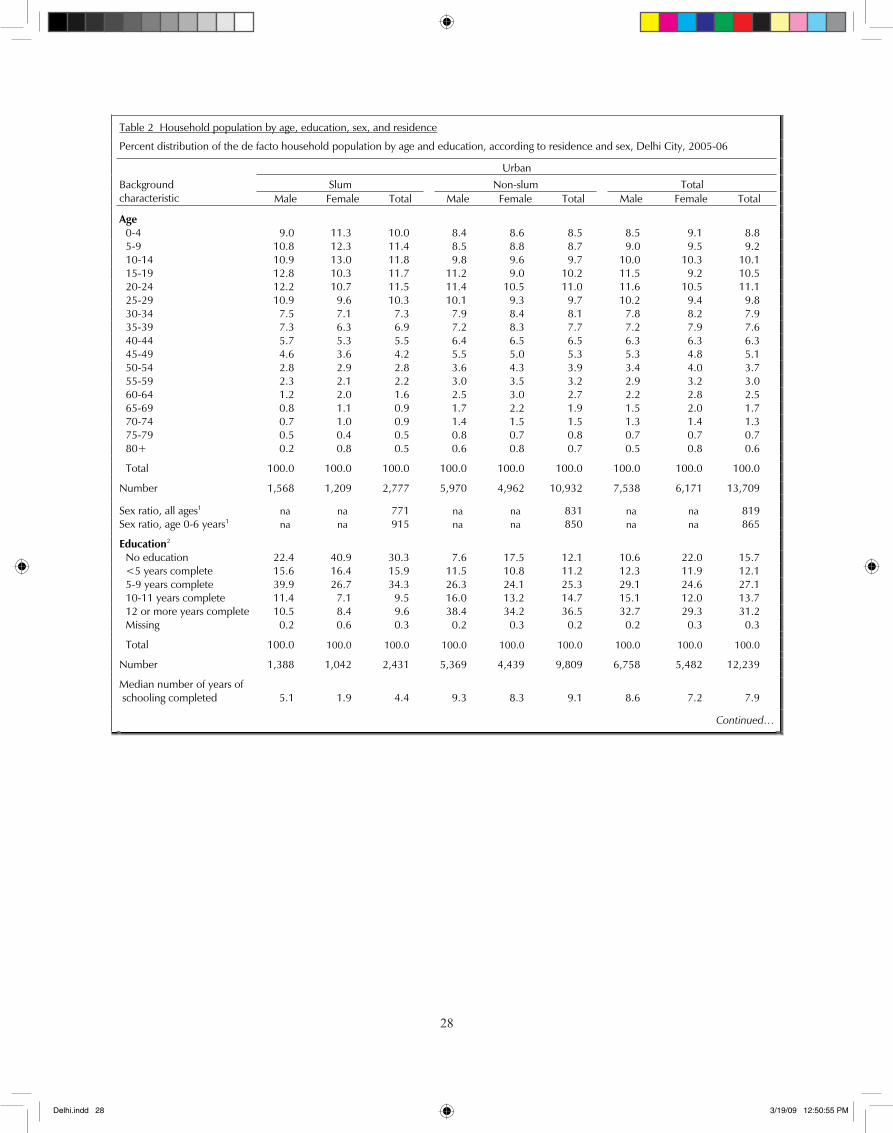
��
28
Table 2 Household population by age, education, sex, and residence
Percent distribution of the de facto household population by age and education, according to residence and sex, Delhi City, 2005-06
Urban Slum Non-slum Total Background characteristic Male Female Total Male Female Total Male Female Total
Age 0-4 9.0 11.3 10.0 8.4 8.6 8.5 8.5 9.1 8.8 5-9 10.8 12.3 11.4 8.5 8.8 8.7 9.0 9.5 9.2 10-14 10.9 13.0 11.8 9.8 9.6 9.7 10.0 10.3 10.1 15-19 12.8 10.3 11.7 11.2 9.0 10.2 11.5 9.2 10.5 20-24 12.2 10.7 11.5 11.4 10.5 11.0 11.6 10.5 11.1 25-29 10.9 9.6 10.3 10.1 9.3 9.7 10.2 9.4 9.8 30-34 7.5 7.1 7.3 7.9 8.4 8.1 7.8 8.2 7.9 35-39 7.3 6.3 6.9 7.2 8.3 7.7 7.2 7.9 7.6 40-44 5.7 5.3 5.5 6.4 6.5 6.5 6.3 6.3 6.3 45-49 4.6 3.6 4.2 5.5 5.0 5.3 5.3 4.8 5.1 50-54 2.8 2.9 2.8 3.6 4.3 3.9 3.4 4.0 3.7 55-59 2.3 2.1 2.2 3.0 3.5 3.2 2.9 3.2 3.0 60-64 1.2 2.0 1.6 2.5 3.0 2.7 2.2 2.8 2.5 65-69 0.8 1.1 0.9 1.7 2.2 1.9 1.5 2.0 1.7 70-74 0.7 1.0 0.9 1.4 1.5 1.5 1.3 1.4 1.3 75-79 0.5 0.4 0.5 0.8 0.7 0.8 0.7 0.7 0.7 80+ 0.2 0.8 0.5 0.6 0.8 0.7 0.5 0.8 0.6
Total 100.0 100.0 100.0 100.0 100.0 100.0 100.0 100.0 100.0
Number 1,568 1,209 2,777 5,970 4,962 10,932 7,538 6,171 13,709
Sex ratio, all ages1 na na 771 na na 831 na na 819 Sex ratio, age 0-6 years1 na na 915 na na 850 na na 865
Education2 No education 22.4 40.9 30.3 7.6 17.5 12.1 10.6 22.0 15.7 <5 years complete 15.6 16.4 15.9 11.5 10.8 11.2 12.3 11.9 12.1 5-9 years complete 39.9 26.7 34.3 26.3 24.1 25.3 29.1 24.6 27.1 10-11 years complete 11.4 7.1 9.5 16.0 13.2 14.7 15.1 12.0 13.7 12 or more years complete 10.5 8.4 9.6 38.4 34.2 36.5 32.7 29.3 31.2 Missing 0.2 0.6 0.3 0.2 0.3 0.2 0.2 0.3 0.3
Total 100.0 100.0 100.0 100.0 100.0 100.0 100.0 100.0 100.0
Number 1,388 1,042 2,431 5,369 4,439 9,809 6,758 5,482 12,239
Median number of years of schooling completed 5.1 1.9 4.4 9.3 8.3 9.1 8.6 7.2 7.9
Continued…
Delhi.indd 28 3/19/09 12:50:55 PM
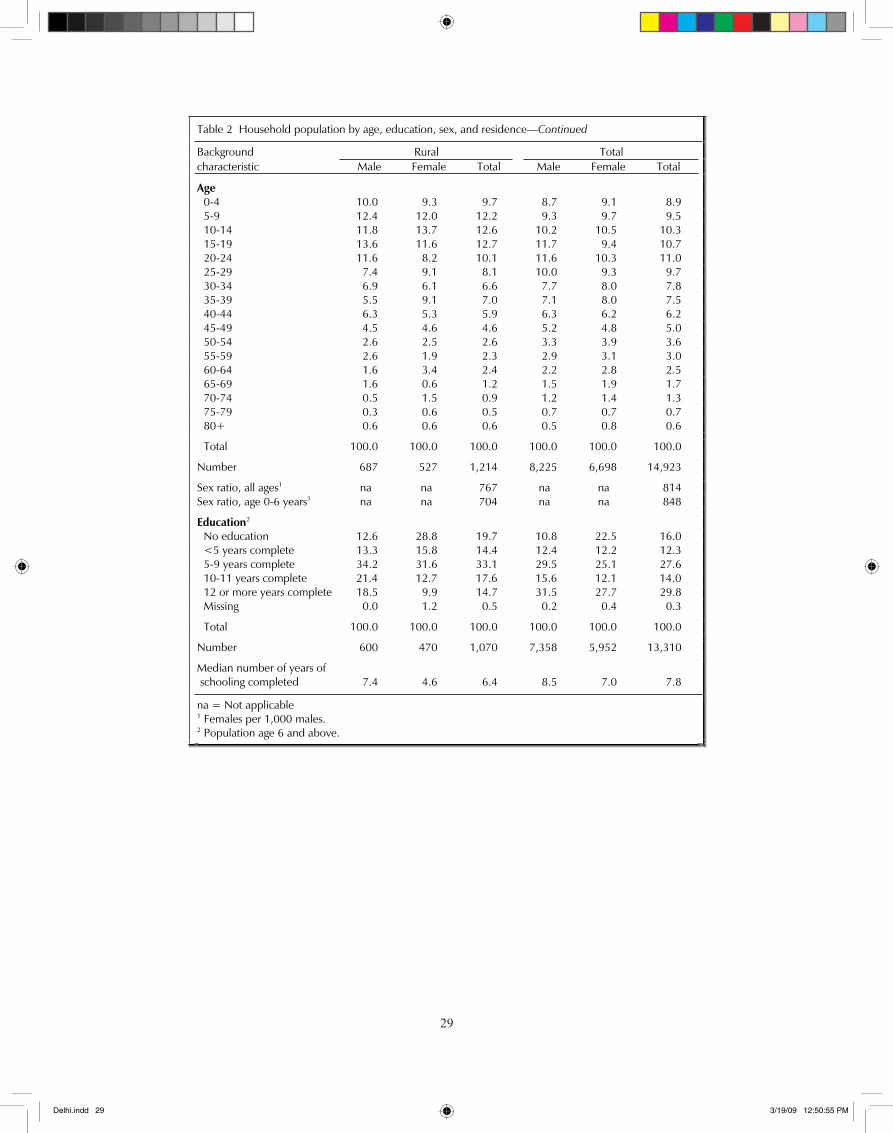
��
29
Table 2 Household population by age, education, sex, and residence—Continued
Background Rural Total characteristic Male Female Total Male Female Total
Age 0-4 10.0 9.3 9.7 8.7 9.1 8.9 5-9 12.4 12.0 12.2 9.3 9.7 9.5 10-14 11.8 13.7 12.6 10.2 10.5 10.3 15-19 13.6 11.6 12.7 11.7 9.4 10.7 20-24 11.6 8.2 10.1 11.6 10.3 11.0 25-29 7.4 9.1 8.1 10.0 9.3 9.7 30-34 6.9 6.1 6.6 7.7 8.0 7.8 35-39 5.5 9.1 7.0 7.1 8.0 7.5 40-44 6.3 5.3 5.9 6.3 6.2 6.2 45-49 4.5 4.6 4.6 5.2 4.8 5.0 50-54 2.6 2.5 2.6 3.3 3.9 3.6 55-59 2.6 1.9 2.3 2.9 3.1 3.0 60-64 1.6 3.4 2.4 2.2 2.8 2.5 65-69 1.6 0.6 1.2 1.5 1.9 1.7 70-74 0.5 1.5 0.9 1.2 1.4 1.3 75-79 0.3 0.6 0.5 0.7 0.7 0.7 80+ 0.6 0.6 0.6 0.5 0.8 0.6
Total 100.0 100.0 100.0 100.0 100.0 100.0
Number 687 527 1,214 8,225 6,698 14,923
Sex ratio, all ages1 na na 767 na na 814 Sex ratio, age 0-6 years1 na na 704 na na 848
Education2 No education 12.6 28.8 19.7 10.8 22.5 16.0 <5 years complete 13.3 15.8 14.4 12.4 12.2 12.3 5-9 years complete 34.2 31.6 33.1 29.5 25.1 27.6 10-11 years complete 21.4 12.7 17.6 15.6 12.1 14.0 12 or more years complete 18.5 9.9 14.7 31.5 27.7 29.8 Missing 0.0 1.2 0.5 0.2 0.4 0.3
Total 100.0 100.0 100.0 100.0 100.0 100.0
Number 600 470 1,070 7,358 5,952 13,310
Median number of years of schooling completed 7.4 4.6 6.4 8.5 7.0 7.8
na = Not applicable 1 Females per 1,000 males. 2 Population age 6 and above.
Delhi.indd 29 3/19/09 12:50:55 PM
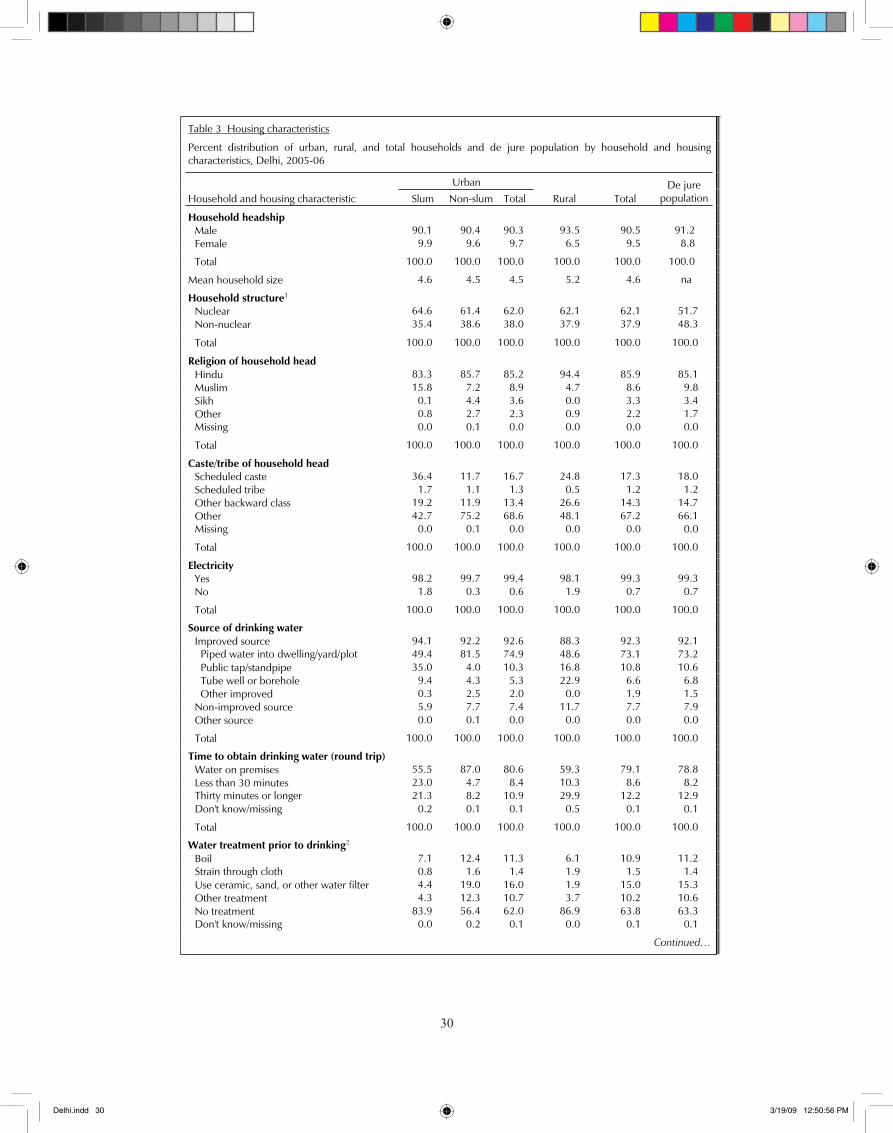
�0
30
Table 3 Housing characteristics
Percent distribution of urban, rural, and total households and de jure population by household and housing characteristics, Delhi, 2005-06
Urban
Household and housing characteristic Slum Non-slum Total Rural Total De jure
population
Household headship Male 90.1 90.4 90.3 93.5 90.5 91.2 Female 9.9 9.6 9.7 6.5 9.5 8.8
Total 100.0 100.0 100.0 100.0 100.0 100.0
Mean household size 4.6 4.5 4.5 5.2 4.6 na
Household structure1 Nuclear 64.6 61.4 62.0 62.1 62.1 51.7 Non-nuclear 35.4 38.6 38.0 37.9 37.9 48.3
Total 100.0 100.0 100.0 100.0 100.0 100.0
Religion of household head Hindu 83.3 85.7 85.2 94.4 85.9 85.1 Muslim 15.8 7.2 8.9 4.7 8.6 9.8 Sikh 0.1 4.4 3.6 0.0 3.3 3.4 Other 0.8 2.7 2.3 0.9 2.2 1.7
Missing 0.0 0.1 0.0 0.0 0.0 0.0
Total 100.0 100.0 100.0 100.0 100.0 100.0
Caste/tribe of household head Scheduled caste 36.4 11.7 16.7 24.8 17.3 18.0 Scheduled tribe 1.7 1.1 1.3 0.5 1.2 1.2 Other backward class 19.2 11.9 13.4 26.6 14.3 14.7 Other 42.7 75.2 68.6 48.1 67.2 66.1
Missing 0.0 0.1 0.0 0.0 0.0 0.0
Total 100.0 100.0 100.0 100.0 100.0 100.0
Electricity Yes 98.2 99.7 99.4 98.1 99.3 99.3 No 1.8 0.3 0.6 1.9 0.7 0.7
Total 100.0 100.0 100.0 100.0 100.0 100.0
Source of drinking water Improved source 94.1 92.2 92.6 88.3 92.3 92.1
Piped water into dwelling/yard/plot 49.4 81.5 74.9 48.6 73.1 73.2 Public tap/standpipe 35.0 4.0 10.3 16.8 10.8 10.6 Tube well or borehole 9.4 4.3 5.3 22.9 6.6 6.8 Other improved 0.3 2.5 2.0 0.0 1.9 1.5 Non-improved source 5.9 7.7 7.4 11.7 7.7 7.9 Other source 0.0 0.1 0.0 0.0 0.0 0.0
Total 100.0 100.0 100.0 100.0 100.0 100.0
Time to obtain drinking water (round trip) Water on premises 55.5 87.0 80.6 59.3 79.1 78.8 Less than 30 minutes 23.0 4.7 8.4 10.3 8.6 8.2
Thirty minutes or longer 21.3 8.2 10.9 29.9 12.2 12.9 Don't know/missing 0.2 0.1 0.1 0.5 0.1 0.1
Total 100.0 100.0 100.0 100.0 100.0 100.0
Water treatment prior to drinking2 Boil 7.1 12.4 11.3 6.1 10.9 11.2
Strain through cloth 0.8 1.6 1.4 1.9 1.5 1.4 Use ceramic, sand, or other water filter 4.4 19.0 16.0 1.9 15.0 15.3 Other treatment 4.3 12.3 10.7 3.7 10.2 10.6 No treatment 83.9 56.4 62.0 86.9 63.8 63.3
Don't know/missing 0.0 0.2 0.1 0.0 0.1 0.1
Continued…
Delhi.indd 30 3/19/09 12:50:56 PM
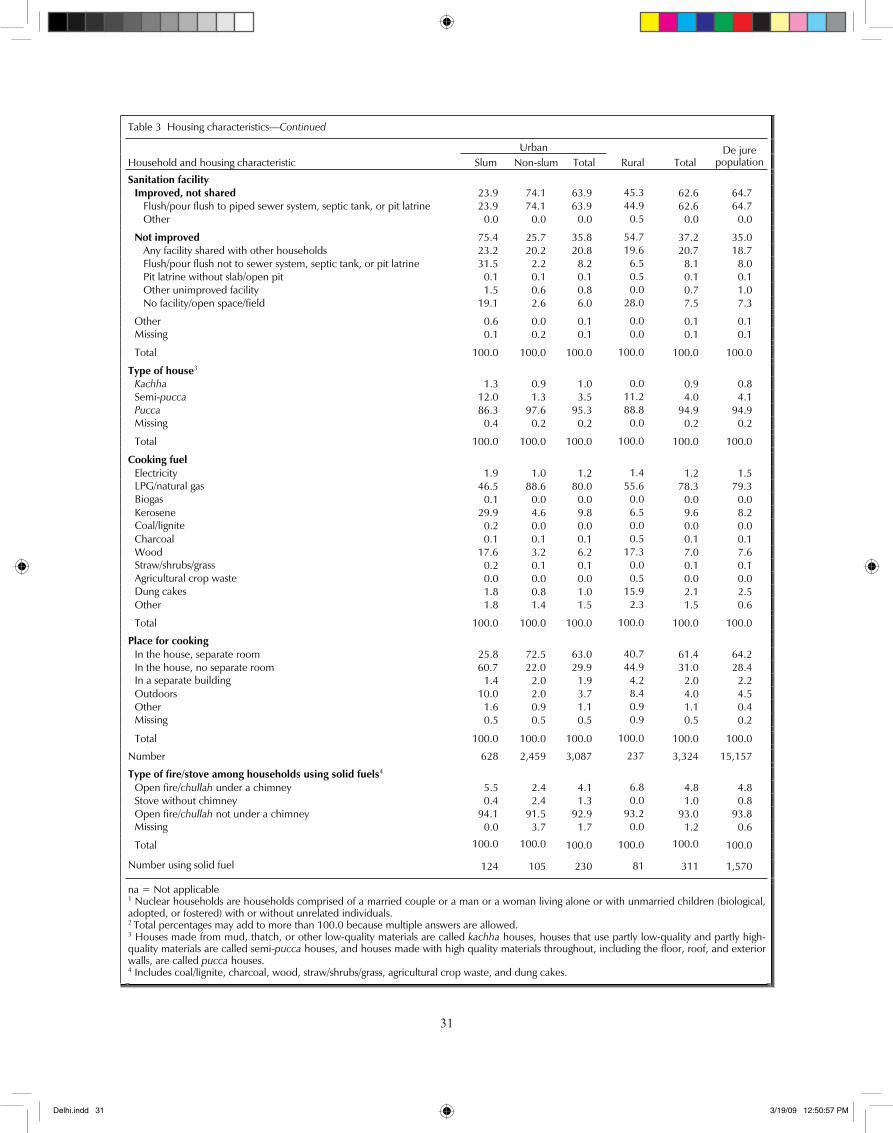
��
31
Table 3 Housing characteristics—Continued
Urban Household and housing characteristic Slum Non-slum Total Rural Total
De jure population
Sanitation facility Improved, not shared 23.9 74.1 63.9 45.3 62.6 64.7
Flush/pour flush to piped sewer system, septic tank, or pit latrine 23.9 74.1 63.9 44.9 62.6 64.7 Other 0.0 0.0 0.0 0.5 0.0 0.0
Not improved 75.4 25.7 35.8 54.7 37.2 35.0 Any facility shared with other households 23.2 20.2 20.8 19.6 20.7 18.7 Flush/pour flush not to sewer system, septic tank, or pit latrine 31.5 2.2 8.2 6.5 8.1 8.0 Pit latrine without slab/open pit 0.1 0.1 0.1 0.5 0.1 0.1 Other unimproved facility 1.5 0.6 0.8 0.0 0.7 1.0 No facility/open space/field 19.1 2.6 6.0 28.0 7.5 7.3
Other 0.6 0.0 0.1 0.0 0.1 0.1 Missing 0.1 0.2 0.1 0.0 0.1 0.1
Total 100.0 100.0 100.0 100.0 100.0 100.0
Type of house3 Kachha 1.3 0.9 1.0 0.0 0.9 0.8
Semi-pucca 12.0 1.3 3.5 11.2 4.0 4.1 Pucca 86.3 97.6 95.3 88.8 94.9 94.9 Missing 0.4 0.2 0.2 0.0 0.2 0.2
Total 100.0 100.0 100.0 100.0 100.0 100.0
Cooking fuel Electricity 1.9 1.0 1.2 1.4 1.2 1.5
LPG/natural gas 46.5 88.6 80.0 55.6 78.3 79.3 Biogas 0.1 0.0 0.0 0.0 0.0 0.0
Kerosene 29.9 4.6 9.8 6.5 9.6 8.2 Coal/lignite 0.2 0.0 0.0 0.0 0.0 0.0
Charcoal 0.1 0.1 0.1 0.5 0.1 0.1 Wood 17.6 3.2 6.2 17.3 7.0 7.6
Straw/shrubs/grass 0.2 0.1 0.1 0.0 0.1 0.1 Agricultural crop waste 0.0 0.0 0.0 0.5 0.0 0.0 Dung cakes 1.8 0.8 1.0 15.9 2.1 2.5 Other 1.8 1.4 1.5 2.3 1.5 0.6
Total 100.0 100.0 100.0 100.0 100.0 100.0
Place for cooking In the house, separate room 25.8 72.5 63.0 40.7 61.4 64.2 In the house, no separate room 60.7 22.0 29.9 44.9 31.0 28.4
In a separate building 1.4 2.0 1.9 4.2 2.0 2.2 Outdoors 10.0 2.0 3.7 8.4 4.0 4.5 Other 1.6 0.9 1.1 0.9 1.1 0.4
Missing 0.5 0.5 0.5 0.9 0.5 0.2
Total 100.0 100.0 100.0 100.0 100.0 100.0
Number 628 2,459 3,087 237 3,324 15,157
Type of fire/stove among households using solid fuels4 Open fire/chullah under a chimney 5.5 2.4 4.1 6.8 4.8 4.8 Stove without chimney 0.4 2.4 1.3 0.0 1.0 0.8 Open fire/chullah not under a chimney 94.1 91.5 92.9 93.2 93.0 93.8
Missing 0.0 3.7 1.7 0.0 1.2 0.6
Total 100.0 100.0 100.0 100.0 100.0 100.0
Number using solid fuel 124 105 230 81 311 1,570
na = Not applicable 1 Nuclear households are households comprised of a married couple or a man or a woman living alone or with unmarried children (biological,adopted, or fostered) with or without unrelated individuals. 2 Total percentages may add to more than 100.0 because multiple answers are allowed. 3 Houses made from mud, thatch, or other low-quality materials are called kachha houses, houses that use partly low-quality and partly high-quality materials are called semi-pucca houses, and houses made with high quality materials throughout, including the floor, roof, and exterior walls, are called pucca houses. 4 Includes coal/lignite, charcoal, wood, straw/shrubs/grass, agricultural crop waste, and dung cakes.
Delhi.indd 31 3/19/09 12:50:57 PM
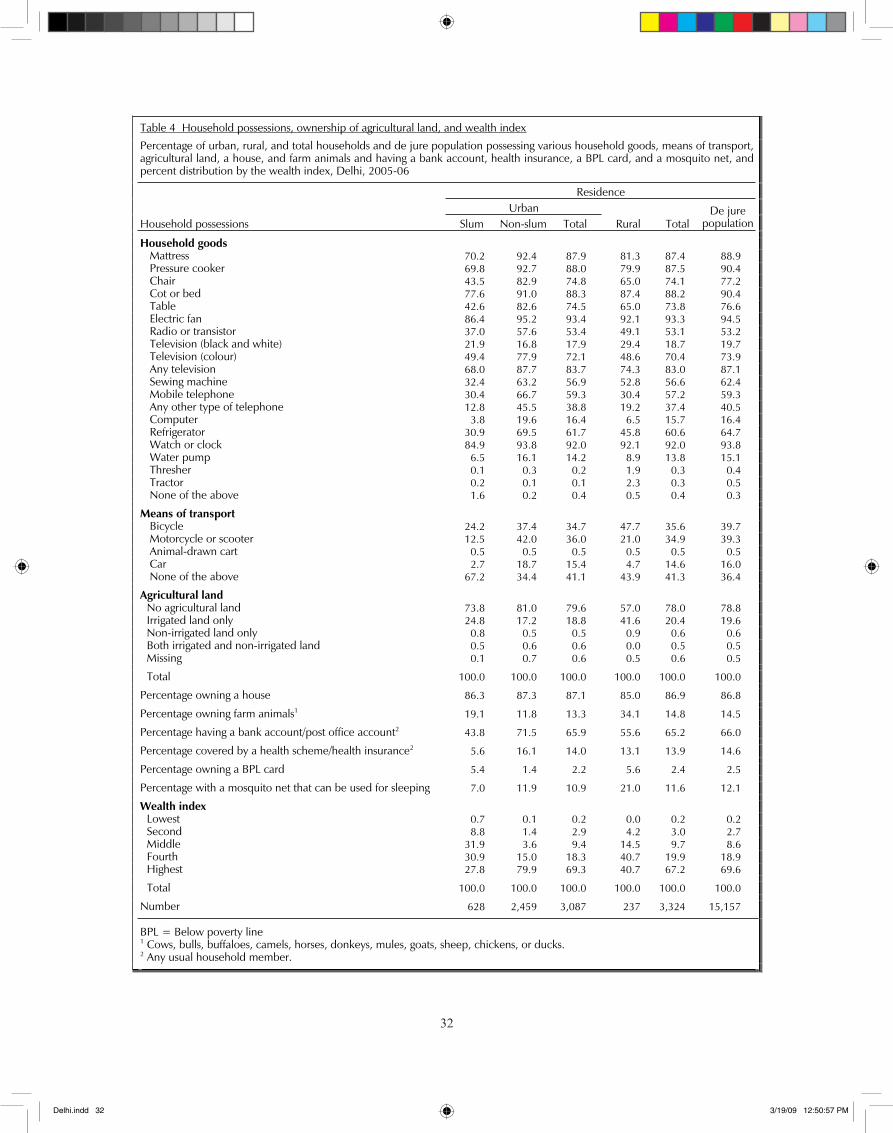
��
32
Table 4 Household possessions, ownership of agricultural land, and wealth index
Percentage of urban, rural, and total households and de jure population possessing various household goods, means of transport,agricultural land, a house, and farm animals and having a bank account, health insurance, a BPL card, and a mosquito net, and percent distribution by the wealth index, Delhi, 2005-06
Residence Urban
Household possessions Slum Non-slum Total Rural Total De jure
population
Household goods Mattress 70.2 92.4 87.9 81.3 87.4 88.9 Pressure cooker 69.8 92.7 88.0 79.9 87.5 90.4 Chair 43.5 82.9 74.8 65.0 74.1 77.2 Cot or bed 77.6 91.0 88.3 87.4 88.2 90.4 Table 42.6 82.6 74.5 65.0 73.8 76.6 Electric fan 86.4 95.2 93.4 92.1 93.3 94.5 Radio or transistor 37.0 57.6 53.4 49.1 53.1 53.2 Television (black and white) 21.9 16.8 17.9 29.4 18.7 19.7 Television (colour) 49.4 77.9 72.1 48.6 70.4 73.9 Any television 68.0 87.7 83.7 74.3 83.0 87.1 Sewing machine 32.4 63.2 56.9 52.8 56.6 62.4 Mobile telephone 30.4 66.7 59.3 30.4 57.2 59.3 Any other type of telephone 12.8 45.5 38.8 19.2 37.4 40.5 Computer 3.8 19.6 16.4 6.5 15.7 16.4 Refrigerator 30.9 69.5 61.7 45.8 60.6 64.7 Watch or clock 84.9 93.8 92.0 92.1 92.0 93.8 Water pump 6.5 16.1 14.2 8.9 13.8 15.1 Thresher 0.1 0.3 0.2 1.9 0.3 0.4 Tractor 0.2 0.1 0.1 2.3 0.3 0.5 None of the above 1.6 0.2 0.4 0.5 0.4 0.3
Means of transport Bicycle 24.2 37.4 34.7 47.7 35.6 39.7 Motorcycle or scooter 12.5 42.0 36.0 21.0 34.9 39.3 Animal-drawn cart 0.5 0.5 0.5 0.5 0.5 0.5 Car 2.7 18.7 15.4 4.7 14.6 16.0 None of the above 67.2 34.4 41.1 43.9 41.3 36.4
Agricultural land No agricultural land 73.8 81.0 79.6 57.0 78.0 78.8 Irrigated land only 24.8 17.2 18.8 41.6 20.4 19.6 Non-irrigated land only 0.8 0.5 0.5 0.9 0.6 0.6 Both irrigated and non-irrigated land 0.5 0.6 0.6 0.0 0.5 0.5 Missing 0.1 0.7 0.6 0.5 0.6 0.5
Total 100.0 100.0 100.0 100.0 100.0 100.0
Percentage owning a house 86.3 87.3 87.1 85.0 86.9 86.8
Percentage owning farm animals1 19.1 11.8 13.3 34.1 14.8 14.5
Percentage having a bank account/post office account2 43.8 71.5 65.9 55.6 65.2 66.0
Percentage covered by a health scheme/health insurance2 5.6 16.1 14.0 13.1 13.9 14.6
Percentage owning a BPL card 5.4 1.4 2.2 5.6 2.4 2.5
Percentage with a mosquito net that can be used for sleeping 7.0 11.9 10.9 21.0 11.6 12.1
Wealth index Lowest 0.7 0.1 0.2 0.0 0.2 0.2 Second 8.8 1.4 2.9 4.2 3.0 2.7 Middle 31.9 3.6 9.4 14.5 9.7 8.6 Fourth 30.9 15.0 18.3 40.7 19.9 18.9 Highest 27.8 79.9 69.3 40.7 67.2 69.6
Total 100.0 100.0 100.0 100.0 100.0 100.0
Number 628 2,459 3,087 237 3,324 15,157
BPL = Below poverty line 1 Cows, bulls, buffaloes, camels, horses, donkeys, mules, goats, sheep, chickens, or ducks. 2 Any usual household member.
Delhi.indd 32 3/19/09 12:50:57 PM
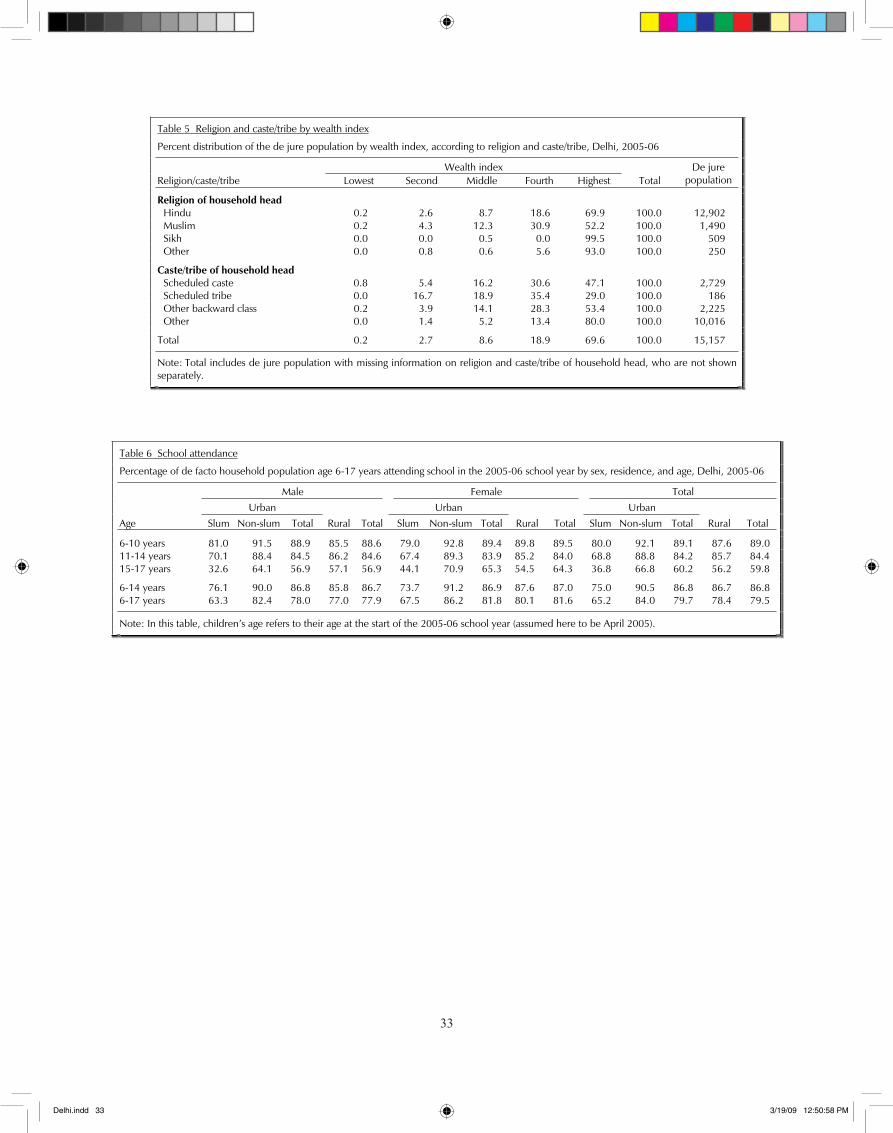
��
33
Table 5 Religion and caste/tribe by wealth index
Percent distribution of the de jure population by wealth index, according to religion and caste/tribe, Delhi, 2005-06
Wealth index Religion/caste/tribe Lowest Second Middle Fourth Highest Total
De jure population
Religion of household head Hindu 0.2 2.6 8.7 18.6 69.9 100.0 12,902 Muslim 0.2 4.3 12.3 30.9 52.2 100.0 1,490 Sikh 0.0 0.0 0.5 0.0 99.5 100.0 509 Other 0.0 0.8 0.6 5.6 93.0 100.0 250
Caste/tribe of household head Scheduled caste 0.8 5.4 16.2 30.6 47.1 100.0 2,729 Scheduled tribe 0.0 16.7 18.9 35.4 29.0 100.0 186 Other backward class 0.2 3.9 14.1 28.3 53.4 100.0 2,225 Other 0.0 1.4 5.2 13.4 80.0 100.0 10,016
Total 0.2 2.7 8.6 18.9 69.6 100.0 15,157
Note: Total includes de jure population with missing information on religion and caste/tribe of household head, who are not shown separately.
Table 6 School attendance
Percentage of de facto household population age 6-17 years attending school in the 2005-06 school year by sex, residence, and age, Delhi, 2005-06
Male Female Total Urban Urban Urban Age Slum Non-slum Total Rural Total Slum Non-slum Total Rural Total Slum Non-slum Total Rural Total
6-10 years 81.0 91.5 88.9 85.5 88.6 79.0 92.8 89.4 89.8 89.5 80.0 92.1 89.1 87.6 89.0 11-14 years 70.1 88.4 84.5 86.2 84.6 67.4 89.3 83.9 85.2 84.0 68.8 88.8 84.2 85.7 84.4 15-17 years 32.6 64.1 56.9 57.1 56.9 44.1 70.9 65.3 54.5 64.3 36.8 66.8 60.2 56.2 59.8
6-14 years 76.1 90.0 86.8 85.8 86.7 73.7 91.2 86.9 87.6 87.0 75.0 90.5 86.8 86.7 86.8 6-17 years 63.3 82.4 78.0 77.0 77.9 67.5 86.2 81.8 80.1 81.6 65.2 84.0 79.7 78.4 79.5
Note: In this table, children’s age refers to their age at the start of the 2005-06 school year (assumed here to be April 2005).
Delhi.indd 33 3/19/09 12:50:58 PM
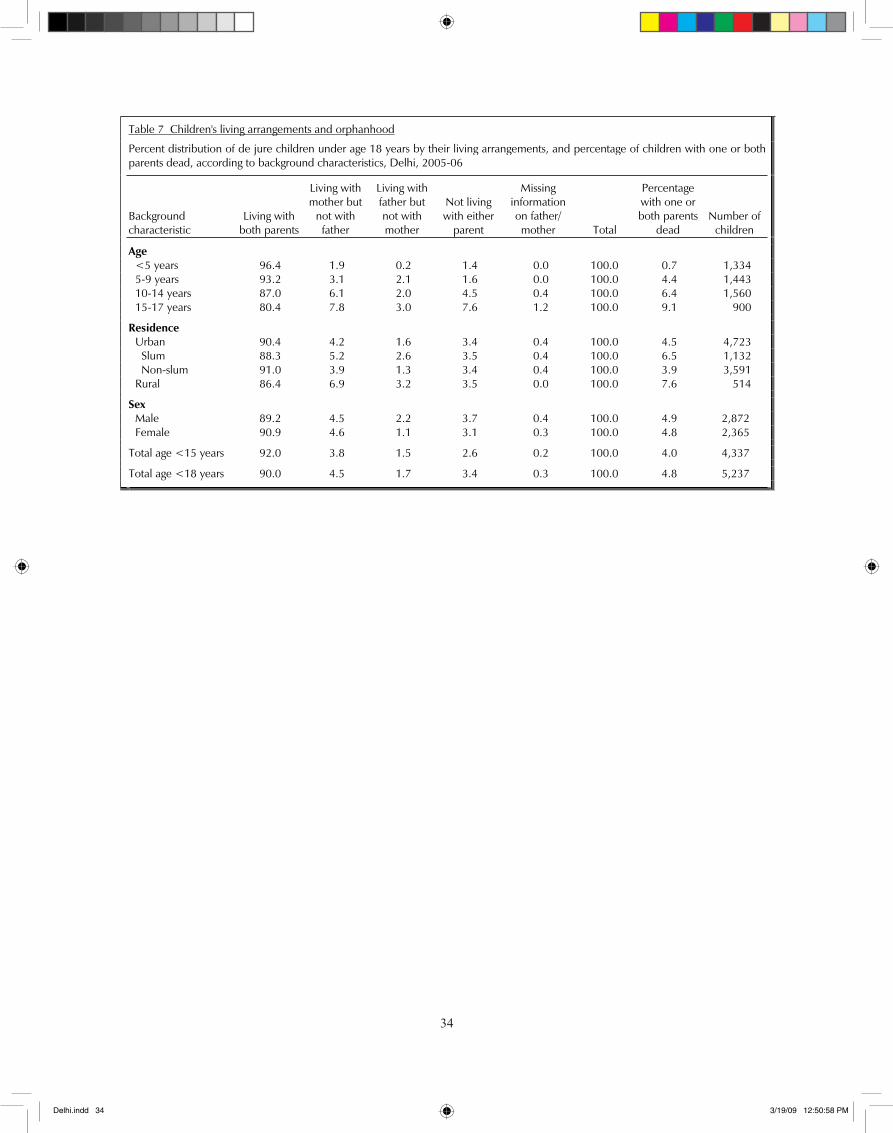
��
34
Table 7 Children's living arrangements and orphanhood
Percent distribution of de jure children under age 18 years by their living arrangements, and percentage of children with one or both parents dead, according to background characteristics, Delhi, 2005-06
Background characteristic
Living with both parents
Living with mother but
not with father
Living with father but not with mother
Not living with either
parent
Missing information on father/ mother Total
Percentage with one or both parents
dead Number of
children
Age <5 years 96.4 1.9 0.2 1.4 0.0 100.0 0.7 1,334 5-9 years 93.2 3.1 2.1 1.6 0.0 100.0 4.4 1,443 10-14 years 87.0 6.1 2.0 4.5 0.4 100.0 6.4 1,560 15-17 years 80.4 7.8 3.0 7.6 1.2 100.0 9.1 900
Residence Urban 90.4 4.2 1.6 3.4 0.4 100.0 4.5 4,723 Slum 88.3 5.2 2.6 3.5 0.4 100.0 6.5 1,132 Non-slum 91.0 3.9 1.3 3.4 0.4 100.0 3.9 3,591 Rural 86.4 6.9 3.2 3.5 0.0 100.0 7.6 514
Sex Male 89.2 4.5 2.2 3.7 0.4 100.0 4.9 2,872 Female 90.9 4.6 1.1 3.1 0.3 100.0 4.8 2,365
Total age <15 years 92.0 3.8 1.5 2.6 0.2 100.0 4.0 4,337
Total age <18 years 90.0 4.5 1.7 3.4 0.3 100.0 4.8 5,237
Delhi.indd 34 3/19/09 12:50:58 PM
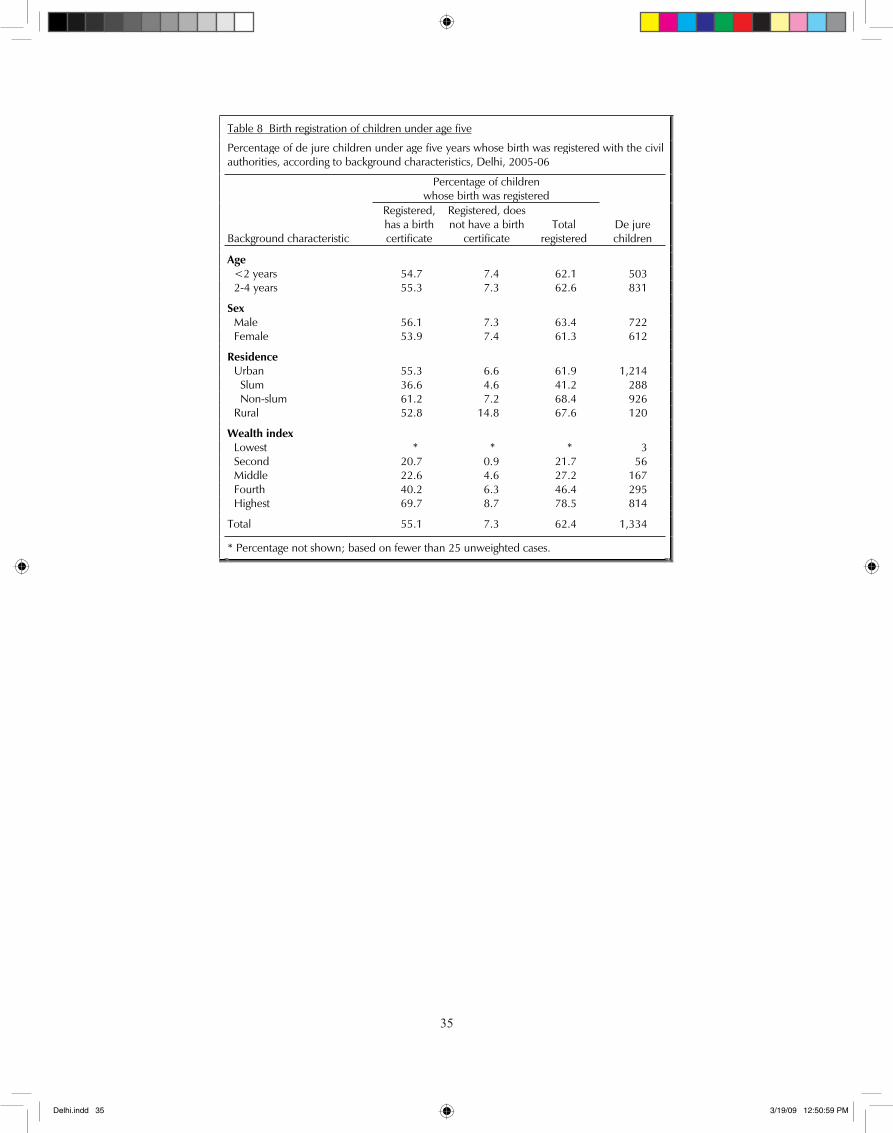
��
35
Table 8 Birth registration of children under age five
Percentage of de jure children under age five years whose birth was registered with the civil authorities, according to background characteristics, Delhi, 2005-06
Percentage of children whose birth was registered
Background characteristic
Registered, has a birth certificate
Registered, does not have a birth
certificate Total
registered De jure children
Age <2 years 54.7 7.4 62.1 503 2-4 years 55.3 7.3 62.6 831
Sex Male 56.1 7.3 63.4 722 Female 53.9 7.4 61.3 612
Residence Urban 55.3 6.6 61.9 1,214 Slum 36.6 4.6 41.2 288 Non-slum 61.2 7.2 68.4 926 Rural 52.8 14.8 67.6 120
Wealth index Lowest * * * 3 Second 20.7 0.9 21.7 56 Middle 22.6 4.6 27.2 167 Fourth 40.2 6.3 46.4 295 Highest 69.7 8.7 78.5 814
Total 55.1 7.3 62.4 1,334
* Percentage not shown; based on fewer than 25 unweighted cases.
Delhi.indd 35 3/19/09 12:50:59 PM
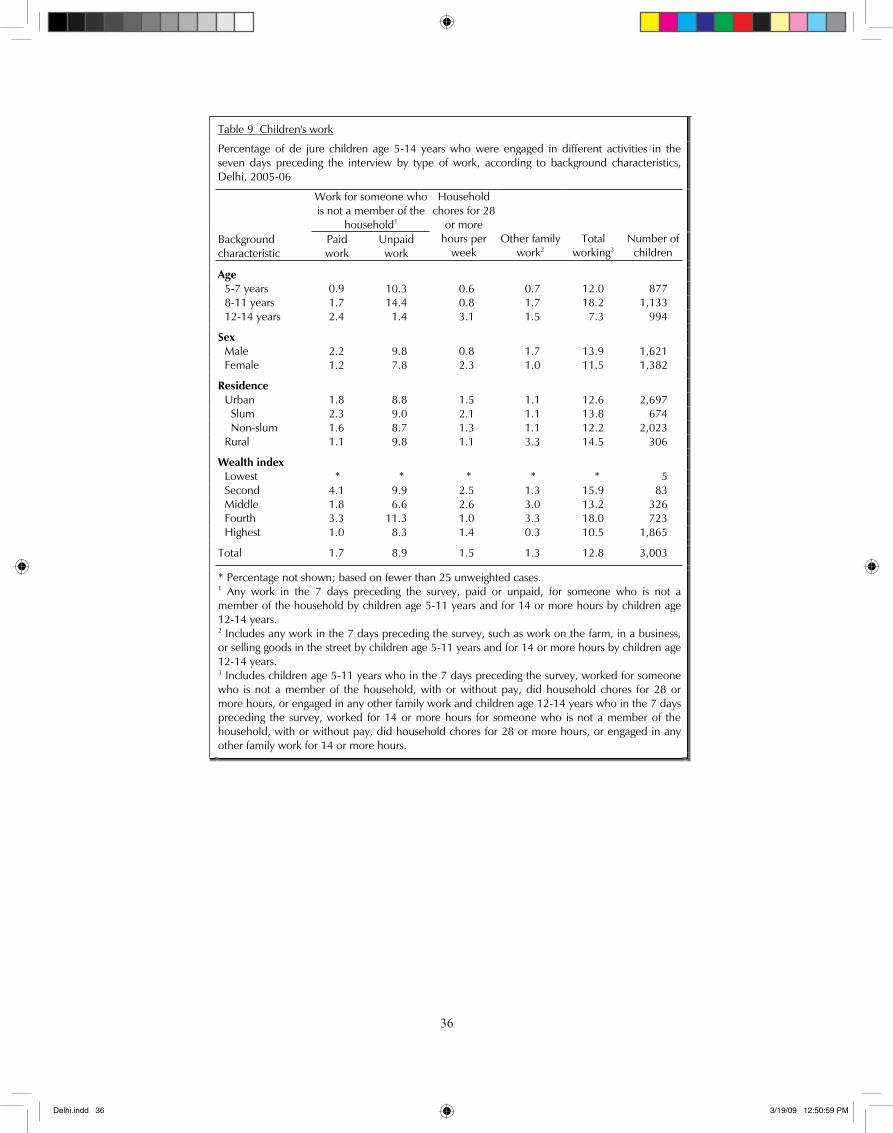
��
36
Table 9 Children's work
Percentage of de jure children age 5-14 years who were engaged in different activities in the seven days preceding the interview by type of work, according to background characteristics, Delhi, 2005-06
Work for someone who is not a member of the
household1
Background characteristic
Paidwork
Unpaid work
Household chores for 28
or more hours per
weekOther family
work2Total
working3Number of
children
Age 5-7 years 0.9 10.3 0.6 0.7 12.0 877 8-11 years 1.7 14.4 0.8 1.7 18.2 1,133 12-14 years 2.4 1.4 3.1 1.5 7.3 994
Sex Male 2.2 9.8 0.8 1.7 13.9 1,621 Female 1.2 7.8 2.3 1.0 11.5 1,382
Residence Urban 1.8 8.8 1.5 1.1 12.6 2,697 Slum 2.3 9.0 2.1 1.1 13.8 674 Non-slum 1.6 8.7 1.3 1.1 12.2 2,023 Rural 1.1 9.8 1.1 3.3 14.5 306
Wealth index Lowest * * * * * 5 Second 4.1 9.9 2.5 1.3 15.9 83 Middle 1.8 6.6 2.6 3.0 13.2 326 Fourth 3.3 11.3 1.0 3.3 18.0 723 Highest 1.0 8.3 1.4 0.3 10.5 1,865
Total 1.7 8.9 1.5 1.3 12.8 3,003
* Percentage not shown; based on fewer than 25 unweighted cases. 1 Any work in the 7 days preceding the survey, paid or unpaid, for someone who is not a member of the household by children age 5-11 years and for 14 or more hours by children age12-14 years. 2 Includes any work in the 7 days preceding the survey, such as work on the farm, in a business, or selling goods in the street by children age 5-11 years and for 14 or more hours by children age12-14 years. 3 Includes children age 5-11 years who in the 7 days preceding the survey, worked for someone who is not a member of the household, with or without pay, did household chores for 28 or more hours, or engaged in any other family work and children age 12-14 years who in the 7 days preceding the survey, worked for 14 or more hours for someone who is not a member of the household, with or without pay, did household chores for 28 or more hours, or engaged in any other family work for 14 or more hours.
Delhi.indd 36 3/19/09 12:50:59 PM
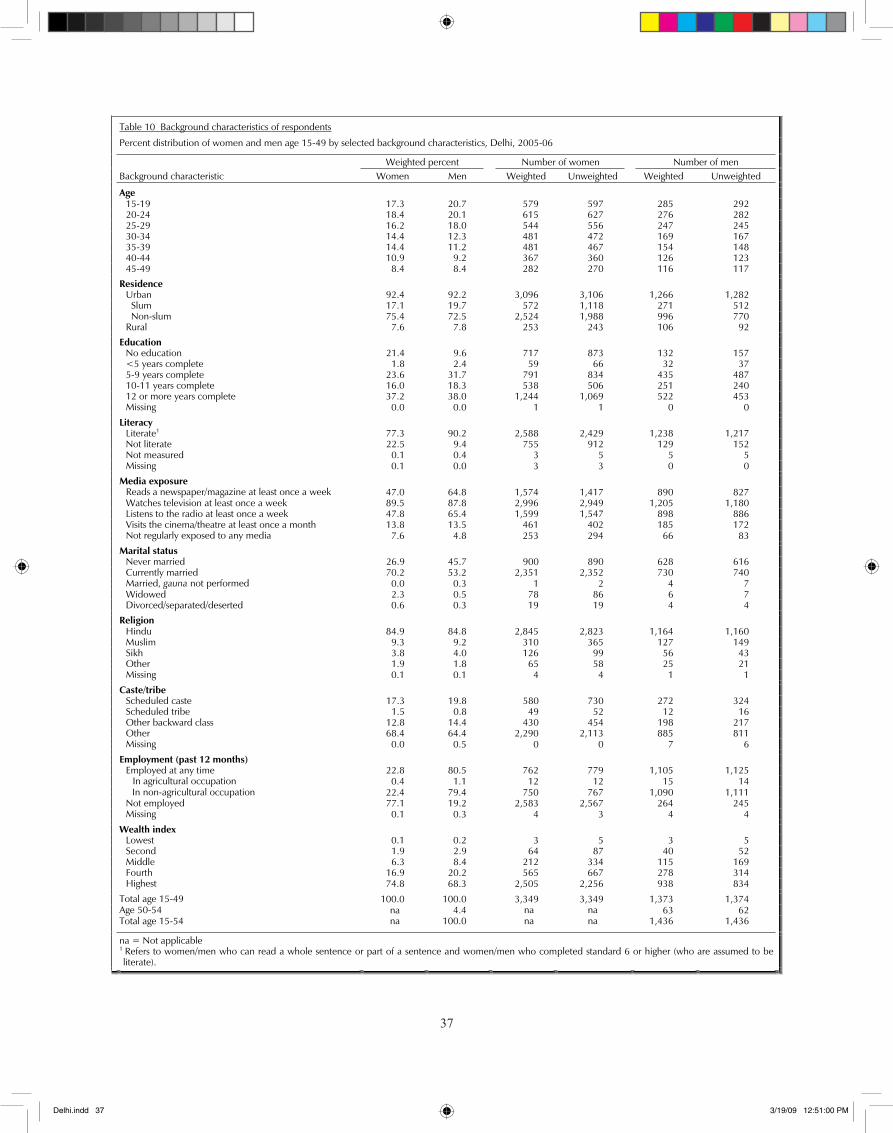
��
37
Table 10 Background characteristics of respondents
Percent distribution of women and men age 15-49 by selected background characteristics, Delhi, 2005-06
Weighted percent Number of women Number of men Background characteristic Women Men Weighted Unweighted Weighted Unweighted
Age 15-19 17.3 20.7 579 597 285 292 20-24 18.4 20.1 615 627 276 282 25-29 16.2 18.0 544 556 247 245 30-34 14.4 12.3 481 472 169 167 35-39 14.4 11.2 481 467 154 148 40-44 10.9 9.2 367 360 126 123 45-49 8.4 8.4 282 270 116 117
Residence Urban 92.4 92.2 3,096 3,106 1,266 1,282 Slum 17.1 19.7 572 1,118 271 512 Non-slum 75.4 72.5 2,524 1,988 996 770 Rural 7.6 7.8 253 243 106 92
Education No education 21.4 9.6 717 873 132 157 <5 years complete 1.8 2.4 59 66 32 37 5-9 years complete 23.6 31.7 791 834 435 487 10-11 years complete 16.0 18.3 538 506 251 240 12 or more years complete 37.2 38.0 1,244 1,069 522 453
Missing 0.0 0.0 1 1 0 0
Literacy Literate1 77.3 90.2 2,588 2,429 1,238 1,217 Not literate 22.5 9.4 755 912 129 152 Not measured 0.1 0.4 3 5 5 5
Missing 0.1 0.0 3 3 0 0
Media exposure Reads a newspaper/magazine at least once a week 47.0 64.8 1,574 1,417 890 827
Watches television at least once a week 89.5 87.8 2,996 2,949 1,205 1,180 Listens to the radio at least once a week 47.8 65.4 1,599 1,547 898 886 Visits the cinema/theatre at least once a month 13.8 13.5 461 402 185 172
Not regularly exposed to any media 7.6 4.8 253 294 66 83
Marital status Never married 26.9 45.7 900 890 628 616 Currently married 70.2 53.2 2,351 2,352 730 740
Married, gauna not performed 0.0 0.3 1 2 4 7 Widowed 2.3 0.5 78 86 6 7 Divorced/separated/deserted 0.6 0.3 19 19 4 4
Religion Hindu 84.9 84.8 2,845 2,823 1,164 1,160 Muslim 9.3 9.2 310 365 127 149 Sikh 3.8 4.0 126 99 56 43 Other 1.9 1.8 65 58 25 21
Missing 0.1 0.1 4 4 1 1
Caste/tribe Scheduled caste 17.3 19.8 580 730 272 324 Scheduled tribe 1.5 0.8 49 52 12 16 Other backward class 12.8 14.4 430 454 198 217 Other 68.4 64.4 2,290 2,113 885 811
Missing 0.0 0.5 0 0 7 6
Employment (past 12 months) Employed at any time 22.8 80.5 762 779 1,105 1,125
In agricultural occupation 0.4 1.1 12 12 15 14 In non-agricultural occupation 22.4 79.4 750 767 1,090 1,111
Not employed 77.1 19.2 2,583 2,567 264 245 Missing 0.1 0.3 4 3 4 4
Wealth index Lowest 0.1 0.2 3 5 3 5 Second 1.9 2.9 64 87 40 52 Middle 6.3 8.4 212 334 115 169 Fourth 16.9 20.2 565 667 278 314
Highest 74.8 68.3 2,505 2,256 938 834
Total age 15-49 100.0 100.0 3,349 3,349 1,373 1,374 Age 50-54 na 4.4 na na 63 62 Total age 15-54 na 100.0 na na 1,436 1,436
na = Not applicable 1 Refers to women/men who can read a whole sentence or part of a sentence and women/men who completed standard 6 or higher (who are assumed to be literate).
Delhi.indd 37 3/19/09 12:51:00 PM
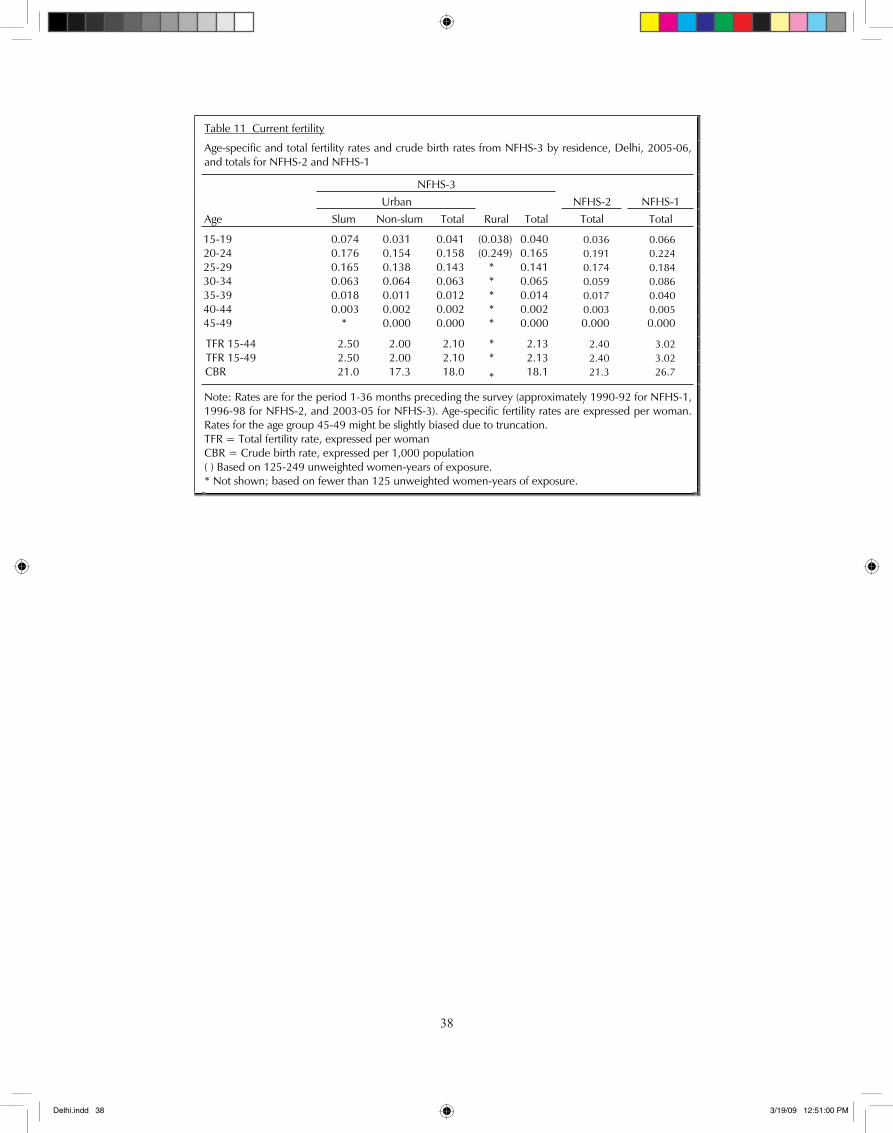
��
38
Table 11 Current fertility
Age-specific and total fertility rates and crude birth rates from NFHS-3 by residence, Delhi, 2005-06, and totals for NFHS-2 and NFHS-1
NFHS-3 Urban NFHS-2 NFHS-1 Age Slum Non-slum Total Rural Total Total Total
15-19 0.074 0.031 0.041 (0.038) 0.040 0.036 0.066 20-24 0.176 0.154 0.158 (0.249) 0.165 0.191 0.224 25-29 0.165 0.138 0.143 * 0.141 0.174 0.184 30-34 0.063 0.064 0.063 * 0.065 0.059 0.086 35-39 0.018 0.011 0.012 * 0.014 0.017 0.040 40-44 0.003 0.002 0.002 * 0.002 0.003 0.005 45-49 * 0.000 0.000 * 0.000 0.000 0.000
TFR 15-44 2.50 2.00 2.10 * 2.13 2.40 3.02 TFR 15-49 2.50 2.00 2.10 * 2.13 2.40 3.02
CBR 21.0 17.3 18.0 * 18.1 21.3 26.7
Note: Rates are for the period 1-36 months preceding the survey (approximately 1990-92 for NFHS-1, 1996-98 for NFHS-2, and 2003-05 for NFHS-3). Age-specific fertility rates are expressed per woman. Rates for the age group 45-49 might be slightly biased due to truncation. TFR = Total fertility rate, expressed per woman CBR = Crude birth rate, expressed per 1,000 population ( ) Based on 125-249 unweighted women-years of exposure. * Not shown; based on fewer than 125 unweighted women-years of exposure.
Delhi.indd 38 3/19/09 12:51:00 PM
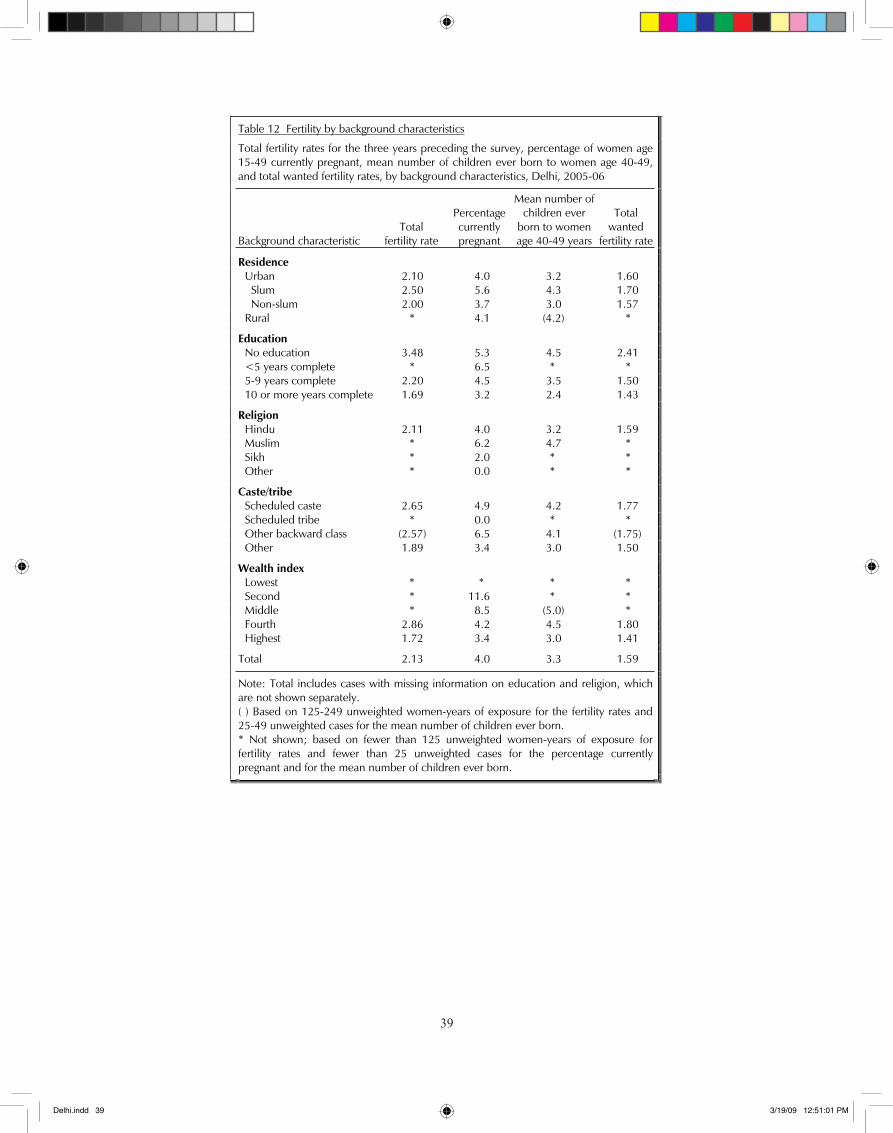
��
39
Table 12 Fertility by background characteristics
Total fertility rates for the three years preceding the survey, percentage of women age15-49 currently pregnant, mean number of children ever born to women age 40-49, and total wanted fertility rates, by background characteristics, Delhi, 2005-06
Background characteristic Total
fertility rate
Percentage currently pregnant
Mean number of children ever
born to women age 40-49 years
Total wanted
fertility rate
Residence Urban 2.10 4.0 3.2 1.60 Slum 2.50 5.6 4.3 1.70 Non-slum 2.00 3.7 3.0 1.57 Rural * 4.1 (4.2) *
Education No education 3.48 5.3 4.5 2.41 <5 years complete * 6.5 * * 5-9 years complete 2.20 4.5 3.5 1.50 10 or more years complete 1.69 3.2 2.4 1.43
Religion Hindu 2.11 4.0 3.2 1.59 Muslim * 6.2 4.7 * Sikh * 2.0 * * Other * 0.0 * *
Caste/tribe Scheduled caste 2.65 4.9 4.2 1.77 Scheduled tribe * 0.0 * * Other backward class (2.57) 6.5 4.1 (1.75) Other 1.89 3.4 3.0 1.50
Wealth index Lowest * * * * Second * 11.6 * * Middle * 8.5 (5.0) * Fourth 2.86 4.2 4.5 1.80 Highest 1.72 3.4 3.0 1.41
Total 2.13 4.0 3.3 1.59
Note: Total includes cases with missing information on education and religion, which are not shown separately. ( ) Based on 125-249 unweighted women-years of exposure for the fertility rates and 25-49 unweighted cases for the mean number of children ever born. * Not shown; based on fewer than 125 unweighted women-years of exposure for fertility rates and fewer than 25 unweighted cases for the percentage currently pregnant and for the mean number of children ever born.
Delhi.indd 39 3/19/09 12:51:01 PM
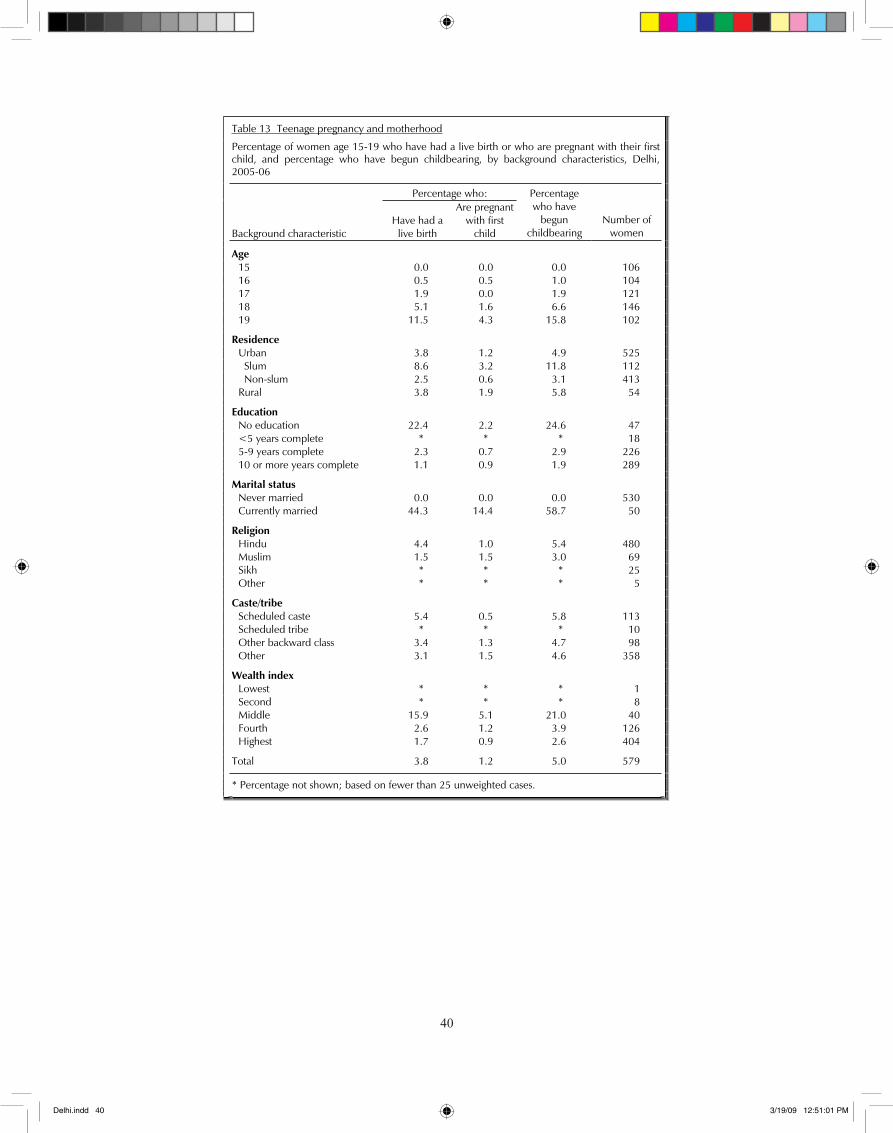
�0
40
Table 13 Teenage pregnancy and motherhood
Percentage of women age 15-19 who have had a live birth or who are pregnant with their first child, and percentage who have begun childbearing, by background characteristics, Delhi, 2005-06
Percentage who:
Background characteristic Have had a
live birth
Are pregnant with first
child
Percentage who have
begunchildbearing
Number of women
Age 15 0.0 0.0 0.0 106 16 0.5 0.5 1.0 104 17 1.9 0.0 1.9 121 18 5.1 1.6 6.6 146 19 11.5 4.3 15.8 102
Residence Urban 3.8 1.2 4.9 525 Slum 8.6 3.2 11.8 112 Non-slum 2.5 0.6 3.1 413 Rural 3.8 1.9 5.8 54
Education No education 22.4 2.2 24.6 47 <5 years complete * * * 18 5-9 years complete 2.3 0.7 2.9 226 10 or more years complete 1.1 0.9 1.9 289
Marital status Never married 0.0 0.0 0.0 530 Currently married 44.3 14.4 58.7 50
Religion Hindu 4.4 1.0 5.4 480 Muslim 1.5 1.5 3.0 69 Sikh * * * 25 Other * * * 5
Caste/tribe Scheduled caste 5.4 0.5 5.8 113 Scheduled tribe * * * 10 Other backward class 3.4 1.3 4.7 98 Other 3.1 1.5 4.6 358
Wealth index Lowest * * * 1 Second * * * 8 Middle 15.9 5.1 21.0 40 Fourth 2.6 1.2 3.9 126 Highest 1.7 0.9 2.6 404
Total 3.8 1.2 5.0 579
* Percentage not shown; based on fewer than 25 unweighted cases.
Delhi.indd 40 3/19/09 12:51:01 PM
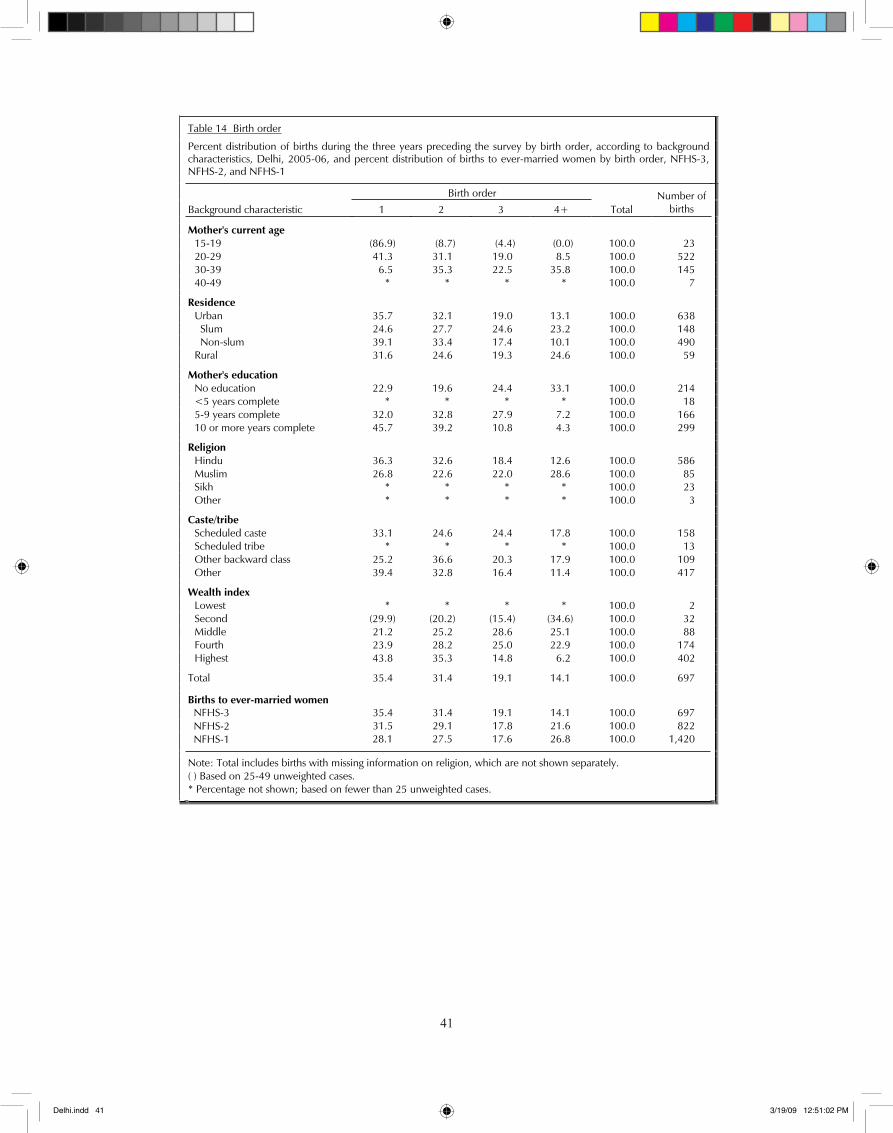
��
41
Table 14 Birth order
Percent distribution of births during the three years preceding the survey by birth order, according to background characteristics, Delhi, 2005-06, and percent distribution of births to ever-married women by birth order, NFHS-3, NFHS-2, and NFHS-1
Birth order
Background characteristic 1 2 3 4+ Total Number of
births
Mother's current age 15-19 (86.9) (8.7) (4.4) (0.0) 100.0 23 20-29 41.3 31.1 19.0 8.5 100.0 522 30-39 6.5 35.3 22.5 35.8 100.0 145 40-49 * * * * 100.0 7
Residence Urban 35.7 32.1 19.0 13.1 100.0 638 Slum 24.6 27.7 24.6 23.2 100.0 148 Non-slum 39.1 33.4 17.4 10.1 100.0 490 Rural 31.6 24.6 19.3 24.6 100.0 59
Mother's education No education 22.9 19.6 24.4 33.1 100.0 214 <5 years complete * * * * 100.0 18 5-9 years complete 32.0 32.8 27.9 7.2 100.0 166 10 or more years complete 45.7 39.2 10.8 4.3 100.0 299
Religion Hindu 36.3 32.6 18.4 12.6 100.0 586 Muslim 26.8 22.6 22.0 28.6 100.0 85 Sikh * * * * 100.0 23 Other * * * * 100.0 3
Caste/tribe Scheduled caste 33.1 24.6 24.4 17.8 100.0 158 Scheduled tribe * * * * 100.0 13 Other backward class 25.2 36.6 20.3 17.9 100.0 109 Other 39.4 32.8 16.4 11.4 100.0 417
Wealth index Lowest * * * * 100.0 2 Second (29.9) (20.2) (15.4) (34.6) 100.0 32 Middle 21.2 25.2 28.6 25.1 100.0 88 Fourth 23.9 28.2 25.0 22.9 100.0 174 Highest 43.8 35.3 14.8 6.2 100.0 402
Total 35.4 31.4 19.1 14.1 100.0 697
Births to ever-married women NFHS-3 35.4 31.4 19.1 14.1 100.0 697 NFHS-2 31.5 29.1 17.8 21.6 100.0 822 NFHS-1 28.1 27.5 17.6 26.8 100.0 1,420
Note: Total includes births with missing information on religion, which are not shown separately. ( ) Based on 25-49 unweighted cases. * Percentage not shown; based on fewer than 25 unweighted cases.
Delhi.indd 41 3/19/09 12:51:02 PM
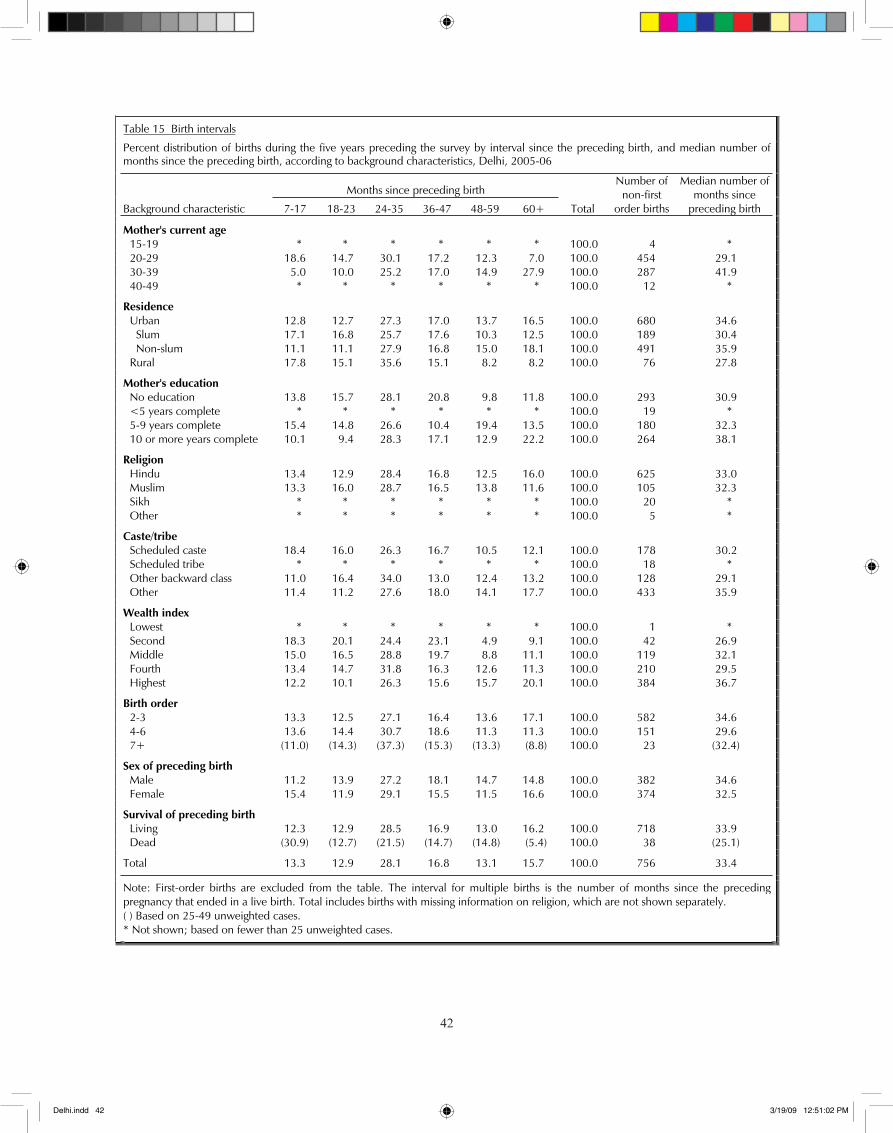
��
42
Table 15 Birth intervals
Percent distribution of births during the five years preceding the survey by interval since the preceding birth, and median number of months since the preceding birth, according to background characteristics, Delhi, 2005-06
Months since preceding birth
Background characteristic 7-17 18-23 24-35 36-47 48-59 60+ Total
Number of non-first
order births
Median number of months since
preceding birth
Mother's current age 15-19 * * * * * * 100.0 4 * 20-29 18.6 14.7 30.1 17.2 12.3 7.0 100.0 454 29.1 30-39 5.0 10.0 25.2 17.0 14.9 27.9 100.0 287 41.9 40-49 * * * * * * 100.0 12 *
Residence Urban 12.8 12.7 27.3 17.0 13.7 16.5 100.0 680 34.6 Slum 17.1 16.8 25.7 17.6 10.3 12.5 100.0 189 30.4 Non-slum 11.1 11.1 27.9 16.8 15.0 18.1 100.0 491 35.9 Rural 17.8 15.1 35.6 15.1 8.2 8.2 100.0 76 27.8
Mother's education No education 13.8 15.7 28.1 20.8 9.8 11.8 100.0 293 30.9 <5 years complete * * * * * * 100.0 19 * 5-9 years complete 15.4 14.8 26.6 10.4 19.4 13.5 100.0 180 32.3 10 or more years complete 10.1 9.4 28.3 17.1 12.9 22.2 100.0 264 38.1
Religion Hindu 13.4 12.9 28.4 16.8 12.5 16.0 100.0 625 33.0 Muslim 13.3 16.0 28.7 16.5 13.8 11.6 100.0 105 32.3 Sikh * * * * * * 100.0 20 * Other * * * * * * 100.0 5 *
Caste/tribe Scheduled caste 18.4 16.0 26.3 16.7 10.5 12.1 100.0 178 30.2 Scheduled tribe * * * * * * 100.0 18 * Other backward class 11.0 16.4 34.0 13.0 12.4 13.2 100.0 128 29.1 Other 11.4 11.2 27.6 18.0 14.1 17.7 100.0 433 35.9
Wealth index Lowest * * * * * * 100.0 1 * Second 18.3 20.1 24.4 23.1 4.9 9.1 100.0 42 26.9 Middle 15.0 16.5 28.8 19.7 8.8 11.1 100.0 119 32.1 Fourth 13.4 14.7 31.8 16.3 12.6 11.3 100.0 210 29.5 Highest 12.2 10.1 26.3 15.6 15.7 20.1 100.0 384 36.7
Birth order 2-3 13.3 12.5 27.1 16.4 13.6 17.1 100.0 582 34.6 4-6 13.6 14.4 30.7 18.6 11.3 11.3 100.0 151 29.6 7+ (11.0) (14.3) (37.3) (15.3) (13.3) (8.8) 100.0 23 (32.4)
Sex of preceding birth Male 11.2 13.9 27.2 18.1 14.7 14.8 100.0 382 34.6 Female 15.4 11.9 29.1 15.5 11.5 16.6 100.0 374 32.5
Survival of preceding birth Living 12.3 12.9 28.5 16.9 13.0 16.2 100.0 718 33.9 Dead (30.9) (12.7) (21.5) (14.7) (14.8) (5.4) 100.0 38 (25.1)
Total 13.3 12.9 28.1 16.8 13.1 15.7 100.0 756 33.4
Note: First-order births are excluded from the table. The interval for multiple births is the number of months since the precedingpregnancy that ended in a live birth. Total includes births with missing information on religion, which are not shown separately.( ) Based on 25-49 unweighted cases. * Not shown; based on fewer than 25 unweighted cases.
Delhi.indd 42 3/19/09 12:51:02 PM
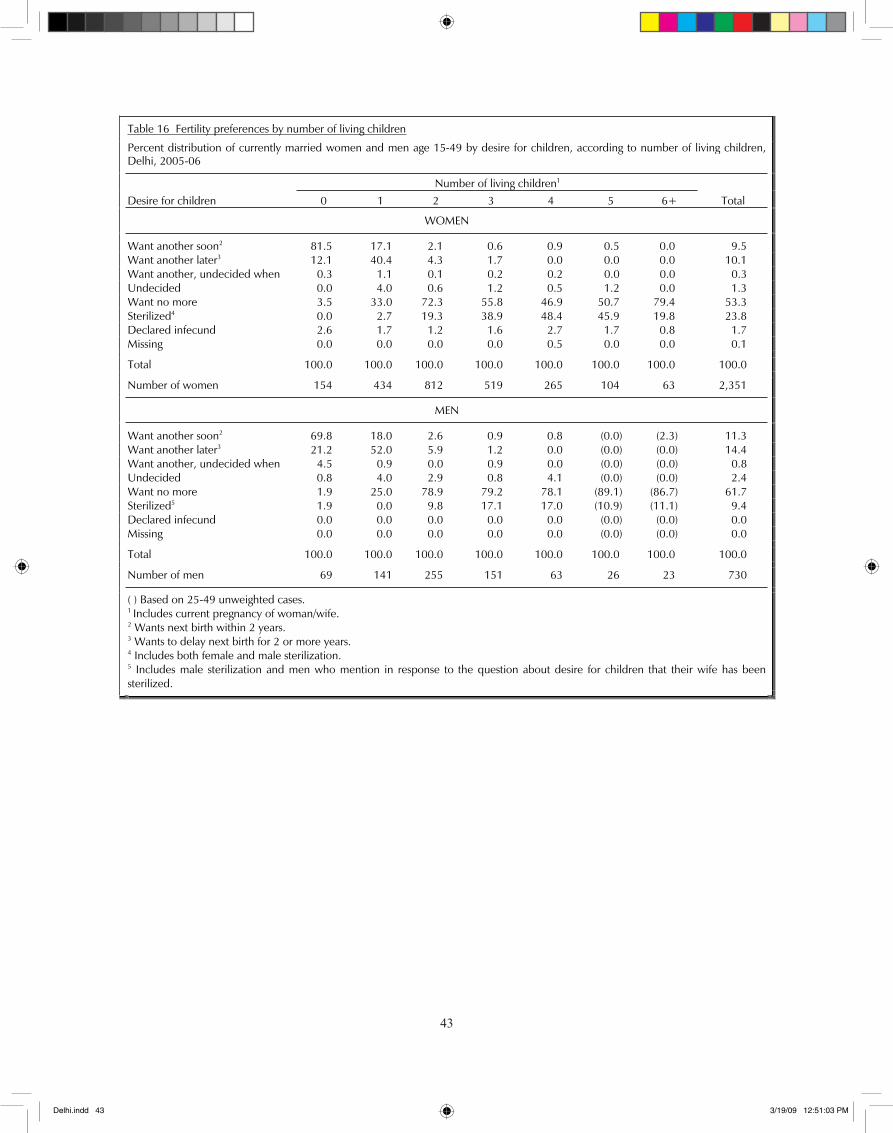
��
43
Table 16 Fertility preferences by number of living children
Percent distribution of currently married women and men age 15-49 by desire for children, according to number of living children, Delhi, 2005-06
Number of living children1
Desire for children 0 1 2 3 4 5 6+ Total
WOMEN
Want another soon2 81.5 17.1 2.1 0.6 0.9 0.5 0.0 9.5 Want another later3 12.1 40.4 4.3 1.7 0.0 0.0 0.0 10.1 Want another, undecided when 0.3 1.1 0.1 0.2 0.2 0.0 0.0 0.3 Undecided 0.0 4.0 0.6 1.2 0.5 1.2 0.0 1.3 Want no more 3.5 33.0 72.3 55.8 46.9 50.7 79.4 53.3 Sterilized4 0.0 2.7 19.3 38.9 48.4 45.9 19.8 23.8 Declared infecund 2.6 1.7 1.2 1.6 2.7 1.7 0.8 1.7 Missing 0.0 0.0 0.0 0.0 0.5 0.0 0.0 0.1
Total 100.0 100.0 100.0 100.0 100.0 100.0 100.0 100.0
Number of women 154 434 812 519 265 104 63 2,351
MEN
Want another soon2 69.8 18.0 2.6 0.9 0.8 (0.0) (2.3) 11.3 Want another later3 21.2 52.0 5.9 1.2 0.0 (0.0) (0.0) 14.4 Want another, undecided when 4.5 0.9 0.0 0.9 0.0 (0.0) (0.0) 0.8 Undecided 0.8 4.0 2.9 0.8 4.1 (0.0) (0.0) 2.4 Want no more 1.9 25.0 78.9 79.2 78.1 (89.1) (86.7) 61.7 Sterilized5 1.9 0.0 9.8 17.1 17.0 (10.9) (11.1) 9.4 Declared infecund 0.0 0.0 0.0 0.0 0.0 (0.0) (0.0) 0.0 Missing 0.0 0.0 0.0 0.0 0.0 (0.0) (0.0) 0.0
Total 100.0 100.0 100.0 100.0 100.0 100.0 100.0 100.0
Number of men 69 141 255 151 63 26 23 730
( ) Based on 25-49 unweighted cases. 1 Includes current pregnancy of woman/wife. 2 Wants next birth within 2 years. 3 Wants to delay next birth for 2 or more years. 4 Includes both female and male sterilization. 5 Includes male sterilization and men who mention in response to the question about desire for children that their wife has beensterilized.
Delhi.indd 43 3/19/09 12:51:03 PM
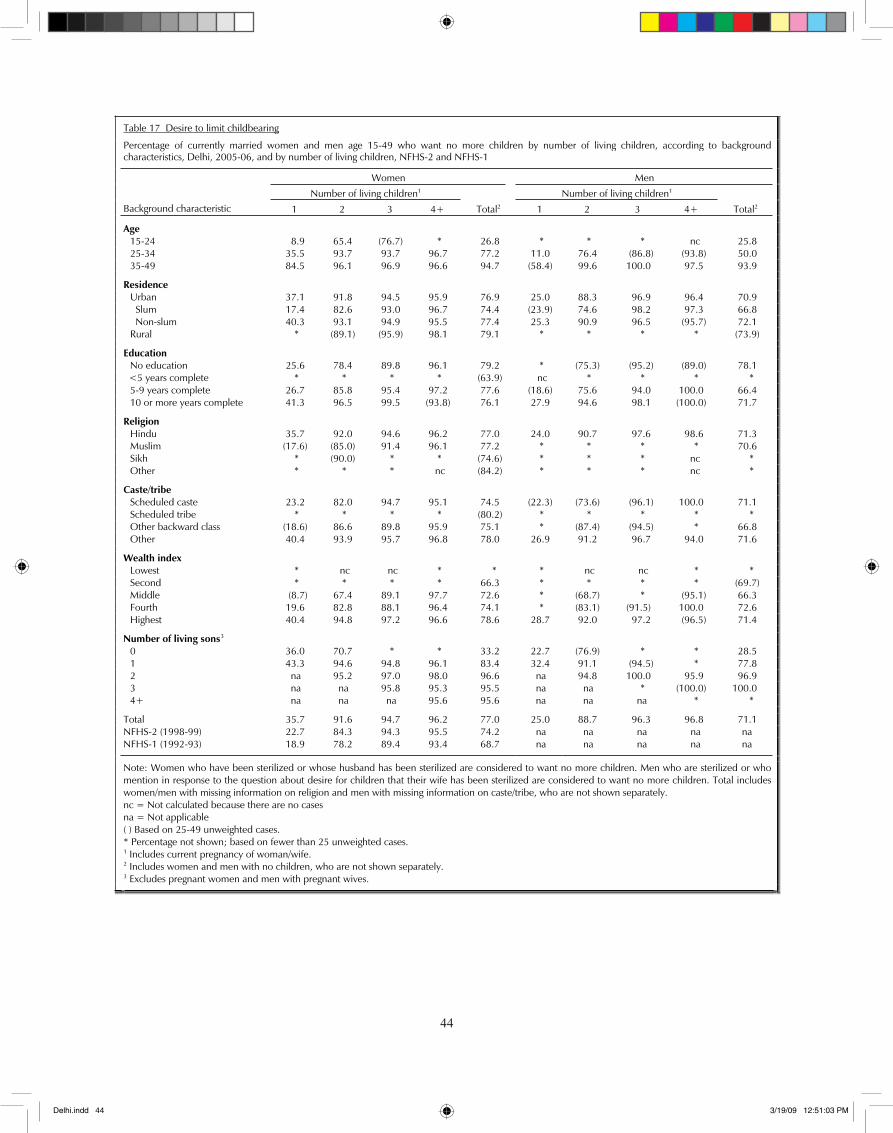
��
44
Table 17 Desire to limit childbearing
Percentage of currently married women and men age 15-49 who want no more children by number of living children, according to background characteristics, Delhi, 2005-06, and by number of living children, NFHS-2 and NFHS-1
Women Men
Number of living children1 Number of living children1
Background characteristic 1 2 3 4+ Total2 1 2 3 4+ Total2
Age 15-24 8.9 65.4 (76.7) * 26.8 * * * nc 25.8 25-34 35.5 93.7 93.7 96.7 77.2 11.0 76.4 (86.8) (93.8) 50.0 35-49 84.5 96.1 96.9 96.6 94.7 (58.4) 99.6 100.0 97.5 93.9
Residence Urban 37.1 91.8 94.5 95.9 76.9 25.0 88.3 96.9 96.4 70.9 Slum 17.4 82.6 93.0 96.7 74.4 (23.9) 74.6 98.2 97.3 66.8 Non-slum 40.3 93.1 94.9 95.5 77.4 25.3 90.9 96.5 (95.7) 72.1 Rural * (89.1) (95.9) 98.1 79.1 * * * * (73.9)
Education No education 25.6 78.4 89.8 96.1 79.2 * (75.3) (95.2) (89.0) 78.1 <5 years complete * * * * (63.9) nc * * * * 5-9 years complete 26.7 85.8 95.4 97.2 77.6 (18.6) 75.6 94.0 100.0 66.4 10 or more years complete 41.3 96.5 99.5 (93.8) 76.1 27.9 94.6 98.1 (100.0) 71.7
Religion Hindu 35.7 92.0 94.6 96.2 77.0 24.0 90.7 97.6 98.6 71.3 Muslim (17.6) (85.0) 91.4 96.1 77.2 * * * * 70.6 Sikh * (90.0) * * (74.6) * * * nc * Other * * * nc (84.2) * * * nc *
Caste/tribe Scheduled caste 23.2 82.0 94.7 95.1 74.5 (22.3) (73.6) (96.1) 100.0 71.1 Scheduled tribe * * * * (80.2) * * * * * Other backward class (18.6) 86.6 89.8 95.9 75.1 * (87.4) (94.5) * 66.8 Other 40.4 93.9 95.7 96.8 78.0 26.9 91.2 96.7 94.0 71.6
Wealth index Lowest * nc nc * * * nc nc * * Second * * * * 66.3 * * * * (69.7) Middle (8.7) 67.4 89.1 97.7 72.6 * (68.7) * (95.1) 66.3 Fourth 19.6 82.8 88.1 96.4 74.1 * (83.1) (91.5) 100.0 72.6 Highest 40.4 94.8 97.2 96.6 78.6 28.7 92.0 97.2 (96.5) 71.4
Number of living sons3 0 36.0 70.7 * * 33.2 22.7 (76.9) * * 28.5 1 43.3 94.6 94.8 96.1 83.4 32.4 91.1 (94.5) * 77.8 2 na 95.2 97.0 98.0 96.6 na 94.8 100.0 95.9 96.9 3 na na 95.8 95.3 95.5 na na * (100.0) 100.0 4+ na na na 95.6 95.6 na na na * *
Total 35.7 91.6 94.7 96.2 77.0 25.0 88.7 96.3 96.8 71.1 NFHS-2 (1998-99) 22.7 84.3 94.3 95.5 74.2 na na na na na NFHS-1 (1992-93) 18.9 78.2 89.4 93.4 68.7 na na na na na
Note: Women who have been sterilized or whose husband has been sterilized are considered to want no more children. Men who are sterilized or who mention in response to the question about desire for children that their wife has been sterilized are considered to want no more children. Total includes women/men with missing information on religion and men with missing information on caste/tribe, who are not shown separately. nc = Not calculated because there are no cases na = Not applicable ( ) Based on 25-49 unweighted cases. * Percentage not shown; based on fewer than 25 unweighted cases. 1 Includes current pregnancy of woman/wife. 2 Includes women and men with no children, who are not shown separately. 3 Excludes pregnant women and men with pregnant wives.
Delhi.indd 44 3/19/09 12:51:03 PM
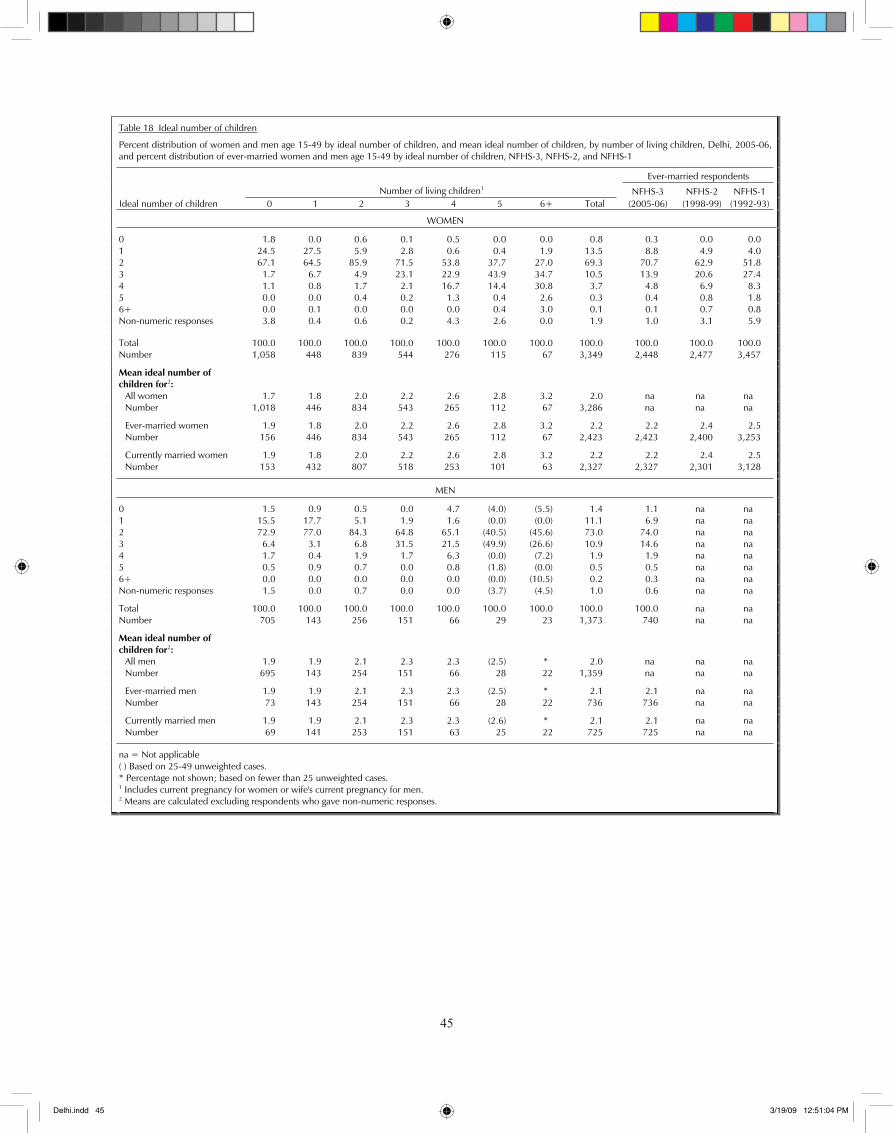
��
45
Table 18 Ideal number of children
Percent distribution of women and men age 15-49 by ideal number of children, and mean ideal number of children, by number of living children, Delhi, 2005-06, and percent distribution of ever-married women and men age 15-49 by ideal number of children, NFHS-3, NFHS-2, and NFHS-1
Ever-married respondents
Number of living children1 NFHS-3 NFHS-2 NFHS-1 Ideal number of children 0 1 2 3 4 5 6+ Total (2005-06) (1998-99) (1992-93)
WOMEN
0 1.8 0.0 0.6 0.1 0.5 0.0 0.0 0.8 0.3 0.0 0.0 1 24.5 27.5 5.9 2.8 0.6 0.4 1.9 13.5 8.8 4.9 4.0 2 67.1 64.5 85.9 71.5 53.8 37.7 27.0 69.3 70.7 62.9 51.8 3 1.7 6.7 4.9 23.1 22.9 43.9 34.7 10.5 13.9 20.6 27.4 4 1.1 0.8 1.7 2.1 16.7 14.4 30.8 3.7 4.8 6.9 8.3 5 0.0 0.0 0.4 0.2 1.3 0.4 2.6 0.3 0.4 0.8 1.8 6+ 0.0 0.1 0.0 0.0 0.0 0.4 3.0 0.1 0.1 0.7 0.8 Non-numeric responses 3.8 0.4 0.6 0.2 4.3 2.6 0.0 1.9 1.0 3.1 5.9
Total 100.0 100.0 100.0 100.0 100.0 100.0 100.0 100.0 100.0 100.0 100.0 Number 1,058 448 839 544 276 115 67 3,349 2,448 2,477 3,457
Mean ideal number of children for2:
All women 1.7 1.8 2.0 2.2 2.6 2.8 3.2 2.0 na na na Number 1,018 446 834 543 265 112 67 3,286 na na na
Ever-married women 1.9 1.8 2.0 2.2 2.6 2.8 3.2 2.2 2.2 2.4 2.5 Number 156 446 834 543 265 112 67 2,423 2,423 2,400 3,253
Currently married women 1.9 1.8 2.0 2.2 2.6 2.8 3.2 2.2 2.2 2.4 2.5 Number 153 432 807 518 253 101 63 2,327 2,327 2,301 3,128
MEN
0 1.5 0.9 0.5 0.0 4.7 (4.0) (5.5) 1.4 1.1 na na 1 15.5 17.7 5.1 1.9 1.6 (0.0) (0.0) 11.1 6.9 na na 2 72.9 77.0 84.3 64.8 65.1 (40.5) (45.6) 73.0 74.0 na na 3 6.4 3.1 6.8 31.5 21.5 (49.9) (26.6) 10.9 14.6 na na 4 1.7 0.4 1.9 1.7 6.3 (0.0) (7.2) 1.9 1.9 na na 5 0.5 0.9 0.7 0.0 0.8 (1.8) (0.0) 0.5 0.5 na na 6+ 0.0 0.0 0.0 0.0 0.0 (0.0) (10.5) 0.2 0.3 na na Non-numeric responses 1.5 0.0 0.7 0.0 0.0 (3.7) (4.5) 1.0 0.6 na na
Total 100.0 100.0 100.0 100.0 100.0 100.0 100.0 100.0 100.0 na na Number 705 143 256 151 66 29 23 1,373 740 na na
Mean ideal number of children for2:
All men 1.9 1.9 2.1 2.3 2.3 (2.5) * 2.0 na na na Number 695 143 254 151 66 28 22 1,359 na na na
Ever-married men 1.9 1.9 2.1 2.3 2.3 (2.5) * 2.1 2.1 na na Number 73 143 254 151 66 28 22 736 736 na na
Currently married men 1.9 1.9 2.1 2.3 2.3 (2.6) * 2.1 2.1 na na Number 69 141 253 151 63 25 22 725 725 na na
na = Not applicable ( ) Based on 25-49 unweighted cases. * Percentage not shown; based on fewer than 25 unweighted cases. 1 Includes current pregnancy for women or wife's current pregnancy for men. 2 Means are calculated excluding respondents who gave non-numeric responses.
Delhi.indd 45 3/19/09 12:51:04 PM
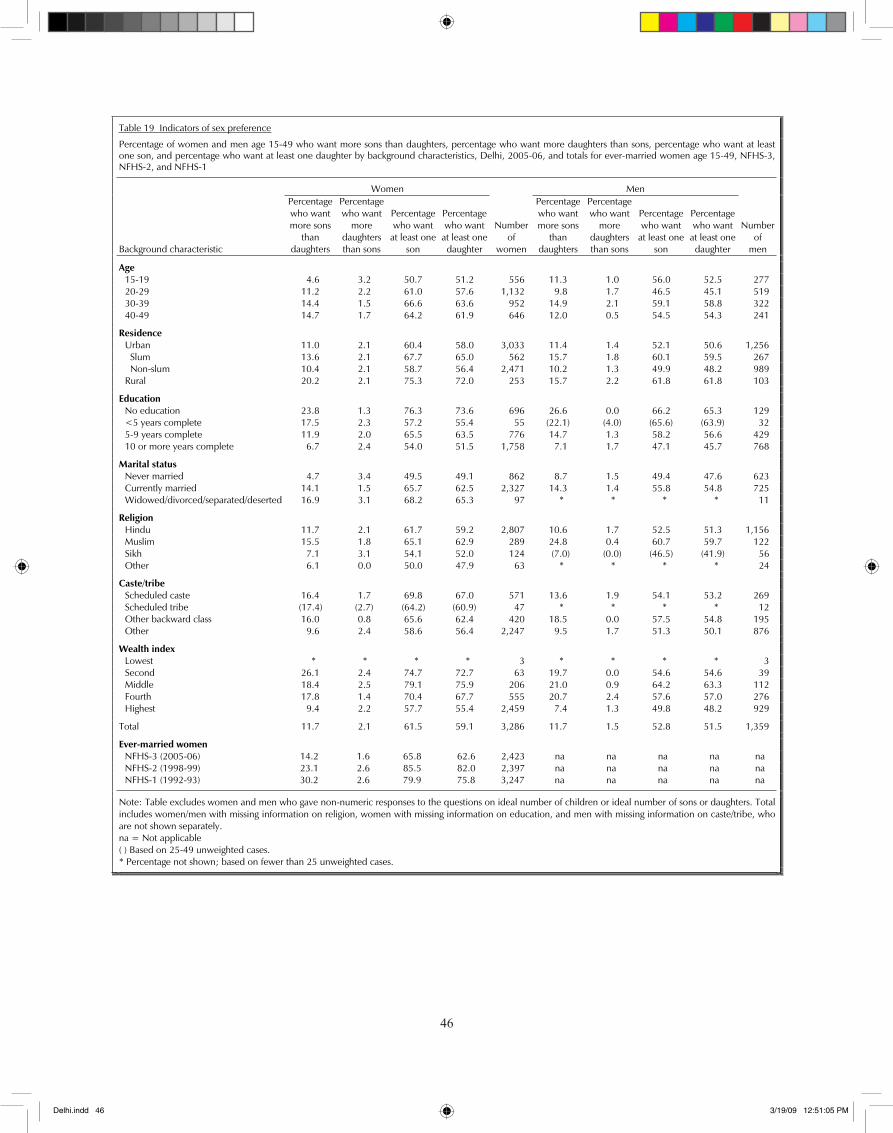
��
46
Table 19 Indicators of sex preference
Percentage of women and men age 15-49 who want more sons than daughters, percentage who want more daughters than sons, percentage who want at least one son, and percentage who want at least one daughter by background characteristics, Delhi, 2005-06, and totals for ever-married women age 15-49, NFHS-3, NFHS-2, and NFHS-1
Women Men
Background characteristic
Percentage who want more sons
than daughters
Percentage who want
moredaughters than sons
Percentage who want
at least one son
Percentage who want
at least one daughter
Number of
women
Percentage who want more sons
than daughters
Percentage who want
moredaughters than sons
Percentage who want
at least one son
Percentage who want
at least one daughter
Number of
men
Age 15-19 4.6 3.2 50.7 51.2 556 11.3 1.0 56.0 52.5 277 20-29 11.2 2.2 61.0 57.6 1,132 9.8 1.7 46.5 45.1 519 30-39 14.4 1.5 66.6 63.6 952 14.9 2.1 59.1 58.8 322 40-49 14.7 1.7 64.2 61.9 646 12.0 0.5 54.5 54.3 241
Residence Urban 11.0 2.1 60.4 58.0 3,033 11.4 1.4 52.1 50.6 1,256 Slum 13.6 2.1 67.7 65.0 562 15.7 1.8 60.1 59.5 267 Non-slum 10.4 2.1 58.7 56.4 2,471 10.2 1.3 49.9 48.2 989 Rural 20.2 2.1 75.3 72.0 253 15.7 2.2 61.8 61.8 103
Education No education 23.8 1.3 76.3 73.6 696 26.6 0.0 66.2 65.3 129 <5 years complete 17.5 2.3 57.2 55.4 55 (22.1) (4.0) (65.6) (63.9) 32 5-9 years complete 11.9 2.0 65.5 63.5 776 14.7 1.3 58.2 56.6 429 10 or more years complete 6.7 2.4 54.0 51.5 1,758 7.1 1.7 47.1 45.7 768
Marital status Never married 4.7 3.4 49.5 49.1 862 8.7 1.5 49.4 47.6 623 Currently married 14.1 1.5 65.7 62.5 2,327 14.3 1.4 55.8 54.8 725 Widowed/divorced/separated/deserted 16.9 3.1 68.2 65.3 97 * * * * 11
Religion Hindu 11.7 2.1 61.7 59.2 2,807 10.6 1.7 52.5 51.3 1,156 Muslim 15.5 1.8 65.1 62.9 289 24.8 0.4 60.7 59.7 122 Sikh 7.1 3.1 54.1 52.0 124 (7.0) (0.0) (46.5) (41.9) 56 Other 6.1 0.0 50.0 47.9 63 * * * * 24
Caste/tribe Scheduled caste 16.4 1.7 69.8 67.0 571 13.6 1.9 54.1 53.2 269 Scheduled tribe (17.4) (2.7) (64.2) (60.9) 47 * * * * 12 Other backward class 16.0 0.8 65.6 62.4 420 18.5 0.0 57.5 54.8 195 Other 9.6 2.4 58.6 56.4 2,247 9.5 1.7 51.3 50.1 876
Wealth index Lowest * * * * 3 * * * * 3 Second 26.1 2.4 74.7 72.7 63 19.7 0.0 54.6 54.6 39 Middle 18.4 2.5 79.1 75.9 206 21.0 0.9 64.2 63.3 112 Fourth 17.8 1.4 70.4 67.7 555 20.7 2.4 57.6 57.0 276 Highest 9.4 2.2 57.7 55.4 2,459 7.4 1.3 49.8 48.2 929
Total 11.7 2.1 61.5 59.1 3,286 11.7 1.5 52.8 51.5 1,359
Ever-married women NFHS-3 (2005-06) 14.2 1.6 65.8 62.6 2,423 na na na na na NFHS-2 (1998-99) 23.1 2.6 85.5 82.0 2,397 na na na na na NFHS-1 (1992-93) 30.2 2.6 79.9 75.8 3,247 na na na na na
Note: Table excludes women and men who gave non-numeric responses to the questions on ideal number of children or ideal number of sons or daughters. Total includes women/men with missing information on religion, women with missing information on education, and men with missing information on caste/tribe, who are not shown separately. na = Not applicable ( ) Based on 25-49 unweighted cases. * Percentage not shown; based on fewer than 25 unweighted cases.
Delhi.indd 46 3/19/09 12:51:05 PM
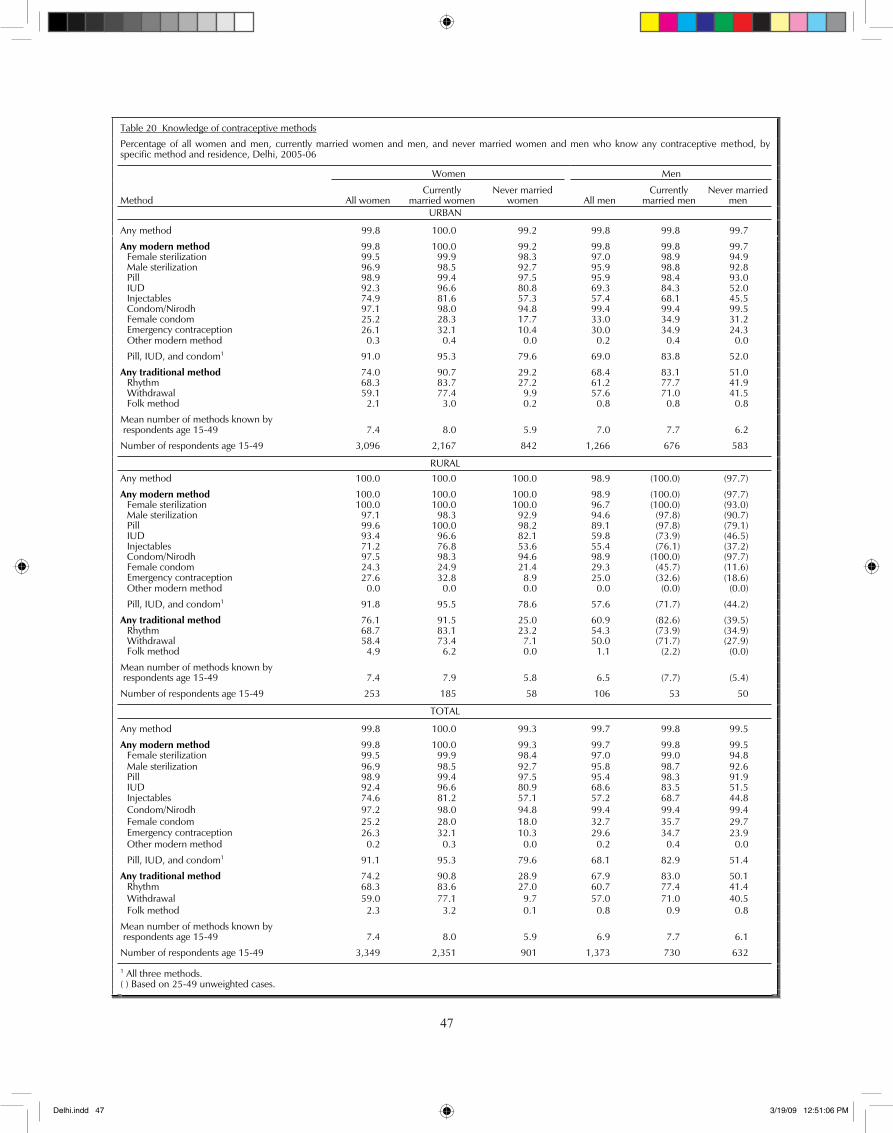
��
47
Table 20 Knowledge of contraceptive methods
Percentage of all women and men, currently married women and men, and never married women and men who know any contraceptive method, byspecific method and residence, Delhi, 2005-06
Women Men
Method All women Currently
married womenNever married
women All men Currently
married men Never married
men URBAN
Any method 99.8 100.0 99.2 99.8 99.8 99.7
Any modern method 99.8 100.0 99.2 99.8 99.8 99.7 Female sterilization 99.5 99.9 98.3 97.0 98.9 94.9 Male sterilization 96.9 98.5 92.7 95.9 98.8 92.8 Pill 98.9 99.4 97.5 95.9 98.4 93.0 IUD 92.3 96.6 80.8 69.3 84.3 52.0 Injectables 74.9 81.6 57.3 57.4 68.1 45.5 Condom/Nirodh 97.1 98.0 94.8 99.4 99.4 99.5 Female condom 25.2 28.3 17.7 33.0 34.9 31.2
Emergency contraception 26.1 32.1 10.4 30.0 34.9 24.3 Other modern method 0.3 0.4 0.0 0.2 0.4 0.0
Pill, IUD, and condom1 91.0 95.3 79.6 69.0 83.8 52.0
Any traditional method 74.0 90.7 29.2 68.4 83.1 51.0 Rhythm 68.3 83.7 27.2 61.2 77.7 41.9 Withdrawal 59.1 77.4 9.9 57.6 71.0 41.5 Folk method 2.1 3.0 0.2 0.8 0.8 0.8
Mean number of methods known by respondents age 15-49 7.4 8.0 5.9 7.0 7.7 6.2
Number of respondents age 15-49 3,096 2,167 842 1,266 676 583
RURAL Any method 100.0 100.0 100.0 98.9 (100.0) (97.7)
Any modern method 100.0 100.0 100.0 98.9 (100.0) (97.7) Female sterilization 100.0 100.0 100.0 96.7 (100.0) (93.0) Male sterilization 97.1 98.3 92.9 94.6 (97.8) (90.7) Pill 99.6 100.0 98.2 89.1 (97.8) (79.1) IUD 93.4 96.6 82.1 59.8 (73.9) (46.5) Injectables 71.2 76.8 53.6 55.4 (76.1) (37.2) Condom/Nirodh 97.5 98.3 94.6 98.9 (100.0) (97.7) Female condom 24.3 24.9 21.4 29.3 (45.7) (11.6)
Emergency contraception 27.6 32.8 8.9 25.0 (32.6) (18.6) Other modern method 0.0 0.0 0.0 0.0 (0.0) (0.0)
Pill, IUD, and condom1 91.8 95.5 78.6 57.6 (71.7) (44.2)
Any traditional method 76.1 91.5 25.0 60.9 (82.6) (39.5) Rhythm 68.7 83.1 23.2 54.3 (73.9) (34.9) Withdrawal 58.4 73.4 7.1 50.0 (71.7) (27.9) Folk method 4.9 6.2 0.0 1.1 (2.2) (0.0)
Mean number of methods known by respondents age 15-49 7.4 7.9 5.8 6.5 (7.7) (5.4)
Number of respondents age 15-49 253 185 58 106 53 50
TOTAL
Any method 99.8 100.0 99.3 99.7 99.8 99.5
Any modern method 99.8 100.0 99.3 99.7 99.8 99.5 Female sterilization 99.5 99.9 98.4 97.0 99.0 94.8 Male sterilization 96.9 98.5 92.7 95.8 98.7 92.6 Pill 98.9 99.4 97.5 95.4 98.3 91.9 IUD 92.4 96.6 80.9 68.6 83.5 51.5 Injectables 74.6 81.2 57.1 57.2 68.7 44.8 Condom/Nirodh 97.2 98.0 94.8 99.4 99.4 99.4 Female condom 25.2 28.0 18.0 32.7 35.7 29.7
Emergency contraception 26.3 32.1 10.3 29.6 34.7 23.9 Other modern method 0.2 0.3 0.0 0.2 0.4 0.0
Pill, IUD, and condom1 91.1 95.3 79.6 68.1 82.9 51.4
Any traditional method 74.2 90.8 28.9 67.9 83.0 50.1 Rhythm 68.3 83.6 27.0 60.7 77.4 41.4 Withdrawal 59.0 77.1 9.7 57.0 71.0 40.5 Folk method 2.3 3.2 0.1 0.8 0.9 0.8
Mean number of methods known by respondents age 15-49 7.4 8.0 5.9 6.9 7.7 6.1
Number of respondents age 15-49 3,349 2,351 901 1,373 730 632
1 All three methods. ( ) Based on 25-49 unweighted cases.
Delhi.indd 47 3/19/09 12:51:06 PM
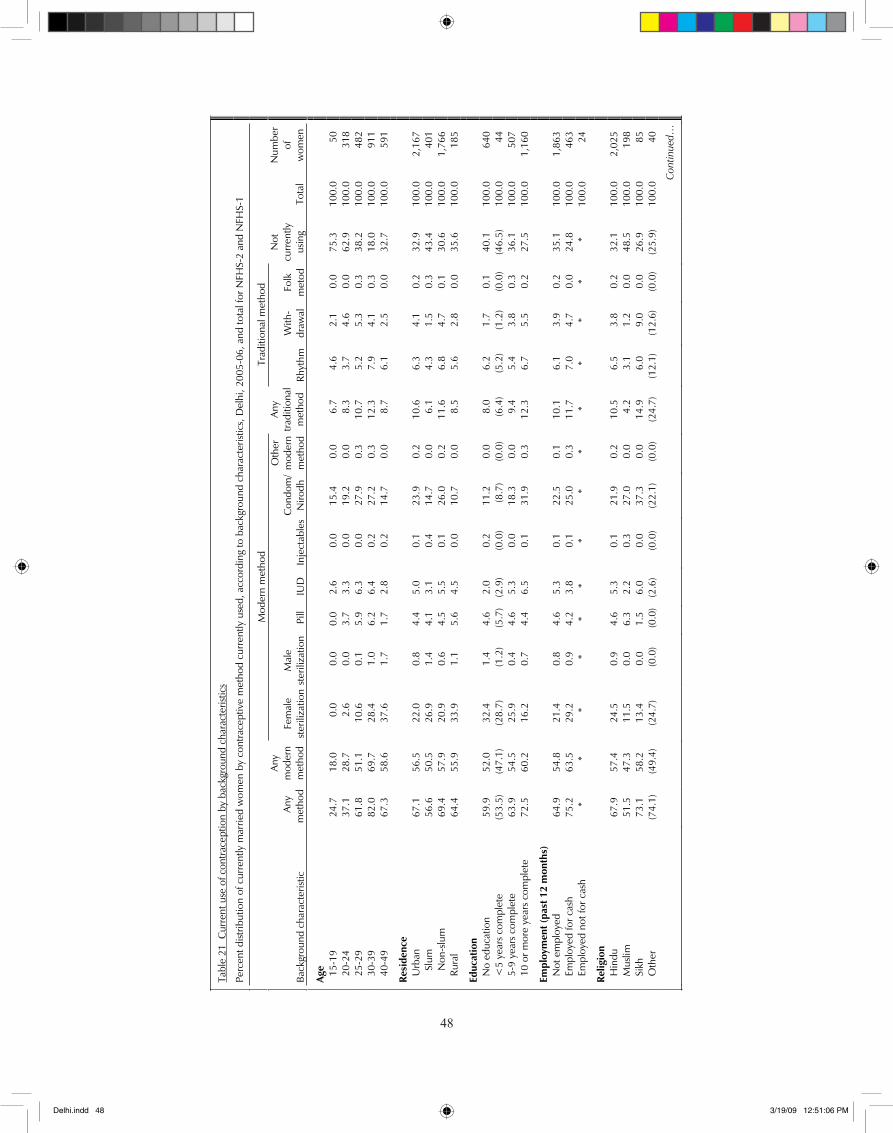
��
48
Tab
le 2
1 C
urre
nt u
se o
f con
trace
ptio
n by
bac
kgro
und
char
acte
ristic
s
Perc
ent d
istrib
utio
n of
cur
rent
ly m
arrie
d w
omen
by
cont
race
ptiv
e m
etho
d cu
rren
tly u
sed,
acc
ordi
ng to
bac
kgro
und
char
acte
ristic
s, D
elhi
, 200
5-06
, and
tota
l for
NFH
S-2
and
NFH
S-1
Mod
ern
met
hod
Trad
ition
al m
etho
d
Bac
kgro
und
char
acte
ristic
An
ym
etho
d
Any
mod
ern
met
hod
Fem
ale
ster
iliza
tion
Mal
est
erili
zatio
nPi
llIU
D
Inje
ctab
les
Con
dom
/N
irodh
Oth
erm
oder
nm
etho
d
Any
tradi
tiona
l m
etho
d Rh
ythm
With
- dr
awal
Folk
met
od
Not
curr
ently
us
ing
Tota
l
Num
ber
ofw
omen
Age
15
-19
24
.7
18.0
0.
0
0.0
0.
0 2.
6
0.0
15
.4
0.0
6.
7
4.6
2.
1
0.0
75
.3
100.
0
50
20
-24
37
.1
28.7
2.
6
0.0
3.
7 3.
3
0.0
19
.2
0.0
8.
3
3.7
4.
6
0.0
62
.9
100.
0
318
25
-29
61
.8
51.1
10
.6
0.1
5.
9 6.
3
0.0
27
.9
0.3
10
.7
5.2
5.
3
0.3
38
.2
100.
0
482
30
-39
82
.0
69.7
28
.4
1.0
6.
2 6.
4
0.2
27
.2
0.3
12
.3
7.9
4.
1
0.3
18
.0
100.
0
911
40
-49
67
.3
58.6
37
.6
1.7
1.
7 2.
8
0.2
14
.7
0.0
8.
7
6.1
2.
5
0.0
32
.7
100.
0
591
Resi
denc
e
Urb
an
67.1
56
.5
22.0
0.
8
4.4
5.0
0.
1
23.9
0.
2
10.6
6.
3
4.1
0.
2
32.9
10
0.0
2,
167
S
lum
56
.6
50.5
26
.9
1.4
4.
1 3.
1
0.4
14
.7
0.0
6.
1
4.3
1.
5
0.3
43
.4
100.
0
401
N
on-s
lum
69
.4
57.9
20
.9
0.6
4.
5 5.
5
0.1
26
.0
0.2
11
.6
6.8
4.
7
0.1
30
.6
100.
0
1,76
6
Rura
l 64
.4
55.9
33
.9
1.1
5.
6 4.
5
0.0
10
.7
0.0
8.
5
5.6
2.
8
0.0
35
.6
100.
0
185
Educ
atio
n
No
educ
atio
n
59.9
52
.0
32.4
1.
4
4.6
2.0
0.
2
11.2
0.
0
8.0
6.
2
1.7
0.
1
40.1
10
0.0
64
0
<5
year
s co
mpl
ete
(5
3.5)
(4
7.1)
(2
8.7)
(1
.2)
(5.7
)(2
.9)
(0.0
) (8
.7)
(0.0
) (6
.4)
(5.2
) (1
.2)
(0.0
) (4
6.5)
10
0.0
44
5-9
year
s co
mpl
ete
63
.9
54.5
25
.9
0.4
4.
6 5.
3
0.0
18
.3
0.0
9.
4
5.4
3.
8
0.3
36
.1
100.
0
507
10
or m
ore
year
s co
mpl
ete
72
.5
60.2
16
.2
0.7
4.
4 6.
5
0.1
31
.9
0.3
12
.3
6.7
5.
5
0.2
27
.5
100.
0
1,16
0
Empl
oym
ent (
past
12
mon
ths)
N
ot e
mpl
oyed
64
.9
54.8
21
.4
0.8
4.
6 5.
3
0.1
22
.5
0.1
10
.1
6.1
3.
9
0.2
35
.1
100.
0
1,86
3
Empl
oyed
for c
ash
75
.2
63.5
29
.2
0.9
4.
2 3.
8
0.1
25
.0
0.3
11
.7
7.0
4.
7
0.0
24
.8
100.
0
463
Em
ploy
ed n
ot fo
r cas
h *
* *
* *
* *
* *
* *
* *
* 10
0.0
24
Relig
ion
H
indu
67
.9
57.4
24
.5
0.9
4.
6 5.
3
0.1
21
.9
0.2
10
.5
6.5
3.
8
0.2
32
.1
100.
0
2,02
5
Mus
lim
51.5
47
.3
11.5
0.
0
6.3
2.2
0.
3
27.0
0.
0
4.2
3.
1
1.2
0.
0
48.5
10
0.0
19
8
Sikh
73
.1
58.2
13
.4
0.0
1.
5 6.
0
0.0
37
.3
0.0
14
.9
6.0
9.
0
0.0
26
.9
100.
0 85
Oth
er
(74.
1)
(49.
4)
(24.
7)
(0.0
) (0
.0)
(2.6
) (0
.0)
(22.
1)
(0.0
) (2
4.7)
(1
2.1)
(1
2.6)
(0
.0)
(25.
9)
100.
0 40
Con
tinue
d…
Delhi.indd 48 3/19/09 12:51:06 PM
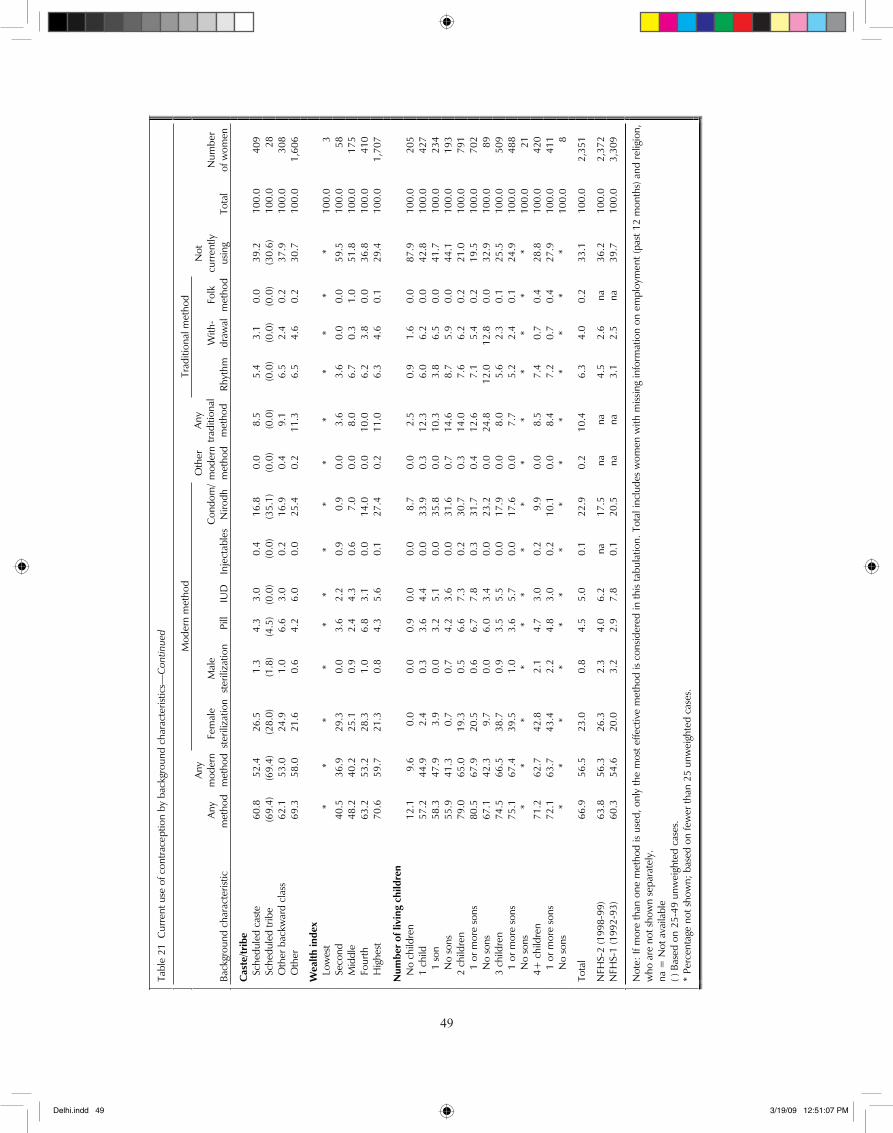
��
49
Tab
le 2
1 C
urre
nt u
se o
f con
trace
ptio
n by
bac
kgro
und
char
acte
ristic
s—C
ontin
ued
Mod
ern
met
hod
Trad
ition
al m
etho
d
Bac
kgro
und
char
acte
ristic
A
ny
met
hod
Any
mod
ern
met
hod
Fem
ale
ster
iliza
tion
Mal
est
erili
zatio
nPi
llIU
D
Inje
ctab
les
Con
dom
/N
irodh
Oth
erm
oder
nm
etho
d
Any
tradi
tiona
l m
etho
d Rh
ythm
With
- dr
awal
Folk
met
hod
Not
curr
ently
usin
g To
tal
Num
ber
of
wom
en
Cas
te/tr
ibe
Sc
hedu
led
cast
e
60.8
52
.4
26.5
1.
3
4.3
3.0
0.
4
16.8
0.
0
8.5
5.
4
3.1
0.
0
39.2
10
0.0
40
9
Sc
hedu
led
tribe
(6
9.4)
(6
9.4)
(2
8.0)
(1
.8)
(4.5
)(0
.0)
(0.0
) (3
5.1)
(0
.0)
(0.0
) (0
.0)
(0.0
) (0
.0)
(30.
6)
100.
0 28
Oth
er b
ackw
ard
clas
s
62.1
53
.0
24.9
1.
0
6.6
3.0
0.
2
16.9
0.
4
9.1
6.
5
2.4
0.
2
37.9
10
0.0
30
8
O
ther
69
.3
58.0
21
.6
0.6
4.
2 6.
0
0.0
25
.4
0.2
11
.3
6.5
4.
6
0.2
30
.7
100.
0
1,60
6
Wea
lth in
dex
Lo
wes
t *
* *
* *
* *
* *
* *
* *
* 10
0.0
3
Seco
nd
40.5
36
.9
29.3
0.
0
3.6
2.2
0.
9
0.9
0.
0
3.6
3.
6
0.0
0.
0
59.5
10
0.0
58
Mid
dle
48
.2
40.2
25
.1
0.9
2.
4 4.
3
0.6
7.
0
0.0
8.
0
6.7
0.
3
1.0
51
.8
100.
0
175
Four
th
63.2
53
.2
28.3
1.
0
6.8
3.1
0.
0
14.0
0.
0
10.0
6.
2
3.8
0.
0
36.8
10
0.0
41
0
H
ighe
st
70.6
59
.7
21.3
0.
8
4.3
5.6
0.
1
27.4
0.
2
11.0
6.
3
4.6
0.
1
29.4
10
0.0
1,
707
Num
ber
of li
ving
chi
ldre
n
No
child
ren
12
.1
9.6
0.
0
0.0
0.
9 0.
0
0.0
8.
7
0.0
2.
5
0.9
1.
6
0.0
87
.9
100.
0
205
1 ch
ild
57.2
44
.9
2.4
0.
3
3.6
4.4
0.
0
33.9
0.
3
12.3
6.
0
6.2
0.
0
42.8
10
0.0
42
7
1
son
58
.3
47.9
3.
9
0.0
3.
2 5.
1
0.0
35
.8
0.0
10
.3
3.8
6.
5
0.0
41
.7
100.
0
234
No
sons
55
.9
41.3
0.
7
0.7
4.
2 3.
6
0.0
31
.6
0.7
14
.6
8.7
5.
9
0.0
44
.1
100.
0
193
2 ch
ildre
n
79.0
65
.0
19.3
0.
5
6.6
7.3
0.
2
30.7
0.
3
14.0
7.
6
6.2
0.
2
21.0
10
0.0
79
1
1
or m
ore
sons
80
.5
67.9
20
.5
0.6
6.
7 7.
8
0.3
31
.7
0.4
12
.6
7.1
5.
4
0.2
19
.5
100.
0
702
No
sons
67
.1
42.3
9.
7
0.0
6.
0 3.
4
0.0
23
.2
0.0
24
.8
12.0
12
.8
0.0
32
.9
100.
0
89
3
child
ren
74
.5
66.5
38
.7
0.9
3.
5 5.
5
0.0
17
.9
0.0
8.
0
5.6
2.
3
0.1
25
.5
100.
0
509
1 o
r mor
e so
ns
75.1
67
.4
39.5
1.
0
3.6
5.7
0.
0
17.6
0.
0
7.7
5.
2
2.4
0.
1
24.9
10
0.0
48
8
N
o so
ns
* *
* *
* *
* *
* *
* *
* *
100.
0
21
4+
chi
ldre
n
71.2
62
.7
42.8
2.
1
4.7
3.0
0.
2
9.9
0.
0
8.5
7.
4
0.7
0.
4
28.8
10
0.0
42
0
1
or m
ore
sons
72
.1
63.7
43
.4
2.2
4.
8 3.
0
0.2
10
.1
0.0
8.
4
7.2
0.
7
0.4
27
.9
100.
0
411
No
sons
*
* *
* *
* *
* *
* *
* *
* 10
0.0
8
Tot
al
66.9
56
.5
23.0
0.
8 4.
5 5.
0 0.
1 22
.9
0.2
10.4
6.
3 4.
0 0.
2 33
.1
100.
0 2,
351
NFH
S-2
(199
8-99
) 63
.8
56.3
26
.3
2.3
4.0
6.2
na
17.5
na
na
4.
5 2.
6 na
36
.2
100.
0 2,
372
NFH
S-1
(199
2-93
) 60
.3
54.6
20
.0
3.2
2.9
7.8
0.1
20.5
na
na
3.
1 2.
5 na
39
.7
100.
0 3,
309
Not
e: If
mor
e th
an o
ne m
etho
d is
used
, onl
y th
e m
ost e
ffect
ive
met
hod
is co
nsid
ered
in th
is ta
bula
tion.
Tot
al in
clud
es w
omen
with
miss
ing
info
rmat
ion
on e
mpl
oym
ent (
past
12
mon
ths)
and
rel
igio
n,
who
are
not
sho
wn
sepa
rate
ly.
na =
Not
ava
ilabl
e ( )
Bas
ed o
n 25
-49
unw
eigh
ted
case
s.
* Pe
rcen
tage
not
sho
wn;
bas
ed o
n fe
wer
than
25
unw
eigh
ted
case
s.
Delhi.indd 49 3/19/09 12:51:07 PM
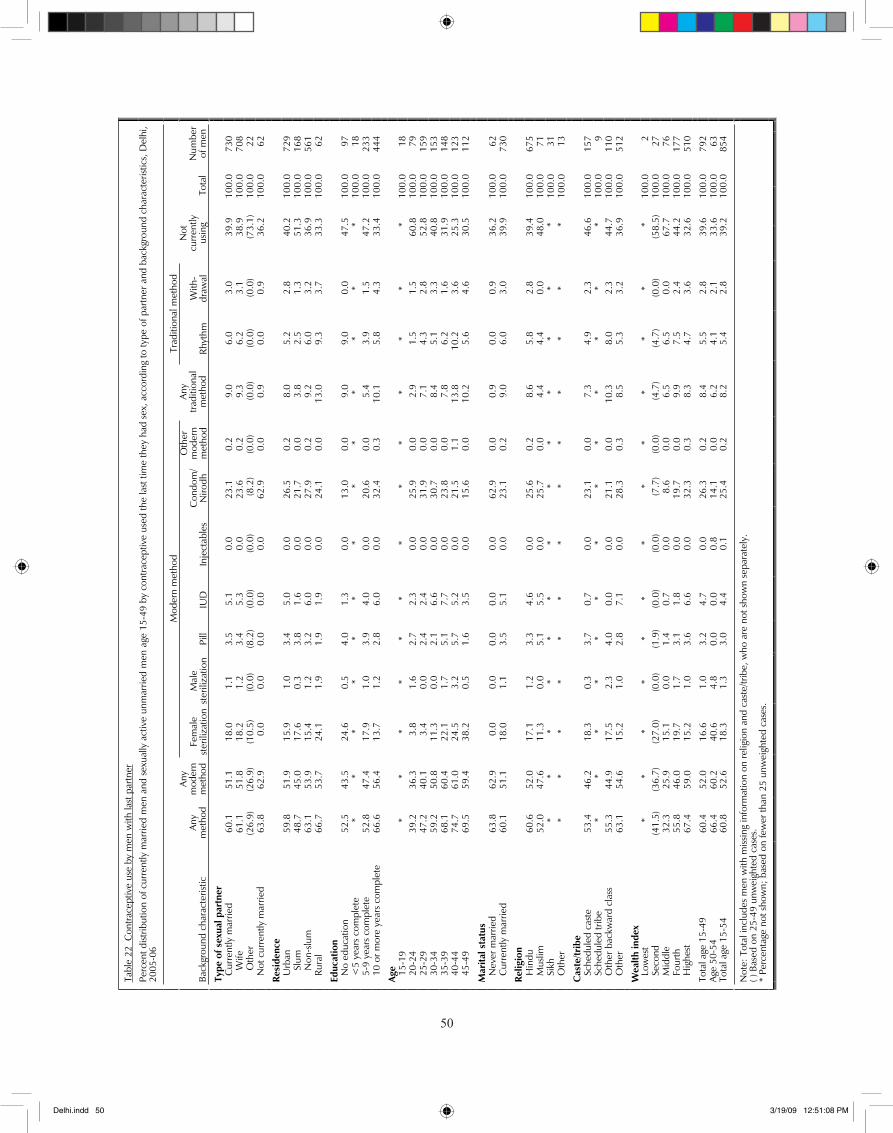
�0
50
Tab
le 2
2 C
ontra
cept
ive
use
by m
en w
ith la
st p
artn
erPe
rcen
t dist
ribut
ion
of c
urre
ntly
mar
ried
men
and
sex
ually
act
ive
unm
arrie
d m
en a
ge 1
5-49
by
cont
race
ptiv
e us
ed th
e la
st ti
me
they
had
sex
, acc
ordi
ng to
type
of p
artn
er a
nd b
ackg
roun
d ch
arac
teris
tics,
Del
hi,
2005
-06
Mod
ern
met
hod
Trad
ition
al m
etho
d
Back
grou
nd c
hara
cter
istic
An
ym
etho
d
Any
mod
ern
met
hod
Fem
ale
ster
iliza
tion
Mal
est
erili
zatio
nPi
ll IU
D
Inje
ctab
les
Con
dom
/N
irodh
Oth
er
mod
ern
met
hod
Any
tradi
tiona
lm
etho
dRh
ythm
W
ith-
draw
al
Not
curr
ently
usin
g To
tal
Num
ber
of m
en
Type
of s
exua
l par
tner
C
urre
ntly
mar
ried
60
.1
51.1
18
.0
1.1
3.
5
5.1
0.
0
23.1
0.
2
9.0
6.
0
3.0
39
.9
100.
0
730
Wife
61
.1
51.8
18
.2
1.2
3.
4
5.3
0.
0
23.6
0.
2
9.3
6.
2
3.1
38
.9
100.
0
708
Oth
er
(26.
9)
(26.
9)
(10.
5)
(0.0
) (8
.2)
(0.0
) (0
.0)
(8.2
) (0
.0)
(0.0
) (0
.0)
(0.0
) (7
3.1)
10
0.0
22
Not
cur
rent
ly m
arrie
d
63.8
62
.9
0.0
0.
0
0.0
0.
0
0.0
62
.9
0.0
0.
9
0.0
0.
9
36.2
10
0.0
62
Resi
denc
e
Urb
an
59.8
51
.9
15.9
1.
0
3.4
5.
0
0.0
26
.5
0.2
8.
0
5.2
2.
8
40.2
10
0.0
72
9
S
lum
48
.7
45.0
17
.6
0.3
3.
8
1.6
0.
0
21.7
0.
0
3.8
2.
5
1.3
51
.3
100.
0
168
N
on-s
lum
63
.1
53.9
15
.4
1.2
3.
2
6.0
0.
0
27.9
0.
2
9.2
6.
0
3.2
36
.9
100.
0
561
Ru
ral
66.7
53
.7
24.1
1.
9
1.9
1.
9
0.0
24
.1
0.0
13
.0
9.3
3.
7
33.3
10
0.0
62
Educ
atio
n
No
educ
atio
n
52.5
43
.5
24.6
0.
5
4.0
1.
3
0.0
13
.0
0.0
9.
0
9.0
0.
0
47.5
10
0.0
97
<5
year
s co
mpl
ete
*
* *
* *
* *
* *
* *
* *
100.
0
18
5-
9 ye
ars
com
plet
e
52.8
47
.4
17.9
1.
0
3.9
4.
0
0.0
20
.6
0.0
5.
4
3.9
1.
5
47.2
10
0.0
23
3
10
or m
ore
year
s co
mpl
ete
66.6
56
.4
13.7
1.
2
2.8
6.
0
0.0
32
.4
0.3
10
.1
5.8
4.
3
33.4
10
0.0
444
Age
15
-19
*
* *
* *
* *
* *
* *
* *
100.
0
18
20
-24
39
.2
36.3
3.
8
1.6
2.
7
2.3
0.
0
25.9
0.
0
2.9
1.
5
1.5
60
.8
100.
0
79
25
-29
47
.2
40.1
3.
4
0.0
2.
4
2.4
0.
0
31.9
0.
0
7.1
4.
3
2.8
52
.8
100.
0
159
30-3
4
59.2
50
.8
11.3
0.
0
2.1
6.
6
0.0
30
.7
0.0
8.
4
5.1
3.
3
40.8
10
0.0
15
3
35
-39
68
.1
60.4
22
.1
1.7
5.
1
7.7
0.
0
23.8
0.
0
7.8
6.
2
1.6
31
.9
100.
0
148
40-4
4
74.7
61
.0
24.5
3.
2
5.7
5.
2
0.0
21
.5
1.1
13
.8
10.2
3.
6
25.3
10
0.0
12
3
45
-49
69
.5
59.4
38
.2
0.5
1.
6
3.5
0.
0
15.6
0.
0
10.2
5.
6
4.6
30
.5
100.
0
112
Mar
ital s
tatu
s
Nev
er m
arrie
d
63.8
62
.9
0.0
0.
0
0.0
0.
0
0.0
62
.9
0.0
0.
9
0.0
0.
9
36.2
10
0.0
62
Cur
rent
ly m
arrie
d
60.1
51
.1
18.0
1.
1
3.5
5.
1
0.0
23
.1
0.2
9.
0
6.0
3.
0
39.9
10
0.0
73
0
Relig
ion
H
indu
60
.6
52.0
17
.1
1.2
3.
3
4.6
0.
0
25.6
0.
2
8.6
5.
8
2.8
39
.4
100.
0
675
Mus
lim
52.0
47
.6
11.3
0.
0
5.1
5.
5
0.0
25
.7
0.0
4.
4
4.4
0.
0
48.0
10
0.0
71
Sikh
*
* *
* *
* *
* *
* *
* *
100.
0 31
Oth
er
* *
* *
* *
* *
* *
* *
* 10
0.0
13
Cas
te/tr
ibe
Sc
hedu
led
cast
e
53.4
46
.2
18.3
0.
3
3.7
0.
7
0.0
23
.1
0.0
7.
3
4.9
2.
3
46.6
10
0.0
15
7
Sc
hedu
led
tribe
*
* *
* *
* *
* *
* *
* *
100.
0
9
O
ther
bac
kwar
d cl
ass
55
.3
44.9
17
.5
2.3
4.
0
0.0
0.
0
21.1
0.
0
10.3
8.
0
2.3
44
.7
100.
0
110
Oth
er
63.1
54
.6
15.2
1.
0
2.8
7.
1
0.0
28
.3
0.3
8.
5
5.3
3.
2
36.9
10
0.0
51
2
Wea
lth in
dex
Lo
wes
t *
* *
* *
* *
* *
* *
* *
100.
0
2
Se
cond
(4
1.5)
(3
6.7)
(2
7.0)
(0
.0)
(1.9
) (0
.0)
(0.0
) (7
.7)
(0.0
) (4
.7)
(4.7
) (0
.0)
(58.
5)
100.
0
27
M
iddl
e
32.3
25
.9
15.1
0.
0
1.4
0.
7
0.0
8.
6
0.0
6.
5
6.5
0.
0
67.7
10
0.0
76
Four
th
55.8
46
.0
19.7
1.
7
3.1
1.
8
0.0
19
.7
0.0
9.
9
7.5
2.
4
44.2
10
0.0
17
7
Hig
hest
67
.4
59.0
15
.2
1.0
3.
6
6.6
0.
0
32.3
0.
3
8.3
4.
7
3.6
32
.6
100.
0
510
Tota
l age
15-
4960
.4
52.0
16
.6
1.0
3.
2
4.7
0.
0
26.3
0.
2
8.4
5.
5
2.8
39
.6
100.
0
792
Ag
e 50
-54
66
.4
60.2
40
.6
4.8
0.
0
0.0
0.
8
14.1
0.
0
6.2
4.
1
2.1
33
.6
100.
0
63
Tot
al a
ge 1
5-54
60
.8
52.6
18
.3
1.3
3.0
4.4
0.1
25.4
0.
2 8.
2 5.
4 2.
8 39
.2
100.
0 85
4
Not
e: T
otal
incl
udes
men
with
miss
ing
info
rmat
ion
on re
ligio
n an
d ca
ste/
tribe
, who
are
not
sho
wn
sepa
rate
ly.
( ) B
ased
on
25-4
9 un
wei
ghte
d ca
ses.
*
Perc
enta
ge n
ot s
how
n; b
ased
on
few
er th
an 2
5 un
wei
ghte
d ca
ses.
Delhi.indd 50 3/19/09 12:51:08 PM
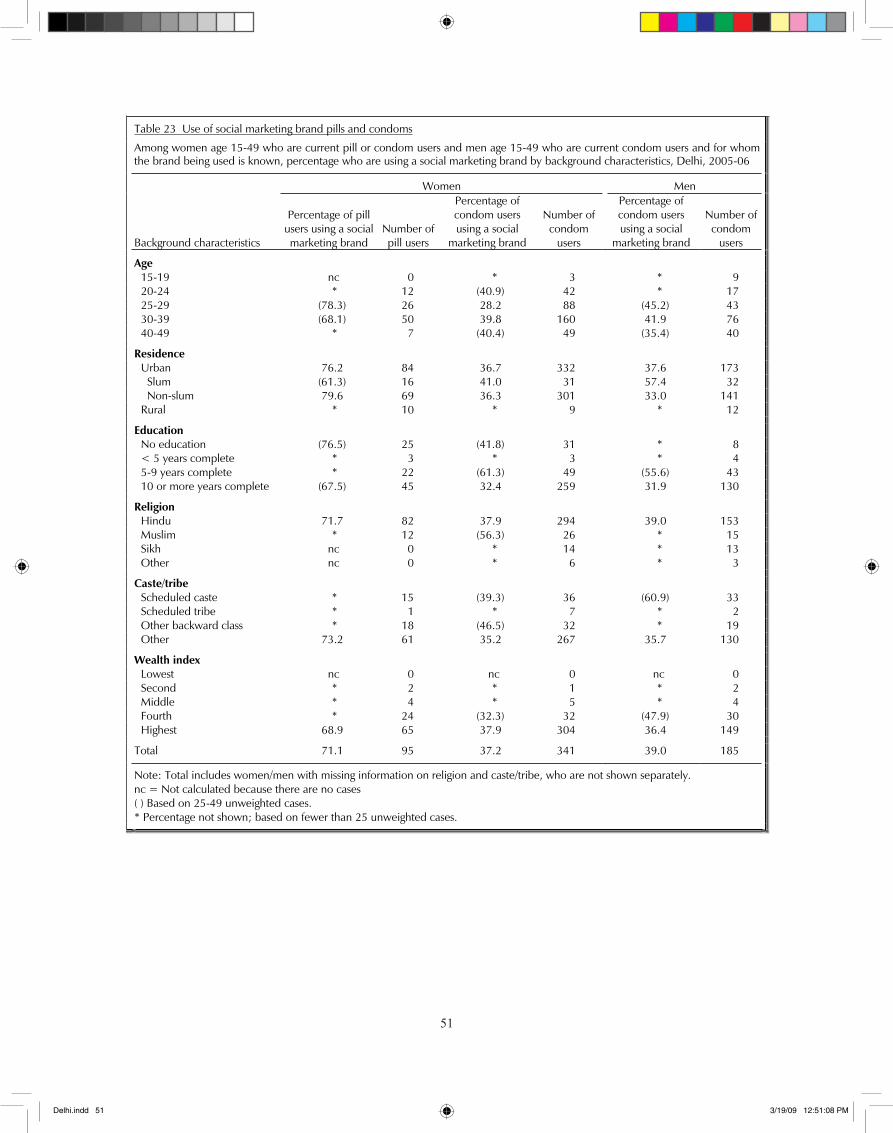
��
51
Table 23 Use of social marketing brand pills and condoms
Among women age 15-49 who are current pill or condom users and men age 15-49 who are current condom users and for whom the brand being used is known, percentage who are using a social marketing brand by background characteristics, Delhi, 2005-06
Women Men
Background characteristics
Percentage of pill users using a social marketing brand
Number of pill users
Percentage of condom users using a social
marketing brand
Number of condom
users
Percentage of condom users using a social
marketing brand
Number of condom
users
Age 15-19 nc 0 * 3 * 9 20-24 * 12 (40.9) 42 * 17 25-29 (78.3) 26 28.2 88 (45.2) 43 30-39 (68.1) 50 39.8 160 41.9 76 40-49 * 7 (40.4) 49 (35.4) 40
Residence Urban 76.2 84 36.7 332 37.6 173 Slum (61.3) 16 41.0 31 57.4 32 Non-slum 79.6 69 36.3 301 33.0 141 Rural * 10 * 9 * 12
Education No education (76.5) 25 (41.8) 31 * 8 < 5 years complete * 3 * 3 * 4 5-9 years complete * 22 (61.3) 49 (55.6) 43 10 or more years complete (67.5) 45 32.4 259 31.9 130
Religion Hindu 71.7 82 37.9 294 39.0 153 Muslim * 12 (56.3) 26 * 15 Sikh nc 0 * 14 * 13 Other nc 0 * 6 * 3
Caste/tribe Scheduled caste * 15 (39.3) 36 (60.9) 33 Scheduled tribe * 1 * 7 * 2 Other backward class * 18 (46.5) 32 * 19 Other 73.2 61 35.2 267 35.7 130
Wealth index Lowest nc 0 nc 0 nc 0 Second * 2 * 1 * 2 Middle * 4 * 5 * 4 Fourth * 24 (32.3) 32 (47.9) 30 Highest 68.9 65 37.9 304 36.4 149
Total 71.1 95 37.2 341 39.0 185
Note: Total includes women/men with missing information on religion and caste/tribe, who are not shown separately. nc = Not calculated because there are no cases ( ) Based on 25-49 unweighted cases. * Percentage not shown; based on fewer than 25 unweighted cases.
Delhi.indd 51 3/19/09 12:51:08 PM
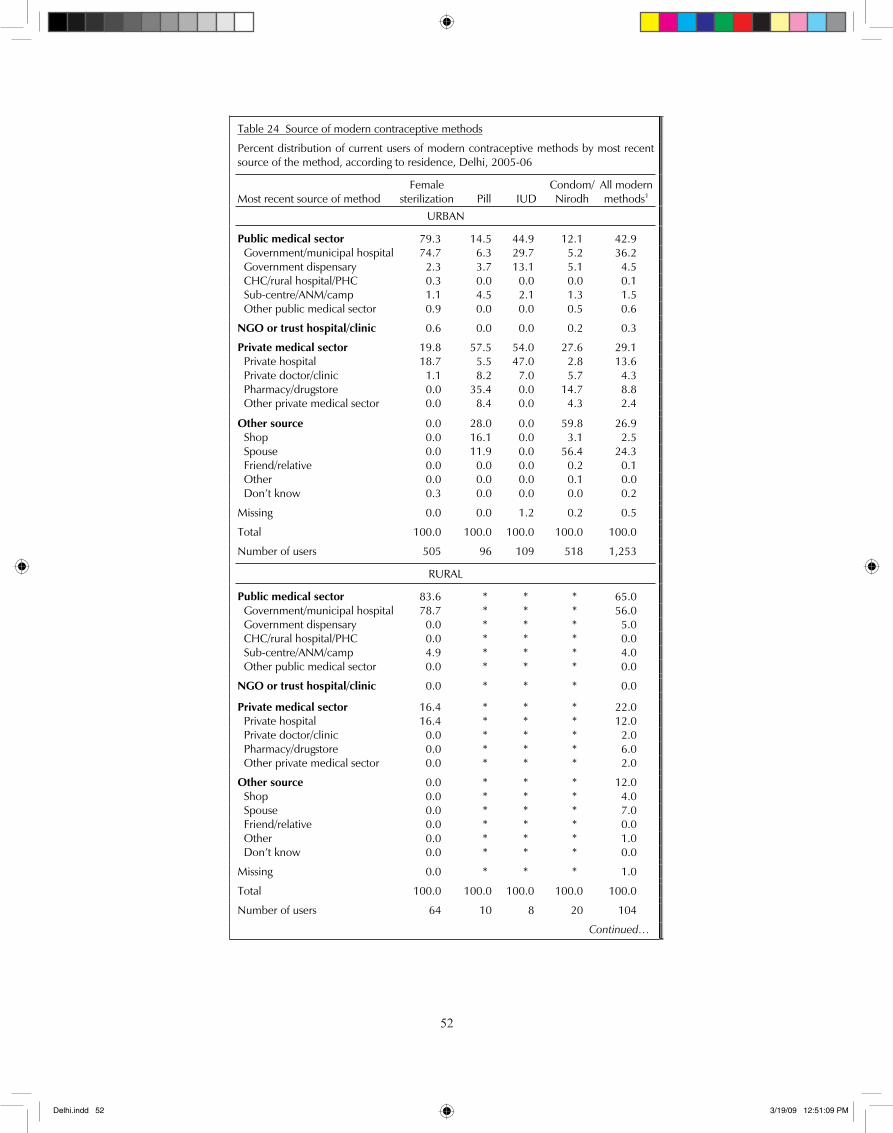
��
52
Table 24 Source of modern contraceptive methods
Percent distribution of current users of modern contraceptive methods by most recent source of the method, according to residence, Delhi, 2005-06
Most recent source of method Female
sterilization Pill IUD Condom/Nirodh
All modern methods1
URBAN
Public medical sector 79.3 14.5 44.9 12.1 42.9 Government/municipal hospital 74.7 6.3 29.7 5.2 36.2 Government dispensary 2.3 3.7 13.1 5.1 4.5 CHC/rural hospital/PHC 0.3 0.0 0.0 0.0 0.1 Sub-centre/ANM/camp 1.1 4.5 2.1 1.3 1.5 Other public medical sector 0.9 0.0 0.0 0.5 0.6
NGO or trust hospital/clinic 0.6 0.0 0.0 0.2 0.3
Private medical sector 19.8 57.5 54.0 27.6 29.1 Private hospital 18.7 5.5 47.0 2.8 13.6 Private doctor/clinic 1.1 8.2 7.0 5.7 4.3 Pharmacy/drugstore 0.0 35.4 0.0 14.7 8.8 Other private medical sector 0.0 8.4 0.0 4.3 2.4
Other source 0.0 28.0 0.0 59.8 26.9 Shop 0.0 16.1 0.0 3.1 2.5 Spouse 0.0 11.9 0.0 56.4 24.3 Friend/relative 0.0 0.0 0.0 0.2 0.1 Other 0.0 0.0 0.0 0.1 0.0 Don’t know 0.3 0.0 0.0 0.0 0.2
Missing 0.0 0.0 1.2 0.2 0.5
Total 100.0 100.0 100.0 100.0 100.0
Number of users 505 96 109 518 1,253
RURAL
Public medical sector 83.6 * * * 65.0 Government/municipal hospital 78.7 * * * 56.0 Government dispensary 0.0 * * * 5.0 CHC/rural hospital/PHC 0.0 * * * 0.0 Sub-centre/ANM/camp 4.9 * * * 4.0 Other public medical sector 0.0 * * * 0.0
NGO or trust hospital/clinic 0.0 * * * 0.0
Private medical sector 16.4 * * * 22.0 Private hospital 16.4 * * * 12.0 Private doctor/clinic 0.0 * * * 2.0 Pharmacy/drugstore 0.0 * * * 6.0 Other private medical sector 0.0 * * * 2.0
Other source 0.0 * * * 12.0 Shop 0.0 * * * 4.0 Spouse 0.0 * * * 7.0 Friend/relative 0.0 * * * 0.0 Other 0.0 * * * 1.0 Don’t know 0.0 * * * 0.0
Missing 0.0 * * * 1.0
Total 100.0 100.0 100.0 100.0 100.0
Number of users 64 10 8 20 104
Continued…
Delhi.indd 52 3/19/09 12:51:09 PM
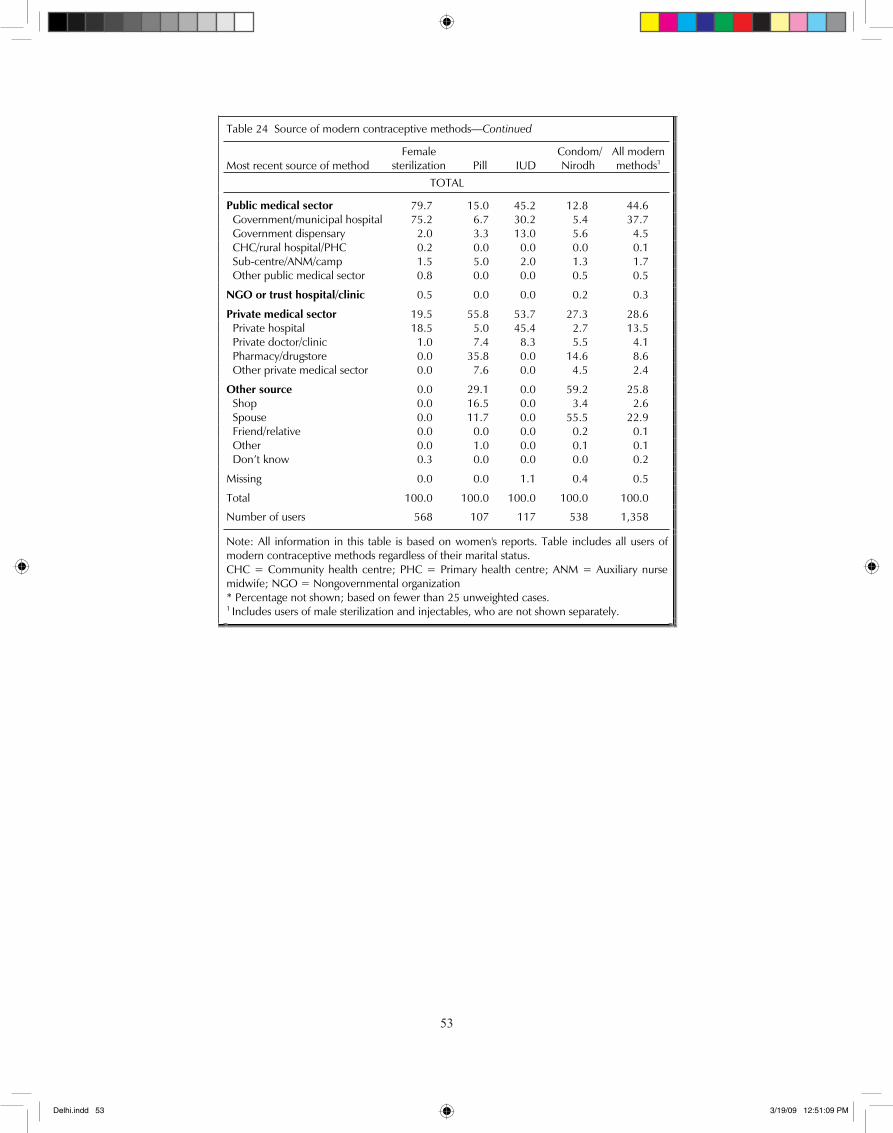
��
53
Table 24 Source of modern contraceptive methods—Continued
Most recent source of method Female
sterilization Pill IUD Condom/
Nirodh All modern methods1
TOTAL
Public medical sector 79.7 15.0 45.2 12.8 44.6 Government/municipal hospital 75.2 6.7 30.2 5.4 37.7 Government dispensary 2.0 3.3 13.0 5.6 4.5 CHC/rural hospital/PHC 0.2 0.0 0.0 0.0 0.1 Sub-centre/ANM/camp 1.5 5.0 2.0 1.3 1.7 Other public medical sector 0.8 0.0 0.0 0.5 0.5
NGO or trust hospital/clinic 0.5 0.0 0.0 0.2 0.3
Private medical sector 19.5 55.8 53.7 27.3 28.6 Private hospital 18.5 5.0 45.4 2.7 13.5 Private doctor/clinic 1.0 7.4 8.3 5.5 4.1 Pharmacy/drugstore 0.0 35.8 0.0 14.6 8.6 Other private medical sector 0.0 7.6 0.0 4.5 2.4
Other source 0.0 29.1 0.0 59.2 25.8 Shop 0.0 16.5 0.0 3.4 2.6 Spouse 0.0 11.7 0.0 55.5 22.9 Friend/relative 0.0 0.0 0.0 0.2 0.1 Other 0.0 1.0 0.0 0.1 0.1 Don’t know 0.3 0.0 0.0 0.0 0.2
Missing 0.0 0.0 1.1 0.4 0.5
Total 100.0 100.0 100.0 100.0 100.0
Number of users 568 107 117 538 1,358
Note: All information in this table is based on women's reports. Table includes all users of modern contraceptive methods regardless of their marital status. CHC = Community health centre; PHC = Primary health centre; ANM = Auxiliary nurse midwife; NGO = Nongovernmental organization * Percentage not shown; based on fewer than 25 unweighted cases. 1 Includes users of male sterilization and injectables, who are not shown separately.
Delhi.indd 53 3/19/09 12:51:09 PM
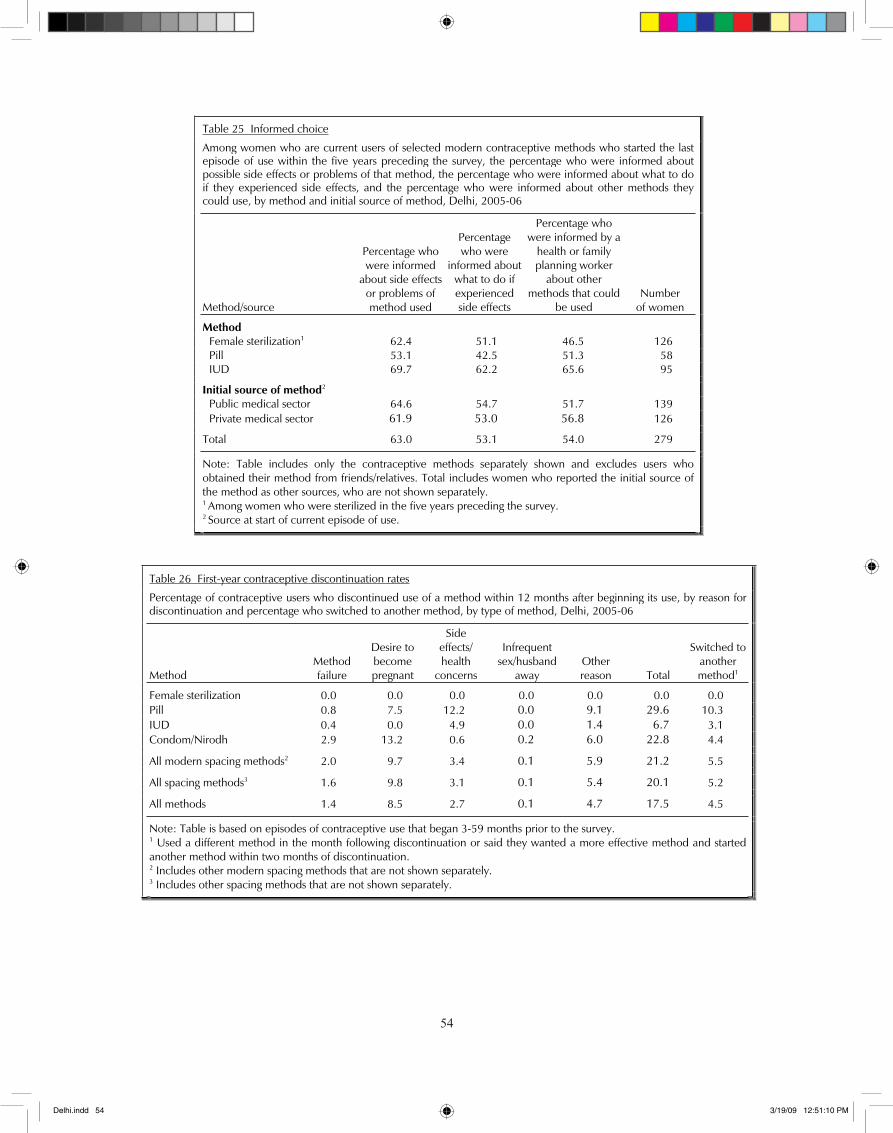
��
54
Table 25 Informed choice
Among women who are current users of selected modern contraceptive methods who started the last episode of use within the five years preceding the survey, the percentage who were informed about possible side effects or problems of that method, the percentage who were informed about what to do if they experienced side effects, and the percentage who were informed about other methods they could use, by method and initial source of method, Delhi, 2005-06
Method/source
Percentage who were informed
about side effects or problems of method used
Percentage who were
informed about what to do if experienced side effects
Percentage who were informed by a
health or family planning worker
about other methods that could
be used Number
of women
Method Female sterilization1 62.4 51.1 46.5 126 Pill 53.1 42.5 51.3 58 IUD 69.7 62.2 65.6 95
Initial source of method2 Public medical sector 64.6 54.7 51.7 139 Private medical sector 61.9 53.0 56.8 126
Total 63.0 53.1 54.0 279
Note: Table includes only the contraceptive methods separately shown and excludes users who obtained their method from friends/relatives. Total includes women who reported the initial source of the method as other sources, who are not shown separately. 1 Among women who were sterilized in the five years preceding the survey. 2 Source at start of current episode of use.
Table 26 First-year contraceptive discontinuation rates
Percentage of contraceptive users who discontinued use of a method within 12 months after beginning its use, by reason for discontinuation and percentage who switched to another method, by type of method, Delhi, 2005-06
Method Method failure
Desire to become pregnant
Side effects/health
concerns
Infrequent sex/husband
awayOther reason Total
Switched to another method1
Female sterilization 0.0 0.0 0.0 0.0 0.0 0.0 0.0 Pill 0.8 7.5 12.2 0.0 9.1 29.6 10.3 IUD 0.4 0.0 4.9 0.0 1.4 6.7 3.1 Condom/Nirodh 2.9 13.2 0.6 0.2 6.0 22.8 4.4
All modern spacing methods2 2.0 9.7 3.4 0.1 5.9 21.2 5.5
All spacing methods3 1.6 9.8 3.1 0.1 5.4 20.1 5.2
All methods 1.4 8.5 2.7 0.1 4.7 17.5 4.5
Note: Table is based on episodes of contraceptive use that began 3-59 months prior to the survey. 1 Used a different method in the month following discontinuation or said they wanted a more effective method and started another method within two months of discontinuation. 2 Includes other modern spacing methods that are not shown separately. 3 Includes other spacing methods that are not shown separately.
Delhi.indd 54 3/19/09 12:51:10 PM
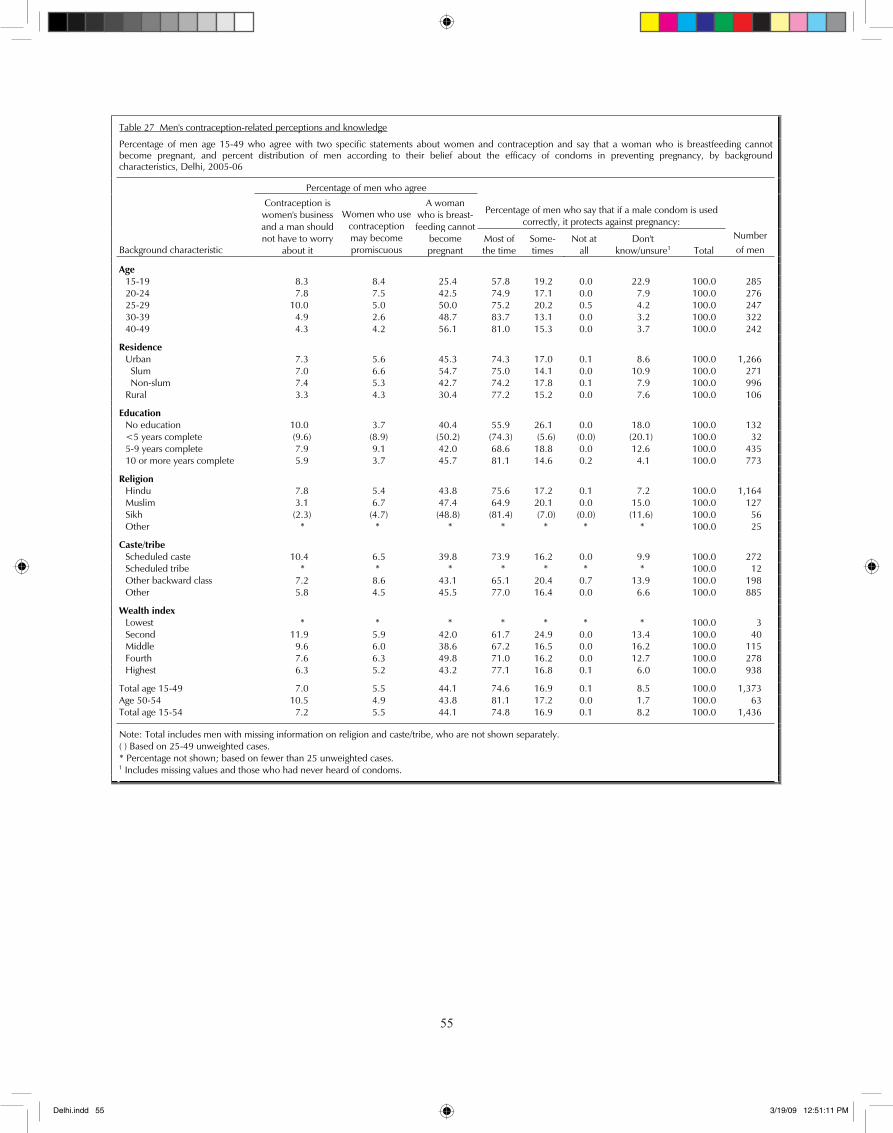
��
55
Table 27 Men's contraception-related perceptions and knowledge
Percentage of men age 15-49 who agree with two specific statements about women and contraception and say that a woman who is breastfeeding cannot become pregnant, and percent distribution of men according to their belief about the efficacy of condoms in preventing pregnancy, by background characteristics, Delhi, 2005-06
Percentage of men who agree
Percentage of men who say that if a male condom is used correctly, it protects against pregnancy:
Background characteristic
Contraception is women's business and a man should not have to worry
about it
Women who use contraceptionmay become promiscuous
A woman who is breast-feeding cannot
become pregnant
Most of the time
Some-times
Not at all
Don'tknow/unsure1 Total
Numberof men
Age 15-19 8.3 8.4 25.4 57.8 19.2 0.0 22.9 100.0 285 20-24 7.8 7.5 42.5 74.9 17.1 0.0 7.9 100.0 276 25-29 10.0 5.0 50.0 75.2 20.2 0.5 4.2 100.0 247 30-39 4.9 2.6 48.7 83.7 13.1 0.0 3.2 100.0 322 40-49 4.3 4.2 56.1 81.0 15.3 0.0 3.7 100.0 242
Residence Urban 7.3 5.6 45.3 74.3 17.0 0.1 8.6 100.0 1,266 Slum 7.0 6.6 54.7 75.0 14.1 0.0 10.9 100.0 271 Non-slum 7.4 5.3 42.7 74.2 17.8 0.1 7.9 100.0 996 Rural 3.3 4.3 30.4 77.2 15.2 0.0 7.6 100.0 106
Education No education 10.0 3.7 40.4 55.9 26.1 0.0 18.0 100.0 132 <5 years complete (9.6) (8.9) (50.2) (74.3) (5.6) (0.0) (20.1) 100.0 32 5-9 years complete 7.9 9.1 42.0 68.6 18.8 0.0 12.6 100.0 435 10 or more years complete 5.9 3.7 45.7 81.1 14.6 0.2 4.1 100.0 773
Religion Hindu 7.8 5.4 43.8 75.6 17.2 0.1 7.2 100.0 1,164 Muslim 3.1 6.7 47.4 64.9 20.1 0.0 15.0 100.0 127 Sikh (2.3) (4.7) (48.8) (81.4) (7.0) (0.0) (11.6) 100.0 56 Other * * * * * * * 100.0 25
Caste/tribe Scheduled caste 10.4 6.5 39.8 73.9 16.2 0.0 9.9 100.0 272 Scheduled tribe * * * * * * * 100.0 12 Other backward class 7.2 8.6 43.1 65.1 20.4 0.7 13.9 100.0 198 Other 5.8 4.5 45.5 77.0 16.4 0.0 6.6 100.0 885
Wealth index Lowest * * * * * * * 100.0 3 Second 11.9 5.9 42.0 61.7 24.9 0.0 13.4 100.0 40 Middle 9.6 6.0 38.6 67.2 16.5 0.0 16.2 100.0 115 Fourth 7.6 6.3 49.8 71.0 16.2 0.0 12.7 100.0 278 Highest 6.3 5.2 43.2 77.1 16.8 0.1 6.0 100.0 938
Total age 15-49 7.0 5.5 44.1 74.6 16.9 0.1 8.5 100.0 1,373 Age 50-54 10.5 4.9 43.8 81.1 17.2 0.0 1.7 100.0 63 Total age 15-54 7.2 5.5 44.1 74.8 16.9 0.1 8.2 100.0 1,436
Note: Total includes men with missing information on religion and caste/tribe, who are not shown separately. ( ) Based on 25-49 unweighted cases. * Percentage not shown; based on fewer than 25 unweighted cases. 1 Includes missing values and those who had never heard of condoms.
Delhi.indd 55 3/19/09 12:51:11 PM
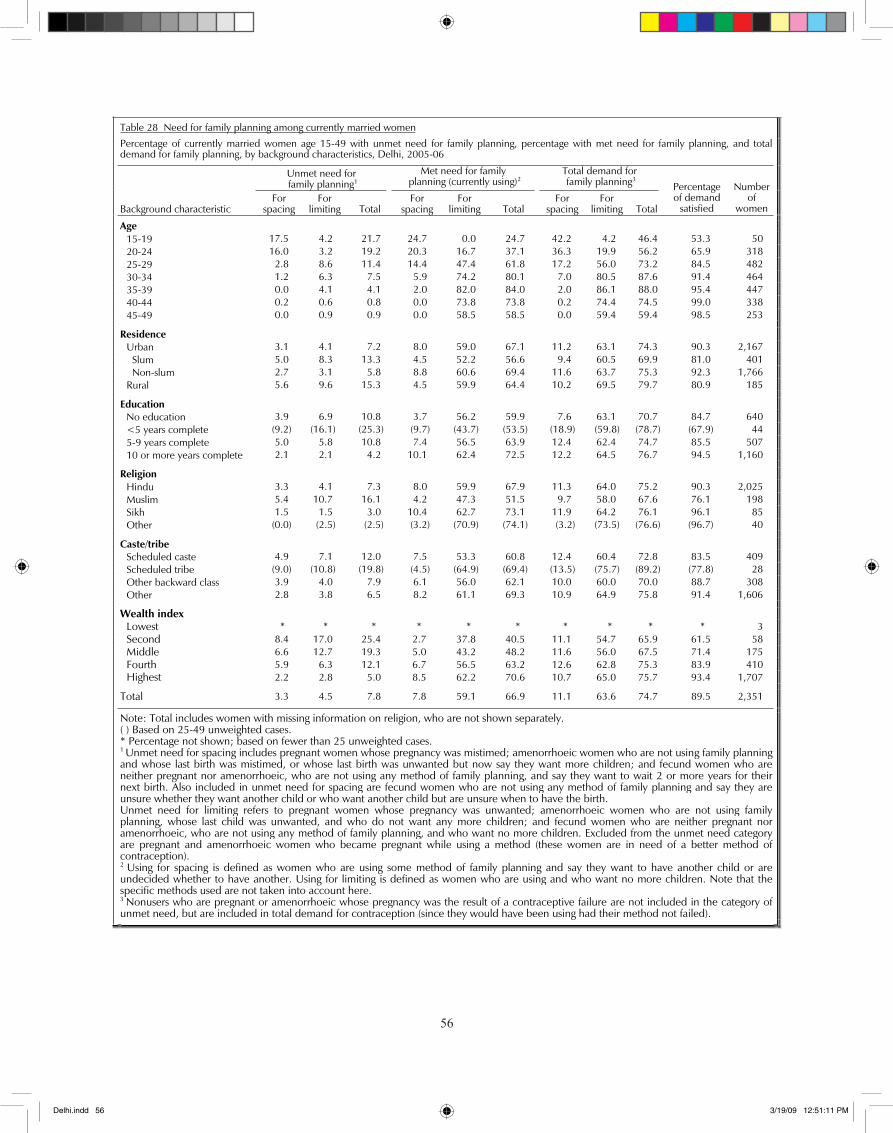
��
56
Table 28 Need for family planning among currently married women
Percentage of currently married women age 15-49 with unmet need for family planning, percentage with met need for family planning, and total demand for family planning, by background characteristics, Delhi, 2005-06
Unmet need for family planning1
Met need for family planning (currently using)2
Total demand for family planning3
Background characteristic For
spacing For
limiting Total For
spacing For
limiting Total For
spacingFor
limiting Total
Percentage of demand
satisfied
Number of
women
Age 15-19 17.5 4.2 21.7 24.7 0.0 24.7 42.2 4.2 46.4 53.3 50 20-24 16.0 3.2 19.2 20.3 16.7 37.1 36.3 19.9 56.2 65.9 318 25-29 2.8 8.6 11.4 14.4 47.4 61.8 17.2 56.0 73.2 84.5 482 30-34 1.2 6.3 7.5 5.9 74.2 80.1 7.0 80.5 87.6 91.4 464 35-39 0.0 4.1 4.1 2.0 82.0 84.0 2.0 86.1 88.0 95.4 447 40-44 0.2 0.6 0.8 0.0 73.8 73.8 0.2 74.4 74.5 99.0 338 45-49 0.0 0.9 0.9 0.0 58.5 58.5 0.0 59.4 59.4 98.5 253
Residence Urban 3.1 4.1 7.2 8.0 59.0 67.1 11.2 63.1 74.3 90.3 2,167 Slum 5.0 8.3 13.3 4.5 52.2 56.6 9.4 60.5 69.9 81.0 401 Non-slum 2.7 3.1 5.8 8.8 60.6 69.4 11.6 63.7 75.3 92.3 1,766 Rural 5.6 9.6 15.3 4.5 59.9 64.4 10.2 69.5 79.7 80.9 185
Education No education 3.9 6.9 10.8 3.7 56.2 59.9 7.6 63.1 70.7 84.7 640 <5 years complete (9.2) (16.1) (25.3) (9.7) (43.7) (53.5) (18.9) (59.8) (78.7) (67.9) 44 5-9 years complete 5.0 5.8 10.8 7.4 56.5 63.9 12.4 62.4 74.7 85.5 507 10 or more years complete 2.1 2.1 4.2 10.1 62.4 72.5 12.2 64.5 76.7 94.5 1,160
Religion Hindu 3.3 4.1 7.3 8.0 59.9 67.9 11.3 64.0 75.2 90.3 2,025 Muslim 5.4 10.7 16.1 4.2 47.3 51.5 9.7 58.0 67.6 76.1 198 Sikh 1.5 1.5 3.0 10.4 62.7 73.1 11.9 64.2 76.1 96.1 85 Other (0.0) (2.5) (2.5) (3.2) (70.9) (74.1) (3.2) (73.5) (76.6) (96.7) 40
Caste/tribe Scheduled caste 4.9 7.1 12.0 7.5 53.3 60.8 12.4 60.4 72.8 83.5 409 Scheduled tribe (9.0) (10.8) (19.8) (4.5) (64.9) (69.4) (13.5) (75.7) (89.2) (77.8) 28 Other backward class 3.9 4.0 7.9 6.1 56.0 62.1 10.0 60.0 70.0 88.7 308 Other 2.8 3.8 6.5 8.2 61.1 69.3 10.9 64.9 75.8 91.4 1,606
Wealth index Lowest * * * * * * * * * * 3 Second 8.4 17.0 25.4 2.7 37.8 40.5 11.1 54.7 65.9 61.5 58 Middle 6.6 12.7 19.3 5.0 43.2 48.2 11.6 56.0 67.5 71.4 175 Fourth 5.9 6.3 12.1 6.7 56.5 63.2 12.6 62.8 75.3 83.9 410
Highest 2.2 2.8 5.0 8.5 62.2 70.6 10.7 65.0 75.7 93.4 1,707
Total 3.3 4.5 7.8 7.8 59.1 66.9 11.1 63.6 74.7 89.5 2,351
Note: Total includes women with missing information on religion, who are not shown separately. ( ) Based on 25-49 unweighted cases. * Percentage not shown; based on fewer than 25 unweighted cases. 1 Unmet need for spacing includes pregnant women whose pregnancy was mistimed; amenorrhoeic women who are not using family planningand whose last birth was mistimed, or whose last birth was unwanted but now say they want more children; and fecund women who are neither pregnant nor amenorrhoeic, who are not using any method of family planning, and say they want to wait 2 or more years for their next birth. Also included in unmet need for spacing are fecund women who are not using any method of family planning and say they are unsure whether they want another child or who want another child but are unsure when to have the birth. Unmet need for limiting refers to pregnant women whose pregnancy was unwanted; amenorrhoeic women who are not using family planning, whose last child was unwanted, and who do not want any more children; and fecund women who are neither pregnant nor amenorrhoeic, who are not using any method of family planning, and who want no more children. Excluded from the unmet need category are pregnant and amenorrhoeic women who became pregnant while using a method (these women are in need of a better method of contraception). 2 Using for spacing is defined as women who are using some method of family planning and say they want to have another child or are undecided whether to have another. Using for limiting is defined as women who are using and who want no more children. Note that the specific methods used are not taken into account here. 3 Nonusers who are pregnant or amenorrhoeic whose pregnancy was the result of a contraceptive failure are not included in the category of unmet need, but are included in total demand for contraception (since they would have been using had their method not failed).
Delhi.indd 56 3/19/09 12:51:11 PM
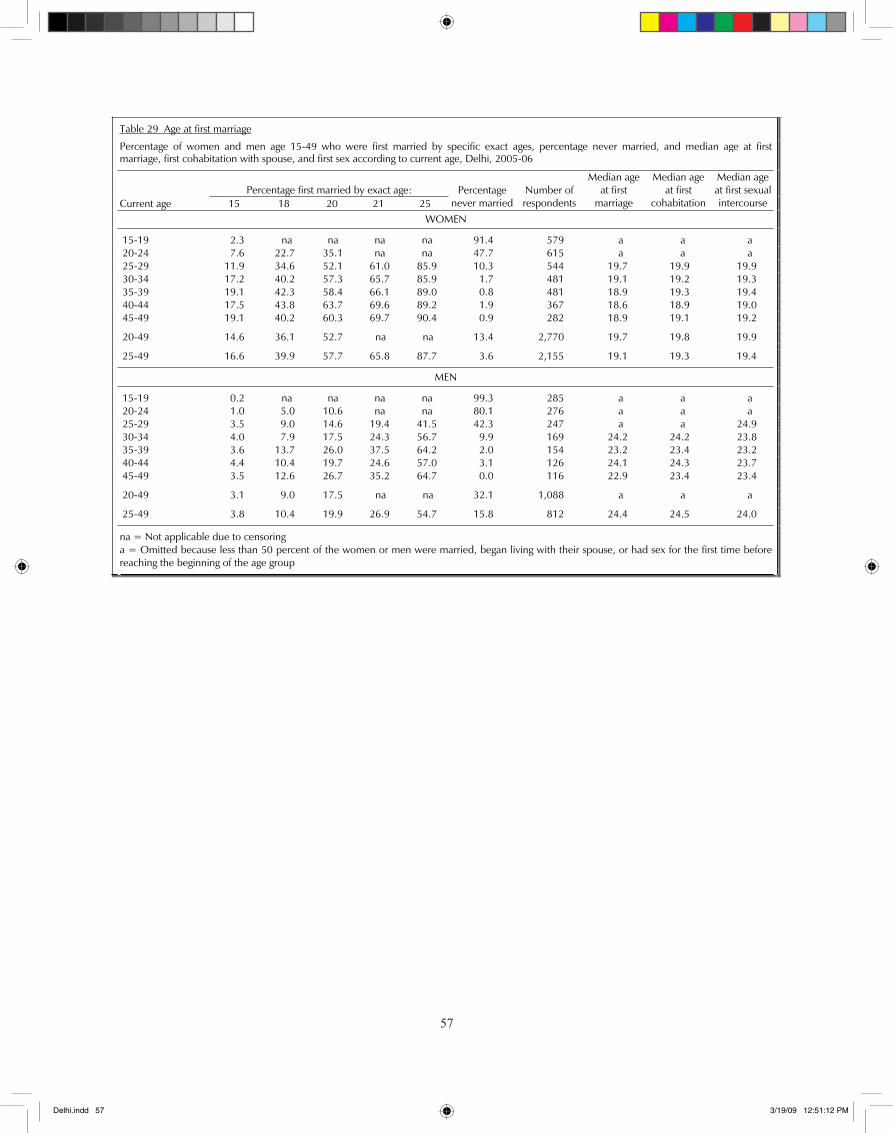
��
57
Table 29 Age at first marriage
Percentage of women and men age 15-49 who were first married by specific exact ages, percentage never married, and median age at first marriage, first cohabitation with spouse, and first sex according to current age, Delhi, 2005-06
Percentage first married by exact age: Current age 15 18 20 21 25
Percentage never married
Number of respondents
Median age at first
marriage
Median age at first
cohabitation
Median age at first sexual intercourse
WOMEN
15-19 2.3 na na na na 91.4 579 a a a 20-24 7.6 22.7 35.1 na na 47.7 615 a a a 25-29 11.9 34.6 52.1 61.0 85.9 10.3 544 19.7 19.9 19.9 30-34 17.2 40.2 57.3 65.7 85.9 1.7 481 19.1 19.2 19.3 35-39 19.1 42.3 58.4 66.1 89.0 0.8 481 18.9 19.3 19.4 40-44 17.5 43.8 63.7 69.6 89.2 1.9 367 18.6 18.9 19.0 45-49 19.1 40.2 60.3 69.7 90.4 0.9 282 18.9 19.1 19.2
20-49 14.6 36.1 52.7 na na 13.4 2,770 19.7 19.8 19.9
25-49 16.6 39.9 57.7 65.8 87.7 3.6 2,155 19.1 19.3 19.4
MEN
15-19 0.2 na na na na 99.3 285 a a a 20-24 1.0 5.0 10.6 na na 80.1 276 a a a 25-29 3.5 9.0 14.6 19.4 41.5 42.3 247 a a 24.9 30-34 4.0 7.9 17.5 24.3 56.7 9.9 169 24.2 24.2 23.8 35-39 3.6 13.7 26.0 37.5 64.2 2.0 154 23.2 23.4 23.2 40-44 4.4 10.4 19.7 24.6 57.0 3.1 126 24.1 24.3 23.7 45-49 3.5 12.6 26.7 35.2 64.7 0.0 116 22.9 23.4 23.4
20-49 3.1 9.0 17.5 na na 32.1 1,088 a a a
25-49 3.8 10.4 19.9 26.9 54.7 15.8 812 24.4 24.5 24.0
na = Not applicable due to censoring a = Omitted because less than 50 percent of the women or men were married, began living with their spouse, or had sex for the first time before reaching the beginning of the age group
Delhi.indd 57 3/19/09 12:51:12 PM
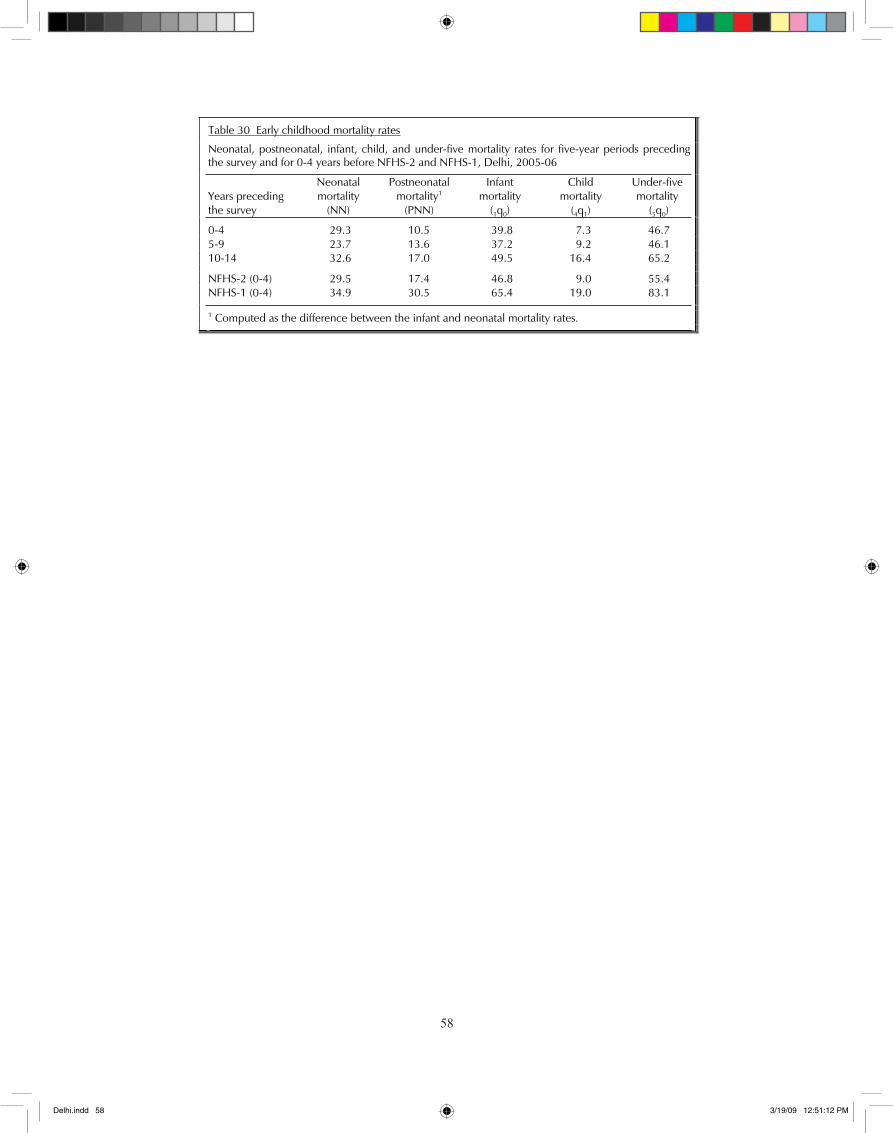
��
58
Table 30 Early childhood mortality rates
Neonatal, postneonatal, infant, child, and under-five mortality rates for five-year periods precedingthe survey and for 0-4 years before NFHS-2 and NFHS-1, Delhi, 2005-06
Years preceding the survey
Neonatalmortality
(NN)
Postneonatal mortality1
(PNN)
Infantmortality
(1q0)
Childmortality
(4q1)
Under-five mortality
(5q0)
0-4 29.3 10.5 39.8 7.3 46.7 5-9 23.7 13.6 37.2 9.2 46.1 10-14 32.6 17.0 49.5 16.4 65.2
NFHS-2 (0-4) 29.5 17.4 46.8 9.0 55.4 NFHS-1 (0-4) 34.9 30.5 65.4 19.0 83.1
1 Computed as the difference between the infant and neonatal mortality rates.
Delhi.indd 58 3/19/09 12:51:12 PM
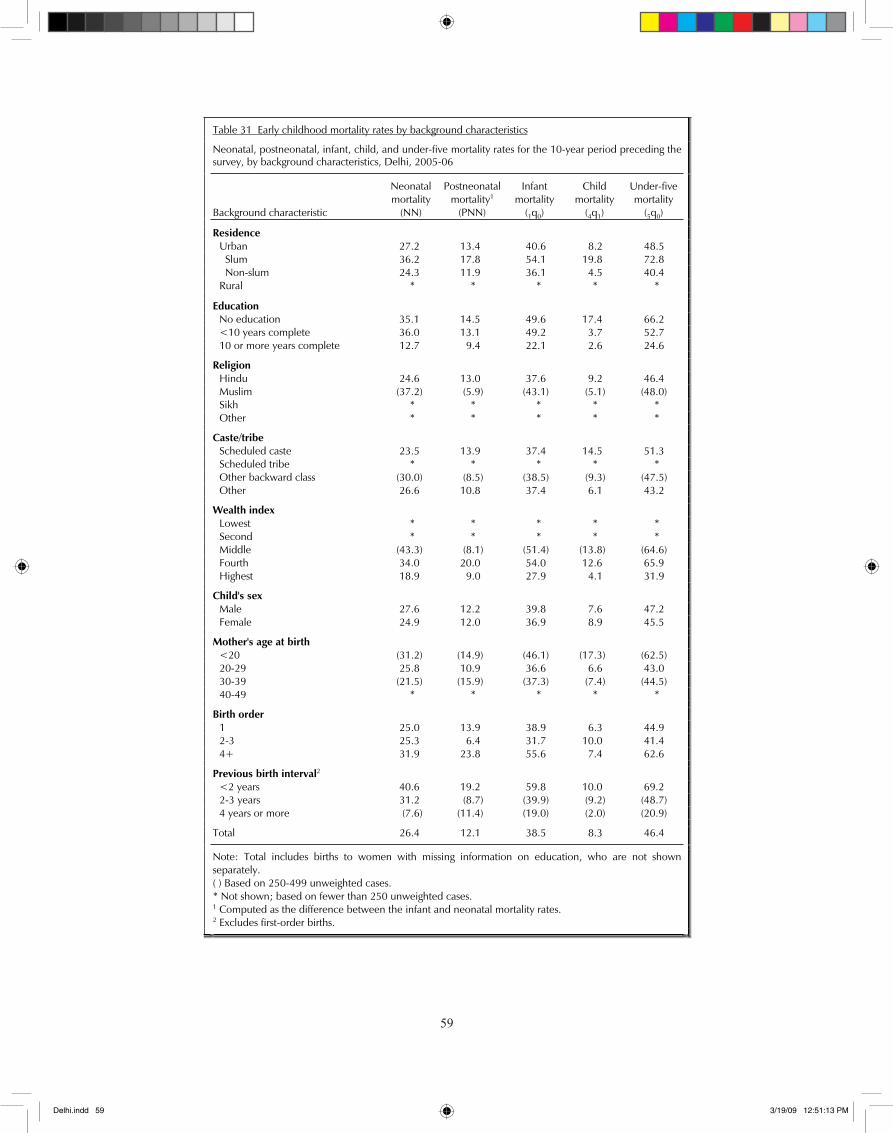
��
59
Table 31 Early childhood mortality rates by background characteristics
Neonatal, postneonatal, infant, child, and under-five mortality rates for the 10-year period preceding the survey, by background characteristics, Delhi, 2005-06
Background characteristic
Neonatal mortality
(NN)
Postneonatal mortality1
(PNN)
Infant mortality
(1q0)
Childmortality
(4q1)
Under-five mortality
(5q0)
Residence Urban 27.2 13.4 40.6 8.2 48.5 Slum 36.2 17.8 54.1 19.8 72.8 Non-slum 24.3 11.9 36.1 4.5 40.4 Rural * * * * *
Education No education 35.1 14.5 49.6 17.4 66.2 <10 years complete 36.0 13.1 49.2 3.7 52.7 10 or more years complete 12.7 9.4 22.1 2.6 24.6
Religion Hindu 24.6 13.0 37.6 9.2 46.4 Muslim (37.2) (5.9) (43.1) (5.1) (48.0) Sikh * * * * * Other * * * * *
Caste/tribe Scheduled caste 23.5 13.9 37.4 14.5 51.3 Scheduled tribe * * * * * Other backward class (30.0) (8.5) (38.5) (9.3) (47.5) Other 26.6 10.8 37.4 6.1 43.2
Wealth index Lowest * * * * * Second * * * * * Middle (43.3) (8.1) (51.4) (13.8) (64.6) Fourth 34.0 20.0 54.0 12.6 65.9 Highest 18.9 9.0 27.9 4.1 31.9
Child's sex Male 27.6 12.2 39.8 7.6 47.2 Female 24.9 12.0 36.9 8.9 45.5
Mother's age at birth <20 (31.2) (14.9) (46.1) (17.3) (62.5) 20-29 25.8 10.9 36.6 6.6 43.0 30-39 (21.5) (15.9) (37.3) (7.4) (44.5) 40-49 * * * * *
Birth order 1 25.0 13.9 38.9 6.3 44.9 2-3 25.3 6.4 31.7 10.0 41.4 4+ 31.9 23.8 55.6 7.4 62.6
Previous birth interval2 <2 years 40.6 19.2 59.8 10.0 69.2 2-3 years 31.2 (8.7) (39.9) (9.2) (48.7) 4 years or more (7.6) (11.4) (19.0) (2.0) (20.9)
Total 26.4 12.1 38.5 8.3 46.4
Note: Total includes births to women with missing information on education, who are not shown separately. ( ) Based on 250-499 unweighted cases. * Not shown; based on fewer than 250 unweighted cases. 1 Computed as the difference between the infant and neonatal mortality rates. 2 Excludes first-order births.
Delhi.indd 59 3/19/09 12:51:13 PM
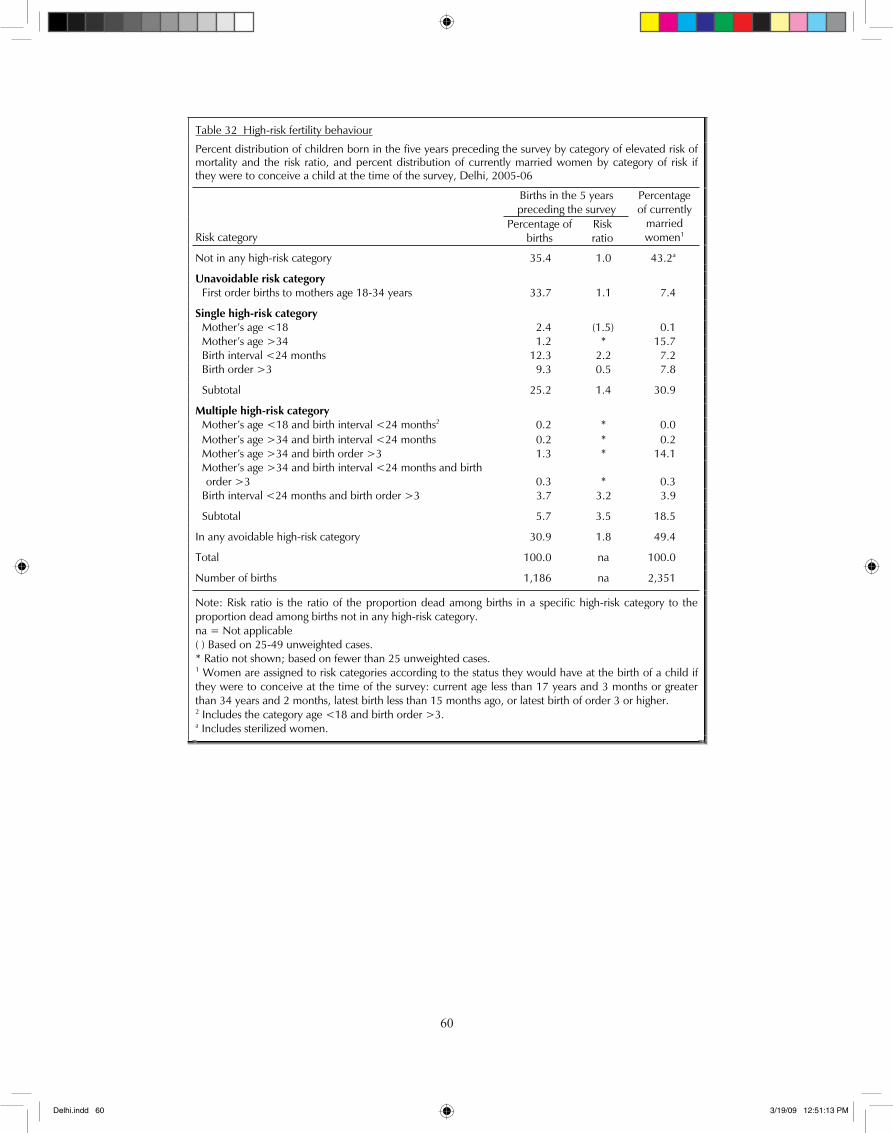
�0
60
Table 32 High-risk fertility behaviour
Percent distribution of children born in the five years preceding the survey by category of elevated risk of mortality and the risk ratio, and percent distribution of currently married women by category of risk if they were to conceive a child at the time of the survey, Delhi, 2005-06
Births in the 5 years preceding the survey
Risk category Percentage of
birthsRisk ratio
Percentage of currently
married women1
Not in any high-risk category 35.4 1.0 43.2a
Unavoidable risk category First order births to mothers age 18-34 years 33.7 1.1 7.4
Single high-risk category Mother’s age <18 2.4 (1.5) 0.1 Mother’s age >34 1.2 * 15.7 Birth interval <24 months 12.3 2.2 7.2 Birth order >3 9.3 0.5 7.8
Subtotal 25.2 1.4 30.9
Multiple high-risk category Mother’s age <18 and birth interval <24 months2 0.2 * 0.0 Mother’s age >34 and birth interval <24 months 0.2 * 0.2 Mother’s age >34 and birth order >3 1.3 * 14.1
Mother’s age >34 and birth interval <24 months and birth order >3 0.3 * 0.3
Birth interval <24 months and birth order >3 3.7 3.2 3.9
Subtotal 5.7 3.5 18.5
In any avoidable high-risk category 30.9 1.8 49.4
Total 100.0 na 100.0
Number of births 1,186 na 2,351
Note: Risk ratio is the ratio of the proportion dead among births in a specific high-risk category to the proportion dead among births not in any high-risk category. na = Not applicable ( ) Based on 25-49 unweighted cases. * Ratio not shown; based on fewer than 25 unweighted cases. 1 Women are assigned to risk categories according to the status they would have at the birth of a child if they were to conceive at the time of the survey: current age less than 17 years and 3 months or greater than 34 years and 2 months, latest birth less than 15 months ago, or latest birth of order 3 or higher. 2 Includes the category age <18 and birth order >3. a Includes sterilized women.
Delhi.indd 60 3/19/09 12:51:13 PM
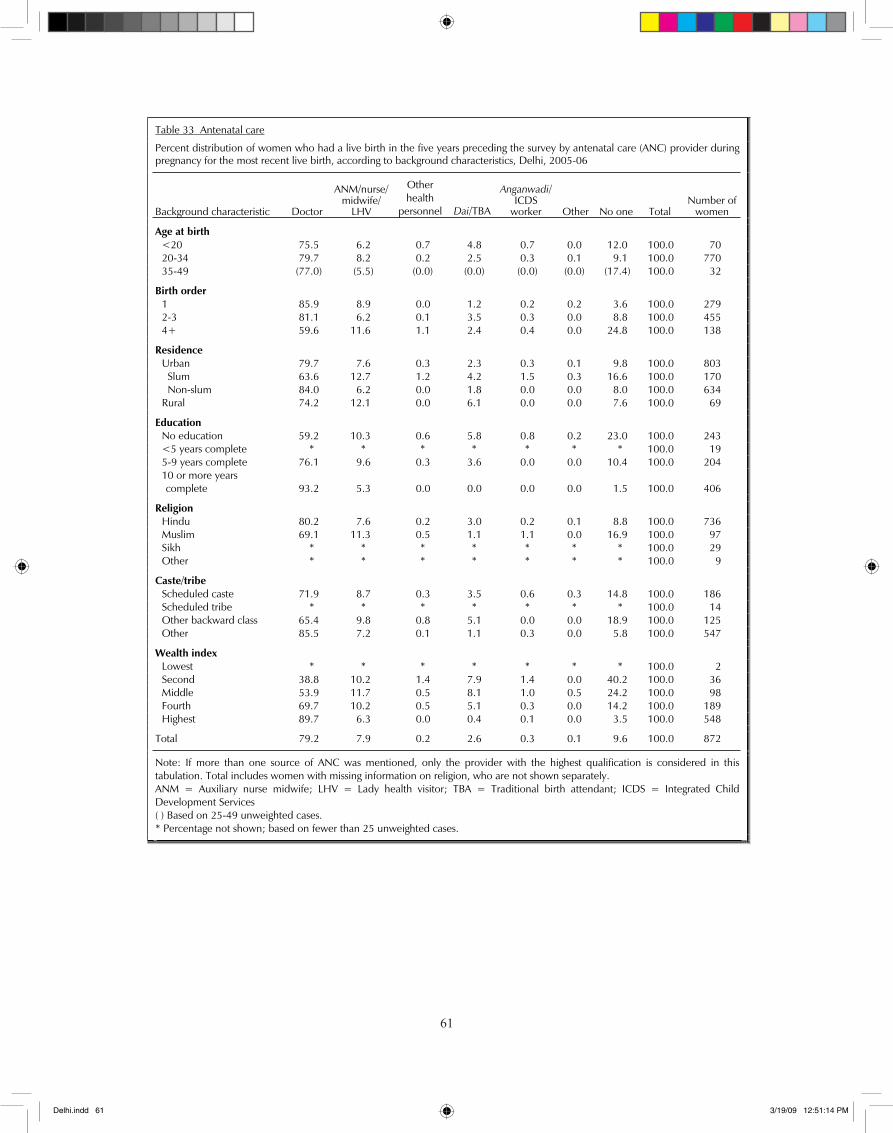
��
61
Table 33 Antenatal care
Percent distribution of women who had a live birth in the five years preceding the survey by antenatal care (ANC) provider during pregnancy for the most recent live birth, according to background characteristics, Delhi, 2005-06
Background characteristic Doctor
ANM/nurse/ midwife/
LHV
Otherhealth
personnel Dai/TBA
Anganwadi/ICDS
worker Other No one Total Number of
women
Age at birth <20 75.5 6.2 0.7 4.8 0.7 0.0 12.0 100.0 70 20-34 79.7 8.2 0.2 2.5 0.3 0.1 9.1 100.0 770 35-49 (77.0) (5.5) (0.0) (0.0) (0.0) (0.0) (17.4) 100.0 32
Birth order 1 85.9 8.9 0.0 1.2 0.2 0.2 3.6 100.0 279 2-3 81.1 6.2 0.1 3.5 0.3 0.0 8.8 100.0 455 4+ 59.6 11.6 1.1 2.4 0.4 0.0 24.8 100.0 138
Residence Urban 79.7 7.6 0.3 2.3 0.3 0.1 9.8 100.0 803 Slum 63.6 12.7 1.2 4.2 1.5 0.3 16.6 100.0 170 Non-slum 84.0 6.2 0.0 1.8 0.0 0.0 8.0 100.0 634 Rural 74.2 12.1 0.0 6.1 0.0 0.0 7.6 100.0 69
Education No education 59.2 10.3 0.6 5.8 0.8 0.2 23.0 100.0 243 <5 years complete * * * * * * * 100.0 19 5-9 years complete 76.1 9.6 0.3 3.6 0.0 0.0 10.4 100.0 204
10 or more years complete 93.2 5.3 0.0 0.0 0.0 0.0 1.5 100.0 406
Religion Hindu 80.2 7.6 0.2 3.0 0.2 0.1 8.8 100.0 736 Muslim 69.1 11.3 0.5 1.1 1.1 0.0 16.9 100.0 97 Sikh * * * * * * * 100.0 29 Other * * * * * * * 100.0 9
Caste/tribe Scheduled caste 71.9 8.7 0.3 3.5 0.6 0.3 14.8 100.0 186 Scheduled tribe * * * * * * * 100.0 14 Other backward class 65.4 9.8 0.8 5.1 0.0 0.0 18.9 100.0 125 Other 85.5 7.2 0.1 1.1 0.3 0.0 5.8 100.0 547
Wealth index Lowest * * * * * * * 100.0 2 Second 38.8 10.2 1.4 7.9 1.4 0.0 40.2 100.0 36 Middle 53.9 11.7 0.5 8.1 1.0 0.5 24.2 100.0 98 Fourth 69.7 10.2 0.5 5.1 0.3 0.0 14.2 100.0 189 Highest 89.7 6.3 0.0 0.4 0.1 0.0 3.5 100.0 548
Total 79.2 7.9 0.2 2.6 0.3 0.1 9.6 100.0 872
Note: If more than one source of ANC was mentioned, only the provider with the highest qualification is considered in this tabulation. Total includes women with missing information on religion, who are not shown separately. ANM = Auxiliary nurse midwife; LHV = Lady health visitor; TBA = Traditional birth attendant; ICDS = Integrated Child Development Services ( ) Based on 25-49 unweighted cases. * Percentage not shown; based on fewer than 25 unweighted cases.
Delhi.indd 61 3/19/09 12:51:14 PM
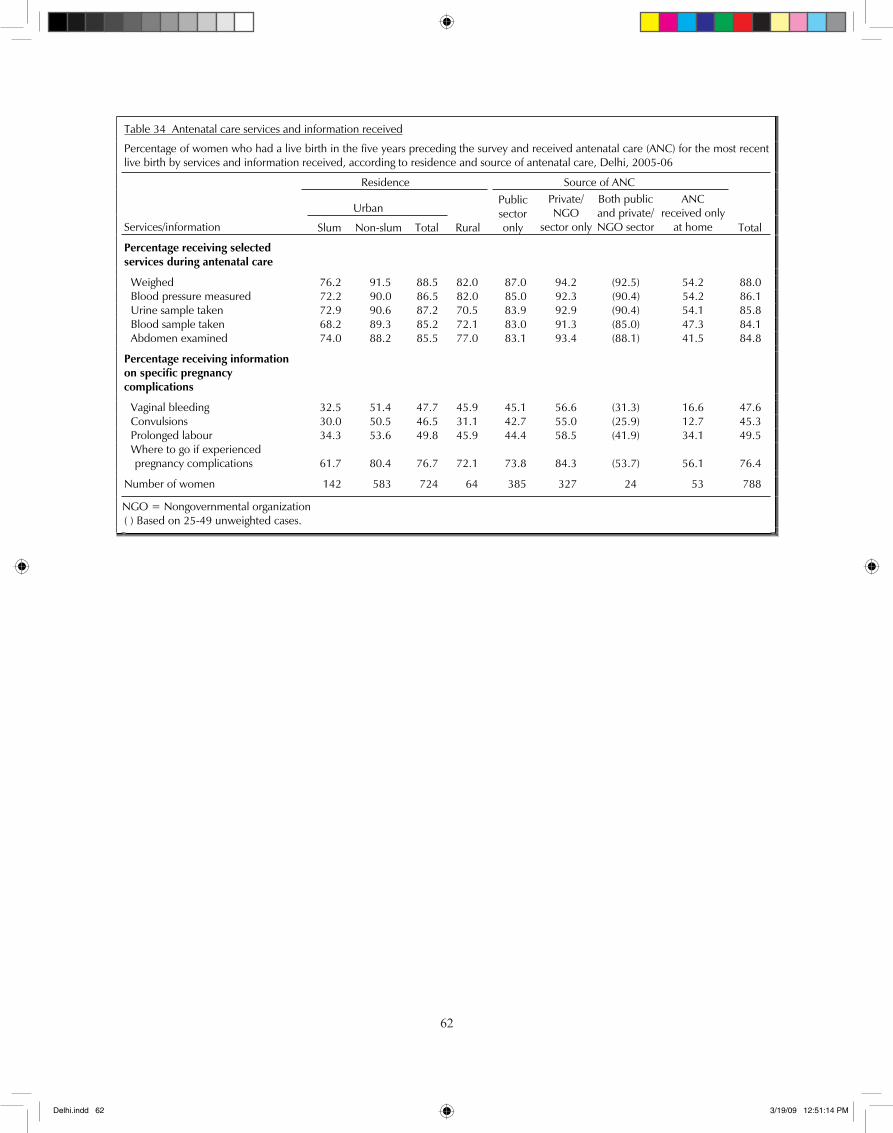
��
62
Table 34 Antenatal care services and information received
Percentage of women who had a live birth in the five years preceding the survey and received antenatal care (ANC) for the most recent live birth by services and information received, according to residence and source of antenatal care, Delhi, 2005-06
Residence Source of ANC
Urban
Services/information Slum Non-slum Total Rural
Publicsector only
Private/NGO
sector only
Both public and private/ NGO sector
ANCreceived only
at home Total
Percentage receiving selected services during antenatal care
Weighed 76.2 91.5 88.5 82.0 87.0 94.2 (92.5) 54.2 88.0 Blood pressure measured 72.2 90.0 86.5 82.0 85.0 92.3 (90.4) 54.2 86.1 Urine sample taken 72.9 90.6 87.2 70.5 83.9 92.9 (90.4) 54.1 85.8 Blood sample taken 68.2 89.3 85.2 72.1 83.0 91.3 (85.0) 47.3 84.1 Abdomen examined 74.0 88.2 85.5 77.0 83.1 93.4 (88.1) 41.5 84.8
Percentage receiving information on specific pregnancy complications
Vaginal bleeding 32.5 51.4 47.7 45.9 45.1 56.6 (31.3) 16.6 47.6 Convulsions 30.0 50.5 46.5 31.1 42.7 55.0 (25.9) 12.7 45.3 Prolonged labour 34.3 53.6 49.8 45.9 44.4 58.5 (41.9) 34.1 49.5
Where to go if experienced pregnancy complications 61.7 80.4 76.7 72.1 73.8 84.3 (53.7) 56.1 76.4
Number of women 142 583 724 64 385 327 24 53 788
NGO = Nongovernmental organization ( ) Based on 25-49 unweighted cases.
Delhi.indd 62 3/19/09 12:51:14 PM
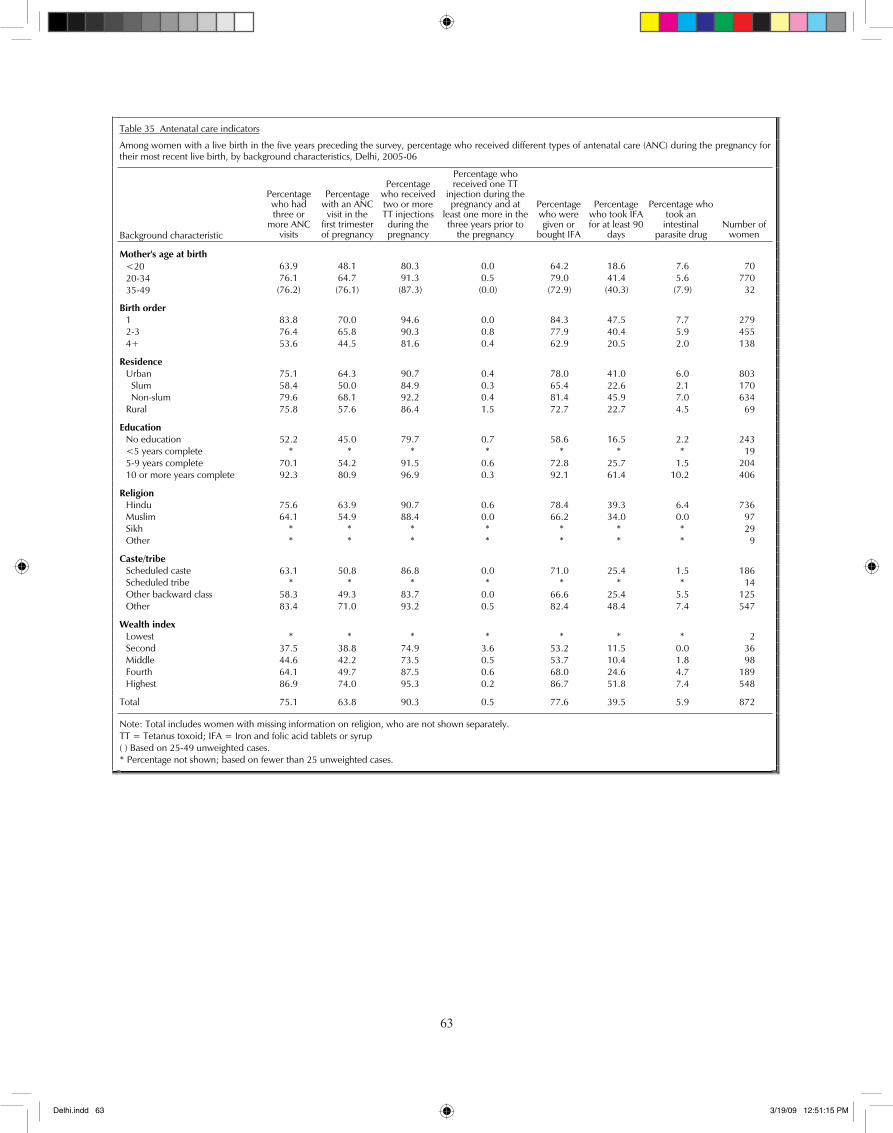
��
63
Table 35 Antenatal care indicators
Among women with a live birth in the five years preceding the survey, percentage who received different types of antenatal care (ANC) during the pregnancy for their most recent live birth, by background characteristics, Delhi, 2005-06
Background characteristic
Percentagewho had three or
more ANC visits
Percentagewith an ANC
visit in the first trimester of pregnancy
Percentagewho received two or more TT injections during the pregnancy
Percentage who received one TT
injection during the pregnancy and at
least one more in the three years prior to
the pregnancy
Percentagewho were given or
bought IFA
Percentagewho took IFA for at least 90
days
Percentage who took an
intestinalparasite drug
Number of women
Mother's age at birth <20 63.9 48.1 80.3 0.0 64.2 18.6 7.6 70 20-34 76.1 64.7 91.3 0.5 79.0 41.4 5.6 770 35-49 (76.2) (76.1) (87.3) (0.0) (72.9) (40.3) (7.9) 32
Birth order 1 83.8 70.0 94.6 0.0 84.3 47.5 7.7 279 2-3 76.4 65.8 90.3 0.8 77.9 40.4 5.9 455 4+ 53.6 44.5 81.6 0.4 62.9 20.5 2.0 138
Residence Urban 75.1 64.3 90.7 0.4 78.0 41.0 6.0 803 Slum 58.4 50.0 84.9 0.3 65.4 22.6 2.1 170 Non-slum 79.6 68.1 92.2 0.4 81.4 45.9 7.0 634 Rural 75.8 57.6 86.4 1.5 72.7 22.7 4.5 69
Education No education 52.2 45.0 79.7 0.7 58.6 16.5 2.2 243 <5 years complete * * * * * * * 19 5-9 years complete 70.1 54.2 91.5 0.6 72.8 25.7 1.5 204 10 or more years complete 92.3 80.9 96.9 0.3 92.1 61.4 10.2 406
Religion Hindu 75.6 63.9 90.7 0.6 78.4 39.3 6.4 736 Muslim 64.1 54.9 88.4 0.0 66.2 34.0 0.0 97 Sikh * * * * * * * 29 Other * * * * * * * 9
Caste/tribe Scheduled caste 63.1 50.8 86.8 0.0 71.0 25.4 1.5 186 Scheduled tribe * * * * * * * 14 Other backward class 58.3 49.3 83.7 0.0 66.6 25.4 5.5 125 Other 83.4 71.0 93.2 0.5 82.4 48.4 7.4 547
Wealth index Lowest * * * * * * * 2 Second 37.5 38.8 74.9 3.6 53.2 11.5 0.0 36 Middle 44.6 42.2 73.5 0.5 53.7 10.4 1.8 98 Fourth 64.1 49.7 87.5 0.6 68.0 24.6 4.7 189 Highest 86.9 74.0 95.3 0.2 86.7 51.8 7.4 548
Total 75.1 63.8 90.3 0.5 77.6 39.5 5.9 872
Note: Total includes women with missing information on religion, who are not shown separately. TT = Tetanus toxoid; IFA = Iron and folic acid tablets or syrup ( ) Based on 25-49 unweighted cases. * Percentage not shown; based on fewer than 25 unweighted cases.
Delhi.indd 63 3/19/09 12:51:15 PM
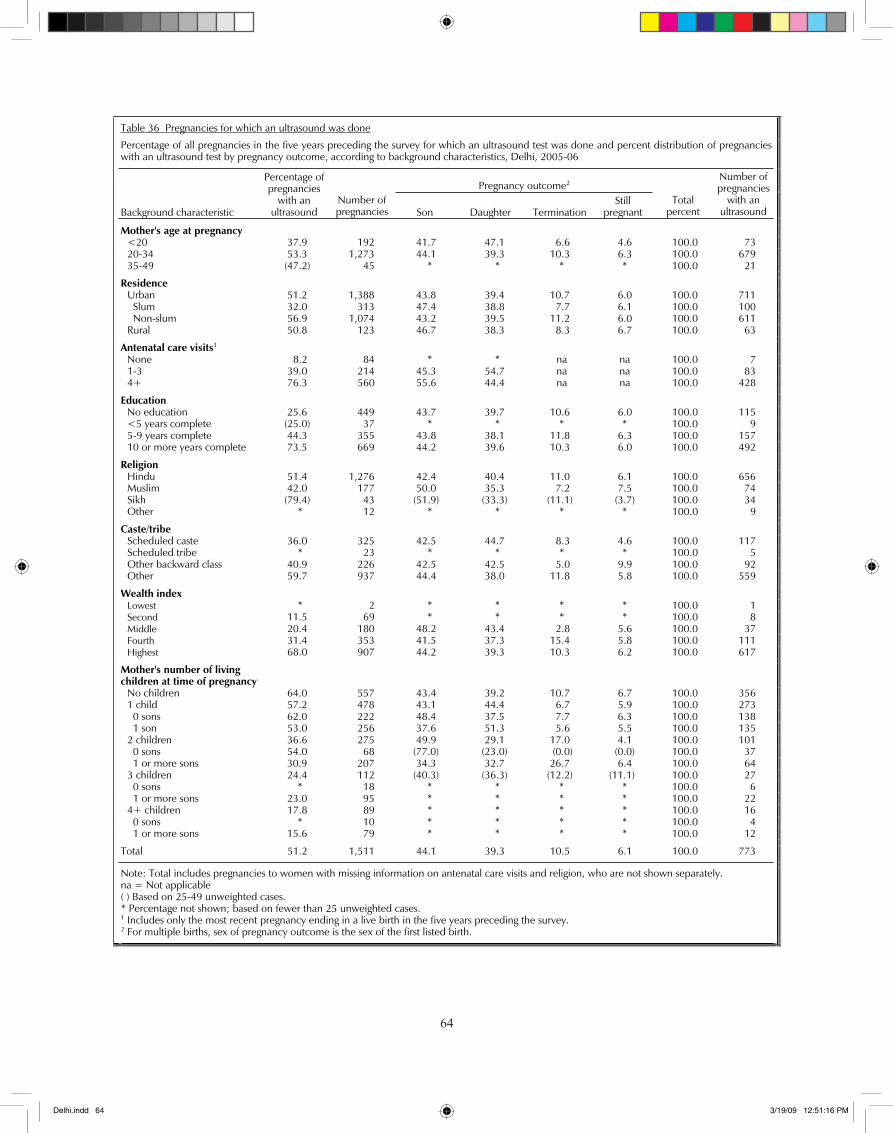
��
64
Table 36 Pregnancies for which an ultrasound was done
Percentage of all pregnancies in the five years preceding the survey for which an ultrasound test was done and percent distribution of pregnancies with an ultrasound test by pregnancy outcome, according to background characteristics, Delhi, 2005-06
Pregnancy outcome2
Background characteristic
Percentage of pregnancies
with an ultrasound
Number of pregnancies Son Daughter Termination
Still pregnant
Total percent
Number of pregnancies
with an ultrasound
Mother's age at pregnancy <20 37.9 192 41.7 47.1 6.6 4.6 100.0 73 20-34 53.3 1,273 44.1 39.3 10.3 6.3 100.0 679 35-49 (47.2) 45 * * * * 100.0 21
Residence Urban 51.2 1,388 43.8 39.4 10.7 6.0 100.0 711 Slum 32.0 313 47.4 38.8 7.7 6.1 100.0 100 Non-slum 56.9 1,074 43.2 39.5 11.2 6.0 100.0 611 Rural 50.8 123 46.7 38.3 8.3 6.7 100.0 63
Antenatal care visits1 None 8.2 84 * * na na 100.0 7 1-3 39.0 214 45.3 54.7 na na 100.0 83 4+ 76.3 560 55.6 44.4 na na 100.0 428
Education No education 25.6 449 43.7 39.7 10.6 6.0 100.0 115 <5 years complete (25.0) 37 * * * * 100.0 9 5-9 years complete 44.3 355 43.8 38.1 11.8 6.3 100.0 157 10 or more years complete 73.5 669 44.2 39.6 10.3 6.0 100.0 492
Religion Hindu 51.4 1,276 42.4 40.4 11.0 6.1 100.0 656 Muslim 42.0 177 50.0 35.3 7.2 7.5 100.0 74 Sikh (79.4) 43 (51.9) (33.3) (11.1) (3.7) 100.0 34 Other * 12 * * * * 100.0 9
Caste/tribe Scheduled caste 36.0 325 42.5 44.7 8.3 4.6 100.0 117 Scheduled tribe * 23 * * * * 100.0 5 Other backward class 40.9 226 42.5 42.5 5.0 9.9 100.0 92 Other 59.7 937 44.4 38.0 11.8 5.8 100.0 559
Wealth index Lowest * 2 * * * * 100.0 1 Second 11.5 69 * * * * 100.0 8 Middle 20.4 180 48.2 43.4 2.8 5.6 100.0 37 Fourth 31.4 353 41.5 37.3 15.4 5.8 100.0 111 Highest 68.0 907 44.2 39.3 10.3 6.2 100.0 617
Mother's number of living children at time of pregnancy
No children 64.0 557 43.4 39.2 10.7 6.7 100.0 356 1 child 57.2 478 43.1 44.4 6.7 5.9 100.0 273 0 sons 62.0 222 48.4 37.5 7.7 6.3 100.0 138 1 son 53.0 256 37.6 51.3 5.6 5.5 100.0 135 2 children 36.6 275 49.9 29.1 17.0 4.1 100.0 101 0 sons 54.0 68 (77.0) (23.0) (0.0) (0.0) 100.0 37 1 or more sons 30.9 207 34.3 32.7 26.7 6.4 100.0 64 3 children 24.4 112 (40.3) (36.3) (12.2) (11.1) 100.0 27 0 sons * 18 * * * * 100.0 6 1 or more sons 23.0 95 * * * * 100.0 22 4+ children 17.8 89 * * * * 100.0 16 0 sons * 10 * * * * 100.0 4 1 or more sons 15.6 79 * * * * 100.0 12
Total 51.2 1,511 44.1 39.3 10.5 6.1 100.0 773
Note: Total includes pregnancies to women with missing information on antenatal care visits and religion, who are not shown separately. na = Not applicable ( ) Based on 25-49 unweighted cases. * Percentage not shown; based on fewer than 25 unweighted cases. 1 Includes only the most recent pregnancy ending in a live birth in the five years preceding the survey. 2 For multiple births, sex of pregnancy outcome is the sex of the first listed birth.
Delhi.indd 64 3/19/09 12:51:16 PM
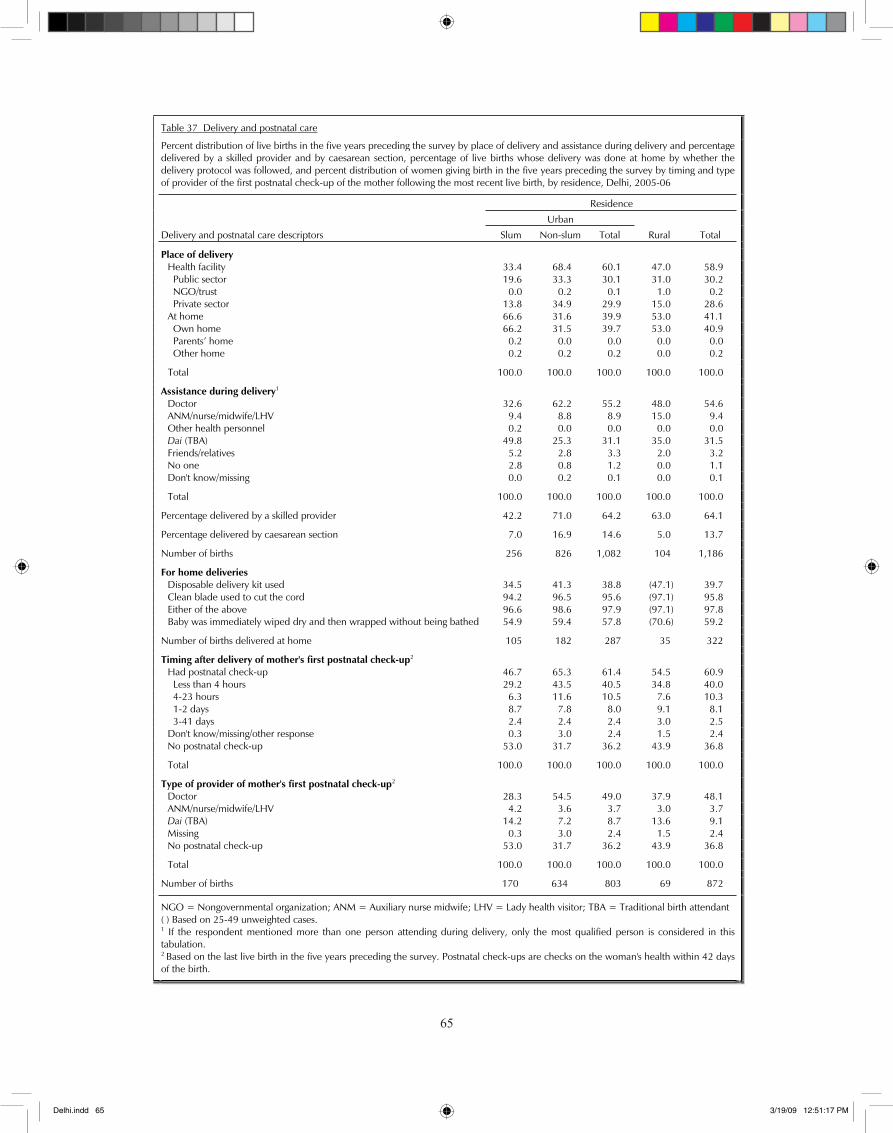
��
65
Table 37 Delivery and postnatal care
Percent distribution of live births in the five years preceding the survey by place of delivery and assistance during delivery and percentagedelivered by a skilled provider and by caesarean section, percentage of live births whose delivery was done at home by whether the delivery protocol was followed, and percent distribution of women giving birth in the five years preceding the survey by timing and typeof provider of the first postnatal check-up of the mother following the most recent live birth, by residence, Delhi, 2005-06
Residence
Urban
Delivery and postnatal care descriptors Slum Non-slum Total Rural Total
Place of delivery Health facility 33.4 68.4 60.1 47.0 58.9 Public sector 19.6 33.3 30.1 31.0 30.2 NGO/trust 0.0 0.2 0.1 1.0 0.2 Private sector 13.8 34.9 29.9 15.0 28.6 At home 66.6 31.6 39.9 53.0 41.1 Own home 66.2 31.5 39.7 53.0 40.9 Parents’ home 0.2 0.0 0.0 0.0 0.0 Other home 0.2 0.2 0.2 0.0 0.2
Total 100.0 100.0 100.0 100.0 100.0
Assistance during delivery1 Doctor 32.6 62.2 55.2 48.0 54.6 ANM/nurse/midwife/LHV 9.4 8.8 8.9 15.0 9.4 Other health personnel 0.2 0.0 0.0 0.0 0.0
Dai (TBA) 49.8 25.3 31.1 35.0 31.5 Friends/relatives 5.2 2.8 3.3 2.0 3.2 No one 2.8 0.8 1.2 0.0 1.1 Don't know/missing 0.0 0.2 0.1 0.0 0.1
Total 100.0 100.0 100.0 100.0 100.0
Percentage delivered by a skilled provider 42.2 71.0 64.2 63.0 64.1
Percentage delivered by caesarean section 7.0 16.9 14.6 5.0 13.7
Number of births 256 826 1,082 104 1,186
For home deliveries Disposable delivery kit used 34.5 41.3 38.8 (47.1) 39.7 Clean blade used to cut the cord 94.2 96.5 95.6 (97.1) 95.8 Either of the above 96.6 98.6 97.9 (97.1) 97.8 Baby was immediately wiped dry and then wrapped without being bathed 54.9 59.4 57.8 (70.6) 59.2
Number of births delivered at home 105 182 287 35 322
Timing after delivery of mother's first postnatal check-up2 Had postnatal check-up 46.7 65.3 61.4 54.5 60.9 Less than 4 hours 29.2 43.5 40.5 34.8 40.0 4-23 hours 6.3 11.6 10.5 7.6 10.3 1-2 days 8.7 7.8 8.0 9.1 8.1 3-41 days 2.4 2.4 2.4 3.0 2.5 Don't know/missing/other response 0.3 3.0 2.4 1.5 2.4 No postnatal check-up 53.0 31.7 36.2 43.9 36.8
Total 100.0 100.0 100.0 100.0 100.0
Type of provider of mother's first postnatal check-up2 Doctor 28.3 54.5 49.0 37.9 48.1 ANM/nurse/midwife/LHV 4.2 3.6 3.7 3.0 3.7
Dai (TBA) 14.2 7.2 8.7 13.6 9.1 Missing 0.3 3.0 2.4 1.5 2.4 No postnatal check-up 53.0 31.7 36.2 43.9 36.8
Total 100.0 100.0 100.0 100.0 100.0
Number of births 170 634 803 69 872
NGO = Nongovernmental organization; ANM = Auxiliary nurse midwife; LHV = Lady health visitor; TBA = Traditional birth attendant( ) Based on 25-49 unweighted cases. 1 If the respondent mentioned more than one person attending during delivery, only the most qualified person is considered in thistabulation.2 Based on the last live birth in the five years preceding the survey. Postnatal check-ups are checks on the woman's health within 42 daysof the birth.
Delhi.indd 65 3/19/09 12:51:17 PM
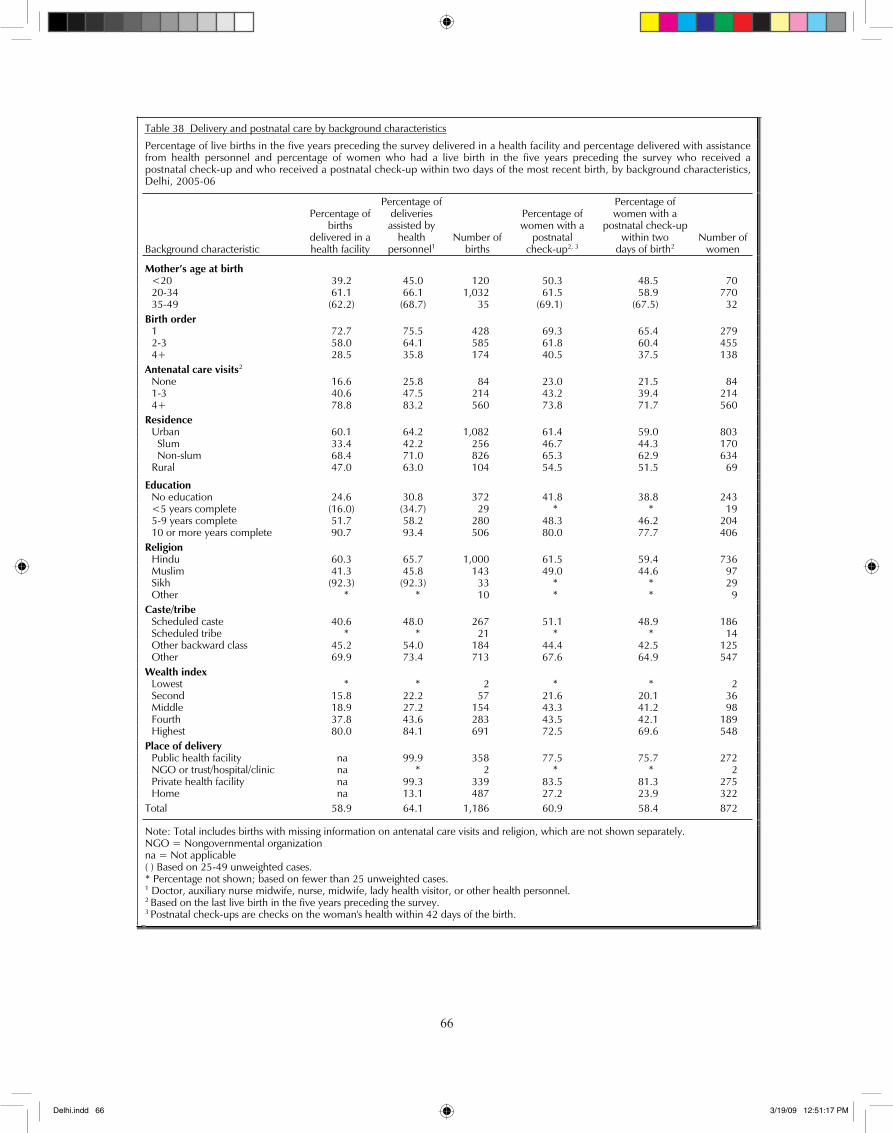
��
66
Table 38 Delivery and postnatal care by background characteristics
Percentage of live births in the five years preceding the survey delivered in a health facility and percentage delivered with assistance from health personnel and percentage of women who had a live birth in the five years preceding the survey who received a postnatal check-up and who received a postnatal check-up within two days of the most recent birth, by background characteristics,Delhi, 2005-06
Background characteristic
Percentage of births
delivered in a health facility
Percentage of deliveries assisted by
health personnel1
Number of births
Percentage of women with a
postnatal check-up2, 3
Percentage of women with a
postnatal check-up within two
days of birth2Number of
women
Mother’s age at birth <20 39.2 45.0 120 50.3 48.5 70 20-34 61.1 66.1 1,032 61.5 58.9 770 35-49 (62.2) (68.7) 35 (69.1) (67.5) 32
Birth order 1 72.7 75.5 428 69.3 65.4 279 2-3 58.0 64.1 585 61.8 60.4 455 4+ 28.5 35.8 174 40.5 37.5 138
Antenatal care visits2 None 16.6 25.8 84 23.0 21.5 84 1-3 40.6 47.5 214 43.2 39.4 214 4+ 78.8 83.2 560 73.8 71.7 560
Residence Urban 60.1 64.2 1,082 61.4 59.0 803 Slum 33.4 42.2 256 46.7 44.3 170 Non-slum 68.4 71.0 826 65.3 62.9 634 Rural 47.0 63.0 104 54.5 51.5 69
Education No education 24.6 30.8 372 41.8 38.8 243 <5 years complete (16.0) (34.7) 29 * * 19 5-9 years complete 51.7 58.2 280 48.3 46.2 204 10 or more years complete 90.7 93.4 506 80.0 77.7 406
Religion Hindu 60.3 65.7 1,000 61.5 59.4 736 Muslim 41.3 45.8 143 49.0 44.6 97 Sikh (92.3) (92.3) 33 * * 29 Other * * 10 * * 9
Caste/tribe Scheduled caste 40.6 48.0 267 51.1 48.9 186 Scheduled tribe * * 21 * * 14 Other backward class 45.2 54.0 184 44.4 42.5 125 Other 69.9 73.4 713 67.6 64.9 547
Wealth index Lowest * * 2 * * 2 Second 15.8 22.2 57 21.6 20.1 36 Middle 18.9 27.2 154 43.3 41.2 98 Fourth 37.8 43.6 283 43.5 42.1 189 Highest 80.0 84.1 691 72.5 69.6 548
Place of delivery Public health facility na 99.9 358 77.5 75.7 272 NGO or trust/hospital/clinic na * 2 * * 2 Private health facility na 99.3 339 83.5 81.3 275 Home na 13.1 487 27.2 23.9 322
Total 58.9 64.1 1,186 60.9 58.4 872
Note: Total includes births with missing information on antenatal care visits and religion, which are not shown separately. NGO = Nongovernmental organization na = Not applicable ( ) Based on 25-49 unweighted cases. * Percentage not shown; based on fewer than 25 unweighted cases. 1 Doctor, auxiliary nurse midwife, nurse, midwife, lady health visitor, or other health personnel. 2 Based on the last live birth in the five years preceding the survey. 3 Postnatal check-ups are checks on the woman's health within 42 days of the birth.
Delhi.indd 66 3/19/09 12:51:17 PM
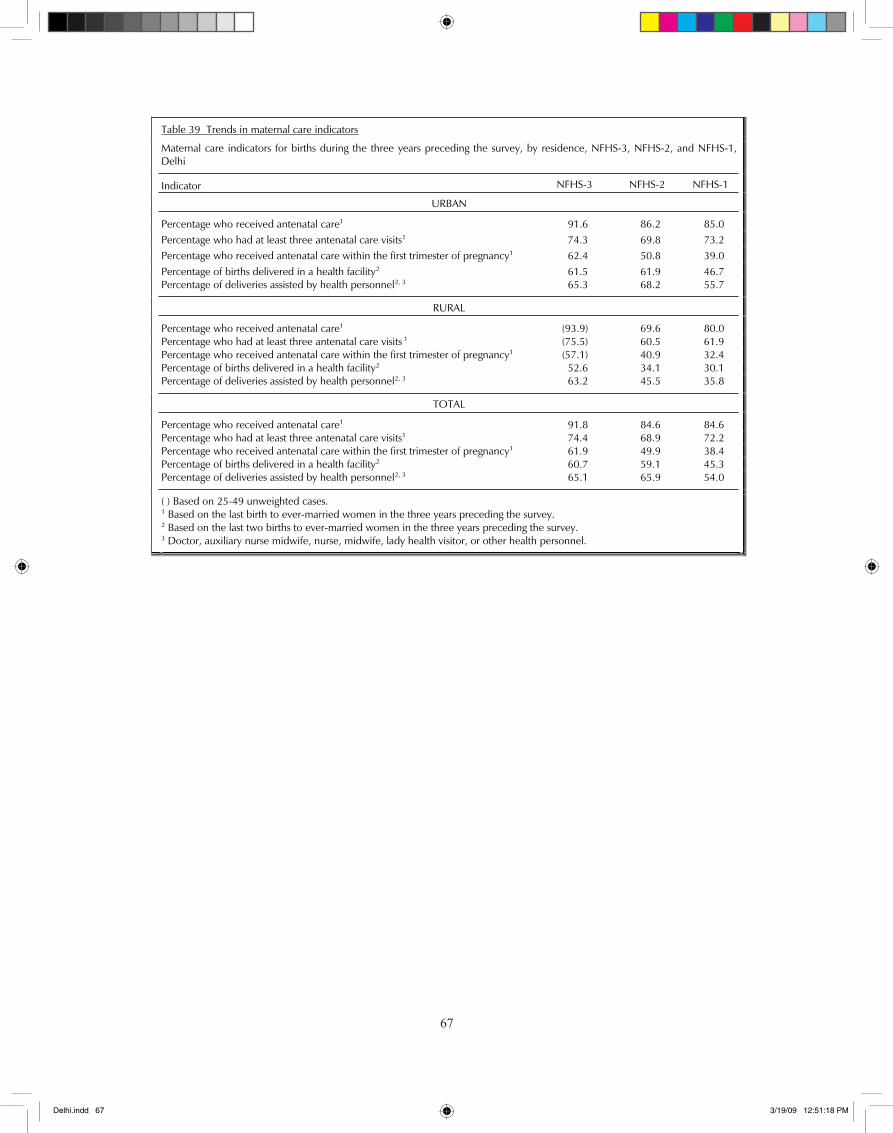
��
67
Table 39 Trends in maternal care indicators
Maternal care indicators for births during the three years preceding the survey, by residence, NFHS-3, NFHS-2, and NFHS-1, Delhi
Indicator NFHS-3 NFHS-2 NFHS-1
URBAN
Percentage who received antenatal care1 91.6 86.2 85.0 Percentage who had at least three antenatal care visits1 74.3 69.8 73.2 Percentage who received antenatal care within the first trimester of pregnancy1 62.4 50.8 39.0 Percentage of births delivered in a health facility2 61.5 61.9 46.7 Percentage of deliveries assisted by health personnel2, 3 65.3 68.2 55.7
RURAL
Percentage who received antenatal care1 (93.9) 69.6 80.0 Percentage who had at least three antenatal care visits 1 (75.5) 60.5 61.9 Percentage who received antenatal care within the first trimester of pregnancy1 (57.1) 40.9 32.4 Percentage of births delivered in a health facility2 52.6 34.1 30.1 Percentage of deliveries assisted by health personnel2, 3 63.2 45.5 35.8
TOTAL
Percentage who received antenatal care1 91.8 84.6 84.6 Percentage who had at least three antenatal care visits1 74.4 68.9 72.2 Percentage who received antenatal care within the first trimester of pregnancy1 61.9 49.9 38.4 Percentage of births delivered in a health facility2 60.7 59.1 45.3 Percentage of deliveries assisted by health personnel2, 3 65.1 65.9 54.0
( ) Based on 25-49 unweighted cases. 1 Based on the last birth to ever-married women in the three years preceding the survey. 2 Based on the last two births to ever-married women in the three years preceding the survey.3 Doctor, auxiliary nurse midwife, nurse, midwife, lady health visitor, or other health personnel.
Delhi.indd 67 3/19/09 12:51:18 PM
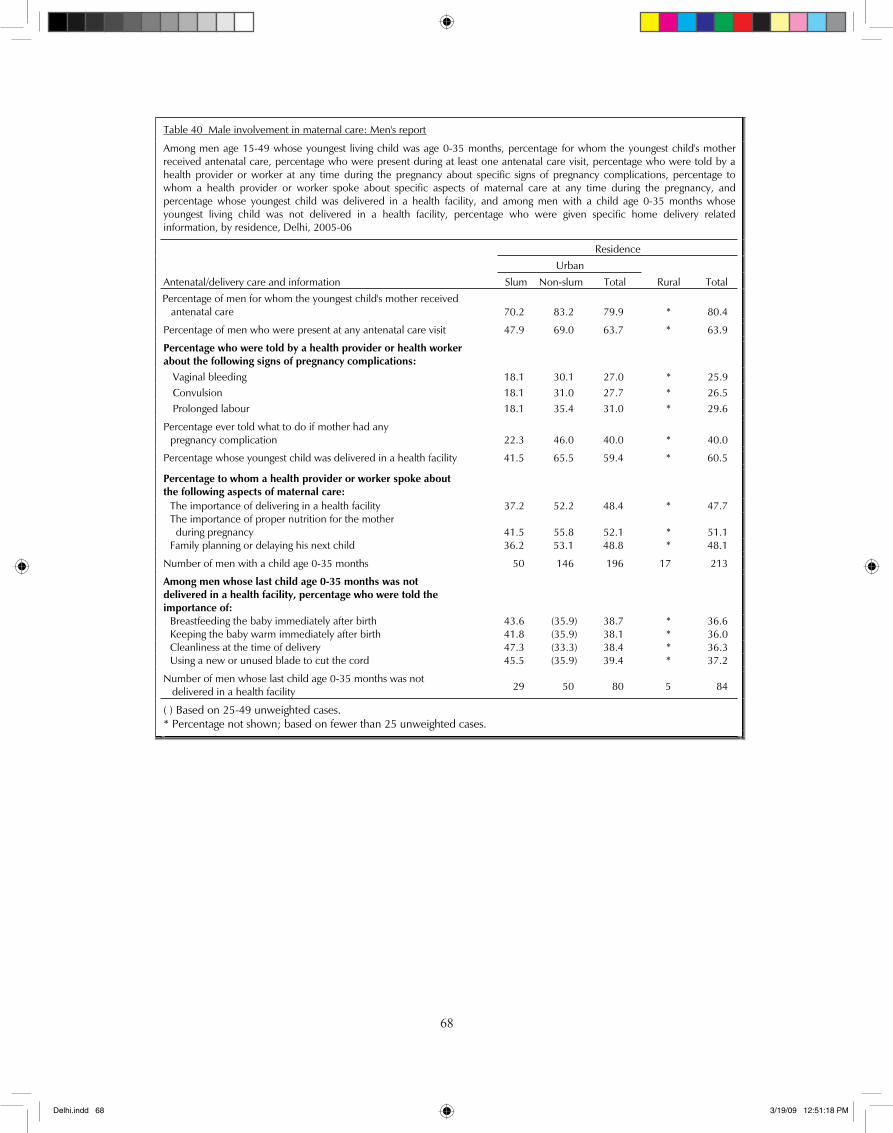
��
68
Table 40 Male involvement in maternal care: Men's report
Among men age 15-49 whose youngest living child was age 0-35 months, percentage for whom the youngest child's mother received antenatal care, percentage who were present during at least one antenatal care visit, percentage who were told by a health provider or worker at any time during the pregnancy about specific signs of pregnancy complications, percentage to whom a health provider or worker spoke about specific aspects of maternal care at any time during the pregnancy, and percentage whose youngest child was delivered in a health facility, and among men with a child age 0-35 months whose youngest living child was not delivered in a health facility, percentage who were given specific home delivery related information, by residence, Delhi, 2005-06
Residence
Urban
Antenatal/delivery care and information Slum Non-slum Total Rural Total
Percentage of men for whom the youngest child's mother received antenatal care 70.2 83.2 79.9 * 80.4
Percentage of men who were present at any antenatal care visit 47.9 69.0 63.7 * 63.9
Percentage who were told by a health provider or health worker about the following signs of pregnancy complications:
Vaginal bleeding 18.1 30.1 27.0 * 25.9 Convulsion 18.1 31.0 27.7 * 26.5 Prolonged labour 18.1 35.4 31.0 * 29.6
Percentage ever told what to do if mother had any pregnancy complication 22.3 46.0 40.0 * 40.0
Percentage whose youngest child was delivered in a health facility 41.5 65.5 59.4 * 60.5
Percentage to whom a health provider or worker spoke about the following aspects of maternal care:
The importance of delivering in a health facility 37.2 52.2 48.4 * 47.7 The importance of proper nutrition for the mother
during pregnancy 41.5 55.8 52.1 * 51.1 Family planning or delaying his next child 36.2 53.1 48.8 * 48.1
Number of men with a child age 0-35 months 50 146 196 17 213
Among men whose last child age 0-35 months was not delivered in a health facility, percentage who were told the importance of:
Breastfeeding the baby immediately after birth 43.6 (35.9) 38.7 * 36.6 Keeping the baby warm immediately after birth 41.8 (35.9) 38.1 * 36.0 Cleanliness at the time of delivery 47.3 (33.3) 38.4 * 36.3 Using a new or unused blade to cut the cord 45.5 (35.9) 39.4 * 37.2
Number of men whose last child age 0-35 months was not delivered in a health facility 29 50 80 5 84
( ) Based on 25-49 unweighted cases. * Percentage not shown; based on fewer than 25 unweighted cases.
Delhi.indd 68 3/19/09 12:51:18 PM
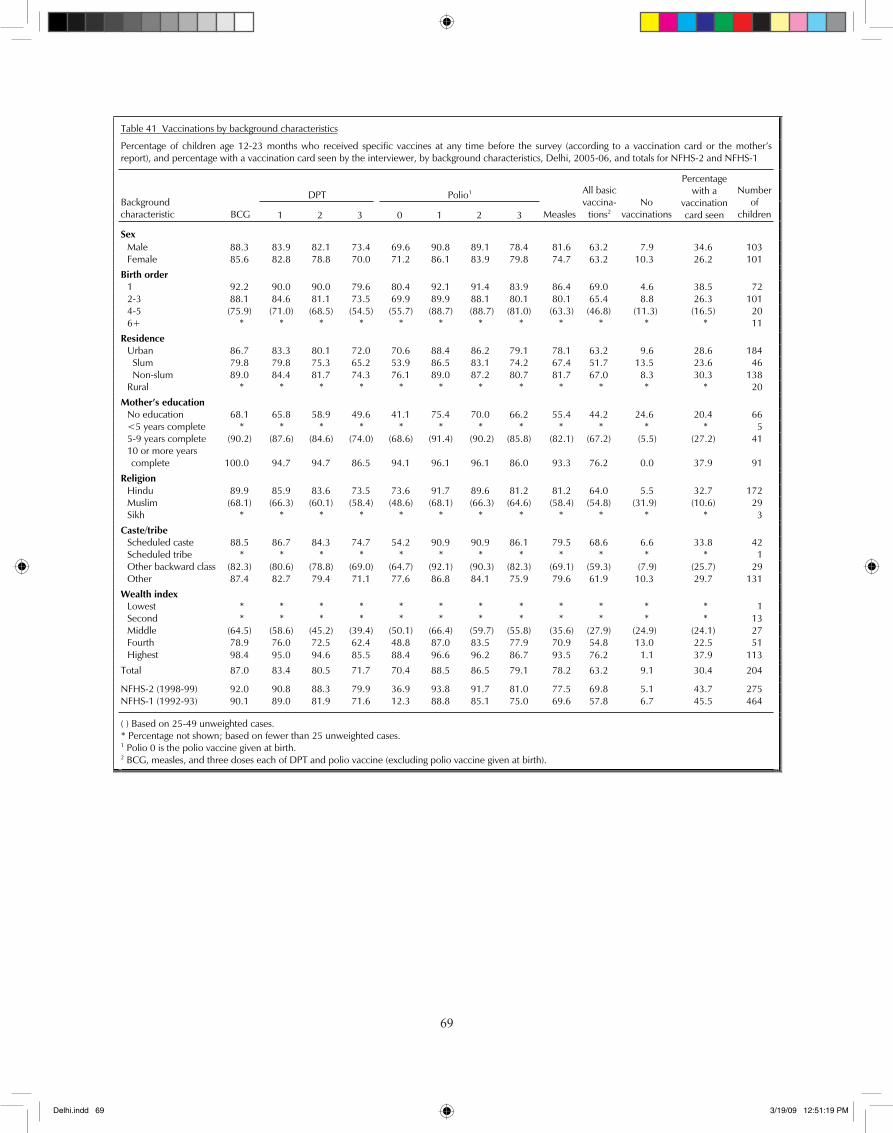
��
69
Table 41 Vaccinations by background characteristics
Percentage of children age 12-23 months who received specific vaccines at any time before the survey (according to a vaccination card or the mother’s report), and percentage with a vaccination card seen by the interviewer, by background characteristics, Delhi, 2005-06, and totals for NFHS-2 and NFHS-1
DPT Polio1
Background characteristic BCG 1 2 3 0 1 2 3 Measles
All basic vaccina-
tions2No
vaccinations
Percentagewith a
vaccinationcard seen
Numberof
children
Sex Male 88.3 83.9 82.1 73.4 69.6 90.8 89.1 78.4 81.6 63.2 7.9 34.6 103 Female 85.6 82.8 78.8 70.0 71.2 86.1 83.9 79.8 74.7 63.2 10.3 26.2 101
Birth order 1 92.2 90.0 90.0 79.6 80.4 92.1 91.4 83.9 86.4 69.0 4.6 38.5 72 2-3 88.1 84.6 81.1 73.5 69.9 89.9 88.1 80.1 80.1 65.4 8.8 26.3 101 4-5 (75.9) (71.0) (68.5) (54.5) (55.7) (88.7) (88.7) (81.0) (63.3) (46.8) (11.3) (16.5) 20 6+ * * * * * * * * * * * * 11
Residence Urban 86.7 83.3 80.1 72.0 70.6 88.4 86.2 79.1 78.1 63.2 9.6 28.6 184 Slum 79.8 79.8 75.3 65.2 53.9 86.5 83.1 74.2 67.4 51.7 13.5 23.6 46 Non-slum 89.0 84.4 81.7 74.3 76.1 89.0 87.2 80.7 81.7 67.0 8.3 30.3 138 Rural * * * * * * * * * * * * 20
Mother’s education No education 68.1 65.8 58.9 49.6 41.1 75.4 70.0 66.2 55.4 44.2 24.6 20.4 66 <5 years complete * * * * * * * * * * * * 5 5-9 years complete (90.2) (87.6) (84.6) (74.0) (68.6) (91.4) (90.2) (85.8) (82.1) (67.2) (5.5) (27.2) 41
10 or more years complete 100.0 94.7 94.7 86.5 94.1 96.1 96.1 86.0 93.3 76.2 0.0 37.9 91
Religion Hindu 89.9 85.9 83.6 73.5 73.6 91.7 89.6 81.2 81.2 64.0 5.5 32.7 172 Muslim (68.1) (66.3) (60.1) (58.4) (48.6) (68.1) (66.3) (64.6) (58.4) (54.8) (31.9) (10.6) 29 Sikh * * * * * * * * * * * * 3
Caste/tribe Scheduled caste 88.5 86.7 84.3 74.7 54.2 90.9 90.9 86.1 79.5 68.6 6.6 33.8 42 Scheduled tribe * * * * * * * * * * * * 1 Other backward class (82.3) (80.6) (78.8) (69.0) (64.7) (92.1) (90.3) (82.3) (69.1) (59.3) (7.9) (25.7) 29 Other 87.4 82.7 79.4 71.1 77.6 86.8 84.1 75.9 79.6 61.9 10.3 29.7 131
Wealth index Lowest * * * * * * * * * * * * 1 Second * * * * * * * * * * * * 13 Middle (64.5) (58.6) (45.2) (39.4) (50.1) (66.4) (59.7) (55.8) (35.6) (27.9) (24.9) (24.1) 27 Fourth 78.9 76.0 72.5 62.4 48.8 87.0 83.5 77.9 70.9 54.8 13.0 22.5 51
Highest 98.4 95.0 94.6 85.5 88.4 96.6 96.2 86.7 93.5 76.2 1.1 37.9 113
Total 87.0 83.4 80.5 71.7 70.4 88.5 86.5 79.1 78.2 63.2 9.1 30.4 204
NFHS-2 (1998-99) 92.0 90.8 88.3 79.9 36.9 93.8 91.7 81.0 77.5 69.8 5.1 43.7 275 NFHS-1 (1992-93) 90.1 89.0 81.9 71.6 12.3 88.8 85.1 75.0 69.6 57.8 6.7 45.5 464
( ) Based on 25-49 unweighted cases. * Percentage not shown; based on fewer than 25 unweighted cases. 1 Polio 0 is the polio vaccine given at birth. 2 BCG, measles, and three doses each of DPT and polio vaccine (excluding polio vaccine given at birth).
Delhi.indd 69 3/19/09 12:51:19 PM
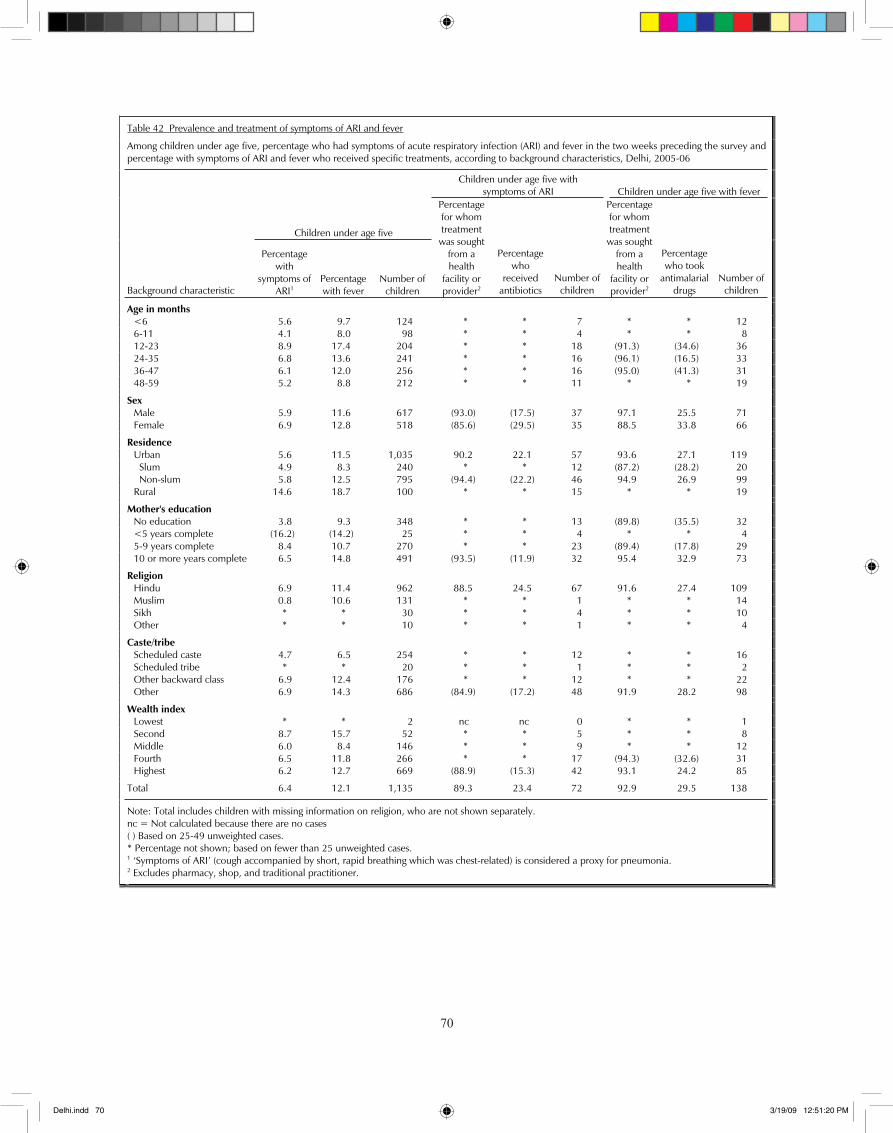
�0
70
Table 42 Prevalence and treatment of symptoms of ARI and fever
Among children under age five, percentage who had symptoms of acute respiratory infection (ARI) and fever in the two weeks preceding the survey and percentage with symptoms of ARI and fever who received specific treatments, according to background characteristics, Delhi, 2005-06
Children under age five with symptoms of ARI Children under age five with fever
Children under age five
Background characteristic
Percentagewith
symptoms of ARI1
Percentagewith fever
Number of children
Percentagefor whom treatment was sought
from a health
facility or provider2
Percentagewho
receivedantibiotics
Number of children
Percentagefor whom treatment was sought
from a health
facility or provider2
Percentagewho took
antimalarial drugs
Number of children
Age in months <6 5.6 9.7 124 * * 7 * * 12 6-11 4.1 8.0 98 * * 4 * * 8 12-23 8.9 17.4 204 * * 18 (91.3) (34.6) 36 24-35 6.8 13.6 241 * * 16 (96.1) (16.5) 33 36-47 6.1 12.0 256 * * 16 (95.0) (41.3) 31 48-59 5.2 8.8 212 * * 11 * * 19
Sex Male 5.9 11.6 617 (93.0) (17.5) 37 97.1 25.5 71 Female 6.9 12.8 518 (85.6) (29.5) 35 88.5 33.8 66
Residence Urban 5.6 11.5 1,035 90.2 22.1 57 93.6 27.1 119 Slum 4.9 8.3 240 * * 12 (87.2) (28.2) 20 Non-slum 5.8 12.5 795 (94.4) (22.2) 46 94.9 26.9 99 Rural 14.6 18.7 100 * * 15 * * 19
Mother's education No education 3.8 9.3 348 * * 13 (89.8) (35.5) 32 <5 years complete (16.2) (14.2) 25 * * 4 * * 4 5-9 years complete 8.4 10.7 270 * * 23 (89.4) (17.8) 29 10 or more years complete 6.5 14.8 491 (93.5) (11.9) 32 95.4 32.9 73
Religion Hindu 6.9 11.4 962 88.5 24.5 67 91.6 27.4 109 Muslim 0.8 10.6 131 * * 1 * * 14 Sikh * * 30 * * 4 * * 10 Other * * 10 * * 1 * * 4
Caste/tribe Scheduled caste 4.7 6.5 254 * * 12 * * 16 Scheduled tribe * * 20 * * 1 * * 2 Other backward class 6.9 12.4 176 * * 12 * * 22 Other 6.9 14.3 686 (84.9) (17.2) 48 91.9 28.2 98
Wealth index Lowest * * 2 nc nc 0 * * 1 Second 8.7 15.7 52 * * 5 * * 8 Middle 6.0 8.4 146 * * 9 * * 12 Fourth 6.5 11.8 266 * * 17 (94.3) (32.6) 31 Highest 6.2 12.7 669 (88.9) (15.3) 42 93.1 24.2 85
Total 6.4 12.1 1,135 89.3 23.4 72 92.9 29.5 138
Note: Total includes children with missing information on religion, who are not shown separately. nc = Not calculated because there are no cases ( ) Based on 25-49 unweighted cases. * Percentage not shown; based on fewer than 25 unweighted cases. 1 ‘Symptoms of ARI’ (cough accompanied by short, rapid breathing which was chest-related) is considered a proxy for pneumonia. 2 Excludes pharmacy, shop, and traditional practitioner.
Delhi.indd 70 3/19/09 12:51:20 PM
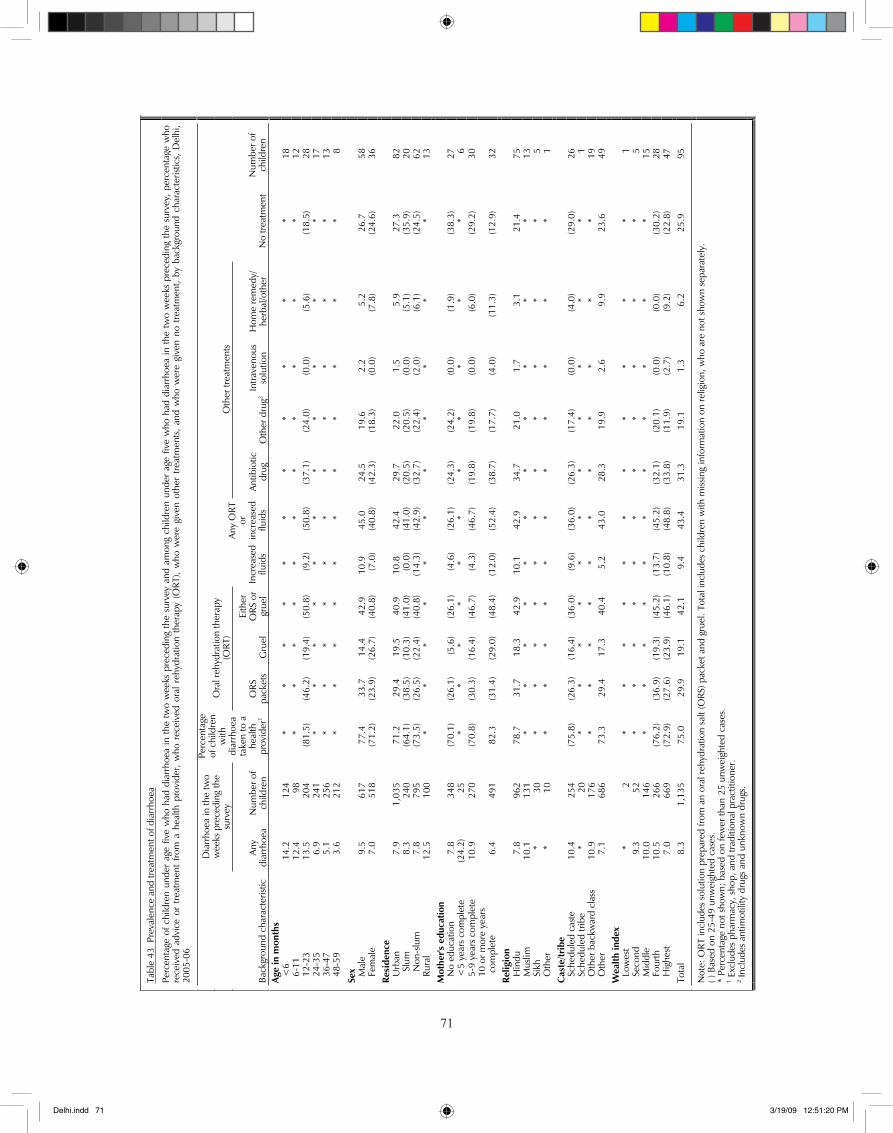
��
71
Tab
le 4
3 P
reva
lenc
e an
d tre
atm
ent o
f dia
rrho
ea
Perc
enta
ge o
f chi
ldre
n un
der
age
five
who
had
dia
rrho
ea in
the
two
wee
ks p
rece
ding
the
sur
vey
and
amon
g ch
ildre
n un
der
age
five
who
had
dia
rrho
ea in
the
tw
o w
eeks
pre
cedi
ng t
he s
urve
y,pe
rcen
tage
who
re
ceiv
ed a
dvic
e or
tre
atm
ent
from
a h
ealth
pro
vide
r, w
ho r
ecei
ved
oral
reh
ydra
tion
ther
apy
(ORT
), w
ho w
ere
give
n ot
her
treat
men
ts,
and
who
wer
e gi
ven
no t
reat
men
t, by
bac
kgro
und
char
acte
ristic
s, D
elhi
, 20
05-0
6
Dia
rrho
ea in
the
two
wee
ks p
rece
ding
the
surv
eyO
ral r
ehyd
ratio
n th
erap
y (O
RT)
Oth
er tr
eatm
ents
Bac
kgro
und
char
acte
ristic
An
ydi
arrh
oea
Num
ber o
f ch
ildre
n
Perc
enta
geof
chi
ldre
n w
ithdi
arrh
oea
take
n to
a
heal
thpr
ovid
er1
ORS
pa
cket
sG
ruel
Eith
erO
RS o
r gr
uel
Incr
ease
d flu
ids
Any
ORT
or
incr
ease
dflu
ids
Antib
iotic
drug
Oth
er d
rug2
Intra
veno
us
solu
tion
Hom
e re
med
y/
herb
al/o
ther
No
treat
men
t N
umbe
r of
child
ren
Age
in m
onth
s
<
6
14.2
12
4
* *
* *
* *
* *
* *
* 18
6-11
12
.4
98
* *
* *
* *
* *
* *
* 12
12-2
3
13.5
20
4
(81.
5)
(46.
2)
(19.
4)
(50.
8)
(9.2
) (5
0.8)
(3
7.1)
(2
4.0)
(0
.0)
(5.6
) (1
8.5)
28
24-3
5
6.9
24
1
* *
* *
* *
* *
* *
* 17
36-4
7
5.1
25
6
* *
* *
* *
* *
* *
* 13
48-5
9
3.6
21
2
* *
* *
* *
* *
* *
* 8
Sex
M
ale
9.
5
617
77
.4
33.7
14
.4
42.9
10
.9
45.0
24
.5
19.6
2.
2
5.2
26
.7
58
Fe
mal
e
7.0
51
8
(71.
2)
(23.
9)
(26.
7)
(40.
8)
(7.0
) (4
0.8)
(4
2.3)
(1
8.3)
(0
.0)
(7.8
) (2
4.6)
36
Resi
denc
e
Urb
an
7.9
1,
035
71
.2
29.4
19
.5
40.9
10
.8
42.4
29
.7
22.0
1.
5
5.9
27
.3
82
S
lum
8.
3
240
(64.
1)
(38.
5)
(10.
3)
(41.
0)
(0.0
) (4
1.0)
(2
0.5)
(2
0.5)
(0
.0)
(5.1
) (3
5.9)
20
Non
-slu
m
7.8
79
5 (7
3.5)
(2
6.5)
(2
2.4)
(4
0.8)
(1
4.3)
(4
2.9)
(3
2.7)
(2
2.4)
(2
.0)
(6.1
) (2
4.5)
62
Rura
l 12
.5
100
*
* *
* *
* *
* *
* *
13
Mot
her's
edu
catio
n
No
educ
atio
n
7.8
34
8
(70.
1)
(26.
1)
(5.6
) (2
6.1)
(4
.6)
(26.
1)
(24.
3)
(24.
2)
(0.0
) (1
.9)
(38.
3)
27
<
5 ye
ars
com
plet
e
(24.
2)
25
* *
* *
* *
* *
* *
* 6
5-9
year
s co
mpl
ete
10
.9
270
(7
0.8)
(3
0.3)
(1
6.4)
(4
6.7)
(4
.3)
(46.
7)
(19.
8)
(19.
8)
(0.0
) (6
.0)
(29.
2)
30
10 o
r mor
e ye
ars
com
plet
e6.
4
491
82
.3
(31.
4)
(29.
0)
(48.
4)
(12.
0)
(52.
4)
(38.
7)
(17.
7)
(4.0
) (1
1.3)
(1
2.9)
32
Relig
ion
H
indu
7.
8
962
78
.7
31.7
18
.3
42.9
10
.1
42.9
34
.7
21.0
1.
7
3.1
21
.4
75
M
uslim
10
.1
131
*
* *
* *
* *
* *
* *
13
Si
kh
* 30
*
* *
* *
* *
* *
* *
5
O
ther
*
10
* *
* *
* *
* *
* *
* 1
Cas
te/tr
ibe
Sc
hedu
led
cast
e
10.4
25
4
(75.
8)
(26.
3)
(16.
4)
(36.
0)
(9.6
) (3
6.0)
(2
6.3)
(1
7.4)
(0
.0)
(4.0
) (2
9.0)
26
Sche
dule
d tri
be
*
20
* *
* *
* *
* *
* *
* 1
Oth
er b
ackw
ard
clas
s
10.9
17
6
* *
* *
* *
* *
* *
* 19
Oth
er
7.1
68
6
73.3
29
.4
17.3
40
.4
5.2
43
.0
28.3
19
.9
2.6
9.
9
23.6
49
Wea
lth in
dex
Lo
wes
t *
2
*
* *
* *
* *
* *
* *
1
Se
cond
9.
3
52
* *
* *
* *
* *
* *
* 5
Mid
dle
10
.0
146
*
* *
* *
* *
* *
* *
15
Fo
urth
10
.5
266
(7
6.2)
(3
6.9)
(1
9.3)
(4
5.2)
(1
3.7)
(4
5.2)
(3
2.1)
(2
0.1)
(0
.0)
(0.0
) (3
0.2)
28
H
ighe
st
7.0
66
9
(72.
9)
(27.
6)
(23.
9)
(46.
1)
(10.
8)
(48.
8)
(33.
8)
(11.
9)
(2.7
) (9
.2)
(22.
8)
47
Tot
al
8.3
1,13
5 75
.0
29.9
19
.1
42.1
9.
4 43
.4
31.3
19
.1
1.3
6.2
25.9
95
Not
e: O
RT in
clud
es s
olut
ion
prep
ared
from
an
oral
rehy
drat
ion
salt
(ORS
) pac
ket a
nd g
ruel
. Tot
al in
clud
es c
hild
ren
with
miss
ing
info
rmat
ion
on re
ligio
n, w
ho a
re n
ot s
how
n se
para
tely
. ( )
Bas
ed o
n 25
-49
unw
eigh
ted
case
s.
* Pe
rcen
tage
not
sho
wn;
bas
ed o
n fe
wer
than
25
unw
eigh
ted
case
s.
1 Exc
lude
s ph
arm
acy,
sho
p, a
nd tr
aditi
onal
pra
ctiti
oner
. 2 In
clud
es a
ntim
otili
ty d
rugs
and
unk
now
n dr
ugs.
Delhi.indd 71 3/19/09 12:51:20 PM
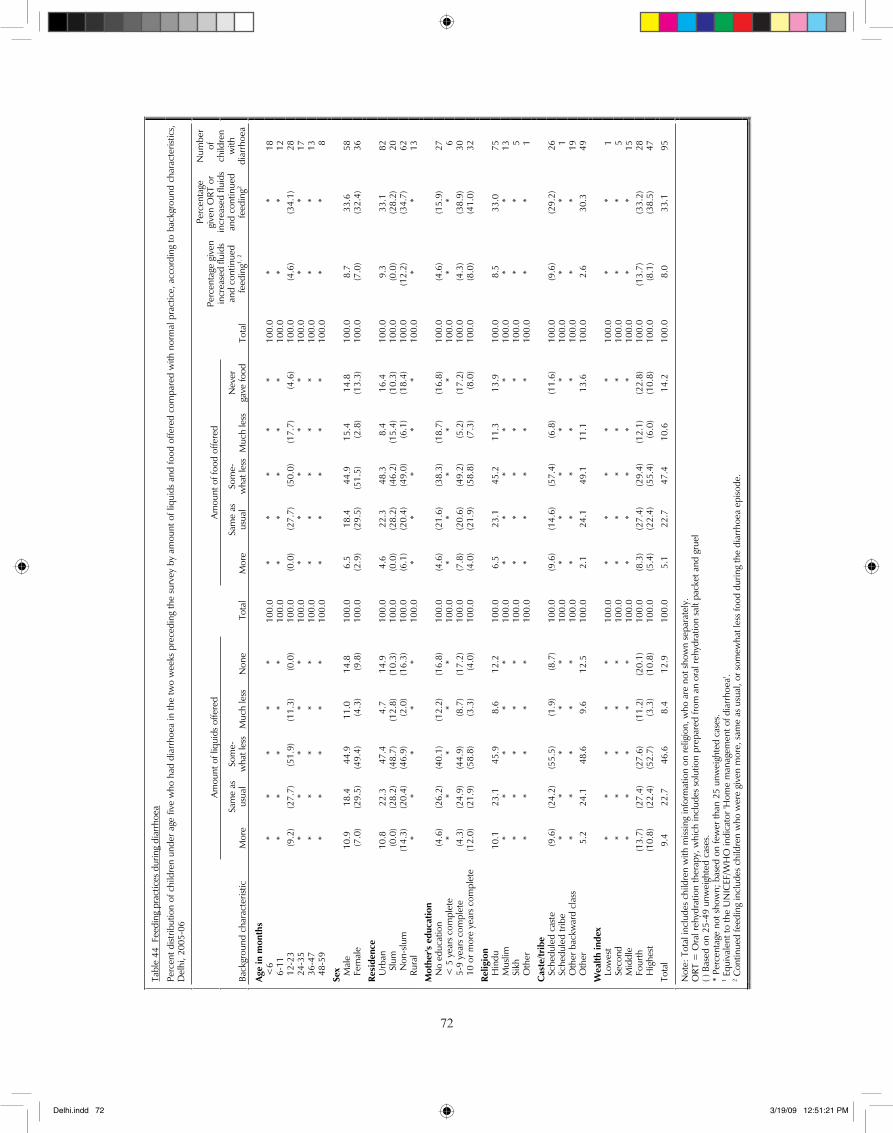
��
72
Tab
le 4
4 F
eedi
ng p
ract
ices
dur
ing
diar
rhoe
a
Perc
ent d
istrib
utio
n of
chi
ldre
n un
der a
ge fi
ve w
ho h
ad d
iarr
hoea
in th
e tw
o w
eeks
pre
cedi
ng th
e su
rvey
by
amou
nt o
f liq
uids
and
food
offe
red
com
pare
d w
ith n
orm
al p
ract
ice,
acc
ordi
ng to
bac
kgro
und
char
acte
ristic
s,
Del
hi, 2
005-
06
Am
ount
of l
iqui
ds o
ffere
d
Amou
nt o
f foo
d of
fere
d
Bac
kgro
und
char
acte
ristic
M
ore
Sam
e as
us
ual
Som
e-w
hat l
ess
Muc
h le
ssN
one
Tota
l M
ore
Sam
e as
us
ual
Som
e-w
hat l
ess
Muc
h le
ssN
ever
gave
food
Tota
l
Perc
enta
ge g
iven
in
crea
sed
fluid
s an
d co
ntin
ued
feed
ing1,
2
Perc
enta
gegi
ven
ORT
or
incr
ease
d flu
ids
and
cont
inue
d fe
edin
g2
Num
ber
of
child
ren
with
diar
rhoe
a
Age
in m
onth
s
<6
*
* *
* *
100.
0
* *
* *
* 10
0.0
* *
18
6-
11
* *
* *
* 10
0.0
*
* *
* *
100.
0 *
* 12
12-2
3
(9.2
) (2
7.7)
(5
1.9)
(1
1.3)
(0
.0)
100.
0
(0.0
) (2
7.7)
(5
0.0)
(1
7.7)
(4
.6)
100.
0 (4
.6)
(34.
1)
28
24
-35
*
* *
* *
100.
0
* *
* *
* 10
0.0
* *
17
36
-47
*
* *
* *
100.
0
* *
* *
* 10
0.0
* *
13
48
-59
*
* *
* *
100.
0
* *
* *
* 10
0.0
* *
8
Sex
M
ale
10
.9
18.4
44
.9
11.0
14
.8
100.
0
6.5
18
.4
44.9
15
.4
14.8
10
0.0
8.7
33
.6
58
Fe
mal
e
(7.0
) (2
9.5)
(4
9.4)
(4
.3)
(9.8
) 10
0.0
(2
.9)
(29.
5)
(51.
5)
(2.8
) (1
3.3)
10
0.0
(7.0
) (3
2.4)
36
Resi
denc
e
Urb
an
10.8
22
.3
47.4
4.
7
14.9
10
0.0
4.
6
22.3
48
.3
8.4
16
.4
100.
0 9.
3
33.1
82
Slu
m
(0.0
) (2
8.2)
(4
8.7)
(1
2.8)
(1
0.3)
10
0.0
(0
.0)
(28.
2)
(46.
2)
(15.
4)
(10.
3)
100.
0 (0
.0)
(28.
2)
20
N
on-s
lum
(1
4.3)
(2
0.4)
(4
6.9)
(2
.0)
(16.
3)
100.
0
(6.1
) (2
0.4)
(4
9.0)
(6
.1)
(18.
4)
100.
0 (1
2.2)
(3
4.7)
62
Rura
l *
* *
* *
100.
0
* *
* *
* 10
0.0
* *
13
Mot
her's
edu
catio
n
No
educ
atio
n
(4.6
) (2
6.2)
(4
0.1)
(1
2.2)
(1
6.8)
10
0.0
(4
.6)
(21.
6)
(38.
3)
(18.
7)
(16.
8)
100.
0 (4
.6)
(15.
9)
27
<
5 y
ears
com
plet
e
* *
* *
* 10
0.0
*
* *
* *
100.
0 *
* 6
5-9
year
s co
mpl
ete
(4
.3)
(24.
9)
(44.
9)
(8.7
) (1
7.2)
10
0.0
(7
.8)
(20.
6)
(49.
2)
(5.2
) (1
7.2)
10
0.0
(4.3
) (3
8.9)
30
10 o
r mor
e ye
ars
com
plet
e
(12.
0)
(21.
9)
(58.
8)
(3.3
) (4
.0)
100.
0
(4.0
) (2
1.9)
(5
8.8)
(7
.3)
(8.0
) 10
0.0
(8.0
) (4
1.0)
32
Relig
ion
H
indu
10
.1
23.1
45
.9
8.6
12
.2
100.
0
6.5
23
.1
45.2
11
.3
13.9
10
0.0
8.5
33
.0
75
M
uslim
*
* *
* *
100.
0
* *
* *
* 10
0.0
* *
13
Si
kh
* *
* *
* 10
0.0
*
* *
* *
100.
0 *
* 5
Oth
er
* *
* *
* 10
0.0
*
* *
* *
100.
0 *
* 1
Cas
te/tr
ibe
Sc
hedu
led
cast
e
(9.6
) (2
4.2)
(5
5.5)
(1
.9)
(8.7
) 10
0.0
(9
.6)
(14.
6)
(57.
4)
(6.8
) (1
1.6)
10
0.0
(9.6
) (2
9.2)
26
Sche
dule
d tri
be
* *
* *
* 10
0.0
*
* *
* *
100.
0 *
* 1
Oth
er b
ackw
ard
clas
s
* *
* *
* 10
0.0
*
* *
* *
100.
0 *
* 19
Oth
er
5.2
24
.1
48.6
9.
6
12.5
10
0.0
2.
1
24.1
49
.1
11.1
13
.6
100.
0 2.
6
30.3
49
Wea
lth in
dex
Low
est
* *
* *
* 10
0.0
*
* *
* *
100.
0 *
* 1
Seco
nd
* *
* *
* 10
0.0
*
* *
* *
100.
0 *
* 5
M
iddl
e
* *
* *
* 10
0.0
*
* *
* *
100.
0 *
* 15
Four
th
(13.
7)
(27.
4)
(27.
6)
(11.
2)
(20.
1)
100.
0
(8.3
) (2
7.4)
(2
9.4)
(1
2.1)
(2
2.8)
10
0.0
(13.
7)
(33.
2)
28
Hig
hest
(1
0.8)
(2
2.4)
(5
2.7)
(3
.3)
(10.
8)
100.
0
(5.4
) (2
2.4)
(5
5.4)
(6
.0)
(10.
8)
100.
0 (8
.1)
(38.
5)
47
Tot
al
9.4
22.7
46
.6
8.4
12.9
10
0.0
5.1
22.7
47
.4
10.6
14
.2
100.
0 8.
0 33
.1
95
Not
e: T
otal
incl
udes
chi
ldre
n w
ith m
issin
g in
form
atio
n on
relig
ion,
who
are
not
sho
wn
sepa
rate
ly.
ORT
= O
ral r
ehyd
ratio
n th
erap
y, w
hich
incl
udes
sol
utio
n pr
epar
ed fr
om a
n or
al re
hydr
atio
n sa
lt pa
cket
and
gru
el
( ) B
ased
on
25-4
9 un
wei
ghte
d ca
ses.
*
Perc
enta
ge n
ot s
how
n; b
ased
on
few
er th
an 2
5 un
wei
ghte
d ca
ses.
1 E
quiv
alen
t to
the
UN
ICEF
/WH
O in
dica
tor '
Hom
e m
anag
emen
t of d
iarr
hoea
'. 2 C
ontin
ued
feed
ing
incl
udes
chi
ldre
n w
ho w
ere
give
n m
ore,
sam
e as
usu
al, o
r som
ewha
t les
s fo
od d
urin
g th
e di
arrh
oea
episo
de.
Delhi.indd 72 3/19/09 12:51:21 PM
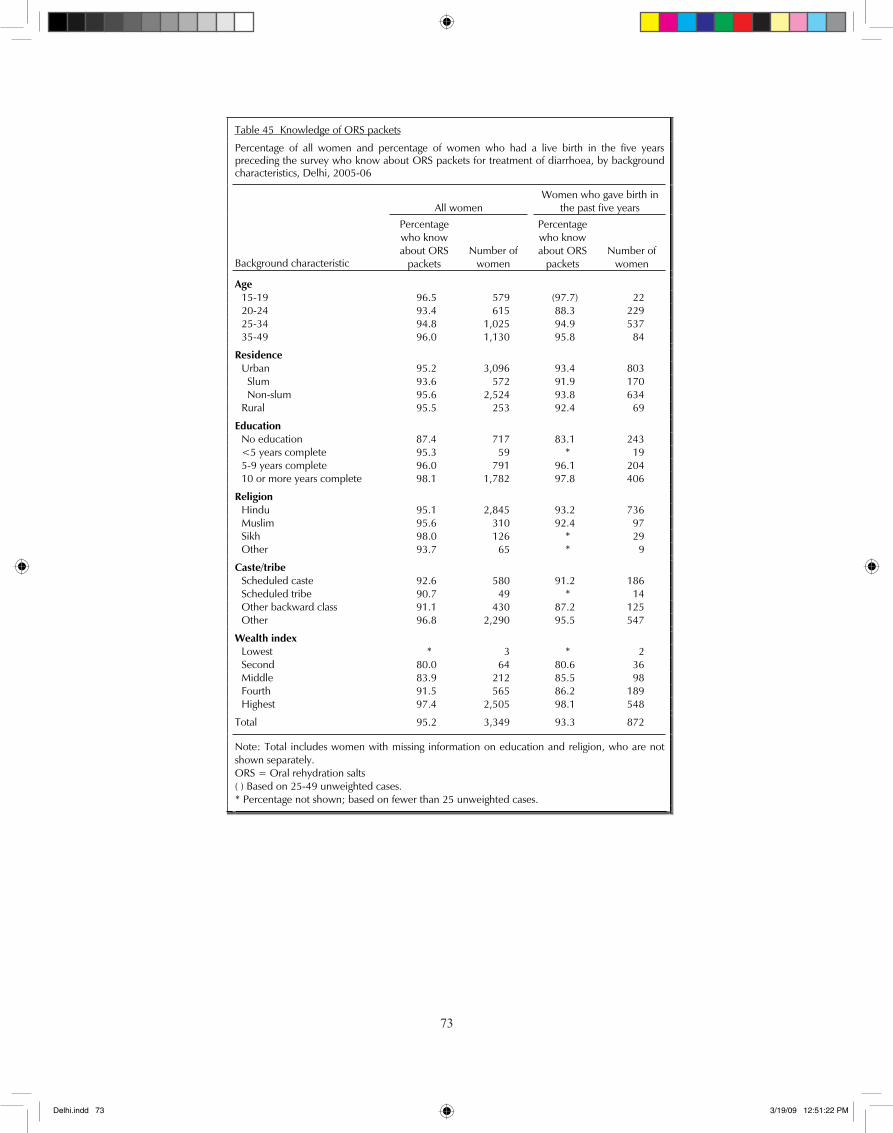
��
73
Table 45 Knowledge of ORS packets
Percentage of all women and percentage of women who had a live birth in the five years preceding the survey who know about ORS packets for treatment of diarrhoea, by background characteristics, Delhi, 2005-06
All women Women who gave birth in
the past five years
Background characteristic
Percentage who know about ORS
packets Number of
women
Percentage who know about ORS
packets Number of
women
Age 15-19 96.5 579 (97.7) 22 20-24 93.4 615 88.3 229 25-34 94.8 1,025 94.9 537 35-49 96.0 1,130 95.8 84
Residence Urban 95.2 3,096 93.4 803 Slum 93.6 572 91.9 170 Non-slum 95.6 2,524 93.8 634 Rural 95.5 253 92.4 69
Education No education 87.4 717 83.1 243 <5 years complete 95.3 59 * 19 5-9 years complete 96.0 791 96.1 204 10 or more years complete 98.1 1,782 97.8 406
Religion Hindu 95.1 2,845 93.2 736 Muslim 95.6 310 92.4 97 Sikh 98.0 126 * 29 Other 93.7 65 * 9
Caste/tribe Scheduled caste 92.6 580 91.2 186 Scheduled tribe 90.7 49 * 14 Other backward class 91.1 430 87.2 125 Other 96.8 2,290 95.5 547
Wealth index Lowest * 3 * 2 Second 80.0 64 80.6 36 Middle 83.9 212 85.5 98 Fourth 91.5 565 86.2 189 Highest 97.4 2,505 98.1 548
Total 95.2 3,349 93.3 872
Note: Total includes women with missing information on education and religion, who are not shown separately. ORS = Oral rehydration salts ( ) Based on 25-49 unweighted cases. * Percentage not shown; based on fewer than 25 unweighted cases.
Delhi.indd 73 3/19/09 12:51:22 PM
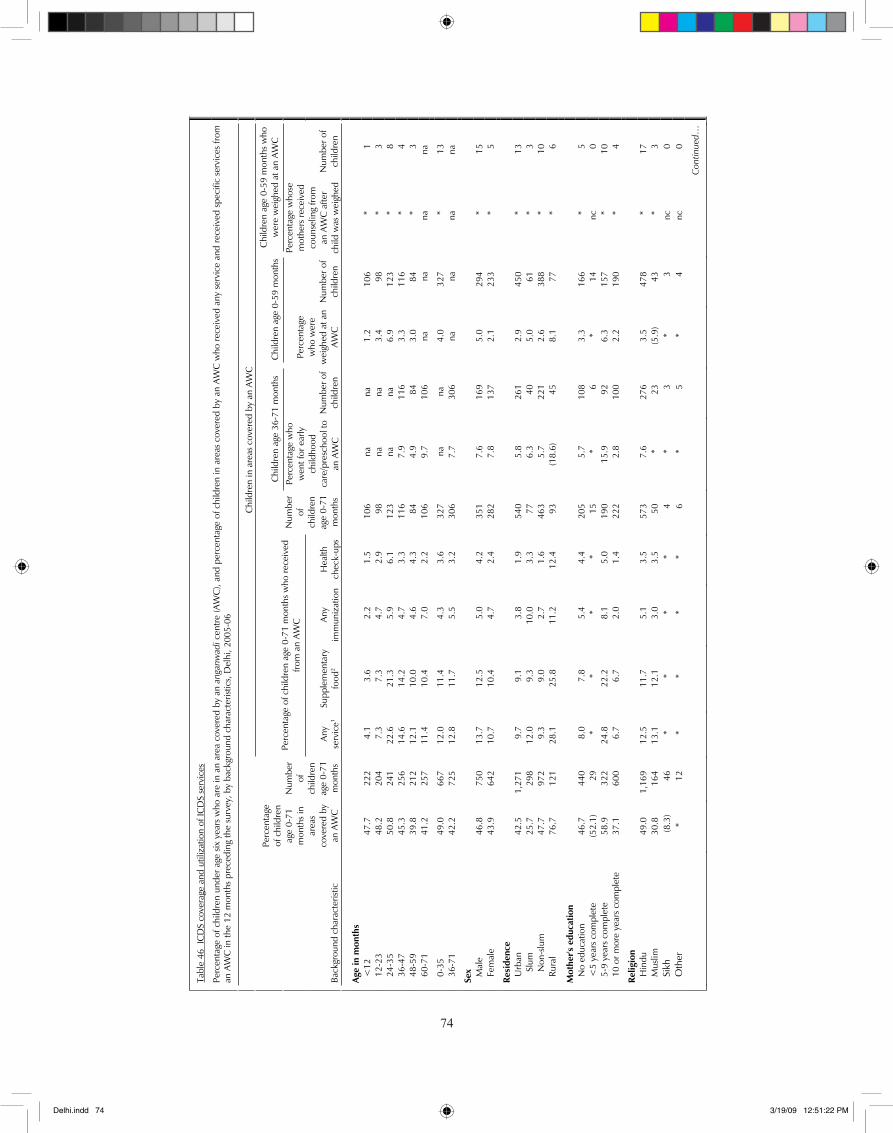
��
74
Ta
ble
46 I
CD
S co
vera
ge a
nd u
tiliz
atio
n of
ICD
S se
rvic
es
Perc
enta
ge o
f chi
ldre
n un
der a
ge s
ix y
ears
who
are
in a
n ar
ea c
over
ed b
y an
ang
anw
adi c
entr
e (A
WC
), an
d pe
rcen
tage
of c
hild
ren
in a
reas
cov
ered
by
an A
WC
who
rece
ived
any
ser
vice
and
rece
ived
spe
cific
ser
vice
s fro
m
an A
WC
in th
e 12
mon
ths
prec
edin
g th
e su
rvey
, by
back
grou
nd c
hara
cter
istic
s, D
elhi
, 200
5-06
Chi
ldre
n in
are
as c
over
ed b
y an
AW
C
Chi
ldre
n ag
e 36
-71
mon
ths
Chi
ldre
n ag
e 0-
59 m
onth
sC
hild
ren
age
0-59
mon
ths
who
w
ere
wei
ghed
at a
n AW
C
Perc
enta
ge o
f chi
ldre
n ag
e 0-
71 m
onth
s w
ho re
ceiv
ed
from
an
AWC
Back
grou
nd c
hara
cter
istic
Perc
enta
geof
chi
ldre
n ag
e 0-
71
mon
ths
in
area
sco
vere
d by
an
AW
C
Num
ber
of
child
ren
age
0-71
m
onth
s An
yse
rvic
e1Su
pple
men
tary
food
2An
yim
mun
izat
ion
Hea
lthch
eck-
ups
Num
ber
of
child
ren
age
0-71
m
onth
s
Perc
enta
ge w
ho
wen
t for
ear
ly
child
hood
care
/pre
scho
ol to
an
AW
C
Num
ber o
f ch
ildre
n
Perc
enta
gew
ho w
ere
wei
ghed
at a
n A
WC
Num
ber o
f ch
ildre
n
Perc
enta
ge w
hose
m
othe
rs re
ceiv
ed
coun
selin
g fro
m
an A
WC
afte
r ch
ild w
as w
eigh
edN
umbe
r of
child
ren
Age
in m
onth
s
<12
47
.7
222
4.
1
3.6
2.
2
1.5
10
6
na
na
1.2
10
6
* 1
12-2
3
48.2
20
4
7.3
7.
3
4.7
2.
9
98
na
na
3.4
98
*
3
24-3
5
50.8
24
1
22.6
21
.3
5.9
6.
1
123
na
na
6.
9
123
*
8
36-4
7
45.3
25
6
14.6
14
.2
4.7
3.
3
116
7.
9
116
3.
3
116
*
4
48-5
9
39.8
21
2
12.1
10
.0
4.6
4.
3
84
4.9
84
3.
0
84
*3
60
-71
41
.2
257
11
.4
10.4
7.
0
2.2
10
6
9.7
10
6
na
na
na
na
0-
35
49.0
66
7
12.0
11
.4
4.3
3.
6
327
na
na
4.
0
327
*
13
36-7
1
42.2
72
5
12.8
11
.7
5.5
3.
2
306
7.
7
306
na
na
na
na
Sex
M
ale
46
.8
750
13
.7
12.5
5.
0
4.2
35
1
7.6
16
9
5.0
29
4
* 15
Fem
ale
43
.9
642
10
.7
10.4
4.
7
2.4
28
2
7.8
13
7
2.1
23
3
* 5
Resi
denc
e
Urb
an
42.5
1,
271
9.
7
9.1
3.
8
1.9
54
0
5.8
26
1
2.9
45
0
* 13
Slu
m
25.7
29
8 12
.0
9.3
10
.0
3.3
77
6.
3
40
5.0
61
*
3
Non
-slu
m
47.7
97
2 9.
3
9.0
2.
7
1.6
46
3 5.
7
221
2.6
38
8 *
10
Ru
ral
76.7
12
1
28.1
25
.8
11.2
12
.4
93
(18.
6)
45
8.1
77
*
6
Mot
her's
edu
catio
n
No
educ
atio
n
46.7
44
0
8.0
7.
8
5.4
4.
4
205
5.
7
108
3.
3
166
*
5
<
5 ye
ars
com
plet
e
(52.
1)
29
* *
* *
15
*
6
* 14
nc
0
5-9
year
s co
mpl
ete
58
.9
322
24
.8
22.2
8.
1
5.0
19
0
15.9
92
6.
3
157
*
10
10
or m
ore
year
s co
mpl
ete
37
.1
600
6.
7
6.7
2.
0
1.4
22
2
2.8
10
0
2.2
19
0
* 4
Relig
ion
H
indu
49
.0
1,16
9
12.5
11
.7
5.1
3.
5
573
7.
6
276
3.
5
478
*
17
M
uslim
30
.8
164
13
.1
12.1
3.
0
3.5
50
*
23
(5.9
) 43
*
3
Sikh
(8.3
) 46
*
* *
* 4
*
3
* 3
nc
0
O
ther
*
12
* *
* *
6
* 5
*
4
nc
0
C
ontin
ued…
Delhi.indd 74 3/19/09 12:51:22 PM
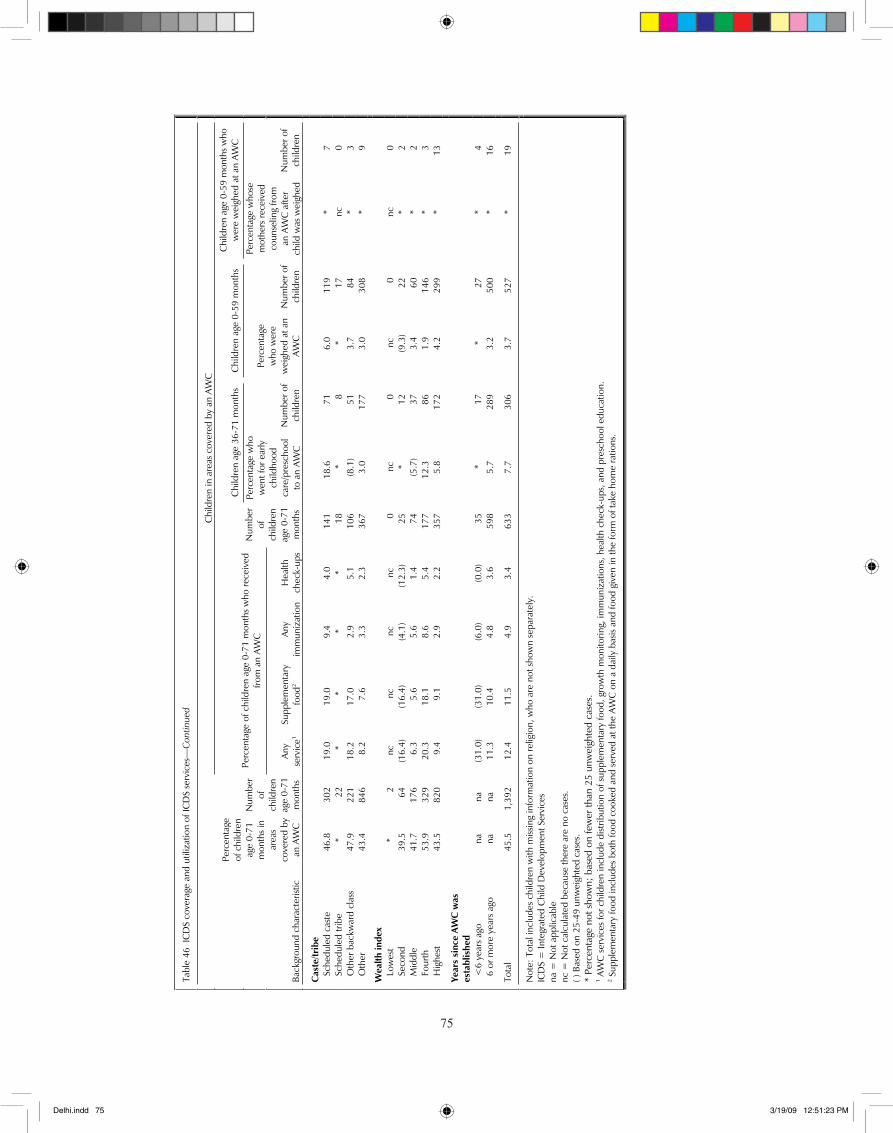
��
75
Tab
le 4
6 IC
DS
cove
rage
and
util
izat
ion
of IC
DS
serv
ices
—C
ontin
ued
Chi
ldre
n in
are
as c
over
ed b
y an
AW
C
Chi
ldre
n ag
e 36
-71
mon
ths
Chi
ldre
n ag
e 0-
59 m
onth
sC
hild
ren
age
0-59
mon
ths
who
w
ere
wei
ghed
at a
n AW
C
Perc
enta
ge o
f chi
ldre
n ag
e 0-
71 m
onth
s w
ho re
ceiv
ed
from
an
AWC
Back
grou
nd c
hara
cter
istic
Perc
enta
geof
chi
ldre
n ag
e 0-
71
mon
ths
in
area
sco
vere
d b y
an A
WC
Num
ber
of
child
ren
age
0-71
m
onth
s An
yse
rvic
e1Su
pple
men
tary
food
2An
yim
mun
izat
ion
Hea
lthch
eck-
ups
Num
ber
of
child
ren
age
0-71
m
onth
s
Perc
enta
ge w
ho
wen
t for
ear
ly
child
hood
care
/pre
scho
ol
to a
n AW
C
Num
ber o
f ch
ildre
n
Perc
enta
gew
ho w
ere
wei
ghed
at a
n A
WC
Num
ber o
f ch
ildre
n
Perc
enta
ge w
hose
m
othe
rs re
ceiv
ed
coun
selin
g fro
m
an A
WC
afte
r ch
ild w
as w
eigh
edN
umbe
r of
child
ren
Cas
te/tr
ibe
Sche
dule
d ca
ste
46
.8
302
19
.0
19.0
9.
4
4.0
14
1
18.6
71
6.
0
119
*
7
Sc
hedu
led
tribe
*
22
* *
* *
18
* 8
*
17
nc
0
Oth
er b
ackw
ard
clas
s
47.9
22
1
18.2
17
.0
2.9
5.
1
106
(8
.1)
51
3.7
84
*
3
O
ther
43
.4
846
8.
2
7.6
3.
3
2.3
36
7
3.0
17
7
3.0
30
8
* 9
Wea
lth in
dex
Lo
wes
t *
2
nc
nc
nc
nc
0
nc
0
nc
0
nc
0
Seco
nd
39.5
64
(1
6.4)
(1
6.4)
(4
.1)
(12.
3)
25
*
12
(9.3
) 22
*
2
M
iddl
e
41.7
17
6
6.3
5.
6
5.6
1.
4
74
(5.7
) 37
3.
4
60
* 2
Four
th
53.9
32
9
20.3
18
.1
8.6
5.
4
177
12
.3
86
1.9
14
6
* 3
Hig
hest
43
.5
820
9.
4
9.1
2.
9
2.2
35
7
5.8
17
2
4.2
29
9
* 13
Year
s si
nce
AWC
was
es
tabl
ishe
d
<6
year
s ag
o
na
na
(31.
0)
(31.
0)
(6.0
) (0
.0)
35
* 17
*
27
* 4
6 or
mor
e ye
ars
ago
na
na
11
.3
10.4
4.
8
3.6
59
8
5.7
28
9
3.2
50
0
* 16
Tot
al
45.5
1,
392
12.4
11
.5
4.9
3.4
633
7.7
306
3.7
527
* 19
Not
e: T
otal
incl
udes
chi
ldre
n w
ith m
issin
g in
form
atio
n on
relig
ion,
who
are
not
sho
wn
sepa
rate
ly.
ICD
S =
Inte
grat
ed C
hild
Dev
elop
men
t Ser
vice
s na
= N
ot a
pplic
able
nc
= N
ot c
alcu
late
d be
caus
e th
ere
are
no c
ases
. ( )
Bas
ed o
n 25
-49
unw
eigh
ted
case
s.
* Pe
rcen
tage
not
sho
wn;
bas
ed o
n fe
wer
than
25
unw
eigh
ted
case
s.1 A
WC
ser
vice
s fo
r chi
ldre
n in
clud
e di
strib
utio
n of
sup
plem
enta
ry fo
od, g
row
th m
onito
ring,
imm
uniz
atio
ns, h
ealth
che
ck-u
ps, a
nd p
resc
hool
edu
catio
n.
2 Sup
plem
enta
ry fo
od in
clud
es b
oth
food
coo
ked
and
serv
ed a
t the
AW
C o
n a
daily
bas
is an
d fo
od g
iven
in th
e fo
rm o
f tak
e ho
me
ratio
ns.
Delhi.indd 75 3/19/09 12:51:23 PM
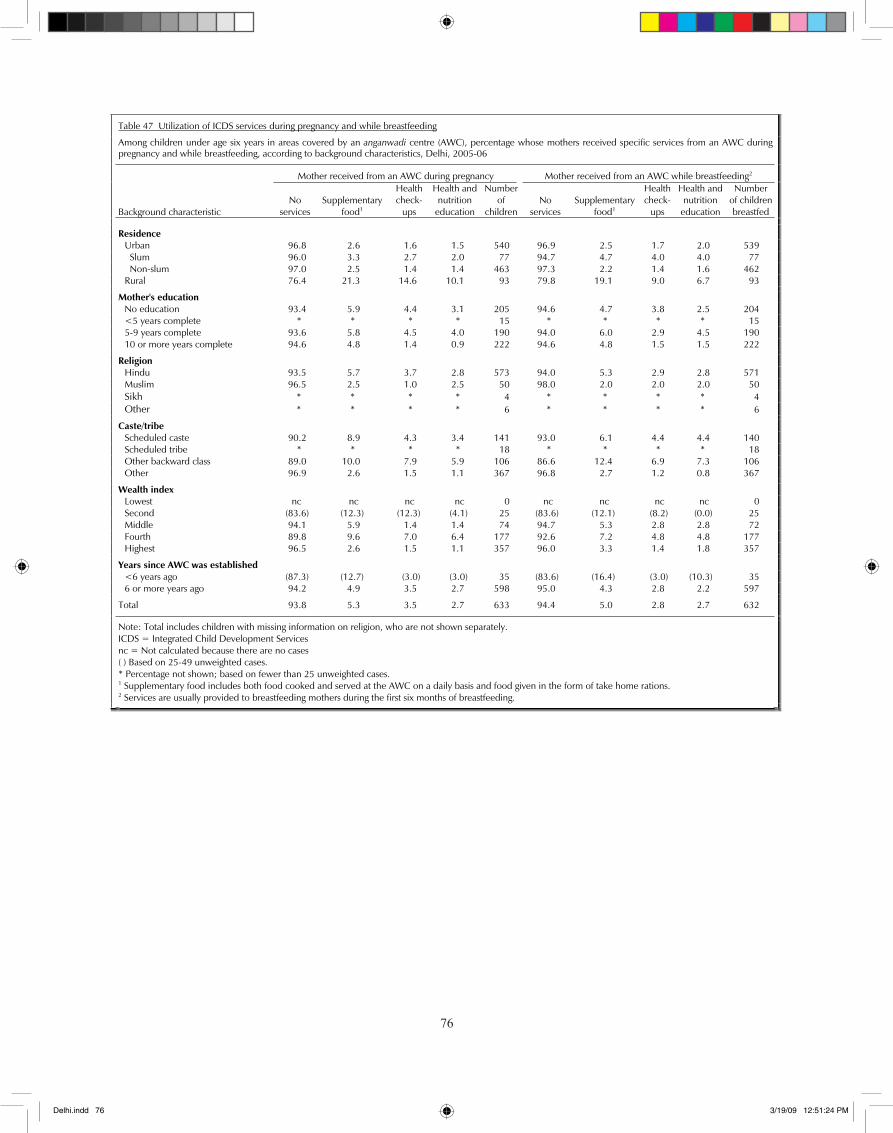
��
76
Table 47 Utilization of ICDS services during pregnancy and while breastfeeding
Among children under age six years in areas covered by an anganwadi centre (AWC), percentage whose mothers received specific services from an AWC duringpregnancy and while breastfeeding, according to background characteristics, Delhi, 2005-06
Mother received from an AWC during pregnancy Mother received from an AWC while breastfeeding2
Background characteristic No
servicesSupplementary
food1
Healthcheck-
ups
Health and nutrition
education
Numberof
childrenNo
servicesSupplementary
food1
Healthcheck-
ups
Health and nutrition
education
Numberof children breastfed
Residence Urban 96.8 2.6 1.6 1.5 540 96.9 2.5 1.7 2.0 539 Slum 96.0 3.3 2.7 2.0 77 94.7 4.7 4.0 4.0 77 Non-slum 97.0 2.5 1.4 1.4 463 97.3 2.2 1.4 1.6 462 Rural 76.4 21.3 14.6 10.1 93 79.8 19.1 9.0 6.7 93
Mother's education No education 93.4 5.9 4.4 3.1 205 94.6 4.7 3.8 2.5 204 <5 years complete * * * * 15 * * * * 15 5-9 years complete 93.6 5.8 4.5 4.0 190 94.0 6.0 2.9 4.5 190 10 or more years complete 94.6 4.8 1.4 0.9 222 94.6 4.8 1.5 1.5 222
Religion Hindu 93.5 5.7 3.7 2.8 573 94.0 5.3 2.9 2.8 571 Muslim 96.5 2.5 1.0 2.5 50 98.0 2.0 2.0 2.0 50
Sikh * * * * 4 * * * * 4 Other * * * * 6 * * * * 6
Caste/tribe Scheduled caste 90.2 8.9 4.3 3.4 141 93.0 6.1 4.4 4.4 140 Scheduled tribe * * * * 18 * * * * 18 Other backward class 89.0 10.0 7.9 5.9 106 86.6 12.4 6.9 7.3 106 Other 96.9 2.6 1.5 1.1 367 96.8 2.7 1.2 0.8 367
Wealth index Lowest nc nc nc nc 0 nc nc nc nc 0 Second (83.6) (12.3) (12.3) (4.1) 25 (83.6) (12.1) (8.2) (0.0) 25 Middle 94.1 5.9 1.4 1.4 74 94.7 5.3 2.8 2.8 72 Fourth 89.8 9.6 7.0 6.4 177 92.6 7.2 4.8 4.8 177 Highest 96.5 2.6 1.5 1.1 357 96.0 3.3 1.4 1.8 357
Years since AWC was established <6 years ago (87.3) (12.7) (3.0) (3.0) 35 (83.6) (16.4) (3.0) (10.3) 35 6 or more years ago 94.2 4.9 3.5 2.7 598 95.0 4.3 2.8 2.2 597
Total 93.8 5.3 3.5 2.7 633 94.4 5.0 2.8 2.7 632
Note: Total includes children with missing information on religion, who are not shown separately. ICDS = Integrated Child Development Services nc = Not calculated because there are no cases ( ) Based on 25-49 unweighted cases. * Percentage not shown; based on fewer than 25 unweighted cases. 1 Supplementary food includes both food cooked and served at the AWC on a daily basis and food given in the form of take home rations.2 Services are usually provided to breastfeeding mothers during the first six months of breastfeeding.
Delhi.indd 76 3/19/09 12:51:24 PM
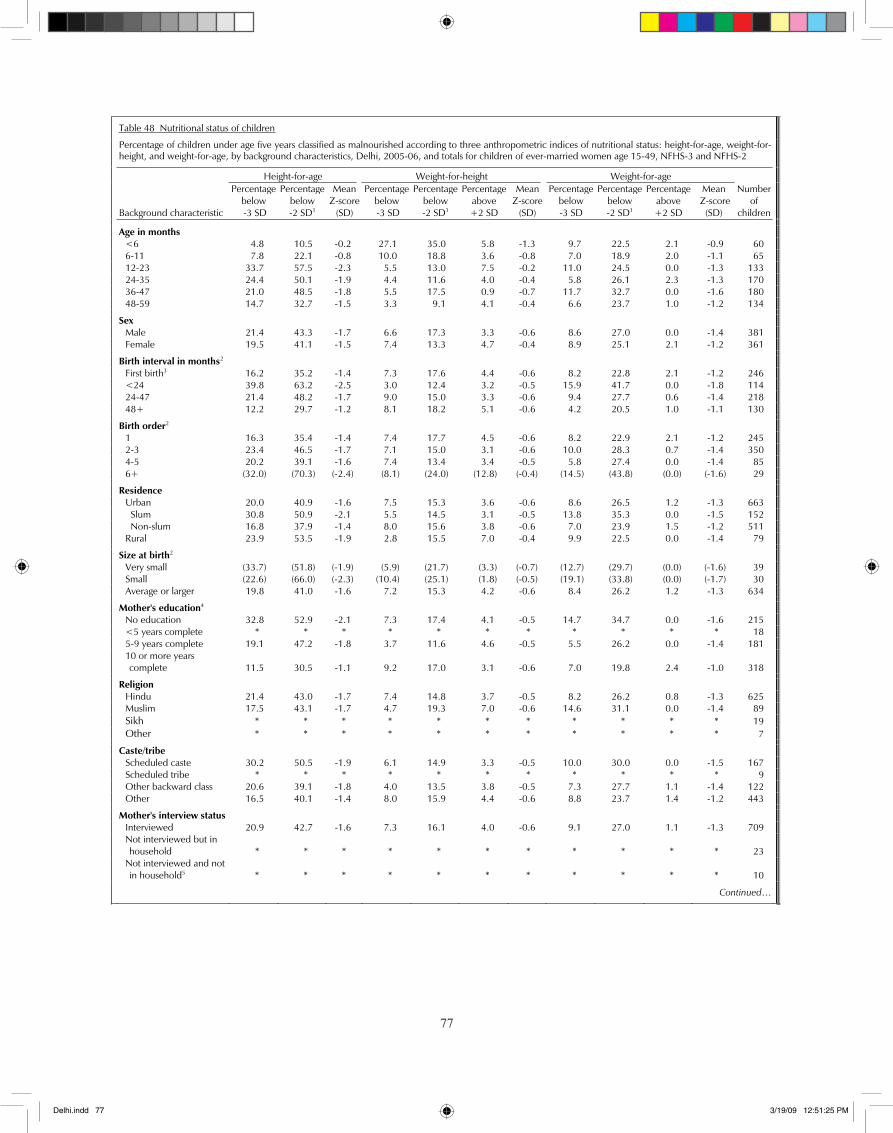
��
77
Table 48 Nutritional status of children
Percentage of children under age five years classified as malnourished according to three anthropometric indices of nutritional status: height-for-age, weight-for-height, and weight-for-age, by background characteristics, Delhi, 2005-06, and totals for children of ever-married women age 15-49, NFHS-3 and NFHS-2
Height-for-age Weight-for-height Weight-for-age
Background characteristic
Percentagebelow -3 SD
Percentagebelow -2 SD1
Mean Z-score
(SD)
Percentagebelow -3 SD
Percentagebelow -2 SD1
Percentageabove+2 SD
Mean Z-score
(SD)
Percentagebelow -3 SD
Percentagebelow -2 SD1
Percentageabove+2 SD
Mean Z-score
(SD)
Numberof
children
Age in months <6 4.8 10.5 -0.2 27.1 35.0 5.8 -1.3 9.7 22.5 2.1 -0.9 60 6-11 7.8 22.1 -0.8 10.0 18.8 3.6 -0.8 7.0 18.9 2.0 -1.1 65 12-23 33.7 57.5 -2.3 5.5 13.0 7.5 -0.2 11.0 24.5 0.0 -1.3 133 24-35 24.4 50.1 -1.9 4.4 11.6 4.0 -0.4 5.8 26.1 2.3 -1.3 170 36-47 21.0 48.5 -1.8 5.5 17.5 0.9 -0.7 11.7 32.7 0.0 -1.6 180 48-59 14.7 32.7 -1.5 3.3 9.1 4.1 -0.4 6.6 23.7 1.0 -1.2 134
Sex Male 21.4 43.3 -1.7 6.6 17.3 3.3 -0.6 8.6 27.0 0.0 -1.4 381 Female 19.5 41.1 -1.5 7.4 13.3 4.7 -0.4 8.9 25.1 2.1 -1.2 361
Birth interval in months2 First birth3 16.2 35.2 -1.4 7.3 17.6 4.4 -0.6 8.2 22.8 2.1 -1.2 246 <24 39.8 63.2 -2.5 3.0 12.4 3.2 -0.5 15.9 41.7 0.0 -1.8 114 24-47 21.4 48.2 -1.7 9.0 15.0 3.3 -0.6 9.4 27.7 0.6 -1.4 218 48+ 12.2 29.7 -1.2 8.1 18.2 5.1 -0.6 4.2 20.5 1.0 -1.1 130
Birth order2 1 16.3 35.4 -1.4 7.4 17.7 4.5 -0.6 8.2 22.9 2.1 -1.2 245 2-3 23.4 46.5 -1.7 7.1 15.0 3.1 -0.6 10.0 28.3 0.7 -1.4 350 4-5 20.2 39.1 -1.6 7.4 13.4 3.4 -0.5 5.8 27.4 0.0 -1.4 85 6+ (32.0) (70.3) (-2.4) (8.1) (24.0) (12.8) (-0.4) (14.5) (43.8) (0.0) (-1.6) 29
Residence Urban 20.0 40.9 -1.6 7.5 15.3 3.6 -0.6 8.6 26.5 1.2 -1.3 663 Slum 30.8 50.9 -2.1 5.5 14.5 3.1 -0.5 13.8 35.3 0.0 -1.5 152 Non-slum 16.8 37.9 -1.4 8.0 15.6 3.8 -0.6 7.0 23.9 1.5 -1.2 511 Rural 23.9 53.5 -1.9 2.8 15.5 7.0 -0.4 9.9 22.5 0.0 -1.4 79
Size at birth2 Very small (33.7) (51.8) (-1.9) (5.9) (21.7) (3.3) (-0.7) (12.7) (29.7) (0.0) (-1.6) 39 Small (22.6) (66.0) (-2.3) (10.4) (25.1) (1.8) (-0.5) (19.1) (33.8) (0.0) (-1.7) 30 Average or larger 19.8 41.0 -1.6 7.2 15.3 4.2 -0.6 8.4 26.2 1.2 -1.3 634
Mother's education4 No education 32.8 52.9 -2.1 7.3 17.4 4.1 -0.5 14.7 34.7 0.0 -1.6 215 <5 years complete * * * * * * * * * * * 18 5-9 years complete 19.1 47.2 -1.8 3.7 11.6 4.6 -0.5 5.5 26.2 0.0 -1.4 181
10 or more years complete 11.5 30.5 -1.1 9.2 17.0 3.1 -0.6 7.0 19.8 2.4 -1.0 318
Religion Hindu 21.4 43.0 -1.7 7.4 14.8 3.7 -0.5 8.2 26.2 0.8 -1.3 625 Muslim 17.5 43.1 -1.7 4.7 19.3 7.0 -0.6 14.6 31.1 0.0 -1.4 89
Sikh * * * * * * * * * * * 19 Other * * * * * * * * * * * 7
Caste/tribe Scheduled caste 30.2 50.5 -1.9 6.1 14.9 3.3 -0.5 10.0 30.0 0.0 -1.5 167 Scheduled tribe * * * * * * * * * * * 9 Other backward class 20.6 39.1 -1.8 4.0 13.5 3.8 -0.5 7.3 27.7 1.1 -1.4 122 Other 16.5 40.1 -1.4 8.0 15.9 4.4 -0.6 8.8 23.7 1.4 -1.2 443
Mother's interview status Interviewed 20.9 42.7 -1.6 7.3 16.1 4.0 -0.6 9.1 27.0 1.1 -1.3 709
Not interviewed but in household * * * * * * * * * * * 23
Not interviewed and not in household5 * * * * * * * * * * * 10
Continued…
Delhi.indd 77 3/19/09 12:51:25 PM
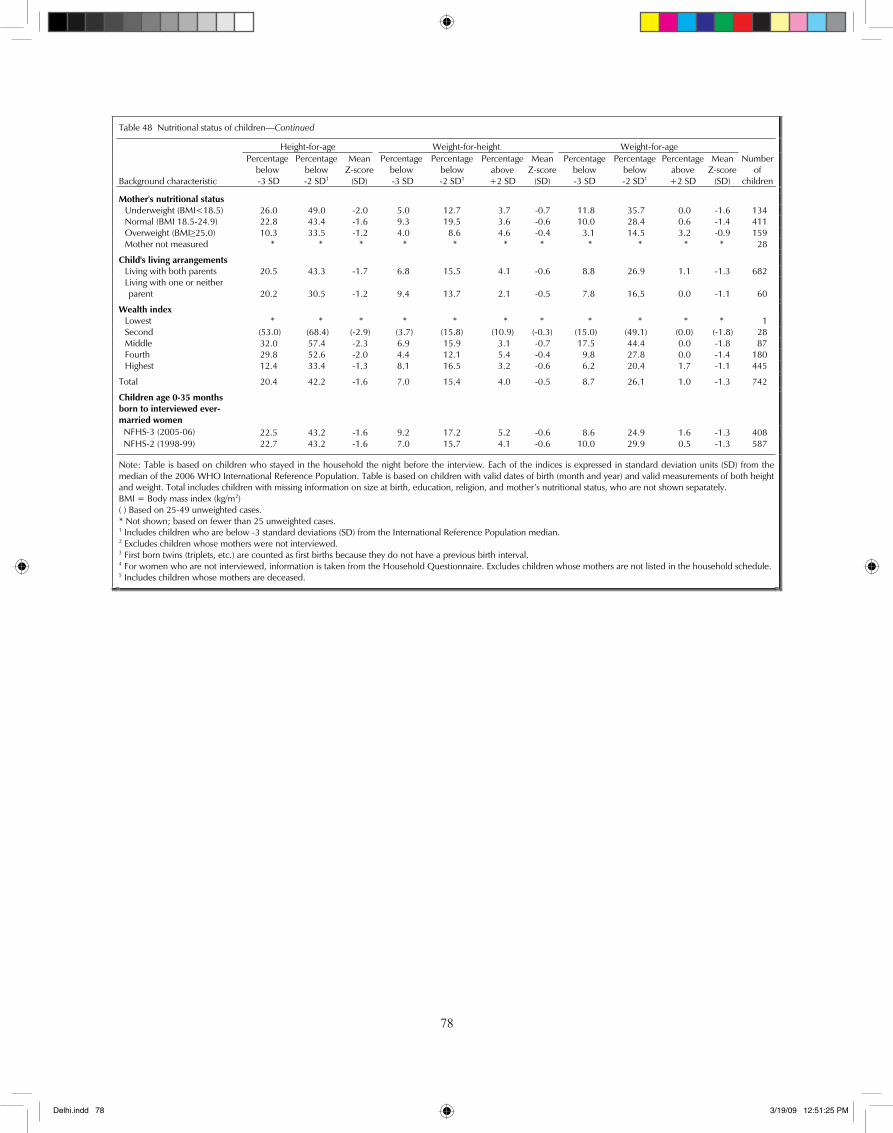
��
78
Table 48 Nutritional status of children—Continued
Height-for-age Weight-for-height Weight-for-age
Background characteristic
Percentagebelow -3 SD
Percentagebelow -2 SD1
Mean Z-score
(SD)
Percentagebelow -3 SD
Percentagebelow -2 SD1
Percentageabove+2 SD
Mean Z-score
(SD)
Percentagebelow -3 SD
Percentagebelow -2 SD1
Percentageabove+2 SD
Mean Z-score
(SD)
Numberof
children
Mother's nutritional status Underweight (BMI<18.5) 26.0 49.0 -2.0 5.0 12.7 3.7 -0.7 11.8 35.7 0.0 -1.6 134 Normal (BMI 18.5-24.9) 22.8 43.4 -1.6 9.3 19.5 3.6 -0.6 10.0 28.4 0.6 -1.4 411 Overweight (BMI 25.0) 10.3 33.5 -1.2 4.0 8.6 4.6 -0.4 3.1 14.5 3.2 -0.9 159 Mother not measured * * * * * * * * * * * 28
Child's living arrangements Living with both parents 20.5 43.3 -1.7 6.8 15.5 4.1 -0.6 8.8 26.9 1.1 -1.3 682
Living with one or neither parent 20.2 30.5 -1.2 9.4 13.7 2.1 -0.5 7.8 16.5 0.0 -1.1 60
Wealth index Lowest * * * * * * * * * * * 1 Second (53.0) (68.4) (-2.9) (3.7) (15.8) (10.9) (-0.3) (15.0) (49.1) (0.0) (-1.8) 28 Middle 32.0 57.4 -2.3 6.9 15.9 3.1 -0.7 17.5 44.4 0.0 -1.8 87 Fourth 29.8 52.6 -2.0 4.4 12.1 5.4 -0.4 9.8 27.8 0.0 -1.4 180 Highest 12.4 33.4 -1.3 8.1 16.5 3.2 -0.6 6.2 20.4 1.7 -1.1 445
Total 20.4 42.2 -1.6 7.0 15.4 4.0 -0.5 8.7 26.1 1.0 -1.3 742
Children age 0-35 months born to interviewed ever- married women NFHS-3 (2005-06) 22.5 43.2 -1.6 9.2 17.2 5.2 -0.6 8.6 24.9 1.6 -1.3 408
NFHS-2 (1998-99) 22.7 43.2 -1.6 7.0 15.7 4.1 -0.6 10.0 29.9 0.5 -1.3 587
Note: Table is based on children who stayed in the household the night before the interview. Each of the indices is expressed in standard deviation units (SD) from the median of the 2006 WHO International Reference Population. Table is based on children with valid dates of birth (month and year) and valid measurements of both heightand weight. Total includes children with missing information on size at birth, education, religion, and mother’s nutritional status, who are not shown separately. BMI = Body mass index (kg/m2)( ) Based on 25-49 unweighted cases. * Not shown; based on fewer than 25 unweighted cases. 1 Includes children who are below -3 standard deviations (SD) from the International Reference Population median. 2 Excludes children whose mothers were not interviewed. 3 First born twins (triplets, etc.) are counted as first births because they do not have a previous birth interval. 4 For women who are not interviewed, information is taken from the Household Questionnaire. Excludes children whose mothers are not listed in the household schedule. 5 Includes children whose mothers are deceased.
Delhi.indd 78 3/19/09 12:51:25 PM
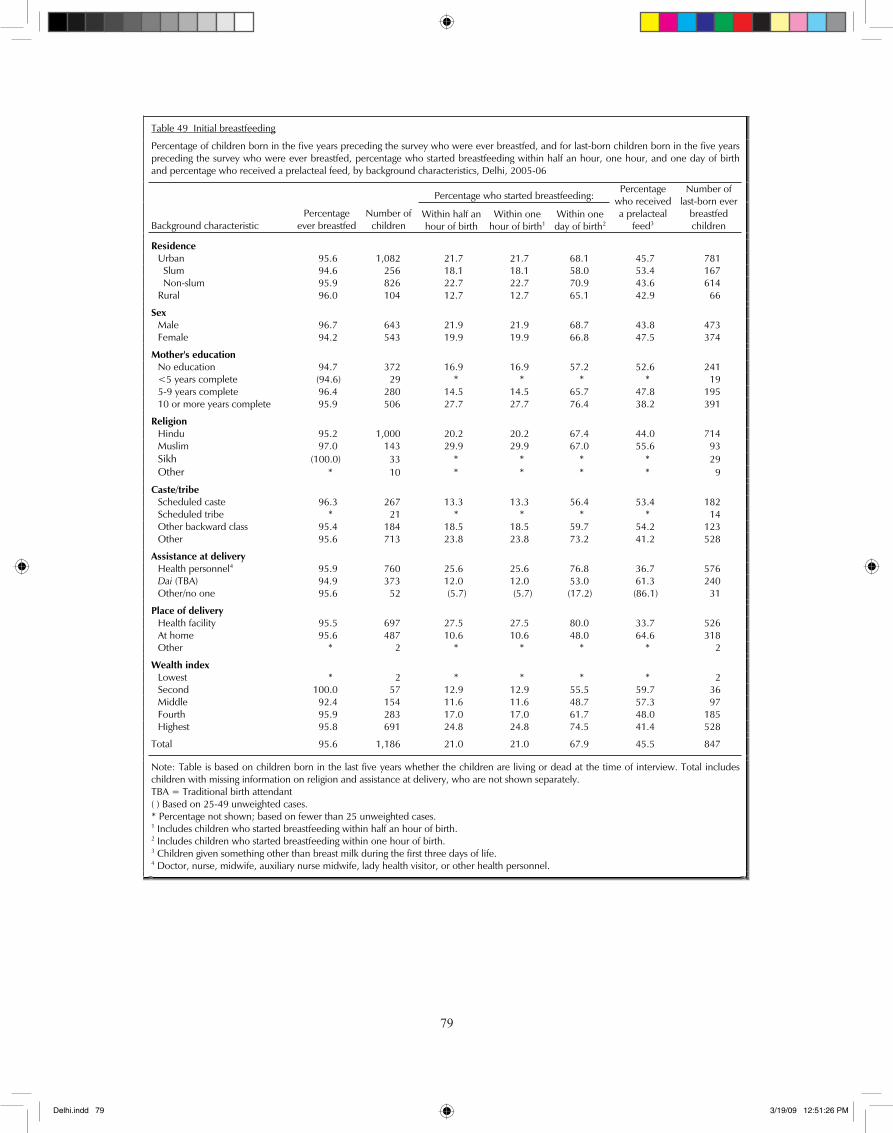
��
79
Table 49 Initial breastfeeding
Percentage of children born in the five years preceding the survey who were ever breastfed, and for last-born children born in the five years preceding the survey who were ever breastfed, percentage who started breastfeeding within half an hour, one hour, and one day of birth and percentage who received a prelacteal feed, by background characteristics, Delhi, 2005-06
Percentage who started breastfeeding:
Background characteristic Percentage
ever breastfed Number of
childrenWithin half an hour of birth
Within one hour of birth1
Within one day of birth2
Percentagewho received a prelacteal
feed3
Number of last-born ever
breastfed children
Residence Urban 95.6 1,082 21.7 21.7 68.1 45.7 781 Slum 94.6 256 18.1 18.1 58.0 53.4 167 Non-slum 95.9 826 22.7 22.7 70.9 43.6 614 Rural 96.0 104 12.7 12.7 65.1 42.9 66
Sex Male 96.7 643 21.9 21.9 68.7 43.8 473 Female 94.2 543 19.9 19.9 66.8 47.5 374
Mother's education No education 94.7 372 16.9 16.9 57.2 52.6 241 <5 years complete (94.6) 29 * * * * 19 5-9 years complete 96.4 280 14.5 14.5 65.7 47.8 195 10 or more years complete 95.9 506 27.7 27.7 76.4 38.2 391
Religion Hindu 95.2 1,000 20.2 20.2 67.4 44.0 714 Muslim 97.0 143 29.9 29.9 67.0 55.6 93
Sikh (100.0) 33 * * * * 29 Other * 10 * * * * 9
Caste/tribe Scheduled caste 96.3 267 13.3 13.3 56.4 53.4 182 Scheduled tribe * 21 * * * * 14 Other backward class 95.4 184 18.5 18.5 59.7 54.2 123 Other 95.6 713 23.8 23.8 73.2 41.2 528
Assistance at delivery Health personnel4 95.9 760 25.6 25.6 76.8 36.7 576
Dai (TBA) 94.9 373 12.0 12.0 53.0 61.3 240 Other/no one 95.6 52 (5.7) (5.7) (17.2) (86.1) 31
Place of delivery Health facility 95.5 697 27.5 27.5 80.0 33.7 526 At home 95.6 487 10.6 10.6 48.0 64.6 318 Other * 2 * * * * 2
Wealth index Lowest * 2 * * * * 2 Second 100.0 57 12.9 12.9 55.5 59.7 36 Middle 92.4 154 11.6 11.6 48.7 57.3 97 Fourth 95.9 283 17.0 17.0 61.7 48.0 185 Highest 95.8 691 24.8 24.8 74.5 41.4 528
Total 95.6 1,186 21.0 21.0 67.9 45.5 847
Note: Table is based on children born in the last five years whether the children are living or dead at the time of interview. Total includes children with missing information on religion and assistance at delivery, who are not shown separately. TBA = Traditional birth attendant ( ) Based on 25-49 unweighted cases. * Percentage not shown; based on fewer than 25 unweighted cases. 1 Includes children who started breastfeeding within half an hour of birth. 2 Includes children who started breastfeeding within one hour of birth. 3 Children given something other than breast milk during the first three days of life. 4 Doctor, nurse, midwife, auxiliary nurse midwife, lady health visitor, or other health personnel.
Delhi.indd 79 3/19/09 12:51:26 PM
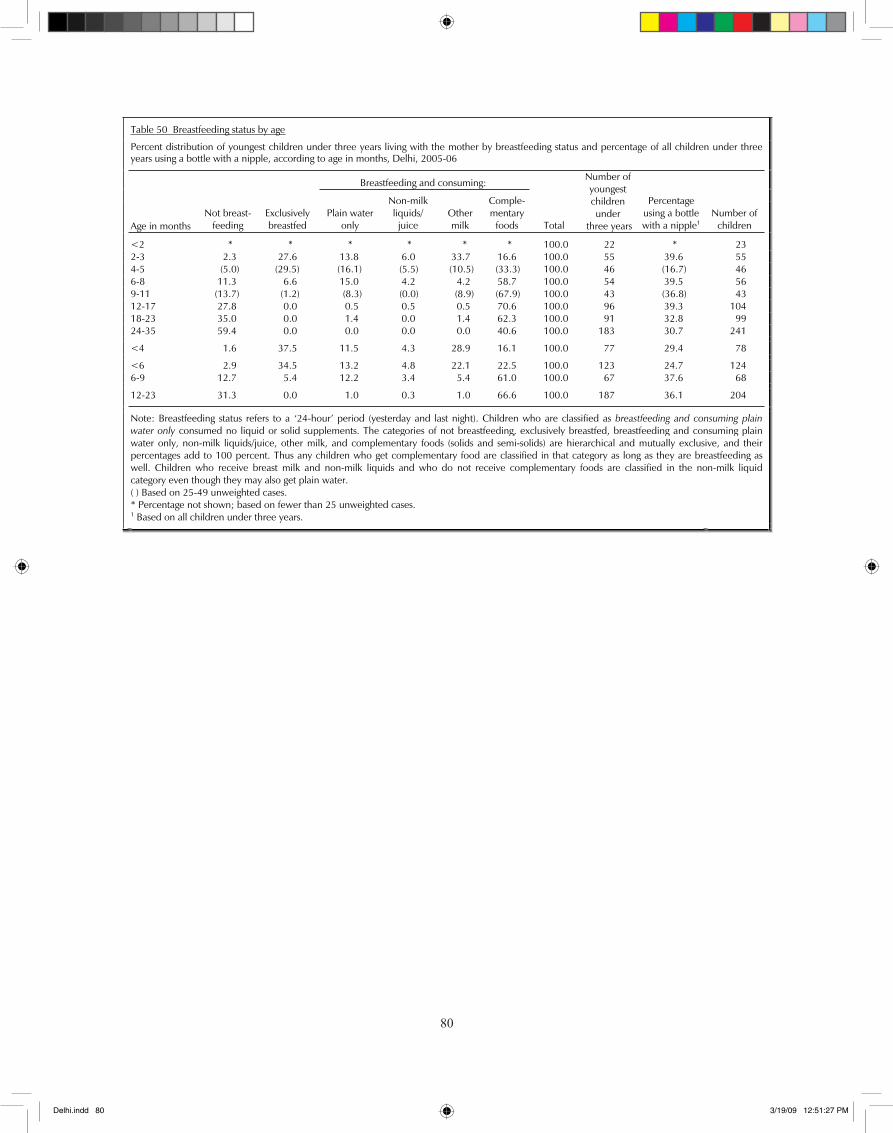
�0
80
Table 50 Breastfeeding status by age
Percent distribution of youngest children under three years living with the mother by breastfeeding status and percentage of all children under three years using a bottle with a nipple, according to age in months, Delhi, 2005-06
Breastfeeding and consuming:
Age in months Not breast-
feedingExclusivelybreastfed
Plain water only
Non-milkliquids/juice
Other milk
Comple-mentary
foods Total
Number of youngest childrenunder
three years
Percentageusing a bottle with a nipple1
Number of children
<2 * * * * * * 100.0 22 * 23 2-3 2.3 27.6 13.8 6.0 33.7 16.6 100.0 55 39.6 55 4-5 (5.0) (29.5) (16.1) (5.5) (10.5) (33.3) 100.0 46 (16.7) 46 6-8 11.3 6.6 15.0 4.2 4.2 58.7 100.0 54 39.5 56 9-11 (13.7) (1.2) (8.3) (0.0) (8.9) (67.9) 100.0 43 (36.8) 43 12-17 27.8 0.0 0.5 0.5 0.5 70.6 100.0 96 39.3 104 18-23 35.0 0.0 1.4 0.0 1.4 62.3 100.0 91 32.8 99 24-35 59.4 0.0 0.0 0.0 0.0 40.6 100.0 183 30.7 241
<4 1.6 37.5 11.5 4.3 28.9 16.1 100.0 77 29.4 78
<6 2.9 34.5 13.2 4.8 22.1 22.5 100.0 123 24.7 124 6-9 12.7 5.4 12.2 3.4 5.4 61.0 100.0 67 37.6 68
12-23 31.3 0.0 1.0 0.3 1.0 66.6 100.0 187 36.1 204
Note: Breastfeeding status refers to a ‘24-hour’ period (yesterday and last night). Children who are classified as breastfeeding and consuming plainwater only consumed no liquid or solid supplements. The categories of not breastfeeding, exclusively breastfed, breastfeeding and consuming plain water only, non-milk liquids/juice, other milk, and complementary foods (solids and semi-solids) are hierarchical and mutually exclusive, and their percentages add to 100 percent. Thus any children who get complementary food are classified in that category as long as they are breastfeeding as well. Children who receive breast milk and non-milk liquids and who do not receive complementary foods are classified in the non-milk liquidcategory even though they may also get plain water. ( ) Based on 25-49 unweighted cases. * Percentage not shown; based on fewer than 25 unweighted cases. 1 Based on all children under three years.
Delhi.indd 80 3/19/09 12:51:27 PM
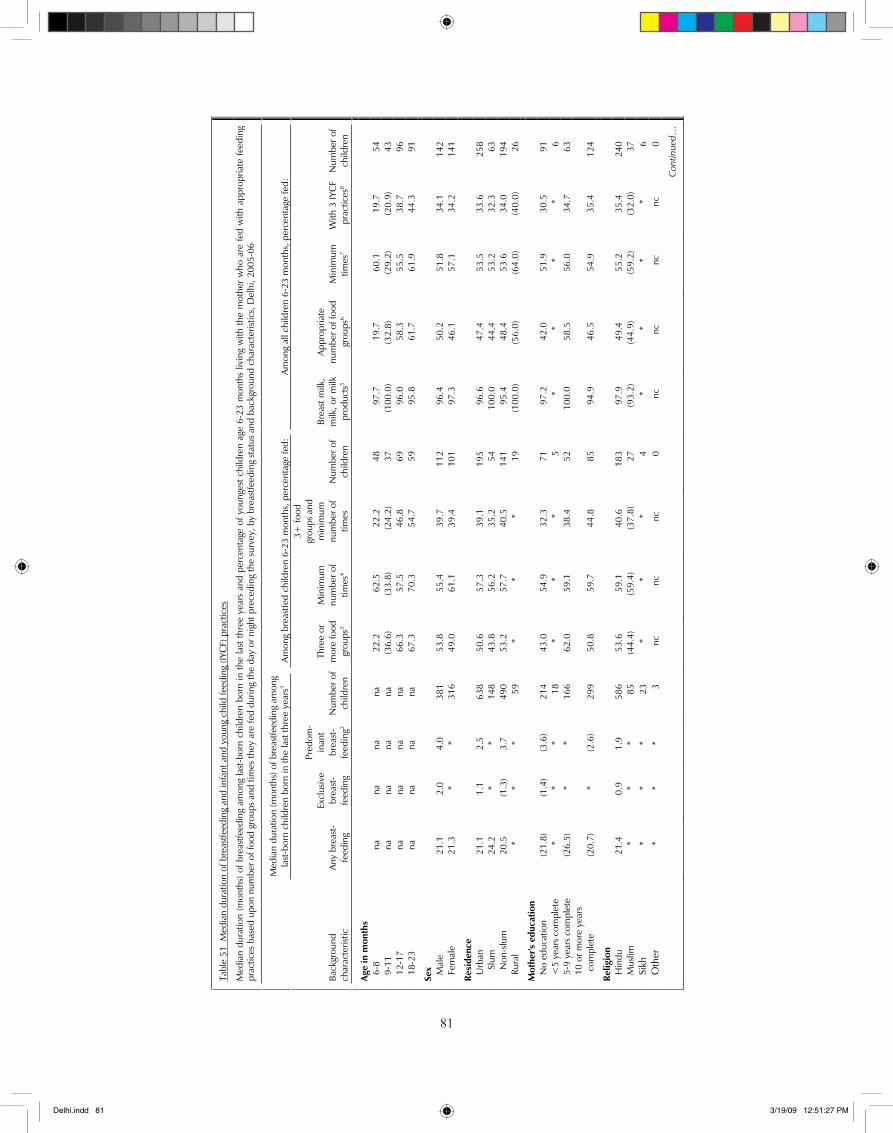
��
81
Ta
ble
51 M
edia
n du
ratio
n of
bre
astfe
edin
g an
d in
fant
and
you
ng c
hild
feed
ing
(IYC
F) p
ract
ices
Med
ian
dura
tion
(mon
ths)
of b
reas
tfeed
ing
amon
g la
st-b
orn
child
ren
born
in th
e la
st th
ree
year
s an
d pe
rcen
tage
of y
oung
est c
hild
ren
age
6-23
mon
ths
livin
g w
ith th
e m
othe
r w
ho a
re fe
d w
ith a
ppro
pria
te fe
edin
gpr
actic
es b
ased
upo
n nu
mbe
r of f
ood
grou
ps a
nd ti
mes
they
are
fed
durin
g th
e da
y or
nig
ht p
rece
ding
the
surv
ey, b
y br
east
feed
ing
stat
us a
nd b
ackg
roun
d ch
arac
teris
tics,
Del
hi, 2
005-
06
Med
ian
dura
tion
(mon
ths)
of b
reas
tfeed
ing
amon
gla
st-b
orn
child
ren
born
in th
e la
st th
ree
year
s1Am
ong
brea
stfe
d ch
ildre
n 6-
23 m
onth
s, p
erce
ntag
e fe
d:
Amon
g al
l chi
ldre
n 6-
23 m
onth
s, p
erce
ntag
e fe
d:
Back
grou
nd
char
acte
ristic
Any
brea
st-
feed
ing
Excl
usiv
ebr
east
-fe
edin
g
Pred
om-
inan
tbr
east
-fe
edin
g2N
umbe
r of
child
ren
Thre
e or
m
ore
food
gr
oups
3
Min
imum
nu
mbe
r of
times
4
3+ fo
od
grou
ps a
nd
min
imum
nu
mbe
r of
times
Num
ber o
f ch
ildre
n
Brea
st m
ilk,
milk
, or m
ilk
prod
ucts
5
Appr
opria
tenu
mbe
r of f
ood
grou
ps6
Min
imum
tim
es7
With
3 IY
CF
prac
tices
8N
umbe
r of
child
ren
Age
in m
onth
s
6-
8
na
na
na
na
22.2
62
.5
22.2
48
97
.7
19.7
60
.1
19.7
54
9-11
na
na
na
na
(3
6.6)
(3
3.8)
(2
4.2)
37
(1
00.0
) (3
2.8)
(2
9.2)
(2
0.9)
43
12-1
7
na
na
na
na
66.3
57
.5
46.8
69
96
.0
58.3
55
.5
38.7
96
18-2
3
na
na
na
na
67.3
70
.3
54.7
59
95
.8
61.7
61
.9
44.3
91
Sex
M
ale
21
.1
2.0
4.
0
381
53
.8
55.4
39
.7
112
96
.4
50.2
51
.8
34.1
14
2
Fe
mal
e
21.3
*
* 31
6
49.0
61
.1
39.4
10
1
97.3
46
.1
57.1
34
.2
141
Resi
denc
e
Urb
an
21.1
1.
1
2.5
63
8
50.6
57
.3
39.1
19
5
96.6
47
.4
53.5
33
.6
258
Slu
m
24.2
*
* 14
8 43
.8
56.2
35
.2
54
100.
0
44.4
53
.2
32.3
63
Non
-slu
m
20.5
(1
.3)
3.7
49
0 53
.2
57.7
40
.5
141
95.4
48
.4
53.6
34
.0
194
Ru
ral
*
* *
59
* *
* 19
(1
00.0
) (5
6.0)
(6
4.0)
(4
0.0)
26
Mot
her's
edu
catio
n
N
o ed
ucat
ion
(2
1.8)
(1
.4)
(3.6
) 21
4
43.0
54
.9
32.3
71
97
.2
42.0
51
.9
30.5
91
<5
year
s co
mpl
ete
*
* *
18
* *
* 5
*
* *
* 6
5-9
year
s co
mpl
ete
(2
6.5)
*
* 16
6
62.0
59
.1
38.4
52
10
0.0
58
.5
56.0
34
.7
63
10 o
r mor
e ye
ars
com
plet
e
( 20.
7)
*
(2.6
) 29
9
50.8
59
.7
44.8
85
94
.9
46.5
54
.9
35.4
12
4
Relig
ion
Hin
du
21.4
0.
9
1.9
58
6
53.6
59
.1
40.6
18
3
97.9
49
.4
55.2
35
.4
240
Mus
lim
*
* *
85
(44.
4)
(59.
4)
(37.
8)
27
(93.
2)
(44.
9)
(59.
2)
(32.
0)
37
Sikh
* *
* 23
*
* *
4
* *
* *
6
Oth
er*
* *
3
nc
nc
nc
0
nc
nc
nc
nc
0
C
ontin
ued…
Delhi.indd 81 3/19/09 12:51:27 PM
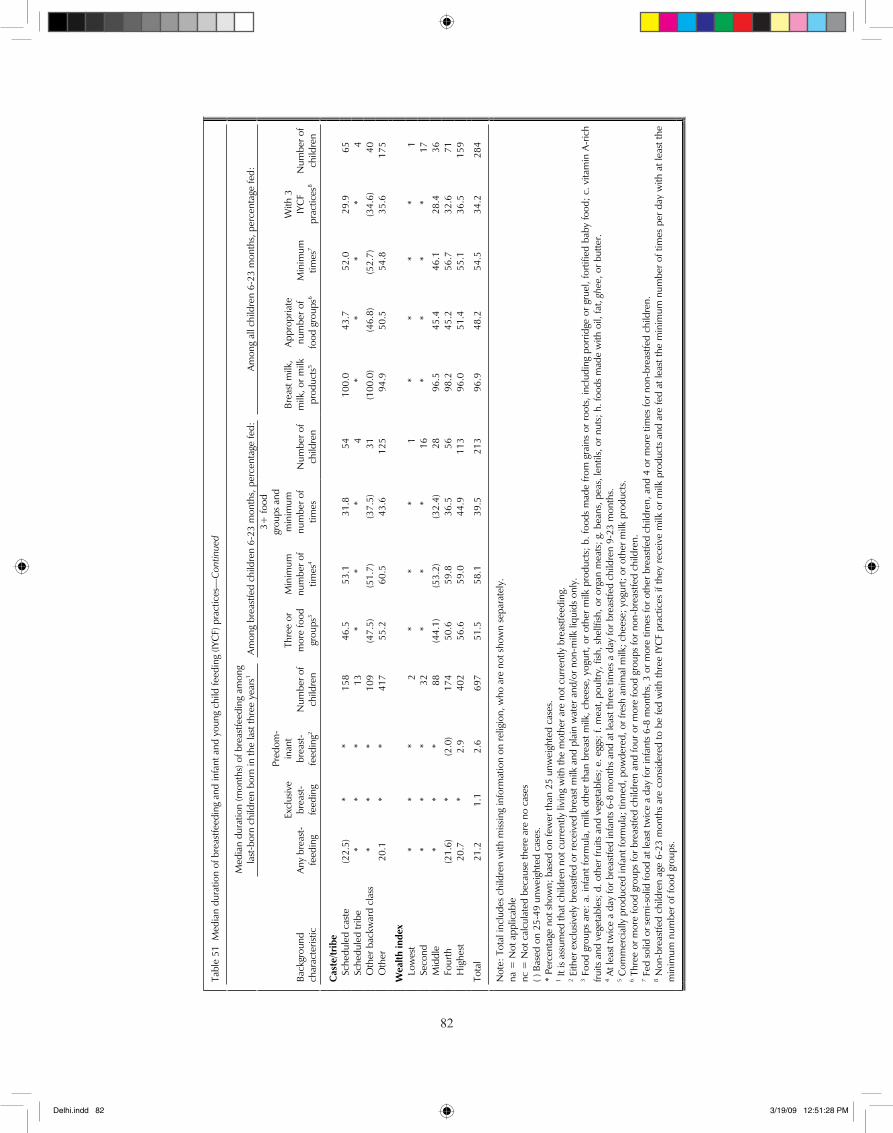
��
82
Ta
ble
51 M
edia
n du
ratio
n of
bre
astfe
edin
g an
d in
fant
and
you
ng c
hild
feed
ing
(IYC
F) p
ract
ices
—C
ontin
ued
Med
ian
dura
tion
(mon
ths)
of b
reas
tfeed
ing
amon
g la
st-b
orn
child
ren
born
in th
e la
st th
ree
year
s1 Am
ong
brea
stfe
d ch
ildre
n 6-
23 m
onth
s, p
erce
ntag
e fe
d:A
mon
g al
l chi
ldre
n 6-
23 m
onth
s, p
erce
ntag
e fe
d:
Back
grou
nd
char
acte
ristic
Any
brea
st-
feed
ing
Excl
usiv
ebr
east
-fe
edin
g
Pred
om-
inan
tbr
east
-fe
edin
g2N
umbe
r of
child
ren
Thre
e or
m
ore
food
gr
oups
3
Min
imum
nu
mbe
r of
times
4
3+ fo
od
grou
ps a
nd
min
imum
nu
mbe
r of
times
Num
ber o
f ch
ildre
n
Brea
st m
ilk,
milk
, or m
ilk
prod
ucts
5
App
ropr
iate
num
ber o
f fo
od g
roup
s6M
inim
um
times
7
With
3
IYC
Fpr
actic
es8
Num
ber o
f ch
ildre
n
Cas
te/tr
ibe
Sche
dule
d ca
ste
(2
2.5)
*
*
158
46
.5
53.1
31
.8
54
100.
0
43.7
52
.0
29.9
65
Sche
dule
d tri
be
* *
* 13
*
* *
4
* *
* *
4
O
ther
bac
kwar
d cl
ass
*
*
*
109
(4
7.5)
(5
1.7)
(3
7.5)
31
(1
00.0
) (4
6.8)
(5
2.7)
(3
4.6)
40
Oth
er
20.1
*
* 41
7
55.2
60
.5
43.6
12
5
94.9
50
.5
54.8
35
.6
175
Wea
lth in
dex
Low
est
* *
* 2
*
* *
1
* *
* *
1
Se
cond
*
* *
32
*
* *
16
* *
* *
17
M
iddl
e
* *
* 88
(4
4.1)
(5
3.2)
(3
2.4)
28
96
.5
45.4
46
.1
28.4
36
Four
th
(21.
6)
* (2
.0)
174
50
.6
59.8
36
.5
56
98.2
45
.2
56.7
32
.6
71
H
ighe
st
20.7
*
2.9
40
2
56.6
59
.0
44.9
11
3
96.0
51
.4
55.1
36
.5
159
To
tal
21.2
1.
1 2.
6 69
7 51
.5
58.1
39
.5
213
96.9
48
.2
54.5
34
.2
284
Not
e: T
otal
incl
udes
chi
ldre
n w
ith m
issin
g in
form
atio
n on
relig
ion,
who
are
not
sho
wn
sepa
rate
ly.
na =
Not
app
licab
le
nc =
Not
cal
cula
ted
beca
use
ther
e ar
e no
cas
es
( ) B
ased
on
25-4
9 un
wei
ghte
d ca
ses.
*
Perc
enta
ge n
ot s
how
n; b
ased
on
few
er th
an 2
5 un
wei
ghte
d ca
ses.
1 It
is a
ssum
ed th
at c
hild
ren
not c
urre
ntly
livi
ng w
ith th
e m
othe
r are
not
cur
rent
ly b
reas
tfeed
ing.
2 E
ither
exc
lusiv
ely
brea
stfe
d or
rece
ived
bre
ast m
ilk a
nd p
lain
wat
er a
nd/o
r non
-milk
liqu
ids
only
. 3 F
ood
grou
ps a
re:
a. in
fant
form
ula,
milk
oth
er th
an b
reas
t milk
, che
ese,
yog
urt,
or o
ther
milk
pro
duct
s; b
. foo
ds m
ade
from
gra
ins
or r
oots
, inc
ludi
ng p
orrid
ge o
r gr
uel,
forti
fied
baby
food
; c.
vita
min
A-r
ich
fruits
and
veg
etab
les;
d. o
ther
frui
ts a
nd v
eget
able
s; e
. egg
s; f.
mea
t, po
ultry
, fish
, she
llfish
, or o
rgan
mea
ts; g
. bea
ns, p
eas,
lent
ils, o
r nut
s; h
. foo
ds m
ade
with
oil,
fat,
ghee
, or b
utte
r. 4 A
t lea
st tw
ice
a da
y fo
r bre
astfe
d in
fant
s 6-
8 m
onth
s an
d at
leas
t thr
ee ti
mes
a d
ay fo
r bre
astfe
d ch
ildre
n 9-
23 m
onth
s.
5 Com
mer
cial
ly p
rodu
ced
infa
nt fo
rmul
a; ti
nned
, pow
dere
d, o
r fre
sh a
nim
al m
ilk; c
hees
e; y
ogur
t; or
oth
er m
ilk p
rodu
cts.
6 T
hree
or m
ore
food
gro
ups
for b
reas
tfed
child
ren
and
four
or m
ore
food
gro
ups
for n
on-b
reas
tfed
child
ren.
7 F
ed s
olid
or s
emi-s
olid
food
at l
east
twic
e a
day
for i
nfan
ts 6
-8 m
onth
s, 3
or m
ore
times
for o
ther
bre
astfe
d ch
ildre
n, a
nd 4
or m
ore
times
for n
on-b
reas
tfed
child
ren.
8 N
on-b
reas
tfed
child
ren
age
6-23
mon
ths
are
cons
ider
ed to
be
fed
with
thre
e IY
CF
prac
tices
if th
ey r
ecei
ve m
ilk o
r m
ilk p
rodu
cts
and
are
fed
at le
ast t
he m
inim
um n
umbe
r of
tim
es p
er d
ay w
ith a
t lea
st th
e m
inim
um n
umbe
r of f
ood
grou
ps.
Delhi.indd 82 3/19/09 12:51:28 PM
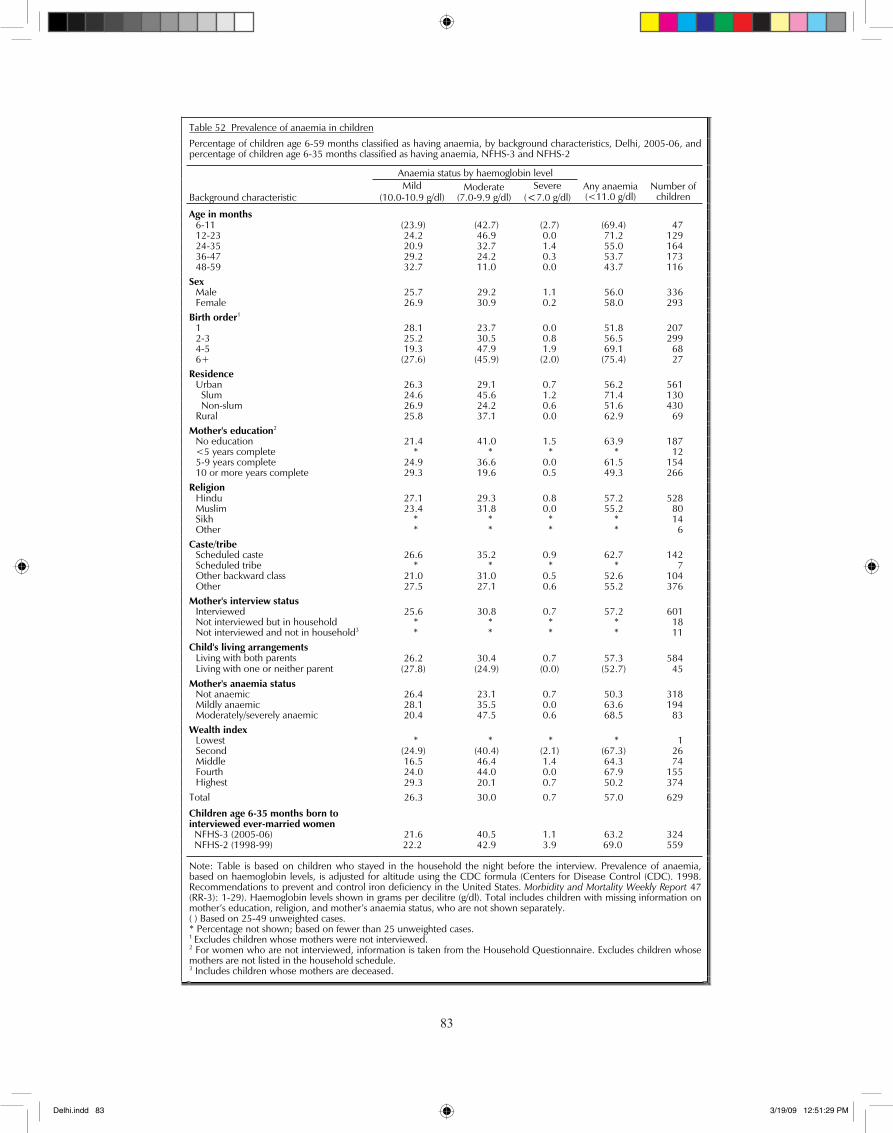
��
83
Table 52 Prevalence of anaemia in children
Percentage of children age 6-59 months classified as having anaemia, by background characteristics, Delhi, 2005-06, and percentage of children age 6-35 months classified as having anaemia, NFHS-3 and NFHS-2
Anaemia status by haemoglobin level
Background characteristic Mild
(10.0-10.9 g/dl)Moderate
(7.0-9.9 g/dl)Severe
(<7.0 g/dl) Any anaemia (<11.0 g/dl)
Number of children
Age in months 6-11 (23.9) (42.7) (2.7) (69.4) 47 12-23 24.2 46.9 0.0 71.2 129 24-35 20.9 32.7 1.4 55.0 164 36-47 29.2 24.2 0.3 53.7 173 48-59 32.7 11.0 0.0 43.7 116
Sex Male 25.7 29.2 1.1 56.0 336 Female 26.9 30.9 0.2 58.0 293
Birth order1 1 28.1 23.7 0.0 51.8 207 2-3 25.2 30.5 0.8 56.5 299 4-5 19.3 47.9 1.9 69.1 68 6+ (27.6) (45.9) (2.0) (75.4) 27
Residence Urban 26.3 29.1 0.7 56.2 561 Slum 24.6 45.6 1.2 71.4 130 Non-slum 26.9 24.2 0.6 51.6 430 Rural 25.8 37.1 0.0 62.9 69
Mother's education2 No education 21.4 41.0 1.5 63.9 187 <5 years complete * * * * 12 5-9 years complete 24.9 36.6 0.0 61.5 154 10 or more years complete 29.3 19.6 0.5 49.3 266
Religion Hindu 27.1 29.3 0.8 57.2 528 Muslim 23.4 31.8 0.0 55.2 80 Sikh * * * * 14 Other * * * * 6
Caste/tribe Scheduled caste 26.6 35.2 0.9 62.7 142 Scheduled tribe * * * * 7 Other backward class 21.0 31.0 0.5 52.6 104 Other 27.5 27.1 0.6 55.2 376
Mother's interview status Interviewed 25.6 30.8 0.7 57.2 601 Not interviewed but in household * * * * 18 Not interviewed and not in household3 * * * * 11
Child's living arrangements Living with both parents 26.2 30.4 0.7 57.3 584 Living with one or neither parent (27.8) (24.9) (0.0) (52.7) 45
Mother's anaemia status Not anaemic 26.4 23.1 0.7 50.3 318 Mildly anaemic 28.1 35.5 0.0 63.6 194 Moderately/severely anaemic 20.4 47.5 0.6 68.5 83
Wealth index Lowest * * * * 1 Second (24.9) (40.4) (2.1) (67.3) 26 Middle 16.5 46.4 1.4 64.3 74 Fourth 24.0 44.0 0.0 67.9 155
Highest 29.3 20.1 0.7 50.2 374
Total 26.3 30.0 0.7 57.0 629
Children age 6-35 months born to interviewed ever-married women
NFHS-3 (2005-06) 21.6 40.5 1.1 63.2 324 NFHS-2 (1998-99) 22.2 42.9 3.9 69.0 559
Note: Table is based on children who stayed in the household the night before the interview. Prevalence of anaemia, based on haemoglobin levels, is adjusted for altitude using the CDC formula (Centers for Disease Control (CDC). 1998. Recommendations to prevent and control iron deficiency in the United States. Morbidity and Mortality Weekly Report 47 (RR-3): 1-29). Haemoglobin levels shown in grams per decilitre (g/dl). Total includes children with missing information on mother’s education, religion, and mother’s anaemia status, who are not shown separately. ( ) Based on 25-49 unweighted cases. * Percentage not shown; based on fewer than 25 unweighted cases. 1 Excludes children whose mothers were not interviewed. 2 For women who are not interviewed, information is taken from the Household Questionnaire. Excludes children whose mothers are not listed in the household schedule. 3 Includes children whose mothers are deceased.
Delhi.indd 83 3/19/09 12:51:29 PM
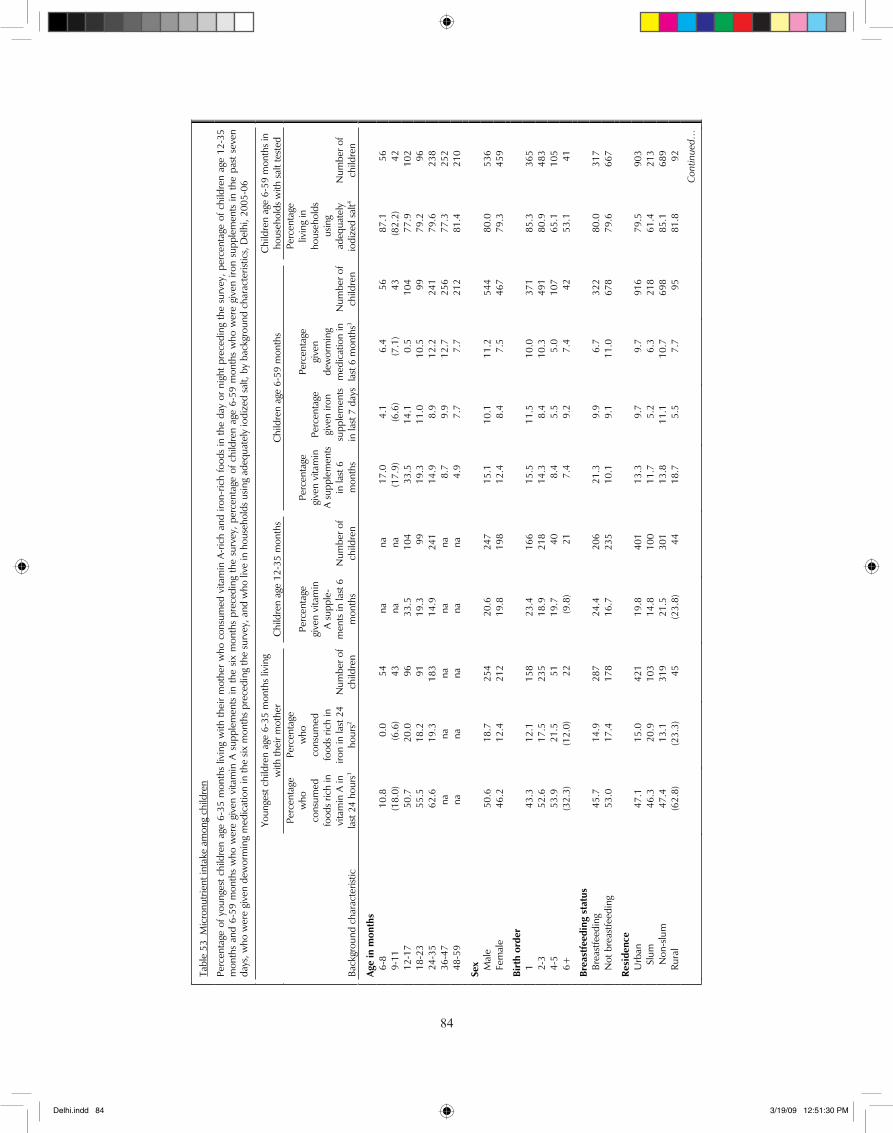
��
84
Tab
le 5
3 M
icro
nutri
ent i
ntak
e am
ong
child
ren
Perc
enta
ge o
f you
nges
t chi
ldre
n ag
e 6-
35 m
onth
s liv
ing
with
thei
r m
othe
r w
ho c
onsu
med
vita
min
A-r
ich
and
iron-
rich
food
s in
the
day
or n
ight
pre
cedi
ng th
e su
rvey
, per
cent
age
of c
hild
ren
age
12-3
5 m
onth
s an
d 6-
59 m
onth
s w
ho w
ere
give
n vi
tam
in A
sup
plem
ents
in t
he s
ix m
onth
s pr
eced
ing
the
surv
ey, p
erce
ntag
e of
chi
ldre
n ag
e 6-
59 m
onth
s w
ho w
ere
give
n iro
n su
pple
men
ts in
the
pas
t se
ven
days
, who
wer
e gi
ven
dew
orm
ing
med
icat
ion
in th
e six
mon
ths
prec
edin
g th
e su
rvey
, and
who
live
in h
ouse
hold
s us
ing
adeq
uate
ly io
dize
d sa
lt, b
y ba
ckgr
ound
cha
ract
erist
ics,
Del
hi, 2
005-
06
Youn
gest
chi
ldre
n ag
e 6-
35 m
onth
s liv
ing
with
thei
r mot
her
Chi
ldre
n ag
e 12
-35
mon
ths
Chi
ldre
n ag
e 6-
59 m
onth
s C
hild
ren
age
6-59
mon
ths
in
hous
ehol
ds w
ith s
alt t
este
d
Bac
kgro
und
char
acte
ristic
Perc
enta
ge
who
cons
umed
food
s ric
h in
vi
tam
in A
in
last
24
hour
s1
Perc
enta
gew
hoco
nsum
edfo
ods
rich
in
iron
in la
st 2
4 ho
urs2
Num
ber o
f ch
ildre
n
Perc
enta
gegi
ven
vita
min
A
sup
ple-
m
ents
in la
st 6
m
onth
s N
umbe
r of
child
ren
Perc
enta
gegi
ven
vita
min
A
supp
lem
ents
in
last
6
mon
ths
Perc
enta
gegi
ven
iron
supp
lem
ents
in
last
7 d
ays
Perc
enta
gegi
ven
dew
orm
ing
med
icat
ion
in
last
6 m
onth
s3N
umbe
r of
child
ren
Perc
enta
geliv
ing
in
hous
ehol
ds
usin
g ad
equa
tely
iodi
zed
salt4
Num
ber o
f ch
ildre
n
Age
in m
onth
s
6-
8
10.8
0.
0
54
na
na
17.0
4.
1
6.4
56
87
.1
56
9-
11
(18.
0)
(6.6
) 43
na
na
(1
7.9)
(6
.6)
(7.1
) 43
(8
2.2)
42
12-1
7
50.7
20
.0
96
33.5
10
4
33.5
14
.1
0.5
10
4
77.9
10
2
18
-23
55
.5
18.2
91
19
.3
99
19.3
11
.0
10.5
99
79
.2
96
24
-35
62
.6
19.3
18
3
14.9
24
1
14.9
8.
9
12.2
24
1
79.6
23
8
36
-47
na
na
na
na
na
8.
7
9.9
12
.7
256
77
.3
252
48-5
9
na
na
na
na
na
4.9
7.
7
7.7
21
2
81.4
21
0
Sex
M
ale
50
.6
18.7
25
4
20.6
24
7
15.1
10
.1
11.2
54
4
80.0
53
6
Fe
mal
e
46.2
12
.4
212
19
.8
198
12
.4
8.4
7.
5
467
79
.3
459
Birt
h or
der
1
43.3
12
.1
158
23
.4
166
15
.5
11.5
10
.0
371
85
.3
365
2-3
52
.6
17.5
23
5
18.9
21
8
14.3
8.
4
10.3
49
1
80.9
48
3
4-
5
53.9
21
.5
51
19.7
40
8.
4
5.5
5.
0
107
65
.1
105
6+
(32.
3)
(12.
0)
22
(9.8
) 21
7.
4
9.2
7.
4
42
53.1
41
Brea
stfe
edin
g st
atus
Br
east
feed
ing
45
.7
14.9
28
7
24.4
20
6
21.3
9.
9
6.7
32
2
80.0
31
7
N
ot b
reas
tfeed
ing
53
.0
17.4
17
8
16.7
23
5
10.1
9.
1
11.0
67
8
79.6
66
7
Resi
denc
e
U
rban
47
.1
15.0
42
1
19.8
40
1
13.3
9.
7
9.7
91
6
79.5
90
3
S
lum
46
.3
20.9
10
3 14
.8
100
11.7
5.
2
6.3
21
8 61
.4
213
Non
-slu
m
47.4
13
.1
319
21.5
30
1 13
.8
11.1
10
.7
698
85.1
68
9 Ru
ral
(62.
8)
(23.
3)
45
(23.
8)
44
18.7
5.
5
7.7
95
81
.8
92
C
ontin
ued…
Delhi.indd 84 3/19/09 12:51:30 PM
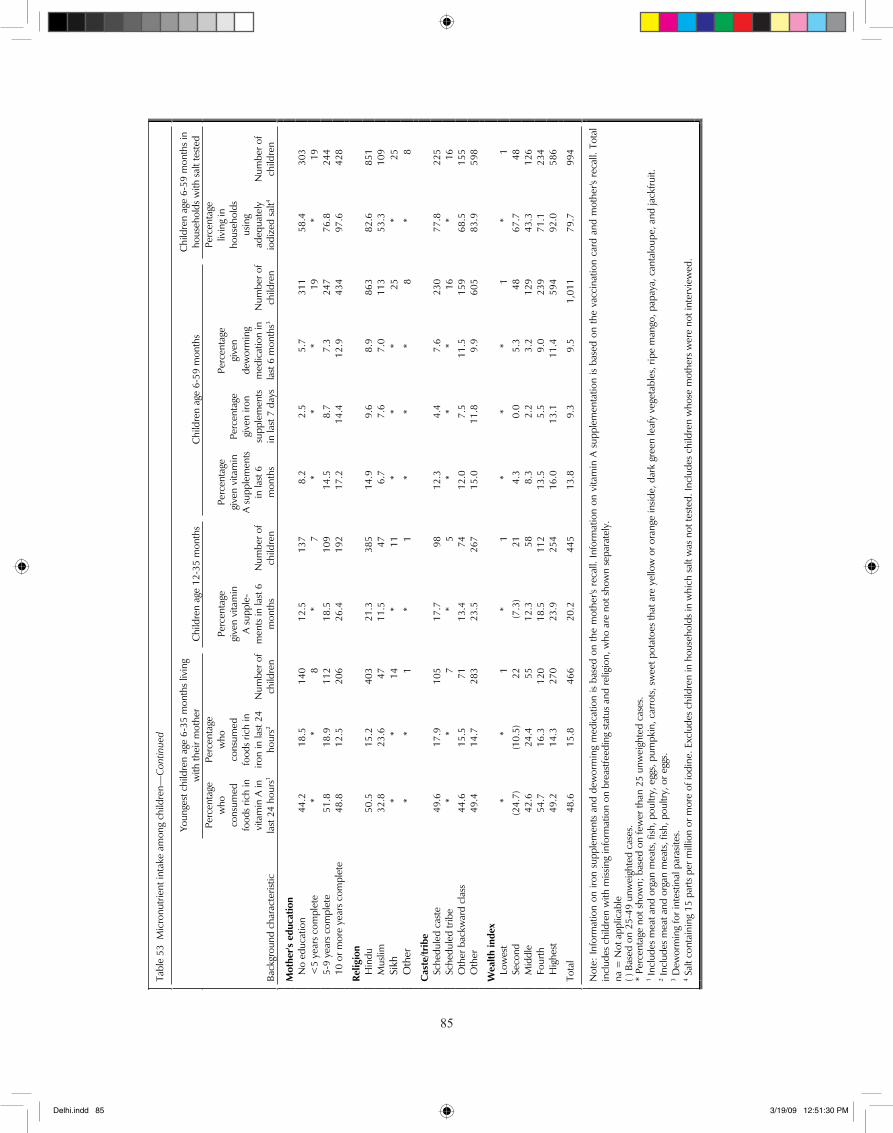
��
85
Tab
le 5
3 M
icro
nutri
ent i
ntak
e am
ong
child
ren—
Con
tinue
d
Youn
gest
chi
ldre
n ag
e 6-
35 m
onth
s liv
ing
with
thei
r mot
her
Chi
ldre
n ag
e 12
-35
mon
ths
Chi
ldre
n ag
e 6-
59 m
onth
s C
hild
ren
age
6-59
mon
ths
in
hous
ehol
ds w
ith s
alt t
este
d
Bac
kgro
und
char
acte
ristic
Perc
enta
ge
who
cons
umed
food
s ric
h in
vi
tam
in A
in
last
24
hour
s1
Perc
enta
gew
hoco
nsum
edfo
ods
rich
in
iron
in la
st 2
4 ho
urs2
Num
ber o
f ch
ildre
n
Perc
enta
gegi
ven
vita
min
A
sup
ple-
m
ents
in la
st 6
m
onth
s N
umbe
r of
child
ren
Perc
enta
gegi
ven
vita
min
A
supp
lem
ents
in
last
6
mon
ths
Perc
enta
gegi
ven
iron
supp
lem
ents
in
last
7 d
ays
Perc
enta
gegi
ven
dew
orm
ing
med
icat
ion
in
last
6 m
onth
s3N
umbe
r of
child
ren
Perc
enta
geliv
ing
in
hous
ehol
ds
usin
g ad
equa
tely
iodi
zed
salt4
Num
ber o
f ch
ildre
n
Mot
her's
edu
catio
n
N
o ed
ucat
ion
44
.2
18.5
14
0
12.5
13
7
8.2
2.
5
5.7
31
1
58.4
30
3
<
5 ye
ars
com
plet
e
* *
8
*
7
* *
* 19
*
19
5-
9 ye
ars
com
plet
e
51.8
18
.9
112
18
.5
109
14
.5
8.7
7.
3
247
76
.8
244
10 o
r mor
e ye
ars
com
plet
e
48.8
12
.5
206
26
.4
192
17
.2
14.4
12
.9
434
97
.6
428
Relig
ion
Hin
du
50.5
15
.2
403
21
.3
385
14
.9
9.6
8.
9
863
82
.6
851
Mus
lim
32.8
23
.6
47
11.5
47
6.
7
7.6
7.
0
113
53
.3
109
Si
kh*
* 14
*
11
* *
* 25
*
25
Oth
er*
* 1
*
1
* *
* 8
*
8
Cas
te/tr
ibe
Sche
dule
d ca
ste
49
.6
17.9
10
5
17.7
98
12
.3
4.4
7.
6
230
77
.8
225
Sche
dule
d tri
be
* *
7
* 5
*
* *
16
* 16
Oth
er b
ackw
ard
clas
s
44.6
15
.5
71
13.4
74
12
.0
7.5
11
.5
159
68
.5
155
Oth
er
49.4
14
.7
283
23
.5
267
15
.0
11.8
9.
9
605
83
.9
598
Wea
lth in
dex
Low
est
* *
1
* 1
*
* *
1
* 1
Seco
nd
(24.
7)
(10.
5)
22
(7.3
) 21
4.
3
0.0
5.
3
48
67.7
48
Mid
dle
42
.6
24.4
55
12
.3
58
8.3
2.
2
3.2
12
9
43.3
12
6
Fo
urth
54
.7
16.3
12
0
18.5
11
2
13.5
5.
5
9.0
23
9
71.1
23
4
H
ighe
st
49.2
14
.3
270
23
.9
254
16
.0
13.1
11
.4
594
92
.0
586
Tot
al
48.6
15
.8
466
20.2
44
5 13
.8
9.3
9.5
1,01
1 79
.7
994
Not
e: In
form
atio
n on
iron
sup
plem
ents
and
dew
orm
ing
med
icat
ion
is ba
sed
on th
e m
othe
r's r
ecal
l. In
form
atio
n on
vita
min
A s
uppl
emen
tatio
n is
base
d on
the
vacc
inat
ion
card
and
mot
her's
rec
all.
Tota
l in
clud
es c
hild
ren
with
miss
ing
info
rmat
ion
on b
reas
tfeed
ing
stat
us a
nd re
ligio
n, w
ho a
re n
ot s
how
n se
para
tely
. na
= N
ot a
pplic
able
( )
Bas
ed o
n 25
-49
unw
eigh
ted
case
s.
* Pe
rcen
tage
not
sho
wn;
bas
ed o
n fe
wer
than
25
unw
eigh
ted
case
s.
1 Incl
udes
mea
t and
org
an m
eats
, fish
, pou
ltry,
egg
s, p
umpk
in, c
arro
ts, s
wee
t pot
atoe
s th
at a
re y
ello
w o
r ora
nge
insid
e, d
ark
gree
n le
afy
vege
tabl
es, r
ipe
man
go, p
apay
a, c
anta
loup
e, a
nd ja
ckfru
it.
2 Incl
udes
mea
t and
org
an m
eats
, fish
, pou
ltry,
or e
ggs.
3 D
ewor
min
g fo
r int
estin
al p
aras
ites.
4 S
alt c
onta
inin
g 15
par
ts p
er m
illio
n or
mor
e of
iodi
ne. E
xclu
des
child
ren
in h
ouse
hold
s in
whi
ch s
alt w
as n
ot te
sted
. Inc
lude
s ch
ildre
n w
hose
mot
hers
wer
e no
t int
ervi
ewed
.
Delhi.indd 85 3/19/09 12:51:30 PM
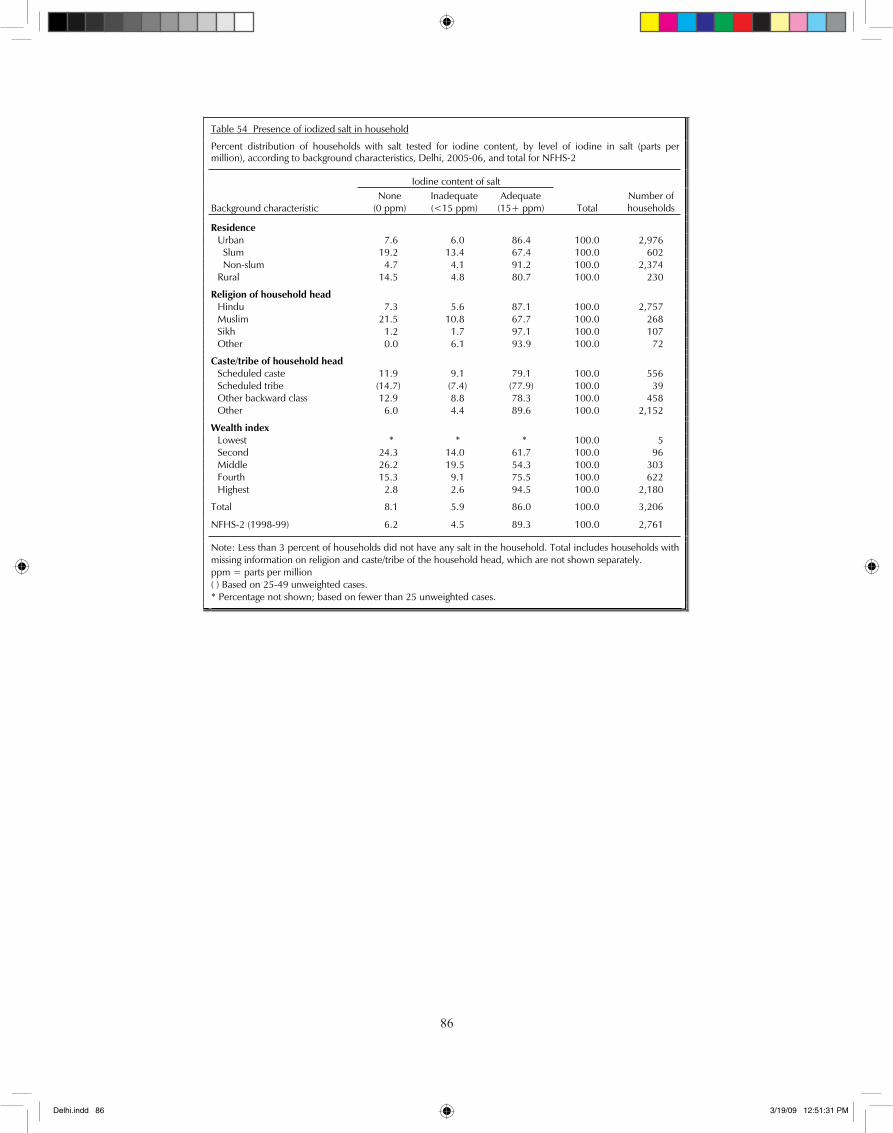
��
86
Table 54 Presence of iodized salt in household
Percent distribution of households with salt tested for iodine content, by level of iodine in salt (parts per million), according to background characteristics, Delhi, 2005-06, and total for NFHS-2
Iodine content of salt
Background characteristic None
(0 ppm) Inadequate (<15 ppm)
Adequate(15+ ppm) Total
Number of households
Residence Urban 7.6 6.0 86.4 100.0 2,976 Slum 19.2 13.4 67.4 100.0 602 Non-slum 4.7 4.1 91.2 100.0 2,374 Rural 14.5 4.8 80.7 100.0 230
Religion of household head Hindu 7.3 5.6 87.1 100.0 2,757 Muslim 21.5 10.8 67.7 100.0 268 Sikh 1.2 1.7 97.1 100.0 107 Other 0.0 6.1 93.9 100.0 72
Caste/tribe of household head Scheduled caste 11.9 9.1 79.1 100.0 556 Scheduled tribe (14.7) (7.4) (77.9) 100.0 39 Other backward class 12.9 8.8 78.3 100.0 458 Other 6.0 4.4 89.6 100.0 2,152
Wealth index Lowest * * * 100.0 5 Second 24.3 14.0 61.7 100.0 96 Middle 26.2 19.5 54.3 100.0 303 Fourth 15.3 9.1 75.5 100.0 622 Highest 2.8 2.6 94.5 100.0 2,180
Total 8.1 5.9 86.0 100.0 3,206
NFHS-2 (1998-99) 6.2 4.5 89.3 100.0 2,761
Note: Less than 3 percent of households did not have any salt in the household. Total includes households with missing information on religion and caste/tribe of the household head, which are not shown separately. ppm = parts per million( ) Based on 25-49 unweighted cases. * Percentage not shown; based on fewer than 25 unweighted cases.
Delhi.indd 86 3/19/09 12:51:31 PM
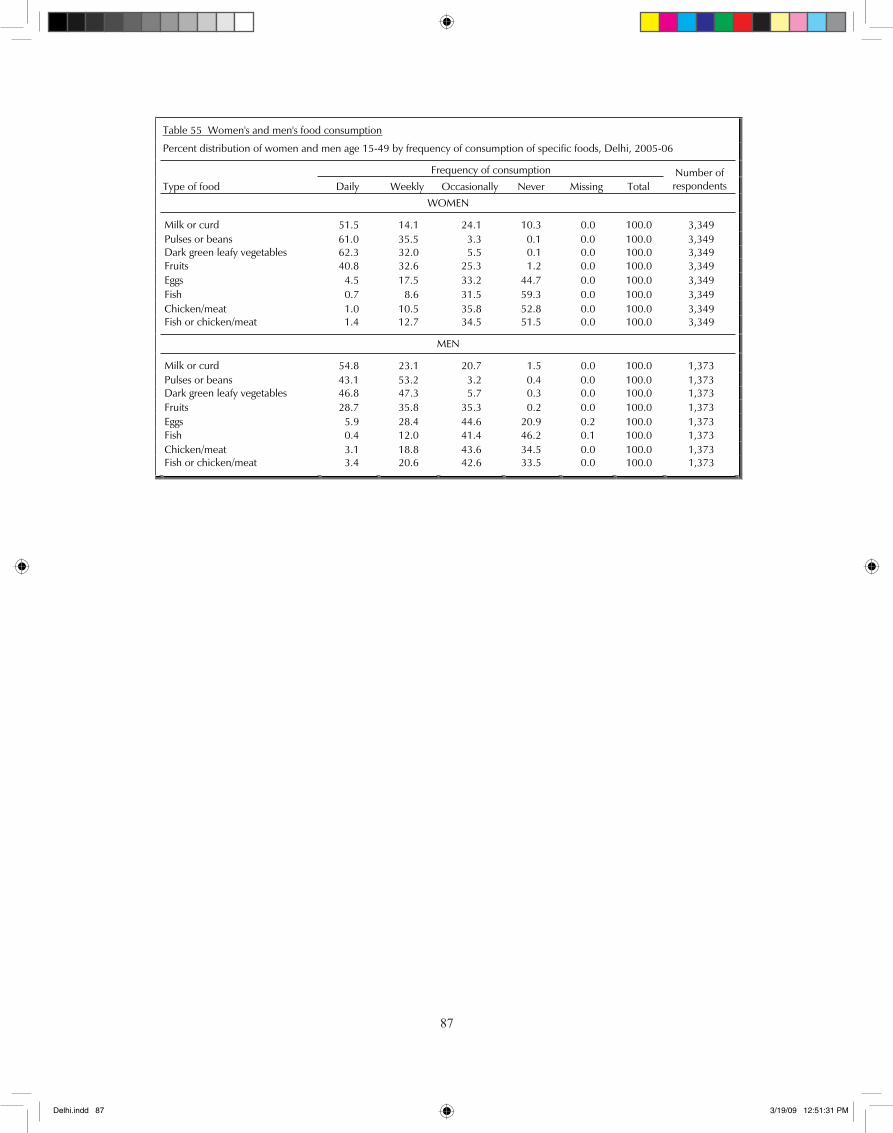
��
87
Table 55 Women's and men's food consumption
Percent distribution of women and men age 15-49 by frequency of consumption of specific foods, Delhi, 2005-06
Frequency of consumption
Type of food Daily Weekly Occasionally Never Missing Total Number of respondents
WOMEN
Milk or curd 51.5 14.1 24.1 10.3 0.0 100.0 3,349 Pulses or beans 61.0 35.5 3.3 0.1 0.0 100.0 3,349 Dark green leafy vegetables 62.3 32.0 5.5 0.1 0.0 100.0 3,349 Fruits 40.8 32.6 25.3 1.2 0.0 100.0 3,349 Eggs 4.5 17.5 33.2 44.7 0.0 100.0 3,349 Fish 0.7 8.6 31.5 59.3 0.0 100.0 3,349 Chicken/meat 1.0 10.5 35.8 52.8 0.0 100.0 3,349 Fish or chicken/meat 1.4 12.7 34.5 51.5 0.0 100.0 3,349
MEN
Milk or curd 54.8 23.1 20.7 1.5 0.0 100.0 1,373 Pulses or beans 43.1 53.2 3.2 0.4 0.0 100.0 1,373 Dark green leafy vegetables 46.8 47.3 5.7 0.3 0.0 100.0 1,373 Fruits 28.7 35.8 35.3 0.2 0.0 100.0 1,373 Eggs 5.9 28.4 44.6 20.9 0.2 100.0 1,373 Fish 0.4 12.0 41.4 46.2 0.1 100.0 1,373 Chicken/meat 3.1 18.8 43.6 34.5 0.0 100.0 1,373 Fish or chicken/meat 3.4 20.6 42.6 33.5 0.0 100.0 1,373
Delhi.indd 87 3/19/09 12:51:31 PM
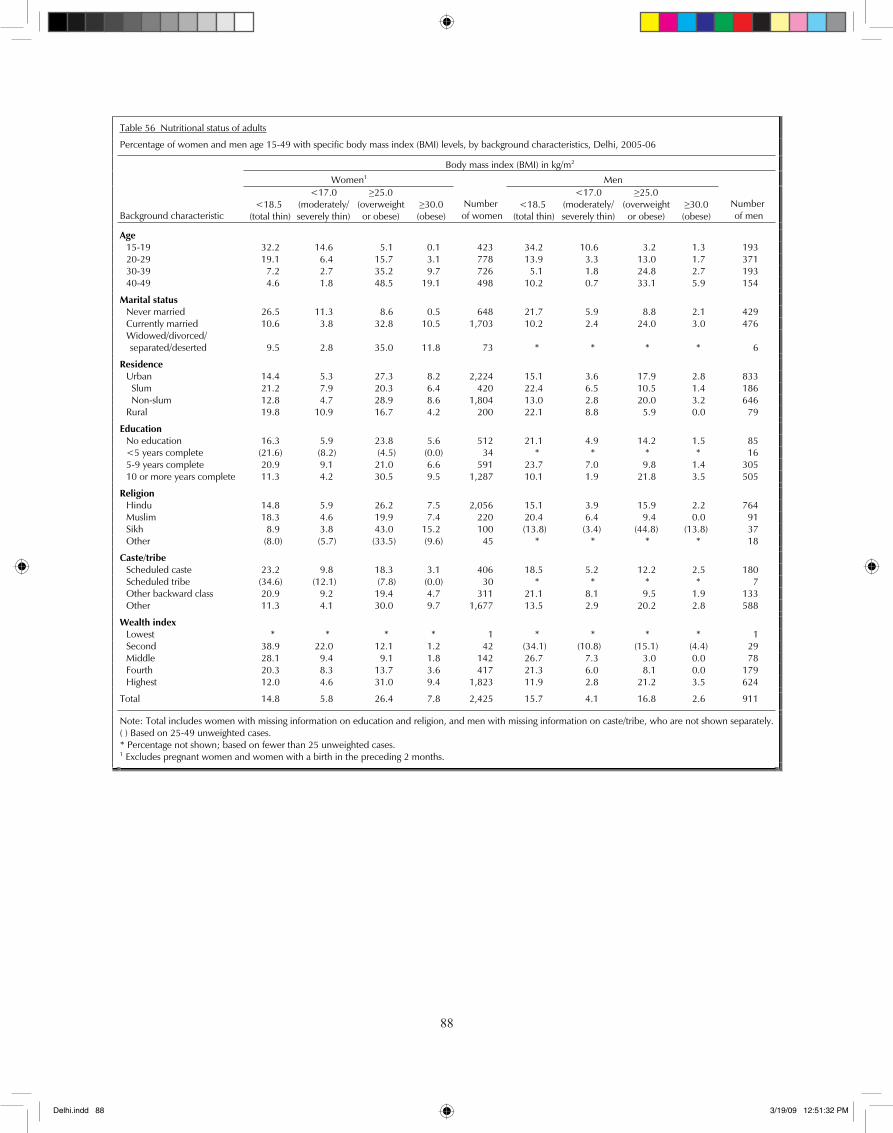
��
88
Table 56 Nutritional status of adults
Percentage of women and men age 15-49 with specific body mass index (BMI) levels, by background characteristics, Delhi, 2005-06
Body mass index (BMI) in kg/m2
Women1 Men
Background characteristic <18.5
(total thin)
<17.0(moderately/ severely thin)
25.0(overweight or obese)
30.0(obese)
Number of women
<18.5 (total thin)
<17.0(moderately/ severely thin)
25.0(overweight or obese)
30.0(obese)
Number of men
Age 15-19 32.2 14.6 5.1 0.1 423 34.2 10.6 3.2 1.3 193 20-29 19.1 6.4 15.7 3.1 778 13.9 3.3 13.0 1.7 371 30-39 7.2 2.7 35.2 9.7 726 5.1 1.8 24.8 2.7 193 40-49 4.6 1.8 48.5 19.1 498 10.2 0.7 33.1 5.9 154
Marital status Never married 26.5 11.3 8.6 0.5 648 21.7 5.9 8.8 2.1 429 Currently married 10.6 3.8 32.8 10.5 1,703 10.2 2.4 24.0 3.0 476
Widowed/divorced/ separated/deserted 9.5 2.8 35.0 11.8 73 * * * * 6
Residence Urban 14.4 5.3 27.3 8.2 2,224 15.1 3.6 17.9 2.8 833 Slum 21.2 7.9 20.3 6.4 420 22.4 6.5 10.5 1.4 186 Non-slum 12.8 4.7 28.9 8.6 1,804 13.0 2.8 20.0 3.2 646 Rural 19.8 10.9 16.7 4.2 200 22.1 8.8 5.9 0.0 79
Education No education 16.3 5.9 23.8 5.6 512 21.1 4.9 14.2 1.5 85 <5 years complete (21.6) (8.2) (4.5) (0.0) 34 * * * * 16 5-9 years complete 20.9 9.1 21.0 6.6 591 23.7 7.0 9.8 1.4 305 10 or more years complete 11.3 4.2 30.5 9.5 1,287 10.1 1.9 21.8 3.5 505
Religion Hindu 14.8 5.9 26.2 7.5 2,056 15.1 3.9 15.9 2.2 764 Muslim 18.3 4.6 19.9 7.4 220 20.4 6.4 9.4 0.0 91 Sikh 8.9 3.8 43.0 15.2 100 (13.8) (3.4) (44.8) (13.8) 37 Other (8.0) (5.7) (33.5) (9.6) 45 * * * * 18
Caste/tribe Scheduled caste 23.2 9.8 18.3 3.1 406 18.5 5.2 12.2 2.5 180 Scheduled tribe (34.6) (12.1) (7.8) (0.0) 30 * * * * 7 Other backward class 20.9 9.2 19.4 4.7 311 21.1 8.1 9.5 1.9 133 Other 11.3 4.1 30.0 9.7 1,677 13.5 2.9 20.2 2.8 588
Wealth index Lowest * * * * 1 * * * * 1 Second 38.9 22.0 12.1 1.2 42 (34.1) (10.8) (15.1) (4.4) 29 Middle 28.1 9.4 9.1 1.8 142 26.7 7.3 3.0 0.0 78 Fourth 20.3 8.3 13.7 3.6 417 21.3 6.0 8.1 0.0 179 Highest 12.0 4.6 31.0 9.4 1,823 11.9 2.8 21.2 3.5 624
Total 14.8 5.8 26.4 7.8 2,425 15.7 4.1 16.8 2.6 911
Note: Total includes women with missing information on education and religion, and men with missing information on caste/tribe, who are not shown separately.( ) Based on 25-49 unweighted cases. * Percentage not shown; based on fewer than 25 unweighted cases. 1 Excludes pregnant women and women with a birth in the preceding 2 months.
Delhi.indd 88 3/19/09 12:51:32 PM
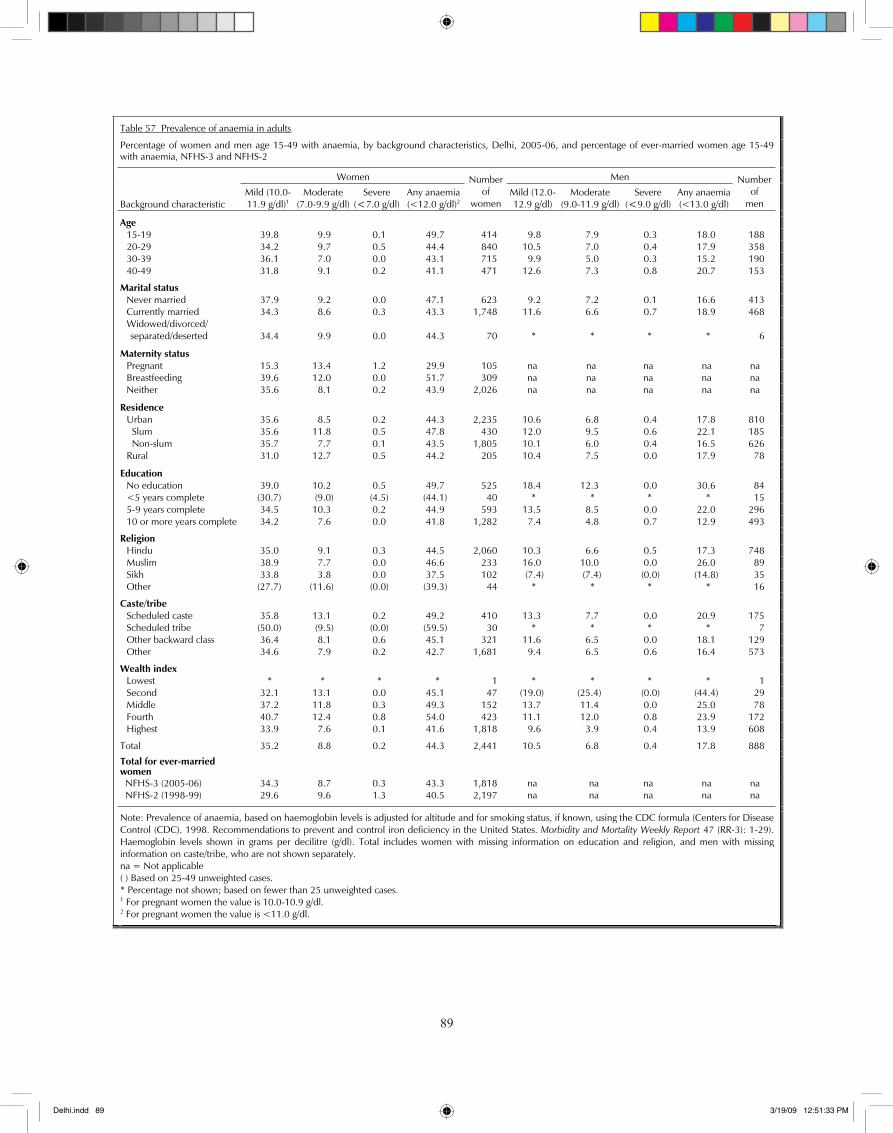
��
89
Table 57 Prevalence of anaemia in adults
Percentage of women and men age 15-49 with anaemia, by background characteristics, Delhi, 2005-06, and percentage of ever-married women age 15-49 with anaemia, NFHS-3 and NFHS-2
Women Men
Background characteristic Mild (10.0-11.9 g/dl)1
Moderate(7.0-9.9 g/dl)
Severe(<7.0 g/dl)
Any anaemia (<12.0 g/dl)2
Numberof
womenMild (12.0-12.9 g/dl)
Moderate(9.0-11.9 g/dl)
Severe(<9.0 g/dl)
Any anaemia (<13.0 g/dl)
Numberof
men
Age 15-19 39.8 9.9 0.1 49.7 414 9.8 7.9 0.3 18.0 188 20-29 34.2 9.7 0.5 44.4 840 10.5 7.0 0.4 17.9 358 30-39 36.1 7.0 0.0 43.1 715 9.9 5.0 0.3 15.2 190 40-49 31.8 9.1 0.2 41.1 471 12.6 7.3 0.8 20.7 153
Marital status Never married 37.9 9.2 0.0 47.1 623 9.2 7.2 0.1 16.6 413 Currently married 34.3 8.6 0.3 43.3 1,748 11.6 6.6 0.7 18.9 468
Widowed/divorced/ separated/deserted 34.4 9.9 0.0 44.3 70 * * * * 6
Maternity status Pregnant 15.3 13.4 1.2 29.9 105 na na na na na Breastfeeding 39.6 12.0 0.0 51.7 309 na na na na na Neither 35.6 8.1 0.2 43.9 2,026 na na na na na
Residence Urban 35.6 8.5 0.2 44.3 2,235 10.6 6.8 0.4 17.8 810 Slum 35.6 11.8 0.5 47.8 430 12.0 9.5 0.6 22.1 185 Non-slum 35.7 7.7 0.1 43.5 1,805 10.1 6.0 0.4 16.5 626 Rural 31.0 12.7 0.5 44.2 205 10.4 7.5 0.0 17.9 78
Education No education 39.0 10.2 0.5 49.7 525 18.4 12.3 0.0 30.6 84 <5 years complete (30.7) (9.0) (4.5) (44.1) 40 * * * * 15 5-9 years complete 34.5 10.3 0.2 44.9 593 13.5 8.5 0.0 22.0 296 10 or more years complete 34.2 7.6 0.0 41.8 1,282 7.4 4.8 0.7 12.9 493
Religion Hindu 35.0 9.1 0.3 44.5 2,060 10.3 6.6 0.5 17.3 748 Muslim 38.9 7.7 0.0 46.6 233 16.0 10.0 0.0 26.0 89 Sikh 33.8 3.8 0.0 37.5 102 (7.4) (7.4) (0.0) (14.8) 35 Other (27.7) (11.6) (0.0) (39.3) 44 * * * * 16
Caste/tribe Scheduled caste 35.8 13.1 0.2 49.2 410 13.3 7.7 0.0 20.9 175 Scheduled tribe (50.0) (9.5) (0.0) (59.5) 30 * * * * 7 Other backward class 36.4 8.1 0.6 45.1 321 11.6 6.5 0.0 18.1 129 Other 34.6 7.9 0.2 42.7 1,681 9.4 6.5 0.6 16.4 573
Wealth index Lowest * * * * 1 * * * * 1 Second 32.1 13.1 0.0 45.1 47 (19.0) (25.4) (0.0) (44.4) 29 Middle 37.2 11.8 0.3 49.3 152 13.7 11.4 0.0 25.0 78 Fourth 40.7 12.4 0.8 54.0 423 11.1 12.0 0.8 23.9 172 Highest 33.9 7.6 0.1 41.6 1,818 9.6 3.9 0.4 13.9 608
Total 35.2 8.8 0.2 44.3 2,441 10.5 6.8 0.4 17.8 888
Total for ever-married women
NFHS-3 (2005-06) 34.3 8.7 0.3 43.3 1,818 na na na na na NFHS-2 (1998-99) 29.6 9.6 1.3 40.5 2,197 na na na na na
Note: Prevalence of anaemia, based on haemoglobin levels is adjusted for altitude and for smoking status, if known, using the CDC formula (Centers for Disease Control (CDC). 1998. Recommendations to prevent and control iron deficiency in the United States. Morbidity and Mortality Weekly Report 47 (RR-3): 1-29). Haemoglobin levels shown in grams per decilitre (g/dl). Total includes women with missing information on education and religion, and men with missinginformation on caste/tribe, who are not shown separately. na = Not applicable ( ) Based on 25-49 unweighted cases. * Percentage not shown; based on fewer than 25 unweighted cases. 1 For pregnant women the value is 10.0-10.9 g/dl.2 For pregnant women the value is <11.0 g/dl.
Delhi.indd 89 3/19/09 12:51:33 PM
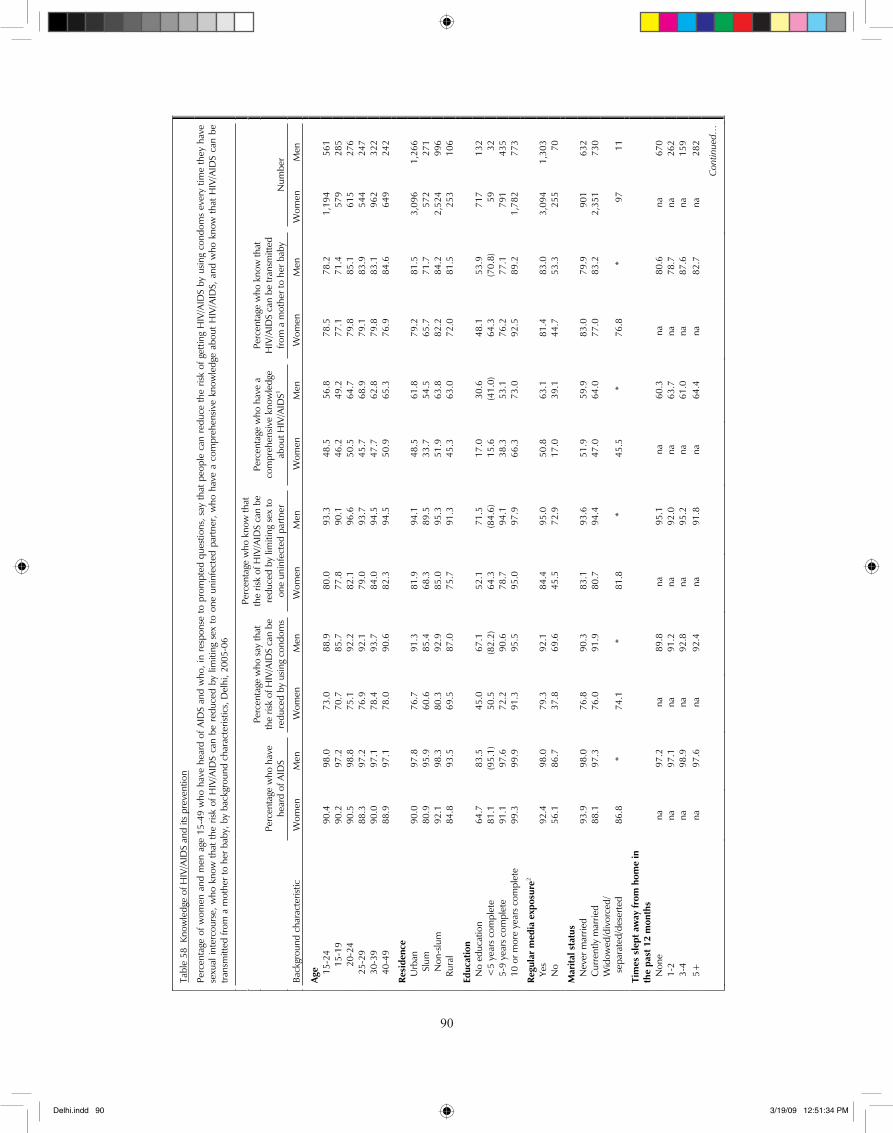
�0
90
Tab
le 5
8 K
now
ledg
e of
HIV
/AID
S an
d its
pre
vent
ion
Perc
enta
ge o
f wom
en a
nd m
en a
ge 1
5-49
who
hav
e he
ard
of A
IDS
and
who
, in
resp
onse
to
prom
pted
que
stio
ns, s
ay th
at p
eopl
e ca
n re
duce
the
risk
of g
ettin
g H
IV/A
IDS
by u
sing
cond
oms
ever
y tim
e th
ey h
ave
sexu
al in
terc
ours
e, w
ho k
now
tha
t th
e ris
k of
HIV
/AID
S ca
n be
red
uced
by
limiti
ng s
ex t
o on
e un
infe
cted
par
tner
, who
hav
e a
com
preh
ensiv
e kn
owle
dge
abou
t H
IV/A
IDS,
and
who
kno
w t
hat
HIV
/ AID
S ca
n be
tra
nsm
itted
from
a m
othe
r to
her b
aby,
by
back
grou
nd c
hara
cter
istic
s, D
elhi
, 200
5-06
Perc
enta
ge w
ho h
ave
hear
d of
AID
S
Perc
enta
ge w
ho s
ay th
at
the
risk
of H
IV/A
IDS
can
be
redu
ced
by u
sing
cond
oms
Perc
enta
ge w
ho k
now
that
th
e ris
k of
HIV
/AID
S ca
n be
re
duce
d by
lim
iting
sex
to
one
unin
fect
ed p
artn
er
Perc
enta
ge w
ho h
ave
a co
mpr
ehen
sive
know
ledg
e ab
out H
IV/A
IDS1
Perc
enta
ge w
ho k
now
that
H
IV/A
IDS
can
be tr
ansm
itted
fro
m a
mot
her t
o he
r bab
y N
umbe
r
Bac
kgro
und
char
acte
ristic
W
omen
M
en
Wom
en
Men
W
omen
M
en
Wom
en
Men
W
omen
M
en
Wom
en
Men
Age
1
5-24
90
.4
98.0
73
.0
88.9
80
.0
93.3
48
.5
56.8
78
.5
78.2
1,
194
56
1
15-
19
90.2
97
.2
70.7
85
.7
77.8
90
.1
46.2
49
.2
77.1
71
.4
579
28
5
20-
24
90.5
98
.8
75.1
92
.2
82.1
96
.6
50.5
64
.7
79.8
85
.1
615
27
6
2
5-29
88
.3
97.2
76
.9
92.1
79
.0
93.7
45
.7
68.9
79
.1
83.9
54
4
247
30-
39
90.0
97
.1
78.4
93
.7
84.0
94
.5
47.7
62
.8
79.8
83
.1
962
32
2
4
0-49
88
.9
97.1
78
.0
90.6
82
.3
94.5
50
.9
65.3
76
.9
84.6
64
9
242
Resi
denc
e
Urb
an
90.0
97
.8
76.7
91
.3
81.9
94
.1
48.5
61
.8
79.2
81
.5
3,09
6
1,26
6
S
lum
80
.9
95.9
60
.6
85.4
68
.3
89.5
33
.7
54.5
65
.7
71.7
57
2 27
1
Non
-slu
m
92.1
98
.3
80.3
92
.9
85.0
95
.3
51.9
63
.8
82.2
84
.2
2,52
4 99
6
Rura
l 84
.8
93.5
69
.5
87.0
75
.7
91.3
45
.3
63.0
72
.0
81.5
25
3
106
Educ
atio
n
N
o ed
ucat
ion
64
.7
83.5
45
.0
67.1
52
.1
71.5
17
.0
30.6
48
.1
53.9
71
7
132
<5
year
s co
mpl
ete
81.1
(9
5.1)
50
.5
(82.
2)
64.3
(8
4.6)
15
.6
(41.
0)
64.3
(7
0.8)
59
32
5-9
year
s co
mpl
ete
91
.1
97.6
72
.2
90.6
78
.7
94.1
38
.3
53.1
76
.2
77.1
79
1
435
10 o
r mor
e ye
ars
com
plet
e 99
.3
99.9
91
.3
95.5
95
.0
97.9
66
.3
73.0
92
.5
89.2
1,
782
77
3
Regu
lar
med
ia e
xpos
ure2
Ye
s
92.4
98
.0
79.3
92
.1
84.4
95
.0
50.8
63
.1
81.4
83
.0
3,09
4
1,30
3
N
o
56.1
86
.7
37.8
69
.6
45.5
72
.9
17.0
39
.1
44.7
53
.3
255
70
Mar
ital s
tatu
s
Nev
er m
arrie
d
93.9
98
.0
76.8
90
.3
83.1
93
.6
51.9
59
.9
83.0
79
.9
901
63
2
C
urre
ntly
mar
ried
88
.1
97.3
76
.0
91.9
80
.7
94.4
47
.0
64.0
77
.0
83.2
2,
351
73
0
Wid
owed
/div
orce
d/
sepa
rate
d/de
serte
d
86.8
*
74.1
*
81.8
*
45.5
*
76.8
*
97
11
Tim
es s
lept
aw
ay fr
om h
ome
in
the
past
12
mon
ths
N
one
na
97
.2
na
89.8
na
95
.1
na
60.3
na
80
.6
na
670
1-2
na
97
.1
na
91.2
na
92
.0
na
63.7
na
78
.7
na
262
3-4
na
98
.9
na
92.8
na
95
.2
na
61.0
na
87
.6
na
159
5+
na
97.6
na
92
.4
na
91.8
na
64
.4
na
82.7
na
28
2
Con
tinue
d…
Delhi.indd 90 3/19/09 12:51:34 PM
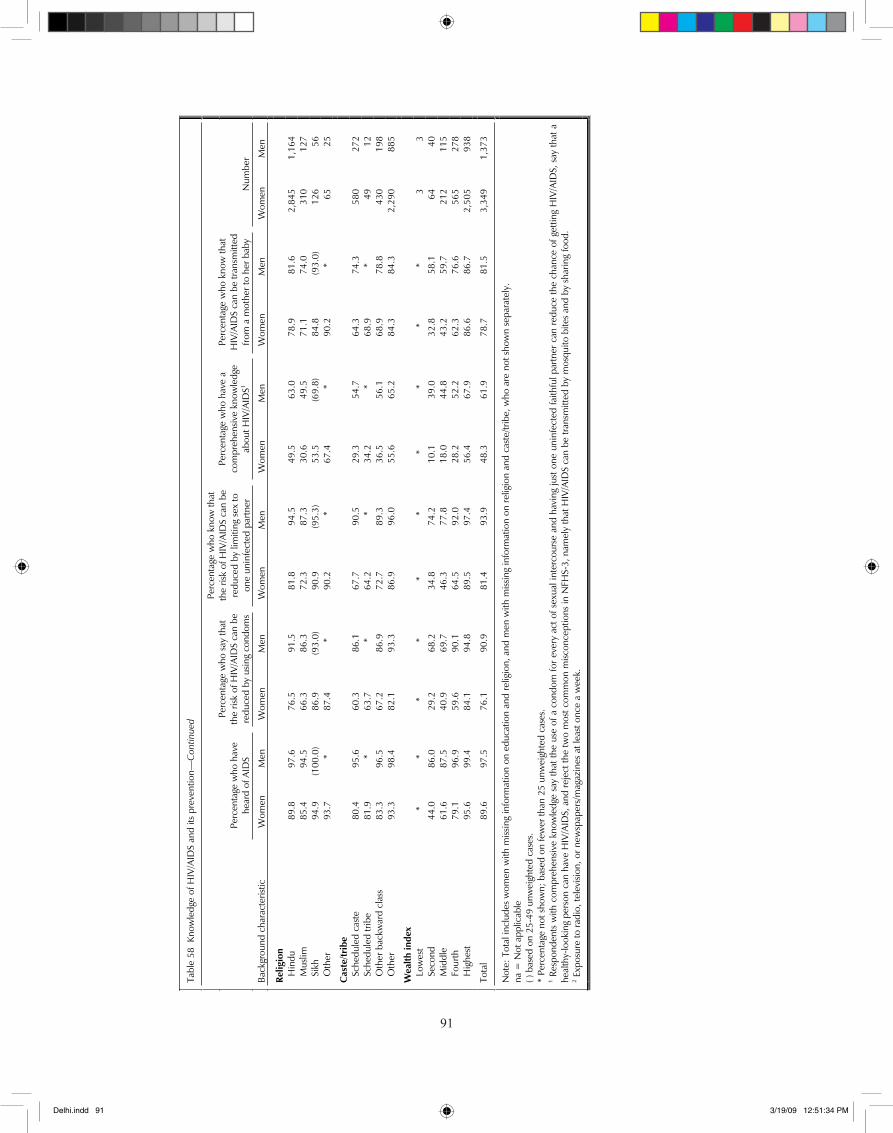
��
91
Tab
le 5
8 K
now
ledg
e of
HIV
/AID
S an
d its
pre
vent
ion—
Con
tinue
d
Perc
enta
ge w
ho h
ave
hear
d of
AID
S
Perc
enta
ge w
ho s
ay th
at
the
risk
of H
IV/ A
IDS
can
be
redu
ced
by u
sing
cond
oms
Perc
enta
ge w
ho k
now
that
th
e ris
k of
HIV
/AID
S ca
n be
re
duce
d by
lim
iting
sex
to
one
unin
fect
ed p
artn
er
Perc
enta
ge w
ho h
ave
a co
mpr
ehen
sive
know
ledg
e ab
out H
IV/A
IDS1
Perc
enta
ge w
ho k
now
that
H
IV/A
IDS
can
be tr
ansm
itted
fro
m a
mot
her t
o he
r bab
y N
umbe
r
Bac
kgro
und
char
acte
ristic
W
omen
M
en
Wom
en
Men
W
omen
M
en
Wom
en
Men
W
omen
M
en
Wom
en
Men
Relig
ion
Hin
du
89.8
97
.6
76.5
91
.5
81.8
94
.5
49.5
63
.0
78.9
81
.6
2,84
5
1,16
4
M
uslim
85
.4
94.5
66
.3
86.3
72
.3
87.3
30
.6
49.5
71
.1
74.0
31
0
127
Sikh
94
.9
(100
.0)
86.9
(9
3.0)
90
.9
(95.
3)
53.5
(6
9.8)
84
.8
(93.
0)
126
56
Oth
er
93.7
*
87.4
*
90.2
*
67
.4
* 90
.2
*
65
25
Cas
te/tr
ibe
Sc
hedu
led
cast
e
80.4
95
.6
60.3
86
.1
67.7
90
.5
29.3
54
.7
64.3
74
.3
580
27
2
Sc
hedu
led
tribe
81
.9
*
63.7
*
64
.2
*
34.2
*
68.9
*
49
12
O
ther
bac
kwar
d cl
ass
83
.3
96.5
67
.2
86.9
72
.7
89.3
36
.5
56.1
68
.9
78.8
43
0
198
Oth
er
93.3
98
.4
82.1
93
.3
86.9
96
.0
55.6
65
.2
84.3
84
.3
2,29
0
885
Wea
lth in
dex
Lo
wes
t
* *
* *
* *
* *
* *
3
3
Se
cond
44
.0
86.0
29
.2
68.2
34
.8
74.2
10
.1
39.0
32
.8
58.1
64
40
Mid
dle
61
.6
87.5
40
.9
69.7
46
.3
77.8
18
.0
44.8
43
.2
59.7
21
2
115
Four
th
79.1
96
.9
59.6
90
.1
64.5
92
.0
28.2
52
.2
62.3
76
.6
565
27
8
H
ighe
st
95.6
99
.4
84.1
94
.8
89.5
97
.4
56.4
67
.9
86.6
86
.7
2,50
5
938
Tot
al
89.6
97
.5
76.1
90
.9
81.4
93
.9
48.3
61
.9
78.7
81
.5
3,34
9 1,
373
Not
e: T
otal
incl
udes
wom
en w
ith m
issin
g in
form
atio
n on
edu
catio
n an
d re
ligio
n, a
nd m
en w
ith m
issin
g in
form
atio
n on
relig
ion
and
cast
e/tri
be, w
ho a
re n
ot s
how
n se
para
tely
. na
= N
ot a
pplic
able
( )
bas
ed o
n 25
-49
unw
eigh
ted
case
s.
* Pe
rcen
tage
not
sho
wn;
bas
ed o
n fe
wer
than
25
unw
eigh
ted
case
s.
1 Res
pond
ents
with
com
preh
ensiv
e kn
owle
dge
say
that
the
use
of a
con
dom
for
ever
y ac
t of s
exua
l int
erco
urse
and
hav
ing
just
one
uni
nfec
ted
faith
ful p
artn
er c
an r
educ
e th
e ch
ance
of g
ettin
g H
IV/A
IDS,
say
that
a
heal
thy-
look
ing
pers
on c
an h
ave
HIV
/AID
S, a
nd re
ject
the
two
mos
t com
mon
misc
once
ptio
ns in
NFH
S-3,
nam
ely
that
HIV
/AID
S ca
n be
tran
smitt
ed b
y m
osqu
ito b
ites
and
by s
harin
g fo
od.
2 Exp
osur
e to
radi
o, te
levi
sion,
or n
ewsp
aper
s/m
agaz
ines
at l
east
onc
e a
wee
k.
Delhi.indd 91 3/19/09 12:51:34 PM
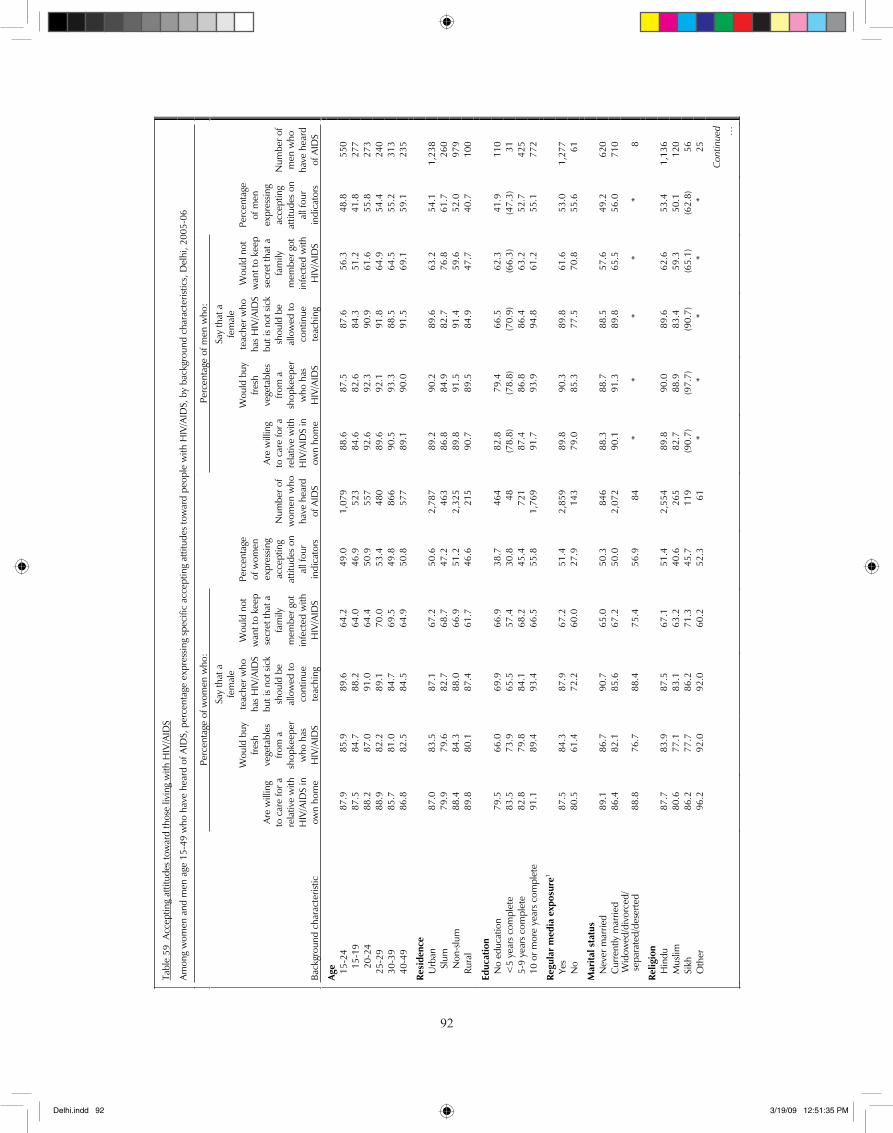
��
92
Tab
le 5
9 A
ccep
ting
attit
udes
tow
ard
thos
e liv
ing
with
HIV
/AID
S
Am
ong
wom
en a
nd m
en a
ge 1
5-49
who
hav
e he
ard
of A
IDS,
per
cent
age
expr
essin
g sp
ecifi
c ac
cept
ing
attit
udes
tow
ard
peop
le w
ith H
IV/A
IDS,
by
back
grou
nd c
hara
cter
istic
s, D
elhi
, 200
5-06
Pe
rcen
tage
of w
omen
who
:
Perc
enta
ge o
f men
who
:
Bac
kgro
und
char
acte
ristic
Are
will
ing
to c
are
for a
re
lativ
e w
ith
HIV
/AID
S in
ow
n ho
me
Wou
ld b
uy
fresh
ve
geta
bles
from
a
shop
keep
er
who
has
H
IV/A
IDS
Say
that
a
fem
ale
teac
her w
ho
has
HIV
/AID
S bu
t is
not s
ick
shou
ld b
e al
low
ed to
co
ntin
uete
achi
ng
Wou
ld n
ot
wan
t to
keep
se
cret
that
a
fam
ily
mem
ber g
ot
infe
cted
with
H
IV/A
IDS
Perc
enta
geof
wom
en
expr
essin
gac
cept
ing
attit
udes
on
all f
our
indi
cato
rs
Num
ber o
f w
omen
who
ha
ve h
eard
of
AID
S
Are
will
ing
to
car
e fo
r a
rela
tive
with
H
IV/A
IDS
in
own
hom
e
Wou
ld b
uy
fresh
ve
geta
bles
from
a
shop
keep
er
who
has
H
IV/A
IDS
Say
that
a
fem
ale
teac
her w
ho
has
HIV
/AID
S bu
t is
not s
ick
shou
ld b
e al
low
ed to
co
ntin
uete
achi
ng
Wou
ld n
ot
wan
t to
kee p
secr
et th
at a
fa
mily
m
embe
r got
in
fect
ed w
ith
HIV
/AID
S
Perc
enta
geof
men
ex
pres
sing
acce
ptin
gat
titud
es o
n al
l fou
r in
dica
tors
Num
ber o
f m
en w
ho
have
hea
rd
of A
IDS
Age
15-2
4
87.9
85
.9
89.6
64
.2
49.0
1,
079
88
.6
87.5
87
.6
56.3
48
.8
550
15-
19
87.5
84
.7
88.2
64
.0
46.9
52
3
84.6
82
.6
84.3
51
.2
41.8
27
7
2
0-24
88
.2
87.0
91
.0
64.4
50
.9
557
92
.6
92.3
90
.9
61.6
55
.8
273
25-2
9
88.9
82
.2
89.1
70
.0
53.4
48
0
89.6
92
.1
91.8
64
.9
54.4
24
0
30
-39
85
.7
81.0
84
.7
69.5
49
.8
866
90
.5
93.3
88
.5
64.5
55
.2
313
40-4
9
86.8
82
.5
84.5
64
.9
50.8
57
7
89.1
90
.0
91.5
69
.1
59.1
23
5
Resi
denc
e
Urb
an
87.0
83
.5
87.1
67
.2
50.6
2,
787
89
.2
90.2
89
.6
63.2
54
.1
1,23
8
S
lum
79
.9
79.6
82
.7
68.7
47
.2
463
86.8
84
.9
82.7
76
.8
61.7
26
0
N
on-s
lum
88
.4
84.3
88
.0
66.9
51
.2
2,32
5
89.8
91
.5
91.4
59
.6
52.0
97
9
Ru
ral
89.8
80
.1
87.4
61
.7
46.6
21
5
90.7
89
.5
84.9
47
.7
40.7
10
0
Educ
atio
n
No
educ
atio
n
79.5
66
.0
69.9
66
.9
38.7
46
4
82.8
79
.4
66.5
62
.3
41.9
11
0
<
5 ye
ars
com
plet
e 83
.5
73.9
65
.5
57.4
30
.8
48
(78.
8)
(78.
8)
(70.
9)
(66.
3)
(47.
3)
31
5-
9 ye
ars
com
plet
e
82.8
79
.8
84.1
68
.2
45.4
72
1
87.4
86
.8
86.4
63
.2
52.7
42
5
10
or m
ore
year
s co
mpl
ete
91.1
89
.4
93.4
66
.5
55.8
1,
769
91
.7
93.9
94
.8
61.2
55
.1
772
Regu
lar
med
ia e
xpos
ure1
Ye
s
87.5
84
.3
87.9
67
.2
51.4
2,
859
89
.8
90.3
89
.8
61.6
53
.0
1,27
7
N
o
80.5
61
.4
72.2
60
.0
27.9
14
3
79.0
85
.3
77.5
70
.8
55.6
61
Mar
ital s
tatu
s
Nev
er m
arrie
d
89.1
86
.7
90.7
65
.0
50.3
84
6
88.3
88
.7
88.5
57
.6
49.2
62
0
C
urre
ntly
mar
ried
86
.4
82.1
85
.6
67.2
50
.0
2,07
2
90.1
91
.3
89.8
65
.5
56.0
71
0
W
idow
ed/d
ivor
ced/
sepa
rate
d/de
serte
d
88.8
76
.7
88.4
75
.4
56.9
84
*
* *
* *
8
Relig
ion
H
indu
87
.7
83.9
87
.5
67.1
51
.4
2,55
4
89.8
90
.0
89.6
62
.6
53.4
1,
136
Mus
lim
80.6
77
.1
83.1
63
.2
40.6
26
5
82.7
88
.9
83.4
59
.3
50.1
12
0
Si
kh
86.2
77
.7
86.2
71
.3
45.7
11
9
(90.
7)
(97.
7)
(90.
7)
(65.
1)
(62.
8)
56
O
ther
96
.2
92.0
92
.0
60.2
52
.3
61
* *
* *
* 25
Con
tinue
d …
Delhi.indd 92 3/19/09 12:51:35 PM
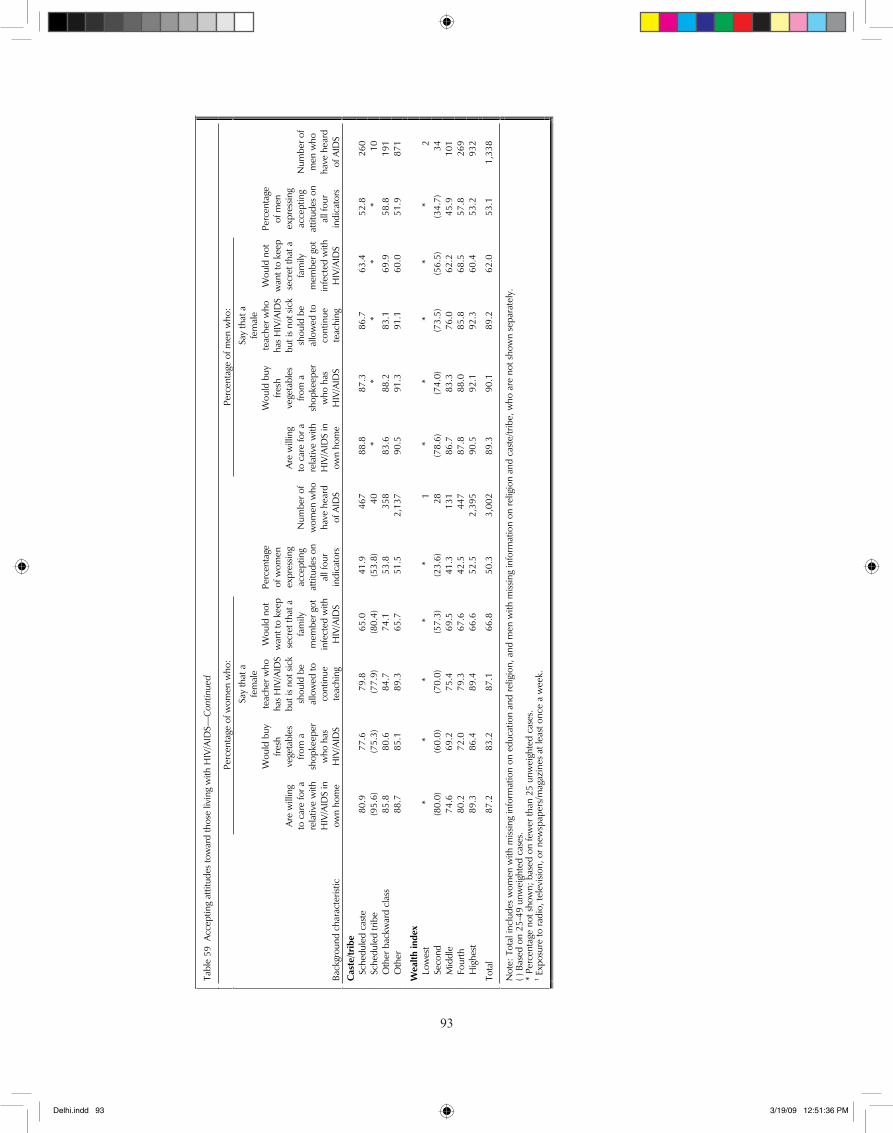
��
93
Tab
le 5
9 A
ccep
ting
attit
udes
tow
ard
thos
e liv
ing
with
HIV
/AID
S—C
ontin
ued
Perc
enta
ge o
f wom
en w
ho:
Pe
rcen
tage
of m
en w
ho:
Bac
kgro
und
char
acte
ristic
Are
will
ing
to c
are
for a
re
lativ
e w
ith
HIV
/AID
S in
ow
n ho
me
Wou
ld b
uy
fresh
ve
geta
bles
from
a
shop
keep
er
who
has
H
IV/A
IDS
Say
that
a
fem
ale
teac
her w
ho
has
HIV
/AID
S bu
t is
not s
ick
shou
ld b
e al
low
ed to
co
ntin
uete
achi
ng
Wou
ld n
ot
wan
t to
keep
secr
et th
at a
fa
mily
m
embe
r got
in
fect
ed w
ith
HIV
/AID
S
Perc
enta
geof
wom
en
expr
essin
gac
cept
ing
attit
udes
on
all f
our
indi
cato
rs
Num
ber o
f w
omen
who
ha
ve h
eard
of
AID
S
Are
will
ing
to
car
e fo
r a
rela
tive
with
H
IV/A
IDS
in
own
hom
e
Wou
ld b
uy
fresh
ve
geta
bles
from
a
shop
keep
er
who
has
H
IV/A
IDS
Say
that
a
fem
ale
teac
her w
ho
has
HIV
/AID
S bu
t is
not s
ick
shou
ld b
e al
low
ed to
co
ntin
uete
achi
ng
Wou
ld n
ot
wan
t to
keep
secr
et th
at a
fa
mily
m
embe
r got
in
fect
ed w
ith
HIV
/AID
S
Perc
enta
geof
men
ex
pres
sing
acce
ptin
gat
titud
es o
n al
l fou
r in
dica
tors
Num
ber o
f m
en w
ho
have
hea
rd
of A
IDS
Cas
te/tr
ibe
Sche
dule
d ca
ste
80
.9
77.6
79
.8
65.0
41
.9
467
88
.8
87.3
86
.7
63.4
52
.8
260
Sche
dule
d tri
be
(95.
6)
(75.
3)
(77.
9)
(80.
4)
(53.
8)
40
* *
* *
* 10
Oth
er b
ackw
ard
clas
s
85.8
80
.6
84.7
74
.1
53.8
35
8
83.6
88
.2
83.1
69
.9
58.8
19
1
O
ther
88
.7
85.1
89
.3
65.7
51
.5
2,13
7
90.5
91
.3
91.1
60
.0
51.9
87
1
Wea
lth in
dex
Lo
wes
t *
* *
* *
1
* *
* *
* 2
Seco
nd
(80.
0)
(60.
0)
(70.
0)
(57.
3)
(23.
6)
28
(78.
6)
(74.
0)
(73.
5)
(56.
5)
(34.
7)
34
M
iddl
e
74.6
69
.2
75.4
69
.5
41.3
13
1
86.7
83
.3
76.0
62
.2
45.9
10
1
Fo
urth
80
.2
72.0
79
.3
67.6
42
.5
447
87
.8
88.0
85
.8
68.5
57
.8
269
Hig
hest
89
.3
86.4
89
.4
66.6
52
.5
2,39
5
90.5
92
.1
92.3
60
.4
53.2
93
2
Tot
al
87.2
83
.2
87.1
66
.8
50.3
3,
002
89.3
90
.1
89.2
62
.0
53.1
1,
338
Not
e: T
otal
incl
udes
wom
en w
ith m
issin
g in
form
atio
n on
edu
catio
n an
d re
ligio
n, a
nd m
en w
ith m
issin
g in
form
atio
n on
relig
ion
and
cast
e/tri
be, w
ho a
re n
ot s
how
n se
para
tely
. ( )
Bas
ed o
n 25
-49
unw
eigh
ted
case
s.
* Pe
rcen
tage
not
sho
wn;
bas
ed o
n fe
wer
than
25
unw
eigh
ted
case
s.
1 Exp
osur
e to
radi
o, te
levi
sion,
or n
ewsp
aper
s/m
agaz
ines
at l
east
onc
e a
wee
k.
Delhi.indd 93 3/19/09 12:51:36 PM
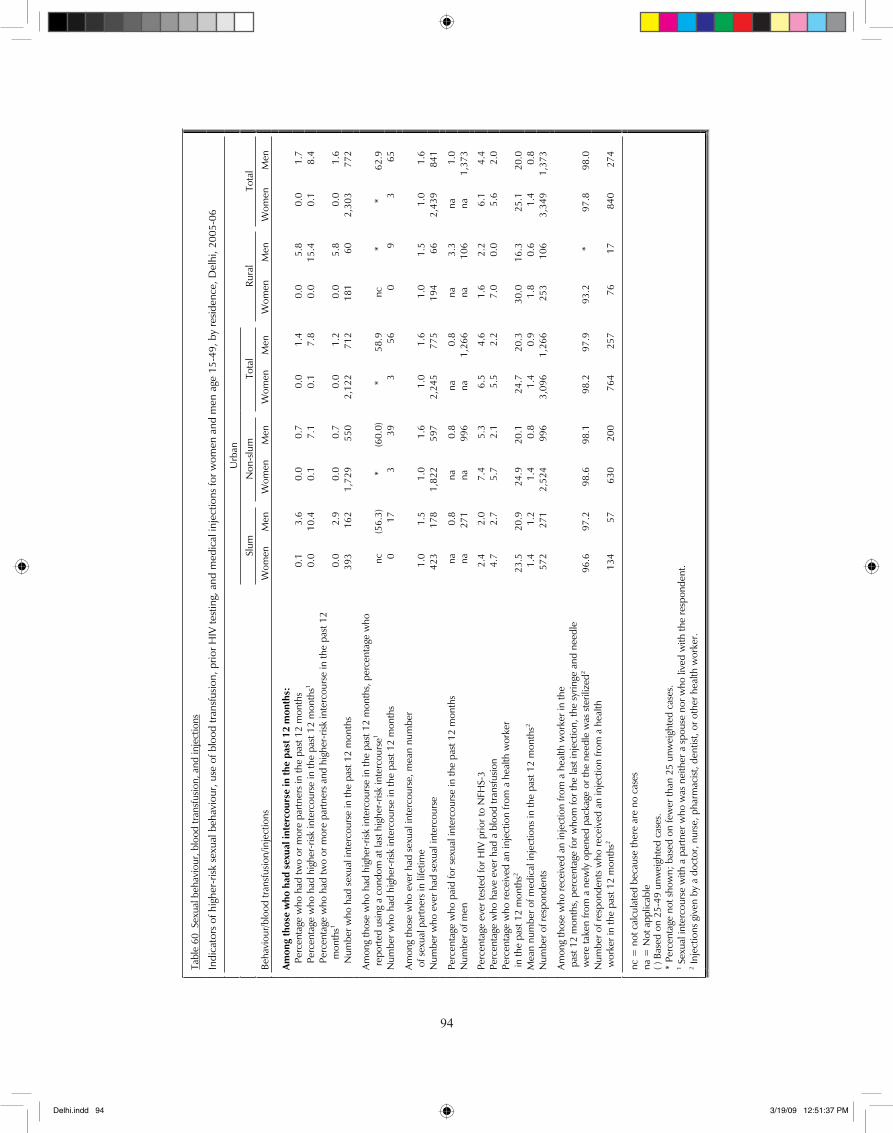
��
94
Tab
le 6
0 S
exua
l beh
avio
ur, b
lood
tran
sfus
ion,
and
inje
ctio
ns
Ind
icat
ors
of h
ighe
r-ris
k se
xual
beh
avio
ur, u
se o
f blo
od tr
ansf
usio
n, p
rior H
IV te
stin
g, a
nd m
edic
al in
ject
ions
for w
omen
and
men
age
15-
49, b
y re
siden
ce, D
elhi
, 200
5-06
Urb
an
Slum
N
on-s
lum
To
tal
Rura
l To
tal
Beh
avio
ur/b
lood
tran
sfus
ion/
inje
ctio
ns
Wom
enM
en
Wom
en
Men
W
omen
M
en
Wom
en
Men
W
omen
Men
Amon
g th
ose
who
had
sex
ual i
nter
cour
se in
the
past
12
mon
ths:
Pe
rcen
tage
who
had
two
or m
ore
part
ners
in th
e pa
st 1
2 m
onth
s
0.1
3.
6
0.0
0.
7
0.0
1.
4
0.0
5.
8
0.0
1.
7
Pe
rcen
tage
who
had
hig
her-
risk
inte
rcou
rse
in th
e pa
st 1
2 m
onth
s1 0.
0
10.4
0.
1
7.1
0.
1
7.8
0.
0
15.4
0.
1
8.4
Pe
rcen
tage
who
had
two
or m
ore
part
ners
and
hig
her-
risk
inte
rcou
rse
in th
e pa
st 1
2 m
onth
s10.
0
2.9
0.
0
0.7
0.
0
1.2
0.
0
5.8
0.
0
1.6
Num
ber w
ho h
ad s
exua
l int
erco
urse
in th
e pa
st 1
2 m
onth
s 39
3 16
2 1,
729
55
0 2,
122
71
2
181
60
2,
303
77
2
Amon
g th
ose
who
had
hig
her-
risk
inte
rcou
rse
in th
e pa
st 1
2 m
onth
s, p
erce
ntag
e w
ho
repo
rted
usin
g a
cond
om a
t las
t hig
her-
risk
inte
rcou
rse1
nc
(56.
3)
* (6
0.0)
*
58.9
nc
*
* 62
.9
Num
ber w
ho h
ad h
ighe
r-ris
k in
terc
ours
e in
the
past
12
mon
ths
0
173
393
56
0
9
3
65
Amon
g th
ose
who
eve
r had
sex
ual i
nter
cour
se, m
ean
num
ber
of s
exua
l par
tner
s in
life
time
1.0
1.
5
1.0
1.
6
1.0
1.
6
1.0
1.
5
1.0
1.
6
Num
ber w
ho e
ver h
ad s
exua
l int
erco
urse
42
3 17
81,
822
597
2,24
5
775
19
4
66
2,43
9
841
Per
cent
age
who
pai
d fo
r sex
ual i
nter
cour
se in
the
past
12
mon
ths
na
0.
8 na
0.
8 na
0.
8
na
3.3
na
1.
0
Num
ber o
f men
na
27
1 na
99
6 na
1,
266
na
10
6
na
1,37
3
Per
cent
age
ever
test
ed fo
r HIV
prio
r to
NFH
S-3
2.
4
2.0
7.
4
5.3
6.
5
4.6
1.
6
2.2
6.
1
4.4
P
erce
ntag
e w
ho h
ave
ever
had
a b
lood
tran
sfus
ion
4.
7
2.7
5.
7
2.1
5.
5
2.2
7.
0
0.0
5.
6
2.0
Pe
rcen
tage
who
rece
ived
an
inje
ctio
n fro
m a
hea
lth w
orke
r in
the
past
12
mon
ths2
23.5
20
.9
24.9
20
.1
24.7
20
.3
30.0
16
.3
25.1
20
.0
Mea
n nu
mbe
r of m
edic
al in
ject
ions
in th
e pa
st 1
2 m
onth
s2 1.
4
1.2
1.
4
0.8
1.
4
0.9
1.
8
0.6
1.
4
0.8
N
umbe
r of r
espo
nden
ts
572
271
2,52
499
63,
096
1,
266
25
3
106
3,
349
1,
373
Amon
g th
ose
who
rece
ived
an
inje
ctio
n fro
m a
hea
lth w
orke
r in
the
pas
t 12
mon
ths,
per
cent
age
for w
hom
for t
he la
st in
ject
ion,
the
syrin
ge a
nd n
eedl
e w
ere
take
n fro
m a
new
ly o
pene
d pa
ckag
e or
the
need
le w
as s
teril
ized
2 96
.6
97.2
98
.6
98.1
98
.2
97.9
93
.2
* 97
.8
98.0
N
umbe
r of r
espo
nden
ts w
ho re
ceiv
ed a
n in
ject
ion
from
a h
ealth
w
orke
r in
the
past
12
mon
ths2
134
5763
020
076
4 25
7 76
17
84
0 27
4
nc =
not
cal
cula
ted
beca
use
ther
e ar
e no
cas
es
na =
Not
app
licab
le
( ) B
ased
on
25-4
9 un
wei
ghte
d ca
ses.
*
Perc
enta
ge n
ot s
how
n; b
ased
on
few
er th
an 2
5 un
wei
ghte
d ca
ses.
1 S
exua
l int
erco
urse
with
a p
artn
er w
ho w
as n
eith
er a
spo
use
nor w
ho li
ved
with
the
resp
onde
nt.
2 Inje
ctio
ns g
iven
by
a do
ctor
, nur
se, p
harm
acist
, den
tist,
or o
ther
hea
lth w
orke
r.
Delhi.indd 94 3/19/09 12:51:37 PM
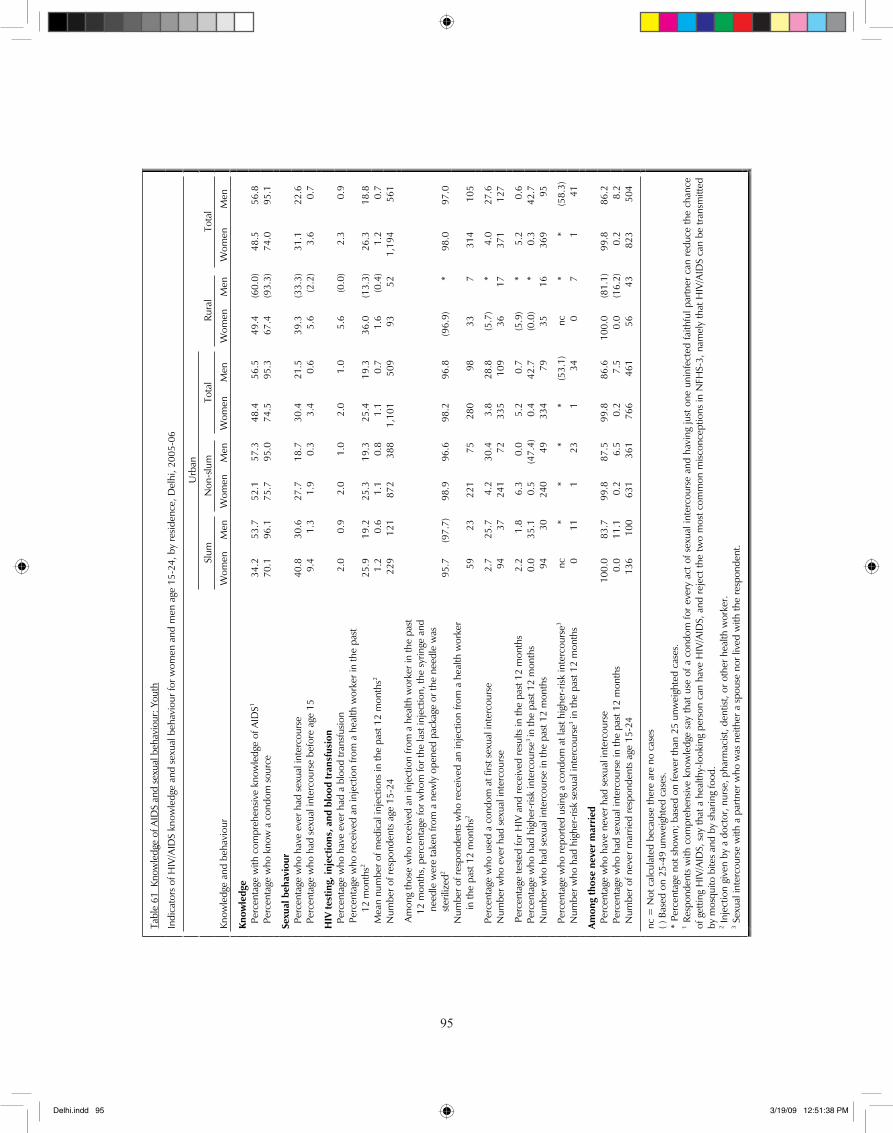
��
95
Tab
le 6
1 K
now
ledg
e of
AID
S an
d se
xual
beh
avio
ur: Y
outh
Ind
icat
ors
of H
IV/A
IDS
know
ledg
e an
d se
xual
beh
avio
ur fo
r wom
en a
nd m
en a
ge 1
5-24
, by
resid
ence
, Del
hi, 2
005-
06
Urb
an
Slum
N
on-s
lum
Tota
l Ru
ral
Tota
l
Kno
wle
dge
and
beha
viou
r W
omen
Men
W
omen
Men
W
omen
Men
W
omen
Men
W
omen
Men
Know
ledg
e
Per
cent
age
with
com
preh
ensiv
e kn
owle
dge
of A
IDS1
34.2
53
.7
52.1
57
.3
48.4
56
.5
49.4
(6
0.0)
48
.5
56.8
Per
cent
age
who
kno
w a
con
dom
sou
rce
70
.1
96.1
75
.7
95.0
74
.5
95.3
67
.4
(93.
3)
74.0
95
.1
Sexu
al b
ehav
iour
P
erce
ntag
e w
ho h
ave
ever
had
sex
ual i
nter
cour
se
40.8
30
.6
27.7
18
.7
30.4
21
.5
39.3
(3
3.3)
31
.1
22.6
Per
cent
age
who
had
sex
ual i
nter
cour
se b
efor
e ag
e 15
9.
4
1.3
1.9
0.
3
3.4
0.
6 5.
6
(2.2
) 3.
6
0.7
HIV
test
ing,
inje
ctio
ns, a
nd b
lood
tran
sfus
ion
Per
cent
age
who
hav
e ev
er h
ad a
blo
od tr
ansf
usio
n
2.0
0.
9 2.
0
1.0
2.
0
1.0
5.6
(0
.0)
2.3
0.
9
Per
cent
age
who
rece
ived
an
inje
ctio
n fro
m a
hea
lth w
orke
r in
the
past
12
mon
ths2
25.9
19
.2
25.3
19
.3
25.4
19
.3
36.0
(1
3.3)
26
.3
18.8
Mea
n nu
mbe
r of m
edic
al in
ject
ions
in th
e pa
st 1
2 m
onth
s2 1.
2
0.6
1.1
0.
8
1.1
0.
7 1.
6
(0.4
) 1.
2
0.7
Num
ber o
f res
pond
ents
age
15-
24
229
121
872
388
1,10
1
509
93
52
1,
194
56
1
Am
ong
thos
e w
ho re
ceiv
ed a
n in
ject
ion
from
a h
ealth
wor
ker i
n th
e pa
st
1
2 m
onth
s, p
erce
ntag
e fo
r who
m fo
r the
last
inje
ctio
n, th
e sy
ringe
and
ne
edle
wer
e ta
ken
from
a n
ewly
ope
ned
pack
age
or th
e ne
edle
was
st
erili
zed2
95.7
(9
7.7)
98
.9
96.6
98
.2
96.8
(9
6.9)
* 98
.0
97.0
N
umbe
r of r
espo
nden
ts w
ho re
ceiv
ed a
n in
ject
ion
from
a h
ealth
wor
ker
in th
e pa
st 1
2 m
onth
s2 59
23
22
1 75
28
0
98
33
7 31
4
105
P
erce
ntag
e w
ho u
sed
a co
ndom
at f
irst s
exua
l int
erco
urse
2.
7
25.7
4.
2
30.4
3.
8
28.8
(5
.7)
* 4.
0
27.6
Num
ber w
ho e
ver h
ad s
exua
l int
erco
urse
94
37
24
1 72
33
5
109
36
17
37
1
127
P
erce
ntag
e te
sted
for H
IV a
nd re
ceiv
ed re
sults
in th
e pa
st 1
2 m
onth
s
2.2
1.
8 6.
3
0.0
5.
2
0.7
(5.9
)*
5.2
0.
6
P
erce
ntag
e w
ho h
ad h
ighe
r-ris
k in
terc
ours
e3in
the
past
12
mon
ths
0.
0
35.1
0.
5
(47.
4)
0.4
42
.7
(0.0
)*
0.3
42
.7
N
umbe
r who
had
sex
ual i
nter
cour
se in
the
past
12
mon
ths
94
30
24
0 49
33
4
79
35
16
369
95
Per
cent
age
who
repo
rted
usin
g a
cond
om a
t las
t hig
her-
risk
inte
rcou
rse3
nc
* *
* *
(53.
1)nc
*
* (5
8.3)
N
umbe
r who
had
hig
her-
risk
sexu
al in
terc
ours
e3 in th
e pa
st 1
2 m
onth
s
0 11
1
23
1
34
0
7 1
41
Amon
g th
ose
neve
r m
arri
ed
P
erce
ntag
e w
ho h
ave
neve
r had
sex
ual i
nter
cour
se
100.
0
83.7
99
.8
87.5
99
.8
86.6
10
0.0
(8
1.1)
99.8
86
.2
P
erce
ntag
e w
ho h
ad s
exua
l int
erco
urse
in th
e pa
st 1
2 m
onth
s
0.0
11
.1
0.2
6.
5
0.2
7.
5 0.
0
(16.
2)0.
2
8.2
Num
ber o
f nev
er m
arrie
d re
spon
dent
s ag
e 15
-24
136
100
631
361
766
461
56
43
823
504
nc =
Not
cal
cula
ted
beca
use
ther
e ar
e no
cas
es
( ) B
ased
on
25-4
9 un
wei
ghte
d ca
ses.
*
Perc
enta
ge n
ot s
how
n; b
ased
on
few
er th
an 2
5 un
wei
ghte
d ca
ses.
1 R
espo
nden
ts w
ith c
ompr
ehen
sive
know
ledg
e sa
y th
at u
se o
f a c
ondo
m fo
r ev
ery
act o
f sex
ual i
nter
cour
se a
nd h
avin
gju
st o
ne u
ninf
ecte
d fa
ithfu
l par
tner
can
red
uce
the
chan
ce
of g
ettin
g H
IV/A
IDS,
say
that
a h
ealth
y-lo
okin
g pe
rson
can
hav
e H
IV/A
IDS,
and
reje
ct th
e tw
o m
ost c
omm
on m
iscon
cept
ions
in N
FHS-
3, n
amel
y th
at H
IV/A
IDS
can
be tr
ansm
itted
by
mos
quito
bite
s an
d by
sha
ring
food
. 2 In
ject
ion
give
n by
a d
octo
r, nu
rse,
pha
rmac
ist, d
entis
t, or
oth
er h
ealth
wor
ker.
3 Sex
ual i
nter
cour
se w
ith a
par
tner
who
was
nei
ther
a s
pous
e no
r liv
ed w
ith th
e re
spon
dent
.
Delhi.indd 95 3/19/09 12:51:38 PM
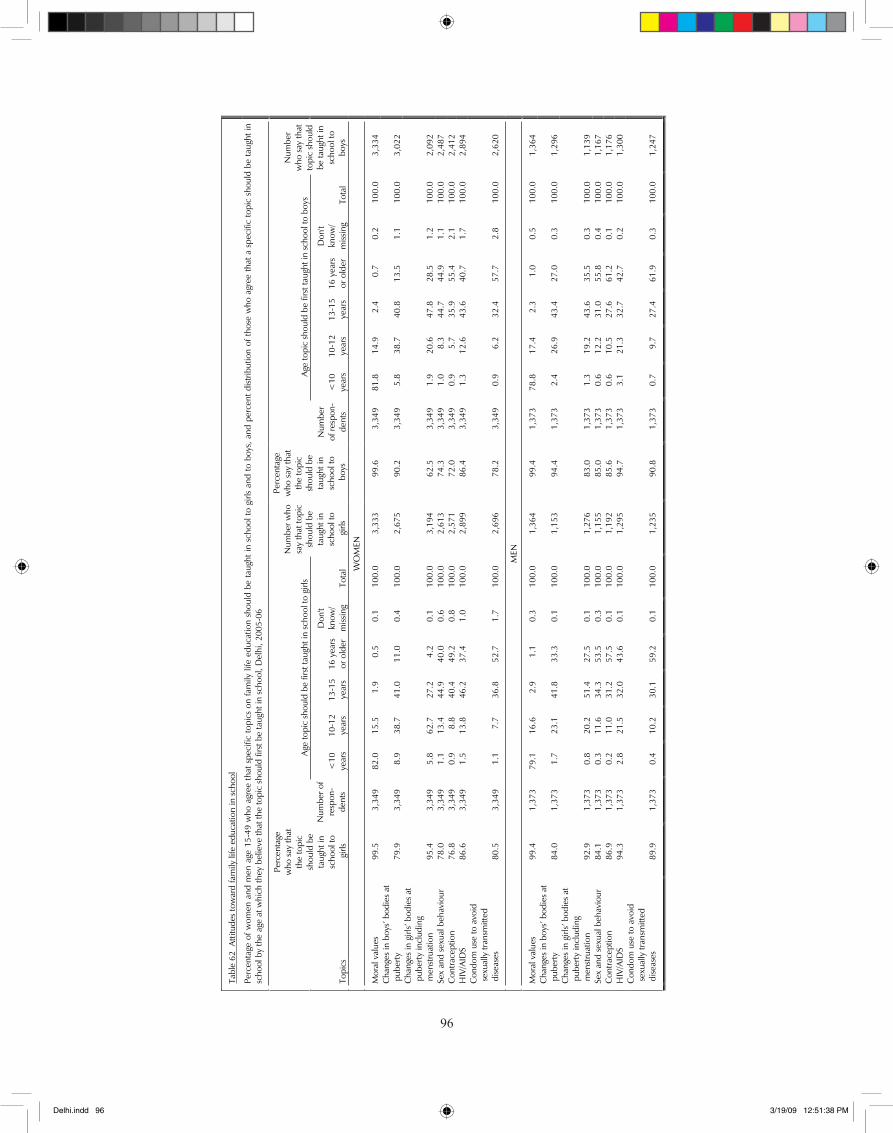
��
96
Tab
le 6
2 A
ttitu
des
tow
ard
fam
ily li
fe e
duca
tion
in s
choo
l
Perc
enta
ge o
f wom
en a
nd m
en a
ge 1
5-49
who
agr
ee th
at s
peci
fic to
pics
on
fam
ily li
fe e
duca
tion
shou
ld b
e ta
ught
in s
choo
l to
girls
and
to b
oys,
and
per
cent
dist
ribut
ion
of th
ose
who
agr
ee th
at a
spe
cific
topi
c sh
ould
be
taug
ht in
sc
hool
by
the
age
at w
hich
they
bel
ieve
that
the
topi
c sh
ould
firs
t be
taug
ht in
sch
ool,
Del
hi, 2
005-
06
Ag
e to
pic
shou
ld b
e fir
st ta
ught
in s
choo
l to
girls
Age
topi
c sh
ould
be
first
taug
ht in
sch
ool t
o bo
ys
Top
ics
Perc
enta
gew
ho s
ay th
at
the
topi
c sh
ould
be
taug
ht in
sc
hool
to
girl
s
Num
ber o
f re
spon
-de
nts
<10
year
s 10
-12
year
s 13
-15
year
s 16
year
sor
old
er
Don
'tkn
ow/
miss
ing
Tota
l
Num
ber w
ho
say
that
topi
csh
ould
be
taug
ht in
sc
hool
to
girl
s
Perc
enta
gew
ho s
ay th
at
the
topi
c sh
ould
be
taug
ht in
sc
hool
to
boy
s
Num
ber
of re
spon
-de
nts
<10
year
s 10
-12
year
s 13
-15
year
s 16
year
sor
old
er
Don
'tkn
ow/
miss
ing
Tota
l
Num
ber
who
say
that
to
pic
shou
ld
be ta
ught
in
scho
ol to
bo
ys
WO
MEN
Mor
al v
alue
s 99
.5
3,34
9
82.0
15
.5
1.9
0.
5
0.1
10
0.0
3,
333
99
.6
3,34
9
81.8
14
.9
2.4
0.
7
0.2
10
0.0
3,
334
Cha
nges
in b
oys’
bod
ies
at
pub
erty
79
.9
3,34
9
8.9
38
.7
41.0
11
.0
0.4
10
0.0
2,
675
90
.2
3,34
9
5.8
38
.7
40.8
13
.5
1.1
10
0.0
3,
022
Cha
nges
in g
irls’
bod
ies
at
pub
erty
incl
udin
g m
enst
ruat
ion
95.4
3,
349
5.
8
62.7
27
.2
4.2
0.
1
100.
0
3,19
4
62.5
3,
349
1.
9
20.6
47
.8
28.5
1.
2
100.
0
2,09
2
S
ex a
nd s
exua
l beh
avio
ur
78.0
3,
349
1.
1
13.4
44
.9
40.0
0.
6
100.
0
2,61
3
74.3
3,
349
1.
0
8.3
44
.7
44.9
1.
1
100.
0
2,48
7
C
ontra
cept
ion
76.8
3,
349
0.
9
8.8
40
.4
49.2
0.
8
100.
0
2,57
1
72.0
3,
349
0.
9
5.7
35
.9
55.4
2.
1
100.
0
2,41
2
H
IV/A
IDS
86.6
3,
349
1.
5
13.8
46
.2
37.4
1.
0
100.
0
2,89
9
86.4
3,
349
1.
3
12.6
43
.6
40.7
1.
7
100.
0
2,89
4
C
ondo
m u
se to
avo
id
sex
ually
tran
smitt
ed
dise
ases
80
.5
3,34
9
1.1
7.
7
36.8
52
.7
1.7
10
0.0
2,
696
78
.2
3,34
9
0.9
6.
2
32.4
57
.7
2.8
10
0.0
2,
620
MEN
Mor
al v
alue
s 99
.4
1,37
3
79.1
16
.6
2.9
1.
1
0.3
10
0.0
1,
364
99
.4
1,37
3
78.8
17
.4
2.3
1.
0
0.5
10
0.0
1,
364
Cha
nges
in b
oys’
bod
ies
at
pub
erty
84
.0
1,37
3
1.7
23
.1
41.8
33
.3
0.1
10
0.0
1,
153
94
.4
1,37
3
2.4
26
.9
43.4
27
.0
0.3
10
0.0
1,
296
Cha
nges
in g
irls’
bod
ies
at
pub
erty
incl
udin
g m
enst
ruat
ion
92.9
1,
373
0.
8
20.2
51
.4
27.5
0.
1
100.
0
1,27
6
83.0
1,
373
1.
3
19.2
43
.6
35.5
0.
3
100.
0
1,13
9
S
ex a
nd s
exua
l beh
avio
ur
84.1
1,
373
0.
3
11.6
34
.3
53.5
0.
3
100.
0
1,15
5
85.0
1,
373
0.
6
12.2
31
.0
55.8
0.
4
100.
0
1,16
7
C
ontra
cept
ion
86.9
1,
373
0.
2
11.0
31
.2
57.5
0.
1
100.
0
1,19
2
85.6
1,
373
0.
6
10.5
27
.6
61.2
0.
1
100.
0
1,17
6
H
IV/A
IDS
94.3
1,
373
2.
8
21.5
32
.0
43.6
0.
1
100.
0
1,29
5
94.7
1,
373
3.
1
21.3
32
.7
42.7
0.
2
100.
0
1,30
0
C
ondo
m u
se to
avo
id
sex
ually
tran
smitt
ed
dise
ases
89
.9
1,37
3 0.
4 10
.2
30.1
59
.2
0.1
100.
0 1,
235
90.8
1,
373
0.7
9.7
27.4
61
.9
0.3
100.
0 1,
247
Delhi.indd 96 3/19/09 12:51:38 PM
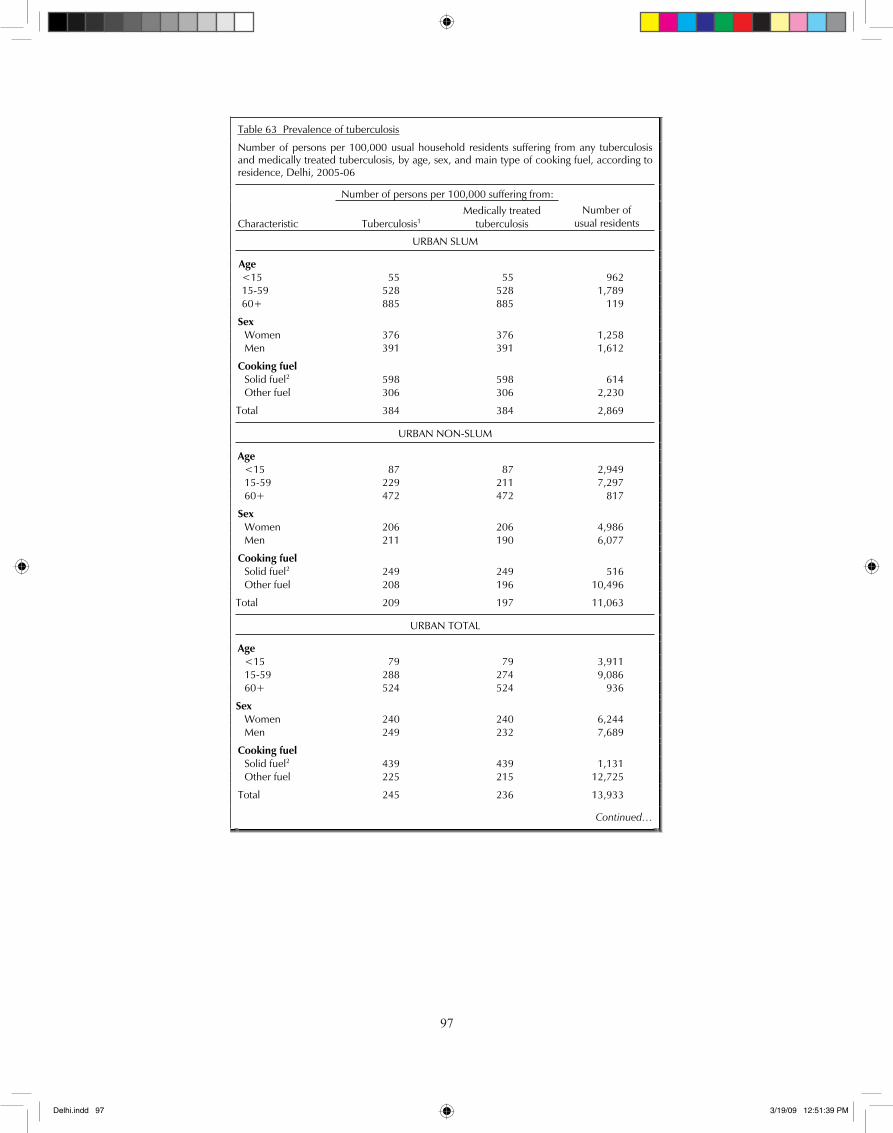
��
97
Table 63 Prevalence of tuberculosis
Number of persons per 100,000 usual household residents suffering from any tuberculosis and medically treated tuberculosis, by age, sex, and main type of cooking fuel, according to residence, Delhi, 2005-06
Number of persons per 100,000 suffering from:
Characteristic Tuberculosis1Medically treated
tuberculosis Number of
usual residents
URBAN SLUM
Age <15 55 55 962
15-59 528 528 1,789 60+ 885 885 119
Sex Women 376 376 1,258 Men 391 391 1,612
Cooking fuel Solid fuel2 598 598 614 Other fuel 306 306 2,230
Total 384 384 2,869
URBAN NON-SLUM
Age <15 87 87 2,949 15-59 229 211 7,297 60+ 472 472 817
Sex Women 206 206 4,986 Men 211 190 6,077
Cooking fuel Solid fuel2 249 249 516 Other fuel 208 196 10,496
Total 209 197 11,063
URBAN TOTAL
Age <15 79 79 3,911 15-59 288 274 9,086 60+ 524 524 936
Sex Women 240 240 6,244 Men 249 232 7,689
Cooking fuel Solid fuel2 439 439 1,131 Other fuel 225 215 12,725
Total 245 236 13,933
Continued…
Delhi.indd 97 3/19/09 12:51:39 PM
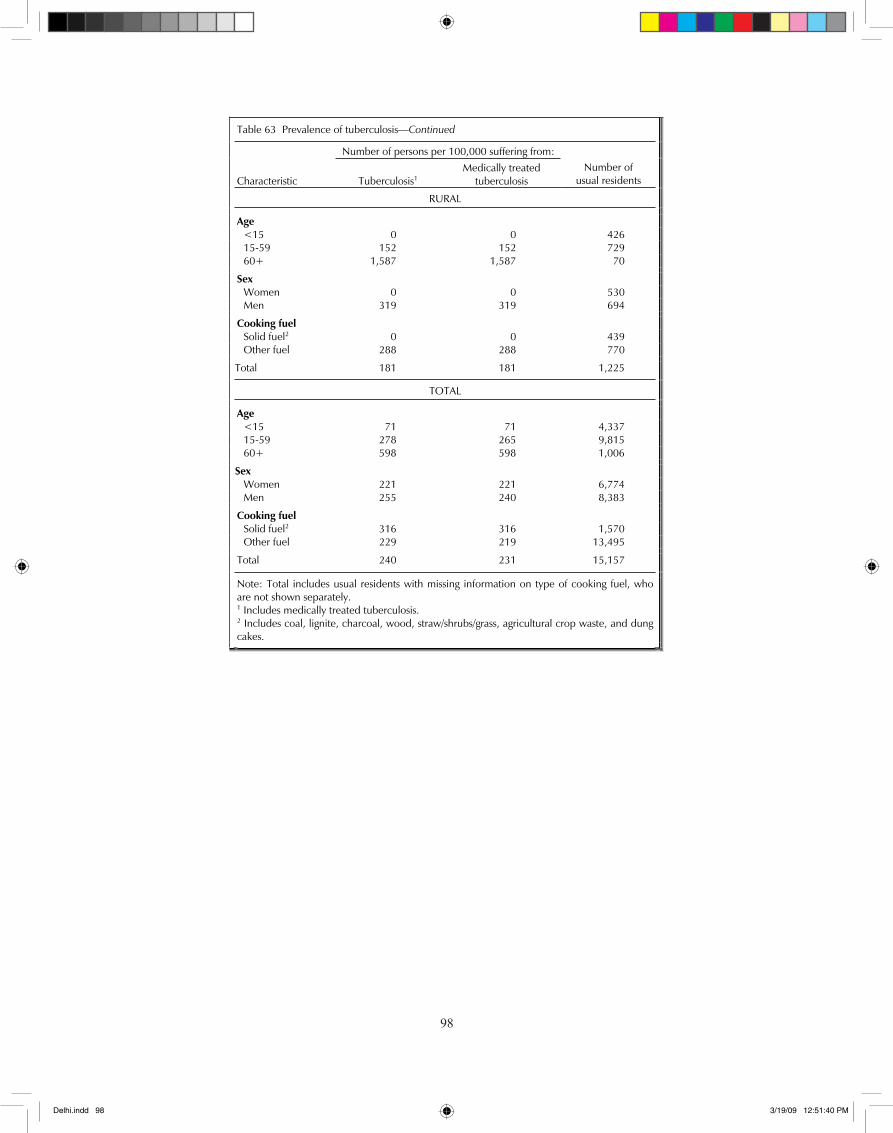
��
98
Table 63 Prevalence of tuberculosis—Continued
Number of persons per 100,000 suffering from:
Characteristic Tuberculosis1Medically treated
tuberculosis Number of
usual residents
RURAL
Age <15 0 0 426 15-59 152 152 729 60+ 1,587 1,587 70
Sex Women 0 0 530 Men 319 319 694
Cooking fuel Solid fuel2 0 0 439 Other fuel 288 288 770
Total 181 181 1,225
TOTAL
Age <15 71 71 4,337 15-59 278 265 9,815 60+ 598 598 1,006
Sex Women 221 221 6,774 Men 255 240 8,383
Cooking fuel Solid fuel2 316 316 1,570 Other fuel 229 219 13,495
Total 240 231 15,157
Note: Total includes usual residents with missing information on type of cooking fuel, who are not shown separately. 1 Includes medically treated tuberculosis. 2 Includes coal, lignite, charcoal, wood, straw/shrubs/grass, agricultural crop waste, and dung cakes.
Delhi.indd 98 3/19/09 12:51:40 PM
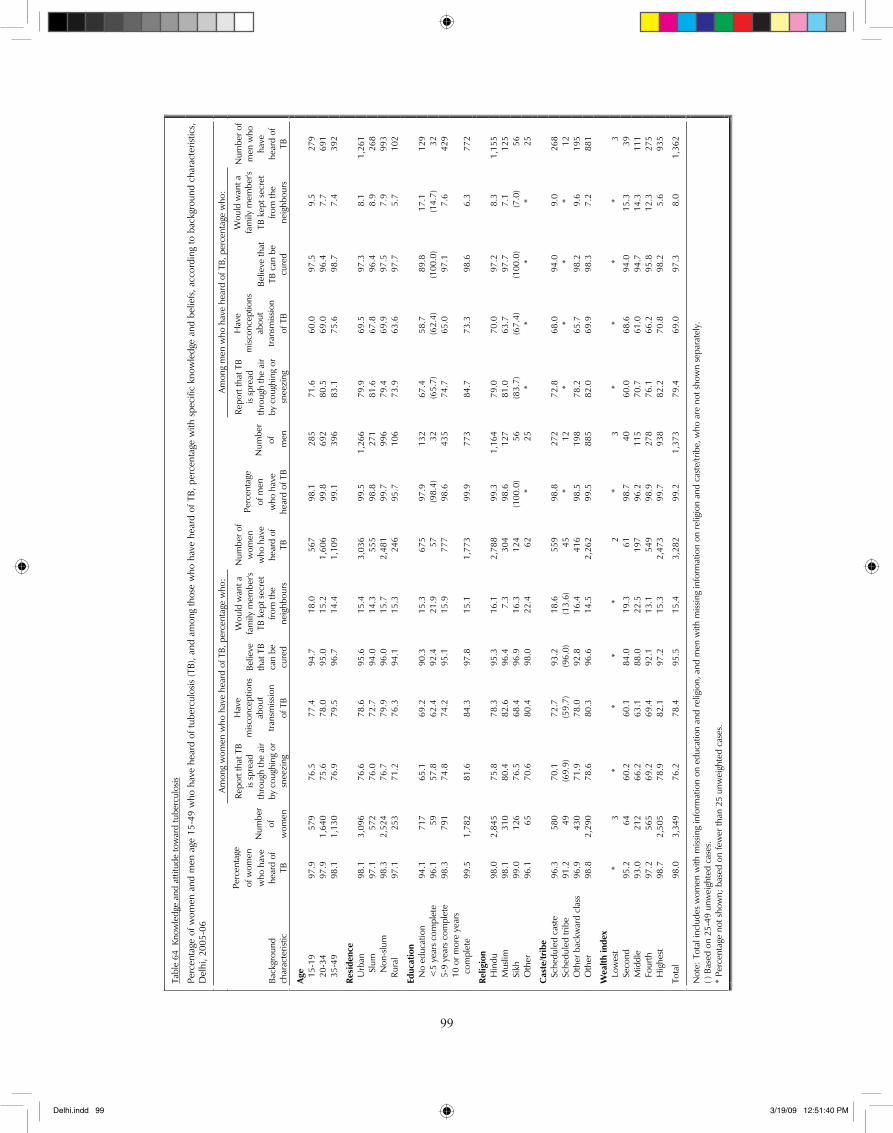
��
99
Tab
le 6
4 K
now
ledg
e an
d at
titud
e to
war
d tu
berc
ulos
is
Perc
enta
ge o
f wom
en a
nd m
en a
ge 1
5-49
who
hav
e he
ard
of tu
berc
ulos
is (T
B), a
nd a
mon
g th
ose
who
hav
e he
ard
of T
B, p
erce
ntag
e w
ith s
peci
fic k
now
ledg
e an
d be
liefs
, acc
ordi
ng to
bac
kgro
und
char
acte
ristic
s,
Del
hi, 2
005-
06
Amon
g w
omen
who
hav
e he
ard
of T
B, p
erce
ntag
e w
ho:
Amon
g m
en w
ho h
ave
hear
d of
TB,
per
cent
age
who
:
Back
grou
nd
char
acte
ristic
Perc
enta
geof
wom
en
who
hav
e he
ard
of
TB
Num
ber
of
wom
en
Repo
rt th
at T
B is
spre
ad
thro
ugh
the
air
by c
ough
ing
or
snee
zing
Hav
em
iscon
cept
ions
abou
ttra
nsm
issio
n
of T
B
Belie
ve
that
TB
can
be
cure
d
Wou
ld w
ant a
fa
mily
mem
ber's
TB
kep
t sec
ret
from
the
neig
hbou
rs
Num
ber o
f w
omen
w
ho h
ave
hear
d of
TB
Perc
enta
geof
men
w
ho h
ave
hear
d of
TB
Num
ber
of
men
Repo
rt th
at T
B is
spre
ad
thro
ugh
the
air
by c
ough
ing
or
snee
zing
Hav
em
iscon
cept
ions
ab
out
trans
miss
ion
of
TB
Belie
ve th
at
TB c
an b
e cu
red
Wou
ld w
ant a
fa
mily
mem
ber's
TB
kep
t sec
ret
from
the
neig
hbou
rs
Num
ber o
f m
en w
ho
have
hear
d of
TB
Age
15-1
9
97.9
57
9
76.5
77
.4
94.7
18
.0
567
98
.1
285
71
.6
60.0
97
.5
9.5
27
9
20
-34
97
.9
1,64
0
75.6
78
.0
95.0
15
.2
1,60
6
99.8
69
2
80.5
69
.0
96.4
7.
7
691
35-4
9
98.1
1,
130
76
.9
79.5
96
.7
14.4
1,
109
99
.1
396
83
.1
75.6
98
.7
7.4
39
2
Resi
denc
e
U
rban
98
.1
3,09
6
76.6
78
.6
95.6
15
.4
3,03
6
99.5
1,
266
79
.9
69.5
97
.3
8.1
1,
261
Slu
m
97.1
57
2 76
.0
72.7
94
.0
14.3
55
5 98
.8
271
81.6
67
.8
96.4
8.
9
268
N
on-s
lum
98
.3
2,52
4 76
.7
79.9
96
.0
15.7
2,
481
99.7
99
6 79
.4
69.9
97
.5
7.9
99
3
Rura
l 97
.1
253
71
.2
76.3
94
.1
15.3
24
6
95.7
10
6
73.9
63
.6
97.7
5.
7
102
Educ
atio
n
N
o ed
ucat
ion
94
.1
717
65
.1
69.2
90
.3
15.3
67
5
97.9
13
2
67.4
58
.7
89.8
17
.1
129
<5
year
s co
mpl
ete
96.1
59
57
.8
62.4
92
.4
21.9
57
(9
8.4)
32
(6
5.7)
(6
2.4)
(1
00.0
) (1
4.7)
32
5-9
year
s co
mpl
ete
98
.3
791
74
.8
74.2
95
.1
15.9
77
7
98.6
43
5
74.7
65
.0
97.1
7.
6
429
10
or m
ore
year
s co
mpl
ete
99.5
1,
782
81
.6
84.3
97
.8
15.1
1,
773
99
.9
773
84
.7
73.3
98
.6
6.3
77
2
Relig
ion
Hin
du
98.0
2,
845
75
.8
78.3
95
.3
16.1
2,
788
99
.3
1,16
4
79.0
70
.0
97.2
8.
3
1,15
5
M
uslim
98
.1
310
80
.4
82.6
96
.4
7.3
30
4
98.6
12
7
81.0
63
.7
97.7
7.
1
125
Sikh
99
.0
126
76
.5
68.4
96
.9
16.3
12
4
(100
.0)
56
(83.
7)
(67.
4)
(100
.0)
(7.0
) 56
Oth
er
96.1
65
70
.6
80.4
98
.0
22.4
62
*
25
* *
* *
25
Cas
te/tr
ibe
Sche
dule
d ca
ste
96
.3
580
70
.1
72.7
93
.2
18.6
55
9
98.8
27
2
72.8
68
.0
94.0
9.
0
268
Sche
dule
d tri
be
91.2
49
(6
9.9)
(5
9.7)
(9
6.0)
(1
3.6)
45
*
12
* *
* *
12
O
ther
bac
kwar
d cl
ass
96
.9
430
71
.9
78.0
92
.8
16.4
41
6
98.5
19
8
78.2
65
.7
98.2
9.
6
195
Oth
er
98.8
2,
290
78
.6
80.3
96
.6
14.5
2,
262
99
.5
885
82
.0
69.9
98
.3
7.2
88
1
Wea
lth in
dex
Low
est
*
3
* *
* *
2
* 3
*
* *
* 3
Seco
nd
95.2
64
60
.2
60.1
84
.0
19.3
61
98
.7
40
60.0
68
.6
94.0
15
.3
39
M
iddl
e
93.0
21
2
66.2
63
.1
88.0
22
.5
197
96
.2
115
70
.7
61.0
94
.7
14.3
11
1
Fo
urth
97
.2
565
69
.2
69.4
92
.1
13.1
54
9
98.9
27
8
76.1
66
.2
95.8
12
.3
275
Hig
hest
98
.7
2,50
5
78.9
82
.1
97.2
15
.3
2,47
3
99.7
93
8
82.2
70
.8
98.2
5.
6
935
Tot
al
98.0
3,
349
76.2
78
.4
95.5
15
.4
3,28
2 99
.2
1,37
3 79
.4
69.0
97
.3
8.0
1,36
2
Not
e: T
otal
incl
udes
wom
en w
ith m
issin
g in
form
atio
n on
edu
catio
n an
d re
ligio
n, a
nd m
en w
ith m
issin
g in
form
atio
n on
relig
ion
and
cast
e/tri
be, w
ho a
re n
ot s
how
n se
para
tely
. ( )
Bas
ed o
n 25
-49
unw
eigh
ted
case
s.
* Pe
rcen
tage
not
sho
wn;
bas
ed o
n fe
wer
than
25
unw
eigh
ted
case
s.
Delhi.indd 99 3/19/09 12:51:40 PM
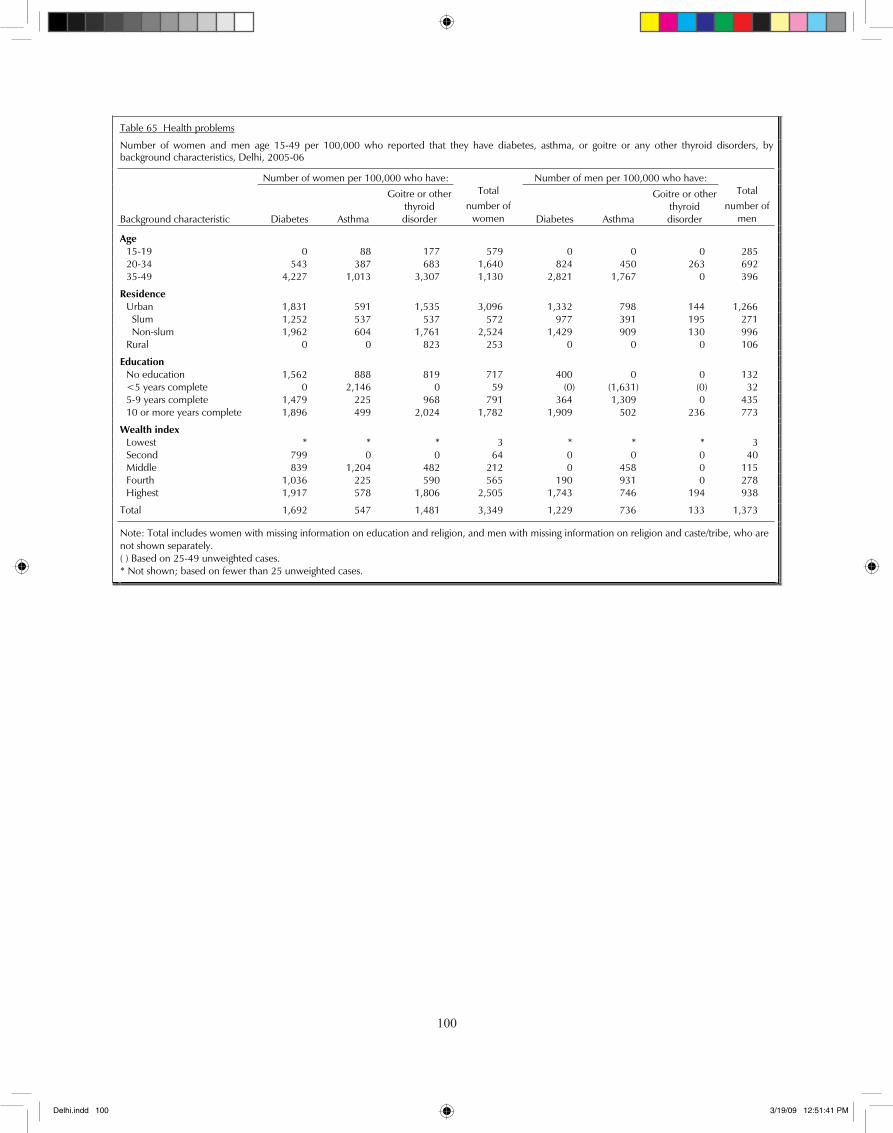
�00
100
Table 65 Health problems
Number of women and men age 15-49 per 100,000 who reported that they have diabetes, asthma, or goitre or any other thyroid disorders, by background characteristics, Delhi, 2005-06
Number of women per 100,000 who have: Number of men per 100,000 who have:
Background characteristic Diabetes Asthma
Goitre or other thyroid disorder
Total number of
women Diabetes Asthma
Goitre or other thyroid disorder
Total number of
men
Age 15-19 0 88 177 579 0 0 0 285 20-34 543 387 683 1,640 824 450 263 692 35-49 4,227 1,013 3,307 1,130 2,821 1,767 0 396
Residence Urban 1,831 591 1,535 3,096 1,332 798 144 1,266 Slum 1,252 537 537 572 977 391 195 271 Non-slum 1,962 604 1,761 2,524 1,429 909 130 996 Rural 0 0 823 253 0 0 0 106
Education No education 1,562 888 819 717 400 0 0 132 <5 years complete 0 2,146 0 59 (0) (1,631) (0) 32 5-9 years complete 1,479 225 968 791 364 1,309 0 435 10 or more years complete 1,896 499 2,024 1,782 1,909 502 236 773
Wealth index Lowest * * * 3 * * * 3 Second 799 0 0 64 0 0 0 40 Middle 839 1,204 482 212 0 458 0 115 Fourth 1,036 225 590 565 190 931 0 278 Highest 1,917 578 1,806 2,505 1,743 746 194 938
Total 1,692 547 1,481 3,349 1,229 736 133 1,373
Note: Total includes women with missing information on education and religion, and men with missing information on religion and caste/tribe, who are not shown separately. ( ) Based on 25-49 unweighted cases. * Not shown; based on fewer than 25 unweighted cases.
Delhi.indd 100 3/19/09 12:51:41 PM
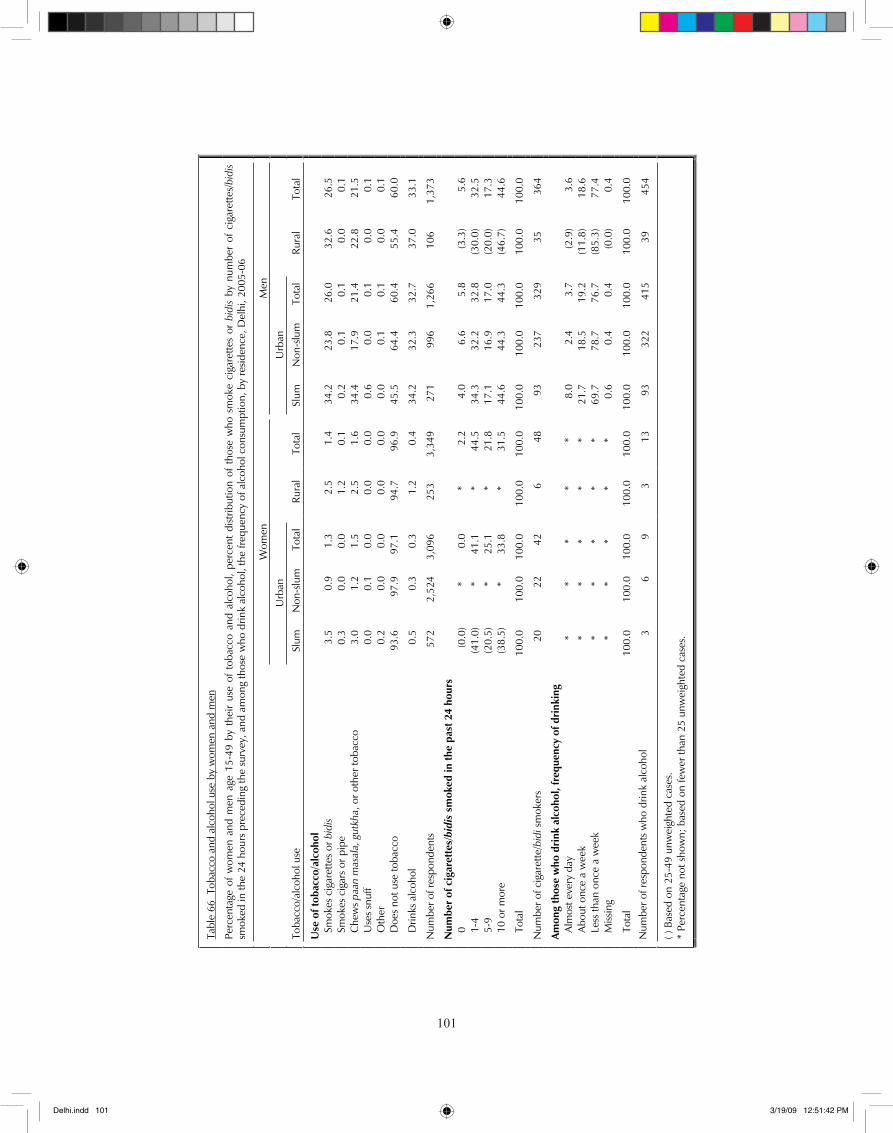
�0�
101
Tab
le 6
6 T
obac
co a
nd a
lcoh
ol u
se b
y w
omen
and
men
Perc
enta
ge o
f w
omen
and
men
age
15-
49 b
y th
eir
use
of t
obac
co a
nd a
lcoh
ol,
perc
ent
dist
ribut
ion
of t
hose
who
sm
oke
ciga
rette
s or
bidi
s by
num
ber
of c
igar
ette
s/bi
dis
smok
ed in
the
24 h
ours
pre
cedi
ng th
e su
rvey
, and
am
ong
thos
e w
ho d
rink
alco
hol,
the
frequ
ency
of a
lcoh
ol c
onsu
mpt
ion,
by
resid
ence
, Del
hi, 2
005-
06
Wom
en
Men
Urb
an
U
rban
Tob
acco
/alc
ohol
use
Sl
um
Non
-slu
mTo
tal
Rura
l To
tal
Slum
N
on-s
lum
Tota
l Ru
ral
Tota
l
Use
of t
obac
co/a
lcoh
ol
Smok
es c
igar
ette
s or
bid
is
3.5
0.
9
1.3
2.
5
1.4
34
.2
23.8
26
.0
32.6
26
.5
Sm
okes
cig
ars
or p
ipe
0.
3
0.0
0.
0
1.2
0.
1
0.2
0.
1
0.1
0.
0
0.1
Che
ws
paan
mas
ala,
gut
kha,
or o
ther
toba
cco
3.
0
1.2
1.
5
2.5
1.
6
34.4
17
.9
21.4
22
.8
21.5
Use
s sn
uff
0.0
0.
1
0.0
0.
0
0.0
0.
6
0.0
0.
1
0.0
0.
1
O
ther
0.
2
0.0
0.
0
0.0
0.
0
0.0
0.
1
0.1
0.
0
0.1
Doe
s no
t use
toba
cco
93
.6
97.9
97
.1
94.7
96
.9
45.5
64
.4
60.4
55
.4
60.0
D
rinks
alc
ohol
0.
5
0.3
0.
3
1.2
0.4
34
.2
32.3
32
.7
37.0
33
.1
Num
ber o
f res
pond
ents
57
2 2,
524
3,09
6
253
3,
349
27
1 99
6 1,
266
10
6
1,37
3
Num
ber
of c
igar
ette
s/bi
dis
smok
ed in
the
past
24
hour
s
0
(0.0
) *
0.0
*
2.2
4.
0
6.6
5.
8
(3.3
) 5.
6
1-
4
(41.
0)
* 41
.1
* 44
.5
34.3
32
.2
32.8
(3
0.0)
32
.5
5-
9
(20.
5)
* 25
.1
* 21
.8
17.1
16
.9
17.0
(2
0.0)
17
.3
10
or m
ore
(3
8.5)
*
33.8
*
31.5
44
.6
44.3
44
.3
(46.
7)
44.6
To
tal
100.
0
100.
0
100.
0
100.
0
100.
0
100.
0
100.
0
100.
0
100.
0
100.
0
Num
ber o
f cig
aret
te/b
idi s
mok
ers
20
22
42
6
48
93
23
7 32
9
35
364
Amon
g th
ose
who
dri
nk a
lcoh
ol, f
requ
ency
of d
rink
ing
A
lmos
t eve
ry d
ay
* *
* *
* 8.
0
2.4
3.
7
(2.9
) 3.
6
A
bout
onc
e a
wee
k
* *
* *
* 21
.7
18.5
19
.2
(11.
8)
18.6
Less
than
onc
e a
wee
k
* *
* *
* 69
.7
78.7
76
.7
(85.
3)
77.4
Miss
ing
* *
* *
* 0.
6
0.4
0.
4
(0.0
) 0.
4
To
tal
100.
0
100.
0
100.
0
100.
0
100.
0
100.
0
100.
0
100.
0
100.
0
100.
0
Num
ber o
f res
pond
ents
who
drin
k al
coho
l 3
6 9
3 13
93
32
2 41
5 39
45
4
( ) B
ased
on
25-4
9 un
wei
ghte
d ca
ses.
*
Perc
enta
ge n
ot s
how
n; b
ased
on
few
er th
an 2
5 un
wei
ghte
d ca
ses.
Delhi.indd 101 3/19/09 12:51:42 PM
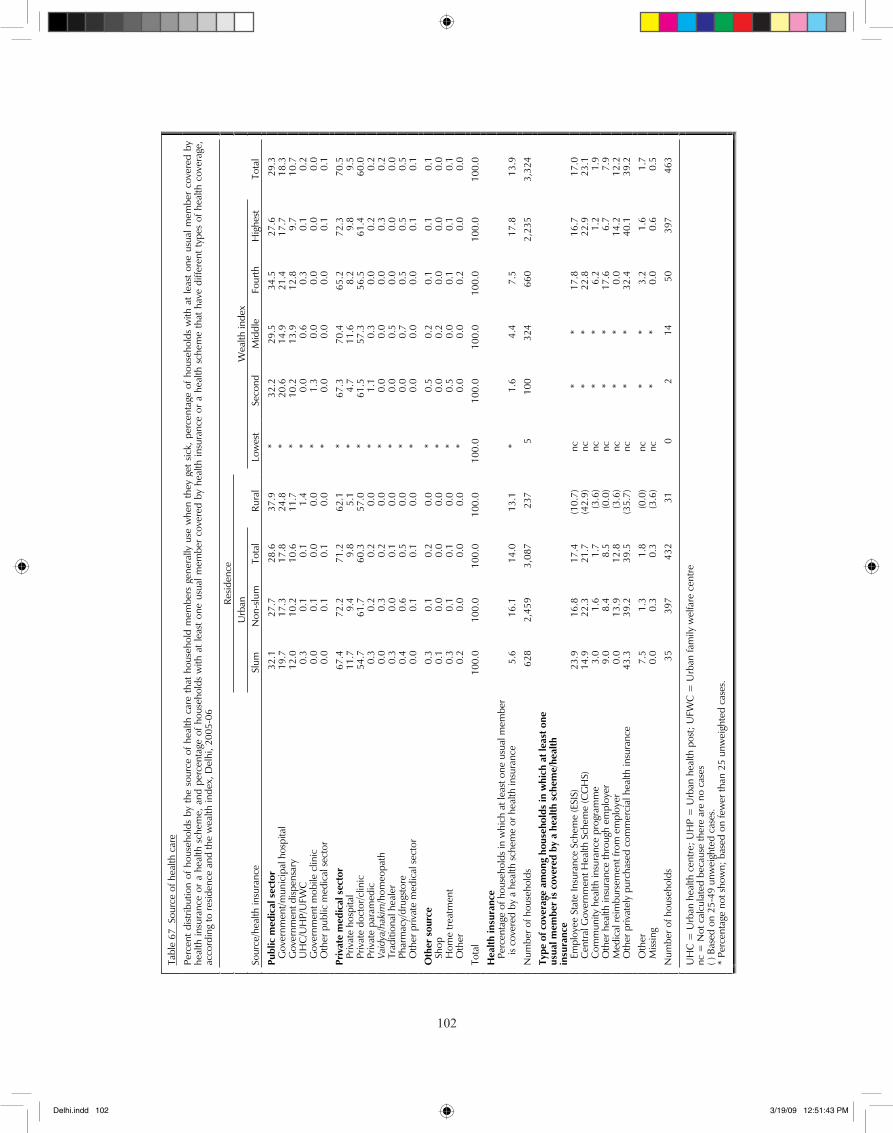
�0�
102
Tab
le 6
7 S
ourc
e of
hea
lth c
are
Perc
ent
dist
ribut
ion
of h
ouse
hold
s by
the
sou
rce
of h
ealth
car
e th
at h
ouse
hold
mem
bers
gen
eral
ly u
se w
hen
they
get
sick,
per
cent
age
of h
ouse
hold
s w
ith a
t le
ast
one
usua
l mem
ber
cove
red
byhe
alth
insu
ranc
e or
a h
ealth
sch
eme,
and
per
cent
age
of h
ouse
hold
s w
ith a
t le
ast
one
usua
l mem
ber
cove
red
by h
ealth
insu
ranc
e or
a h
ealth
sch
eme
that
hav
e di
ffere
nt t
ypes
of h
ealth
cov
erag
e,
acco
rdin
g to
resid
ence
and
the
wea
lth in
dex,
Del
hi, 2
005-
06
Resid
ence
Urb
an
Wea
lth in
dex
S
ourc
e/he
alth
insu
ranc
e Sl
um
Non
-slu
mTo
tal
Rura
l Lo
wes
t Se
cond
M
iddl
e Fo
urth
H
ighe
st
Tota
l
Publ
ic m
edic
al s
ecto
r 32
.1
27.7
28
.6
37.9
*
32.2
29
.5
34.5
27
.6
29.3
Gov
ernm
ent/m
unic
ipal
hos
pita
l 19
.7
17.3
17
.8
24.8
*
20.6
14
.9
21.4
17
.7
18.3
Gov
ernm
ent d
ispen
sary
12
.0
10.2
10
.6
11.7
*
10.2
13
.9
12.8
9.
7
10.7
UH
C/U
HP/
UFW
C
0.3
0.
1
0.1
1.
4
* 0.
0
0.6
0.
3
0.1
0.
2
G
over
nmen
t mob
ile c
linic
0.
0
0.1
0.
0
0.0
*
1.3
0.
0
0.0
0.
0
0.0
Oth
er p
ublic
med
ical
sec
tor
0.0
0.
1
0.1
0.
0
* 0.
0
0.0
0.
0
0.1
0.
1
Priv
ate
med
ical
sec
tor
67.4
72
.2
71.2
62
.1
* 67
.3
70.4
65
.2
72.3
70
.5
Pr
ivat
e ho
spita
l 11
.7
9.4
9.
8
5.1
*
4.7
11
.6
8.2
9.
8
9.5
Priv
ate
doct
or/c
linic
54
.7
61.7
60
.3
57.0
*
61.5
57
.3
56.5
61
.4
60.0
Priv
ate
para
med
ic
0.3
0.
2
0.2
0.
0
* 1.
1
0.3
0.
0
0.2
0.
2
Vaid
ya/h
akim
/hom
eopa
th
0.0
0.
3
0.2
0.
0
* 0.
0
0.0
0.
0
0.3
0.
2
Tr
aditi
onal
hea
ler
0.3
0.
0
0.1
0.
0
* 0.
0
0.5
0.
0
0.0
0.
0
Ph
arm
acy/
drug
stor
e 0.
4
0.6
0.
5
0.0
*
0.0
0.
7
0.5
0.
5
0.5
Oth
er p
rivat
e m
edic
al s
ecto
r 0.
0
0.1
0.
1
0.0
*
0.0
0.
0
0.0
0.
1
0.1
Oth
er s
ourc
e 0.
3
0.1
0.
2
0.0
*
0.5
0.
2
0.1
0.
1
0.1
Shop
0.
1
0.0
0.
0
0.0
*
0.0
0.
2
0.0
0.
0
0.0
Hom
e tre
atm
ent
0.3
0.
1
0.1
0.
0
* 0.
5
0.0
0.
1
0.1
0.
1
O
ther
0.
2
0.0
0.
0
0.0
*
0.0
0.
0
0.2
0.
0
0.0
Tot
al
100.
0
100.
0
100.
0
100.
0
100.
0
100.
0
100.
0
100.
0
100.
0
100.
0
Hea
lth in
sura
nce
Perc
enta
ge o
f hou
seho
lds
in w
hich
at l
east
one
usu
al m
embe
r is
cove
red
by a
hea
lth s
chem
e or
hea
lth in
sura
nce
5.
6
16.1
14
.0
13.1
*
1.6
4.
4
7.5
17
.8
13.9
Num
ber o
f hou
seho
lds
62
8 2,
459
3,08
7 23
7
5
100
32
4
660
2,
235
3,
324
Type
of c
over
age
amon
g ho
useh
olds
in w
hich
at l
east
one
us
ual m
embe
r is
cov
ered
by
a he
alth
sch
eme/
heal
th
insu
ranc
e
Empl
oyee
Sta
te In
sura
nce
Sche
me
(ESI
S)
23.9
16
.8
17.4
(1
0.7)
nc
*
* 17
.8
16.7
17
.0
C
entra
l Gov
ernm
ent H
ealth
Sch
eme
(CG
HS)
14
.9
22.3
21
.7
(42.
9)
nc
* *
22.8
22
.9
23.1
Com
mun
ity h
ealth
insu
ranc
e pr
ogra
mm
e
3.0
1.
6
1.7
(3
.6)
nc
* *
6.2
1.
2
1.9
Oth
er h
ealth
insu
ranc
e th
roug
h em
ploy
er
9.0
8.
4
8.5
(0
.0)
nc
* *
17.6
6.
7
7.9
Med
ical
reim
burs
emen
t fro
m e
mpl
oyer
0.
0
13.9
12
.8
(3.6
) nc
*
* 0.
0
14.2
12
.2
O
ther
priv
atel
y pu
rcha
sed
com
mer
cial
hea
lth in
sura
nce
43
.3
39.2
39
.5
(35.
7)
nc
* *
32.4
40
.1
39.2
O
ther
7.
5
1.3
1.
8
(0.0
) nc
*
* 3.
2
1.6
1.
7
M
issin
g 0.
0
0.3
0.
3
(3.6
) nc
*
* 0.
0
0.6
0.
5
Num
ber o
f hou
seho
lds
35
397
432
31
0 2
14
50
397
463
UH
C =
Urb
an h
ealth
cen
tre;
UH
P =
Urb
an h
ealth
pos
t; U
FWC
= U
rban
fam
ily w
elfa
re c
entre
nc
= N
ot c
alcu
late
d be
caus
e th
ere
are
no c
ases
( )
Bas
ed o
n 25
-49
unw
eigh
ted
case
s.
* Pe
rcen
tage
not
sho
wn;
bas
ed o
n fe
wer
than
25
unw
eigh
ted
case
s.
Delhi.indd 102 3/19/09 12:51:43 PM
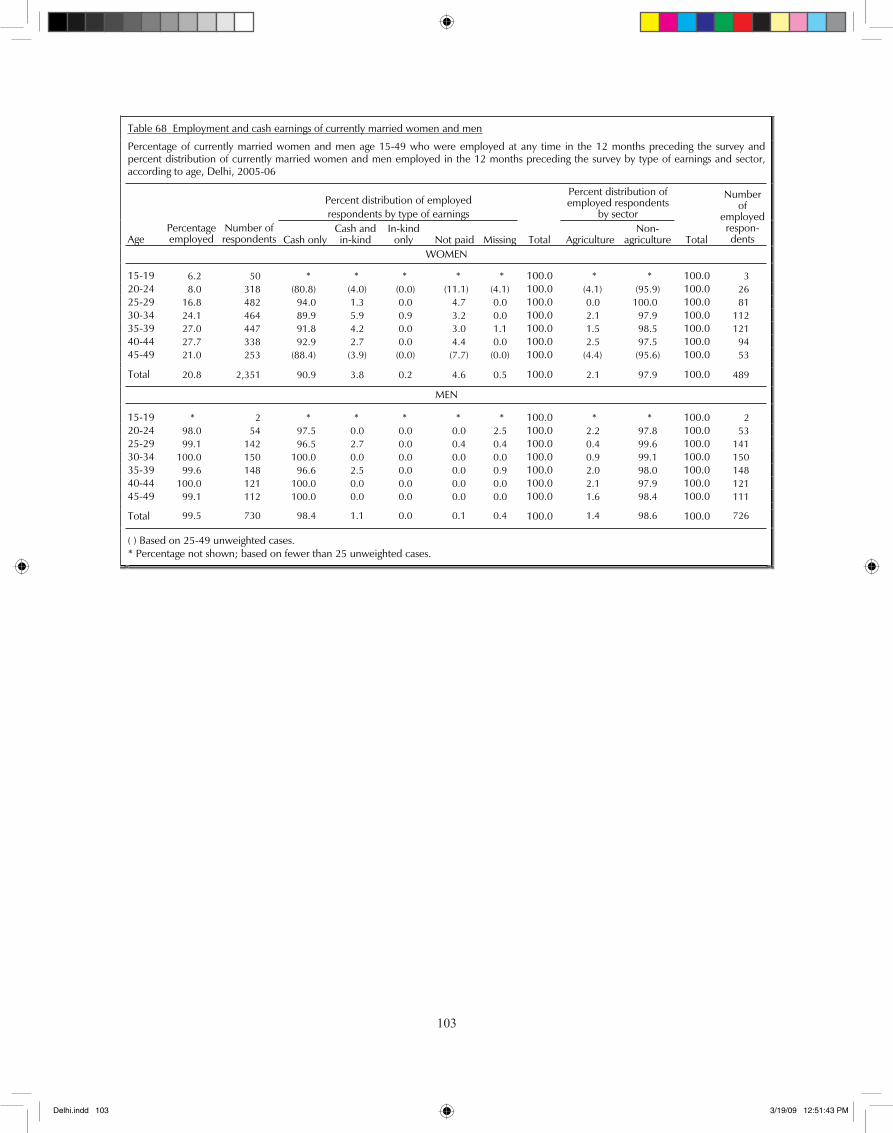
�0�
103
Table 68 Employment and cash earnings of currently married women and men
Percentage of currently married women and men age 15-49 who were employed at any time in the 12 months preceding the survey andpercent distribution of currently married women and men employed in the 12 months preceding the survey by type of earnings and sector, according to age, Delhi, 2005-06
Percent distribution of employed respondents by type of earnings
Percent distribution of employed respondents
by sector
Age Percentage employed
Number of respondents Cash only
Cash and in-kind
In-kind only Not paid Missing Total Agriculture
Non-agriculture Total
Number of
employed respon-dents
WOMEN
15-19 6.2 50 * * * * * 100.0 * * 100.0 3 20-24 8.0 318 (80.8) (4.0) (0.0) (11.1) (4.1) 100.0 (4.1) (95.9) 100.0 26 25-29 16.8 482 94.0 1.3 0.0 4.7 0.0 100.0 0.0 100.0 100.0 81 30-34 24.1 464 89.9 5.9 0.9 3.2 0.0 100.0 2.1 97.9 100.0 112 35-39 27.0 447 91.8 4.2 0.0 3.0 1.1 100.0 1.5 98.5 100.0 121 40-44 27.7 338 92.9 2.7 0.0 4.4 0.0 100.0 2.5 97.5 100.0 94 45-49 21.0 253 (88.4) (3.9) (0.0) (7.7) (0.0) 100.0 (4.4) (95.6) 100.0 53
Total 20.8 2,351 90.9 3.8 0.2 4.6 0.5 100.0 2.1 97.9 100.0 489
MEN
15-19 * 2 * * * * * 100.0 * * 100.0 2 20-24 98.0 54 97.5 0.0 0.0 0.0 2.5 100.0 2.2 97.8 100.0 53 25-29 99.1 142 96.5 2.7 0.0 0.4 0.4 100.0 0.4 99.6 100.0 141 30-34 100.0 150 100.0 0.0 0.0 0.0 0.0 100.0 0.9 99.1 100.0 150 35-39 99.6 148 96.6 2.5 0.0 0.0 0.9 100.0 2.0 98.0 100.0 148 40-44 100.0 121 100.0 0.0 0.0 0.0 0.0 100.0 2.1 97.9 100.0 121 45-49 99.1 112 100.0 0.0 0.0 0.0 0.0 100.0 1.6 98.4 100.0 111
Total 99.5 730 98.4 1.1 0.0 0.1 0.4 100.0 1.4 98.6 100.0 726
( ) Based on 25-49 unweighted cases. * Percentage not shown; based on fewer than 25 unweighted cases.
Delhi.indd 103 3/19/09 12:51:43 PM
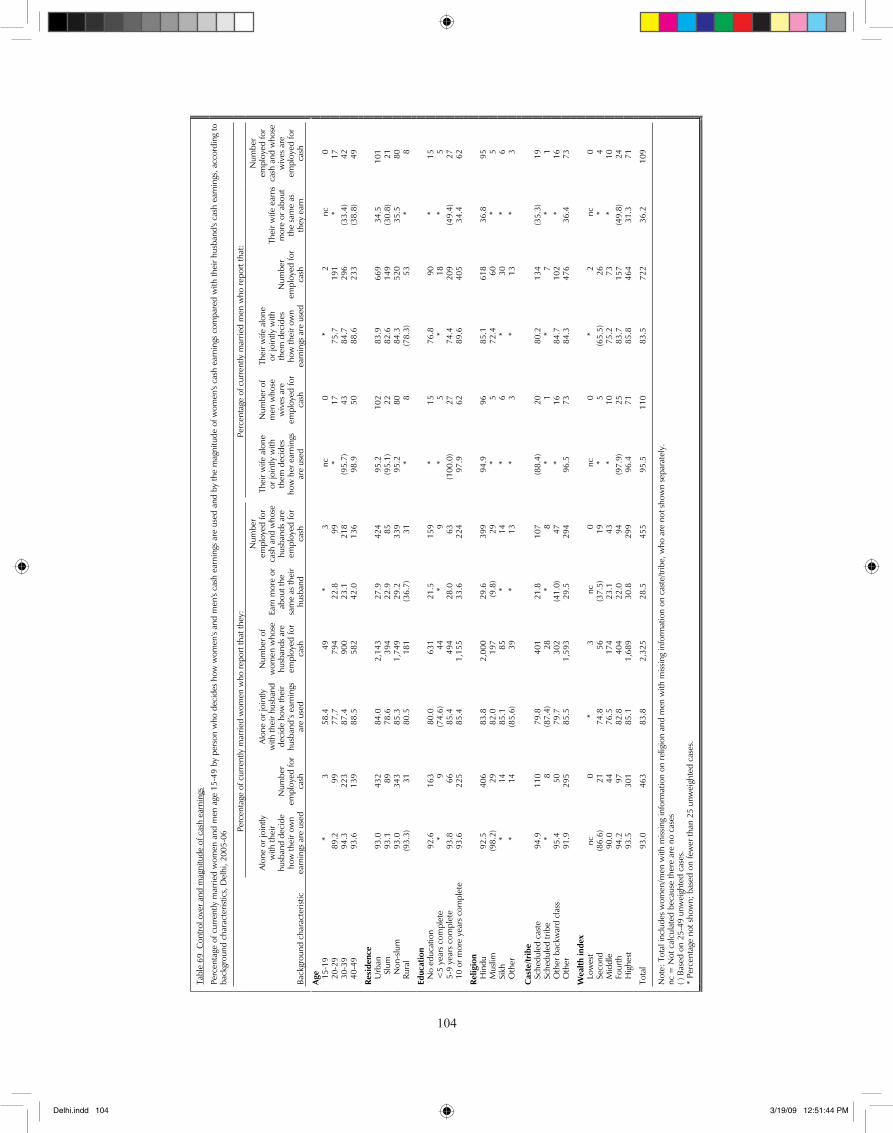
�0�
104
Tab
le 6
9 C
ontro
l ove
r and
mag
nitu
de o
f cas
h ea
rnin
gs
Perc
enta
ge o
f cur
rent
ly m
arrie
d w
omen
and
men
age
15-
49 b
y pe
rson
who
dec
ides
how
wom
en's
and
men
's ca
sh e
arni
ngs
are
used
and
by
the
mag
nitu
de o
f wom
en's
cash
ear
ning
s co
mpa
red
with
thei
r hus
band
's ca
sh e
arni
ngs,
acc
ordi
ng to
ba
ckgr
ound
cha
ract
erist
ics,
Del
hi, 2
005-
06
Pe
rcen
tage
of c
urre
ntly
mar
ried
wom
en w
ho re
port
that
they
:
Pe
rcen
tage
of c
urre
ntly
mar
ried
men
who
repo
rt th
at:
Bac
kgro
und
char
acte
ristic
Alon
e or
join
tly
with
thei
r hu
sban
d de
cide
ho
w th
eir o
wn
earn
ings
are
use
d
Num
ber
empl
oyed
for
cash
Alon
e or
join
tly
with
thei
r hus
band
de
cide
how
thei
r hu
sban
d’s
earn
ings
ar
e us
ed
Num
ber o
f w
omen
who
se
husb
ands
are
em
ploy
ed fo
r ca
sh
Earn
mor
e or
ab
out t
he
sam
e as
thei
r hu
sban
d
Num
ber
empl
oyed
for
cash
and
who
se
husb
ands
are
em
ploy
ed fo
r ca
sh
Thei
r wife
alo
ne
or jo
intly
with
th
em d
ecid
es
how
her
ear
ning
s ar
e us
ed
Num
ber o
f m
en w
hose
w
ives
are
em
ploy
ed fo
r ca
sh
Thei
r wife
alo
ne
or jo
intly
with
th
em d
ecid
es
how
thei
r ow
n ea
rnin
gs a
re u
sed
Num
ber
empl
oyed
for
cash
Thei
r wife
ear
ns
mor
e or
abo
ut
the
sam
e as
th
ey e
arn
Num
ber
empl
oyed
for
cash
and
who
se
wiv
es a
re
empl
oyed
for
cash
Age
15-1
9
* 3
58
.4
49
* 3
nc
0
*
2
nc
0
20
-29
89
.2
99
77.7
79
4
22.8
99
*
17
75
.7
191
*
17
30
-39
94
.3
223
87
.4
900
23
.1
218
(9
5.7)
43
84
.7
296
(3
3.4)
42
40-4
9
93.6
13
9
88.5
58
2
42.0
13
6
98.9
50
88
.6
233
(3
8.8)
49
Resi
denc
e
Urb
an
93.0
43
2
84.0
2,
143
27
.9
424
95
.2
102
83
.9
669
34
.5
101
Slu
m
93.1
89
78
.6
394
22.9
85
(9
5.1)
22
82
.6
149
(30.
8)
21
N
on-s
lum
93
.0
343
85.3
1,
749
29.2
33
9 95
.2
80
84.3
52
0 35
.5
80
Ru
ral
(93.
3)
31
80.5
18
1
(36.
7)
31
*
8
(78.
3)
53
* 8
Educ
atio
n
No
educ
atio
n
92.6
16
3
80.0
63
1
21.5
15
9
* 15
76
.8
90
* 15
<5
year
s co
mpl
ete
*
9
(74.
6)
44
* 9
*
5
* 18
*
5
5-
9 ye
ars
com
plet
e
93.8
66
85
.4
494
28
.0
63
(100
.0)
27
74.4
20
9
(49.
4)
27
10
or m
ore
year
s co
mpl
ete
93.6
22
5
85.4
1,
155
33
.6
224
97
.9
62
89.6
40
5
34.4
62
Relig
ion
H
indu
92
.5
406
83
.8
2,00
0
29.6
39
9
94.9
96
85
.1
618
36
.8
95
M
uslim
(9
8.2)
29
82
.0
197
(9
.8)
29
* 5
72
.4
60
* 5
Sikh
*
14
85.1
85
*
14
* 6
*
30
* 6
Oth
er
* 14
(8
5.6)
39
*
13
* 3
*
13
* 3
Cas
te/tr
ibe
Sc
hedu
led
cast
e
94.9
11
0
79.8
40
1
21.8
10
7
(88.
4)
20
80.2
13
4
(35.
3)
19
Sc
hedu
led
tribe
*
8
(87.
4)
28
* 8
*
1
* 7
*
1
O
ther
bac
kwar
d cl
ass
95
.4
50
79.7
30
2
(41.
0)
47
* 16
84
.7
102
*
16
O
ther
91
.9
295
85
.5
1,59
3
29.5
29
4
96.5
73
84
.3
476
36
.4
73
Wea
lth in
dex
Lo
wes
t nc
0
*
3
nc
0
nc
0
* 2
nc
0
Seco
nd
(86.
6)
21
74.8
56
(3
7.5)
19
*
5
(65.
5)
26
* 4
Mid
dle
90
.0
44
76.5
17
4
23.1
43
*
10
75.2
73
*
10
Fo
urth
94
.2
97
82.8
40
4
22.0
94
(9
7.9)
25
83
.7
157
(4
9.8)
24
Hig
hest
93
.5
301
85
.1
1,68
9
30.8
29
9
96.4
71
85
.8
464
31
.3
71
Tota
l 93
.0
463
83.8
2,
325
28.5
45
5 95
.5
110
83.5
72
2 36
.2
109
Not
e: T
otal
incl
udes
wom
en/m
en w
ith m
issin
g in
form
atio
n on
relig
ion
and
men
with
miss
ing
info
rmat
ion
on c
aste
/trib
e, w
ho a
re n
ot s
how
n se
para
tely
. nc
= N
ot c
alcu
late
d be
caus
e th
ere
are
no c
ases
( )
Bas
ed o
n 25
-49
unw
eigh
ted
case
s.
* Pe
rcen
tage
not
sho
wn;
bas
ed o
n fe
wer
than
25
unw
eigh
ted
case
s.
Delhi.indd 104 3/19/09 12:51:44 PM
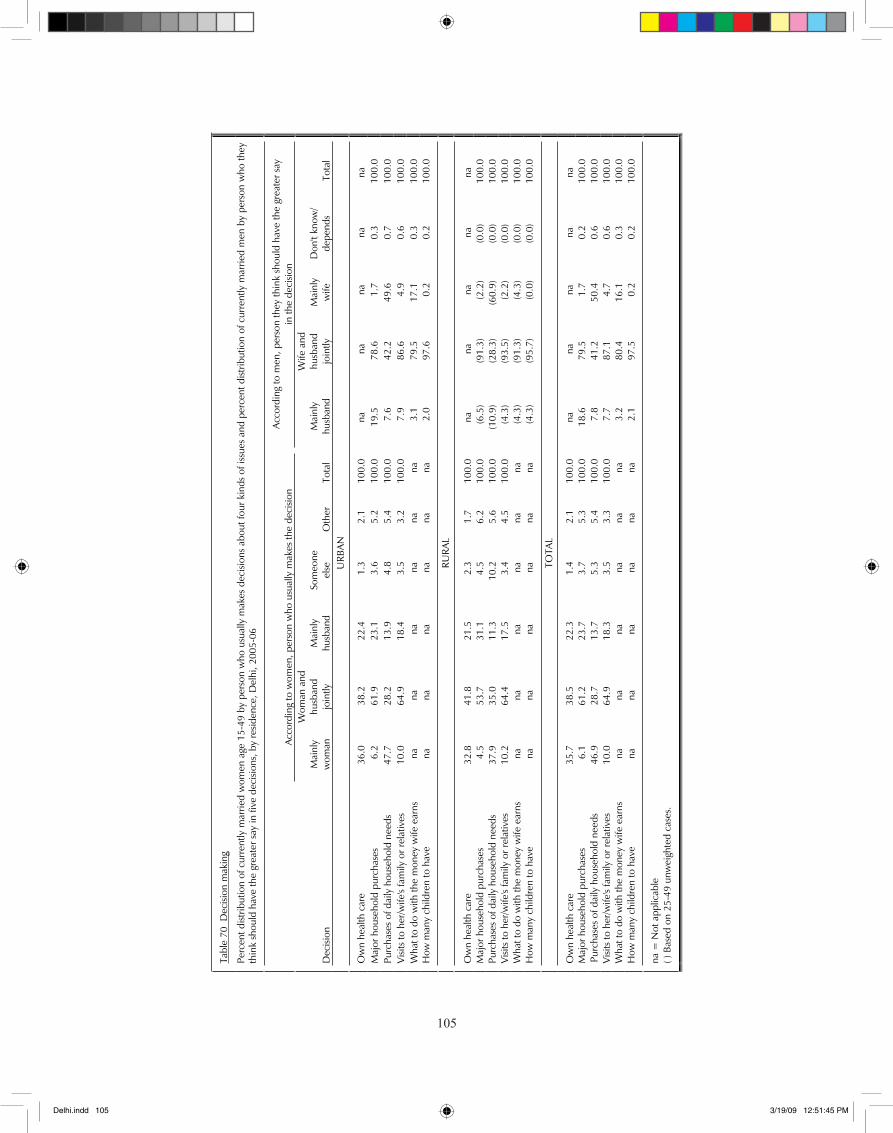
�0�
105
Tab
le 7
0 D
ecisi
on m
akin
g
Perc
ent d
istrib
utio
n of
cur
rent
ly m
arrie
d w
omen
age
15-
49 b
y pe
rson
who
usu
ally
mak
es d
ecisi
ons
abou
t fou
r kin
ds o
f iss
ues
and
perc
ent d
istrib
utio
n of
cur
rent
ly m
arrie
d m
en b
y pe
rson
who
they
thin
k sh
ould
hav
e th
e gr
eate
r say
in fi
ve d
ecisi
ons,
by
resid
ence
, Del
hi, 2
005-
06
Acco
rdin
g to
wom
en, p
erso
n w
ho u
sual
ly m
akes
the
deci
sion
Ac
cord
ing
to m
en, p
erso
n th
ey th
ink
shou
ld h
ave
the
grea
ter s
ay
in th
e de
cisio
n
Dec
ision
M
ainl
y
wom
an
Wom
an a
nd
husb
and
join
tlyM
ainl
yhu
sban
d So
meo
ne
else
O
ther
To
tal
M
ainl
yhu
sban
d
Wife
and
hu
sban
d jo
intly
Mai
nly
wife
D
on't
know
/ de
pend
sTo
tal
URB
AN
Ow
n he
alth
car
e 36
.0
38.2
22
.4
1.3
2.
1
100.
0
na
na
na
na
na
Maj
or h
ouse
hold
pur
chas
es
6.2
61
.9
23.1
3.
6
5.2
10
0.0
19
.5
78.6
1.
7
0.3
10
0.0
Pur
chas
es o
f dai
ly h
ouse
hold
nee
ds
47.7
28
.2
13.9
4.
8
5.4
10
0.0
7.
6
42.2
49
.6
0.7
10
0.0
V
isits
to h
er/w
ife's
fam
ily o
r rel
ativ
es
10.0
64
.9
18.4
3.
5
3.2
10
0.0
7.
9
86.6
4.
9
0.6
10
0.0
W
hat t
o do
with
the
mon
ey w
ife e
arns
na
na
na
na
na
na
3.
1
79.5
17
.1
0.3
10
0.0
H
ow m
any
child
ren
to h
ave
na
na
na
na
na
na
2.0
97
.6
0.2
0.
2
100.
0
RURA
L
Ow
n he
alth
car
e 32
.8
41.8
21
.5
2.3
1.
7
100.
0
na
na
na
na
na
Maj
or h
ouse
hold
pur
chas
es
4.5
53
.7
31.1
4.
5
6.2
10
0.0
(6
.5)
(91.
3)
(2.2
) (0
.0)
100.
0
Pur
chas
es o
f dai
ly h
ouse
hold
nee
ds
37.9
35
.0
11.3
10
.2
5.6
10
0.0
(1
0.9)
(2
8.3)
(6
0.9)
(0
.0)
100.
0
Visi
ts to
her
/wife
's fa
mily
or r
elat
ives
10
.2
64.4
17
.5
3.4
4.
5
100.
0
(4.3
) (9
3.5)
(2
.2)
(0.0
) 10
0.0
W
hat t
o do
with
the
mon
ey w
ife e
arns
na
na
na
na
na
na
(4
.3)
(91.
3)
(4.3
) (0
.0)
100.
0
How
man
y ch
ildre
n to
hav
e na
na
na
na
na
na
(4
.3)
(95.
7)
(0.0
) (0
.0)
100.
0
TOTA
L
Ow
n he
alth
car
e 35
.7
38.5
22
.3
1.4
2.
1
100.
0
na
na
na
na
na
Maj
or h
ouse
hold
pur
chas
es
6.1
61
.2
23.7
3.
7
5.3
10
0.0
18
.6
79.5
1.
7
0.2
10
0.0
Purc
hase
s of
dai
ly h
ouse
hold
nee
ds
46.9
28
.7
13.7
5.
3
5.4
10
0.0
7.
8
41.2
50
.4
0.6
10
0.0
V
isits
to h
er/w
ife's
fam
ily o
r rel
ativ
es
10.0
64
.9
18.3
3.
5
3.3
10
0.0
7.
7
87.1
4.
7
0.6
10
0.0
W
hat t
o do
with
the
mon
ey w
ife e
arns
na
na
na
na
na
na
3.
2
80.4
16
.1
0.3
10
0.0
H
ow m
any
child
ren
to h
ave
na
na
na
na
na
na
2.1
97.5
0.
2 0.
2 10
0.0
na
= N
ot a
pplic
able
( )
Bas
ed o
n 25
-49
unw
eigh
ted
case
s.
Delhi.indd 105 3/19/09 12:51:45 PM
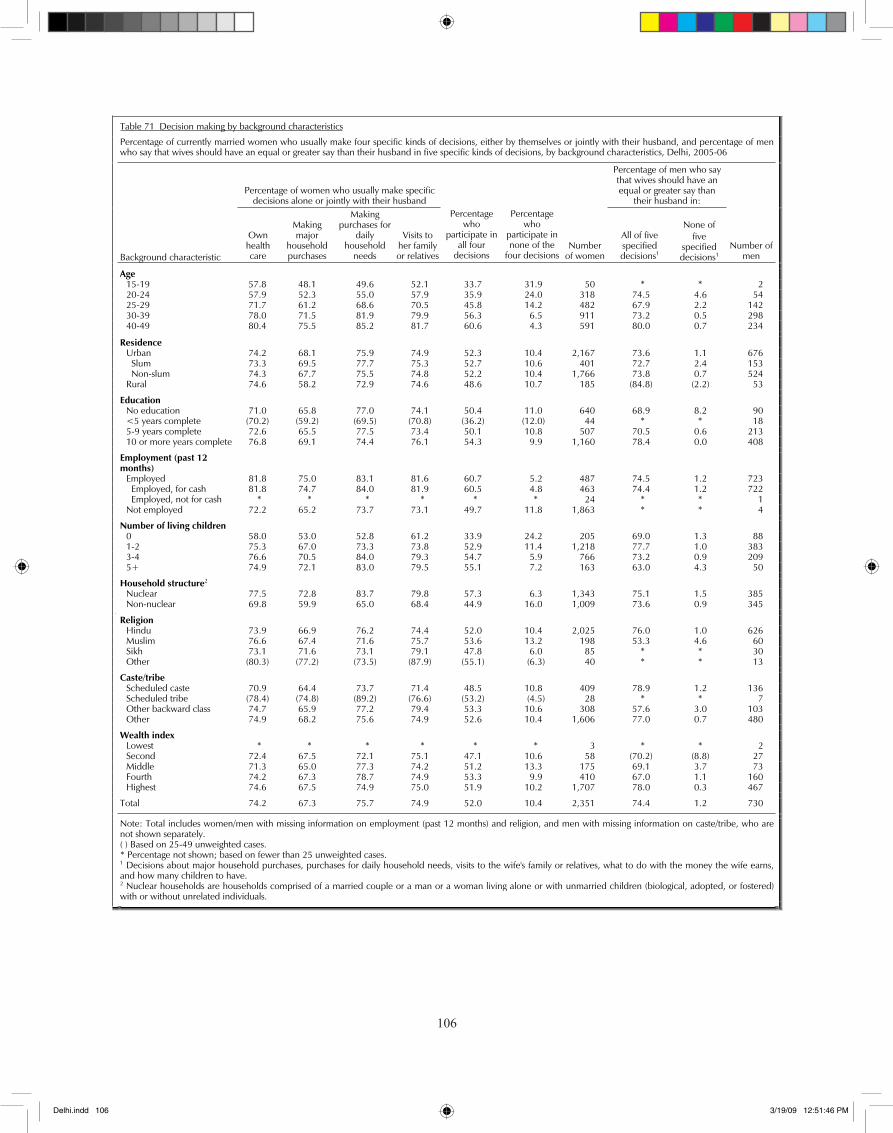
�0�
106
Table 71 Decision making by background characteristics
Percentage of currently married women who usually make four specific kinds of decisions, either by themselves or jointly with their husband, and percentage of men who say that wives should have an equal or greater say than their husband in five specific kinds of decisions, by background characteristics, Delhi, 2005-06
Percentage of women who usually make specific decisions alone or jointly with their husband
Percentage of men who say that wives should have an equal or greater say than
their husband in:
Background characteristic
Own healthcare
Making major
household purchases
Making purchases for
dailyhousehold
needs
Visits to her family or relatives
Percentagewho
participate in all four
decisions
Percentagewho
participate in none of the
four decisionsNumber
of women
All of five specifieddecisions1
None of five
specifieddecisions1
Number of men
Age 15-19 57.8 48.1 49.6 52.1 33.7 31.9 50 * * 2 20-24 57.9 52.3 55.0 57.9 35.9 24.0 318 74.5 4.6 54 25-29 71.7 61.2 68.6 70.5 45.8 14.2 482 67.9 2.2 142 30-39 78.0 71.5 81.9 79.9 56.3 6.5 911 73.2 0.5 298 40-49 80.4 75.5 85.2 81.7 60.6 4.3 591 80.0 0.7 234
Residence Urban 74.2 68.1 75.9 74.9 52.3 10.4 2,167 73.6 1.1 676 Slum 73.3 69.5 77.7 75.3 52.7 10.6 401 72.7 2.4 153 Non-slum 74.3 67.7 75.5 74.8 52.2 10.4 1,766 73.8 0.7 524 Rural 74.6 58.2 72.9 74.6 48.6 10.7 185 (84.8) (2.2) 53
Education No education 71.0 65.8 77.0 74.1 50.4 11.0 640 68.9 8.2 90 <5 years complete (70.2) (59.2) (69.5) (70.8) (36.2) (12.0) 44 * * 18 5-9 years complete 72.6 65.5 77.5 73.4 50.1 10.8 507 70.5 0.6 213 10 or more years complete 76.8 69.1 74.4 76.1 54.3 9.9 1,160 78.4 0.0 408
Employment (past 12 months)
Employed 81.8 75.0 83.1 81.6 60.7 5.2 487 74.5 1.2 723 Employed, for cash 81.8 74.7 84.0 81.9 60.5 4.8 463 74.4 1.2 722 Employed, not for cash * * * * * * 24 * * 1 Not employed 72.2 65.2 73.7 73.1 49.7 11.8 1,863 * * 4
Number of living children 0 58.0 53.0 52.8 61.2 33.9 24.2 205 69.0 1.3 88 1-2 75.3 67.0 73.3 73.8 52.9 11.4 1,218 77.7 1.0 383 3-4 76.6 70.5 84.0 79.3 54.7 5.9 766 73.2 0.9 209 5+ 74.9 72.1 83.0 79.5 55.1 7.2 163 63.0 4.3 50
Household structure2 Nuclear 77.5 72.8 83.7 79.8 57.3 6.3 1,343 75.1 1.5 385 Non-nuclear 69.8 59.9 65.0 68.4 44.9 16.0 1,009 73.6 0.9 345 .
Religion Hindu 73.9 66.9 76.2 74.4 52.0 10.4 2,025 76.0 1.0 626 Muslim 76.6 67.4 71.6 75.7 53.6 13.2 198 53.3 4.6 60 Sikh 73.1 71.6 73.1 79.1 47.8 6.0 85 * * 30 Other (80.3) (77.2) (73.5) (87.9) (55.1) (6.3) 40 * * 13
Caste/tribe Scheduled caste 70.9 64.4 73.7 71.4 48.5 10.8 409 78.9 1.2 136 Scheduled tribe (78.4) (74.8) (89.2) (76.6) (53.2) (4.5) 28 * * 7 Other backward class 74.7 65.9 77.2 79.4 53.3 10.6 308 57.6 3.0 103 Other 74.9 68.2 75.6 74.9 52.6 10.4 1,606 77.0 0.7 480
Wealth index Lowest * * * * * * 3 * * 2 Second 72.4 67.5 72.1 75.1 47.1 10.6 58 (70.2) (8.8) 27 Middle 71.3 65.0 77.3 74.2 51.2 13.3 175 69.1 3.7 73 Fourth 74.2 67.3 78.7 74.9 53.3 9.9 410 67.0 1.1 160 Highest 74.6 67.5 74.9 75.0 51.9 10.2 1,707 78.0 0.3 467
Total 74.2 67.3 75.7 74.9 52.0 10.4 2,351 74.4 1.2 730
Note: Total includes women/men with missing information on employment (past 12 months) and religion, and men with missing information on caste/tribe, who are not shown separately. ( ) Based on 25-49 unweighted cases. * Percentage not shown; based on fewer than 25 unweighted cases. 1 Decisions about major household purchases, purchases for daily household needs, visits to the wife's family or relatives, what to do with the money the wife earns, and how many children to have. 2 Nuclear households are households comprised of a married couple or a man or a woman living alone or with unmarried children (biological, adopted, or fostered) with or without unrelated individuals.
Delhi.indd 106 3/19/09 12:51:46 PM
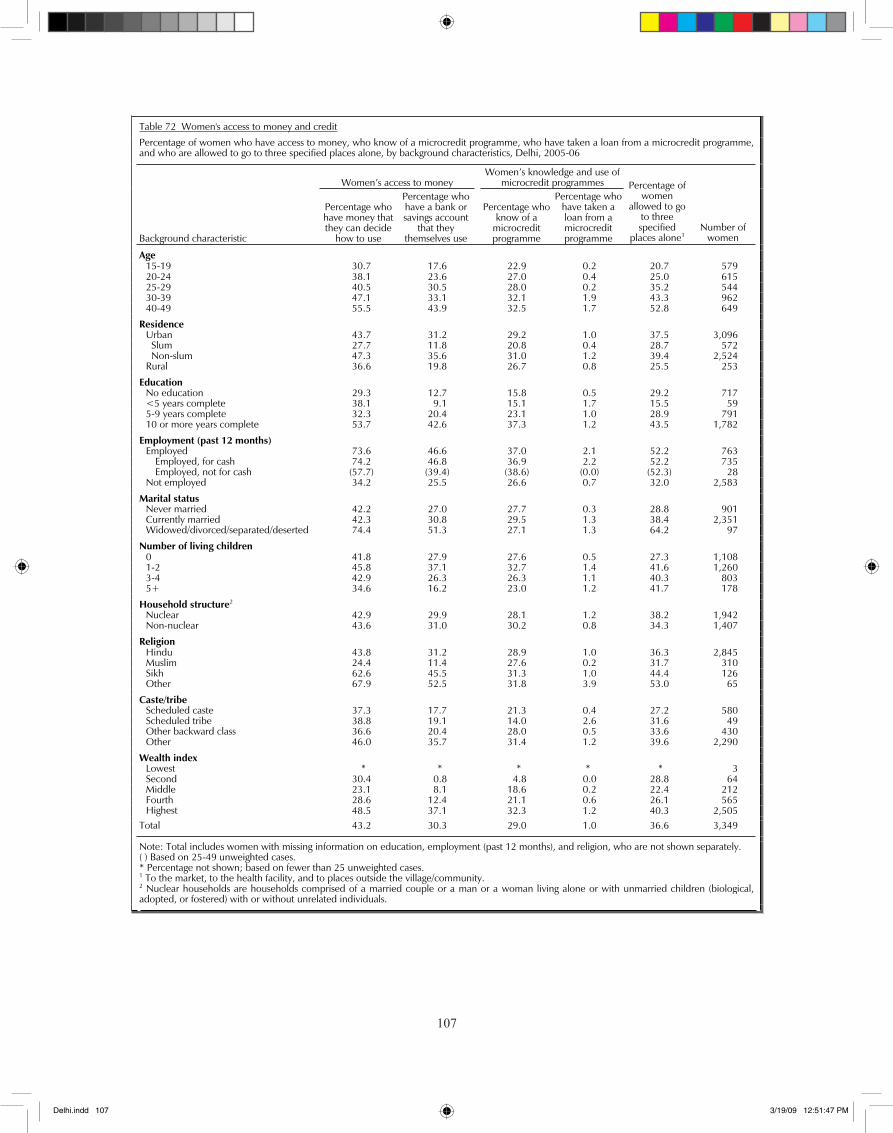
�0�
107
Table 72 Women's access to money and credit
Percentage of women who have access to money, who know of a microcredit programme, who have taken a loan from a microcredit programme, and who are allowed to go to three specified places alone, by background characteristics, Delhi, 2005-06
Women’s access to money Women’s knowledge and use of
microcredit programmes
Background characteristic
Percentage who have money that they can decide
how to use
Percentage who have a bank or savings account
that they themselves use
Percentage who know of a
microcreditprogramme
Percentage who have taken a loan from a microcreditprogramme
Percentage of women
allowed to go to three specified
places alone1Number of
women
Age 15-19 30.7 17.6 22.9 0.2 20.7 579 20-24 38.1 23.6 27.0 0.4 25.0 615 25-29 40.5 30.5 28.0 0.2 35.2 544 30-39 47.1 33.1 32.1 1.9 43.3 962 40-49 55.5 43.9 32.5 1.7 52.8 649
Residence Urban 43.7 31.2 29.2 1.0 37.5 3,096 Slum 27.7 11.8 20.8 0.4 28.7 572 Non-slum 47.3 35.6 31.0 1.2 39.4 2,524 Rural 36.6 19.8 26.7 0.8 25.5 253
Education No education 29.3 12.7 15.8 0.5 29.2 717 <5 years complete 38.1 9.1 15.1 1.7 15.5 59 5-9 years complete 32.3 20.4 23.1 1.0 28.9 791 10 or more years complete 53.7 42.6 37.3 1.2 43.5 1,782
Employment (past 12 months) Employed 73.6 46.6 37.0 2.1 52.2 763 Employed, for cash 74.2 46.8 36.9 2.2 52.2 735 Employed, not for cash (57.7) (39.4) (38.6) (0.0) (52.3) 28 Not employed 34.2 25.5 26.6 0.7 32.0 2,583
Marital status Never married 42.2 27.0 27.7 0.3 28.8 901 Currently married 42.3 30.8 29.5 1.3 38.4 2,351 Widowed/divorced/separated/deserted 74.4 51.3 27.1 1.3 64.2 97
Number of living children 0 41.8 27.9 27.6 0.5 27.3 1,108 1-2 45.8 37.1 32.7 1.4 41.6 1,260 3-4 42.9 26.3 26.3 1.1 40.3 803 5+ 34.6 16.2 23.0 1.2 41.7 178
Household structure2 Nuclear 42.9 29.9 28.1 1.2 38.2 1,942 Non-nuclear 43.6 31.0 30.2 0.8 34.3 1,407
Religion Hindu 43.8 31.2 28.9 1.0 36.3 2,845 Muslim 24.4 11.4 27.6 0.2 31.7 310 Sikh 62.6 45.5 31.3 1.0 44.4 126 Other 67.9 52.5 31.8 3.9 53.0 65
Caste/tribe Scheduled caste 37.3 17.7 21.3 0.4 27.2 580 Scheduled tribe 38.8 19.1 14.0 2.6 31.6 49 Other backward class 36.6 20.4 28.0 0.5 33.6 430 Other 46.0 35.7 31.4 1.2 39.6 2,290
Wealth index Lowest * * * * * 3 Second 30.4 0.8 4.8 0.0 28.8 64 Middle 23.1 8.1 18.6 0.2 22.4 212 Fourth 28.6 12.4 21.1 0.6 26.1 565
Highest 48.5 37.1 32.3 1.2 40.3 2,505
Total 43.2 30.3 29.0 1.0 36.6 3,349
Note: Total includes women with missing information on education, employment (past 12 months), and religion, who are not shown separately.( ) Based on 25-49 unweighted cases. * Percentage not shown; based on fewer than 25 unweighted cases. 1 To the market, to the health facility, and to places outside the village/community. 2 Nuclear households are households comprised of a married couple or a man or a woman living alone or with unmarried children (biological, adopted, or fostered) with or without unrelated individuals.
Delhi.indd 107 3/19/09 12:51:47 PM
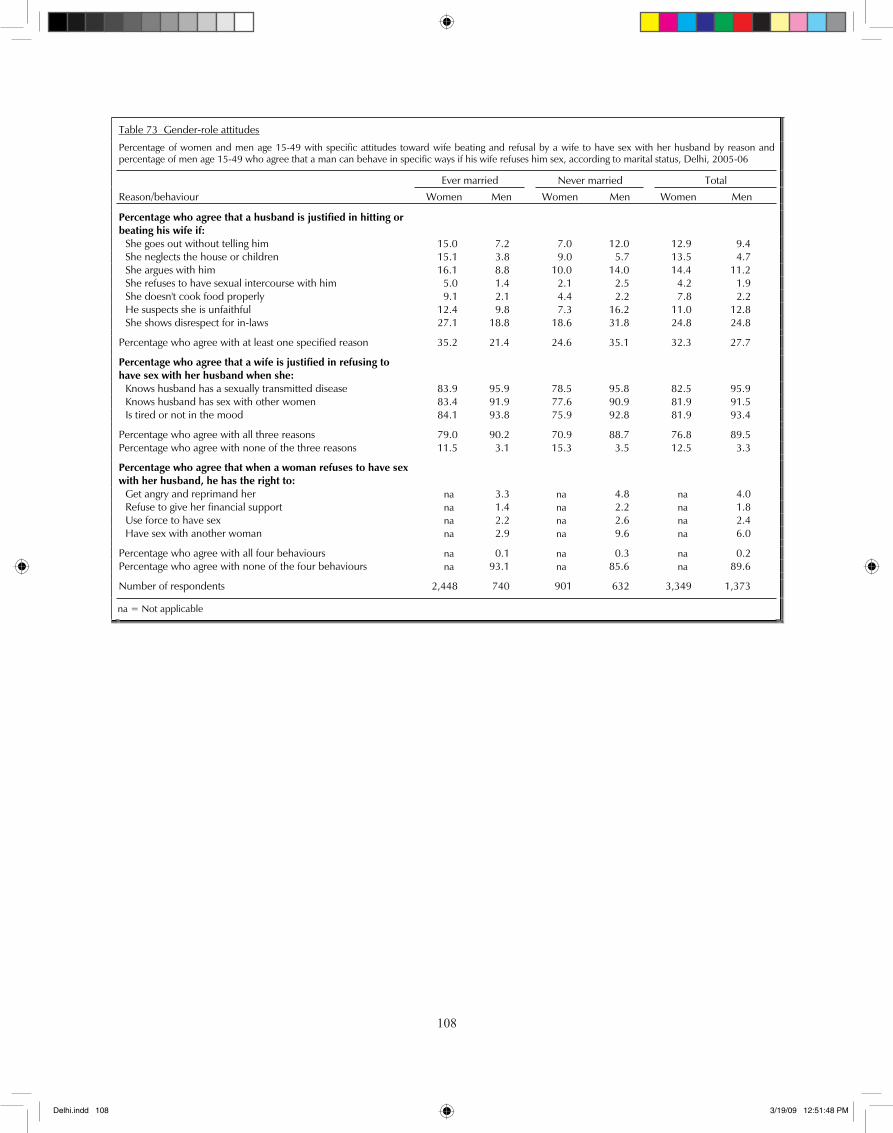
�0�
108
Table 73 Gender-role attitudes
Percentage of women and men age 15-49 with specific attitudes toward wife beating and refusal by a wife to have sex with her husband by reason and percentage of men age 15-49 who agree that a man can behave in specific ways if his wife refuses him sex, according to marital status, Delhi, 2005-06
Ever married Never married Total
Reason/behaviour Women Men Women Men Women Men
Percentage who agree that a husband is justified in hitting or beating his wife if:
She goes out without telling him 15.0 7.2 7.0 12.0 12.9 9.4 She neglects the house or children 15.1 3.8 9.0 5.7 13.5 4.7 She argues with him 16.1 8.8 10.0 14.0 14.4 11.2 She refuses to have sexual intercourse with him 5.0 1.4 2.1 2.5 4.2 1.9 She doesn't cook food properly 9.1 2.1 4.4 2.2 7.8 2.2 He suspects she is unfaithful 12.4 9.8 7.3 16.2 11.0 12.8 She shows disrespect for in-laws 27.1 18.8 18.6 31.8 24.8 24.8
Percentage who agree with at least one specified reason 35.2 21.4 24.6 35.1 32.3 27.7
Percentage who agree that a wife is justified in refusing to have sex with her husband when she:
Knows husband has a sexually transmitted disease 83.9 95.9 78.5 95.8 82.5 95.9 Knows husband has sex with other women 83.4 91.9 77.6 90.9 81.9 91.5 Is tired or not in the mood 84.1 93.8 75.9 92.8 81.9 93.4
Percentage who agree with all three reasons 79.0 90.2 70.9 88.7 76.8 89.5 Percentage who agree with none of the three reasons 11.5 3.1 15.3 3.5 12.5 3.3
Percentage who agree that when a woman refuses to have sex with her husband, he has the right to:
Get angry and reprimand her na 3.3 na 4.8 na 4.0 Refuse to give her financial support na 1.4 na 2.2 na 1.8 Use force to have sex na 2.2 na 2.6 na 2.4 Have sex with another woman na 2.9 na 9.6 na 6.0
Percentage who agree with all four behaviours na 0.1 na 0.3 na 0.2 Percentage who agree with none of the four behaviours na 93.1 na 85.6 na 89.6
Number of respondents 2,448 740 901 632 3,349 1,373
na = Not applicable
Delhi.indd 108 3/19/09 12:51:48 PM
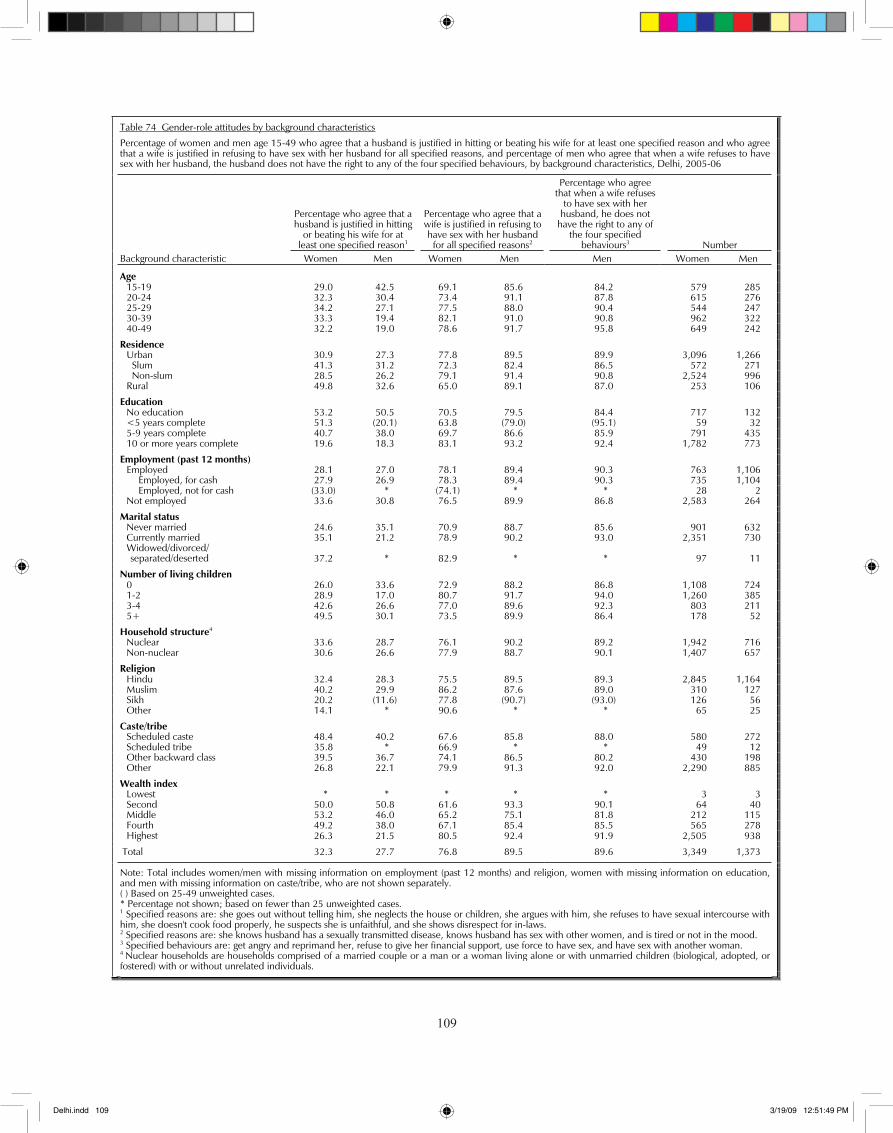
�0�
109
Table 74 Gender-role attitudes by background characteristics
Percentage of women and men age 15-49 who agree that a husband is justified in hitting or beating his wife for at least one specified reason and who agreethat a wife is justified in refusing to have sex with her husband for all specified reasons, and percentage of men who agree that when a wife refuses to have sex with her husband, the husband does not have the right to any of the four specified behaviours, by background characteristics, Delhi, 2005-06
Percentage who agree that a husband is justified in hitting
or beating his wife for at least one specified reason1
Percentage who agree that a wife is justified in refusing to have sex with her husband
for all specified reasons2
Percentage who agree that when a wife refuses
to have sex with her husband, he does not
have the right to any of the four specified
behaviours3 Number Background characteristic Women Men Women Men Men Women Men
Age 15-19 29.0 42.5 69.1 85.6 84.2 579 285 20-24 32.3 30.4 73.4 91.1 87.8 615 276 25-29 34.2 27.1 77.5 88.0 90.4 544 247 30-39 33.3 19.4 82.1 91.0 90.8 962 322 40-49 32.2 19.0 78.6 91.7 95.8 649 242
Residence Urban 30.9 27.3 77.8 89.5 89.9 3,096 1,266 Slum 41.3 31.2 72.3 82.4 86.5 572 271 Non-slum 28.5 26.2 79.1 91.4 90.8 2,524 996 Rural 49.8 32.6 65.0 89.1 87.0 253 106
Education No education 53.2 50.5 70.5 79.5 84.4 717 132 <5 years complete 51.3 (20.1) 63.8 (79.0) (95.1) 59 32 5-9 years complete 40.7 38.0 69.7 86.6 85.9 791 435 10 or more years complete 19.6 18.3 83.1 93.2 92.4 1,782 773
Employment (past 12 months) Employed 28.1 27.0 78.1 89.4 90.3 763 1,106 Employed, for cash 27.9 26.9 78.3 89.4 90.3 735 1,104 Employed, not for cash (33.0) * (74.1) * * 28 2 Not employed 33.6 30.8 76.5 89.9 86.8 2,583 264
Marital status Never married 24.6 35.1 70.9 88.7 85.6 901 632 Currently married 35.1 21.2 78.9 90.2 93.0 2,351 730
Widowed/divorced/ separated/deserted 37.2 * 82.9 * * 97 11
Number of living children 0 26.0 33.6 72.9 88.2 86.8 1,108 724 1-2 28.9 17.0 80.7 91.7 94.0 1,260 385 3-4 42.6 26.6 77.0 89.6 92.3 803 211 5+ 49.5 30.1 73.5 89.9 86.4 178 52
Household structure4 Nuclear 33.6 28.7 76.1 90.2 89.2 1,942 716 Non-nuclear 30.6 26.6 77.9 88.7 90.1 1,407 657
Religion Hindu 32.4 28.3 75.5 89.5 89.3 2,845 1,164 Muslim 40.2 29.9 86.2 87.6 89.0 310 127 Sikh 20.2 (11.6) 77.8 (90.7) (93.0) 126 56 Other 14.1 * 90.6 * * 65 25
Caste/tribe Scheduled caste 48.4 40.2 67.6 85.8 88.0 580 272 Scheduled tribe 35.8 * 66.9 * * 49 12 Other backward class 39.5 36.7 74.1 86.5 80.2 430 198 Other 26.8 22.1 79.9 91.3 92.0 2,290 885
Wealth index Lowest * * * * * 3 3 Second 50.0 50.8 61.6 93.3 90.1 64 40 Middle 53.2 46.0 65.2 75.1 81.8 212 115 Fourth 49.2 38.0 67.1 85.4 85.5 565 278
Highest 26.3 21.5 80.5 92.4 91.9 2,505 938
Total 32.3 27.7 76.8 89.5 89.6 3,349 1,373
Note: Total includes women/men with missing information on employment (past 12 months) and religion, women with missing information on education, and men with missing information on caste/tribe, who are not shown separately. ( ) Based on 25-49 unweighted cases. * Percentage not shown; based on fewer than 25 unweighted cases. 1 Specified reasons are: she goes out without telling him, she neglects the house or children, she argues with him, she refuses to have sexual intercourse with him, she doesn't cook food properly, he suspects she is unfaithful, and she shows disrespect for in-laws. 2 Specified reasons are: she knows husband has a sexually transmitted disease, knows husband has sex with other women, and is tired or not in the mood. 3 Specified behaviours are: get angry and reprimand her, refuse to give her financial support, use force to have sex, and have sex with another woman. 4 Nuclear households are households comprised of a married couple or a man or a woman living alone or with unmarried children (biological, adopted, or fostered) with or without unrelated individuals.
Delhi.indd 109 3/19/09 12:51:49 PM
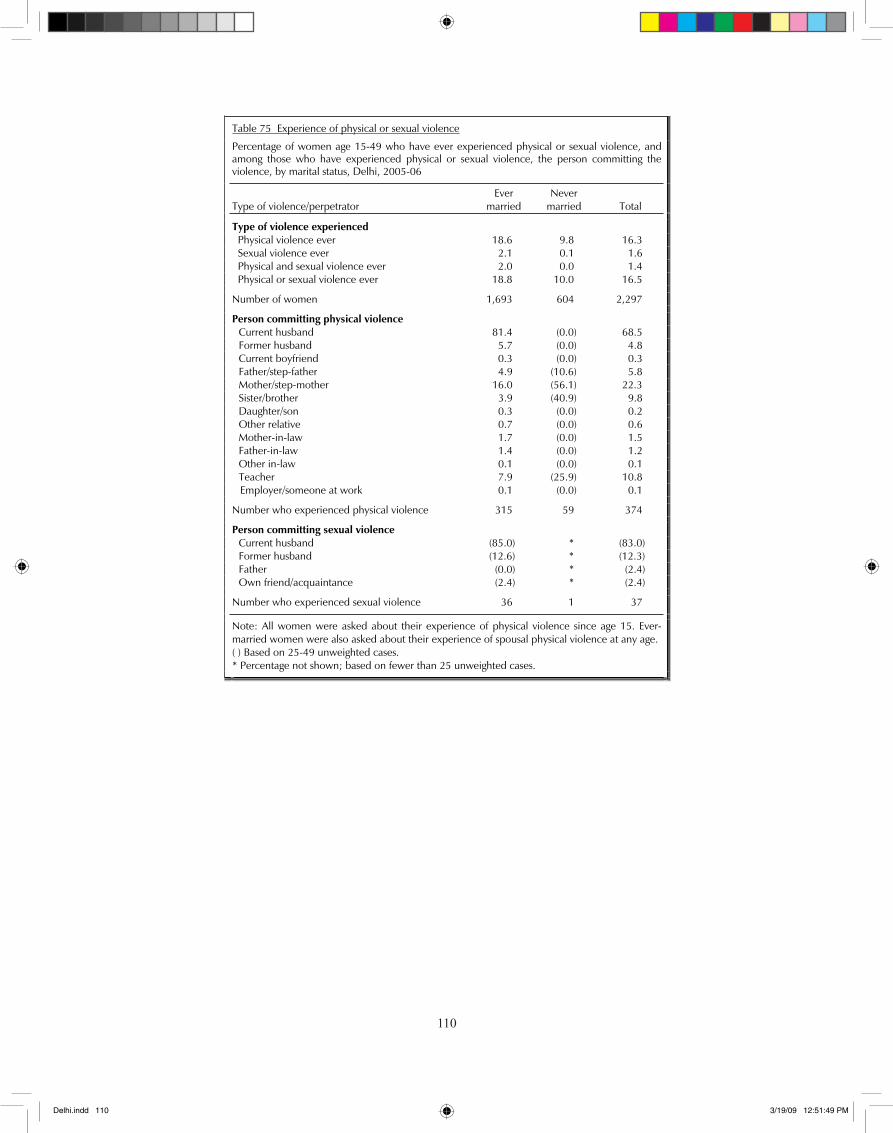
��0
110
Table 75 Experience of physical or sexual violence
Percentage of women age 15-49 who have ever experienced physical or sexual violence, and among those who have experienced physical or sexual violence, the person committing the violence, by marital status, Delhi, 2005-06
Type of violence/perpetrator Ever
married Never
married Total
Type of violence experienced Physical violence ever 18.6 9.8 16.3 Sexual violence ever 2.1 0.1 1.6 Physical and sexual violence ever 2.0 0.0 1.4 Physical or sexual violence ever 18.8 10.0 16.5
Number of women 1,693 604 2,297
Person committing physical violence Current husband 81.4 (0.0) 68.5 Former husband 5.7 (0.0) 4.8 Current boyfriend 0.3 (0.0) 0.3 Father/step-father 4.9 (10.6) 5.8 Mother/step-mother 16.0 (56.1) 22.3 Sister/brother 3.9 (40.9) 9.8 Daughter/son 0.3 (0.0) 0.2 Other relative 0.7 (0.0) 0.6 Mother-in-law 1.7 (0.0) 1.5 Father-in-law 1.4 (0.0) 1.2 Other in-law 0.1 (0.0) 0.1 Teacher 7.9 (25.9) 10.8
Employer/someone at work 0.1 (0.0) 0.1
Number who experienced physical violence 315 59 374
Person committing sexual violence Current husband (85.0) * (83.0) Former husband (12.6) * (12.3) Father (0.0) * (2.4) Own friend/acquaintance (2.4) * (2.4)
Number who experienced sexual violence 36 1 37
Note: All women were asked about their experience of physical violence since age 15. Ever-married women were also asked about their experience of spousal physical violence at any age. ( ) Based on 25-49 unweighted cases. * Percentage not shown; based on fewer than 25 unweighted cases.
Delhi.indd 110 3/19/09 12:51:49 PM
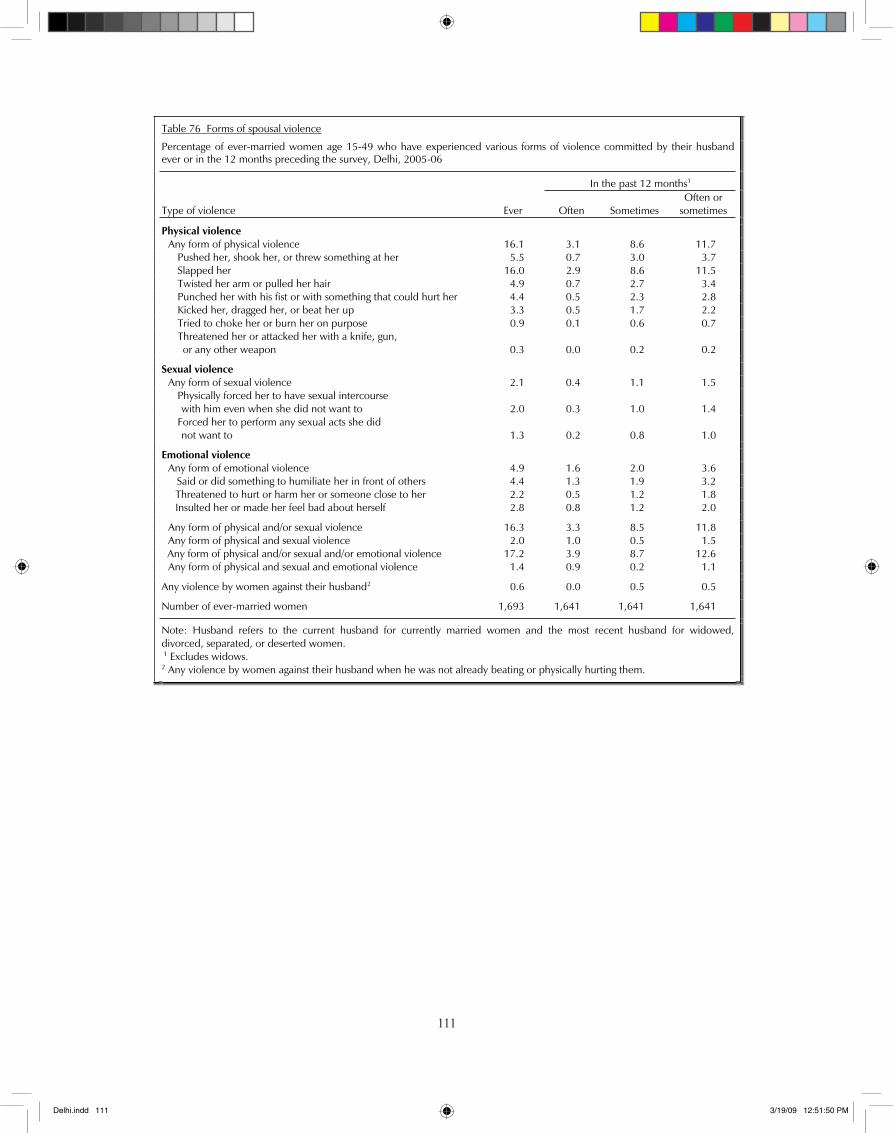
���
111
Table 76 Forms of spousal violence
Percentage of ever-married women age 15-49 who have experienced various forms of violence committed by their husband ever or in the 12 months preceding the survey, Delhi, 2005-06
In the past 12 months1
Type of violence Ever Often Sometimes Often or
sometimes
Physical violence Any form of physical violence 16.1 3.1 8.6 11.7 Pushed her, shook her, or threw something at her 5.5 0.7 3.0 3.7 Slapped her 16.0 2.9 8.6 11.5 Twisted her arm or pulled her hair 4.9 0.7 2.7 3.4 Punched her with his fist or with something that could hurt her 4.4 0.5 2.3 2.8 Kicked her, dragged her, or beat her up 3.3 0.5 1.7 2.2 Tried to choke her or burn her on purpose 0.9 0.1 0.6 0.7
Threatened her or attacked her with a knife, gun, or any other weapon 0.3 0.0 0.2 0.2
Sexual violence Any form of sexual violence 2.1 0.4 1.1 1.5
Physically forced her to have sexual intercourse with him even when she did not want to 2.0 0.3 1.0 1.4
Forced her to perform any sexual acts she did not want to 1.3 0.2 0.8 1.0
Emotional violence Any form of emotional violence 4.9 1.6 2.0 3.6 Said or did something to humiliate her in front of others 4.4 1.3 1.9 3.2 Threatened to hurt or harm her or someone close to her 2.2 0.5 1.2 1.8 Insulted her or made her feel bad about herself 2.8 0.8 1.2 2.0
Any form of physical and/or sexual violence 16.3 3.3 8.5 11.8 Any form of physical and sexual violence 2.0 1.0 0.5 1.5 Any form of physical and/or sexual and/or emotional violence 17.2 3.9 8.7 12.6 Any form of physical and sexual and emotional violence 1.4 0.9 0.2 1.1
Any violence by women against their husband2 0.6 0.0 0.5 0.5
Number of ever-married women 1,693 1,641 1,641 1,641
Note: Husband refers to the current husband for currently married women and the most recent husband for widowed, divorced, separated, or deserted women. 1 Excludes widows. 2 Any violence by women against their husband when he was not already beating or physically hurting them.
Delhi.indd 111 3/19/09 12:51:50 PM
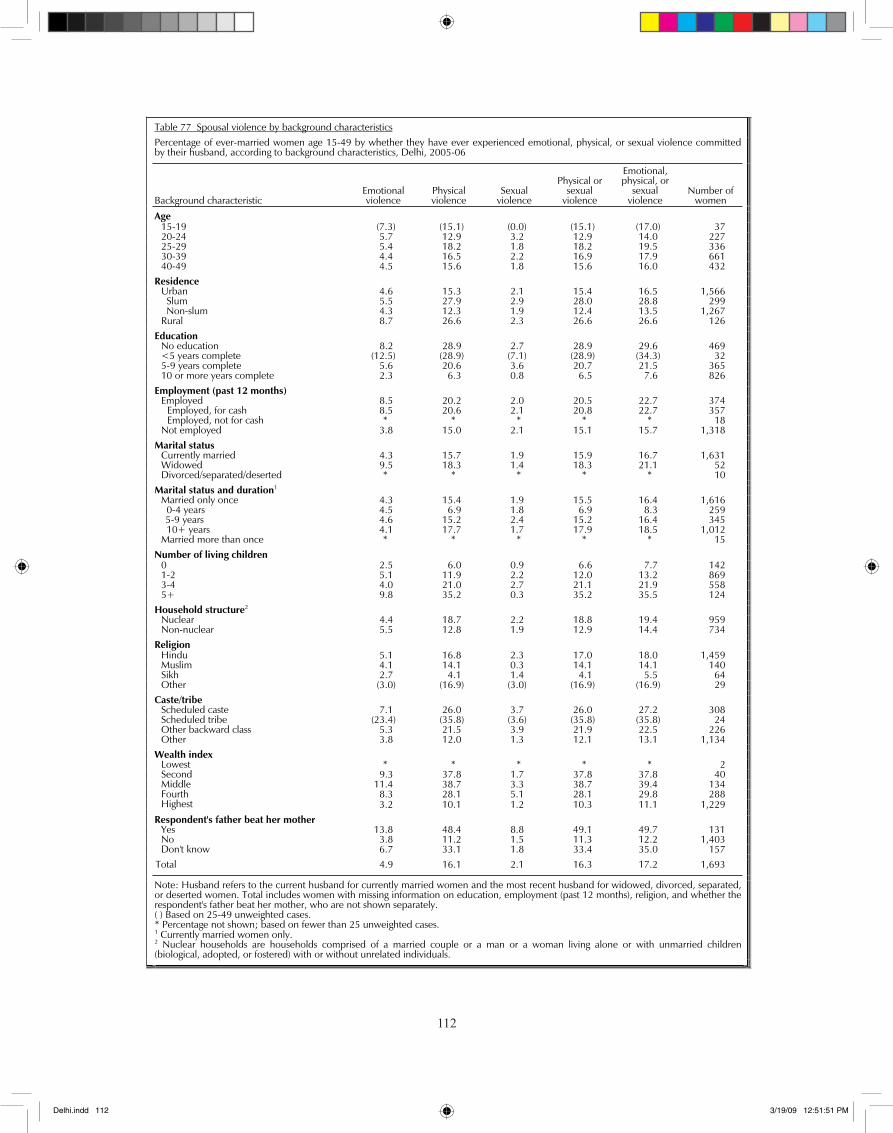
���
112
Table 77 Spousal violence by background characteristicsPercentage of ever-married women age 15-49 by whether they have ever experienced emotional, physical, or sexual violence committed by their husband, according to background characteristics, Delhi, 2005-06
Background characteristic Emotional violence
Physicalviolence
Sexualviolence
Physical or sexual
violence
Emotional, physical, or
sexualviolence
Number of women
Age 15-19 (7.3) (15.1) (0.0) (15.1) (17.0) 37 20-24 5.7 12.9 3.2 12.9 14.0 227 25-29 5.4 18.2 1.8 18.2 19.5 336 30-39 4.4 16.5 2.2 16.9 17.9 661 40-49 4.5 15.6 1.8 15.6 16.0 432
Residence Urban 4.6 15.3 2.1 15.4 16.5 1,566 Slum 5.5 27.9 2.9 28.0 28.8 299 Non-slum 4.3 12.3 1.9 12.4 13.5 1,267 Rural 8.7 26.6 2.3 26.6 26.6 126
Education No education 8.2 28.9 2.7 28.9 29.6 469 <5 years complete (12.5) (28.9) (7.1) (28.9) (34.3) 32 5-9 years complete 5.6 20.6 3.6 20.7 21.5 365 10 or more years complete 2.3 6.3 0.8 6.5 7.6 826
Employment (past 12 months) Employed 8.5 20.2 2.0 20.5 22.7 374 Employed, for cash 8.5 20.6 2.1 20.8 22.7 357 Employed, not for cash * * * * * 18 Not employed 3.8 15.0 2.1 15.1 15.7 1,318
Marital status Currently married 4.3 15.7 1.9 15.9 16.7 1,631 Widowed 9.5 18.3 1.4 18.3 21.1 52 Divorced/separated/deserted * * * * * 10
Marital status and duration1 Married only once 4.3 15.4 1.9 15.5 16.4 1,616 0-4 years 4.5 6.9 1.8 6.9 8.3 259 5-9 years 4.6 15.2 2.4 15.2 16.4 345 10+ years 4.1 17.7 1.7 17.9 18.5 1,012 Married more than once * * * * * 15
Number of living children 0 2.5 6.0 0.9 6.6 7.7 142 1-2 5.1 11.9 2.2 12.0 13.2 869 3-4 4.0 21.0 2.7 21.1 21.9 558 5+ 9.8 35.2 0.3 35.2 35.5 124
Household structure2 Nuclear 4.4 18.7 2.2 18.8 19.4 959 Non-nuclear 5.5 12.8 1.9 12.9 14.4 734
Religion Hindu 5.1 16.8 2.3 17.0 18.0 1,459 Muslim 4.1 14.1 0.3 14.1 14.1 140 Sikh 2.7 4.1 1.4 4.1 5.5 64 Other (3.0) (16.9) (3.0) (16.9) (16.9) 29
Caste/tribe Scheduled caste 7.1 26.0 3.7 26.0 27.2 308 Scheduled tribe (23.4) (35.8) (3.6) (35.8) (35.8) 24 Other backward class 5.3 21.5 3.9 21.9 22.5 226 Other 3.8 12.0 1.3 12.1 13.1 1,134
Wealth index Lowest * * * * * 2 Second 9.3 37.8 1.7 37.8 37.8 40 Middle 11.4 38.7 3.3 38.7 39.4 134 Fourth 8.3 28.1 5.1 28.1 29.8 288
Highest 3.2 10.1 1.2 10.3 11.1 1,229
Respondent's father beat her mother Yes 13.8 48.4 8.8 49.1 49.7 131 No 3.8 11.2 1.5 11.3 12.2 1,403 Don't know 6.7 33.1 1.8 33.4 35.0 157
Total 4.9 16.1 2.1 16.3 17.2 1,693
Note: Husband refers to the current husband for currently married women and the most recent husband for widowed, divorced, separated, or deserted women. Total includes women with missing information on education, employment (past 12 months), religion, and whether the respondent's father beat her mother, who are not shown separately. ( ) Based on 25-49 unweighted cases. * Percentage not shown; based on fewer than 25 unweighted cases. 1 Currently married women only. 2 Nuclear households are households comprised of a married couple or a man or a woman living alone or with unmarried children (biological, adopted, or fostered) with or without unrelated individuals.
Delhi.indd 112 3/19/09 12:51:51 PM
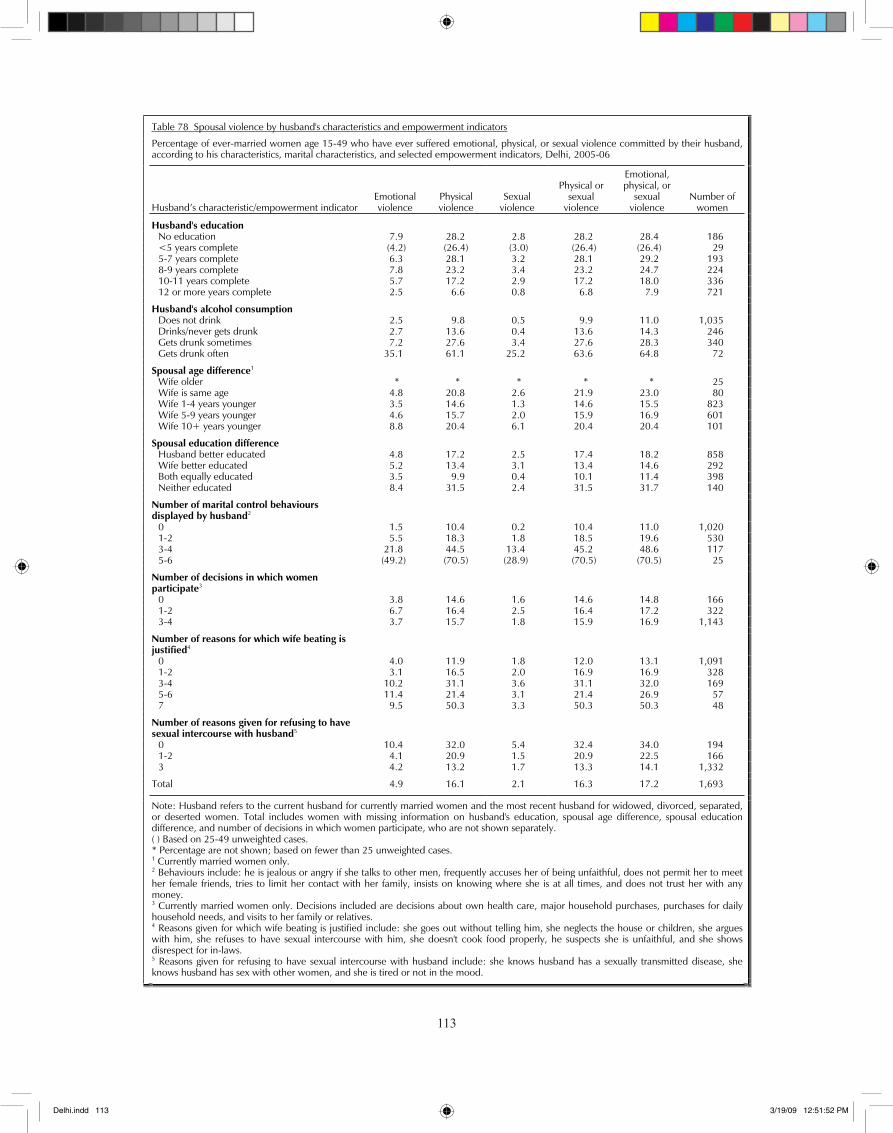
���
113
Table 78 Spousal violence by husband's characteristics and empowerment indicators
Percentage of ever-married women age 15-49 who have ever suffered emotional, physical, or sexual violence committed by their husband, according to his characteristics, marital characteristics, and selected empowerment indicators, Delhi, 2005-06
Husband’s characteristic/empowerment indicator Emotional violence
Physicalviolence
Sexualviolence
Physical or sexual
violence
Emotional, physical, or
sexualviolence
Number of women
Husband's education No education 7.9 28.2 2.8 28.2 28.4 186 <5 years complete (4.2) (26.4) (3.0) (26.4) (26.4) 29 5-7 years complete 6.3 28.1 3.2 28.1 29.2 193 8-9 years complete 7.8 23.2 3.4 23.2 24.7 224 10-11 years complete 5.7 17.2 2.9 17.2 18.0 336 12 or more years complete 2.5 6.6 0.8 6.8 7.9 721
Husband's alcohol consumption Does not drink 2.5 9.8 0.5 9.9 11.0 1,035 Drinks/never gets drunk 2.7 13.6 0.4 13.6 14.3 246 Gets drunk sometimes 7.2 27.6 3.4 27.6 28.3 340 Gets drunk often 35.1 61.1 25.2 63.6 64.8 72
Spousal age difference1 Wife older * * * * * 25 Wife is same age 4.8 20.8 2.6 21.9 23.0 80 Wife 1-4 years younger 3.5 14.6 1.3 14.6 15.5 823 Wife 5-9 years younger 4.6 15.7 2.0 15.9 16.9 601 Wife 10+ years younger 8.8 20.4 6.1 20.4 20.4 101
Spousal education difference Husband better educated 4.8 17.2 2.5 17.4 18.2 858 Wife better educated 5.2 13.4 3.1 13.4 14.6 292 Both equally educated 3.5 9.9 0.4 10.1 11.4 398 Neither educated 8.4 31.5 2.4 31.5 31.7 140
Number of marital control behaviours displayed by husband2
0 1.5 10.4 0.2 10.4 11.0 1,020 1-2 5.5 18.3 1.8 18.5 19.6 530 3-4 21.8 44.5 13.4 45.2 48.6 117 5-6 (49.2) (70.5) (28.9) (70.5) (70.5) 25
Number of decisions in which women participate3
0 3.8 14.6 1.6 14.6 14.8 166 1-2 6.7 16.4 2.5 16.4 17.2 322 3-4 3.7 15.7 1.8 15.9 16.9 1,143
Number of reasons for which wife beating is justified4
0 4.0 11.9 1.8 12.0 13.1 1,091 1-2 3.1 16.5 2.0 16.9 16.9 328 3-4 10.2 31.1 3.6 31.1 32.0 169 5-6 11.4 21.4 3.1 21.4 26.9 57 7 9.5 50.3 3.3 50.3 50.3 48
Number of reasons given for refusing to have sexual intercourse with husband5
0 10.4 32.0 5.4 32.4 34.0 194 1-2 4.1 20.9 1.5 20.9 22.5 166 3 4.2 13.2 1.7 13.3 14.1 1,332
Total 4.9 16.1 2.1 16.3 17.2 1,693
Note: Husband refers to the current husband for currently married women and the most recent husband for widowed, divorced, separated, or deserted women. Total includes women with missing information on husband's education, spousal age difference, spousal education difference, and number of decisions in which women participate, who are not shown separately. ( ) Based on 25-49 unweighted cases. * Percentage are not shown; based on fewer than 25 unweighted cases. 1 Currently married women only. 2 Behaviours include: he is jealous or angry if she talks to other men, frequently accuses her of being unfaithful, does not permit her to meet her female friends, tries to limit her contact with her family, insists on knowing where she is at all times, and does not trust her with anymoney. 3 Currently married women only. Decisions included are decisions about own health care, major household purchases, purchases for dailyhousehold needs, and visits to her family or relatives. 4 Reasons given for which wife beating is justified include: she goes out without telling him, she neglects the house or children, she argueswith him, she refuses to have sexual intercourse with him, she doesn't cook food properly, he suspects she is unfaithful, and she shows disrespect for in-laws. 5 Reasons given for refusing to have sexual intercourse with husband include: she knows husband has a sexually transmitted disease, she knows husband has sex with other women, and she is tired or not in the mood.
Delhi.indd 113 3/19/09 12:51:52 PM
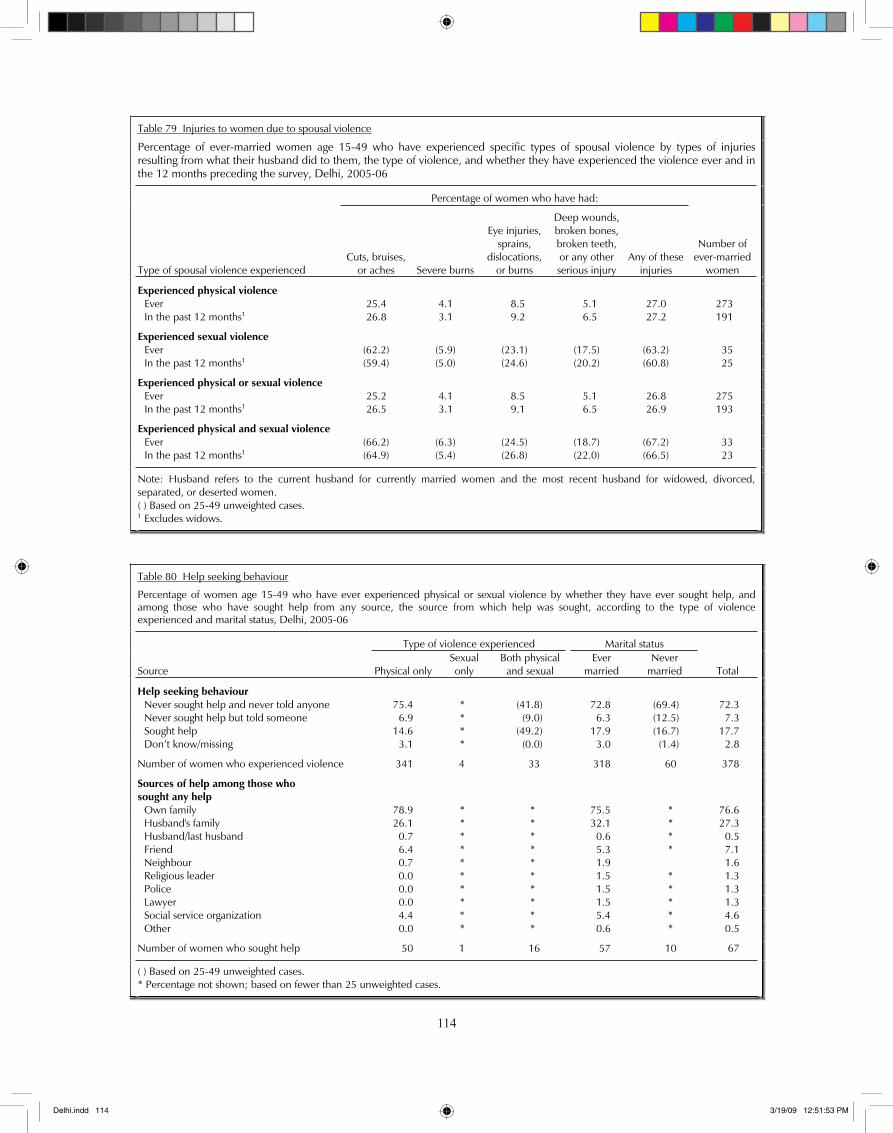
���
114
Table 79 Injuries to women due to spousal violence
Percentage of ever-married women age 15-49 who have experienced specific types of spousal violence by types of injuries resulting from what their husband did to them, the type of violence, and whether they have experienced the violence ever and in the 12 months preceding the survey, Delhi, 2005-06
Percentage of women who have had:
Type of spousal violence experienced Cuts, bruises,
or aches Severe burns
Eye injuries, sprains,
dislocations, or burns
Deep wounds, broken bones, broken teeth, or any other serious injury
Any of these injuries
Number of ever-married
women
Experienced physical violence Ever 25.4 4.1 8.5 5.1 27.0 273 In the past 12 months1 26.8 3.1 9.2 6.5 27.2 191
Experienced sexual violence Ever (62.2) (5.9) (23.1) (17.5) (63.2) 35 In the past 12 months1 (59.4) (5.0) (24.6) (20.2) (60.8) 25
Experienced physical or sexual violence Ever 25.2 4.1 8.5 5.1 26.8 275 In the past 12 months1 26.5 3.1 9.1 6.5 26.9 193
Experienced physical and sexual violence Ever (66.2) (6.3) (24.5) (18.7) (67.2) 33 In the past 12 months1 (64.9) (5.4) (26.8) (22.0) (66.5) 23
Note: Husband refers to the current husband for currently married women and the most recent husband for widowed, divorced, separated, or deserted women. ( ) Based on 25-49 unweighted cases. 1 Excludes widows.
Table 80 Help seeking behaviour
Percentage of women age 15-49 who have ever experienced physical or sexual violence by whether they have ever sought help, andamong those who have sought help from any source, the source from which help was sought, according to the type of violence experienced and marital status, Delhi, 2005-06
Type of violence experienced Marital status
Source Physical onlySexualonly
Both physical and sexual
Evermarried
Never married Total
Help seeking behaviour Never sought help and never told anyone 75.4 * (41.8) 72.8 (69.4) 72.3 Never sought help but told someone 6.9 * (9.0) 6.3 (12.5) 7.3 Sought help 14.6 * (49.2) 17.9 (16.7) 17.7 Don’t know/missing 3.1 * (0.0) 3.0 (1.4) 2.8
Number of women who experienced violence 341 4 33 318 60 378
Sources of help among those who sought any help
Own family 78.9 * * 75.5 * 76.6 Husband's family 26.1 * * 32.1 * 27.3 Husband/last husband 0.7 * * 0.6 * 0.5 Friend 6.4 * * 5.3 * 7.1 Neighbour 0.7 * * 1.9 1.6 Religious leader 0.0 * * 1.5 * 1.3 Police 0.0 * * 1.5 * 1.3 Lawyer 0.0 * * 1.5 * 1.3
Social service organization 4.4 * * 5.4 * 4.6 Other 0.0 * * 0.6 * 0.5
Number of women who sought help 50 1 16 57 10 67
( ) Based on 25-49 unweighted cases. * Percentage not shown; based on fewer than 25 unweighted cases.
Delhi.indd 114 3/19/09 12:51:53 PM
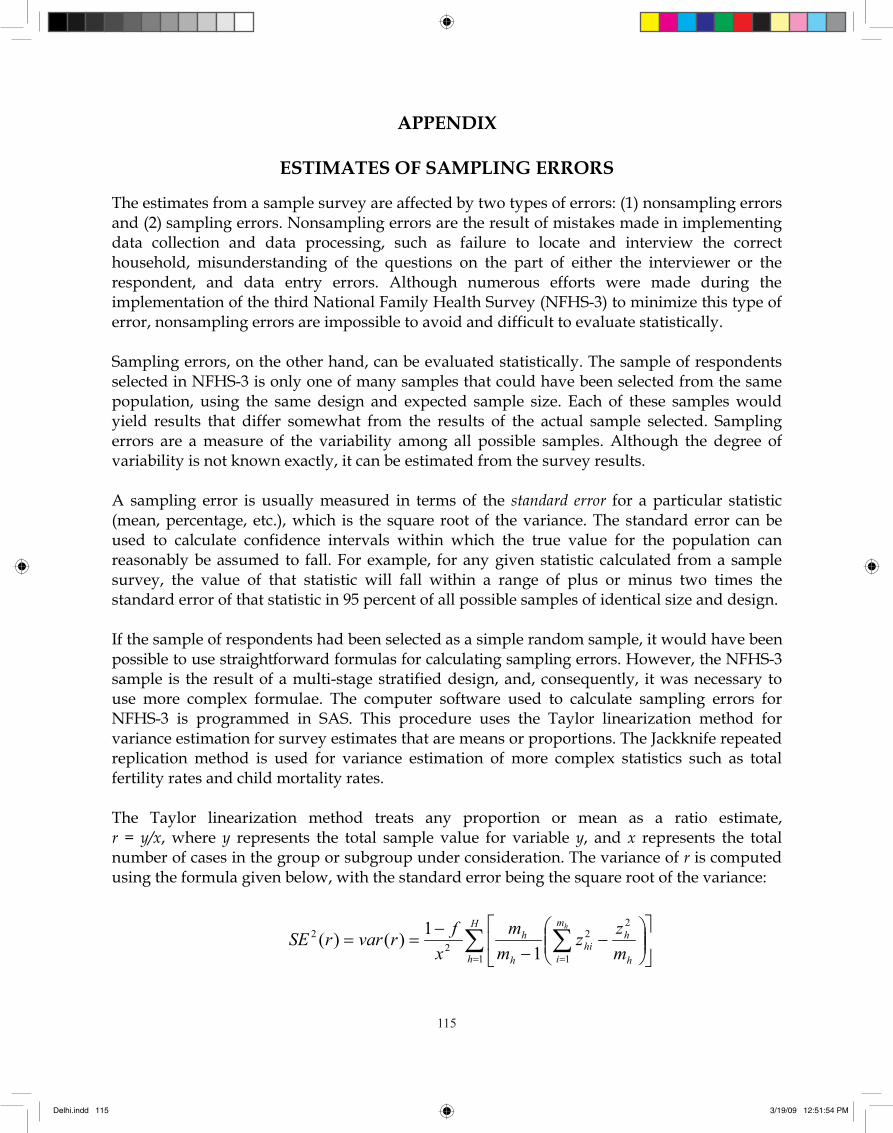
���
115
APPENDIX
ESTIMATES OF SAMPLING ERRORS
The estimates from a sample survey are affected by two types of errors: (1) nonsampling errors and (2) sampling errors. Nonsampling errors are the result of mistakes made in implementing data collection and data processing, such as failure to locate and interview the correct household, misunderstanding of the questions on the part of either the interviewer or the respondent, and data entry errors. Although numerous efforts were made during the implementation of the third National Family Health Survey (NFHS-3) to minimize this type of error, nonsampling errors are impossible to avoid and difficult to evaluate statistically.
Sampling errors, on the other hand, can be evaluated statistically. The sample of respondents selected in NFHS-3 is only one of many samples that could have been selected from the same population, using the same design and expected sample size. Each of these samples would yield results that differ somewhat from the results of the actual sample selected. Sampling errors are a measure of the variability among all possible samples. Although the degree of variability is not known exactly, it can be estimated from the survey results.
A sampling error is usually measured in terms of the standard error for a particular statistic (mean, percentage, etc.), which is the square root of the variance. The standard error can be used to calculate confidence intervals within which the true value for the population can reasonably be assumed to fall. For example, for any given statistic calculated from a sample survey, the value of that statistic will fall within a range of plus or minus two times the standard error of that statistic in 95 percent of all possible samples of identical size and design.
If the sample of respondents had been selected as a simple random sample, it would have been possible to use straightforward formulas for calculating sampling errors. However, the NFHS-3 sample is the result of a multi-stage stratified design, and, consequently, it was necessary to use more complex formulae. The computer software used to calculate sampling errors for NFHS-3 is programmed in SAS. This procedure uses the Taylor linearization method for variance estimation for survey estimates that are means or proportions. The Jackknife repeated replication method is used for variance estimation of more complex statistics such as total fertility rates and child mortality rates.
The Taylor linearization method treats any proportion or mean as a ratio estimate, r = y/x, where y represents the total sample value for variable y, and x represents the total number of cases in the group or subgroup under consideration. The variance of r is computed using the formula given below, with the standard error being the square root of the variance:
H
h h
hm
ihi
h
h
mzz
mm
xfrvarrSE
h
1
2
1
22
2
11)()(
Delhi.indd 115 3/19/09 12:51:54 PM
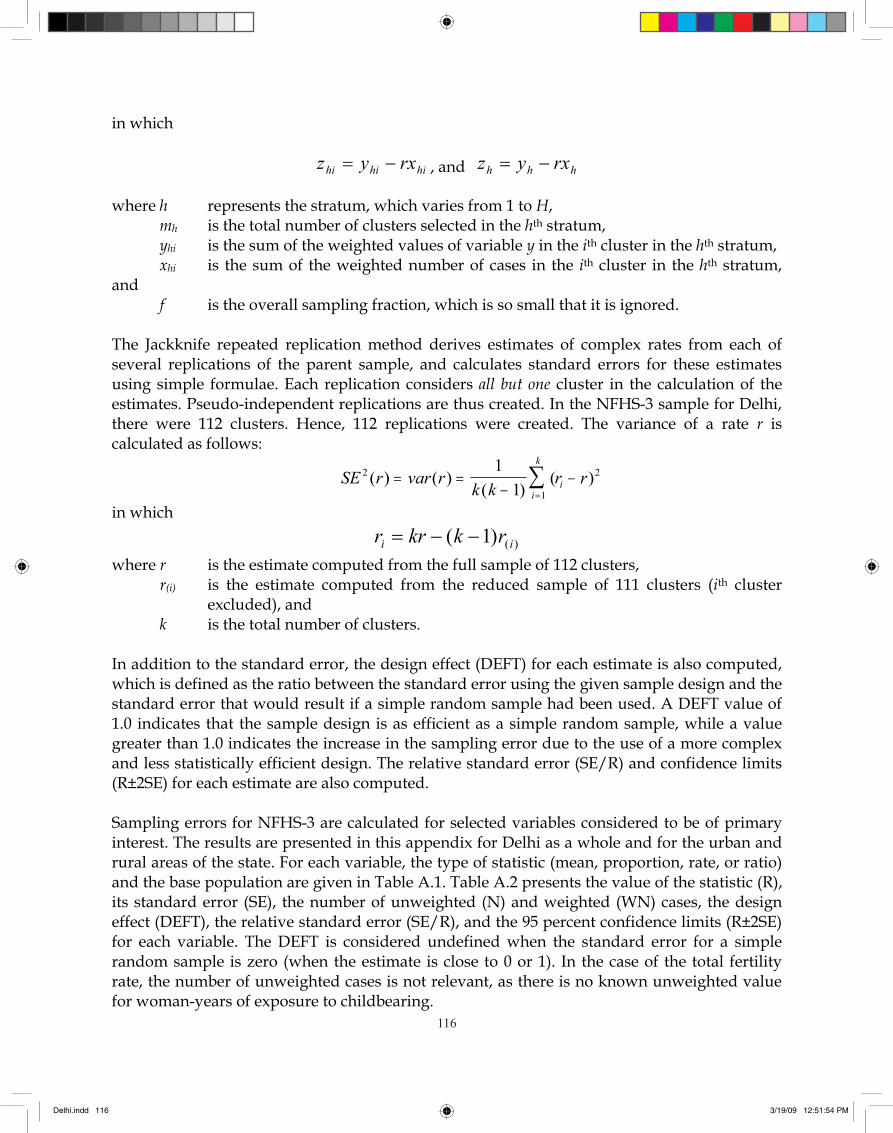
���
116
in which
hihihi rxyz , and hhh rxyz
where h represents the stratum, which varies from 1 to H,mh is the total number of clusters selected in the hth stratum, yhi is the sum of the weighted values of variable y in the ith cluster in the hth stratum, xhi is the sum of the weighted number of cases in the ith cluster in the hth stratum,
andf is the overall sampling fraction, which is so small that it is ignored.
The Jackknife repeated replication method derives estimates of complex rates from each of several replications of the parent sample, and calculates standard errors for these estimates using simple formulae. Each replication considers all but one cluster in the calculation of the estimates. Pseudo-independent replications are thus created. In the NFHS-3 sample for Delhi, there were 112 clusters. Hence, 112 replications were created. The variance of a rate r is calculated as follows:
SE r var rk k
r ri
k
i2
1
211
( ) ( )( )
( )
in which
)()1( ii rkkrrwhere r is the estimate computed from the full sample of 112 clusters,
r(i) is the estimate computed from the reduced sample of 111 clusters (ith cluster excluded), and
k is the total number of clusters.
In addition to the standard error, the design effect (DEFT) for each estimate is also computed, which is defined as the ratio between the standard error using the given sample design and the standard error that would result if a simple random sample had been used. A DEFT value of 1.0 indicates that the sample design is as efficient as a simple random sample, while a value greater than 1.0 indicates the increase in the sampling error due to the use of a more complex and less statistically efficient design. The relative standard error (SE/R) and confidence limits (R±2SE) for each estimate are also computed.
Sampling errors for NFHS-3 are calculated for selected variables considered to be of primary interest. The results are presented in this appendix for Delhi as a whole and for the urban and rural areas of the state. For each variable, the type of statistic (mean, proportion, rate, or ratio) and the base population are given in Table A.1. Table A.2 presents the value of the statistic (R), its standard error (SE), the number of unweighted (N) and weighted (WN) cases, the design effect (DEFT), the relative standard error (SE/R), and the 95 percent confidence limits (R±2SE) for each variable. The DEFT is considered undefined when the standard error for a simple random sample is zero (when the estimate is close to 0 or 1). In the case of the total fertility rate, the number of unweighted cases is not relevant, as there is no known unweighted value for woman-years of exposure to childbearing.
Delhi.indd 116 3/19/09 12:51:54 PM
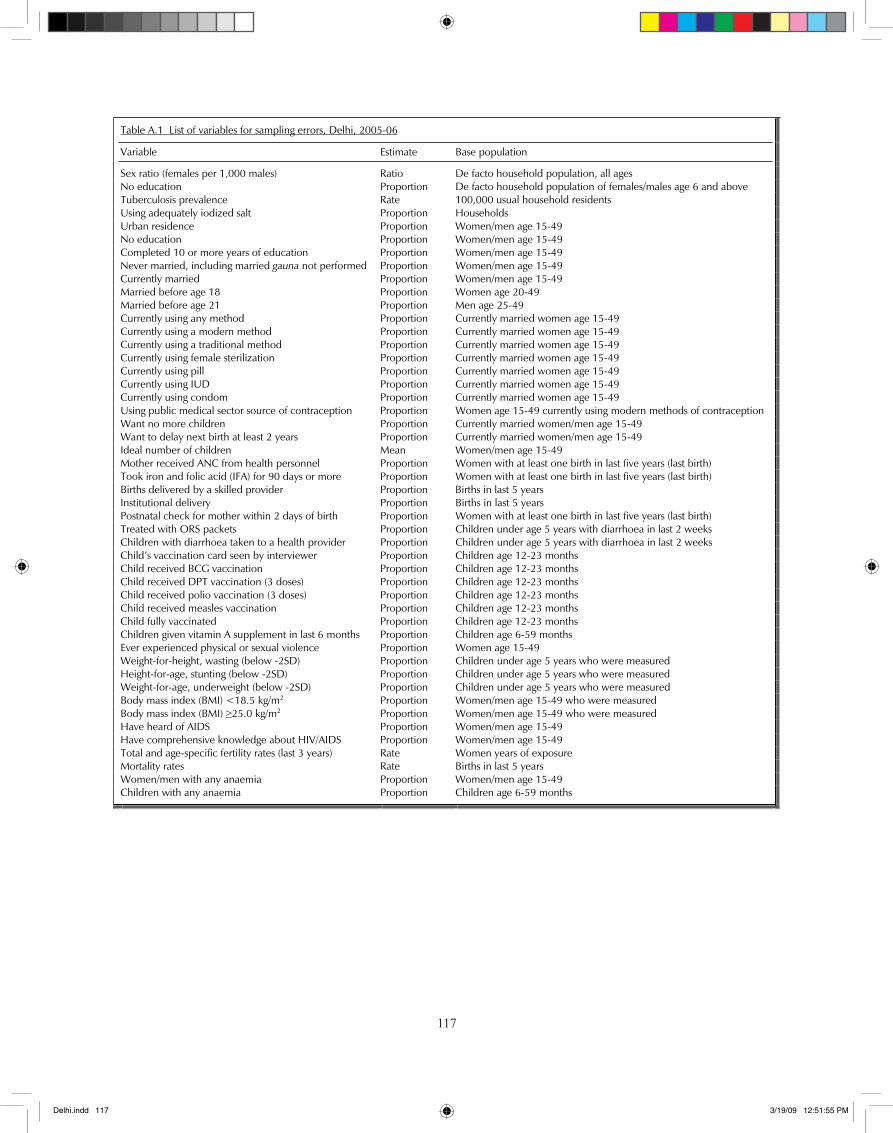
���
117
Table A.1 List of variables for sampling errors, Delhi, 2005-06
Variable Estimate Base population
Sex ratio (females per 1,000 males) Ratio De facto household population, all ages No education Proportion De facto household population of females/males age 6 and above Tuberculosis prevalence Rate 100,000 usual household residents Using adequately iodized salt Proportion Households Urban residence Proportion Women/men age 15-49 No education Proportion Women/men age 15-49 Completed 10 or more years of education Proportion Women/men age 15-49 Never married, including married gauna not performed Proportion Women/men age 15-49 Currently married Proportion Women/men age 15-49 Married before age 18 Proportion Women age 20-49 Married before age 21 Proportion Men age 25-49 Currently using any method Proportion Currently married women age 15-49 Currently using a modern method Proportion Currently married women age 15-49 Currently using a traditional method Proportion Currently married women age 15-49 Currently using female sterilization Proportion Currently married women age 15-49 Currently using pill Proportion Currently married women age 15-49 Currently using IUD Proportion Currently married women age 15-49 Currently using condom Proportion Currently married women age 15-49 Using public medical sector source of contraception Proportion Women age 15-49 currently using modern methods of contraception Want no more children Proportion Currently married women/men age 15-49 Want to delay next birth at least 2 years Proportion Currently married women/men age 15-49 Ideal number of children Mean Women/men age 15-49 Mother received ANC from health personnel Proportion Women with at least one birth in last five years (last birth) Took iron and folic acid (IFA) for 90 days or more Proportion Women with at least one birth in last five years (last birth) Births delivered by a skilled provider Proportion Births in last 5 years Institutional delivery Proportion Births in last 5 years Postnatal check for mother within 2 days of birth Proportion Women with at least one birth in last five years (last birth) Treated with ORS packets Proportion Children under age 5 years with diarrhoea in last 2 weeks Children with diarrhoea taken to a health provider Proportion Children under age 5 years with diarrhoea in last 2 weeks Child’s vaccination card seen by interviewer Proportion Children age 12-23 months Child received BCG vaccination Proportion Children age 12-23 months Child received DPT vaccination (3 doses) Proportion Children age 12-23 months Child received polio vaccination (3 doses) Proportion Children age 12-23 months Child received measles vaccination Proportion Children age 12-23 months Child fully vaccinated Proportion Children age 12-23 months Children given vitamin A supplement in last 6 months Proportion Children age 6-59 months Ever experienced physical or sexual violence Proportion Women age 15-49 Weight-for-height, wasting (below -2SD) Proportion Children under age 5 years who were measured Height-for-age, stunting (below -2SD) Proportion Children under age 5 years who were measured Weight-for-age, underweight (below -2SD) Proportion Children under age 5 years who were measured Body mass index (BMI) <18.5 kg/m2 Proportion Women/men age 15-49 who were measured Body mass index (BMI) 25.0 kg/m2 Proportion Women/men age 15-49 who were measured Have heard of AIDS Proportion Women/men age 15-49 Have comprehensive knowledge about HIV/AIDS Proportion Women/men age 15-49 Total and age-specific fertility rates (last 3 years) Rate Women years of exposure Mortality rates Rate Births in last 5 years Women/men with any anaemia Proportion Women/men age 15-49 Children with any anaemia Proportion Children age 6-59 months
Delhi.indd 117 3/19/09 12:51:55 PM
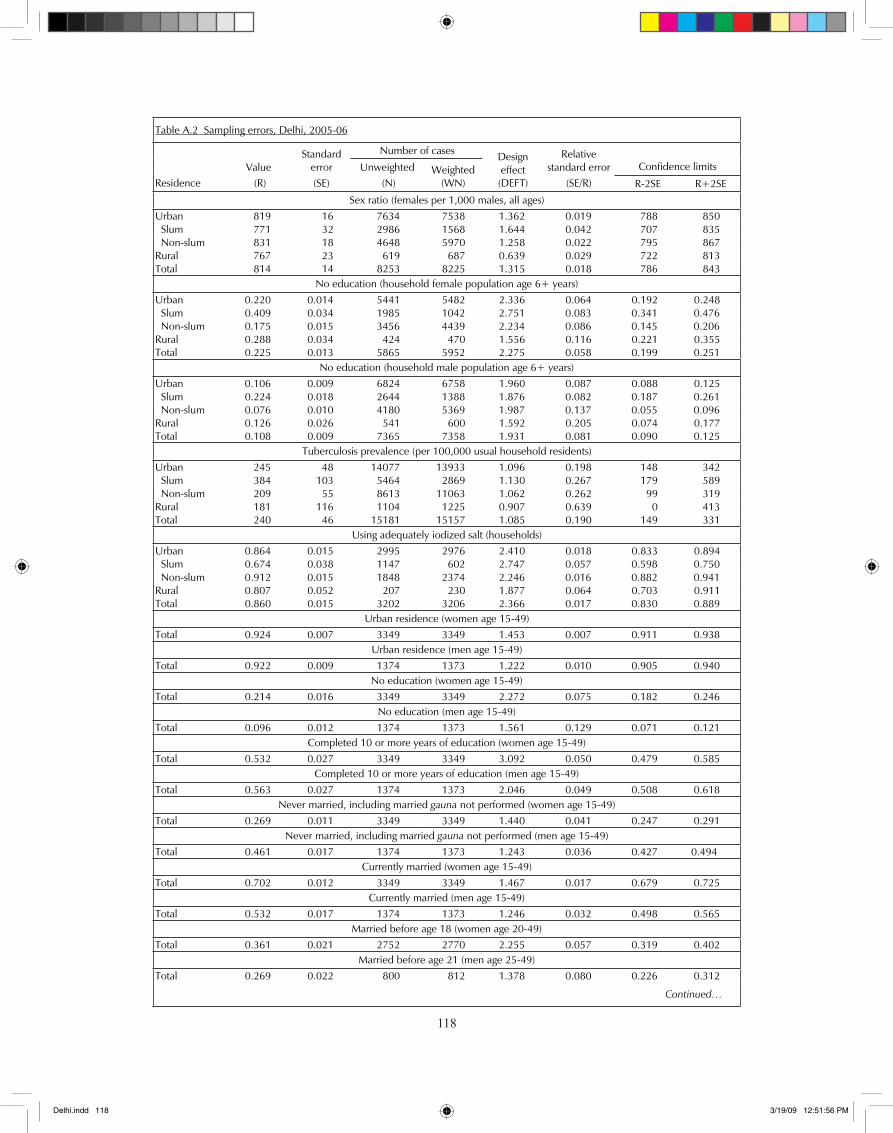
���
118
Table A.2 Sampling errors, Delhi, 2005-06
Number of cases Confidence limits
Residence Value (R)
Standard error(SE)
Unweighted (N)
Weighted (WN)
Design effect (DEFT)
Relative standard error
(SE/R) R-2SE R+2SE Sex ratio (females per 1,000 males, all ages)
Urban 819 16 7634 7538 1.362 0.019 788 850 Slum 771 32 2986 1568 1.644 0.042 707 835 Non-slum 831 18 4648 5970 1.258 0.022 795 867 Rural 767 23 619 687 0.639 0.029 722 813 Total 814 14 8253 8225 1.315 0.018 786 843
No education (household female population age 6+ years) Urban 0.220 0.014 5441 5482 2.336 0.064 0.192 0.248 Slum 0.409 0.034 1985 1042 2.751 0.083 0.341 0.476 Non-slum 0.175 0.015 3456 4439 2.234 0.086 0.145 0.206 Rural 0.288 0.034 424 470 1.556 0.116 0.221 0.355 Total 0.225 0.013 5865 5952 2.275 0.058 0.199 0.251
No education (household male population age 6+ years) Urban 0.106 0.009 6824 6758 1.960 0.087 0.088 0.125 Slum 0.224 0.018 2644 1388 1.876 0.082 0.187 0.261 Non-slum 0.076 0.010 4180 5369 1.987 0.137 0.055 0.096 Rural 0.126 0.026 541 600 1.592 0.205 0.074 0.177 Total 0.108 0.009 7365 7358 1.931 0.081 0.090 0.125
Tuberculosis prevalence (per 100,000 usual household residents) Urban 245 48 14077 13933 1.096 0.198 148 342 Slum 384 103 5464 2869 1.130 0.267 179 589 Non-slum 209 55 8613 11063 1.062 0.262 99 319 Rural 181 116 1104 1225 0.907 0.639 0 413 Total 240 46 15181 15157 1.085 0.190 149 331
Using adequately iodized salt (households) Urban 0.864 0.015 2995 2976 2.410 0.018 0.833 0.894 Slum 0.674 0.038 1147 602 2.747 0.057 0.598 0.750 Non-slum 0.912 0.015 1848 2374 2.246 0.016 0.882 0.941 Rural 0.807 0.052 207 230 1.877 0.064 0.703 0.911 Total 0.860 0.015 3202 3206 2.366 0.017 0.830 0.889
Urban residence (women age 15-49) Total 0.924 0.007 3349 3349 1.453 0.007 0.911 0.938
Urban residence (men age 15-49) Total 0.922 0.009 1374 1373 1.222 0.010 0.905 0.940
No education (women age 15-49) Total 0.214 0.016 3349 3349 2.272 0.075 0.182 0.246
No education (men age 15-49) Total 0.096 0.012 1374 1373 1.561 0.129 0.071 0.121
Completed 10 or more years of education (women age 15-49) Total 0.532 0.027 3349 3349 3.092 0.050 0.479 0.585
Completed 10 or more years of education (men age 15-49) Total 0.563 0.027 1374 1373 2.046 0.049 0.508 0.618
Never married, including married gauna not performed (women age 15-49) Total 0.269 0.011 3349 3349 1.440 0.041 0.247 0.291
Never married, including married gauna not performed (men age 15-49) Total 0.461 0.017 1374 1373 1.243 0.036 0.427 0.494
Currently married (women age 15-49) Total 0.702 0.012 3349 3349 1.467 0.017 0.679 0.725
Currently married (men age 15-49) Total 0.532 0.017 1374 1373 1.246 0.032 0.498 0.565
Married before age 18 (women age 20-49) Total 0.361 0.021 2752 2770 2.255 0.057 0.319 0.402
Married before age 21 (men age 25-49) Total 0.269 0.022 800 812 1.378 0.080 0.226 0.312
Continued…
Delhi.indd 118 3/19/09 12:51:56 PM
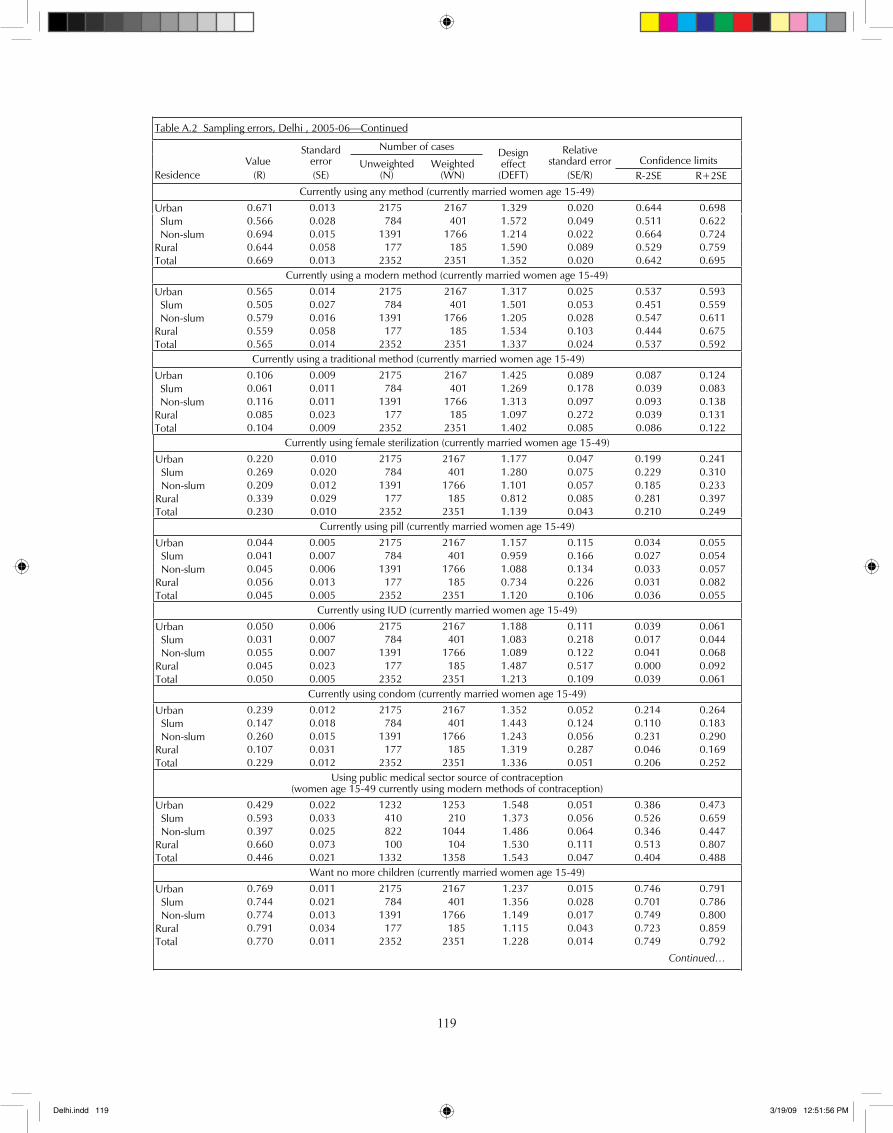
���119
Table A.2 Sampling errors, Delhi , 2005-06—Continued
Number of cases Confidence limits
Residence Value (R)
Standard error(SE)
Unweighted (N)
Weighted (WN)
Design effect (DEFT)
Relative standard error
(SE/R) R-2SE R+2SECurrently using any method (currently married women age 15-49)
Urban 0.671 0.013 2175 2167 1.329 0.020 0.644 0.698 Slum 0.566 0.028 784 401 1.572 0.049 0.511 0.622 Non-slum 0.694 0.015 1391 1766 1.214 0.022 0.664 0.724 Rural 0.644 0.058 177 185 1.590 0.089 0.529 0.759 Total 0.669 0.013 2352 2351 1.352 0.020 0.642 0.695
Currently using a modern method (currently married women age 15-49)
Urban 0.565 0.014 2175 2167 1.317 0.025 0.537 0.593 Slum 0.505 0.027 784 401 1.501 0.053 0.451 0.559 Non-slum 0.579 0.016 1391 1766 1.205 0.028 0.547 0.611 Rural 0.559 0.058 177 185 1.534 0.103 0.444 0.675 Total 0.565 0.014 2352 2351 1.337 0.024 0.537 0.592
Currently using a traditional method (currently married women age 15-49)
Urban 0.106 0.009 2175 2167 1.425 0.089 0.087 0.124 Slum 0.061 0.011 784 401 1.269 0.178 0.039 0.083 Non-slum 0.116 0.011 1391 1766 1.313 0.097 0.093 0.138 Rural 0.085 0.023 177 185 1.097 0.272 0.039 0.131 Total 0.104 0.009 2352 2351 1.402 0.085 0.086 0.122
Currently using female sterilization (currently married women age 15-49)
Urban 0.220 0.010 2175 2167 1.177 0.047 0.199 0.241 Slum 0.269 0.020 784 401 1.280 0.075 0.229 0.310 Non-slum 0.209 0.012 1391 1766 1.101 0.057 0.185 0.233 Rural 0.339 0.029 177 185 0.812 0.085 0.281 0.397 Total 0.230 0.010 2352 2351 1.139 0.043 0.210 0.249
Currently using pill (currently married women age 15-49)
Urban 0.044 0.005 2175 2167 1.157 0.115 0.034 0.055 Slum 0.041 0.007 784 401 0.959 0.166 0.027 0.054 Non-slum 0.045 0.006 1391 1766 1.088 0.134 0.033 0.057 Rural 0.056 0.013 177 185 0.734 0.226 0.031 0.082 Total 0.045 0.005 2352 2351 1.120 0.106 0.036 0.055
Currently using IUD (currently married women age 15-49)
Urban 0.050 0.006 2175 2167 1.188 0.111 0.039 0.061 Slum 0.031 0.007 784 401 1.083 0.218 0.017 0.044 Non-slum 0.055 0.007 1391 1766 1.089 0.122 0.041 0.068 Rural 0.045 0.023 177 185 1.487 0.517 0.000 0.092 Total 0.050 0.005 2352 2351 1.213 0.109 0.039 0.061
Currently using condom (currently married women age 15-49)
Urban 0.239 0.012 2175 2167 1.352 0.052 0.214 0.264 Slum 0.147 0.018 784 401 1.443 0.124 0.110 0.183 Non-slum 0.260 0.015 1391 1766 1.243 0.056 0.231 0.290 Rural 0.107 0.031 177 185 1.319 0.287 0.046 0.169 Total 0.229 0.012 2352 2351 1.336 0.051 0.206 0.252
Using public medical sector source of contraception (women age 15-49 currently using modern methods of contraception)
Urban 0.429 0.022 1232 1253 1.548 0.051 0.386 0.473 Slum 0.593 0.033 410 210 1.373 0.056 0.526 0.659 Non-slum 0.397 0.025 822 1044 1.486 0.064 0.346 0.447 Rural 0.660 0.073 100 104 1.530 0.111 0.513 0.807 Total 0.446 0.021 1332 1358 1.543 0.047 0.404 0.488
Want no more children (currently married women age 15-49)
Urban 0.769 0.011 2175 2167 1.237 0.015 0.746 0.791 Slum 0.744 0.021 784 401 1.356 0.028 0.701 0.786 Non-slum 0.774 0.013 1391 1766 1.149 0.017 0.749 0.800 Rural 0.791 0.034 177 185 1.115 0.043 0.723 0.859 Total 0.770 0.011 2352 2351 1.228 0.014 0.749 0.792
Continued…
Delhi.indd 119 3/19/09 12:51:56 PM
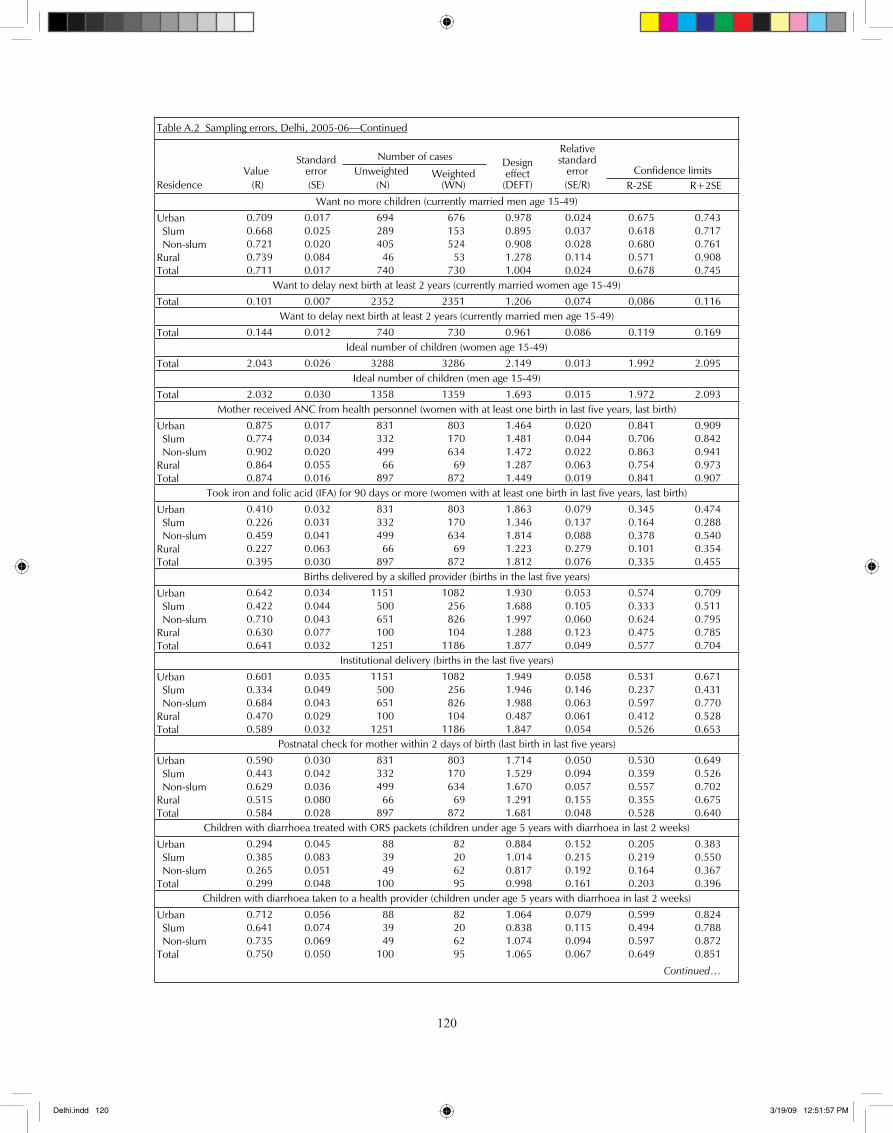
��0120
Table A.2 Sampling errors, Delhi, 2005-06—Continued
Number of cases Confidence limits
Residence Value (R)
Standard error(SE)
Unweighted (N)
Weighted (WN)
Design effect (DEFT)
Relativestandard
error(SE/R) R-2SE R+2SE
Want no more children (currently married men age 15-49)
Urban 0.709 0.017 694 676 0.978 0.024 0.675 0.743 Slum 0.668 0.025 289 153 0.895 0.037 0.618 0.717 Non-slum 0.721 0.020 405 524 0.908 0.028 0.680 0.761 Rural 0.739 0.084 46 53 1.278 0.114 0.571 0.908 Total 0.711 0.017 740 730 1.004 0.024 0.678 0.745
Want to delay next birth at least 2 years (currently married women age 15-49)
Total 0.101 0.007 2352 2351 1.206 0.074 0.086 0.116 Want to delay next birth at least 2 years (currently married men age 15-49)
Total 0.144 0.012 740 730 0.961 0.086 0.119 0.169 Ideal number of children (women age 15-49)
Total 2.043 0.026 3288 3286 2.149 0.013 1.992 2.095 Ideal number of children (men age 15-49)
Total 2.032 0.030 1358 1359 1.693 0.015 1.972 2.093 Mother received ANC from health personnel (women with at least one birth in last five years, last birth)
Urban 0.875 0.017 831 803 1.464 0.020 0.841 0.909 Slum 0.774 0.034 332 170 1.481 0.044 0.706 0.842 Non-slum 0.902 0.020 499 634 1.472 0.022 0.863 0.941 Rural 0.864 0.055 66 69 1.287 0.063 0.754 0.973 Total 0.874 0.016 897 872 1.449 0.019 0.841 0.907
Took iron and folic acid (IFA) for 90 days or more (women with at least one birth in last five years, last birth)
Urban 0.410 0.032 831 803 1.863 0.079 0.345 0.474 Slum 0.226 0.031 332 170 1.346 0.137 0.164 0.288 Non-slum 0.459 0.041 499 634 1.814 0.088 0.378 0.540 Rural 0.227 0.063 66 69 1.223 0.279 0.101 0.354 Total 0.395 0.030 897 872 1.812 0.076 0.335 0.455
Births delivered by a skilled provider (births in the last five years)
Urban 0.642 0.034 1151 1082 1.930 0.053 0.574 0.709 Slum 0.422 0.044 500 256 1.688 0.105 0.333 0.511 Non-slum 0.710 0.043 651 826 1.997 0.060 0.624 0.795 Rural 0.630 0.077 100 104 1.288 0.123 0.475 0.785 Total 0.641 0.032 1251 1186 1.877 0.049 0.577 0.704
Institutional delivery (births in the last five years)
Urban 0.601 0.035 1151 1082 1.949 0.058 0.531 0.671 Slum 0.334 0.049 500 256 1.946 0.146 0.237 0.431 Non-slum 0.684 0.043 651 826 1.988 0.063 0.597 0.770 Rural 0.470 0.029 100 104 0.487 0.061 0.412 0.528 Total 0.589 0.032 1251 1186 1.847 0.054 0.526 0.653
Postnatal check for mother within 2 days of birth (last birth in last five years)
Urban 0.590 0.030 831 803 1.714 0.050 0.530 0.649 Slum 0.443 0.042 332 170 1.529 0.094 0.359 0.526 Non-slum 0.629 0.036 499 634 1.670 0.057 0.557 0.702 Rural 0.515 0.080 66 69 1.291 0.155 0.355 0.675 Total 0.584 0.028 897 872 1.681 0.048 0.528 0.640
Children with diarrhoea treated with ORS packets (children under age 5 years with diarrhoea in last 2 weeks)
Urban 0.294 0.045 88 82 0.884 0.152 0.205 0.383 Slum 0.385 0.083 39 20 1.014 0.215 0.219 0.550 Non-slum 0.265 0.051 49 62 0.817 0.192 0.164 0.367 Total 0.299 0.048 100 95 0.998 0.161 0.203 0.396
Children with diarrhoea taken to a health provider (children under age 5 years with diarrhoea in last 2 weeks)
Urban 0.712 0.056 88 82 1.064 0.079 0.599 0.824 Slum 0.641 0.074 39 20 0.838 0.115 0.494 0.788 Non-slum 0.735 0.069 49 62 1.074 0.094 0.597 0.872 Total 0.750 0.050 100 95 1.065 0.067 0.649 0.851
Continued…
Delhi.indd 120 3/19/09 12:51:57 PM
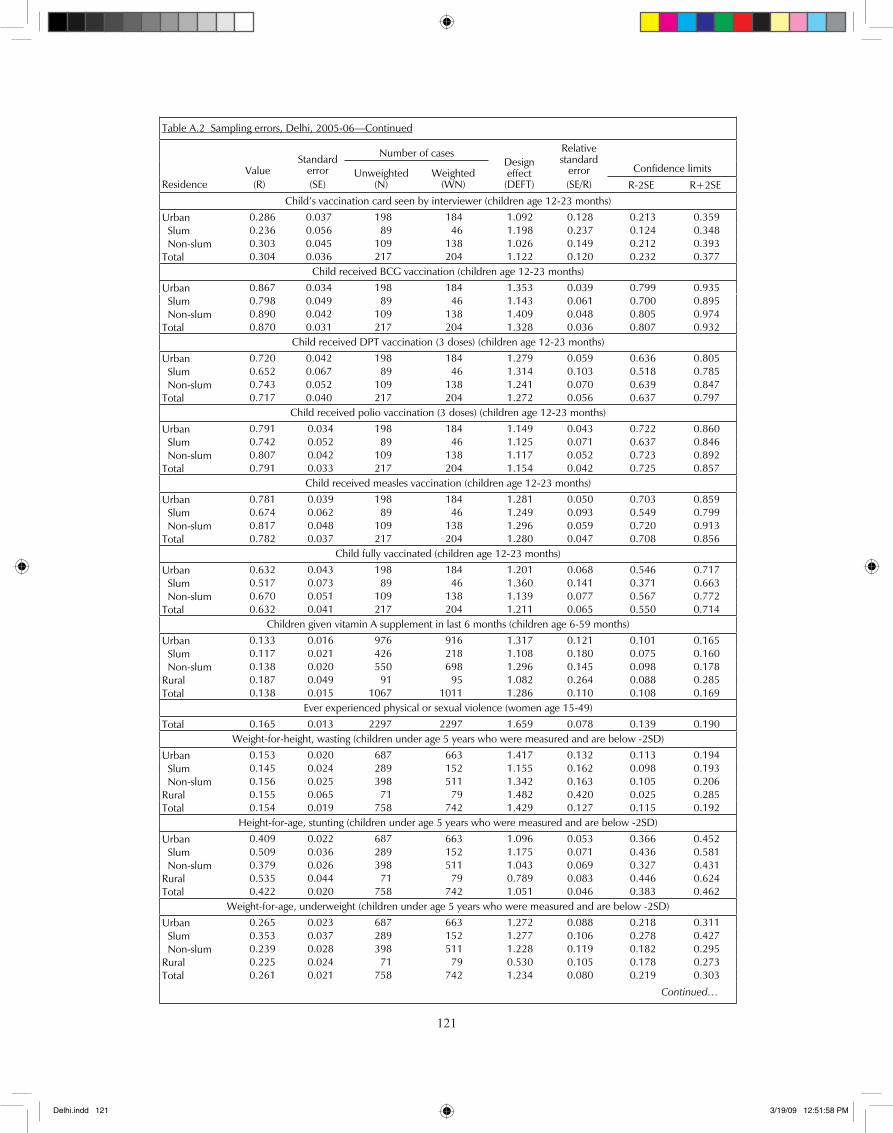
���121
Table A.2 Sampling errors, Delhi, 2005-06—Continued
Number of cases Confidence limits
Residence Value (R)
Standard error(SE)
Unweighted (N)
Weighted (WN)
Design effect (DEFT)
Relativestandard
error(SE/R) R-2SE R+2SE
Child’s vaccination card seen by interviewer (children age 12-23 months)
Urban 0.286 0.037 198 184 1.092 0.128 0.213 0.359 Slum 0.236 0.056 89 46 1.198 0.237 0.124 0.348 Non-slum 0.303 0.045 109 138 1.026 0.149 0.212 0.393 Total 0.304 0.036 217 204 1.122 0.120 0.232 0.377
Child received BCG vaccination (children age 12-23 months)
Urban 0.867 0.034 198 184 1.353 0.039 0.799 0.935 Slum 0.798 0.049 89 46 1.143 0.061 0.700 0.895 Non-slum 0.890 0.042 109 138 1.409 0.048 0.805 0.974 Total 0.870 0.031 217 204 1.328 0.036 0.807 0.932
Child received DPT vaccination (3 doses) (children age 12-23 months)
Urban 0.720 0.042 198 184 1.279 0.059 0.636 0.805 Slum 0.652 0.067 89 46 1.314 0.103 0.518 0.785 Non-slum 0.743 0.052 109 138 1.241 0.070 0.639 0.847 Total 0.717 0.040 217 204 1.272 0.056 0.637 0.797
Child received polio vaccination (3 doses) (children age 12-23 months)
Urban 0.791 0.034 198 184 1.149 0.043 0.722 0.860 Slum 0.742 0.052 89 46 1.125 0.071 0.637 0.846 Non-slum 0.807 0.042 109 138 1.117 0.052 0.723 0.892 Total 0.791 0.033 217 204 1.154 0.042 0.725 0.857
Child received measles vaccination (children age 12-23 months)
Urban 0.781 0.039 198 184 1.281 0.050 0.703 0.859 Slum 0.674 0.062 89 46 1.249 0.093 0.549 0.799 Non-slum 0.817 0.048 109 138 1.296 0.059 0.720 0.913 Total 0.782 0.037 217 204 1.280 0.047 0.708 0.856
Child fully vaccinated (children age 12-23 months)
Urban 0.632 0.043 198 184 1.201 0.068 0.546 0.717 Slum 0.517 0.073 89 46 1.360 0.141 0.371 0.663 Non-slum 0.670 0.051 109 138 1.139 0.077 0.567 0.772 Total 0.632 0.041 217 204 1.211 0.065 0.550 0.714
Children given vitamin A supplement in last 6 months (children age 6-59 months)
Urban 0.133 0.016 976 916 1.317 0.121 0.101 0.165 Slum 0.117 0.021 426 218 1.108 0.180 0.075 0.160 Non-slum 0.138 0.020 550 698 1.296 0.145 0.098 0.178 Rural 0.187 0.049 91 95 1.082 0.264 0.088 0.285 Total 0.138 0.015 1067 1011 1.286 0.110 0.108 0.169
Ever experienced physical or sexual violence (women age 15-49)
Total 0.165 0.013 2297 2297 1.659 0.078 0.139 0.190 Weight-for-height, wasting (children under age 5 years who were measured and are below -2SD)
Urban 0.153 0.020 687 663 1.417 0.132 0.113 0.194 Slum 0.145 0.024 289 152 1.155 0.162 0.098 0.193 Non-slum 0.156 0.025 398 511 1.342 0.163 0.105 0.206 Rural 0.155 0.065 71 79 1.482 0.420 0.025 0.285 Total 0.154 0.019 758 742 1.429 0.127 0.115 0.192
Height-for-age, stunting (children under age 5 years who were measured and are below -2SD)
Urban 0.409 0.022 687 663 1.096 0.053 0.366 0.452 Slum 0.509 0.036 289 152 1.175 0.071 0.436 0.581 Non-slum 0.379 0.026 398 511 1.043 0.069 0.327 0.431 Rural 0.535 0.044 71 79 0.789 0.083 0.446 0.624 Total 0.422 0.020 758 742 1.051 0.046 0.383 0.462
Weight-for-age, underweight (children under age 5 years who were measured and are below -2SD)
Urban 0.265 0.023 687 663 1.272 0.088 0.218 0.311 Slum 0.353 0.037 289 152 1.277 0.106 0.278 0.427 Non-slum 0.239 0.028 398 511 1.228 0.119 0.182 0.295 Rural 0.225 0.024 71 79 0.530 0.105 0.178 0.273 Total 0.261 0.021 758 742 1.234 0.080 0.219 0.303
Continued…
Delhi.indd 121 3/19/09 12:51:58 PM
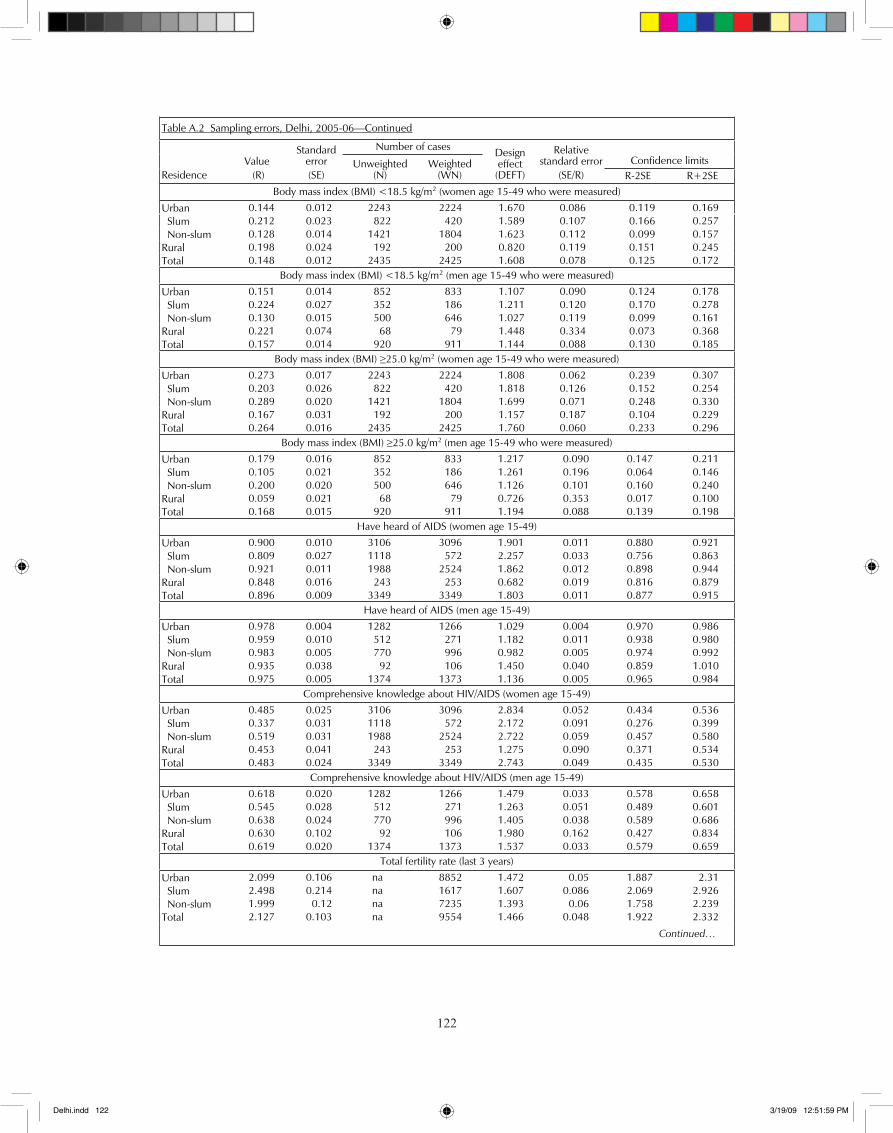
���
122
Table A.2 Sampling errors, Delhi, 2005-06—Continued
Number of cases Confidence limits
Residence Value (R)
Standard error(SE)
Unweighted (N)
Weighted (WN)
Design effect (DEFT)
Relative standard error
(SE/R) R-2SE R+2SEBody mass index (BMI) <18.5 kg/m2 (women age 15-49 who were measured)
Urban 0.144 0.012 2243 2224 1.670 0.086 0.119 0.169 Slum 0.212 0.023 822 420 1.589 0.107 0.166 0.257 Non-slum 0.128 0.014 1421 1804 1.623 0.112 0.099 0.157 Rural 0.198 0.024 192 200 0.820 0.119 0.151 0.245 Total 0.148 0.012 2435 2425 1.608 0.078 0.125 0.172
Body mass index (BMI) <18.5 kg/m2 (men age 15-49 who were measured)
Urban 0.151 0.014 852 833 1.107 0.090 0.124 0.178 Slum 0.224 0.027 352 186 1.211 0.120 0.170 0.278 Non-slum 0.130 0.015 500 646 1.027 0.119 0.099 0.161 Rural 0.221 0.074 68 79 1.448 0.334 0.073 0.368 Total 0.157 0.014 920 911 1.144 0.088 0.130 0.185
Body mass index (BMI) 25.0 kg/m2 (women age 15-49 who were measured)
Urban 0.273 0.017 2243 2224 1.808 0.062 0.239 0.307 Slum 0.203 0.026 822 420 1.818 0.126 0.152 0.254 Non-slum 0.289 0.020 1421 1804 1.699 0.071 0.248 0.330 Rural 0.167 0.031 192 200 1.157 0.187 0.104 0.229 Total 0.264 0.016 2435 2425 1.760 0.060 0.233 0.296
Body mass index (BMI) 25.0 kg/m2 (men age 15-49 who were measured)
Urban 0.179 0.016 852 833 1.217 0.090 0.147 0.211 Slum 0.105 0.021 352 186 1.261 0.196 0.064 0.146 Non-slum 0.200 0.020 500 646 1.126 0.101 0.160 0.240 Rural 0.059 0.021 68 79 0.726 0.353 0.017 0.100 Total 0.168 0.015 920 911 1.194 0.088 0.139 0.198
Have heard of AIDS (women age 15-49)
Urban 0.900 0.010 3106 3096 1.901 0.011 0.880 0.921 Slum 0.809 0.027 1118 572 2.257 0.033 0.756 0.863 Non-slum 0.921 0.011 1988 2524 1.862 0.012 0.898 0.944 Rural 0.848 0.016 243 253 0.682 0.019 0.816 0.879 Total 0.896 0.009 3349 3349 1.803 0.011 0.877 0.915
Have heard of AIDS (men age 15-49)
Urban 0.978 0.004 1282 1266 1.029 0.004 0.970 0.986 Slum 0.959 0.010 512 271 1.182 0.011 0.938 0.980 Non-slum 0.983 0.005 770 996 0.982 0.005 0.974 0.992 Rural 0.935 0.038 92 106 1.450 0.040 0.859 1.010 Total 0.975 0.005 1374 1373 1.136 0.005 0.965 0.984
Comprehensive knowledge about HIV/AIDS (women age 15-49)
Urban 0.485 0.025 3106 3096 2.834 0.052 0.434 0.536 Slum 0.337 0.031 1118 572 2.172 0.091 0.276 0.399 Non-slum 0.519 0.031 1988 2524 2.722 0.059 0.457 0.580 Rural 0.453 0.041 243 253 1.275 0.090 0.371 0.534 Total 0.483 0.024 3349 3349 2.743 0.049 0.435 0.530
Comprehensive knowledge about HIV/AIDS (men age 15-49)
Urban 0.618 0.020 1282 1266 1.479 0.033 0.578 0.658 Slum 0.545 0.028 512 271 1.263 0.051 0.489 0.601 Non-slum 0.638 0.024 770 996 1.405 0.038 0.589 0.686 Rural 0.630 0.102 92 106 1.980 0.162 0.427 0.834 Total 0.619 0.020 1374 1373 1.537 0.033 0.579 0.659
Total fertility rate (last 3 years)
Urban 2.099 0.106 na 8852 1.472 0.05 1.887 2.31 Slum 2.498 0.214 na 1617 1.607 0.086 2.069 2.926 Non-slum 1.999 0.12 na 7235 1.393 0.06 1.758 2.239 Total 2.127 0.103 na 9554 1.466 0.048 1.922 2.332
Continued…
Delhi.indd 122 3/19/09 12:51:59 PM
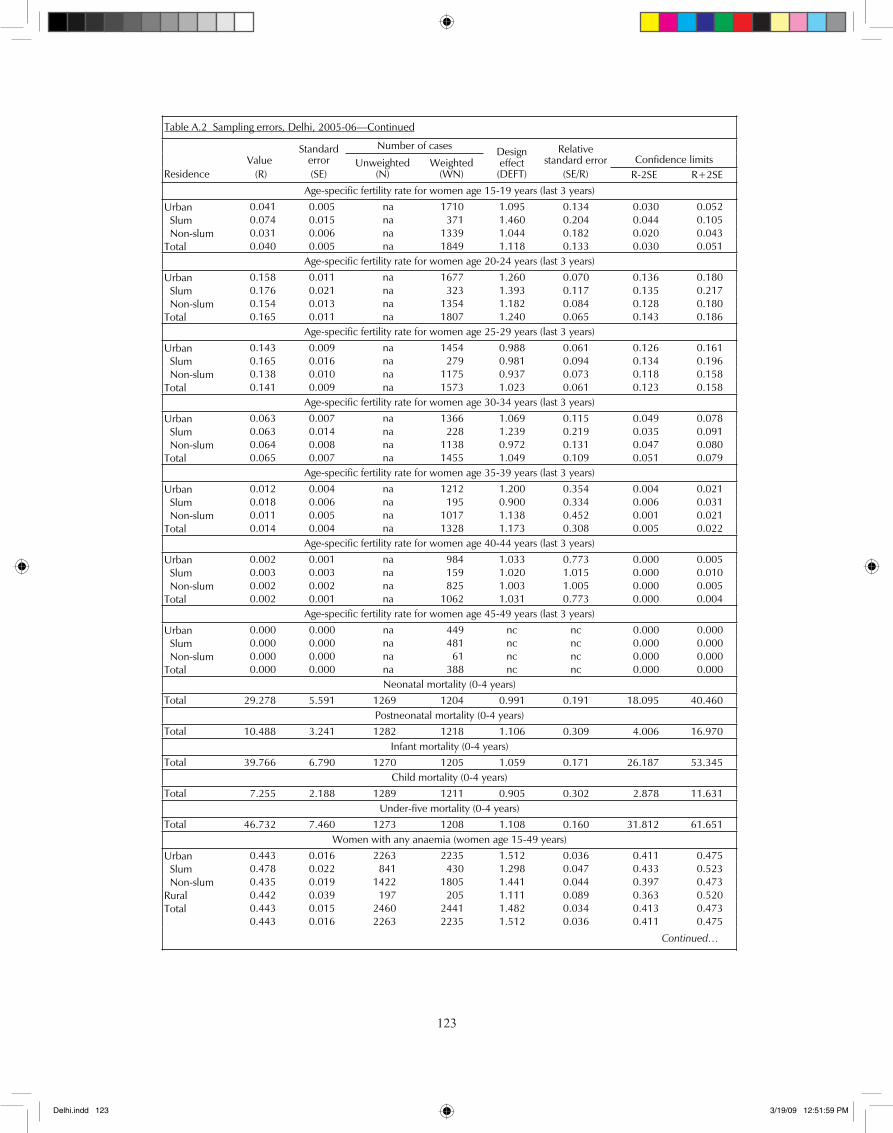
���123
Table A.2 Sampling errors, Delhi, 2005-06—Continued
Number of cases Confidence limits
Residence Value (R)
Standard error(SE)
Unweighted (N)
Weighted (WN)
Design effect (DEFT)
Relative standard error
(SE/R) R-2SE R+2SEAge-specific fertility rate for women age 15-19 years (last 3 years)
Urban 0.041 0.005 na 1710 1.095 0.134 0.030 0.052 Slum 0.074 0.015 na 371 1.460 0.204 0.044 0.105 Non-slum 0.031 0.006 na 1339 1.044 0.182 0.020 0.043 Total 0.040 0.005 na 1849 1.118 0.133 0.030 0.051
Age-specific fertility rate for women age 20-24 years (last 3 years)
Urban 0.158 0.011 na 1677 1.260 0.070 0.136 0.180 Slum 0.176 0.021 na 323 1.393 0.117 0.135 0.217 Non-slum 0.154 0.013 na 1354 1.182 0.084 0.128 0.180 Total 0.165 0.011 na 1807 1.240 0.065 0.143 0.186
Age-specific fertility rate for women age 25-29 years (last 3 years)
Urban 0.143 0.009 na 1454 0.988 0.061 0.126 0.161 Slum 0.165 0.016 na 279 0.981 0.094 0.134 0.196 Non-slum 0.138 0.010 na 1175 0.937 0.073 0.118 0.158 Total 0.141 0.009 na 1573 1.023 0.061 0.123 0.158
Age-specific fertility rate for women age 30-34 years (last 3 years)
Urban 0.063 0.007 na 1366 1.069 0.115 0.049 0.078 Slum 0.063 0.014 na 228 1.239 0.219 0.035 0.091 Non-slum 0.064 0.008 na 1138 0.972 0.131 0.047 0.080 Total 0.065 0.007 na 1455 1.049 0.109 0.051 0.079
Age-specific fertility rate for women age 35-39 years (last 3 years)
Urban 0.012 0.004 na 1212 1.200 0.354 0.004 0.021 Slum 0.018 0.006 na 195 0.900 0.334 0.006 0.031 Non-slum 0.011 0.005 na 1017 1.138 0.452 0.001 0.021 Total 0.014 0.004 na 1328 1.173 0.308 0.005 0.022
Age-specific fertility rate for women age 40-44 years (last 3 years)
Urban 0.002 0.001 na 984 1.033 0.773 0.000 0.005 Slum 0.003 0.003 na 159 1.020 1.015 0.000 0.010 Non-slum 0.002 0.002 na 825 1.003 1.005 0.000 0.005 Total 0.002 0.001 na 1062 1.031 0.773 0.000 0.004
Age-specific fertility rate for women age 45-49 years (last 3 years)
Urban 0.000 0.000 na 449 nc nc 0.000 0.000 Slum 0.000 0.000 na 481 nc nc 0.000 0.000 Non-slum 0.000 0.000 na 61 nc nc 0.000 0.000 Total 0.000 0.000 na 388 nc nc 0.000 0.000
Neonatal mortality (0-4 years) Total 29.278 5.591 1269 1204 0.991 0.191 18.095 40.460
Postneonatal mortality (0-4 years) Total 10.488 3.241 1282 1218 1.106 0.309 4.006 16.970
Infant mortality (0-4 years) Total 39.766 6.790 1270 1205 1.059 0.171 26.187 53.345
Child mortality (0-4 years) Total 7.255 2.188 1289 1211 0.905 0.302 2.878 11.631
Under-five mortality (0-4 years) Total 46.732 7.460 1273 1208 1.108 0.160 31.812 61.651
Women with any anaemia (women age 15-49 years)
Urban 0.443 0.016 2263 2235 1.512 0.036 0.411 0.475 Slum 0.478 0.022 841 430 1.298 0.047 0.433 0.523 Non-slum 0.435 0.019 1422 1805 1.441 0.044 0.397 0.473 Rural 0.442 0.039 197 205 1.111 0.089 0.363 0.520 Total 0.443 0.015 2460 2441 1.482 0.034 0.413 0.473
0.443 0.016 2263 2235 1.512 0.036 0.411 0.475
Continued…
Delhi.indd 123 3/19/09 12:51:59 PM
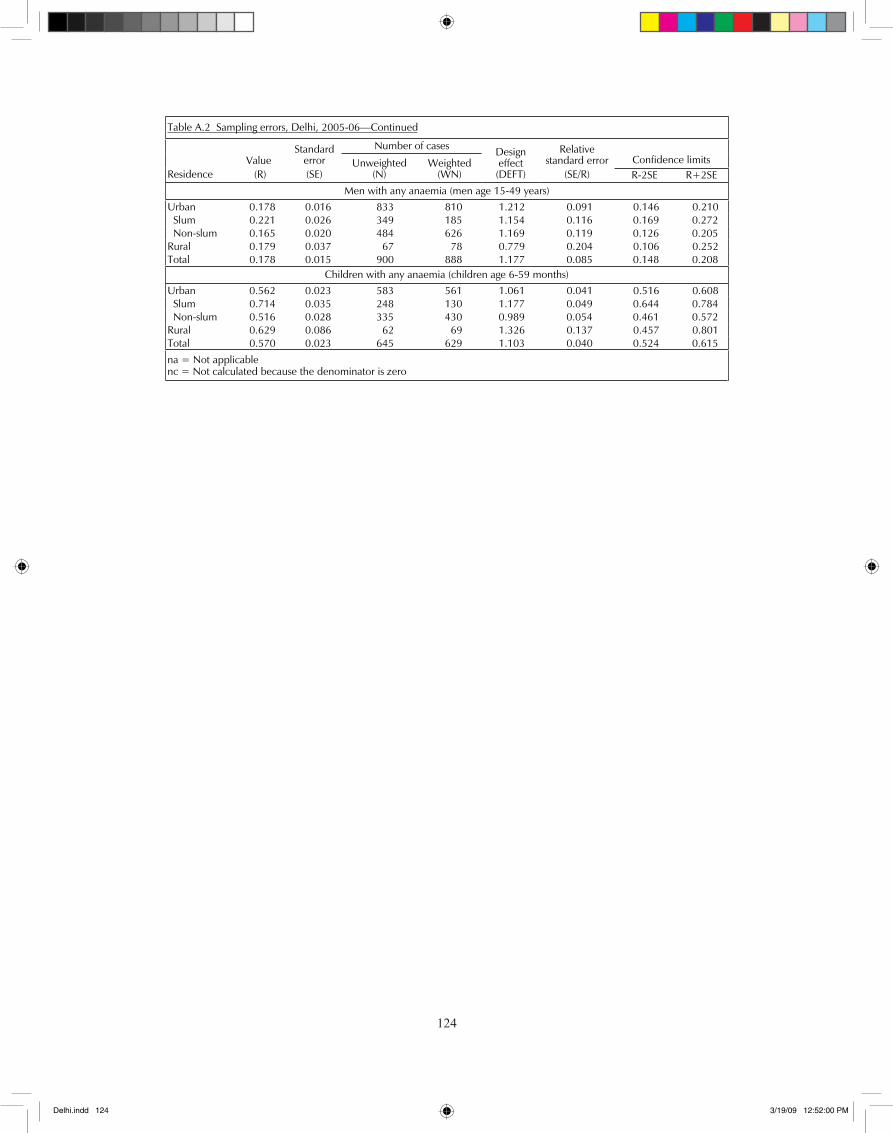
���124
Table A.2 Sampling errors, Delhi, 2005-06—Continued
Number of cases Confidence limits
Residence Value (R)
Standard error(SE)
Unweighted (N)
Weighted (WN)
Design effect (DEFT)
Relative standard error
(SE/R) R-2SE R+2SEMen with any anaemia (men age 15-49 years)
Urban 0.178 0.016 833 810 1.212 0.091 0.146 0.210 Slum 0.221 0.026 349 185 1.154 0.116 0.169 0.272 Non-slum 0.165 0.020 484 626 1.169 0.119 0.126 0.205 Rural 0.179 0.037 67 78 0.779 0.204 0.106 0.252 Total 0.178 0.015 900 888 1.177 0.085 0.148 0.208
Children with any anaemia (children age 6-59 months) Urban 0.562 0.023 583 561 1.061 0.041 0.516 0.608 Slum 0.714 0.035 248 130 1.177 0.049 0.644 0.784 Non-slum 0.516 0.028 335 430 0.989 0.054 0.461 0.572 Rural 0.629 0.086 62 69 1.326 0.137 0.457 0.801 Total 0.570 0.023 645 629 1.103 0.040 0.524 0.615
na = Not applicable nc = Not calculated because the denominator is zero
Delhi.indd 124 3/19/09 12:52:00 PM


![Untitled-1 [] · Nagarjuna Sagar Dam õ3NãgerjunasagaóSite Jammar . ANDHRA AUTHORITY . ANDHRA AUTHORITY . ANDHRA AUTHORITY . ANDHRA AUTHORITY . ANDHRA AUTHORITY . ANDHRA AUTHORITY](https://img.pdfslide.net/doc/110x75/5fa86894420206628339e79d/untitled-1-nagarjuna-sagar-dam-3ngerjunasagasite-jammar-andhra-authority.jpg)