Embed Size (px)
Citation preview

University of Arkansas, FayettevilleScholarWorks@UARK
Economics Undergraduate Honors Theses Economics
5-2018
Fantasy Football's Impact on NFL RevenueJoshua Hamby
Follow this and additional works at: http://scholarworks.uark.edu/econuht
Part of the Growth and Development Commons, Sports Studies Commons, and the Work,Economy and Organizations Commons
This Thesis is brought to you for free and open access by the Economics at ScholarWorks@UARK. It has been accepted for inclusion in EconomicsUndergraduate Honors Theses by an authorized administrator of ScholarWorks@UARK. For more information, please contact [email protected],[email protected].
Recommended CitationHamby, Joshua, "Fantasy Football's Impact on NFL Revenue" (2018). Economics Undergraduate Honors Theses. 21.http://scholarworks.uark.edu/econuht/21

1
Fantasy Football’s Impact on NFL Revenues
by
Joshua Edward Hamby
Advisor: Dr. Peter McGee
An Honors Thesis in partial fulfillment of the requirements for the degree Bachelor of
Science in Business Administration in Economics.
Sam M. Walton College of Business
University of Arkansas
Fayetteville, Arkansas
May 11, 2018

2
Abstract
This paper investigates the hypothesis that fantasy football positively influences NFL
revenues. While there are many variables that may substantially influence NFL revenues, such
as team by team and year by year variation, the estimations in this paper attempt to isolate the
effects of fantasy football. Providing evidence of impacts attributable to fantasy football would
be important information for parties involved with the NFL and/or fantasy football to better
understand what is creating value for the league, players in the league, and the fantasy industry.
This paper has results on estimations testing the impacts of both the fantasy participation
explosion and an NFL team’s fantasy popularity on NFL team local revenues. These results are
indicative of a positive impact on NFL revenues from fantasy football. This paper concludes that
the evidence provided is in favor of the hypothesis but is merely suggestive evidence due to data
limitations.
History
Sports have always been a part of society. Even before the Romans built the Colosseum
and held the infamous gladiator games, sports have been deeply entrenched in the everyday lives
of people. In today’s world, where everything and everyone is connected, sports leagues have
become some of the biggest industries in existence. Take soccer for example. Soccer has nearly
4 billion people who watch it every year. It has multiple TV deals, worth over 8 billion euros
($9.84 billion) combined, that spread viewers across the globe. Its world-wide popularity allows
for enormous revenues that in turn pay some players over 300,000 euros ($369,000) a week.
These are crazy numbers considering it is just some people playing a game. The entertainment
value of sports is well documented throughout history.
The biggest sport in the United States hands down is football. While it lacks the
international appeal of other sports in other countries, American football has created a massive
industry in the United States. The National Football League is the main beneficiary of this
popularity. The NFL has over $10 billion in annual revenue. The Super Bowl is the most
watched event in the United States and has been popular for many years. The NFL has a $4
billion deal with Direct TV alone for broadcast rights. Roger Goodell, the NFL commissioner,
said that they project NFL yearly revenues will be at $25 billion by 2027. There are many
possible factors that contribute to this success. One of which, may be its historic popularity in
sports betting and sports betting’s relatively new cousin, fantasy football.
Sports betting has always been there to act in harmony with sports. In Rome, people
would wager on which gladiator will be left standing at the end. In Greece, at the first Olympic
games, people placed wagers on who would win each event. (The History of Sports Betting,
Onlinegamblingsites.org) It adds excitement and investment from the people towards the games.
Nothing can get you quite as excited about an event as having a personal investment in the
outcome of that event. In more recent history, sports betting has been a controversial topic.
While the federal government of the U.S. has made it illegal in most states, one place has
become infamous for it. Las Vegas’ legalization of sports betting created a hub for hard-core
gamblers and average bettors alike. However, since this began before the advent of the internet,
almost all wagers had to be made through sports bookies inside city limits of Las Vegas. This
made it almost impossible for the general public in the United States to really get involved. That
means a hard cap was put on the extent to which gambling could grow in usage. Of course, there
were bets between friends, bets among small groups, and illegal large scale betting. However,

3
these times when people would bend the rules didn’t account for anything close to what the
potential sports betting market could be.
After the advent of the internet is when sports betting really took off. Offshore websites
like Oddsshark.com and 5Dimes.com created avenues for people all over the country and all over
the world to place bets on upcoming sporting events. Since then, online gambling has turned
into a massive market. World-wide yearly online wagers total at almost $38 billion. Online
gambling’s impact on sports industries and over all economies is huge. However, using the
internet to gamble in the United States is still controversial. The law does prohibit bettors from
using the internet to bet using a bookie in the United States. Using off-shore based websites is a
way to circumvent this, but it is still not on firm legal ground. With high demand for a sports
betting avenue and the legal tensions surrounding traditional sports betting in the United States,
fantasy sports has cemented itself as a less controversial and less stigmatized alternative to
traditional sports betting.
Fantasy sports is a game inside the game where people choose players and compete based
on those player’s statistical outputs. Take golf for example. In fantasy golf, your average golf
fan goes online to pick a “roster” of players who are playing in the tournament that week. This
fan’s friends do the same thing, and they compete. The fan with the lowest average score for
their roster, lower is better in golf, wins the week. Fantasy sports is considered by many to be a
more wholesome way for fans to get involved in the game because it is more like a competition
between friends than a wager against Vegas odds. There does not even have to be money
attached to fantasy sports and people often play simply for the enjoyment. The fantasy sports
community consider it a skill-based game and therefor completely different from gambling. The
law seems to agree with this claim only for season-long fantasy. Currently, there is no law
against seasonal fantasy sports participation in the United States, but some states have put
restrictions on daily fantasy sports considering it too close to traditional gambling. Overall,
fantasy sports’ advantages over traditional sports betting has given it major growth over the past
25 years. Figure 1 shows growth in fantasy sport participation from 1988 to 2015. The trends in
this massive growth follow the impacts of three important events.
First off, growth from the 1990s to the early 2000s can most likely be attributed to the
growth in internet availability. Prior to 1991 there were less than 1 million people playing
fantasy sports. (Wenrich, 2017) Those 1 million were just groups of friends who would score
their fantasy weeks based off NFL stats in the newspaper after games. However, with the help of
new technologies, it would soon grow. In 1991, a computer programmer from Switzerland,
named Tim Berners-Lee, changed the internet from a strictly scientific community resource to a
communication and information tool that has a scope far beyond what it previously did. Today,
we call this tool the world wide web. In 1992, a group of researchers from the university of
Illinois created a user-friendly interface for the world wide web called Mosaic. Over the course
of the next 12 years the internet, and fantasy sports along with it, grew substantially. By 2003,
that number of fantasy sport players was 15.2 million. This amazing new technology allowed for
fantasy leagues to be run much more easily and faster than before. However, technology was not
done influencing fantasy sport growth.

4
The second large spike in fantasy sport usage was between 2007 and 2008. In 2007 there
were 19.4 million people playing fantasy sports. In 2008 that jumped to 29.9 million. This is
strongly correlated with the introduction of the iPhone in 2007. When Steve Jobs introduced the
iPhone at MacWorld in 2007, almost no industry was left untouched. Investment banking,
Hollywood, grocery chains, and even mom and pop stores were significantly impacted by the
iPhone and its competitors. The mobile platform connected the world in a way that spurred new
market development. The fantasy sports industry is a prime example of a market impacted for
the better by the new technology. With the increased availability of the internet and the ease of
app based technology for fantasy, fantasy sports grew in number of users dramatically. Figure 2
is a pie chart, from Thefantasyfootballers.com, of all the things fantasy players do regularly that
mobile has now made much easier. All of these activities are essential to playing fantasy sports
and just the ease of a cell phone compared to a desktop created a much more frictionless
experience. The new platform gave people everything they needed to get involved in fantasy.
The ability to do fantasy sports without the hassle of getting on an old desk top made the game
that much more appealing. Mobile app development and innovation helped spur the growth on.
The third jump in fantasy usage happened between 2014 and 2015. It jumped from 41.5
million in 2014 to almost 57 million in 2015. This is the result of the introduction and growth of
daily fantasy sports. A slightly different game than seasonal fantasy sports, this gives people the
ability to play one week at a time without committing to handling a roster every week. In regular
seasonal fantasy, each person drafts a team for the whole season. Then they make moves and
start decisions all year long. They are committed from the draft to the end of the season and
admittedly it can be time consuming. In daily fantasy sports, people can compete on a weekly
basis. You pick your team and play for only that one week. Then, if you don’t want to play next
week you don’t have to. Daily fantasy is where a lot of bets are placed. Weekly prices on the
two most popular daily fantasy websites, Fanduel and DraftKings, entice a lot of activity.
Within fantasy sports, the most popular fantasy sport, by far, is fantasy football. It has
become so big, it has grown into an industry of its own. More than 70% of all fantasy sport
participants play fantasy football. (Wenrish, 2017) In 2013, the most recent year for which I am
given information, revenues for the fantasy football industry were $11 billion and that does not
include ad revenue for fantasy football sites. Since 2013, fantasy football has grown even more.
Because fantasy football dominates the fantasy sports community, the growth in fantasy sports as
a whole, discussed above, is highly correlated with growth in the fantasy football sector.
There are many forms of fantasy football. For those that do not know, here is a general
overview of how fantasy football is played. Family, friends, coworkers, and acquaintances alike
get together to form fantasy football leagues. There are several websites that offer fantasy
football leagues, like Yahoo and ESPN to name a few. Typically, leagues are constructed of 8-
12 teams. Teams can be owned and managed by one person or co-owned and managed by a
couple people. Roster sizes can vary, but a typical roster is 1 quarterback (QB), 2 wide receivers
(WR)s, 2 running backs (RB), 1 tight end (TE), 1 flex, 1 kicker, a defense, and 6-8 bench spots.
A WR, RB, or TE usually are the positions able to start in the flex position. A defense is just a
NFL team’s defense. Points for defense are based on the number of points the NFL team defense

5
gives up, point the defense scores themselves, sacks, interceptions, and fumble recoveries. Some
leagues may use specific defensive players, but most do not, and typically defensive players are
not very important in fantasy. Points for offensive positions are based off of yards, touchdowns,
and sometimes pass receptions. These fantasy leagues begin the year with either an auction or
draft to decide who gets what players. Auctions go like any other auction. Players are put on the
board, and fantasy teams place imaginary values on them based off of the fake team budgets
given. The team that values the player the most gets the player. Drafts go in order. A team’s
draft position comes up, and they choose the player they want based off of the players not
already drafted. Then, after the teams are chosen, each fan manages their own team throughout
the season and based on their player’s statistical outputs, they compete. Money does not have to
be attached to winning, but in many leagues, they play for a prize. Fantasy football is set up by a
couple different factors to be the best fantasy sport. The perfect mix of seasonal excitement for
American football and the number of games played makes the NFL’s football the best product
for inducing fantasy involvement.
Question
Roger Goodell’s estimate of $25 billion in NFL revenue by 2027 mentioned above seems
like an extremely difficult feat to the average person. However, NFL revenues have been
growing at a strong pace for years. figure 3 shows NFL revenues from 2001 to 2016. These
year-end revenues are not only the largest of the three biggest sports in the United States
(football/basketball/baseball), they are also growing at the fastest pace. Figure 4 shows MLB
revenues from 2001 to 2016. Figure 5 shows NBA revenues from 2001 to 2017. In 2001 the
revenues for the NFL, MLB, and NBA were $4.28 billion, $3.58 billion, and $2.66 billion
respectively. In 2016 those revenues had grown to $13.16 Billion for the NFL, $9.46 billion for
the MLB, and $5.87 billion for the NBA. That’s an increase of 307% for the NFL, 252% for the
MLB, and 221% for the NBA. So, NFL revenues are better than the other two major sports in
the United States in both overall size and rate of growth.
Why is it that NFL revenues have out performed MLB and NBA revenues so drastically?
Well, revenues of a sports league have a lot to do with the popularity of that sports league. The
reason the NHL does not make $13.16 billion a year is because not as many people in the United
States watch hockey as football. Popularity turns into higher TV ratings, sponsorship demand,
advertisement demand, and merchandise sales. All of which create revenue for the league. If the
Super bowl didn’t draw as big of crowd as it does, it wouldn’t cost $5 million for a 30 second ad
during the game. So, the thing every sports league desires most is popularity. Every day, people
in these leagues are striving for ways to increase their popularity. So, this begs the question;
why is the NFL the most popular league in the United States? Is it just as simple as more people
like watching football than watching basketball or baseball? Baseball has always had the
nickname “America’s past time”. Wouldn’t it make sense then for that to be the most popular
sport? There are many possible reasons for why that’s not the case, but one factor that I believe
is holding baseball back from being the most popular and profitable sport in America is its
fantasy popularity. Fantasy baseball has steadily lost some of its percentage share in the total

6
fantasy sports participation pie. While fantasy baseball has been losing ground, fantasy football
has been gaining traction.
I hypothesize that, the NFL’s popularity is influenced by their fantasy popularity and thus
their revenue success is influenced by their fantasy popularity. The number of games and
structure of schedule in the NFL make their fantasy format very straight forward and easy to
understand. The ease and simplicity of fantasy football when compared to other sports has led to
it dominating the fantasy world. As discussed above, about 70% of all fantasy sport activity is
fantasy football, and an even higher percent of fantasy revenue is fantasy football related. The
Pearson correlation coefficient between the number of fantasy sport players, the best proxy for
fantasy football players, and NFL league revenue shows a strong correlation.
A perfect positive Pearson correlation coefficient is 1. For example, that would be the
result comparing a variable against itself. Comparing NFL league revenue to fantasy sport
participation results in a Pearson correlation of 0.9656. This is evidence that as the number of
fantasy players goes up, NFL revenue goes up and vice versa. This is all good, but this
correlation does not prove causation. The Pearson correlation coefficient cannot determine if the
variables are actually influencing each other or are just correlated. So, this is not proof that the
growth in fantasy sport users is impacting NFL revenues. It could be that NFL revenues are
influencing fantasy sport participation, or it could just be a random correlation. This relationship
could also be attributed to any number of outside variables, such as macro-economic conditions
or just random chance, and proves nothing more than both NFL league revenues and Fantasy
sport users increased during this time period.
So, the question I need to ask is, are there impacts on NFL revenues, above the impacts
attributable to other known factors, that are correlated with the fantasy football craze.
Successfully controlling for those other factors and still finding a correlation would suggest that
the increase in fantasy football has some effect on the revenue increases. Specifically, I will do
two tests. First, I will test revenues for NFL teams, local revenues only because these are the
only revenues that vary team by team, for a relationship between those and the best variable
available to represent fantasy football participation, fantasy sports participation. Secondly, I will
estimate the effects of a NFL team’s fantasy popularity on that team’s local revenues.
Controlling for each team’s win percentage and using dummy variables to control for other
factors will help to make my findings more valuable.
Data
One would assume that when trying to test for impacts on NFL revenues, the best
variable to use as the dependent would of course be NFL revenues. However, because of the
league’s bargaining agreement, a large portion of the revenue the teams in the league make are
shared evenly among the 32 teams. These are called the national revenues and they are mostly
made up of revenues from TV contracts and other contract deals that are made years in advance.
Things that happen during the years of the contracts don’t typically have an effect on how much
money is given to the NFL in those years because the contract is already written and agreed
upon. So, testing for fantasy football impacts on these revenues does not make any sense.

7
Instead, I use the revenues that are not predetermined and shared evenly. Those are the local
revenues. These are made up of things like stadium pro shop sales, local sponsorships, and the
team’s share of home game ticket sales. Testing for fantasy football impacts on these makes
sense because they are not long-term contracts and they vary team-by-team depending on any
number of factors.
I obtained measurements for each team’s local revenue in the following way. First, I had
to find each team’s total revenue for each year. That is calculated as their share of national
revenues plus their local revenues. To find total team revenue, I used Forbes, which
conveniently comes out each year with their valuations of all 32 NFL teams. These valuations
take into account several factors, both historic and forward looking, to determine the fair value of
each specific NFL team. They call their team valuations “enterprise values” because their
equation, equity plus net debt, is what they consider the value of everything team related the
owner has. Some historic variables this equation takes into account are debts and revenues
associated with whether the owner actually owns the stadium or not. A forward looking variable
they use is their estimate of the impact a stadium renovation or relocation will have. Another
one of the historic factors they take into account are the total revenues for each team for the
previous year. So, the Forbes 2013 valuation for the Chicago Bears takes into account the total
revenues the Bears made in 2012. I gathered these from Forbes.com for the years they still had
available, 2012-2016. This data has a mean of 344.66 million and a standard deviation of 86.27
million. This data shows NFL revenues increasing over time. The mean in 2012 is 286.47
million and that number steadily grows to 411.13 million in 2016. Basic characteristics of this
data can be found in table 1. Then, I had to make some calculations. National and local
revenues are not necessarily released by each team. However, one team in particular has an
extensive financial report each year. That team would be the Packers. Because the Packers are
publicly owned, they release their local revenues for each season. Because each season the 32
teams split the national revenue evenly, by knowing the Packers local revenue and their total
revenue, calculating the difference gives the national revenue each team receives in a given year.
Then to get the other team’s local revenues, I just calculated the difference between each team’s
total revenue and their share of the national revenue for that year. All calculations were done
using excel formulas.
In an ideal world, I would be testing fantasy football participation instead of total fantasy
sport participation. However, this specificity is not available, only numbers for fantasy sports in
total are available. But, for the following reason, I argue it is reasonable to say that the growth in
total fantasy sport usage is attributable largely to fantasy football and highly correlated with
fantasy football participation change. According to numbers that originate from the Fantasy
Sport Trade Association (FSTA), fantasy football was 72% of fantasy participation in 2013. It is
also known that fantasy football was 71% of total fantasy participation in 2016. Considering
these numbers, it is likely that fantasy football’s percentage of total participation hasn’t varied
much during the time frame being tested, 2012 to 2016. This would mean that variation in total
participation would be correlated highly with fantasy football participation. Getting the number
of fantasy sport users on a yearly basis was very straight forward. The Fantasy Sports Trade
8
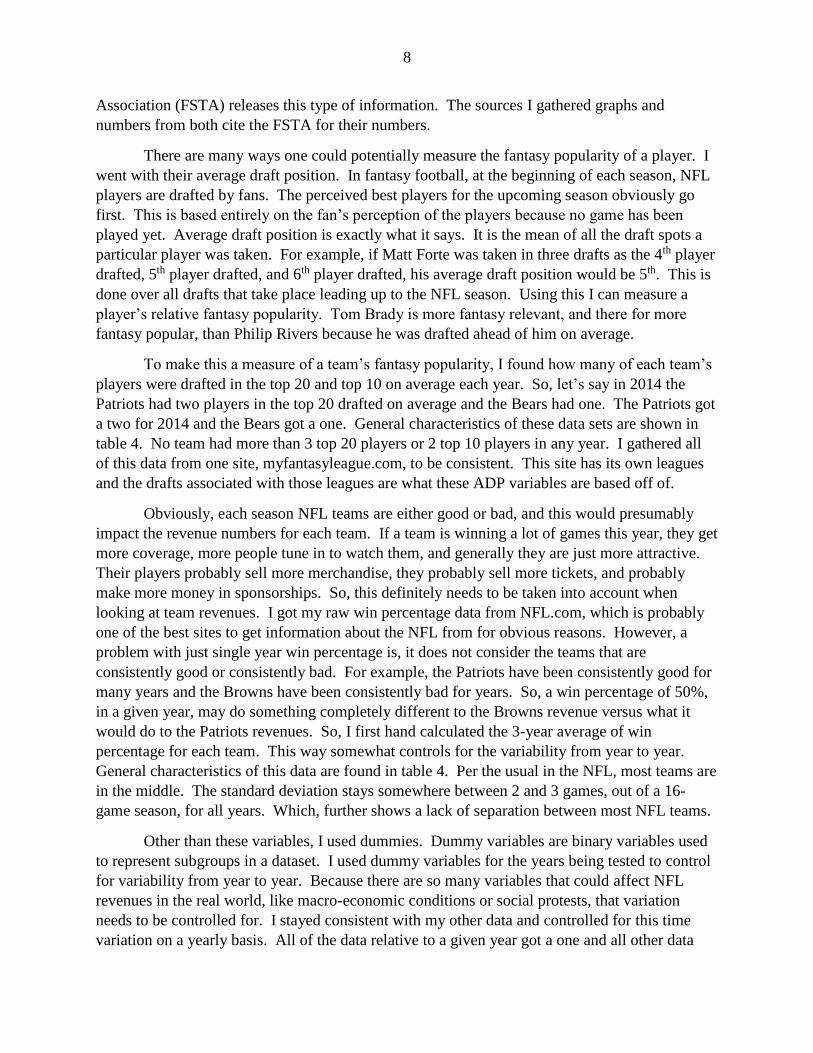
Association (FSTA) releases this type of information. The sources I gathered graphs and
numbers from both cite the FSTA for their numbers.
There are many ways one could potentially measure the fantasy popularity of a player. I
went with their average draft position. In fantasy football, at the beginning of each season, NFL
players are drafted by fans. The perceived best players for the upcoming season obviously go
first. This is based entirely on the fan’s perception of the players because no game has been
played yet. Average draft position is exactly what it says. It is the mean of all the draft spots a
particular player was taken. For example, if Matt Forte was taken in three drafts as the 4th player
drafted, 5th player drafted, and 6th player drafted, his average draft position would be 5th. This is
done over all drafts that take place leading up to the NFL season. Using this I can measure a
player’s relative fantasy popularity. Tom Brady is more fantasy relevant, and there for more
fantasy popular, than Philip Rivers because he was drafted ahead of him on average.
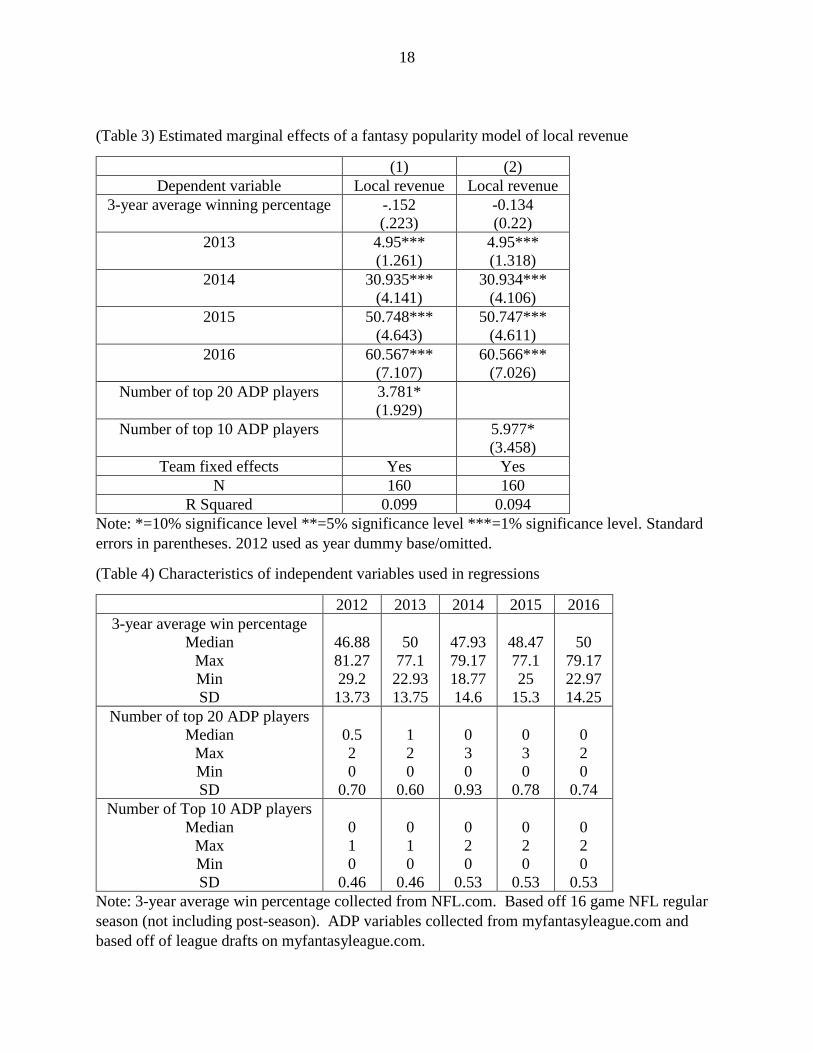
To make this a measure of a team’s fantasy popularity, I found how many of each team’s
players were drafted in the top 20 and top 10 on average each year. So, let’s say in 2014 the
Patriots had two players in the top 20 drafted on average and the Bears had one. The Patriots got
a two for 2014 and the Bears got a one. General characteristics of these data sets are shown in
table 4. No team had more than 3 top 20 players or 2 top 10 players in any year. I gathered all
of this data from one site, myfantasyleague.com, to be consistent. This site has its own leagues
and the drafts associated with those leagues are what these ADP variables are based off of.
Obviously, each season NFL teams are either good or bad, and this would presumably
impact the revenue numbers for each team. If a team is winning a lot of games this year, they get
more coverage, more people tune in to watch them, and generally they are just more attractive.
Their players probably sell more merchandise, they probably sell more tickets, and probably
make more money in sponsorships. So, this definitely needs to be taken into account when
looking at team revenues. I got my raw win percentage data from NFL.com, which is probably
one of the best sites to get information about the NFL from for obvious reasons. However, a
problem with just single year win percentage is, it does not consider the teams that are
consistently good or consistently bad. For example, the Patriots have been consistently good for
many years and the Browns have been consistently bad for years. So, a win percentage of 50%,
in a given year, may do something completely different to the Browns revenue versus what it
would do to the Patriots revenues. So, I first hand calculated the 3-year average of win
percentage for each team. This way somewhat controls for the variability from year to year.
General characteristics of this data are found in table 4. Per the usual in the NFL, most teams are
in the middle. The standard deviation stays somewhere between 2 and 3 games, out of a 16-
game season, for all years. Which, further shows a lack of separation between most NFL teams.
Other than these variables, I used dummies. Dummy variables are binary variables used
to represent subgroups in a dataset. I used dummy variables for the years being tested to control
for variability from year to year. Because there are so many variables that could affect NFL
revenues in the real world, like macro-economic conditions or social protests, that variation
needs to be controlled for. I stayed consistent with my other data and controlled for this time
variation on a yearly basis. All of the data relative to a given year got a one and all other data

9
got a zero. So, for 2012, the data rows related to each team’s variables in that year got a one in
the 2012 column. The rows with data related to other years got a zero in the 2012 column. I also
used dummies to control for team by team variability. I gave each row a one for the team related
with that row and a zero for the other 31 teams not related to that row. (This allows for error
clustering, which we will discuss farther in the results section) Because the coefficients for the
team dummy variables are not significant to the study I am doing, they will not be shown in the
tables for these tests. Instead, using Stata, their coefficients are represented in the constant, to
help clean up the tables.
Results
The first test is to determine if there are any impacts on NFL team revenues attributable
to the growth in fantasy participation. To do this test, I built a model without using fantasy
participation as an independent variable and studied the unexplained variation. I want to know
the residuals, or unexplained variation, of a model that does not include fantasy participation, so
I can compare those results to the fantasy participation data and look for a correlation. Testing
for a correlation this way instead of adding fantasy participation into the regression has one
major advantage. Because fantasy participation may have collinearity with other variables
involved, like win percentage and team dummies, adding the fantasy sport player data into the
regression may distort the results and make it unclear where the actual impacts are coming from.
A winning team probably has better statistical players, and often in the NFL some teams are
consistently good, and some teams are consistently bad. The possible collinearity makes
studying the residuals of a model that does not include fantasy participation the better option.
To begin, I started out with a model of just year dummies as independent variables and
NFL local revenues as the dependent variable. This can be found in table 2 column 1. From
looking at this, you can get a general idea of the relationship between year and local revenue.
Year by year variation is very important to include in these estimations, but without the other
independent variables, significance of the marginal effects for 2013, 2014, and the constant are
lack luster. Table 2 column 2 shows a regression that has now added the 3-year winning
percentage of each team as an independent variable, along with the year dummies. We see an
improvement from the previous estimation, but this still has limitations that can be improved
upon. The winning percentage variable adds a new element of specificity to what may be
influencing local revenues, but as you can see, the significance of some variables still needs to be
improved upon.
Table 2 column 3 is the most important estimation and the one that the residuals for the
next part are drawn from. This estimation uses the NFL team’s local revenues as the dependent
variable, year dummies as independent variables, along with the 3-year average win percentage
of each team, and now team dummies with team fixed effects. These team dummies allow for
variation from team to team to be considered. Theoretically, this is another important source of
variation that needs to be measured when estimating team local revenues. Some teams may
inherently be more valuable, because of market size or history. That is important variation to
distinguish. I then clustered the standard errors by team to account for the non-independence of

10
observations for a given team over time. Basically, clustering helps to prevent correlated error
terms that would be the effect of comparing a team against itself over time.
Using the fixed effects function in Stata gave me the advantages of using team dummies
and it does not show the messy coefficients for all 32 teams. The first thing we see from this
regression is that the 3-year average win percentage variable is not statistically significant. This
is especially interesting because the regression in table 2 column 2, without team fixed effects,
shows a positive significant marginal effect for the winning percentage variable. This means that
the marginal effect for the 3-year average winning percentage variable was being skewed by the
unaccounted-for team variation. So, some of the teams with inherently more local revenue also
had better winning percentages, and once the variation in team was accounted for, the estimation
in column 3 shows that there is not a statistical relationship between winning and local revenue.
The p-value of the winning percentage variable is so large in column 3, .693, that we cannot say
the marginal effect for this variable is different from zero. If this test was over a longer period of
time and this variable could be studied using more data, one could be more certain as to whether
its effects are different from zero. But, I am not able to draw any conclusions from the current
coefficient I have. The comparison between column 2 and column 3 results for the winning
percentage variable shows the importance of adding the team dummy variables. The next thing
we see is that the 2012 variable is the one omitted. This just means that the rest of the years are
being compared to 2012 as a base, which makes sense when you look at their coefficients. The
coefficients from 2013 to 2016 are all significant and are becoming larger and larger as time goes
on with 2016 being the largest. A test on this regression, comparing each year dummy to the
adjacent years, shows that each year is different from the adjacent years at least at the 5% level.
This shows that there is a statistically significant impact on revenue based on what year you are
in and that that impact is a positive relationship. As time goes on, revenues go up.
To use this regression to test the effects of the growth in fantasy participation, I graphed
the growth in fantasy sports participation against the residuals of this regression. The residuals
of a regression make up a variable that shows the variation in the dependent variable not
explained by the independent variables. So, the residuals of this regression show the variation in
local revenues not explained by the team’s win percentage or the year and team dummies used.
The graph comparing the residuals to fantasy sport participation can be found in figure 6.
This figure shows a positive relationship between the residuals of the regression
discussed above and the growth in fantasy sport usage. So, it can be interpreted from this figure
that some of the unexplained variation in NFL team local revenues from a regression with win
percentage, year variation controlled, and team variation controlled, is related to the growth in
fantasy users. This is stronger evidence of a relationship between NFL revenues and fantasy
sport growth than just the Pearson coefficient between NFL league revenues and fantasy sport
growth because it controls for variables that would be considered major players in NFL team
revenue. However, this is still only suggestive evidence. It is not necessarily definitive that
there is a causal relationship between the residuals and fantasy sport participation. This merely
removes some variation, by explaining it with the independent variables in the regression, and

11
shows that there is still a relationship between the growth in fantasy sport participation and the
NFL local revenues.
The second estimation I am testing is to see if there are any impacts on NFL team
revenues related to that team’s fantasy popularity. To do this test, I used local revenue as the
dependent variable. I did not do this test with national revenue because that revenue is split
evenly among the 32 teams each year. So, whether a team was extremely popular in fantasy or
not, they received the same national revenue. With local revenue as my dependent variable, I did
two regressions. First, I used 3-year average winning percentage, year and team dummy
variables, and each team’s number of players with ADPs in the top 20 as my independent
variables. Secondly, I used 3-year average winning percentage, year and team dummy variables,
and each team’s number of players with ADPs in the top 10 as my independent variables. These
ADP variables are proxy for how popular a team was in fantasy that year. A positive correlation
between these variables and local revenues would mean that as a team’s number of players with
ADPs in the top 20 and top 10 increases, as a team’s fantasy popularity increases, their local
revenues also increase.
For the first regression in this second estimation, the one using the top 20 ADP variable,
the results are found in table 3 column 1. The 3-year average winning percentage is again not
significant, and we cannot confidently say its coefficient is different from zero. The year
dummies are very significant, and the coefficients get bigger as time goes on. What is most
important from this regression is the significance found with the ADP variable. It shows, the
number of players a team has that are drafted on average, in fantasy drafts, in the top 20 has a
positive relationship with team local revenues at the 10% significance level, and almost at the 5
% significance level (p=.059). This information is very interesting because, this means that even
after controlling for a NFL team’s wins, variation attributable to each specific year, and variation
from team to team, how many players a team has that are popular enough in fantasy to be drafted
in the top 20 has a measurable impact on that team’s local revenues. Specifically, the test
estimates that an increase of 1 player drafted in the top 20 ADP will increase a team’s revenue by
3.781 million dollars. This information could be valuable to both NFL players, to better
understand their worth to the organization, and a NFL team’s representatives looking to see what
may impact their revenues. This information is also important for my hypothesis because it
suggests that fantasy can in fact impact NFL revenues.
The second regression was the same, except I changed the ADP variable to the number of
players drafted on average in the top 10 instead of the top 20. I did this because it is possible that
the impact on revenue of having a player in the top 10 is different from the impact of having a
player from 11-20. For example, it is very reasonable to say that the impact of Antonio Brown at
an ADP of 4 overall is much different from the impact of Keenan Allen at 20 overall. Brown is
much more popular and could potentially produce more revenue for the team. This regression’s
results are found in table 3 column 2. As you can see, all of the controlled for variables, 3-year
average winning percentage and the dummy variables used, follow the same patterns they have
been following in the other regressions. The variable being tested for, the ADP variable, once
again shows similar characteristics to the top 20 ADP variable. This top 10 ADP variable has a

12
positive coefficient that is significant at the 10% level. Specifically, this means, as the number
of players a NFL team has that are drafted on average in the top 10 of fantasy drafts increases by
1, their local revenues go up by 5.977 million dollars. This is suggestive evidence for my
hypothesis that fantasy football has impacted NFL revenues. Also, a coefficient of basically 6
for the top 10 ADP variable compared to a coefficient of 3.781 for the top 20 ADP variable
suggests that the impact of having a player in the top 10 is in fact quite a bit more valuable than a
player in the 11-20 range.
By showing that the teams with more popular fantasy players have better local revenues,
these two regressions involving the ADP variables are able to advocate for the idea that fantasy
football has an overarching positive influence on NFL revenues. Still, I am being selective with
how I phrase what these regressions show because they are not undisputable evidence. Even
though there are some variables being controlled for, there are many unknown variables that
could be skewing the results. This is strong but not full proof evidence of a relationship that
would back up my hypothesis.
Conclusion
Fantasy football has become a very big market. Its popularity grew by more than 50%
between 2012 and 2016. I hypothesized that fantasy football has had a positive impact on NFL
popularity and there for NFL revenues. To test this, I did two different estimations. First, I
controlled for outside variables by regressing NFL local revenues against NFL team 3-year
average winning percentage, to control for the impacts of winning on a team’s revenues, along
with year and team dummies, to control for variation across years and across teams. Then, I
compared the residuals of this regression with the growth in fantasy sports during these years. I
found that there was a positive correlation between the unexplained variation of this regression
and fantasy sport’s participation. This suggests that some of the variation outside of this
regression is related to the growth in fantasy.
The second estimation I did involved two regressions testing the impacts of a team
having popular fantasy players on that NFL team’s local revenues. These results showed
statistically significant evidence that even after controlling for some other variation, having
players with average draft positions in the top 20 and top 10 can actually positively influence a
NFL team’s local revenues. All of these estimations point towards a positive influence fantasy
football may have on NFL revenues. The estimations involving ADP variables are evidence of a
general relationship between fantasy popularity and NFL revenues. The correlation between the
residuals of the regression in table 2 column 3 and the fantasy sport participation data shows that
this relationship may factor into the incredible growth rate of NFL revenues.
These findings are only suggestive and are not stand alone full proof evidence to back up
my hypothesis, but they do serve as strong talking points in favor of my hypothesis. To form
stronger evidence in favor of this hypothesis, I would need a number of things to be different
about my data. First, I would need more of it. 5 years is a relatively strong timeframe for this
type of analysis, but a 10-year or even 15-year window would be even better. Secondly, I would
need specific numbers on fantasy football growth and not just fantasy sport growth. While it is

13
reasonable to attribute fantasy sport growth largely to fantasy football, the more specificity the
better. It would also make for better evidence if the revenue streams for the NFL could be
broken down even farther than just local and national. Testing for impacts on specific revenue
streams instead of groups of revenue streams could come up with correlations that cannot be
ignored when discussing this topic. All in all, the evidence provided in this paper furthers the
idea that NFL revenues are in fact positively influenced by fantasy football.

14
Figures and Tables
(Figure 1) Fantasy Sport Participation
Note: Collected from Fantasy Sports Trade Association
(Figure 2) Mobile Fantasy Platform Usage
Note: Collected from thefantasyfootballers.com

15
(Figure 3) NFL Revenues
Note: collected from statista.com
(Figure 4) MLB revenues
Note: Collected from statista.com

16
(Figure 5) NBA revenues
Note: Collected from statista.com
(Figure 6) Local revenue regression residuals versus fantasy sport participation
Note: Residuals of the regression (NFL team local revenue = 3-year average win
percentage + year dummies + team dummies) compared to the number of Fantasy sport players
each year. Errors clustered by team in regression.

17
(Table 1) NFL Team Revenues
NFL Team
Revenues
2012 2013 2014 2015 2016
Mean 286.47 299.22 346.59 379.91 411.13
Median 269 279.5 322 358.5 388.5
Max 539 560 620 700 840
Min 229 244 281 301 321
Standard
Deviation
59.89 62.46 68.43 74.78 91.30
Note: All numbers denominated in millions. Data analyzed was collected entirely from
forbes.com.
(Table 2) Estimated marginal effects of a model of local revenue
(1) (2) (3)
Dependent variable Local revenue Local revenue Local revenue
Constant 106.57
(12.98)
51.62**
(23.52)
111.234***
(11.777)
3-year average winning percentage 1.10***
(0.396)
-0.093
(0.235)
2013 4.95
(18.35)
4.95
(17.96)
4.95***
(1.01)
2014 30.93*
(18.35)
30.85*
(17.96)
30.93***
(4.074)
2015 50.74***
(18.35)
50.66***
(17.96)
50.744**
(4.674)
2016 60.56***
(18.35)
60.48***
(17.96)
60.563***
(7.196)
Team fixed effects No No Yes
N 160 160 160
R Squared 0.099 0.143 0.092
Note: *=10% significance level **=5% significance level ***=1% significance level. Standard
errors in parentheses. 2012 used as year dummy base/omitted.
18
(Table 3) Estimated marginal effects of a fantasy popularity model of local revenue
(1) (2)
Dependent variable Local revenue Local revenue
3-year average winning percentage -.152
(.223)
-0.134
(0.22)
2013 4.95***
(1.261)
4.95***
(1.318)
2014 30.935***
(4.141)
30.934***
(4.106)
2015 50.748***
(4.643)
50.747***
(4.611)
2016 60.567***
(7.107)
60.566***
(7.026)
Number of top 20 ADP players 3.781*
(1.929)
Number of top 10 ADP players 5.977*
(3.458)
Team fixed effects Yes Yes
N 160 160
R Squared 0.099 0.094
Note: *=10% significance level **=5% significance level ***=1% significance level. Standard
errors in parentheses. 2012 used as year dummy base/omitted.
(Table 4) Characteristics of independent variables used in regressions
2012 2013 2014 2015 2016
3-year average win percentage
Median
Max
Min
SD
46.88
81.27
29.2
13.73
50
77.1
22.93
13.75
47.93
79.17
18.77
14.6
48.47
77.1
25
15.3
50
79.17
22.97
14.25
Number of top 20 ADP players
Median
Max
Min
SD
0.5
2
0
0.70
1
2
0
0.60
0
3
0
0.93
0
3
0
0.78
0
2
0
0.74
Number of Top 10 ADP players
Median
Max
Min
SD
0
1
0
0.46
0
1
0
0.46
0
2
0
0.53
0
2
0
0.53
0
2
0
0.53
Note: 3-year average win percentage collected from NFL.com. Based off 16 game NFL regular
season (not including post-season). ADP variables collected from myfantasyleague.com and
based off of league drafts on myfantasyleague.com.

19
Resources
Barton, Merrilee. “2014 NFL Team Values.” Forbes, Forbes Magazine, 4 May 2017,
www.forbes.com/pictures/55d4de89e4b0ffa7afe3faa3/32-buffalo-bills/#72c265b07673.
Barton, Merrilee. “2015 NFL Team Values.” Forbes, Forbes Magazine, 4 May 2017,
www.forbes.com/pictures/57c04820a7ea430a8a18c8e0/1-dallas-
cowboys/#5af094794280.
Barton, Merrilee. “2016 NFL Team Values.” Forbes, Forbes Magazine, 4 May 2017,
www.forbes.com/pictures/57c04820a7ea430a8a18c8e0/32-buffalo-bills/#1b0255cc365c.
Gaines, Cork. “The Number of People Playing Fantasy Sports Is Skyrocketing.” Business
Insider, Business Insider, 12 Oct. 2015, www.businessinsider.com/fantasy-sports-players-
2015-10
Hu, Elise. “Smartphone Boom Fuels A $1 Billion Fantasy Sports Industry.” NPR, NPR, 16 Sept.
2013, www.npr.org/sections/alltechconsidered/2013/09/16/223110132/smartphone-
boom-fuels-a-1-billion-fantasy-sports-industry.
Montgomery, James. “Why Won't Anybody Join Your Fantasy Baseball League?” Rolling
Stone, Rolling Stone, 25 Mar. 2015, www.rollingstone.com/culture/features/why-wont-
anybody-join-your-fantasy-baseball-league-20150325.
Null. “2013 NFL Team Values.” Forbes, Forbes Magazine, 4 May 2017,
www.forbes.com/pictures/54f4e702da47a54de824430a/32-st-louis-rams/#423ad69714fa
Ozanian, Mike. “2012 NFL Team Values.” Forbes, Forbes Magazine, 18 Aug. 2013,
www.forbes.com/pictures/mlm45ekfed/32-oakland-raiders/#595fcfbd3792.
Rovell, Darren. “Packers Enjoy Record Earnings.” ESPN, ESPN Internet Ventures, 16 July
2013, www.espn.com/nfl/story/_/id/9483276/green-bay-packers-enjoyed-record-revenue-
profits-2012-13.
Rovell, Darren. “NFL Teams Each Earn $226.4M from National Revenue Sharing.” ESPN,
ESPN Internet Ventures, 22 July 2015, www.espn.com/nfl/story/_/id/13290743/green-
bay-packers-financial-records-reveal-2264m-nfl-revenue-sharing.
Ryman, Richard. “Packers Report Another Year of Record Revenue.” Press Gazette Media,
Green Bay Press Gazette, 13 July 2017,
www.greenbaypressgazette.com/story/news/2017/07/12/packers-report-another-year-
record-revenue/417355001/
Ryman, Richard -. “Green Bay Packers' Revenue Continues to Grow.” Press

20
Gazette Media, Wisconsin, 11 July 2014,
www.greenbaypressgazette.com/story/money/2014/07/10/green-bay-packers-revenue-
continues-grow/12493065/.
Wenrish, Michael. “The Financial Outlook of Fantasy Football.” The Fantasy Footballers
Podcast, 31 July 2017,
www.thefantasyfootballers.com/articles/financial-outlook-fantasy-football/
Wilde, Jason. “Packers Raked in $222.6M in National Revenue in Fiscal 2015.” ESPN, ESPN
Internet Ventures, 25 June 2016, www.espn.com/nfl/story/_/id/16486925/green-bay-
packers-report-record-profit-489-million-2015-fiscal-year.
“Revenue of the NFL 2001-2016 | Statistic.” Statista, www.statista.com/statistics/193457/total
league-revenue-of-the-nfl-since-2005/.
“NFL League Standings.” NFL.com, www.nfl.com/standings/league/2015/REG
My Fantasy League,
www03.myfantasyleague.com/2013/adp?COUNT=150&POS=*&ROOKIES=0&INJUR
ED=1&CUTOFF=5&FRANCHISES=-1&IS_PPR=-1&IS_KEEPER=0&IS_MOCK=-
1&TIME
History.com Staff. “The Invention of the Internet.” History.com, A&E Television Networks,
2010, www.history.com/topics/inventions/invention-of-the-internet.
“Major League Baseball total league revenue from 2001 to 2017 (in billion U.S. dollars)”
Statista, https://www.statista.com/statistics/193466/total-league-revenue-of-the-mlb-
since-2005/
“Total NBA Revenue 2001-2017.” Statista, www.statista.com/statistics/193467/total-league-
revenue-of-the-nba-since-2005/.
“The History of Sports Betting.” History of Sports Betting - A Historical Look at Betting on
Sports, www.onlinegamblingsites.org/history/sports-betting/.