Embed Size (px)
Citation preview

S P E C I A L R E P O R T
FAO/WFP CROP AND FOOD SECURITY ASSESSMENT MISSION TO THE DEMOCRATIC PEOPLE’S REPUBLIC OF KOREA
28 November 2013
FOOD AND AGRICULTURE ORGANIZATION OF THE UNITED NATIONS, ROME
WORLD FOOD PROGRAMME, ROME

- 2 -
This report has been prepared by Kisan Gunjal and Swithun Goodbody (FAO) and Siemon Hollema,
Katrien Ghoos, Samir Wanmali, Krishna Krishnamurthy and Emily Turano (WFP) under the
responsibility of the FAO and WFP Secretariats with information from official and other sources. The
authors wish to acknowledge valuable contributions from Belay Gaga and Bui Bong (FAO) and Anna-
Leena Rasanen, Xuerong Liu, Dawa Gyetse and Jennifer Rosenzweig (WFP). Since conditions may
change rapidly, please contact the undersigned for further information if required.
Liliana Balbi Kenro Oshidari Senior Economist, GIEWS, FAO Regional Director, WFP Fax: 0039-06-5705-4495 Fax: 0066-26554413
E-mail: [email protected] E-mail: [email protected]
Please note that this Special Report is also available on the Internet as part of the FAO World Wide Web
(www.fao.org) at the following URL address: http://www.fao.org/giews/
The Special Alerts/Reports can also be received automatically by E-mail as soon as they are published,
by subscribing to the GIEWS/Alerts report ListServ. To do so, please send an E-mail to the FAO-Mail-
Server at the following address: [email protected], leaving the subject blank, with the following
message:
subscribe GIEWSAlertsWorld-L To be deleted from the list, send the message:
unsubscribe GIEWSAlertsWorld-L
Please note that it is now possible to subscribe to regional lists to only receive Special Reports/Alerts by
region: Africa, Asia, Europe or Latin America (GIEWSAlertsAfrica-L, GIEWSAlertsAsia-L,
GIEWSAlertsEurope-L and GIEWSAlertsLA-L). These lists can be subscribed to in the same way as the
worldwide list.

- 3 -
TABLE OF CONTENTS
Page Mission Highlights ....................................................................................................................................... 4 1. OVERVIEW ...................................................................................................................................... 4 1.1 Mission organization ......................................................................................................................... 4 1.2 Food production ................................................................................................................................ 6 1.3 Household food security and nutrition .............................................................................................. 7 2. OVERALL ECONOMIC SETTING AND AGRICULTURE IN DPRK ............................................... 7 2.1 Macro-economy ................................................................................................................................ 7 2.2 Food imports ..................................................................................................................................... 8 2.3 Economic policy changes ................................................................................................................. 9 2.4 Agricultural sector ........................................................................................................................... 10 3. FOOD CROP PRODUCTION IN 2013 ........................................................................................... 11 3.1 Climate ...................................................................................................................................... 11 3.2 Area planted ................................................................................................................................... 13 3.3 Means of production and inputs ..................................................................................................... 16 3.4 Crop yields and production ............................................................................................................. 20 3.5 Livestock ...................................................................................................................................... 24 4. FOOD SUPPLY/DEMAND BALANCE 2013/14 ........................................................................... 25 5. HOUSEHOLD FOOD SECURITY AND VULNERABILITY ANALYSIS ........................................ 27 5.1 Household food consumption ......................................................................................................... 27 5.2 The Public Distribution System ....................................................................................................... 29 5.3 Household food security and coping strategies .............................................................................. 34 6. MATERNAL, INFANT AND YOUNG CHILD NUTRITION ............................................................ 37 6.1 Trend in under-nutrition .................................................................................................................. 37 6.2 Severe and moderate acute malnutrition ........................................................................................ 39 6.3 Child feeding practices ................................................................................................................... 39 6.4 Morbidity . ..................................................................................................................................... 42 6.5 Water, sanitation and hygiene practices ......................................................................................... 42 7. RECOMMENDATIONS FOR FOLLOW-UP ACTIONS ................................................................. 44 7.1 Recommendations related to agriculture ........................................................................................ 44 7.2 Recommendations related to household food security and nutrition ............................................. 45

- 4 -
Mission Highlights
1. In the DPRK, despite a small reduction in planted area, overall crop production in 2013/14 is estimated to increase by about 5 percent.
2. A total of 5.98 million tonnes of food output (including paddy, cereals, soybeans, and cereal equivalent of potatoes) from cooperative farms, plots on sloping land, and household gardens for 2013/14 is expected. This estimate includes the 2013 main season harvest that was concluded and the forecast for 2014 early season crops. When paddy is converted to milled rice and soybeans to cereal equivalent, total food production is estimated at about 5.03 million tonnes.
3. Unusually early and heavy rains in July and early August compromised maize and soybean yields but had little effect on paddy.
4. Soybean production recorded a second consecutive year of decline, due to a 6 percent reduction in yield. Main-season potatoes performed well this year, which bodes well for the seed supply for the 2014 early crop. However, supply of seeds for minor winter and spring wheat as well as barley is a constraint due to declining production over consecutive recent years.
5. Based on the Mission’s estimate of total utilization needs of 5.37 million tonnes of cereal equivalent (rice in milled terms), the Mission estimates a cereal import requirement of 340,000 tonnes for the 2013/14 marketing year (November/October). Assuming the official import target of 300,000 tonnes of cereals is met, the Mission estimates an uncovered food deficit of 40,000 tonnes for the current marketing year. This food gap is the narrowest in many years, and is mainly due to the higher 2013 production.
6. Despite the improved harvest, the food security situation remains similar to previous years with most households having borderline and poor food consumption. Consumption of protein and oils remains an issue of concern.
7. The Mission observed immense logistical challenges for the public distribution system (PDS) and therefore expresses concerns about the timeliness and consistency of food distribution.
8. Markets and informal mechanisms of bartering and other forms of exchange are believed to be of increasing importance for household access to food, particularly in urban areas.
9. The nutrition situation has improved in recent years; however, rates of stunting remain high and micronutrient deficiencies are of particular concern.
10. In order to improve food security and nutrition, the Mission also makes recommendations for national and international support for:
(i) Agriculture-related: sustainable farming practices, better price and market incentives for farmers, and improvement in farm mechanization.
(ii) Food security-related: stimulate spring crop production and implement disaster preparedness and response programmes.
(iii) Nutrition-related: improve dietary diversity and feeding practices for young children and women through different strategies such as behavioural change, market reform, and encouraging livestock and fish production; strengthening treatment of severe and moderate acute malnutrition and improving hygiene and sanitation practices.
1. OVERVIEW 1.1 Mission organization
The Mission met with Government officials at national, provincial and county levels, and visited cooperative farms, rural and urban households, farmers’ and city markets and state shops, interviewed staff of child institutions, hospital paediatric wards, and Public Distribution Centres (PDCs) and held discussions with staff of UN agencies and NGOs. The FAO/WFP Crop and Food Security Assessment Mission (CFSAM) visited the Democratic People’s Republic of Korea (DPRK) at the request of the Government, from 27 September to 11 October 2013 to assess the 2013 main crop harvest, forecast the 2014 production of winter and spring crops, estimate cereal import requirements for the 2013/14 marketing year (November/October), and assess the household food security and nutrition situation.

- 5 -
The Mission was divided into four teams in order to maximize geographical coverage. In total, 27 counties in all nine agricultural provinces were visited (Figure 1).
Figure 1. Overview of counties visited by the 2013 CFSAM members
Over the course of nine days in the field the teams visited 51 cooperative farms which represent a wide diversity in terms of their contribution to national food production (low, medium and high) and vulnerability to weather-related shocks (dry spells and floods). The Mission held interviews with a sample of 77 households to better understand household-level food and nutrition security. The Mission used a structured household questionnaire. In each county 2 to 3 households were selected. The types of household to be visited - cooperative farm or households dependent on the Public Distribution System (PDS) - were chosen at the request of the Mission teams. The final sample consisted of 47 PDS-dependent households, 29 cooperative farmers, and 1 mixed household. In addition, the Mission visited 16 hospitals and 24 child institutions to assess the contribution of Government institutions to overall food security. Nine state shops and three farmers’ markets were also visited. Doctors, nurses and nursery managers were asked specific questions on the nutrition situation of children. The sample cannot be treated as representative of the entire population as it was small and was not selected in a statistically random manner. The results presented in this report should, therefore, be considered as indicative only. Mission members brought a wide variety of skills and perspectives on agriculture, food security and nutrion. Korean-speaking international staff and consultants accompanied the teams in the field. Four observers from the European Commission (EC), the Canadian International Development Agency (CIDA), the Swiss Development Corporation (SDC) and the United Nations Resident Coordination Office also joined the Mission for all or part of the Mission period.

- 6 -
The Government provided the Mission with official data including: estimates of area and production at the county, provincial and national level; records of cereal imports and bilateral food assistance; demographic data for each county; Public Distribution System (PDS) ration levels and food transfers; and meteorological data. The Mission reviewed the data and, where necessary, adjusted the estimates based on interviews with Government and cooperative-farm officials, observation of standing and harvested crops, and evaluation of the remote sensing imagery on rainfall and vegetation. This year, for the second consecutive time, the Mission was able to carry out crop yield estimations by sample crop-cutting. For paddy, a circle of crop measuring 1 pyong (3.3 m
2) in a field ready for harvest
was cut and the seed removed and weighed. Similarly for maize, cobs were taken from rows of crop occupying one pyong. The grains were then removed from the cobs and weighed. Provision was made for moisture content in the subsequent calculation of yield, several farms having their own moisture meters. The results of these sample crop-cuttings indicated yields closely in line with those reported by the farms. 1.2 Food production
For 2013/14, overall food production (in cereal equivalents) is estimated to increase by 5 percent compared to last year, from 5.73 to 5.98 million tonnes. After taking into account milling rates for rice, this translates into 5.03 million tonnes of food available for domestic consumption this year. For 2013/14, the Mission estimates an overall production of 5.98 million tonnes (including paddy, cereals, soybeans and cereal equivalent of potatoes), an increase of almost 5 percent on last year. This figure includes main-season crops and winter and early crops produced on cooperative farms, and production from sloping land, home gardens and kitchen gardens. Paddy yields were almost 11 percent higher than last year, and maize yields were just marginally lower than last year. Soybean average yield and production were all lower than in 2012, signalling a second consecutive year of decline. Overall, the improved production this year is attributed to the increase in paddy harvest due to the generally favourable weather conditions of early heavy rains followed by good drying and ripening weather. Spring conditions in 2013 were slightly cooler than normal. Although this caused some delays in plantings, the effect of the cooler conditions was mitigated by a good supply of plastic sheeting that helped initiate crop germination and emergence. Last year, the supply of plastic sheeting to cooperative farms increased significantly and a similar level was maintained this year. There is still, however, room for improvement in this regard. Late spring and early summer (May and June) were drier than normal in many parts of the country, occasionally necessitating re-planting of maize. The period of heavy rainfall started at the beginning of July and continued into August. This was approximately one month earlier than usual and, in many locations, exceeded the maximum previously-recorded July rainfall. As a result of flooding of fields, temporary submergence of crops, and deposition of silt on crop land, some farms reported minor physical damage to crops as well as root problems where maize was temporarily waterlogged. In addition, the heavy rains were reported to have adversely affected the pollination of maize. Mission observations of incomplete grain formation on cobs at harvest time confirmed these reports. Maize also suffered from a shortage of sunshine hours throughout the summer as cloudy conditions tended to prevail. Paddy was relatively unaffected by the heavy July rains and benefited from the drier weather experienced in many provinces in August and September. The supply of agricultural inputs this year was similar to 2012, and there was a slight increase in the number of operational tractors. The incidence of crop pests and diseases was low. Based on the Mission’s estimate of total utilization needs of 5.37 million tonnes of cereal equivalent (rice in milled terms), the Mission estimates a cereal import requirement of 340,000 tonnes for the 2013/14 marketing year (November/October). Assuming the official import target of 300,000 tonnes of cereals is met, the Mission estimates an uncovered food deficit of 40,000 tonnes for the current marketing year. This food gap is the narrowest in many years, and is mainly due to the higher 2013 production level.

- 7 -
1.3 Household food security and nutrition Despite continued improvement in agricultural production, the food system in DPRK remains highly vulnerable to shocks and key gaps exist particularly in the production of protein-rich foods. The majority of households in DPRK have borderline or poor food consumption. Those households that depend on the PDS and have no access to kitchen gardens tend to be particularly vulnerable. In addition to the central public distribution system, households rely on a variety of avenues to access food. These include own production on the farm and in kitchen gardens, state shops, formal and informal markets, work (e.g. factories), wild gathering of food, and a system of gifting and commodity exchange. While the extent of the role of markets in accessing food is unclear, evidence suggests that market activity is becoming increasingly important in household food security. The nutrition situation has improved in recent years, however, rates of stunting remain high and micronutrient deficiencies are of particular concern. Child dietary diversity is poor in large part reflecting the inadequacy of food provided in child institutions. Coordinated efforts between the sectors of nutrition, health, food security, water, hygiene and sanitation are essential to further improve the nutrition status of women and children. 2. OVERALL ECONOMIC SETTING AND AGRICULTURE IN DPRK 2.1 Macro-economy
1
Since 2006, the economy of the DPRK has been stagnant, resulting in a decline in nominal per capita income. The agricultural sector remains the main contributor to the national economy. Trade with China is increasing in importance. The DPRK economy grew modestly, by 1.1 percent in 2012 over 2011, after a cumulative stagnation over the previous six years (see Table 1). In general, the small recovery in 2012 was due to the relatively good performance of the agriculture sector, expanding trade with China, and a rise in investments particularly in the mining sector and in economic zones built near the Chinese border. However, the real gross domestic product (GDP) index increased only marginally to 100.4 in 2012 with a base value of 100 in 2005, thus implying a compound annual growth rate of 0.06 percent per annum between 2006 and 2012. However, the population continued to grow at 0.5 to 0.6 percent, therefore leading to a decline in per capita income over this period.
Table 1. DPRK key economic indicators, 2006 to 2012
Economic indicator Year
2006 2007 2008 2009 2010 2011 2012 Real GDP growth (%) -1.00 -1.20 3.10 -0.90 -0.50 -0.10 1.10
Real GDP index (2005 = 100) 99 98 101 100 99 99 100
Exports (USD million) 1,467 1,685 2,062 1,994 2,554 3,704 4,000
Imports (USD million) 2,879 3,053 3,578 3,095 3,528 4,330 4,800
Trade deficit (USD million) 1,412 1,368 1,516 1,191 974 626 800
Exports to China (USD million) … … … 348 1,195 2,476 …
Imports from China (USD million … … … 1,473 2,277 3,165 …
Trade deficit with China (USD million)
… … … 1,1125 1,082 689 …
% of trade with China in total … … … 36 57 70 …
Source: Economist Intelligence Unit (EIU), October 2012 Country Report and earlier issues; 2012 trade figures from Bank of Korea quoted in EIU
The agriculture sector remains the main contributor to the national economy. However frequent drought and floods have led to significant drops in agricultural production generating shocks to the overall economy.
1 Based on data from the Economist Intelligence Unit, the Bank of Korea, and Korea Development Institute.

- 8 -
In 2012, cereal production increased by over 5 percent following an expansion of the agriculture, fishery and forestry sector by 5.3 percent in 2011. Volatility in agricultural production remains a major challenge in maintaining a stable economy and improving living standards of the population. Based on available statistics, the total trade deficit of DPRK increased by almost 50 percent in five years, rising from USD 983 million in 2003 to an estimated record high of USD 1.516 billion in 2008. Although imports have increased since then, the annual trade deficit decreased to USD 626 million in 2011 as a consequence of an increase in exports mainly to China. Economic trade of DPRK is limited to few countries, namely with China and the Republic of Korea (ROK) being the most important trading partners. Trade with China increased from about 36 percent of the total in 2009 to 70 percent in 2011. China is currently the only foreign investor mainly investing in mining, roads, railways and other infrastructure. The trend of exports to China is expected to continue. ROK was, until 2010, DPRK’s top export destination accounting for about half of all exports. However, the decision to suspend the inter-Korean trade in 2011 reduced exports. Trade values improved slightly with the resumption of the Kaesong Industrial Complex (KIC) production facilities, which were shut down from April to October 2013. This event may have had a major impact on trade between the North and the South, causing large trade deficit and reduction in foreign-exchange earnings for DPRK in 2013. 2.2 Food imports In 2012/13 the total cereal imports in the country declined sharply from the year before mainly due to a drop in bilateral and multilateral food aid. During the 2012/13 (November/October) marketing year, DPRK imported 398,636 tonnes of cereals. The country has been dependent on large quantities of food imports, primarily from China and the Russian Federation, over the last two decades with total imports declining from about a million tonnes of cereals during the mid-2000s to under 300,000 tonnes in 2008/09 (see Figure 2). Since then, the total cereal imports have steadily increased reaching 700,000 tonnes in 2011/12, with a five-year average level of about 400,000 tonnes during 2012/13. In general, commercial imports have been relatively stable in recent years, while international assistance, bilateral as well as multilateral food aid, has fluctuated significantly.
Figure 2. DPRK Cereal imports, 2005/06 to 2012/13 marketing years ('000 tonnes)
Source: National Coordination Committee, Government of DPRK
- 9 -
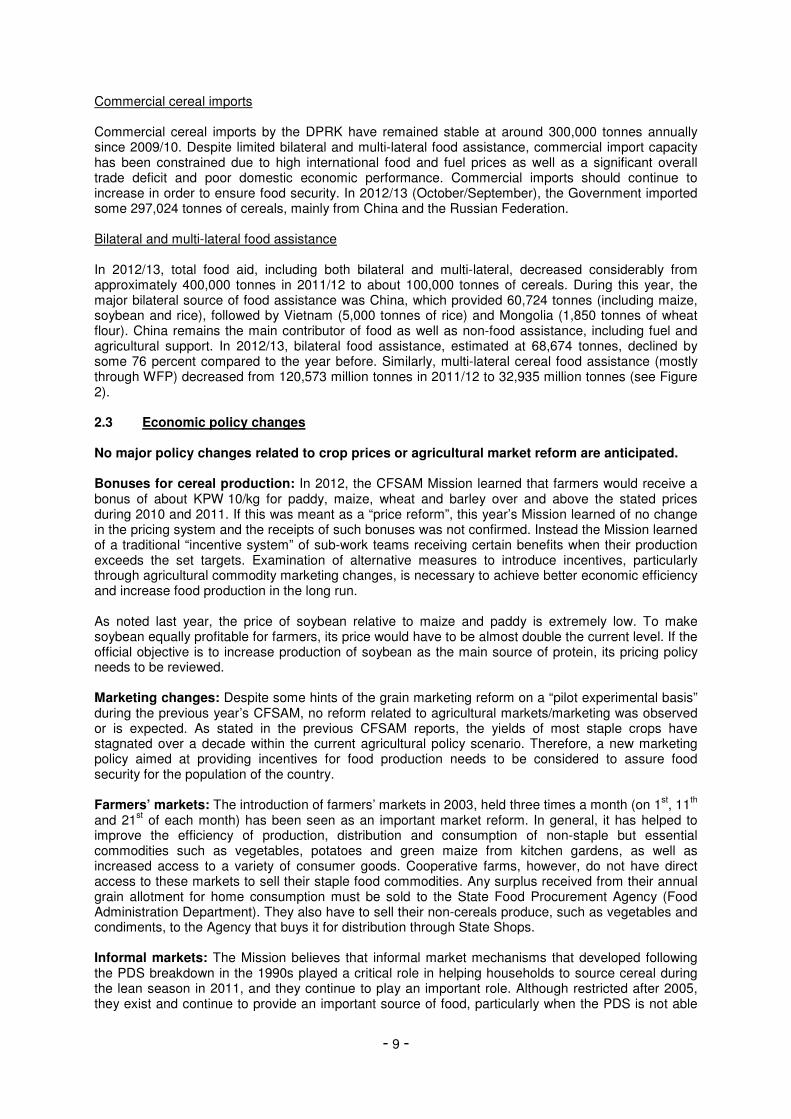
Commercial cereal imports Commercial cereal imports by the DPRK have remained stable at around 300,000 tonnes annually since 2009/10. Despite limited bilateral and multi-lateral food assistance, commercial import capacity has been constrained due to high international food and fuel prices as well as a significant overall trade deficit and poor domestic economic performance. Commercial imports should continue to increase in order to ensure food security. In 2012/13 (October/September), the Government imported some 297,024 tonnes of cereals, mainly from China and the Russian Federation. Bilateral and multi-lateral food assistance In 2012/13, total food aid, including both bilateral and multi-lateral, decreased considerably from approximately 400,000 tonnes in 2011/12 to about 100,000 tonnes of cereals. During this year, the major bilateral source of food assistance was China, which provided 60,724 tonnes (including maize, soybean and rice), followed by Vietnam (5,000 tonnes of rice) and Mongolia (1,850 tonnes of wheat flour). China remains the main contributor of food as well as non-food assistance, including fuel and agricultural support. In 2012/13, bilateral food assistance, estimated at 68,674 tonnes, declined by some 76 percent compared to the year before. Similarly, multi-lateral cereal food assistance (mostly through WFP) decreased from 120,573 million tonnes in 2011/12 to 32,935 million tonnes (see Figure 2). 2.3 Economic policy changes No major policy changes related to crop prices or agricultural market reform are anticipated. Bonuses for cereal production: In 2012, the CFSAM Mission learned that farmers would receive a bonus of about KPW 10/kg for paddy, maize, wheat and barley over and above the stated prices during 2010 and 2011. If this was meant as a “price reform”, this year’s Mission learned of no change in the pricing system and the receipts of such bonuses was not confirmed. Instead the Mission learned of a traditional “incentive system” of sub-work teams receiving certain benefits when their production exceeds the set targets. Examination of alternative measures to introduce incentives, particularly through agricultural commodity marketing changes, is necessary to achieve better economic efficiency and increase food production in the long run. As noted last year, the price of soybean relative to maize and paddy is extremely low. To make soybean equally profitable for farmers, its price would have to be almost double the current level. If the official objective is to increase production of soybean as the main source of protein, its pricing policy needs to be reviewed. Marketing changes: Despite some hints of the grain marketing reform on a “pilot experimental basis” during the previous year’s CFSAM, no reform related to agricultural markets/marketing was observed or is expected. As stated in the previous CFSAM reports, the yields of most staple crops have stagnated over a decade within the current agricultural policy scenario. Therefore, a new marketing policy aimed at providing incentives for food production needs to be considered to assure food security for the population of the country. Farmers’ markets: The introduction of farmers’ markets in 2003, held three times a month (on 1
st, 11
th
and 21st of each month) has been seen as an important market reform. In general, it has helped to
improve the efficiency of production, distribution and consumption of non-staple but essential commodities such as vegetables, potatoes and green maize from kitchen gardens, as well as increased access to a variety of consumer goods. Cooperative farms, however, do not have direct access to these markets to sell their staple food commodities. Any surplus received from their annual grain allotment for home consumption must be sold to the State Food Procurement Agency (Food Administration Department). They also have to sell their non-cereals produce, such as vegetables and condiments, to the Agency that buys it for distribution through State Shops. Informal markets: The Mission believes that informal market mechanisms that developed following the PDS breakdown in the 1990s played a critical role in helping households to source cereal during the lean season in 2011, and they continue to play an important role. Although restricted after 2005, they exist and continue to provide an important source of food, particularly when the PDS is not able

- 10 -
to supply cereal in sufficient quantity. However, as sale of cereals is officially prohibited, questions about this type of market activity usually do not receive direct answers. Households interviewed were uncomfortable describing exchanges of cereals and other agricultural commodities as gifts or barter. 2.4 Agricultural sector Agriculture in DPRK is the biggest contributor to gross domestic product (GDP) and a major employer for the population. However, its vulnerability to natural hazards, as well as the lack of meaningful reform in marketing and of technology, contributes to its erratic performance in recent years. Mechanization remains a primary challenge. Agriculture, including forestry and fisheries, is the biggest contributor to gross domestic product (GDP). However, its contribution to the national income has declined from about 30 percent in the early 2000s to some 21 percent in 2011. The performance of the sector has been erratic with negative growth rates in several recent years. Natural hazards such as dry spells, heavy rainfall, tidal surges, hailstorms, typhoons, and extremely cold winters have impacted agricultural prerformance with a varying degree of severity with consequent adverse impacts on food production, especially during 1996, 1997, 2000, 2007 and 2009 (see Figure 3). Although there has been a positive trend in cereal production since 2000, the current level of output (average of 2011-2013) remains well below the plateau of over 6 million tonnes achieved in the late 1980s through cooperation within the former Soviet Union trading arrangements. However, cereal production is estimated to increase for the third consecutive year in 2013 and exceed 5 million tonnes for the second year in a row since 1994. Despite this improvement, major challenges remain to reaching that potential level of food production recorded in the 1980s.
Figure 3. DPRK - Cereal production 1981-2012 (‘000 tonnes) 1/
1/ Total cereals include only cereals (i.e., this figure does not include potatoes and soybeans) Source: 1982 to 2009 FAOSTAT; 2010 to 2012 Ministry of Agriculture (MoA) and 2013 CFSAM
The precarious foreign exchange situation combined with international restrictons on trade has not allowed adequate commercial imports of much needed agricultural inputs such as fertilizer, pesticides, plastic sheeting, spare parts for machinery, tires for tractors and trucks and fuel. Over the years, domestic production of fertilizer has declined to a level of about 10 percent of total requirement, increasing dependence on imported fertilizer and reducing its overall use. Much needed lime application to improve fertility of acidic soils, although improved lately, is constrained by the lack of transport facilities and fuel availability. Yields of the main paddy crop used to be around 7 or 8 tonnes/hectare (t/ha) during the 1980s, but are now estimated to be about half that level due to a departure from sound agricultural techniques, lack of agricultural inputs and incentives. In order to increase total food production in the country, every possible piece of cultivable land, including plots with extremely high slopes in mountainous areas, are being brought into production under a temporary derogation of official policy. Although the Ministry of Land and Environmental

- 11 -
Protection (MOLEP) has introduced regulations for sloping lands and re-forestation, and has taken over some of the sloped lands (as the Mission learned this year), the rehabilitation and renewal progress has been slow. For now some of the MOLEP lands are turned over to the newly formed Land User Groups made up of under-employed factory workers. Cultivation of marginal lands has unintended consequences of soil erosion, increased risk of flood damage to more productive lowland, and further reduction in overall land productivity. Thus, productivity improvement is desperately needed. To improve nutrional stautus of the population, increase of leguminous crops especially in crop rotation system is vital. Mechanization on the farms perhaps represents the biggest challenge and biggest potential in DPRK. With the recent rehabilitation of old tractors and acquisition of some new tractors, the operational rate of farm tractors has improved and currently ranges from 68 to 75 percent by province, up from an average national figure of 57 percent in 2004. The major constraint, in addition to the old technology and low horse power machinery, seems to be the shortage of spare parts, tires and fuel. However, these improvements are in reference to a mechanization strategy established in the 1960s, and fundamental new strategies and technologies are also needed to meet the demands of agronomic advances in conservation agriculture and in order to effectively implement double cropping and intercropping. The agricultural marketing system is tightly controlled: all cereals, soybean, and potato output of the cooperative farms must be sold to the State. The net income of farmers varies widely depending on the surplus they can produce and the cost of inputs. Prices of farm inputs are also set by the State and remained more-or-less same this year as in 2010 and 2012. Likewise, the price of grains remained similar this year compared to recent years. Lack of access to farmers’ markets to sell produce over and above the allocated production quota remains a major limitation. A meaningful reform in the marketing system may provide necessary incentive to farmers to produce more on the cooperative farms as well as on their own small kitchen garden plots and may help alleviate critical shortage of staple food in the country. 3. FOOD CROP PRODUCTION IN 2013 3.1 Climate Low temperatures at the beginning of the agricultural season emphasised the need for plastic sheeting to ensure a timely start for the main cereal crops. The subsequent heavy rains and generally low levels of sunshine compromised maize and soybean productivity. Flooding of agricultural land remained localised. DPRK has a continental climate with a relatively short cropping season. Long winters bring bitterly cold and clear weather interspersed with snow storms as a result of northern and north-western winds that blow in from Siberia. The weather is particularly harsh and cold in the northern, mountainous regions. Summers tend to be short, hot, humid, and rainy as a result of the southern and south-eastern monsoon winds that bring moist air from the Pacific Ocean. On average, approximately 60 percent of all precipitation occurs between June and September. The distribution of the remaining 40 percent of precipitation is less reliable, and droughts are common in spring, winter and autumn. Typhoons affect the peninsula on average at least once every summer. Spring and autumn are transitional seasons marked by mild temperatures and variable winds.
Due to the cold temperatures, single cropping is practised in the north of the country. In the south, however, where winters are less severe and slightly shorter, double-cropping is possible (see Figure 4). The country’s relative shortage of arable land means there is pressure to exploit this potential wherever possible. For various reasons discussed below, the extent of double-cropping is limited.

- 12 -
Figure 4. DPRK Crop Calendar
Throughout DPRK, April 2013 was significantly cooler than April 2012, with an average monthly temperature of 2-4
oC lower than in the previous year. The difference in average monthly temperatures
between the two years became much less pronounced in May, and by June the average monthly temperature was similar to that of June 2012. The low temperatures at the beginning of the season tended to delay the planting of early crops, and emphasized the need for plastic sheeting to ensure a timely start for the main cereal crops. May and June were relatively dry in some parts of the country, requiring some re-seeding of maize. This period was then followed by the unusually early arrival of the heavy rains at the beginning of July (see Figure 5), with total rainfall amounts for July exceeding recorded maxima at several locations. The heavy rains also ended early, mostly in the first half of August, and many meteorological stations, especially in the south of the country, registered August rainfall amounts below the long-term monthly average. Nevertheless, the skies tended to remain cloudier than usual during August and September even in areas with reduced precipitation, which affected pollination rates for maize. The heavy rains did relatively little structural damage, and flooding of agricultural land was localised and not particularly serious. Maize productivity, and to an extent soybean productivity, was compromised by the heavy rains and by the generally low levels of sunshine throughout the season at the critical period of pollination. Paddy was relatively unaffected. Figure 5 shows the patterns of precipitation for the eight-month period January-August 2013 in DPRK’s four most agriculturally important provinces, compared with the average patterns of the five years (2006-2010). The charts clearly show the rainfall deficit in June, the significant surplus in July and, in North and South Hwanghae, the subsequent low values for August.

- 13 -
Figure 5. Precipitation (mm) in four selected provinces, 2013 compared to long-term average
Source: MoA figures based on multiple weather stations in each province
3.2 Area planted The area under main-season cereals, potatoes and soybeans this year decreased by 20,000 hectares compared to 2012. Some of the sloping land has been transferred to the Ministry of Land and Environmental Protection (MOLEP) for agroforestry purposes. DPRK’s total land area amounts to 122,543 km
2 (about 12.3 million hectares), of which an estimated
17 percent, or slightly more than 2 million hectares, is cultivated by cooperative farms. Of this, approximately 1.4 million hectares are considered suitable for cereal cultivation, 0.3 million hectares are under vegetable crops, some 160,000 hectares are under fruit orchards
2, and the balance is
industrial crops such as mulberry, cotton, tobacco and ginseng. In addition, about 0.4 million hectares are farmed by Government institutions on state farms. Many of these state farms are dedicated to such activities as livestock breeding and seed production. The CFSAM considers only the production from cooperative farms. As a result of the country’s mountainous terrain the scope for expanding the cultivable area is extremely limited. For this reason, emphasis has been placed recently on increasing production through double-cropping. However, because of the relatively short cropping season, the frequently prolonged and harsh winter, and the uncertainty of the spring weather, double-cropping often results in disappointing production despite significant investment in terms of seed, fuel and manpower (see section below on double-cropping).
2 The management of orchards, which used to be under the direct control of the cooperative farms, has largely been taken over by the National Fruit Agency in order to increase efficiency through economies of scale and enhanced access to new technologies.
- 14 -
The aggregate cooperative farm area under main-season cereals, potatoes and soybeans this year amounted to 1,245 million hectares, a reduction of about 20,000 ha or 1.57 percent from 2012 (Table 7). This follows a reduction of 0.2 percent in 2012 compared with 2011. The usual explanation for this quite substantial reduction is that some agricultural areas have been given over to industrial use or for new roads, but the Mission saw little evidence of this. However, some cooperative farms and some counties did report reduction in the area under their control with some of it being transferred to MOLEP for agroforestry purposes. Some of this transferred land is used by the Land User Groups, mainly consisting of idle factory workers, to produce raw material for their food processing factories. With regard to the winter and spring cereals to be harvested in 2014, a 4 percent increase in area is anticipated as a result of improved seed availability. In aggregate, the 2013/14 cropped area is estimated to be 2.005 million hectares, including 550,000 ha of sloping lands, 185,000 ha of early crops and 25,000 ha of kitechn gardens, which is 0.63 percent less than that of 2012/13. Paddy Paddy is the most important crop of DPRK in terms of both area cultivated and production, although total output of milled rice is second to that of maize given a 66 percent milling rate. Paddy is grown mainly in the central, south-western and south-eastern parts of the country collectively known as the “Cereal Bowl” (includes the lowland parts of North and South Pyongan, North and South Hwanghae, Pyongyang, Nampo and Kaesong) and on the narrow eastern coastal strip comprising parts of Kangwon, and North and South Hamgyong Provinces. Smaller areas are also cultivated in Chagang and Ryanggang provinces. Since the early 2000s, a large-scale realignment operation to improve the size and layout of paddy fields increased the overall paddy production area by about 60,000 hectares according to the Ministry of Agriculture. In 2013, the area under paddy was reported as 546,697 hectares, representing a reduction of almost 3 percent from the 563,237 hectares of 2012. This follows a reduction of 1 percent in 2012 from the year before. Maize Maize is more universally distributed than paddy and is normally grown under rainfed conditions. DPRK is the only country in the world to transplant maize on a large scale in order to accommodate double-cropping and to give the crop a good early start in what is a relatively short growing season. This year’s maize area of 527,317 hectares was 0.7 percent smaller than the approximately 531,000 hectares of last year. Potato Potatoes are grown as an early (spring) crop in the Cereal Bowl, and as a summer main crop in the cooler, northern highlands (Chagang and Ryanggang Provinces), where the growing season is short. As an early crop, potato is sown in March/April and harvested in June/July, while as a main crop it is sown in May/June following the winter and spring cereal harvest and harvested in September. In response to a national potato campaign inspired by the reduced productivity of the main cereals since the late 1990s and the relatively high carbohydrate yield per hectare of potatoes compared to almost any other crop, the area under potato has generally been increasing in the major agricultural areas over the past 15 years or so. After a major dip in this trend last year caused by shortages of seed potato and heavy storage losses in the preceding years, 2013 saw a significant recovery of 12 percent from approximately 26,000 to 29,143 hectares. Winter wheat, spring wheat and barley Winter wheat is sown from the end of October to mid-November, immediately after the harvesting of the main-season crops. Factors influencing the area under winter wheat include: autumn rainfall; seed availability; competition for access to limited farm power, fuel and labour in the autumn when other operations such as the harvesting of paddy are on-going; and the anticipated availability of labour, machinery and fuel during the short harvest window of seven to ten days in mid-June. Winter wheat and spring barley are produced in all provinces except Ryanggang and North Hamgyong. They were the main cereals in the Double-Cropping programme initiated in 1996 jointly by

- 15 -
FAO and UNDP as part of the Government framework for agricultural recovery. However, since then, the low survival rate of winter wheat during a series of severe winters and the frequently low yields in more normal years, have prompted farms to place increasing emphasis on early potatoes with consequent gradual reductions in the area under winter wheat. The total area under wheat and barley was 70,032 hectares in 2012/13, of which 72 percent was spring-sown. With slightly better availability of seed this year it is anticipated that 70,200 hectares will be sown in 2013/14. However, the negative considerations mentioned above are expected to limit any further expansion. Soybean Although the total area under soybean increased this year by 0.8 percent, a significant number of farms visited by the Mission reported having reduced their area under soybean in favour of an increased area under maize as result of expectations of higher profits. The purchase price of maize is KPW 20/kg while that of soybean is KPW 40/kg. Considering that maize yields are usually more than twice those of soybean, it makes sense for farms to grow maize in order to maximise income to sustain their operations. In addition, soybean seed rates are higher than those of maize and, whereas most soybean goes for industrial processing, maize can be directly consumed. However, given the importance of soybeans in crop rotations by helping to improve nitrogen levels in the soil and in providing dietary protein, any continuance of the downward trend in soybean area should be avoided. As was mentioned in last year’s CFSAM report, the pricing of soybean relative to maize needs careful re-examination. Other crops Other crops produced in DPRK include sorghum, millet, sweet potato, buckwheat, mulberry, vegetables (mainly cabbage, spinach, radish, cucumber, eggplant and tomato) and fruit (mainly pears, peaches, apricots, apples and persimmons). Much of the vegetable production is from home gardens while most fruit is produced either in farm orchards or in orchards managed by the National Fruit Agency. Other field crops (mainly sorghum, millet, sweet potato and buckwheat) are estimated to have been produced on just over 26,000 hectares in 2013, a reduction of 10 percent compared with last year. Home gardens and kitchen gardens Each cooperative-farm household is entitled to a private home garden of up to 30 pyong, which equates to about 100 m
2. A recent informal survey indicates that the size of a home garden can vary
considerably from household to household, but that the average size is close to the maximum stipulated 30 pyong. There are about 1.7 million farm households in the country, which translates to about 17,000 hectares of home gardens. In addition, a significant proportion of the 4.3 million urban households also have access to smaller home garden plots, typically between 5 and 10 pyong in size. Kitchen gardens belong to a different category and capture those that are allocated to institutions or factories for the production of food crops for their staff and workers. Their size may vary according to the size of the institution or factory. In the absence of more reliable quantitative data, it is assumed that the country’s total home-garden and kitchen-garden area may be about 25,000 hectares. Sloping land area It is difficult to estimate the area of sloping land (gradient > 15
o) used for crop production in DPRK. In
2008, MoLEP, using reports from its Forest Rangers, estimated that the area of deforested sloping land was between 300,000 and 350,000 hectares. A more reliable estimate, however, may be that of a 2012 study carried out by the EU’s Joint Research Centre (JRC)
3. Using photo-interpretation of points
on a digital elevation model superimposed on Google Earth imagery and Bing maps, the JRC
3 ‘Assessment of cropland area on sloping land in DPRK’ (JRC IES/H04/F/HKE/hke
D(2012)(15113)).

- 16 -
concluded that approximately 550,000 hectares of sloping land of gradient > 15o is likely to be under
cultivation. This figure has been accepted by the CFSAM and was used in last year’s report. 3.3 Means of production and inputs The quantity of agricultural inputs provided to farms this year was similar to 2012. However, some farms reported late delivery of urea, possibly due to poor road conditions and to late availability from the Namhung Fertilizer Plant in South Pyongan. Planting material and plastic sheeting The provision of main-crop cereal seed was generally adequate this year, especially in provinces of high crop productivity. New cereal varieties that are deemed especially suitable to specific agro-ecological zones of the country are regularly released by the National Academy of Agricultural Sciences. Improved breeder seed is then multiplied up by specialized cooperatives and state seed farms which then provide certified seed on credit to cooperative farms through the Government’s distribution system. Potato seed, however, was less readily available this year, which was unfortunate as 2013 was a good year for potato productivity. New potato planting material in DPRK starts as high-quality virus-free tissue-cultured mini-tubers in the national potato seed centre in Ryanggang, a state-of-the-art facility that has been supported by the International Fund for Agricultural Development (IFAD) and SDC. As with the cereal breeder seed, the mini-tubers are distributed to specialized seed farms where they are multiplied up to produce high-grade seed for cooperative farms. In the normal course of events, however, farms use their own produce as planting material for the next season. This necessitates storage through the winter which often results in considerable loss from freezing and rotting. If the resulting supply of seed potato is inadequate for the farm’s requirement, the seed potatoes will be divided into several pieces that are often too small to produce a good yield. Paddy is typically sown in nurseries under plastic sheeting at the beginning of April and transplanted in late May or early June. The cold weather of April this year emphasized the need for adequate plastic sheeting to allow farms to get their cereal crops started as early as possible. The adequacy of plastic sheeting supplies (which can be used for at least two, and possibly three, years) was commonly reported as being between 30 and 80 percent, with a few farms reporting 100 percent. Perhaps justifiably, farms in the most productive areas appeared to have been most adequately supplied. Much of the country’s plastic sheeting is provided by FAO in cooperation with the MoA. Fertilizers, manure and lime While the supply of nitrogenous fertilizer (imported ammonium sulphate and locally produced urea) was similar to that of last year, the supply of phosphate was down slightly from last year’s 21,000 tonnes of superphosphate, the highest in recent years (see Table 2). On the other hand, the supply of potash, at less than 3,000 tonnes of muriate of potash, was the lowest in several years. Overall fertilizer supply (N, P and K) was therefore lower than in both of the previous two years. Adequacy of nitrogenous fertilizer supply was commonly reported by farms and counties as being between 50 and 90 percent, with farms in some of the more productive areas receiving more than 100 percent..

- 17 -
Table 2. DPRK - Fertilizer statistics for 2008-2012 (tonnes)
Year (August to
July)
Application Domestic production
Import/ Assistance
Stocks Remaining stocks
N (ammonium sulphate equivalent, approx. 20.5% N)
2013 686,015
2012 686,517 202,931 483,586 3,000 3,000
2011 735,943 189,335 548,108 1,500 3,000
2010 475,100 174,350 299,250 3,000 1,500
2009 434,807 170,090 266,817 900 3,000
2008 438,457 256,800 181,157 1,400 900
P (superphosphate equivalent, approx. 17% P2O5)
2013 18,396
2012 21,460 21,460
2011 5,545 5,545
2010 11,402 11,402
2009 2,776 2,776
2008 7,425 7,425
K (KCl-muriate of potash, 48-62% K2O)
2013 ,788
2012 18,650 18,650
2011 4,477 4,477
2010 12,314 12,314
2009 8,400 8,400
2008 10,415 10,415
Total (N+P+K)
2013 707,199
2012 726,627
2011 745,965
2010 498,816
2009 445,983
2008 456,297
Source: Ministry of Agriculture (MoA)
Table 3 shows South Hwanghae’s provincial supply exceeding 100 percent of its planned amount and the provincial supplies for North and South Pyongan and North Hwanghae all greater than 90 percent. Several farms in North and South Hwanghae, Kangwon and South Hamgyong provinces reported late delivery of urea which is used as a top-dressing for paddy and maize – urea should be delivered by 20 June, but some deliveries were as late as 20 July. The common practice of applying lime at a rate of between 500 and 1,000 kg per hectare every 3 years is important as it counteracts the tendency to acidity of most of DPRK’s soils. However, high application rates of ammonium sulphate as fertilizer can exacerbate the tendency to acidity. Several farms in DPRK have soils in the pH range of 4.5 to 5.5. Under such conditions several nutrients, most notably phosphate, become unavailable to crops. Many farms also report further increases in the application of organic fertilizer, some achieving the target of 20 tonnes per hectare. The use of organic fertilizer also reduces acidity and improves soil texture.

- 18 -
Table 3. Supply of nitrogenous fertilizers to provinces, 2013
Province Planned Supplied Supplied/Planned
(tonnes) (tonnes) (%)
Pyongyang 32,942 21,086 64
S Pyongan 80,174 72,981 91
N Pyongan 138,289 134,748 97
Chagang 31,664 23,924 76
S Hwanghae 167,872 173,569 103
N Hwanghae 80,743 72,377 90
Kangwon 41,879 30,113 72
S Hamgyong 77,219 66,631 86
N Hamgyong 54,747 44,754 82
Ryanggang 30,275 22,208 73
Nampo 32,826 23,624 72
Total 768,630 686,015 89
Source: MoA
The contents of organic manure and their proportions vary from location to location depending on what is readily available, but they normally include a well-rotted mix of crop residues, used straw and animal and human waste. A bio-active ingredient developed by the National Academy of Agricultural Science and containing amino acids derived from the breakdown of animal hair and fur, may also be added. Crop pest and disease control There were no significant outbreaks of crop pests or diseases this year, apart from a slight increase in maize root problems (fungal and unidentified insect pests) resulting from the heavy rains in July and early August. Some localised armyworm attacks were reported, but these were effectively controlled using deltamethrin provided by the county authorities. Sheath blight, bacterial leaf blight and smut occurred in paddy and fusarium wilt in maize, although both at sub-critical levels. The presence of rice water weevil was frequently cited, and stemborers were present in both paddy and maize, but at low levels. The overall availability of crop-protection materials in 2013 was slightly lower than that of last year. Similar to last year, 1,193 tonnes of herbicide comprising of ten different commercial preparations were used this year, but it was not clear how much was used on cooperative farms and how much on state farms. The significant increase in supply in Ryanggang may possibly be attributed to the expansion of the area under potatoes. Integrated Pest Management (IPM) continues to be widely used as a cheaper and more environmentally friendly means of control than the application of commercial formulations. Approaches include, among others, light traps, pheromone traps and the use of nicotine and solanin extracted from tobacco and potato leaves respectively.

- 19 -
Table 4. Supply of herbicide by province in 2013 compared with 2012 (tonnes)
Province 2013 2012 % change
Pyongyang 22 21 6
S Pyongan 106 116 -9
N Pyongan 205 257 -20
Chagang 56 61 -9
S Hwanghae 247 310 -20
N Hwanghae 127 131 -3
Kangwon 64 68 -6
S Hamgyong 120 115 5
N Hamgyong 114 88 30
Ryanggang 95 12 688
Nampo 37 39 -4
DPRK 1,193 1,218 -2 Source: MoA
Farm power Farm power, in the form of machinery and fuel, is the most frequently cited constraint to increased crop production in DPRK. Farm managers complain that the ubiquitous 28-horse-power Chollima is not sufficiently powerful to plough to the required depth, that it is too slow for the amount of land preparation that needs to be completed in a short space of time, and that the numbers of tractors are simply inadequate. This and the limited supply of diesel meant that for many farms, especially those located outside the Rice Bowl, mechanized land preparation could only be carried out on about 60 percent of their arable area, with the remaining land being prepared by oxen. Inadequate farm power is also a major obstacle to expansion of the area under winter wheat. The number of tractors in DPRK is reported to have risen by 2 percent compared with 2012 (Table 5) while the operational rate nationally has risen by 1.4 percent. While most farms depend solely on the standard 28-horse power Chollimas for their mechanization, some farms, especially those in the more productive provinces, have received higher-power tractors over the last 10 years or so from various donors including the EU. These tractors have often raised productivity on the recipient farms, but maintenance and access to spare parts remains problematic. There has also been in increase in the number of donated mono-axle tractors in recent years, which are especially well-suited to the transport of materials to the field and for the cultivation of small or irregularly shaped fields that are awkward for larger tractors. The amount of diesel used this year was only marginally higher than last year (Table 5). Farms generally reported timely delivery meaning that theoretically farm operations could be carried out on time. However, given the limitations cited above, this was rarely the case. By the time it is received by the cooperative farms, diesel has usually gone through several containers - bulk storage at the national, provincial and county levels, and barrel transport to the farm - with the result that it picks up contaminants en route. Although this is not too serious for the highly tolerant Chollima engines, it can be extremely damaging to the engines of the higher-powered and more sophisticated tractors. The Government has recently acknowledged this problem and recognises that if the use of higher-powered tractors is to become more widespread it must go hand-in-hand with the provision of cleaner fuel. It is also generally accepted that if farm mechanization is to be increased, a clear policy needs to be formulated with regard to the types of tractor to be used and that access to essential spare parts must be assured.

- 20 -
Table 5. Tractor numbers and fuel consumption in 2013 compared with 2012
Province 2013 2012 % change, 2012 to 2013
Number
% op Number
% op Numbers % op
Tractors Pyongyang 2,845 73 2,712 72 5 1
South Pyongan 7,234 73 7,795 71 -7 3
North Pyongan 8,618 74 8,350 72 3 3
Chagang 1,787 74 1,737 72 3 3
South Hwanghae
12,328 72 11,863 73 4 -1
North Hwanghae
7,245 73 7,030 70 3 4
Kangwon 3,495 70 3,336 68 5 3
South Hamgyong
6,098 72 5,951 70 2 3
North Hamgyong
4,191 73 3,993 73 5 0
Ryanggang 2,256 72 2,169 73 4 -1
Nampo City 2,913 72 2,690 70 8 3
Total 59,010 73 57,626 72 2 1.4
Fuel Type 2013 2012 % change, 2012 to 2013
Diesel 64,425 64,480 0
Petrol 7,000 7,210 -3
Total 71,425 71,690 - <1 Source: MoA
Irrigation The major realignment of irrigation canals that was implemented in the early 2000s and the resulting increase in gravity-fed systems has ensured more reliable and efficient irrigation of paddy fields. This in turn has released electricity to pump water to the few remaining canals that still depend on electrically powered pumping stations. Most farms, however, still face difficulties when pumping and piping of irrigation water is required. The pumps are old and less efficient than they used to be, electricity supply can be erratic and most pipes need to be replaced, the complaint most voiced this year. However, the heavy rains of July and early August 2013 meant that irrigation was less critical during that period and there was more than adequate water in the reservoirs, as is shown in Table 6.
Table 6. Volume of water in irrigation reservoirs, 2012 and 2013 (10 000 m3)
Year Target Actual
2012 357,400 374,560
2013 357,400 364,400 Source: MoA
3.4 Crop yields and production The main-season cooperative farm crop production has increased by 4.7 percent to an estimated 5.3 million tonnes. Although the overall crop area declined by 1.6 percent, increased yields of 5.8 percent compensated for this. Paddy production increased by 10.5 percent, but maize and soybean production was down by 1.9 percent and 2.8 percent, respectively. Area, yield and production figures for 2013/14 are presented in Tables 7 and 8 below. They are based primarily on the MoA’s figures, with adjustments made according to the Mission’s observations in the field and following discussions with county officials and farm management staff. As a matter of course, cooperative farms carry out yield estimates by cutting a small sample area of 1 pyong (just over 3 m
2)
in each field prior to harvest. Yield is then estimated by extrapolation of the weight of grain from the sample, with adjustment being made to take account of the grain moisture content. In order to ensure unbiased reporting, three observers are involved in this activity - the cooperative farm manager, a county PDS representative, and a CFMC representative. The Mission was able to carry out its own

- 21 -
crop-cutting sampling on a number of farms with the assistance of farm staff using their standard methodology; the results obtained were generally very close to the yield estimates reported by the farms. Main-season crop production in 2013, estimated at 5.265 million tonnes, is about 5 percent higher than that of 2012. Although the overall area saw a reduction of nearly 2 percent, this was more than compensated for by an average yield increase of 6 percent. This year’s 5 percent increase in production follows last year’s approximately 6 percent production increase compared with 2011/12. The forecast for the winter and early crops of 2013/14 is estimated to increase by approximately 6 percent compared with 2012/13, due principally to an improved availability of seeds. Overall, taking into account the main-season crops, winter and early crops, and production from sloping land and gardens, aggregate production is expected to reach 5.981 million tonnes (in cereal equivalent and paddy terms). This represents an increase of about 5 percent compared with 2012/13 (Table 7). Paddy Average paddy yield this year, at 5.3 t/ha, showed an 11 percent increase on that of last year, which itself was an increase of 11 percent over that of 2011. Even with the 3 percent reduction in the area under paddy this year, production was up by 8 percent on last year’s figure, from 2,681 million tonnes to 2,901 million tonnes. Increased yield and production were mainly attributed to the generally favourable weather conditions of early heavy rains followed by good drying and ripening weather. Maize Unlike paddy, maize was compromised this year by the heavy early rains. In particular, pollination was adversely affected and yields were lower as a result of the fewer number of sunshine hours. Consequently the average yield of maize, at 3.79 t/ha, was marginally lower than last year’s 3.84 t/ha when the crop was hit by a prolonged dry spell. Production stands at 2 million tonnes, which represents a reduction of 2 percent compared with last year’s 2.04 million tonnes. Soybeans Soybean production was down a massive 31 percent last year compared with 2011. This year saw a further reduction of 3 percent, a production decline attributed to a 6 percent reduction in yield. As with maize, yield was adversely affected by the early heavy rains at the time of pollination. Other cereals and sweet potato The area under other cereals and sweet potato fell by more than 10 percent this year compared with 2012. However, yields were significantly higher as a result of this year’s better rainfall, and production is estimated to be up by 12 percent. Early crops expectations for 2014, and the Double Cropping Programme The area under potatoes for the early 2014 crop is expected to be slightly larger than in 2013 following this year’s good harvest. Potato production in early 2013, in cereal equivalent, was 296,000 tonnes with a yield of 2.7 t/ha, output likely to lead to slightly better seed potato availability this year. As a result, it would be reasonable to expect cereal-equivalent yeilds to improve to 2.8 t/ha with total output of 316,000 tonnes in 2013/14, barring any adverse events such as a dry spell during the spring and early summer of 2014. This output would comfortably exceed the usual national target of 300,000 tonnes. Wheat and barley production (winter and spring) in 2012/13 was constrained by a shortage of seed. Besides this constraint, there still seems to be a tendency for farms to limit the area planted under these cereals. Farmers’ reluctance to increase the area is based on the low yields achieved, the lower per unit price offered by the State Procument Authority, and the logistical difficulties, discussed below, of fitting the crop into a tight farm schedule where it may compromise essential operations for the higher-yielding main-season crops. However, assuming a move towards the long term average, a marginal increase in production of 2 percent is expected for 2013/14 compared with the previous year.

- 22 -
Double-cropping in DPRK is difficult to successfully achieve if the weather is not conducive or if farm inputs are insufficient. Seed is apparently not a problem this year, but farm power and diesel are (although not to any greater extent than in previous years), and weather conditions, as always, remain unpredictable. Figure 6 (below) illustrates the the trend of wheat and barley production (both winter and spring) in DPRK over the last two decades. Although wheat and barley production is still encouraged as a means of maximizing agricultural productivity throughout the year, it is clear that the area under these crops has shown a steady decline since its peak in the early 2000s. Yields, as may be expected, have fluctuated between just over 0.5 and almost 2.5 tonnes per hectare according to weather conditions, but production over the last several years has shown a marked downward trend.
Figure 6. Wheat and barley production in DPRK, 1990 - 2013
Source: FAOSTAT and MoA
Crop production in home and kitchen gardens Though limited in size, home gardens can be highly productive, carrying both crops and livestock such as rabbits, pigs, goats and poultry. Supplied as young stock by the cooperative farm to farm households, these crops contribute significantly to household nutrition and income. A typical pattern of cultivation in home gardens is an early crop of potatoes and green maize, followed by vegetables such as cabbage, peppers, radishes and garlic. It is reasonable to assume yields of 6 t/ha for maize and potatoes (cereal equivalent) since with close proximity to the house they can be tended with great care. Such production on half of the estimated national home garden area would result in an extra 75,000 tonnes of cereal equivalent. In the absence of firm data, kitchen gardens (which are allocated to institutions and factories) are included in this production estimate.

- 23 -
Table 7. DPRK - Main-season crop area, yield and production of grains and potatoes in 2013; farm production only
Province
Paddy Maize Potato
Soybeans Other cereals Total (cereal equvalent) 1/
Area Yield Prod Area Yield Prod Area Yield Prod Area Yield Prod Area Yield Prod Area Yield Prod
‘000 ha
t/ha ‘000 t
‘000 ha
t/ha ‘000 t
‘000 ha
t/ha ‘000 t
‘000 ha
t/ha ‘000 t
‘000 ha
t/ha ‘000 t
‘000 ha
t/ha ‘000 t
Pyongyang 12 6.3 76 4 4.6 16 0.01 3.5 0.03 0 1.5 1 0 2.9 1 16 5.8 93
S Pyongan 82 6.2 514 65 3.5 225 0.3 2.0 0.6 14 1.2 17 3 2.1 7 165 4.6 764
N Pyongan 101 5.8 586 80 4.0 322 0.04 5.5 0.2 22 1.6 36 4 2.9 11 208 4.6 956
Chagang 7 3.7 25 34 3.1 104 1.9 2.6 4.9 8 1.4 12 1 1.5 1 52 2.9 148
S Hwanghae 145 5.2 757 96 4.3 419 0.1 4.3 0.2 13 1.6 21 4 3.9 17 259 4.7 1214
N Hwanghae 57 4.6 262 83 4.1 342 0.7 2.5 1.7 14 1.4 19 7 2.5 18 162 4.0 642
Kangwon 29 4.1 117 38 3.2 119 0 … 0 7 1.8 13 1 2.1 1 74 3.4 250
S Hamgyong
59 4.6 271 49 3.8 185 4.9 5.0 25 13 1.1 14 2 2.6 6 128 3.9 501
N Hamgyong
27 3.9 104 60 3.0 180 3.2 5.5 17 14 1.2 18 2 0.9 2 106 3.0 322
Ryanggang 1 2.7 4 9 4.0 35 18 4.7 85 7 1.2 9 0 1.1 0 36 3.7 134
Nampo City 27 6.9 184 10 5.5 54 0.01 4.4 0.04 2 2.1 5 0 1.5 0 39 6.2 244
DPRK total 547 5.3 2901 527 3.8 2002 29 4.6 135 116 1.4 163 26 2.5 66 1245 4.2 5267
1/ Potatoes in cereal equivalent at 25 percent conversion rate; Source: MoA
Table 8. DPRK - Comparison between 2013/14 and 2012/13 national aggregate production of food crops in cereal equivalent. (Early-crop figures revised)
2013/14 2012/13 1/ Change
Area Yield Prod Area Yield Prod Area Yield Prod
‘000 ha t/ha ‘000 t ‘000 ha t/ha ‘000 t % % %
MAIN SEASON, Farm (total) 1254 4.2 5267 1265 4.0 5031 -1.6 5.8 4.7
Paddy 547 5.3 2901 583 4.8 2681 -2.9 10.5 8.2
Maize 527 3.8 2002 531 3.8 2040 -0.7 -1.1 -1.9
Other Cereals 26 2.5 66 29 2.0 59 -10.2 26.2 11.5
Potatoes 29 4.6 135 26 3.2 84 12.1 44.8 60.8
Soybeans 116 1.4 163 115 1.5 168 0.8 -6.0 -2.8
EARLY SEASON (winter and spring), Farm (Total)
185 2.3 422 178 2.2 399 4.0 1.5 5.7
Wheat and barley 2/ 70 1.5 105.3 70 1.5 103 0.3 1.6 2.2
Potatoes 115 2.8 316 108 2.7 296 6.5 0.3 6.8
NATIONAL, Farm (Total) 1430 4.0 5689 1443 3.8 5430 -0.9 5.7 4.8
Sloping land (maize) 550 0.4 220 550 0.4 220 0.0 0.0 0.0
Household gardens (2/3 potatoes, 1/3 maize)
25 3.0 75 25 3.0 75 0.0 0.0 0.0
TOTAL (including sloping lands and gardens)
2005 3.0 5984 2018 2.8 5725 -0.6 5.2 4.5
1/ Revised 2012/13 figures based on the actual official estimates for the early season crops 2/ Includes a small amount of main crop wheat and barley grown mainly in North and South Hamgyong, and Ryanggang
Source: MoA and CFSAM
Crop production on sloping land Much of DPRK’s sloping land has been cultivated for decades by individuals, groups and also by cooperative farms. This year’s Mission learnt that some sloping land that had been previously cultivated by cooperative farms in some provinces has recently been transferred back to MOLEP and is cultivated by defined groups of workers from factories or institutions, called Land User Groups. However, the Government’s policy of re-forestation through MOLEP still applies and, where possible, efforts are being made to incorporate crop production with tree planting, with the aim of ceasing crop production as soon as the trees are well established. Estimation of the amount of crop produced on sloping land in DPRK is difficult as little is known of either the extent of the cultivated area, its cropping pattern, or its level of productivity. However, many factors conspire to suggest very low yield expectations on sloping land. Most sloping-land soils can be assumed to be shallow, of low fertility and subject to accelerated erosion. Because of low yield expectations, seed may be of poor quality. In addition, since plots are usually distant from dwellings and cultivators are not necessarily from agricultural backgrounds, crop husbandry may be expected to be relatively poor.

- 24 -
A general yield figure of 0.4 tonnes per hectare of cultivated sloping land was adopted by last year’s CFSAM following discussions with the MoA, and this has been retained in the present report. This yield figure has been selected to represent all the food crops grown on sloping land, such as maize, sorghum and sweet potato (the latter in cereal equivalent). The estimated area of 550,000 hectares, which was also used in last year’s report, is based largely on the studies mentioned above that were carried out by the EC’s Joint Research Centre (JRC) in 2012. 3.5 Livestock The trend of decline in the number of grain-feeding livestock and increase in the number of grass-feeding livestock has continued. In recent years there has been a policy to reduce the number of granivores (grain-feeding livestock) and increase the number of herbivores (grass-feeding livestock). The results of this policy are now becoming evident with a 21 percent decline in the number of pigs since last year, and a 3 percent decline in the number of chickens, while among the herbivores there has been an 8 percent increase in the number of rabbits. Numbers of draught cattle and sheep have remained fairly static over the last five years, while goat numbers have shown only a relatively small increase over the same period. The number of cows (9,000) has been included this year for the first time. The stated policy in the country has been to emphasize small ruminants at the expense of larger and other grain-eating animals. Judging from the official livestock numbers this trend is evident since 2004 (see Figure 7).
Table 9. DPRK - Livestock population, 1996-2013 (‘000 heads)
1996 2000 2004 2008 2012 2013
% change to 2013 from
1996 2008 2012
Draught cattle 615 579 566 576 576 576 -6 0 0
Sheep 248 185 171 167 168 168 -32 1 0
Goats 712 2,276 2,736 3,441 3,689 3,682 417 7 0
Rabbits 3,056 1,475 19,677 26,467 2,9120 31,480 930 19 8
Pigs 2,674 3,120 3,194 2,178 2,857 2,265 -15 4 -21
Chickens 8,871 14,844 18,729 14,071 16,847 15,309 73 9 -9
Ducks 1,098 2,078 5,189 5,878 5,468 6,012 448 2 10
Geese 554 889 1,580 1,477 1,584 1,880 239 27 19
Source: MoA
Livestock health is good, although the perennial problem of a shortage of fodder for oxen at the critical time in spring when most work is required of them remains. Several counties have reported an improvement in veterinary service. It is understood that oxen may enter the human food chain at the end of their productive life as draught animals at the age of about 13 years. Elderly oxen are examined by a veterinarian to confirm that they are disease-free; if they are, they are slaughtered for meat.

- 25 -
Figure 7. DPRK – Index of grass-eating (solid lines) and grain-eating (dashed lines) animals, 1996-2013 (1996=100) 1/
1/ The Index reflects the percent increase each year for each animal type since 1996
Source: MoA
4. FOOD SUPPLY/DEMAND BALANCE 2013/14 A national food supply/demand balance sheet, including cereals, milled rice and cereal equivalent of potatoes and soybeans, for the 2013/14 marketing year (November/October), is presented in Table 10. In preparing the balance sheet, the following assumptions were made: a. According to the Government, the total national population at the end of December 2012 was
24,622,000 (including 700,000 special-entity personnel). The Department of Statistics now uses an annual population rate of growth of 0.5 percent (adjusted downwards from last year’s 0.6 percent). Using this information, for the purpose of this report, the Mission estimates the population for November 2013 to October 2014 at 24.797 million.
b. As with past CFSAM reports, the annual per capita consumption of 174 kg of basic food commodities covering cereals, potatoes and soybeans is assumed. Although the total remains the same this year, the individual items are adjusted somewhat to match with the estimated availability during this marketing year and to maintain zero balance of non-traded commodities such as potatoes and other cereals. Specific food requirements used are: 150.2 kg of cereals (including 64 kg of milled rice, 77.2 kg of maize, 6.75 kg of wheat and barley and 2.25 kg of other cereals), 13.8 kg of potatoes in cereal equivalent, and 10 kg of soybeans. Slightly more rice and slightly less maize are included in the anticipated diet to reflect changes in the crop production this year compared to 2012. The estimated per capita food requirement of 174 kg is slightly higher than the apparent national consumption average of the previous five years, but is also considerably below the Government’s target weighted average consumption rate of 213 kg (milled) per person per year. The Mission’s assumed level of consumption on average represents about 1,640 kcal. The remaining energy and other nutrients required are assumed to be derived from the limited quantities of available fish, poultry, meat, sweet potatoes, vegetables, fruits, and wild foods.
c. Given that soybean is the principal source of protein in DPRK, this crop has been added to the
food balance sheet in the CFSAM report since 2010. On average the calorie content of soybean is

- 26 -
about 20 percent higher than that of cereals4, hence the production is multiplied by 1.2 to express
the availability in cereal equivalent terms.
d. Normal-year seed requirement of 209,000 tonnes is estimated, based on the seed rates used in DPRK, allowing for some multiple planting/sowing and the intended area to be sown next year.
e. Post-harvest losses, as in previous CFSAM reports, have been assumed as follows: 15 percent for rice, maize and potatoes; 10 percent for wheat, barley and other cereals; and 5 percent for soybeans. Lower losses for winter/spring grains are used because of the shorter duration of storage. The level of post-harvest crop losses in DPRK has been a contentious issue in recent years, with estimates ranging from 3 percent to more than 30 percent. Unfortunately, no systematic investigation has been undertaken. As stated in previous reports, the Mission recommends that a study be carried out to quantify losses at each vulnerable stage in order to estimate the extent of post-harvest losses.
f. The Ministry of Agriculture has historically estimated animal feed requirement at about 120,000-
150,000 tonnes but reduced this to 75,000 tonnes in 2011/12 due to a shortage of staple grains. Although there has been a reduction in the number of pigs over the last twelve months, the Mission considers that the good harvest this year will once again allow 120,000 tonnes of feed grain and feed-grain equivalent (100,000 tonnes of maize and 20,000 tonnes of potatoes) to be used as feed.
g. Although reportedly there has been some investment in milling machinery, until clear evidence on
the ground is collected, a paddy-to-rice milling ratio of 66 percent is used in order to be consistent with other Southeast Asian countries in the region. No other grains are converted to milled form as the food and non-food requirements are expressed in the whole-grain form.
Table 10. Food balance sheet for marketing year, November 2013-October 2014 (‘000 tonnes)
Rice (Milled)
1/
Maize Wheat/ Barley
Other Cereals
Potatoes 2/
Soybeans 3/
Total
DOMESTIC AVAILABILITY 1,915 2,247 105 66 501 196 5,030
Main-season production 1,915 2,002 66 135 196 4,313
Winter/spring production 105.3 316 422
Production on slopes 220 220
Production from gardens 25 50 75
TOTAL UTILIZATION 1,930 2,413 194 65 501 266 5,370
Food use 1,587 1,914 167 56 342 248 4,315
Feed use 100 20 120
Seed requirement 56 62 16 3 64 8 209
Post-harvest losses 287 337 11 7 75 10 726
Stock build-up 0 0 0 0 0 0 0
IMPORT REQUIREMENTS 16 166 89 0 0 70 340
Anticipated commercial Imports
300
Uncovered deficit 40
Note: Figures may not add up exactly due to rounding 1/ Paddy-to-rice milling rate of 66 percent; this is the same as was used in previous CFSAM reports and is in line with the FAO’s milling rate for the majority of Asian countries 2/ Including potatoes in cereal equivalent at 25 percent conversion rate, based on the calorie content 3/ Soybeans cereal equivalent using a factor of 1.2
The total cereal import requirement in 2013/14 is estimated at 340,000 tonnes of which 300,000 tonnes of cereals are expected to be imported commercially by the Government.
4 Calorie content of soybeans varies from 335 kcal to 470 kcal per 100 g depending on the oil content of the
beans.

- 27 -
5. HOUSEHOLD FOOD SECURITY AND VULNERABILITY ANALYSIS
5.1 Household Food Consumption
Dietary quantity and quality Despite a slight increase in cereal production this year, food consumption at the household level remains limited in quantity and quality. In particular, consumption of proteins (animal and soya) is infrequent and inadequate. The continuing decrease in soya production has compounded this problem. Food consumption at the household level remains limited in both quantity and quality. Generally, meals consist of staple grains (boiled rice, maize, noodle, or porridge) accompanied by
vegetables (especially kimchi, 김치) and vegetable soup (e.g.
with cabbage or potato). The vast majority of the kilocalories in the diet are provided by the staple grains. Similar to the findings from last year’s CFSAM, a typical household consumes about 350 grams of cereals per person per day. In households dependent on the public distribution system (PDS) for their cereals, the average consumption this year tends to be smaller, at 310 grams of cereals per person per day, providing approximately 1,250 kilocalories. If calories from daily vegetable and oil consumption are included, the calorie gap between the average DPRK diet and the international recommendation of 2,100 kcal per day is estimated at 30 percent, similar to that identified in last year’s CFSAM. The cereal quantity actually consumed at by PDS households (310 grams per person per day) falls short of the average reported PDS ration of 390 grams per person per day fixed for the month of October but comes close to the average reported PDS ration of 310 grams for September (See Section on Public Distribution System). In farming households, the average daily cereal consumption is higher than in PDS dependent households at 400 grams per person per day, but still falls substantially short of the daily recommended requirement. Dietary diversity at the household level is poor. Out of 8 food groups for which data were collected, most households only consume items from 3 to 4 food groups on a daily basis – namely, cereals, vegetables (kimchi), and oils, complemented with condiments (bean paste and soy sauce).
5
The consumption of soybeans, an important source of vegetable protein, has continued to decline as a result of the on-going reduction in soybean cultivation across the country. The protein gap in a typical DPRK diet is relatively high even with soybeans (22 percent), but increases to 26 percent when soybeans are removed from the diet (Figure 8). Fats and oil, although consumed on a regular basis, continue to be consumed in very small quantities of about half a tablespoon per person per day. The gap in oil and fats consumption and daily recommended intake is about 30 percent (CFSAM 2012). Meat consumption is rare and generally restricted to national holidays when it is made available as a special allotment through the state distribution system. For the majority of households, the last day on
which meat was consumed was the 19th of September 2013 in celebration of chusok (추석), a harvest
festival.
5 The 8 food groups include: cereals, vegetables, pulses, fruits, meat/fish/eggs, dairy products, oil & fats and
sugar.
Figure 8. Protein gap with and without soybeans
Source: 2013 CFSAM

- 28 -
Eggs were reportedly consumed more frequently – about once a week – while dairy products were largely absent from the typical DPRK household diet. Households near the sea or rivers or those with access to fish ponds may occasionally enjoy fish in small quantities. The consumption of fruits depends on the season but is infrequent and limited to on average once a week. Adequacy of the diet Data indicates that only 16 percent of households in the DRPK have acceptable food consumption. Diet adequacy as measured by the food consumption score is comparable to last year’s. By giving weights to each food item consumed and considering the frequency of consumption within a period of 7 days, the Food Consumption Score (FCS) can be calculated.
6 Using the thresholds for
DPRK, households can be classified into three food consumption groups: acceptable (FCS > 42), borderline (28 < FCS < 42) and poor (FCS <28). By supplementing data collected during the CFSAM with WFP monitoring data, the picture of household food consumption that emerges for 2013 is that 25 percent of households have acceptable food consumption, 45 percent have borderline food consumption and 30 percent have poor food consumption.
7 CFSAM data
alone (n=77) indicates that only 16 percent of households had acceptable food consumption, while half had borderline and one-third had poor food consumption. As seen in previous years, PDS dependent households continue to have worse food consumption patterns than cooperative farmer households (Figure 9). The average food consumption score for the total sample (n=375) in 2013 was slightly, but not significantly, lower than last year and still higher than that of 2011 (Figure 10).
6 The FCS is calculated as follows:
��� � 2 ∗ ���� , ��� � � 3 ∗ ���� � � 1 ∗ ������� � � 1 ∗ ����� � � 4 ∗ ����, �� �, �� � � 0.5 ∗�"�� �#$��� � � 0.5 ∗ � ��� �,where (…) is the number of days the particular food group was consumed capped at 7 days maximum. 7 This is calculated using M&E (n=79) 2/2013 data, EOPR (n=104) 7/2013 data, M&E (n=115) April-June 2013
data, and the CFSAM (n=77) data. The total sample size over the period was 375.
Figure 9. Proportion of households with acceptable, borderline, and poor food consumption scores
Source: 2013 CFSAM
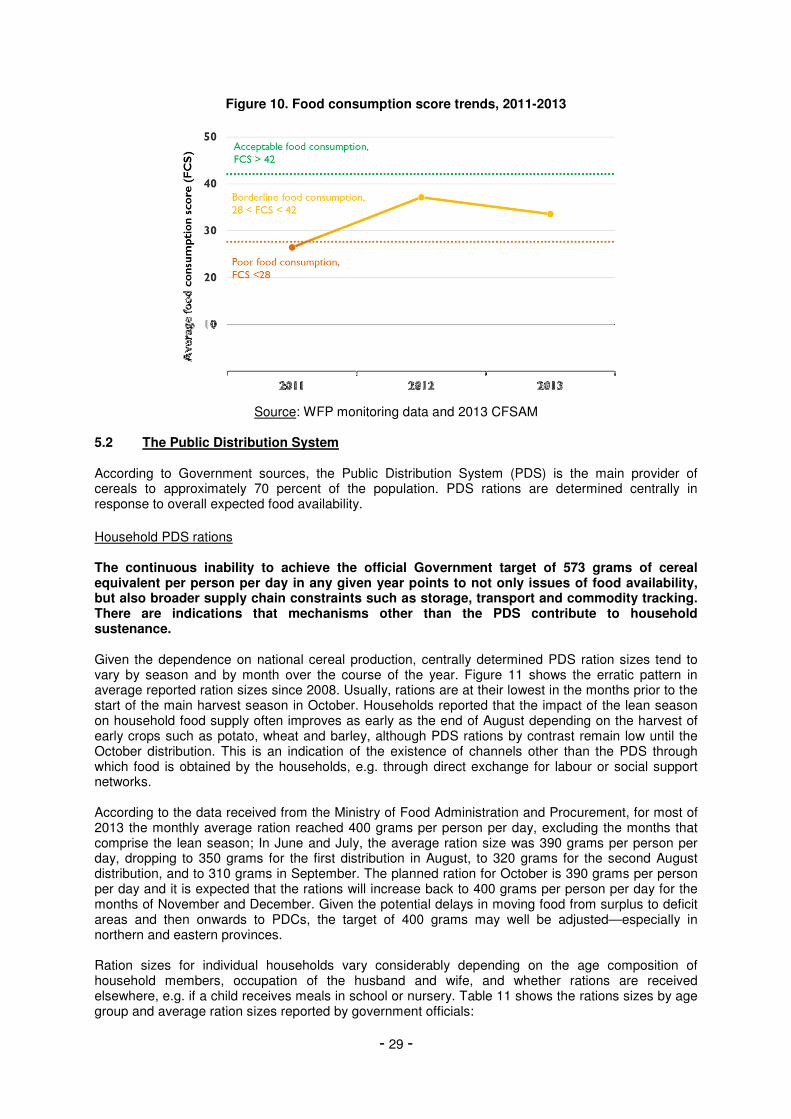
- 29 -
Source: WFP monitoring data and 2013 CFSAM 5.2 The Public Distribution System
According to Government sources, the Public Distribution System (PDS) is the main provider of cereals to approximately 70 percent of the population. PDS rations are determined centrally in response to overall expected food availability.
Household PDS rations
The continuous inability to achieve the official Government target of 573 grams of cereal equivalent per person per day in any given year points to not only issues of food availability, but also broader supply chain constraints such as storage, transport and commodity tracking. There are indications that mechanisms other than the PDS contribute to household sustenance. Given the dependence on national cereal production, centrally determined PDS ration sizes tend to vary by season and by month over the course of the year. Figure 11 shows the erratic pattern in average reported ration sizes since 2008. Usually, rations are at their lowest in the months prior to the start of the main harvest season in October. Households reported that the impact of the lean season on household food supply often improves as early as the end of August depending on the harvest of early crops such as potato, wheat and barley, although PDS rations by contrast remain low until the October distribution. This is an indication of the existence of channels other than the PDS through which food is obtained by the households, e.g. through direct exchange for labour or social support networks. According to the data received from the Ministry of Food Administration and Procurement, for most of 2013 the monthly average ration reached 400 grams per person per day, excluding the months that comprise the lean season; In June and July, the average ration size was 390 grams per person per day, dropping to 350 grams for the first distribution in August, to 320 grams for the second August distribution, and to 310 grams in September. The planned ration for October is 390 grams per person per day and it is expected that the rations will increase back to 400 grams per person per day for the months of November and December. Given the potential delays in moving food from surplus to deficit areas and then onwards to PDCs, the target of 400 grams may well be adjusted—especially in northern and eastern provinces. Ration sizes for individual households vary considerably depending on the age composition of household members, occupation of the husband and wife, and whether rations are received elsewhere, e.g. if a child receives meals in school or nursery. Table 11 shows the rations sizes by age group and average ration sizes reported by government officials:
Figure 10. Food consumption score trends, 2011-2013

- 30 -
Figure 11. Average monthly PDS rations, 2008-2013 compared to the Government target
Source: WFP monitoring data and 2013 CFSAM
The immense time and logistical demands of these monthly calculations for household PDS entitlements should not be underestimated particularly in light of the lack of computer power at the county level; complex paper filing systems stand testament to this remarkable achievement.
Table 11. Ration sizes by age group and average ration sizes
Age group (years)
Average ration size
390 g/person/day 400 g/person/day
< 1 65 67
1–4 130 134
5–6 195 200
7–10 265 270
11–16 330 340
17–59 460 475
>60 395 400 Source: 2013 CFSAM, interviews with county officials
PDS stocks and transfers
The logistical challenges inherent in distributing rations to households are immense, particularly given the high number of Public Distribution Centres (PDCs) in each county and the monthly or bi-monthly schedule of distributions. At county level, very limited PDC stocks were reported for the October distribution. As a result, this may result in significant delays in some distributions and food shortages at the household level. At the county level, the Mission observed very limited stocks. In the first half of October, almost half of the counties lacked sufficient stock to meet the first PDS needs (based on the ration size of 390 grams per person per day). In one of the counties visited by the Mission, there was only 38 kg of stock for a PDS dependent population of around 140,000 people. In counties visited by the Mission in the Northeast, stock levels were zero. The ‘just-in-time’ nature of the PDS system leaves county warehouses completely exhausted after the completion of either the first or second distribution in a given month. County officials express no clear knowledge on from where replenishment stocks will emanate for the remainder of the month, but are confident that the supplies will be made available. Food for the PDS is generally transferred from the surplus provinces in the southern and western parts of the country – North and South Hwanghae, and North and South Pyongan – to the deficit provinces in the north and along the eastern coast – Chagang, Ryanggang, North and South Hamgyong, and Kangwon (see Figure 12). The majority of food between provinces is reportedly transferred via train. The major flows are all into large urban areas such as Pyongyang, Nampo, Hamhung, and Chongjin. Pyongyang serves as a primary transport hub for shifting food from surplus areas to deficit areas for two main reasons: For one, decisions are made centrally by the Ministry of Food Administration and Procurement regarding

- 31 -
the amount and destination of surplus production; and two, the logistics of re-distributing from south/west to north/east rely heavily on the limited rail network, much of which passes through Pyongyang. Minor flows within provinces or to neighbouring provinces are mostly transported by truck or by sea (especially in South Hamgyong). Several of the counties in the northern and eastern provinces are highly food deficit and difficult to reach. In these cases, food is transported by a combination of rail and truck. Some cereals are imported from the People’s Republic of China (PRC) and are transferred to North and South Pyongan (possibly via Sinuiju), Ryanggang (via Hyesan), and North Hamgyong (via Hoeryong). Food procured from the PRC is mostly sent to its final destination by train.
Figure 12. Food transfers in DPRK
Source: 2013 CFSAM based on discussions with county and province officials
Food transported from one province to another or from one county to another within a province is offloaded and stored in county warehouses. This implies that secondary transport networks are also essential to ensure that available food is sent onwards from county warehouses to the numerous public distribution centres (PDCs) that act as the final distribution points to PDS dependents. The long distances, especially to highly food deficit counties in the northern and eastern provinces, mean that a combination of rail and trucks are used to transport food from surplus areas. Undoubtedly, this leads to delays in receipt of essential stocks in county warehouses and in local PDCs, likely even more so in the winter season when roads are not always passable. Any delay on one leg of the transport chain will lead to further delays in finally reaching PDCs. As a result, PDS dependent households have to look to other sources of food until such time as stocks are replenished—be it through markets or familial networks. Table 12 provides estimated cereal needs for a number of selected counties and the reported PDC stock levels at the county level as of 1
st of October.

- 32 -
Table 12. Cereal Needs and Cereal Stocks by County, 1 October 2013
Province County/City Estimated
number of
PDS
dependents
Total
requirement
for first
distribution of
October
(based on 390
gr/p/d for 15
days)
Total
reported
stock
level as
per 1
October
Surplus (+)
or Deficit (-
) for first
distribution
Surplus (+) or Deficit (-) for the month of October
South Hamgyong
Hoisan 652,694 3,818 MT 600 MT -3313 MT - 7036 MT
Kangwon Wonsan
City
288,828 1,690 MT 590 MT -745 MT - 2790 MT
Chagang Huichon
City
134,009 784 MT 38 MT - 745 MT - 1530 MT
Kangwon Kosan 51,282 300 MT 1 MT -299 MT - 599 MT
North Pyongan
Tongrim 48,998 287 MT 150
MT
-137 MT - 424 MT
North Hwanghae
Rinsan 41,401 242 MT 118
MT
- 124 MT - 366 MT
North Hwanghae
Pongsan 64,487 377 MT 450
MT
+ 73 MT -304 MT
Kangwon Munchon 79,753 467 MT 590
MT
+ 123 MT -344 MT
South Hwanghae
Taetan 18,134 106 MT 304 MT + 197 MT + 92 MT
South Hamgyong
Kumya 79,325 464 MT 670 MT +206 MT -258 MT
South Hamgyong
Tockhong 33,347 195 MT 600 MT + 405 MT + 210 MT
South Pyongan
Phyongsong
City
190,190 1,112 MT 2,895 MT + 1,782 MT + 671 MT
Source: 2013 CFSAM
County officials reported that part of the October rations would be supplied through immediate re-distribution of the current rice harvest. If this is the case, it is unlikely that secondary transport will be sufficient to move the large quantities required to the various PDCs on time. The counties visited by the Mission reported having between 25 and 30 PDCs per county. The number of households listed to receive food at these PDCs ranges from 700 to 2,900 households. The Mission visited a few PDCs and observed that their storage capacities are often not sufficient to hold rations for a large number of households (i.e., above 1,000). The sheer numbers of PDS dependents requiring assistance across the different PDCs leads the Mission to conclude that significant delays are to be expected for PDS distributions for the months of October and November, and possibly through the first distribution of December.

- 33 -
State shops
State shops carried limited essential supplies such as salt (non-iodized), bean paste, soya sauce and oil. These items are available on state allotment with ration sizes depending on availability. Meat was reported to be only available on major holidays. As part of the centralized system of food provision, state shops supply other non-cereal household necessities including oil, condiments (such as bean paste, soy sauce, and non-iodized salt), and some vegetables (such as radish, kimchi, eggplant, and seaweed). Other items – particularly fruits, meat, and tofu – are available during specific seasons or on national holidays. Some state shops in rural areas also stock non-food items such as clothes, notebooks, pens, and school materials. The mechanism of sale at the state shops is not uniform. Coupons are reportedly distributed to households as part of their rations, but at all the state shops visited, at least some items could be purchased with cash. At some shops, most of the items could be purchased with cash. Observed prices varied from county to county and are artificial in relation to prices for similar items observed in markets: for instance, salt is usually priced at KPW 3 per kg but one shop was selling salt for KPW 15.5 per kg. The reason for this difference is usually explained in terms of higher transportation costs. Other examples of prices collected during the Mission are listed below in Table 13.
Table 13. Prices of food items in State Shops
Item (unit) Range in reported prices , in KPW
Bean paste (kg) 22
Soy sauce (kg) 22 – 25
Oil (kg) 250
Salt, non-iodised (kg) 3 – 15.5
Salt (iodised) 12
Garlic (kg) 380
Tofu (kg) 6 – 250
Red peppers (kg) 616
Sausage (piece) 2.5
Pears (kg) 40
Apples (kg) 68
Rice cake (25g piece) 0.4
Bean candy (20g piece) 0.5
Soju 40 – 60 Source: 2013 CFSAM
According to CFSAM data, households go to state shops on average 1.6 times per month and receive an average allotment of approximately 1.7 kg of oil, 2 kg of soy sauce, and 6 kg of bean paste per month. The number of households served by each state shop visited by the Mission ranged from 1,673 to 5,020 families. Based on the allotment per household, an average size shop with 3,000 families listed would, on a monthly basis, need approximately:
• 5.1 MT of oil;
• 6 MT of soy sauce; and
• 18 MT of bean paste. Most of the state shops visited by the Mission had very limited stocks on hand. Almost half of the state shops had no oil at the time and in only a few was bean paste readily available. Shops in the south-western provinces appeared to have larger stocks of meat (sausages), dried fish, tofu (bean curd), and snacks such as rice cakes, bean candy and peanuts. Based on these observations, there is concern that the state shops may not be able to consistently and sufficiently provide for all the population needs.

- 34 -
5.3 Household food security and coping strategies
Coping with food shortages At the household level, food shortages occur chronically and consistently, peaking during the lean period between May and August. PDS dependent households, typically the more vulnerable given the lack of self-sufficiency, cope by receiving support from relatives on cooperative farms, reducing quantities consumed, gathering wild foods, and diluting meals with water. Due to the inconsistent and unpredictable public distribution system, households in the DRPK are likely to experience frequent food shortages. Over 80 percent of PDS dependent households frequently worry about not having enough food, eat a limited variety, and are not able to eat the foods they prefer. Reducing the number of meals or eating smaller meals is reportedly less common, although approximately one-third of households stated eating smaller or fewer meals. More extreme forms of experiencing hunger, such as not having any food to eat at all and skipping a whole day without eating are rare in the DPRK (Figure 13).
Figure 13. Impacts of food insecurity at household level
Source: 2013 CFSAM
While particularly insightful for assessing household perceptions of their food security, the nine questions above reflect household food security status over the past 30 days, in this case capturing experiences in the month of September 2013. In order to assess food insecurity during the lean season months, an addition set of questions on coping behaviours was asked. Households identified the lean season months as falling between May and early August, during which period the PDS dependent households can face food shortages. The importance of support networks increases during these months, with almost 90 percent of PDS dependent households report relying on relatives from cooperative farms. Food-based coping strategies also become more frequent with increased dependence on wild vegetables and diluting of meals with water. Approximately 60 percent of PDS dependent households reported relying more on bartering and exchange to obtain sufficient food for the household during these months. In late August, the harvest of early crops appears to mitigate the impact of reduced ration sizes that continue through October.

- 35 -
Household food access Formal and informal markets, own production and a system of gifting and commodity exchange are increasingly becoming important means for households to obtain food. Households in DPRK access food through a variety of avenues including own production (on the farm and in kitchen gardens), the PDS, state shops, markets, wild food gathering, land user groups of factory workers, and through gifts and exchanges. The relative importance of each source varies by food group, by type of household (PDS dependent or farming), as well as by season and month. Informal mechanisms such as gifts and exchange remain a key source of food particularly for PDS dependent households. For cooperative farming households, own production supplies a large proportion of the food. Typically, and if targets are met, farming households are allotted an annual ration of 260 kg from their own production, with the remainder going to the PDS. During September and October, farming households may receive an advanced ration that will be then be subtracted from their total annual allotment. A number of farms reported the existence of an incentive scheme for sub-work teams. If outputs exceed the set targets, rations up to 15 months maximum are provided, i.e. an additional 65 kg per farmer. If targets are not met however, the annual allotment can be as low as 8 months. Farming households all have kitchen gardens which then provide the household with most of its vegetables. For PDS households with access to kitchen gardens (38 percent of PDS households), own production contributes approximately 8 percent of cereal supply and almost all of their vegetable supply (98 percent).
8
For those without access to a kitchen garden (62 percent), gifting and exchange become increasingly important mechanisms for sourcing both cereals (16 percent of total cereals) and vegetables (52 percent of total). State shops provide mostly condiments, such as soy sauce and bean paste, and oils. However, for those households without a kitchen garden, state shops also provide a substantial proportion of vegetables (35 percent of total vegetables). For all PDS households, support from families and friends contributes significantly to household food supply: on average families receive 24 kg of cereals a year through this form of social support. While markets are not readily identified as a source of either vegetables or cereals, on average PDS dependent households reported going to the market 2 to 3 times per month. Markets Market observations were limited, but in the few visited, a range of products including meat, fresh vegetables, clothing and other non-food items were available, especially in daily city markets. Farmers’ markets in rural areas mostly supplied local produce, tobacco and small livestock. With these limited observations, the true role of markets in household food economy remains unclear. Daily urban markets and farmers’ markets held every 10 days in rural areas are an important source of vegetables, tubers, and small livestock for a limited number of households. In the daily city markets, the Mission observed a range of products including meat, fresh vegetables, clothing, and other non-food items. Farmers’ markets were mostly limited to supplying locally produced vegetables and condiments, tobacco, seafood, and small livestock. Some clothing and shoes were also available for sale. Prices observed in the markets were inconsistent, but appear to be much higher than in state shops: for instance, one kg of garlic is sold at KPW 380 in state shops, while in farmers’ markets the price is
8 Percentages in this section are based on data collected during the Mission (n=77). The Mission visits were
biased to up areas. The PRRO review in July 2013 found 57 percent of PDS dependents with access to kitchen gardens. The EMOP review of 2012 found 69 percent. Differences are due to division of the sample across ri and up areas.

- 36 -
KPW 2,000. It is unclear how households obtain income to purchase food in farmers’ markets. Observed price ranges are listed in Table 14. The range of prices seems to indicate that there is very limited market integration. With constraints in peoples’ movement from one county to the next,
9 this is
not surprising and as such can lead to large price swings in local markets especially for perishable goods depending on prevailing supply and demand conditions.
Table 14. Prices of food items in famers’ markets
Item (unit) Range in reported prices (KPW)
Apples (kg) 1,500 – 4,000
Pears (kg) 500
Potato (kg) 200
Tomato (kg) 1,500
Garlic (kg) 850 – 2,000
Red peppers (kg) 6,000
Dried chili (kg) 500
Rabbit (adult) 800 – 4,500
Rabbit (young) 500
Chicken (kg) 3,000 – 6,000
Duck (adult) 6,000
Piglet (kg) 7,000
Pork (kg) 5,000
Eggs (piece) 300 – 800
Dried fish (kg) 900
Fresh fish (kg) 1,000
Crab (kg) 4,000
Shrimp paste (kg) 150 Source: 2013 CFSAM
The average distance to markets is 12 ris (approximately 4.7 km); however, almost all of the households interviewed by the Mission in urban areas live within 5 ris (approximately 2 km) of the nearest market. The proximity of urban households to markets, frequent visits to these markets by households to procure foods, as well as direct observations from the Mission suggest that market activity may be much more common in the DPRK than generally assumed. Based on these observations, The Mission recognizes the increasing role of markets – both formal and informal – for obtaining food. As such it has requested the Government for assistance to gain a better understanding of the role markets play in improving household food security.
9 Movement of people in the DRPK is not free and people need permission to travel from one county to the next.
Wild foods Wild foods play an important role in the food supply for many households in DPRK, particularly during periods of food shortage. However, collection is highly seasonal as well as region-specific. Most of the wild foods are available during the spring and early summer, from April to June. Collection begins to taper in the late summer and autumn, with mainly some fruits being collected in the later autumn months. In winter, most wild foods are not available. The timing of this Mission, during the beginning of the harvest period, may explain the low levels of reported gathering as a source of the “previous week’s supply” of food: only 7 percent of vegetables for cooperative farming households and none for PDS dependent households. However, WFP monitoring data over the past several years suggests that approximately one-third of households report relying more on wild food collection during the lean months.

- 37 -
6. MATERNAL, INFANT AND YOUNG CHILD NUTRITION
6.1 Trends in under-nutrition The findings of the most recent nutrition survey confirm that rates of child malnutrition have steadily declined over the past 10 years. However, rates of stunting remain high and micronutrient deficiencies are of particular concern. Although trends of under-nutrition are moving in the right direction, coordinated efforts among the sectors of nutrition, health, food security, water, hygiene and sanitation are essential to further improve the nutrition status of women and children. Child under-nutrition in DPRK, measured through stunting, wasting and underweight, has steadily declined over the past decade. The prevalence of wasting (4 percent) is now within the normal range according to international thresholds. Despite the significant declines in stunting prevalence from 45 percent in 2000 to 28 percent in 2012 (a decline of over 2 percent per year), stunting prevalence remains of alarming public health importance according to international standards (see Figure 14).
The determinants of improved nutrition in DPRK are not immediately apparent. Nutrition interventions supported by international partners likely have played a role, however the Mission postulates that the increasing role of markets may have made a significant contribution to reducing malnutrition (see box).
Figure 14. Under-nutrition trends in DPRK for selected indicators, 2000-2012
Source: Data from DPRK National Nutrition Survey, 2012
Markets may have contributed to dietary diversity and nutrition in DPRK. The CFSAM Mission observed that mainly women tend to be engaged in market related activities including bartering, buying and selling. The products bartered and sold on farm and city markets originate mainly from kitchen gardens. The diversity of fresh products provides a means for improving both quantity and quality of the diet. As children consume their main meals in child institutions, the improved dietary diversity available through market exchanges may currently be benefiting women’s diets more than their children’s.

- 38 -
Geographic disparities
Despite low prevalence of wasting at national level, wasting rates remain alarmingly high in some provinces. Wasting rates are highest (categorized as an ‘alarming’ public health problem) in the north and eastern provinces of Ryangang and Chagang. Stunting also varies regionally, with rates exceeding 30 percent (categorized as ‘serious’) in Ryangang, South Hamgyong and Chagang. In Ryangang, stunting is most widespread with 39.6 percent of children under the age of five stunted (>40 percent is considered ‘critical’). Stunting levels can only be considered ‘normal’ (i.e. < 20 percent) in Pyongyang city. Seasonal variation The incidence of wasting is highly seasonal. The National Nutrition Survey 2012 was conducted during the harvest season (September and October) when the incidence of wasting is at its lowest. Wasting peaks during the lean season from May to August. Disparity by age group Disaggregating under-nutrition by age group reveals disparities within DPRK. According to the National Nutrition Survey 2012, wasting levels in children aged 0 to 23 months are slightly higher than in the 24 to 59 month age group. This is in line with global trends and is associated with the higher morbidity and sub-optimal feeding practices for this age group. Stunting amongst children aged 6 to 11 months is relatively low at 8.4 percent. Amongst children aged 12 to 23 months, stunting prevalence sharply increases to 27 percent, followed by another increase to 34 percent amongst children aged 24 to 35 months. Low birth weight In line with the low rate of stunting in the 6 to 11 month age group, low birth weight has remained below 10 percent for the past decade. Yet maternal weight gain during pregnancy (a significant determinant of low birth weight) is approximately 5kg, well below the recommended 10kg. This indicates that dietary intake during pregnancy is most probably insufficient. Thus, given the prevalence of stunting and low maternal weight gain, interventions that address nutrition gaps for pregnant and breastfeeding women, breastfeeding practices and complementary feeding should be considered. Anaemia Anaemia rates amongst pregnant and non-pregnant women (31.2 percent) and children aged 6 to 59 months (28.7 percent) are considered as ‘moderate’ public health problems. In addition, of significant concern is the high prevalence rate of anaemia amongst children aged 6 to 11 months (45.4 percent) and children between 12 and 23 months (47.9 percent). No province has anaemia prevalence rates below 20 percent, with the highest rates in Kangwon province for child anaemia (39.3 percent) and in Ryanggang province for maternal anaemia (36.0 percent). The main causes of anaemia are insufficient dietary intake of iron as well as Vitamin B12 and infectious diseases such as hookworm infections. A specific concern in DPRK is the extremely low intake of animal-source protein. According to the global evidence base, low intake of animal-source protein is strongly associated with deficiencies in Iron, Zinc and Vitamin A respectively resulting in anaemia, stunting and increased morbidity. Iodine Deficiency Disorder (IDD) Although the National Nutrition Survey 2012 did not evaluate iodine levels, iodine deficiency disorder (IDD) is assumed to be an on-going problem in DPRK. The main consequences of IDD include irreversible brain damage and mental retardation. The percentage of households with adequately iodised salt increased from 1.5 percent in 2000 to 42.1 percent in 2010, which is far below the international recommendation of 95 percent. Although UNICEF supports salt iodisation, progress is challenging given the numerous salt production sites. Indeed, the Mission observed that the only source of salt is the state shops and that the salt was non-iodised. A study conducted in 2010 found that only 42.1 percent of households consumed iodised salt and only 23 percent of the salt was adequately iodised.

- 39 -
6.2 Severe and moderate acute malnutrition In DPRK provincial and county hospitals hold the primary responsibility for treatment of severe acute malnutrition (SAM). However, it is recommended that the implementation of this recently developed protocol be strengthened especially with respect to the correct use of nutritious products such as F75, F100, Plumpy’Nut, and the WFP blended foods. Recognition of and attempts to address moderate acute malnutrition (MAM) are also largely inadequate. Management of SAM has been implemented in 29 counties in six provinces as well as in all provincial hospitals. Through interviews and observation in 15 hospitals, the Mission found that knowledge and understanding was unequal. There are a number of concerns regarding the quality of care and treatment provided. Based on Mission interviews, it seems as though the DPRK treatment protocol is often wrongly applied. Staff described that treatment of SAM is a combination of medical and dietary remedies including: traditional Korean medicine; and provision of F75 or F100, Plumpy’Nut, rice-milk blend (WFP), fresh vegetables, sugars, and/or dairy products. In many of the hospitals visited by the Mission, F75 and F100 were unavailable – in these hospitals, substitutes made with milk and soya or WFP blended foods were often provided to treat severe malnutrition. Neighbourhood doctors identify and treat cases of moderate acute malnutrition (MAM) in local clinics at the ri or up level. Some cases of MAM with medical complications, such as respiratory illnesses, malaria
10, or diarrhoea are sometimes referred to county or provincial hospitals. However, in such
cases treatment focuses on the complication instead of treatment of MAM. All SAM children with complications are admitted as inpatients for the entire duration of the treatment. In some locations, outpatient MAM children are wrongly receiving Plumpy’Nut, as it is intended only as a therapeutic food for use by SAM out patients only. Meanwhile, interviewees explained that SAM children receive WFP blended foods instead of therapeutic foods (F75, F 100 or Plumpy’Nut). This is especially the practice when no therapeutic foods are available. On a positive note, the decrease in admissions was partially attributed to UNICEF and WFP support. To improve quality review of implementation modalities, refresher training and adequate monitoring should be considered. In most cases, the hospitals reported receiving regular supplies of antibiotics, oral rehydration salts (ORS), zinc tablets, and WFP blended food. The hospitals visited appeared to have sufficient stocks of these products. However, in the hospital visited no information was available regarding F75, F100 and Plumpy’Nut supplies. 6.3 Child feeding practices Feeding practices in children’s institutions Government policies prioritize food supplies to children’s institutions, especially for children under the age of 5 years. Cereals, cabbage and soya milk are regularly provided to institutions. However, provision of animal products and fruits is sporadic, depends on seasonal availability and is provided in very low quantities. Recent resource constraints have affected WFP-supported institutions resulting in a reduction in the number of full feeding days, and an overall decline in nutritious food intake by young children. Most children in DPRK attend child institutions daily, including nurseries, kindergartens, and primary schools. Typically, children are placed in nurseries at the age of four months at the conclusion of maternity leave. At age four children transition into kindergarten, moving on to primary school at the age of six. The Mission visited 24 child institutions, including 13 nurseries, 2 baby homes (orphanages for children under five years), and 9 kindergartens. Given that children enter these institutions at a
10
Several hospitals in the southern provinces reported cases of malaria; however, the incidence of this disease is reportedly decreasing rapidly.

- 40 -
very young age and receive a significant amount of their daily food intake from them, the food supply and meal compositions is particularly important for interpreting and understanding nutrition outcomes for young children. Meals are provided three times per day in baby homes, twice daily in nurseries, and once in kindergartens. The quantity of food provided and its diversity is not sufficient to meet child nutrition requirements. In all institutions, animal source protein (an important source of micronutrients especially iron, Vitamin A, Vitamin B12, zinc, riboflavin, and calcium) is provided in very small quantities, well below international recommendations. Meat is rarely provided, mostly restricted to national holidays and given in very small quantities. In one school the Mission observed that approximately 25g of meat per child per month is received. In addition, the consumption of fish and eggs is limited to a small quantity provided once or twice per month. When eggs are provided, children receive one-half or one-quarter of an egg per child. On a positive note, the daily provision of a quarter to one-half cup of soymilk in several of the institutions visited was encouraging. Fruit intake, however, is only seasonal and depends on availability. In general, the quantity and quality of meals does not meet international recommendations. More specifically:
• Kindergarten meals: Meals are limited to approximately 100 grams of cereals, and less in some schools. The daily vegetable ration is dependent on whether the kindergarten has access to a kitchen garden or public land (slope land). The Mission observed that kindergartens with large kitchen gardens provide substantially more vegetables than those without gardens or with smaller plots. In these cases, the daily vegetable ration may exceed the cereal ration.
• Nursery meals: Meal quantity and type of food received is determined based on child age groups. Children less than one year of age receive approximately half of what is provided to the 3 to 5 year olds. As observed by the Mission, children under age one do not regularly receive meat and vegetables. Children between one and two years of age are provided a somewhat larger quantity and more diverse food selection, however less than children aged three to five years.
• School meals in kindergarten and nurseries are generally supplemented by one or two daily snacks. In schools supported by WFP these consist of biscuits (30 to 60 grams) and/or 100 gram pancakes made from a mix of corn-soy-milk flour or cereal-milk flour. These WFP-provided nutritious snacks make up a substantial part of the daily food supplies at children’s institutions. This year’s pipeline breaks, resulting in fewer number of feeding days or provision of lower daily rations in many of the schools, have therefore substantially affected the intake of nutritious food by young children.
Infant and Young Child Feeding Practices (IYCF) Around two thirds of DPRK children are exclusively breastfed until 6 months of age. However, dietary diversity for young children (under the age of 2) deteriorates quickly with only one quarter receiving adequately diverse diets. Animal-source protein is limited. International Infant and Young Child Feeding (IYCF) recommendations include exclusive breastfeeding up to age of six months followed by continued breastfeeding and the timely introduction of appropriate quality and quantity of complementary foods up to age two. Exclusive breastfeeding: According to the National Nutrition Survey 2012, 68 percent of infants 0-6 months were exclusively breastfed. According to a number of mothers interviewed by the Mission, babies are usually exclusively breastfed for the duration of maternity leave (typically four months). Once the infants are enrolled in nurseries, some as young as 4 months of age, continuing exclusive breastfeeding becomes a major challenge, despite initiatives taken to encourage mothers to come at set times to nurseries to breastfeed. Introduction of complementary foods: At the age of 6 months a child should receive complementary foods. According to the National Nutrition Survey 2012, only one in four (26.5 percent) children aged 6 to 23 months received foods from four different food groups (i.e. met the requirements

- 41 -
for minimum dietary diversity). A greater percentage of children in Pyongyang had a minimum dietary diversity (59.4 percent) than in any other part of the country, with ranges outside Pyongyang from 15.6 percent in Ryanggang to 25.8 percent in South Pyongan (including Nampo municipality). Poor dietary diversity: In determining the cause of under-nutrition of infants and young children it is helpful to examine maternal nutrition, especially dietary diversity. The proportion of women with adequate dietary diversity (49.6 percent) is nearly double that of children. This discrepancy suggests that the feeding practices in the institutions (see previous section) may be a more important determinant of poor children’s dietary diversity compared to feeding practices at home. Limited access to and consumption of animal source protein: While the National Nutrition Survey 2012 found no statistical association between dietary diversity and stunting, previous research in DPRK found that consumption of animal source proteins by mothers was associated with reduced stunting of their children, pointing to the importance of animal products in preventing stunting.
11
However, more information on quantities of key food items consumed by children is needed to understand the links between dietary diversity, stunting, and micronutrient deficiencies. Limited use of breast milk substitutes: MICS 2009 and observations during the mission confirm that the use of Breast Milk Substitutes (BMS, or Infant formula) in DPRK is not widespread. MICS estimates only 3.5 percent of the children aged 0 to 23 months are bottled fed. During some hospital visits the Mission observed the use of locally produced BMS made with rice, milk, or soya. Hospital staff in hospitals that treat severe acute malnourished children indicated that they use the F75 and F100 (therapeutic milk) as BMS as well. Children of women with communicable diseases, pregnant women who are undernourished and mothers who cannot produce enough breast milk receive these substitutes. Given these practices, there is a need for training of hospital staff to better support and promote exclusive breastfeeding. Further, the use of F75 and/or 100 as BMS is incorrect and should be addressed in trainings on exclusive breastfeeding and management of severe acute malnutrition. Promotion of good maternal and infant and young child nutrition: The Mission did not observe any evidence of promotion of good feeding practices for pregnant and breastfeeding women or infants and young children. However, the Mission did observe the practice of additional food being provided to pregnant women by family members. The additional food does not continue beyond pregnancy. Therefore, breastfeeding women and their young children do not have access to this additional food source. Although diverse (e.g. meat, fruits, vegetables), the additional quantity provided is most probably not sufficient to meet additional nutrition requirements. During home visits, pregnant women do receive general health advice from doctors. Local production of specialized nutritious foods: Since 1998, WFP in partnership with the Government of DPRK, has produced various types of blended fortified foods and nutritious biscuits for distribution to pregnant and breastfeeding women and children. At present, 14 local factories produce Cereal Milk Blend (CMB), Corn Soya Milk Blend (CSM), Rice Milk Blend (RMB) and nutritious biscuits. DPRK is one of the very few countries in the region producing locally a fortified blended food (RMB) of acceptable quality for use in stunting prevention programmes. However, current production capacity is only around 20 MT per month and the product is very expensive as the content of Dried Skimmed Milk (DSM) is very high. At the end of December 2012, a WFP Food Technologist recommended a shift from the less nutritious CMB and expensive RMB to a new product Rice Soya Milk Blend (RSB) that also meets the CS+ standards. Some investment will be necessary but it is believed that the shift will result in sufficient production of a high quality blended food that can be used for management of wasting and prevention of wasting and stunting.
11
The lack of zinc in the diet, another micronutrient found in animal products, is closely associated with decreased linear growth or stunting.

- 42 -
6.4 Morbidity Childhood morbidity is a significant determinant of child nutrition status. According to the 2012 National Nutrition Survey, childhood illnesses are a key challenge in DPRK: approximately 14 percent of children were reported sick in the 14 days prior to the survey, 8.5 percent with diarrhoea and 6.5 percent with acute respiratory infection (ARI). Geographically, the highest morbidity level was observed in North Hamgyong with diarrheal incidence at 18 percent and in Kangwon with reported ARI incidence of 8.6 percent. Amongst children under 2 years of age, morbidity rates were particularly high: 17.8 percent of children 6 to 11 months old and 17 percent of children 12 to 23 months old were reported sick in the 14 days prior to the survey. Of these, 11.1 percent of 6 to 11 month olds and 11.8 percent of 12 to 23 month olds suffered from diarrhoea, while 8.7 percent and 6.7 percent suffered from ARI respectively by age group. These figures highlight both important geographical disparities around the country and differences by age group, with increased vulnerability of children less than two years of age. The highest incidence of diarrhoea and indigestion falls during the rainy summer months (June through August), which correlates to the peak time in acute malnutrition. While no exact extrapolation can be made, it is possibly fair to state that up to 30 percent of children may suffer from diarrhoea during the rainy season as compared to less than 10 percent during the harvest period in October/November (Figure 15).
Figure 15. Seasonal calendar indicating timing of the lean season, agricultural activities, hazards, and disease incidence
Source: 2013 CFSAM based on discussions with county and provincial officials, including staff of child institutions
6.5 Water, sanitation and hygiene practices Improving water, sanitation and hygiene promotes healthy environments and prevents diseases. Repeated cases of diarrhoea and intestinal infections, resulting from a lack or poor quality of water, sanitation and hygiene, impedes children and adults’ ability to absorb nutrients, diminishes appetites and results in under-nutrition, including high rates of stunting. According to national data, 99.9 percent of people have access to improved water sources (MICS 2009) and 83.2 percent of people use improved sanitation facilities. However, the sharp increase in incidence among children suffering from diarrhoea during the rainy season is contradictory with the above-mentioned water and sanitation indicators. Contaminated water sources, incorrect use of

- 43 -
sanitation facilities and other sub optimal hygiene practices, such as hand washing are strongly associated with higher prevalence of diarrhoea. Water source and storage
The Mission observed that water storage and treatment met international standards. However, there are concerns regarding water contamination. Inconsistent electricity supply may affect the quality of piped water. In addition, the most commonly reported secondary sources of drinking water were protected wells often located inside the kitchen gardens and thus vulnerable (especially during the rainy season) to contamination from applied fertilizer (including human excrement from latrines) and direct contamination of from nearby latrines.
Sanitation
According to the MICS 2009 data, 83.2 percent of the population has access to improved sanitation facilities. However, the Mission is concerned with the proper construction and/or use of latrines. Most latrines observed by the Mission did not have a cover, were made of wood, were not cleaned or aerated appropriately and were not protected from flies. The close proximity of latrines to the house and/or to kitchen gardens raises concerns additional concerns regarding contamination risk.
Hygiene
Hand washing: Washing hands with water and soap, particularly after visiting the toilet, cleaning a child, before eating or handing food and before feeding a child, is internationally recognized as the most cost-effective health intervention to reduce both the incidence of diarrhoea and pneumonia in children less than five years of age. However, monitoring correct hand washing behaviour is a serious challenge. In the DPRK, soap is made available to households and to children’s institutions through the state, either directly or obtained from state shops. According to the MICS 2009, all surveyed households had a designated place for hand washing complete with sufficient soap and water, although the actual act of hand washing was not monitored. The Mission did not observe hand washing either.
All nurseries visited indicated having a space to wash hands and sufficient water and soap available at all times. However, soap or cleansing material, sometimes also water, was not seen to be available at that space. The Mission observed that based on the number of children enrolled in child institutions, the reported quantity of soap available appears insufficient: e.g. nursery with 27 children attending indicated to consume 7 pieces of soap, while a nursery with 349 children would consume 5 pieces. A possible important difference in size of the pieces of soap could explain the incoherency.
Food Contamination: Food contamination is a significant determinant of diarrhoea. Food safety is a scientific discipline describing handling, preparation, and storage of food in ways that prevent foodborne illness. Given high rates of diarrhoea in DPRK, food contamination should be considered as a potential significant determinant. The Mission did not have an opportunity to observe food handling or preparation. In addition, food storage was only partially assessed. Therefore, future monitoring and assessments should include review of food safety practices in line with WHO recommendations.

- 44 -
7. RECOMMENDATIONS FOR FOLLOW-UP ACTIONS
7.1 Recommendations related to agriculture
There are a number issues relating to crop production, use of technologies, human nutrition and farm mechanization that are critical drivers to improve agricultural production and food security in the DPRK. Several recommendations have been listed in the past CFSAM reports. This Mission, however, would like to focus on the following: 1. The price paid to farms for soybean should be increased to KPW 55/kg in order to
encourage an expansion in production. Over the last two years, average maize yields were approximately 2.6 times greater than those of soybean, yet the price paid to farms for soybean is only twice that of maize. In order to encourage soybean production, in the interest of increased protein consumption, improved national nutrition, and to reverse the downward trend of soybean production that is apparent in most parts of the country, it is recommended that the price paid for soybean should be increased to KPW 55/kg. This would bring the relative price of soybean in line with current international prices; for example US export prices in October 2013 were USD 544/tonne for soybean and USD 200/tonne for maize.
2. Efforts should be redoubled to increase reliance on locally produced organic fertilizers,
while applications of lime and phosphate fertilizers should be increased to be in appropriate proportion of nitrogenous fertilizer. Use of farm yard manure and other organic matter has increased on some cooperative farms, which has led to higher yields. This method of improving soil fertility is both affordable and sustainable. Furthermore, according to the MoA’s fertilizer statistics, the amount of nitrogenous fertilizer applied in 2013 was, at 686,015 tonnes, the second highest in the last six years or almost 480 kg/ha. In stark contrast, the amount of phosphate applied was less than 13 kg/ha. Although more lime is applied to agricultural land now than was the case in previous years, heavier application could be expected to help facilitate yield increases by raising soil pH levels (i.e. by reducing the soil acidity). Soil acidity, which is common throughout DPRK and which can be counteracted by lime application, reduces the availability of essential crop nutrients, and in particular phosphate.
3. High-cold-tolerant winter wheat varieties should be tested to help revitalize the double
cropping programme. Winter wheat frequently gives very disappointing yields in DPRK because of the often exceptionally harsh winter conditions. Plant-breeding carried out internationally in recent years has resulted in the production of increasingly cold-tolerant winter wheat varieties. Some of these have been developed and are grown in parts of China with similar conditions to those of DPRK. It is recommended that these varieties are tested in DPRK.
4. Conservation agriculture (minimum tillage) should continue to be encouraged. Conservation
agriculture was introduced to DPRK several years ago. Following a generally sluggish uptake, it now appears to be gaining acceptance as a valid farming option. Apart from the benefits to soil structure, conservation agriculture has the enormous advantage of reducing fuel consumption, and should therefore be further encouraged.
5. The country should prioritise the manufacturing of appropriate tractors and farm
machinery. On the other hand, international donations of tractors must take account of local capacity to operate, service and repair machinery, and to provide spare parts. Given the country’s high engineering capacity, the development and manufacturing of much needed farm machines is a matter of placing high national priority on farm mechanization. On the other hand, many international donors have supported farm mechanization through donations of tractors and farm implements. A major problem encountered with imported modern tractors has been the level of contamination of diesel by the time it reaches the farm. The ubiquitous 28-hp Chollima tractors are very tolerant of diesel contaminants, but modern tractors with high-precision fuel-injector pumps are not. Support for farm mechanization, should include development of tractors with appropriately robust and tolerant engines that can be easily serviced and repaired using the facilities that are currently available in DPRK. Assistance might also be considered in the provision of clean plastic diesel-storage tanks or providing the machinery for manufacturing such tanks.
- 45 -
6. The Mission also recommends the adoption of an incentive system through relevant reforms in agricultural marketing and also more investment in agriculture/food production to increase productivity and strengthen resilience to shocks to help improve the country’s food security.
7.2 Recommendations related to household food security and nutrition The household food and nutrition security situation is comparable to last year’s but remains fragile and
susceptible to production shocks. Dietary diversity remains poor and provides a risk to the further
reduction of under-nutrition. The declining soybean production and this year’s frequent WFP pipeline
breaks in providing fortified blended foods to child institutions compound this challenge. The most at-
risk households are those who depend on the public distribution system (PDS), lack access to kitchen
gardens and do not have relatives on cooperative farms, as well as young children, pregnant and
breastfeeding women, and elderly and disabled residents. In addition, children up to the age of 5
years, especially those between 6 months and 3 years, and pregnant and breastfeeding women,
specifically in Ryanggang, Chagang and Eastern provinces, are at increased risk of poor nutrition
outcomes.
The determinants of under-nutrition in the DPRK are multifaceted and include amongst others, poor
sanitation, lack of good hygiene practices, poor complementary feeding practices, poor maternal
nutrition, lack of dietary diversity (especially animal source protein) and insufficient food availability.
Therefore a coordinated effort among the sectors of nutrition, health, food security, agriculture, water,
hygiene, and sanitation are essential to further improve the nutrition status of women and children.
To further enhance household food and nutrition security, and ensure continued reduction in under-nutrition (stunting and wasting), the 2013 Mission also makes the following food security- and nutrition-related recommendations: 1. Improve dietary diversity and feeding practices for young children and women: Increasing
dietary diversity, especially the availability and consumption of animal and vegetable source
protein, is essential to reducing under-nutrition in the DPRK. Increased intake of animal protein
can come from egg, meat, fish, milk (cow or goat). This requires a multi-sectoral approach that is
inclusive of behaviour change strategies, improves food diversity in child institutions, introduces
market reforms and promotes small-scale agriculture.
2. Develop a strategy for behaviour change and counselling: to promote improved feeding
practices and dietary diversity for young children, pregnant and breastfeeding women, the strategy
should be finalized and implemented. It should build upon existing systems and cultural practices
(i.e. food gifts from relatives to pregnant women) by relying on doctors, influential family members
and women themselves as change agents.
3. Improve quality and diversity of food in child institutions: Improving the diversity and quality
of food provided through the child institution system is essential to improving children’s nutrition in
the DPRK. The existing quantity and quality does not meet international recommendations for
infant and young child feeding. Building upon the existing system to expand the use of farm and
kitchen gardens to increase supplies of meat, vegetables and fruits should be considered.
Especially, strategies to increase animal (milk, eggs, meat and fish) and vegetable (soya) source
protein should be developed and implemented. Finally, a concentrated effort should be made to
ensure a sufficient supply of specialized nutritious foods to complement other food sources.
4. Distribute high-quality WFP Rice Soya Milk Blend (RSB) food to children in nurseries:
Children aged 6 months to 3 years are highly vulnerable to poor nutrition outcomes. An estimated
80 percent of children in this age group attend nurseries, and thus rely on the institutional system
as their primary food source. RMB, a locally produced fortified blended food, produced with
imported and locally available raw materials, is in line with WFP global recommendations for use
in stunting reduction and wasting prevention programmes. However, quantity produced is very low
and the costs of raw materials are considerable. As a result, this product is only used in paediatric
wards to accelerate recovery from illness. As such, the recommendations of the WFP Food

- 46 -
Technologist made at the end 2012 should be implemented as soon as possible. These include a
shift from the less nutritious CMB and expensive RMB to good quality and reduced priced RSB. It
is recommended that WFP ensures consistent availability and quality of RSB in nurseries for
extended periods of time.
5. Improve quantity and quality of daily household food basket through market reform and
livestock and fish production: Due to the inherent logistic challenges of the public distribution
system, households in the DRPK are likely to experience frequent delays in receiving sufficient
food rations. Relaxation in restrictions on movement and on market activity similar to the 2002
reforms would to a large extent address this issue, as well as reduce dependency on PDS. In
addition, small livestock and fish production in the DPRK can be improved to increase cost-
effective production at the farm and household level. This will have a beneficial impact on both
food security and the nutrition situation.
6. Strengthen treatment of severe and moderate acute malnutrition: Although the official
national prevalence of wasting at 4 percent is within the normal threshold, the population remains
highly vulnerable to acute malnutrition, especially during the lean season (May to August).
Additionally, geographic disparities persist with wasting rates significantly higher than the national
average in the provinces of Ryanggang, Chagang and Eastern provinces. Finally, children under-
five are highly vulnerable to shocks, such as sudden deterioration in food security due to floods
and droughts. This has potential to result in a rapid increase in wasting levels, possibly above
emergency thresholds as witnessed in 2011.
Although a protocol for management of acute malnutrition (SAM and MAM) is available, its
implementation has been sub-optimal especially with respect to the correct use of products such
as F75, F100, Plumpy’Nut and WFP blended food. To improve quality of treatment a review of
implementation modalities, refresher training and adequate monitoring is recommended. The
management of MAM should be implemented in the same geographical areas as SAM. Priority
should be given to areas with a higher risk of wasting. Strong referral systems between both
components should be established to ensure full recovery from acute malnutrition. This requires
close collaboration between UNICEF, WFP and relevant Government departments, including on
disaster preparedness and response programmes.
7. Increase availability of iodized salt: Iodine deficiency has significant implications for women and
young children. Given the limited availability of iodized salt, there is a continued need to support
the implementation of the strategy to increase production and availability of iodized salt.
8. Improve sanitation and hygiene: High rates of diarrhoea (especially during rainy season) and
the Mission’s observations of poor quality sanitation facilities, indicates the need for a targeted
programme to improve sanitation and hygiene.
9. Stimulate spring crop production: Although the harvest of spring crops (potato, wheat and
barley) provides a small contribution to the overall national production, it constitutes an important
food security crop, signalling the end of the lean period in August. For this reason, further
promotion of spring crop production is essential. Furthermore, the continuing decline in soybean
production is worrisome given its importance as a key source of protein in the DPRK. Continued
efforts to prioritize soybean production are required.
10. Implement disaster preparedness and response programmes: The food economy of the
DPRK remains extremely vulnerable to the recurring weather-related hazards and long-term
climate change. In the long term, the introduction of commodity trade relationships and
agreements will contribute to feeding the population and will provide the country with more
response options in case harvests fail. In the short-term, a contingency plan on how the
international community should respond to natural disasters and crop failure urgently needs to be
developed.