Embed Size (px)
Citation preview
SOUTHWESTERN MINNESOTAFARM BUSINESS MANAGEMENT ASSOCIATION
2008ANNUAL REPORT
In Cooperation with:Center for Farm Financial Management · Department of Applied Economics · University of Minnesota Extension
College of Food, Agricultural and Natural Resource Sciences · University of Minnesota
Staff Paper P09-6Department of Applied Economics
University of MinnesotaSt. Paul, MN 55108
April 2009
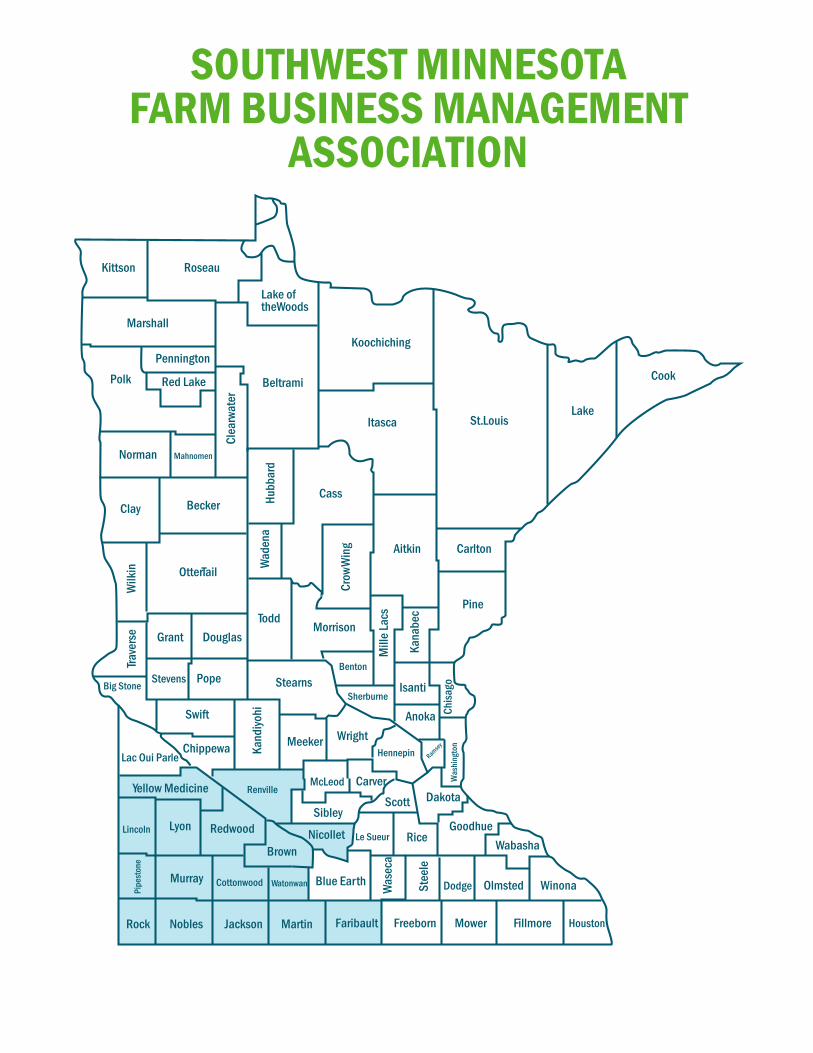
SOUTHWEST MINNESOTAFARM BUSINESS MANAGEMENT
ASSOCIATION
RoseauKittson
Marshall
PenningtonPolk Red Lake
Lake of the Woods
Beltrami
Norman Mahnomen
Clea
rwat
er
Clay Becker
Otter Tail
Wilk
in
Grant
Stevens Pope Stearns
Douglas
Trave
rse
Big Stone
Swift
ChippewaLac Oui Parle
Renville
Kand
iyohi
Meeker Wright
McLeod
Hennepin
Carver
SibleyScott
BrownNicollet Rice
Blue Earth
Le Sueur
Was
eca
Watonwan
MartinJackson
CottonwoodMurray
RedwoodLincoln
Pipe
ston
e
NoblesRock
Lyon
Yellow Medicine
Faribault Freeborn Mower Fillmore Houston
WinonaOlmstedDodgeStee
le
WabashaGoodhue
Dakota
Anoka
Ramsey
Was
hing
ton
IsantiSherburne
Pine
CarltonAitkin
Crow
Win
g
Wad
ena
Chisa
go
Morrison
Benton
Todd
Kana
bec
Mill
e Lac
s
CassHubb
ard
Itasca
Koochiching
St. LouisLake
Cook
TECHNICAL & COMMUNITY COLLEGEANALYSIS CENTERS & REGIONAL DEANS OF MANAGEMENT EDUCATION
1. Ron Dvergsten Northland Community & TC 1101 Highway 1 East Thief River Falls, MN 56701 Telephone 218-681-0797
2. Del Ray Lecy Central Lakes College 1830 Airport Road Staples, MN 56479 Telephone 218-894-5164
3. Jim Molenaar Ridgewater College 2101 15th Avenue NW Willmar, MN 56201 Telephone 320-222-5211
4. Al Brudelie MN West Community & TC 401 West Street, Box 269 Jackson, MN 56143 Telephone 507-847-7928
5. Al Brudelie South Central College 1920 Lee Boulevard, Box 1920 North Mankato, MN 56002 Telephone 507-389-7264
6. Peter Scheffert Riverland Community College 1900 8th Avenue NW Austin, MN 55912 Telephone 507-433-0614
i
Executive Summary
2008 Annual Report of the Southwestern MinnesotaFarm Business Management Association
by Dale W. Nordquist, James N. Kurtz, Garen J. Paulson, James L. Christensen, and Janet M. Froslan
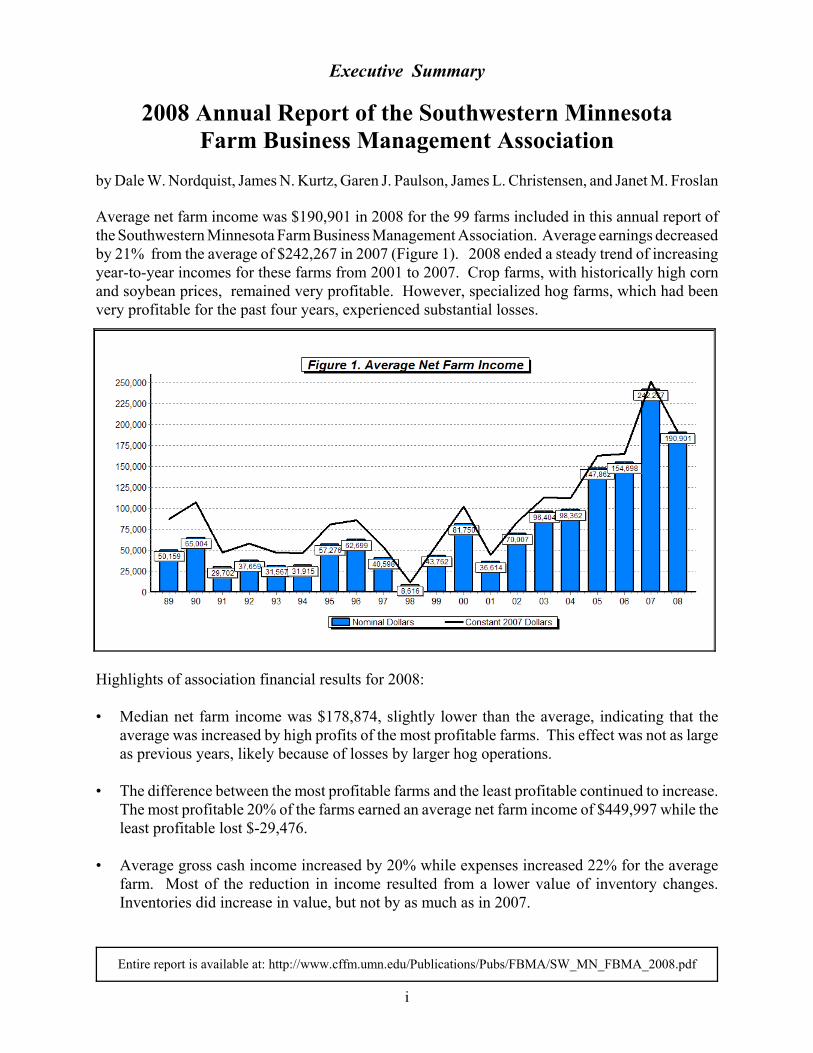
Average net farm income was $190,901 in 2008 for the 99 farms included in this annual report ofthe Southwestern Minnesota Farm Business Management Association. Average earnings decreasedby 21% from the average of $242,267 in 2007 (Figure 1). 2008 ended a steady trend of increasingyear-to-year incomes for these farms from 2001 to 2007. Crop farms, with historically high cornand soybean prices, remained very profitable. However, specialized hog farms, which had beenvery profitable for the past four years, experienced substantial losses.
Highlights of association financial results for 2008:
• Median net farm income was $178,874, slightly lower than the average, indicating that theaverage was increased by high profits of the most profitable farms. This effect was not as largeas previous years, likely because of losses by larger hog operations.
• The difference between the most profitable farms and the least profitable continued to increase.The most profitable 20% of the farms earned an average net farm income of $449,997 while theleast profitable lost $-29,476.
• Average gross cash income increased by 20% while expenses increased 22% for the averagefarm. Most of the reduction in income resulted from a lower value of inventory changes.Inventories did increase in value, but not by as much as in 2007.
Entire report is available at: http://www.cffm.umn.edu/Publications/Pubs/FBMA/SW_MN_FBMA_2008.pdf
ii
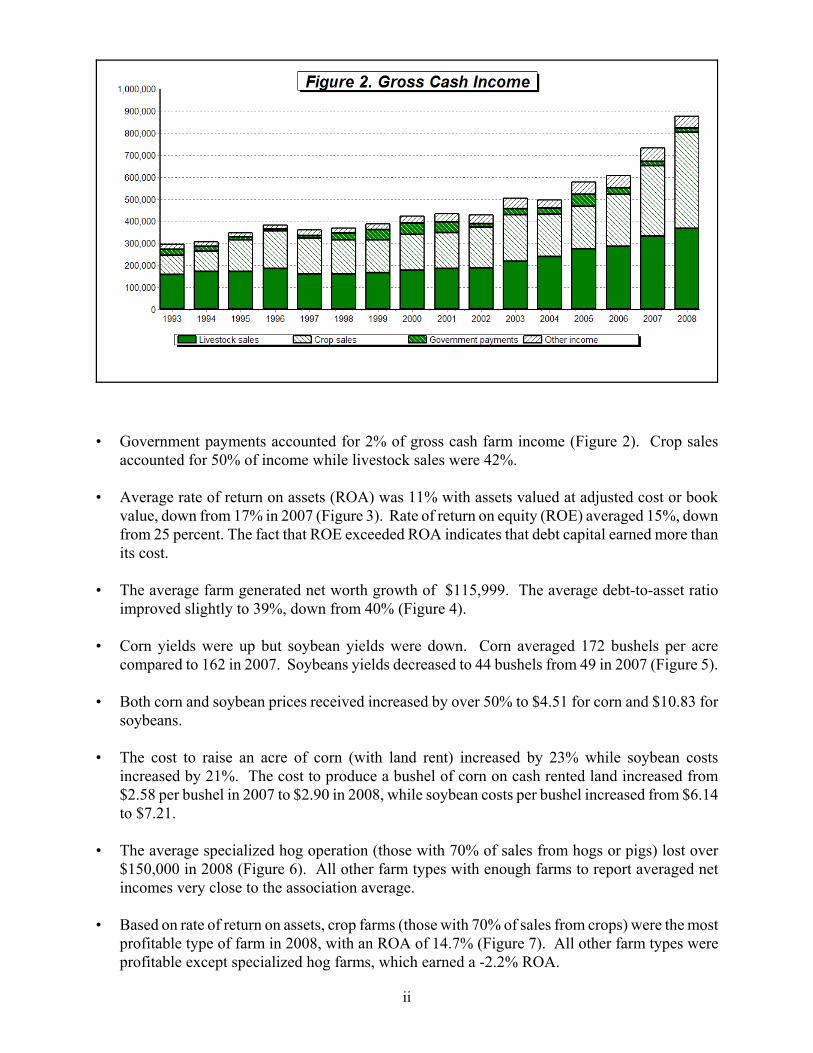
• Government payments accounted for 2% of gross cash farm income (Figure 2). Crop salesaccounted for 50% of income while livestock sales were 42%.
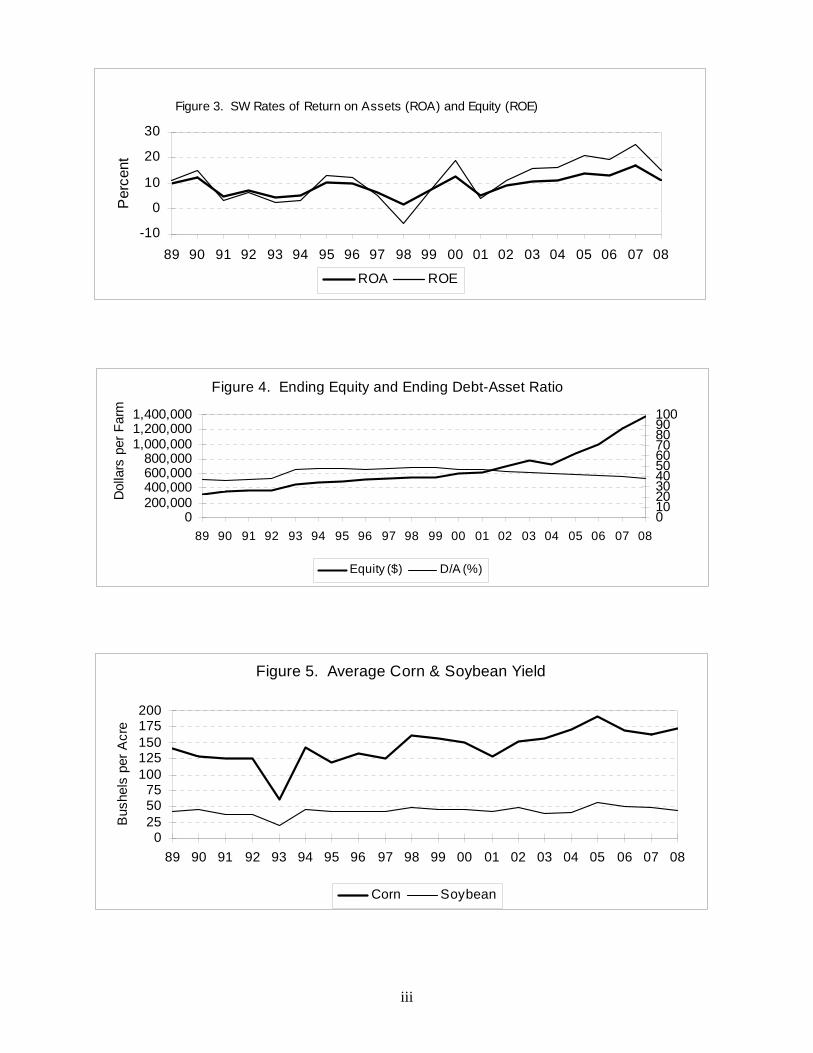
• Average rate of return on assets (ROA) was 11% with assets valued at adjusted cost or bookvalue, down from 17% in 2007 (Figure 3). Rate of return on equity (ROE) averaged 15%, downfrom 25 percent. The fact that ROE exceeded ROA indicates that debt capital earned more thanits cost.
• The average farm generated net worth growth of $115,999. The average debt-to-asset ratioimproved slightly to 39%, down from 40% (Figure 4).
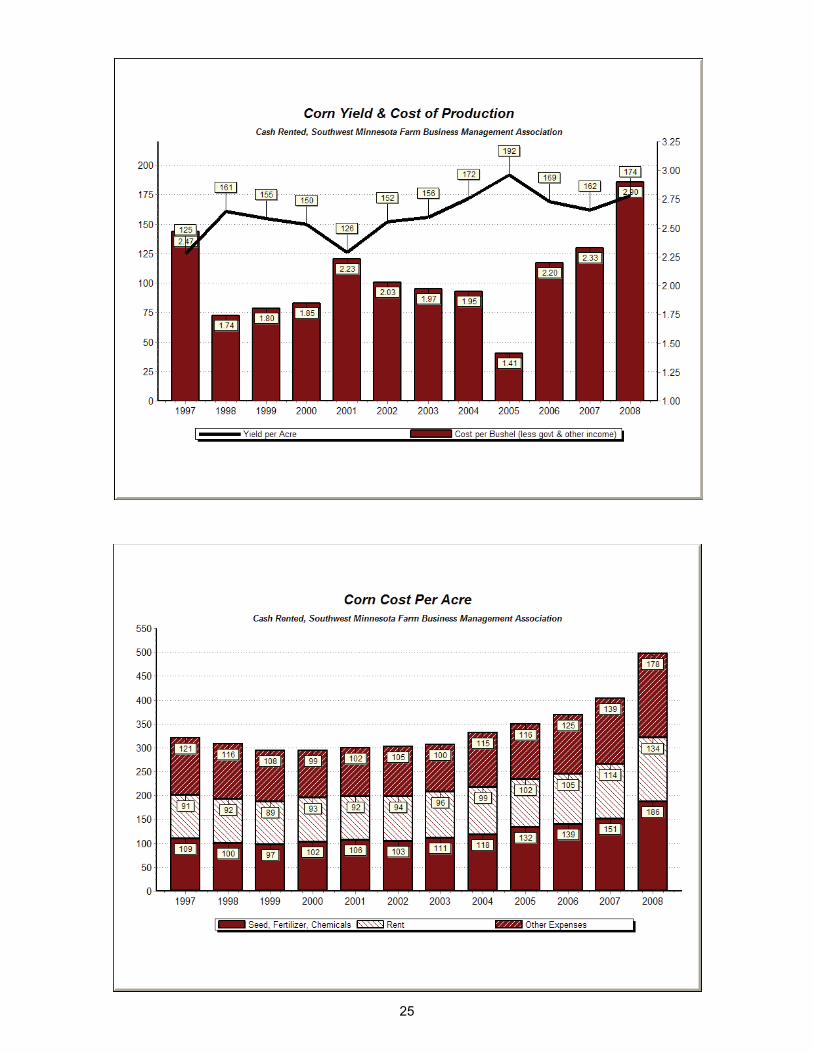
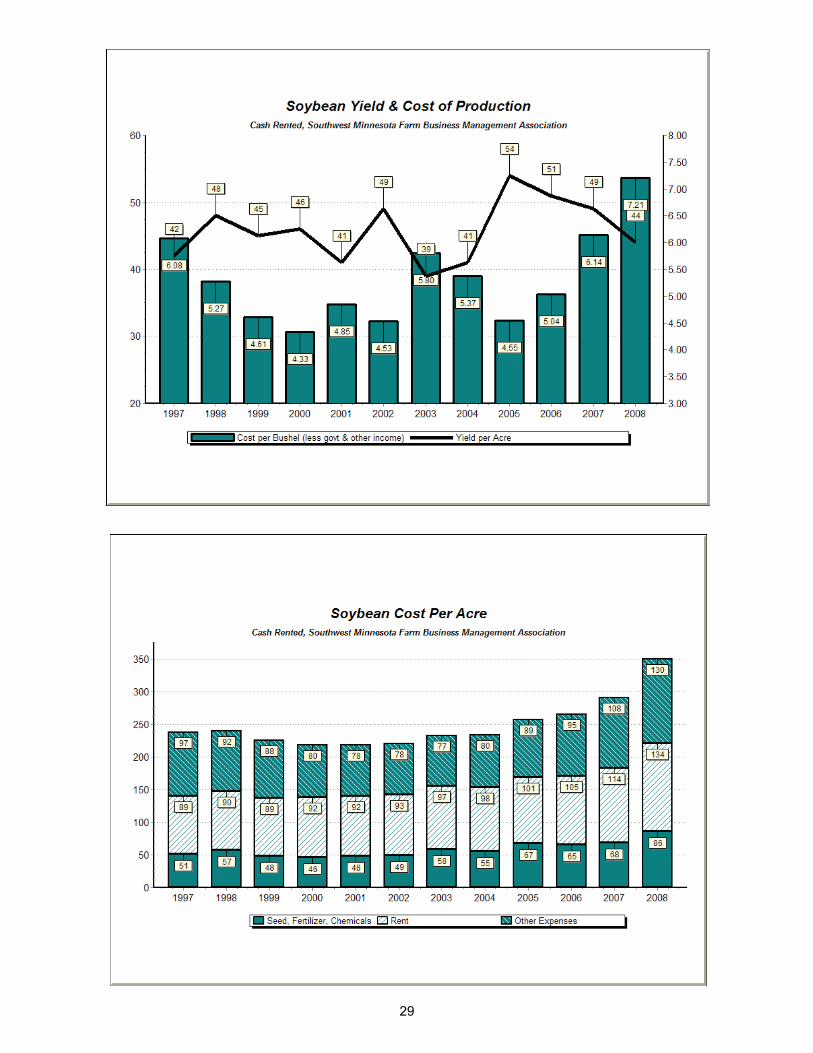
• Corn yields were up but soybean yields were down. Corn averaged 172 bushels per acrecompared to 162 in 2007. Soybeans yields decreased to 44 bushels from 49 in 2007 (Figure 5).
• Both corn and soybean prices received increased by over 50% to $4.51 for corn and $10.83 forsoybeans.
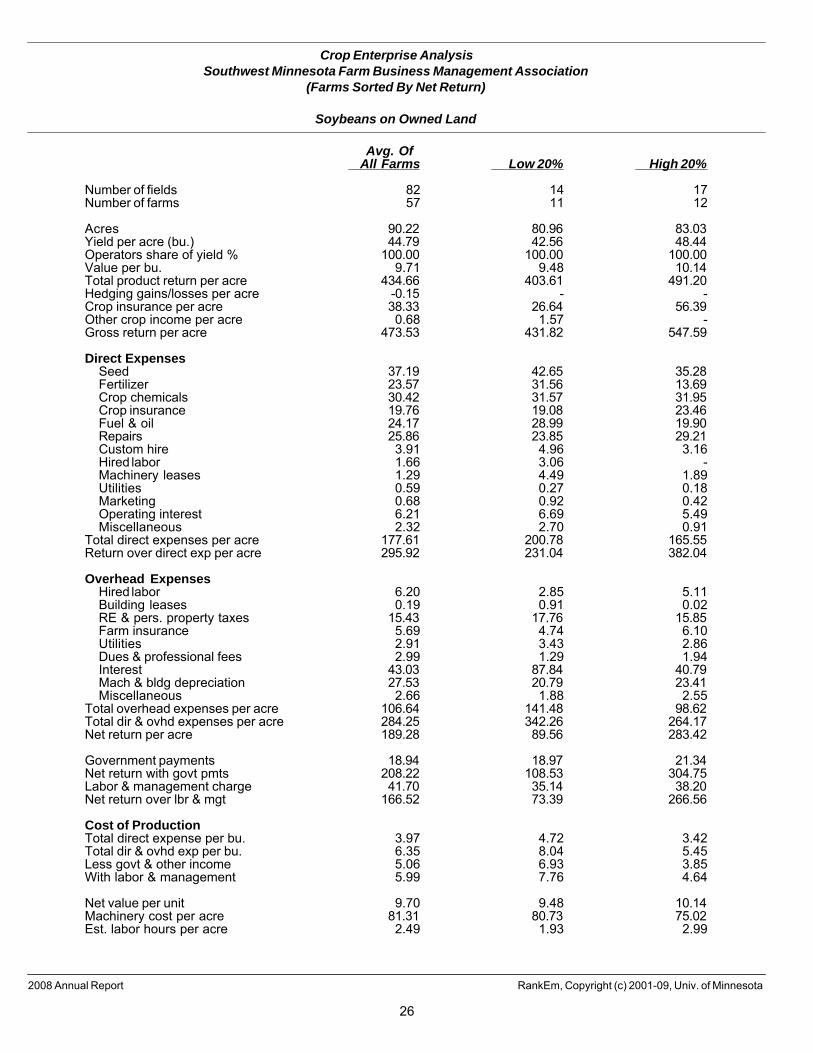
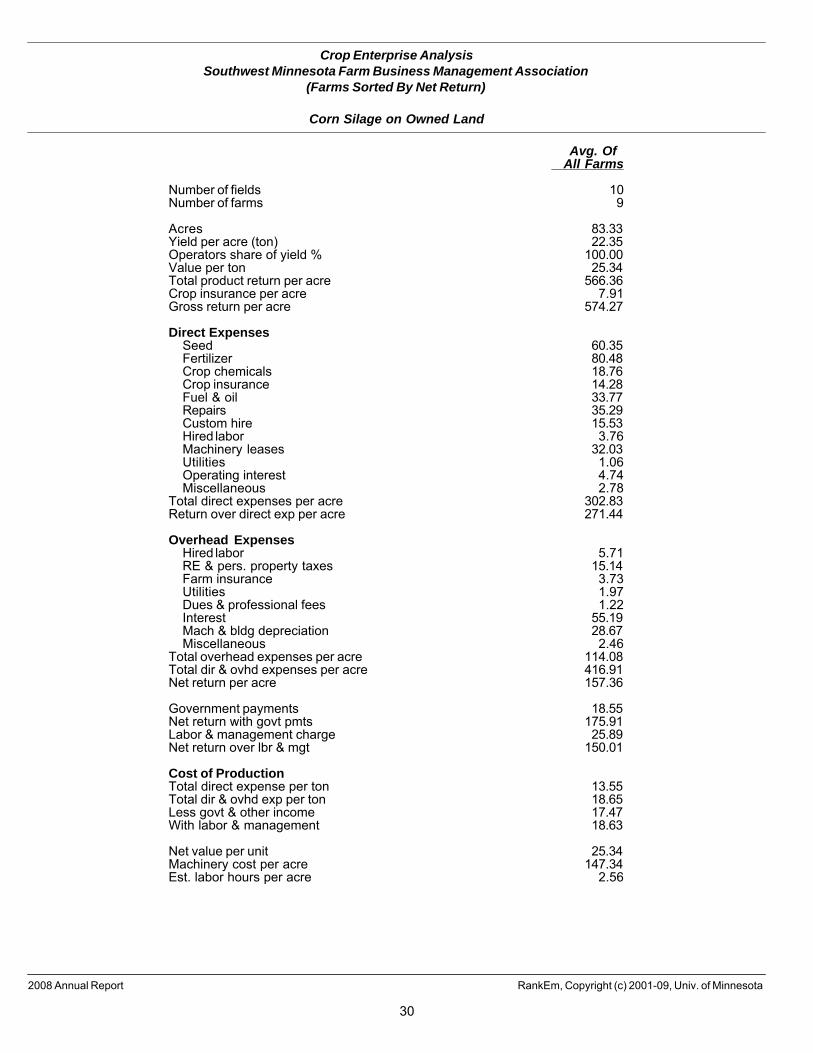
• The cost to raise an acre of corn (with land rent) increased by 23% while soybean costsincreased by 21%. The cost to produce a bushel of corn on cash rented land increased from$2.58 per bushel in 2007 to $2.90 in 2008, while soybean costs per bushel increased from $6.14to $7.21.
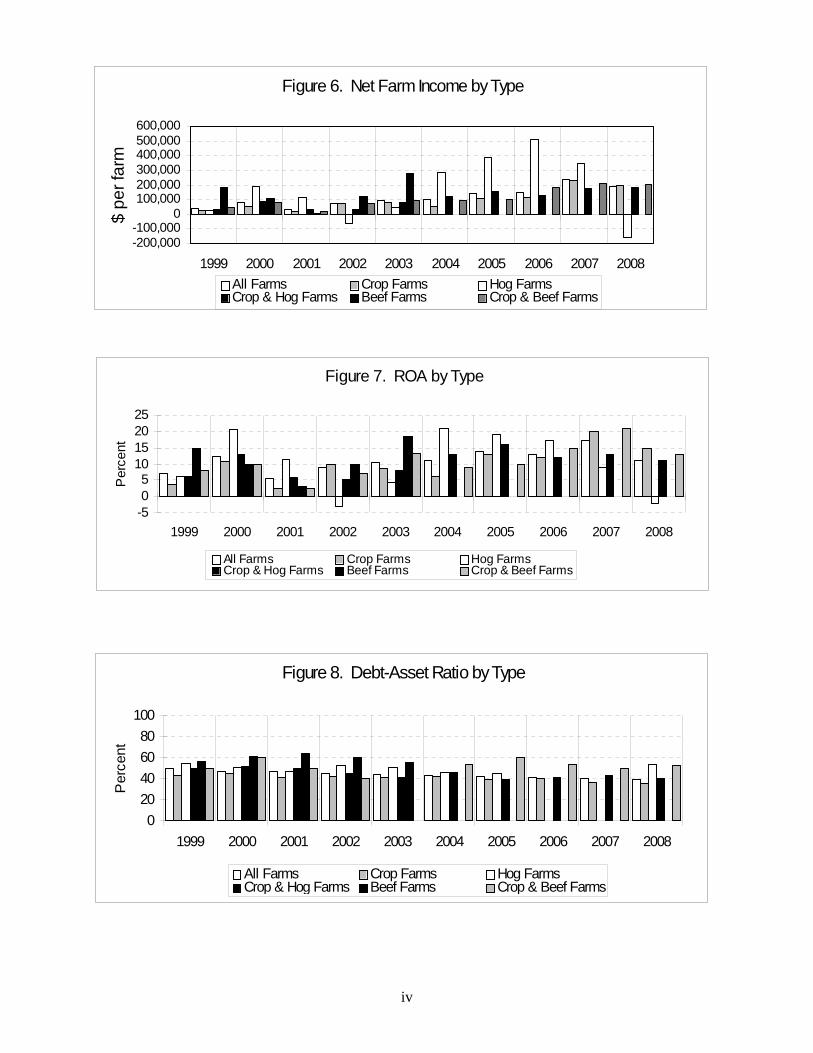
• The average specialized hog operation (those with 70% of sales from hogs or pigs) lost over$150,000 in 2008 (Figure 6). All other farm types with enough farms to report averaged netincomes very close to the association average.
• Based on rate of return on assets, crop farms (those with 70% of sales from crops) were the mostprofitable type of farm in 2008, with an ROA of 14.7% (Figure 7). All other farm types wereprofitable except specialized hog farms, which earned a -2.2% ROA.
iii
-10
0
10
20
30
89 90 91 92 93 94 95 96 97 98 99 00 01 02 03 04 05 06 07 08
Per
cent
ROA ROE
Figure 3. SW Rates of Return on Assets (ROA) and Equity (ROE)
0200,000400,000600,000800,000
1,000,0001,200,0001,400,000
89 90 91 92 93 94 95 96 97 98 99 00 01 02 03 04 05 06 07 08
Dol
lars
per
Far
m
0102030405060708090100
Equity ($) D/A (%)
Figure 4. Ending Equity and Ending Debt-Asset Ratio
Figure 5. Average Corn & Soybean Yield
0255075
100125150175200
89 90 91 92 93 94 95 96 97 98 99 00 01 02 03 04 05 06 07 08
Bus
hels
per
Acr
e
Corn Soybean
iv
Figure 7. ROA by Type
-505
10152025
1999 2000 2001 2002 2003 2004 2005 2006 2007 2008
Per
cent
All Farms Crop Farms Hog FarmsCrop & Hog Farms Beef Farms Crop & Beef Farms
Figure 8. Debt-Asset Ratio by Type
020406080
100
1999 2000 2001 2002 2003 2004 2005 2006 2007 2008
Per
cent
All Farms Crop Farms Hog FarmsCrop & Hog Farms Beef Farms Crop & Beef Farms
Figure 6. Net Farm Income by Type
-200,000-100,000
0100,000200,000300,000400,000500,000600,000
1999 2000 2001 2002 2003 2004 2005 2006 2007 2008
$ pe
r far
m
All Farms Crop Farms Hog FarmsCrop & Hog Farms Beef Farms Crop & Beef Farms
v
• Hog farms, after large losses in 2008, replaced Crop/Beef farms as the type of farm group withthe highest debt to asset ratio at the end of the year (Figure 8).
• The largest farms, those with gross revenue over $1,000,000, were the least profitable based onrate of return on assets. This group earned an average ROA of 7% compared to 14% for farmsthat grossed between $500,000 and $1,000,000.
• With exceptionally high feed prices, no hog or beef enterprise, with the exception of contractgrowing of hogs (where the contractor provided the feed), covered even direct costs ofproduction.
The report provides additional information on profitability, liquidity, and solvency as well as otherwhole-farm information and detailed information on crop and livestock enterprises. Also reportedare whole-farm financial condition and performance by county, sales size class, type of farm, debt-to-asset ratio, and age of operator.

1Nordquist is Extension Economist–Center For Farm Financial Management, University ofMinnesota, Twin Cities; Kurtz is Regional Extension Educator--Farm Management and Fieldmen forthe Association; Paulson, Christensen and Froslan are financial analysts for the Association; RannLoppnow, Software Developer, Center For Farm Financial Management, was the programmer forRankEm Central (the analysis package used to prepare this report).
2008 Annual ReportSouthwestern Minnesota Farm Business Management Association
by
Dale W. Nordquist, James N. Kurtz, Garen J. Paulson, James L. Christensen, and Janet M. Froslan1
This report summarizes the individual farm records of the members of the Southwestern MinnesotaFarm Business Management Association for 2008.
Whole-farm information and enterprise costs and returns are reported. The year-end analysis of theindividual farms was performed by the Association fieldmen using the FINPACK software from theCenter for Farm Financial Management. The individual analyses were summarized at theDepartment of Applied Economics using RankEm Central. In addition to the average of all farms,the averages for the high and low income groups are also presented. The tables are divided into fourmajor groups: whole-farm information, crop enterprises, livestock enterprises, and summaryinformation. The summary information includes whole farm historical trends and information bycounty, farm size, type of farm, debt to asset ratio, and operator age.
Of the 112 farms in the Southwestern Association, the data for 99 farms are included in this report.The rest were omitted because the records were incomplete at the time that this report was prepared.In addition to this report, members receive an annual farm business analysis; on-farm instructionalvisits; end-of-year income tax planning and preparation; periodic meetings, tours, and seminars; amonthly newsletter; and other managerial and educational assistance. Each farmer pays an annualfee which covers the majority of the cost, with the balance defrayed by the Minnesota ExtensionService and research programs of the University of Minnesota.
1
Southwestern Minnesota Farm Business Management Association
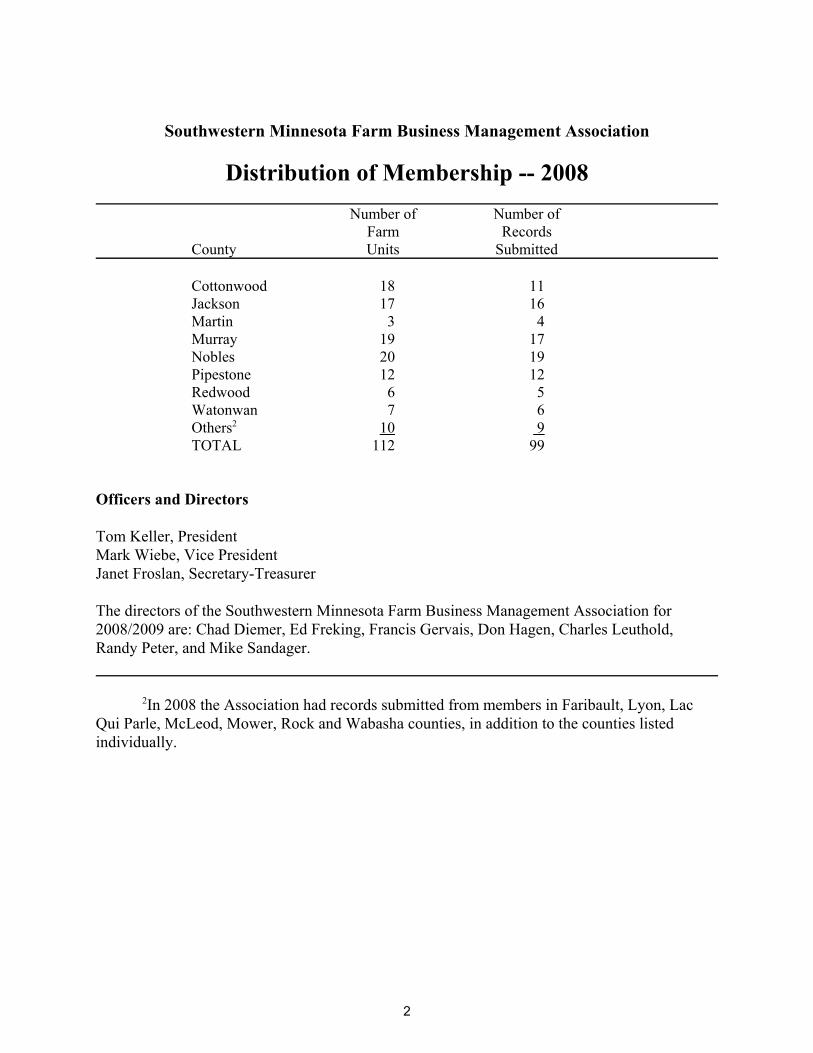
Distribution of Membership -- 2008Number of Number of
Farm RecordsCounty Units Submitted
Cottonwood 18 11Jackson 17 16Martin 3 4Murray 19 17Nobles 20 19Pipestone 12 12Redwood 6 5Watonwan 7 6Others2 10 9TOTAL 112 99
Officers and Directors
Tom Keller, PresidentMark Wiebe, Vice PresidentJanet Froslan, Secretary-Treasurer
The directors of the Southwestern Minnesota Farm Business Management Association for2008/2009 are: Chad Diemer, Ed Freking, Francis Gervais, Don Hagen, Charles Leuthold, Randy Peter, and Mike Sandager.
2In 2008 the Association had records submitted from members in Faribault, Lyon, LacQui Parle, McLeod, Mower, Rock and Wabasha counties, in addition to the counties listedindividually.
2
Southwestern Minnesota Farm Business Management Association
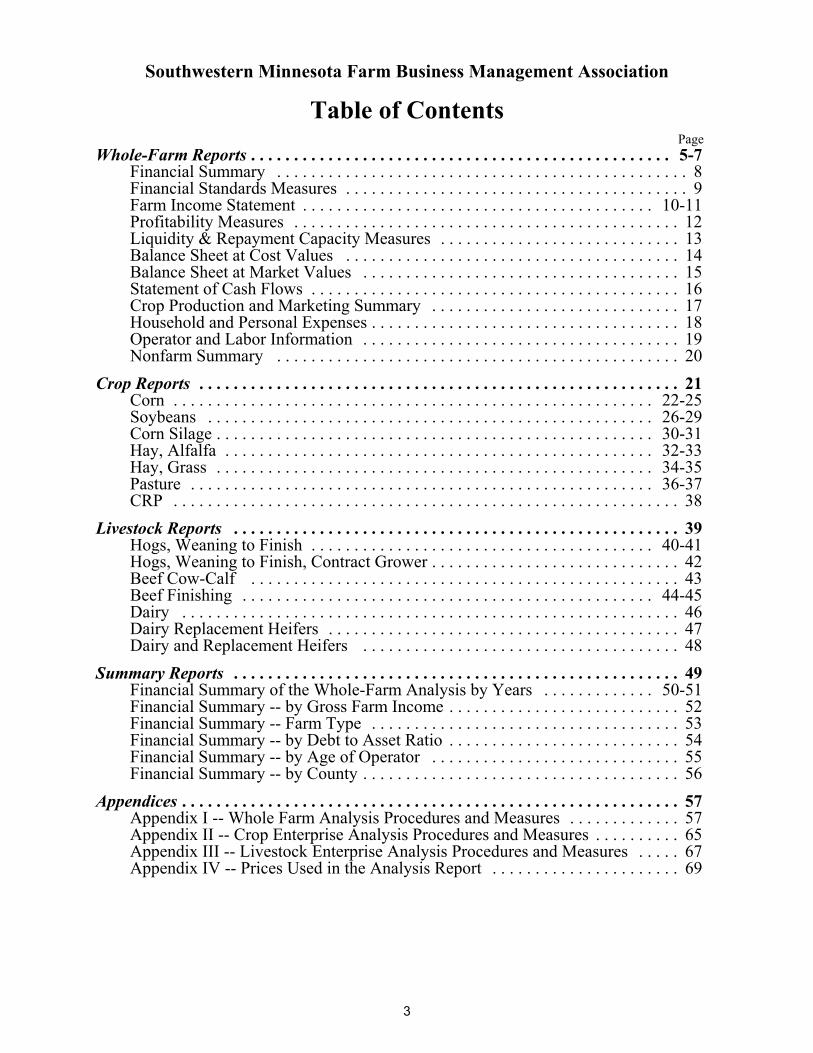
Table of ContentsPage
Whole-Farm Reports . . . . . . . . . . . . . . . . . . . . . . . . . . . . . . . . . . . . . . . . . . . . . . . . . 5-7 Financial Summary . . . . . . . . . . . . . . . . . . . . . . . . . . . . . . . . . . . . . . . . . . . . . . . . 8 Financial Standards Measures . . . . . . . . . . . . . . . . . . . . . . . . . . . . . . . . . . . . . . . . 9 Farm Income Statement . . . . . . . . . . . . . . . . . . . . . . . . . . . . . . . . . . . . . . . . . 10-11 Profitability Measures . . . . . . . . . . . . . . . . . . . . . . . . . . . . . . . . . . . . . . . . . . . . . 12 Liquidity & Repayment Capacity Measures . . . . . . . . . . . . . . . . . . . . . . . . . . . . 13 Balance Sheet at Cost Values . . . . . . . . . . . . . . . . . . . . . . . . . . . . . . . . . . . . . . . 14 Balance Sheet at Market Values . . . . . . . . . . . . . . . . . . . . . . . . . . . . . . . . . . . . . 15 Statement of Cash Flows . . . . . . . . . . . . . . . . . . . . . . . . . . . . . . . . . . . . . . . . . . . 16 Crop Production and Marketing Summary . . . . . . . . . . . . . . . . . . . . . . . . . . . . . 17 Household and Personal Expenses . . . . . . . . . . . . . . . . . . . . . . . . . . . . . . . . . . . . 18 Operator and Labor Information . . . . . . . . . . . . . . . . . . . . . . . . . . . . . . . . . . . . . 19 Nonfarm Summary . . . . . . . . . . . . . . . . . . . . . . . . . . . . . . . . . . . . . . . . . . . . . . . 20
Crop Reports . . . . . . . . . . . . . . . . . . . . . . . . . . . . . . . . . . . . . . . . . . . . . . . . . . . . . . . . 21 Corn . . . . . . . . . . . . . . . . . . . . . . . . . . . . . . . . . . . . . . . . . . . . . . . . . . . . . . . . 22-25 Soybeans . . . . . . . . . . . . . . . . . . . . . . . . . . . . . . . . . . . . . . . . . . . . . . . . . . . . 26-29 Corn Silage . . . . . . . . . . . . . . . . . . . . . . . . . . . . . . . . . . . . . . . . . . . . . . . . . . . 30-31 Hay, Alfalfa . . . . . . . . . . . . . . . . . . . . . . . . . . . . . . . . . . . . . . . . . . . . . . . . . . 32-33 Hay, Grass . . . . . . . . . . . . . . . . . . . . . . . . . . . . . . . . . . . . . . . . . . . . . . . . . . . 34-35 Pasture . . . . . . . . . . . . . . . . . . . . . . . . . . . . . . . . . . . . . . . . . . . . . . . . . . . . . . 36-37 CRP . . . . . . . . . . . . . . . . . . . . . . . . . . . . . . . . . . . . . . . . . . . . . . . . . . . . . . . . . . . 38
Livestock Reports . . . . . . . . . . . . . . . . . . . . . . . . . . . . . . . . . . . . . . . . . . . . . . . . . . . . 39 Hogs, Weaning to Finish . . . . . . . . . . . . . . . . . . . . . . . . . . . . . . . . . . . . . . . . 40-41 Hogs, Weaning to Finish, Contract Grower . . . . . . . . . . . . . . . . . . . . . . . . . . . . . 42 Beef Cow-Calf . . . . . . . . . . . . . . . . . . . . . . . . . . . . . . . . . . . . . . . . . . . . . . . . . . 43 Beef Finishing . . . . . . . . . . . . . . . . . . . . . . . . . . . . . . . . . . . . . . . . . . . . . . . . 44-45 Dairy . . . . . . . . . . . . . . . . . . . . . . . . . . . . . . . . . . . . . . . . . . . . . . . . . . . . . . . . . . 46 Dairy Replacement Heifers . . . . . . . . . . . . . . . . . . . . . . . . . . . . . . . . . . . . . . . . . 47 Dairy and Replacement Heifers . . . . . . . . . . . . . . . . . . . . . . . . . . . . . . . . . . . . . 48
Summary Reports . . . . . . . . . . . . . . . . . . . . . . . . . . . . . . . . . . . . . . . . . . . . . . . . . . . . 49 Financial Summary of the Whole-Farm Analysis by Years . . . . . . . . . . . . . 50-51 Financial Summary -- by Gross Farm Income . . . . . . . . . . . . . . . . . . . . . . . . . . . 52 Financial Summary -- Farm Type . . . . . . . . . . . . . . . . . . . . . . . . . . . . . . . . . . . . 53 Financial Summary -- by Debt to Asset Ratio . . . . . . . . . . . . . . . . . . . . . . . . . . . 54 Financial Summary -- by Age of Operator . . . . . . . . . . . . . . . . . . . . . . . . . . . . . 55 Financial Summary -- by County . . . . . . . . . . . . . . . . . . . . . . . . . . . . . . . . . . . . . 56
Appendices . . . . . . . . . . . . . . . . . . . . . . . . . . . . . . . . . . . . . . . . . . . . . . . . . . . . . . . . . . 57 Appendix I -- Whole Farm Analysis Procedures and Measures . . . . . . . . . . . . . 57 Appendix II -- Crop Enterprise Analysis Procedures and Measures . . . . . . . . . . 65 Appendix III -- Livestock Enterprise Analysis Procedures and Measures . . . . . 67 Appendix IV -- Prices Used in the Analysis Report . . . . . . . . . . . . . . . . . . . . . . 69
3

4
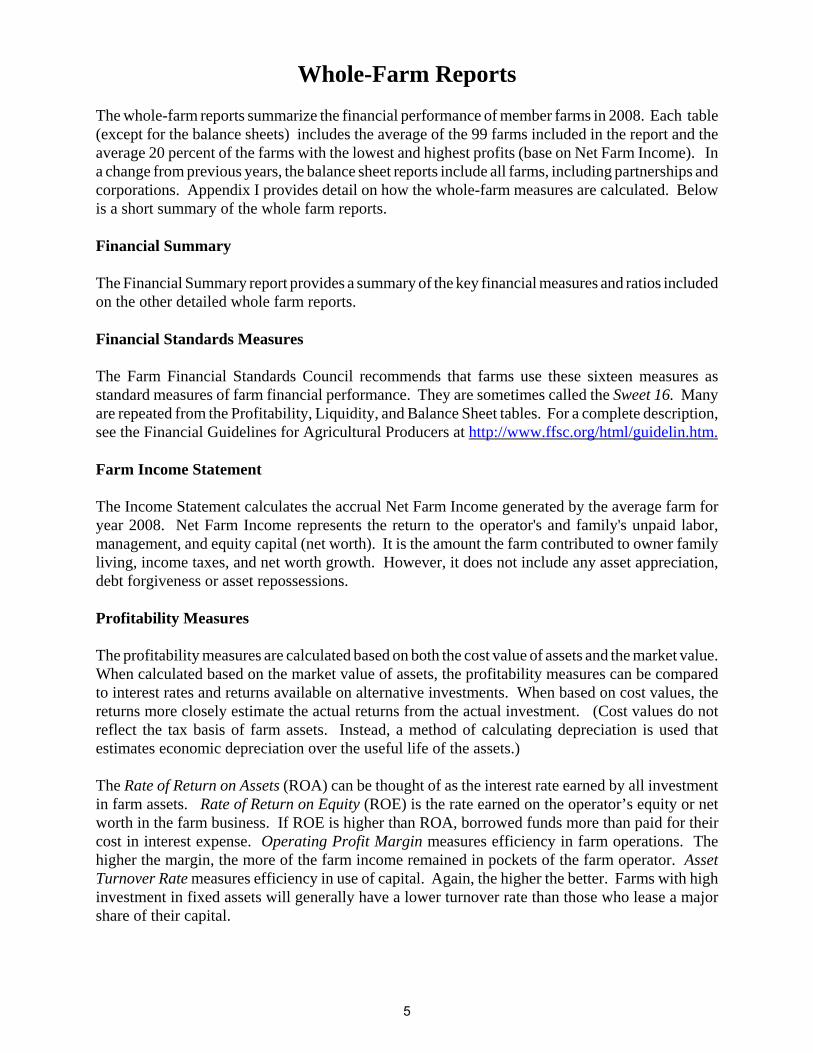
Whole-Farm ReportsThe whole-farm reports summarize the financial performance of member farms in 2008. Each table(except for the balance sheets) includes the average of the 99 farms included in the report and theaverage 20 percent of the farms with the lowest and highest profits (base on Net Farm Income). Ina change from previous years, the balance sheet reports include all farms, including partnerships andcorporations. Appendix I provides detail on how the whole-farm measures are calculated. Belowis a short summary of the whole farm reports.
Financial Summary
The Financial Summary report provides a summary of the key financial measures and ratios includedon the other detailed whole farm reports.
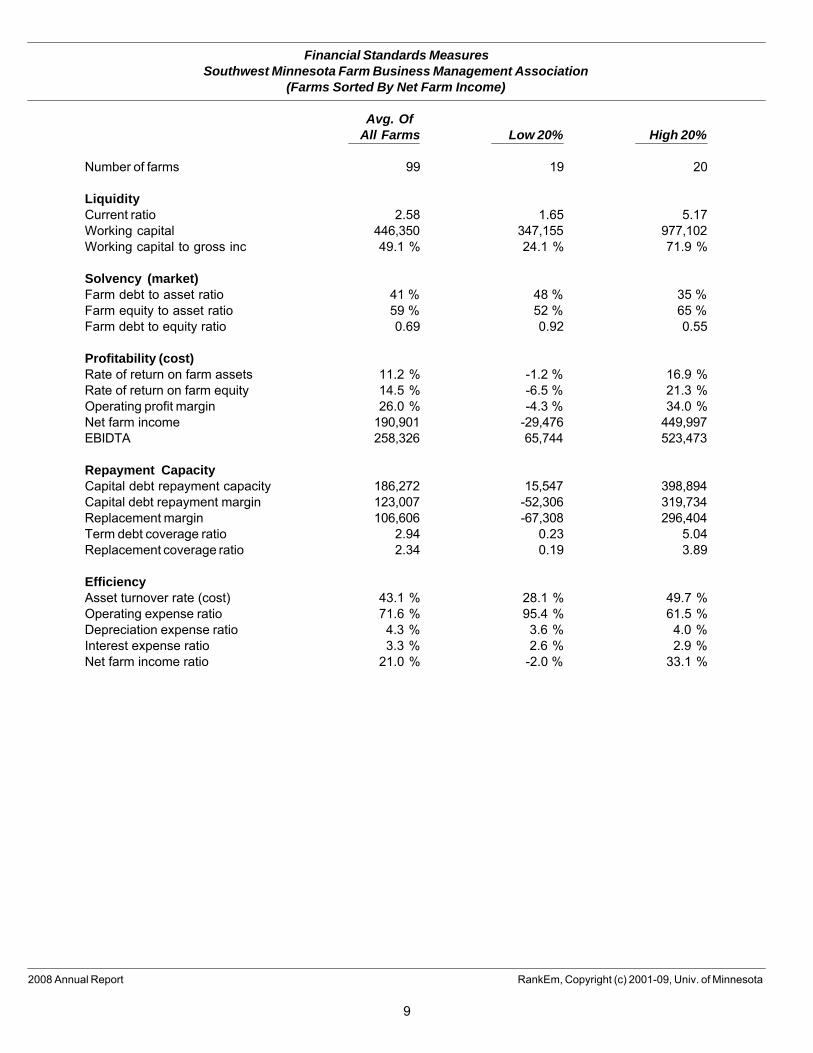
Financial Standards Measures
The Farm Financial Standards Council recommends that farms use these sixteen measures asstandard measures of farm financial performance. They are sometimes called the Sweet 16. Manyare repeated from the Profitability, Liquidity, and Balance Sheet tables. For a complete description,see the Financial Guidelines for Agricultural Producers at http://www.ffsc.org/html/guidelin.htm.
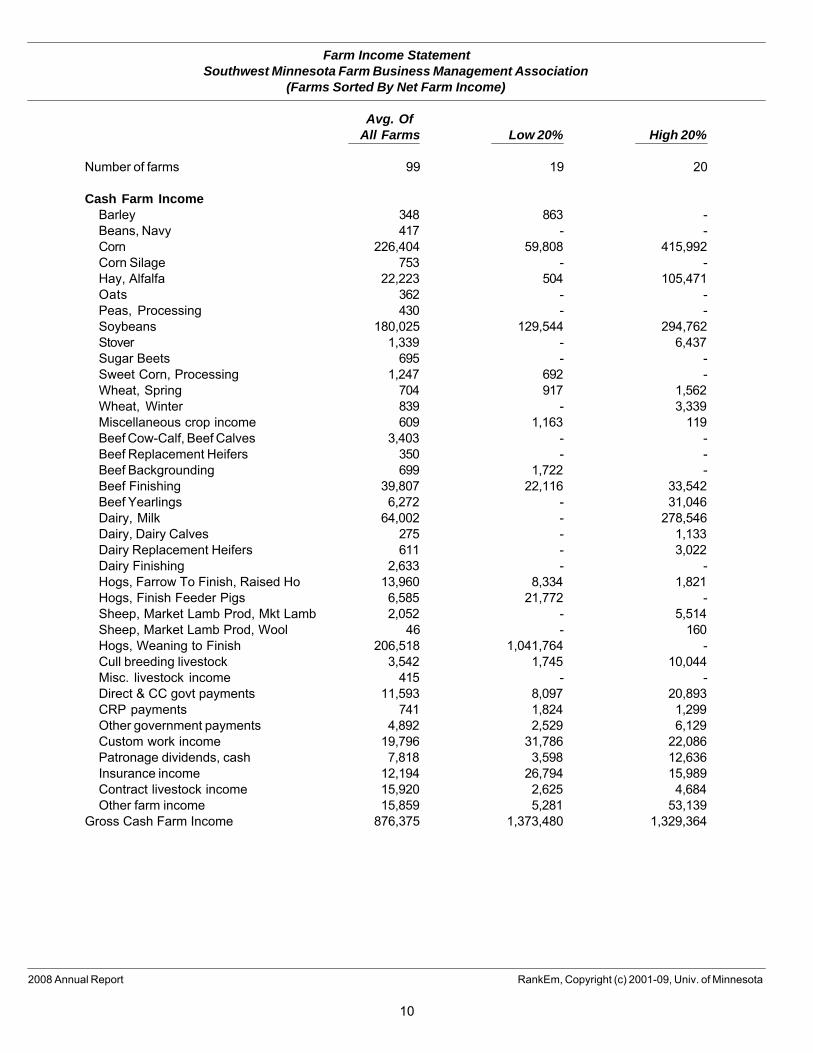
Farm Income Statement
The Income Statement calculates the accrual Net Farm Income generated by the average farm foryear 2008. Net Farm Income represents the return to the operator's and family's unpaid labor,management, and equity capital (net worth). It is the amount the farm contributed to owner familyliving, income taxes, and net worth growth. However, it does not include any asset appreciation,debt forgiveness or asset repossessions.
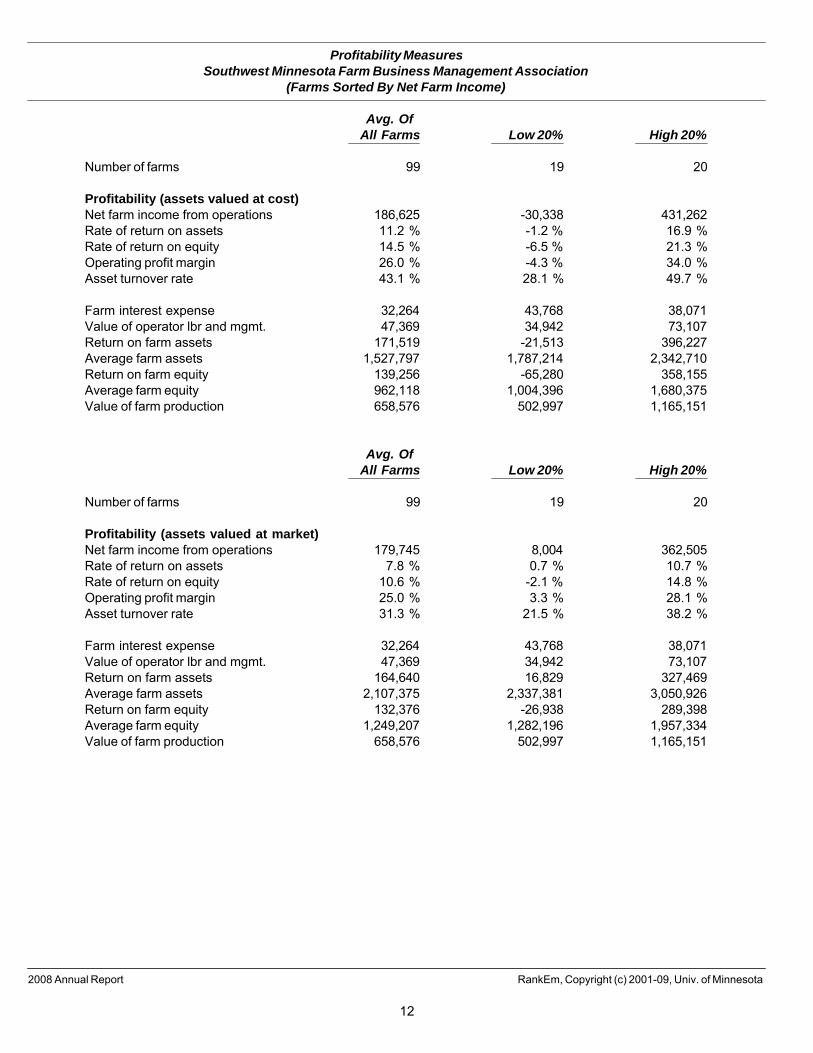
Profitability Measures
The profitability measures are calculated based on both the cost value of assets and the market value.When calculated based on the market value of assets, the profitability measures can be comparedto interest rates and returns available on alternative investments. When based on cost values, thereturns more closely estimate the actual returns from the actual investment. (Cost values do notreflect the tax basis of farm assets. Instead, a method of calculating depreciation is used thatestimates economic depreciation over the useful life of the assets.)
The Rate of Return on Assets (ROA) can be thought of as the interest rate earned by all investmentin farm assets. Rate of Return on Equity (ROE) is the rate earned on the operator’s equity or networth in the farm business. If ROE is higher than ROA, borrowed funds more than paid for theircost in interest expense. Operating Profit Margin measures efficiency in farm operations. Thehigher the margin, the more of the farm income remained in pockets of the farm operator. AssetTurnover Rate measures efficiency in use of capital. Again, the higher the better. Farms with highinvestment in fixed assets will generally have a lower turnover rate than those who lease a majorshare of their capital.
5
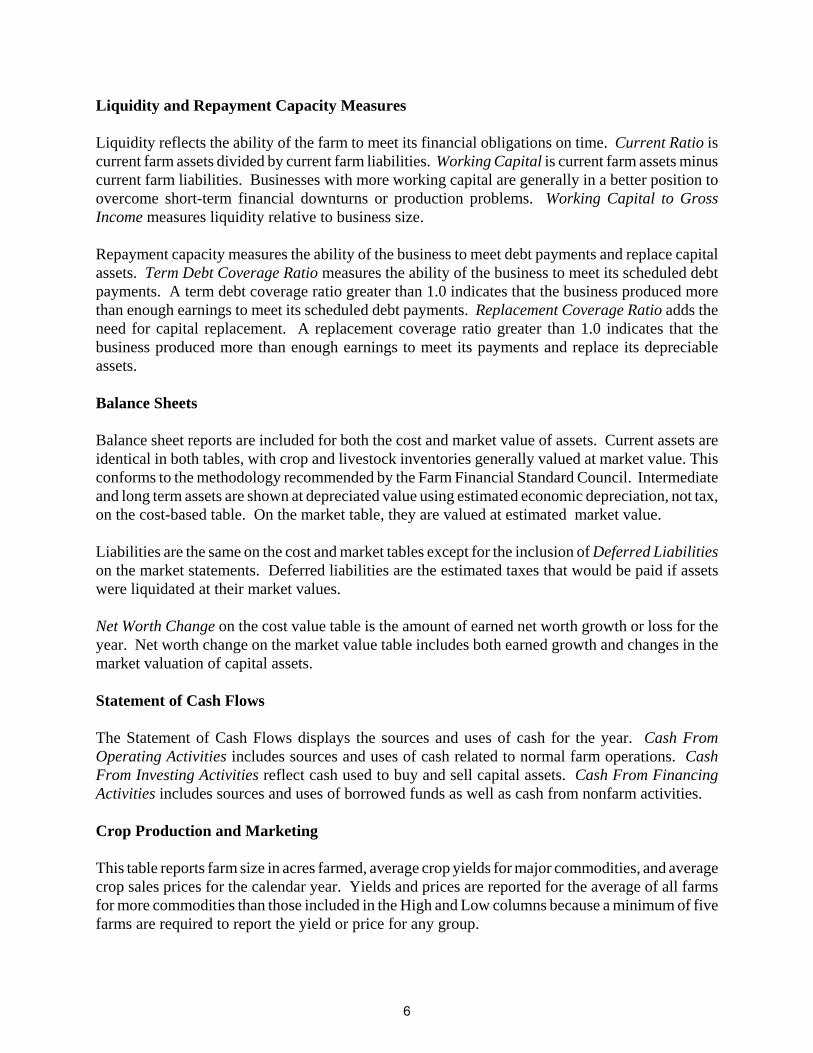
Liquidity and Repayment Capacity Measures
Liquidity reflects the ability of the farm to meet its financial obligations on time. Current Ratio iscurrent farm assets divided by current farm liabilities. Working Capital is current farm assets minuscurrent farm liabilities. Businesses with more working capital are generally in a better position toovercome short-term financial downturns or production problems. Working Capital to GrossIncome measures liquidity relative to business size.
Repayment capacity measures the ability of the business to meet debt payments and replace capitalassets. Term Debt Coverage Ratio measures the ability of the business to meet its scheduled debtpayments. A term debt coverage ratio greater than 1.0 indicates that the business produced morethan enough earnings to meet its scheduled debt payments. Replacement Coverage Ratio adds theneed for capital replacement. A replacement coverage ratio greater than 1.0 indicates that thebusiness produced more than enough earnings to meet its payments and replace its depreciableassets.
Balance Sheets
Balance sheet reports are included for both the cost and market value of assets. Current assets areidentical in both tables, with crop and livestock inventories generally valued at market value. Thisconforms to the methodology recommended by the Farm Financial Standard Council. Intermediateand long term assets are shown at depreciated value using estimated economic depreciation, not tax,on the cost-based table. On the market table, they are valued at estimated market value.
Liabilities are the same on the cost and market tables except for the inclusion of Deferred Liabilitieson the market statements. Deferred liabilities are the estimated taxes that would be paid if assetswere liquidated at their market values.
Net Worth Change on the cost value table is the amount of earned net worth growth or loss for theyear. Net worth change on the market value table includes both earned growth and changes in themarket valuation of capital assets.
Statement of Cash Flows
The Statement of Cash Flows displays the sources and uses of cash for the year. Cash FromOperating Activities includes sources and uses of cash related to normal farm operations. CashFrom Investing Activities reflect cash used to buy and sell capital assets. Cash From FinancingActivities includes sources and uses of borrowed funds as well as cash from nonfarm activities.
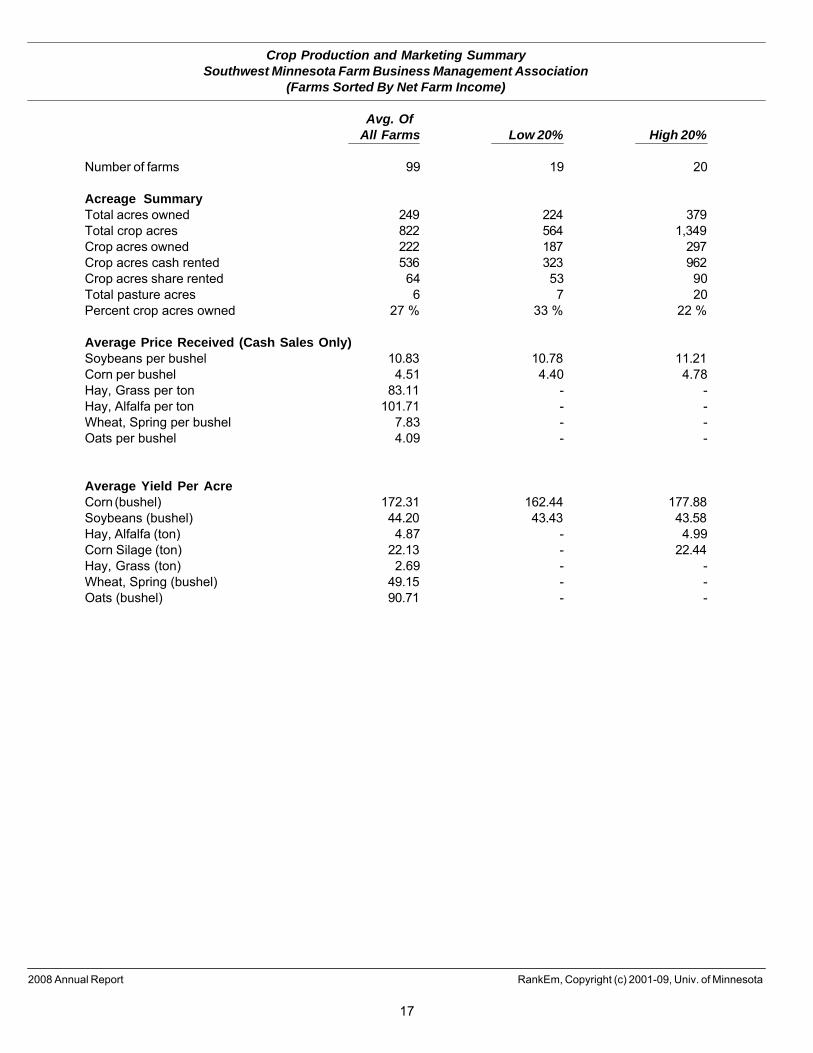
Crop Production and Marketing
This table reports farm size in acres farmed, average crop yields for major commodities, and averagecrop sales prices for the calendar year. Yields and prices are reported for the average of all farmsfor more commodities than those included in the High and Low columns because a minimum of fivefarms are required to report the yield or price for any group.
6
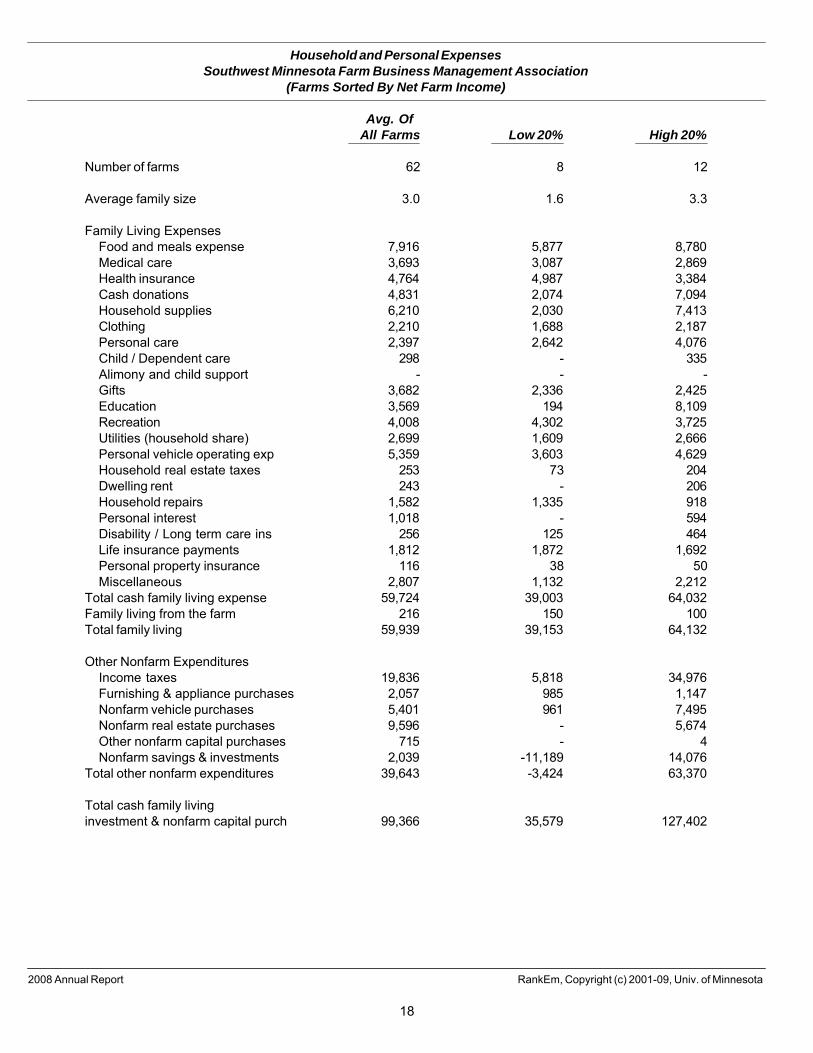
Household and Personal Expenses
This table reports family living and other non-farm expenditures. Only sole proprietors who keepdetailed family living records are included.
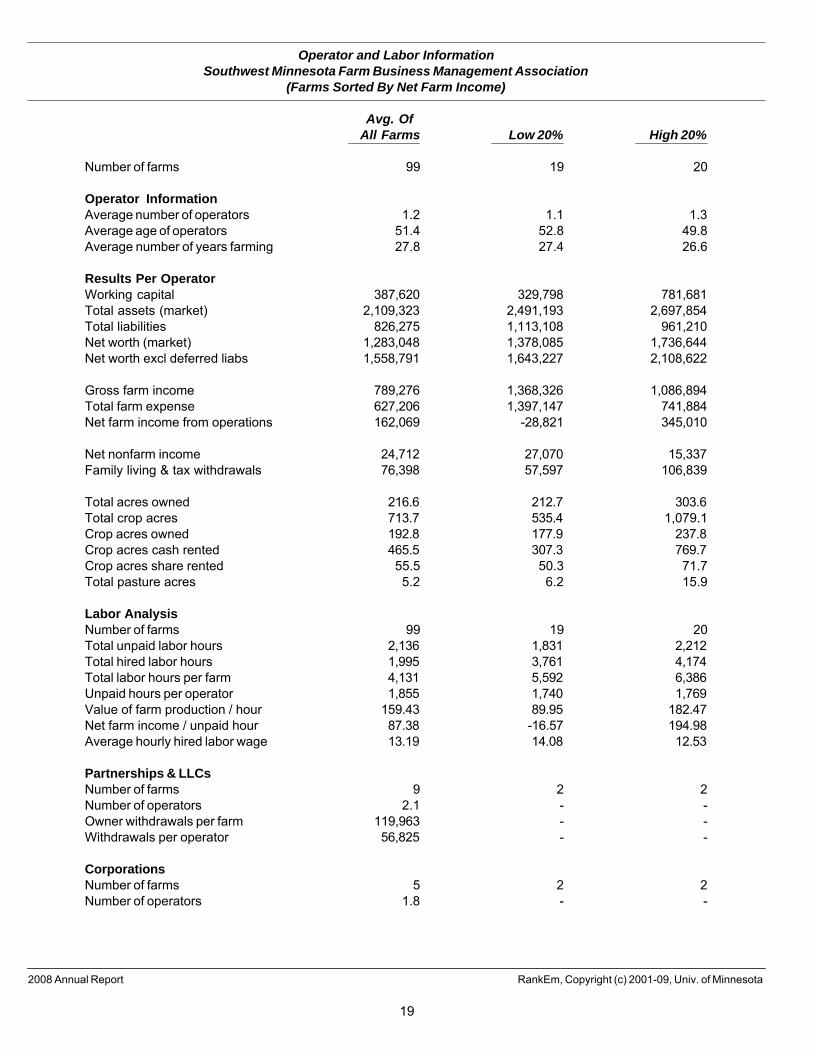
Operator and Labor Information
All previous tables report results per farm, regardless of the number of families or operatorsinvolved in the operation. This report repeats several measures from previous tables on a PerOperator basis. It also summarizes estimated labor hours used and labor performance.
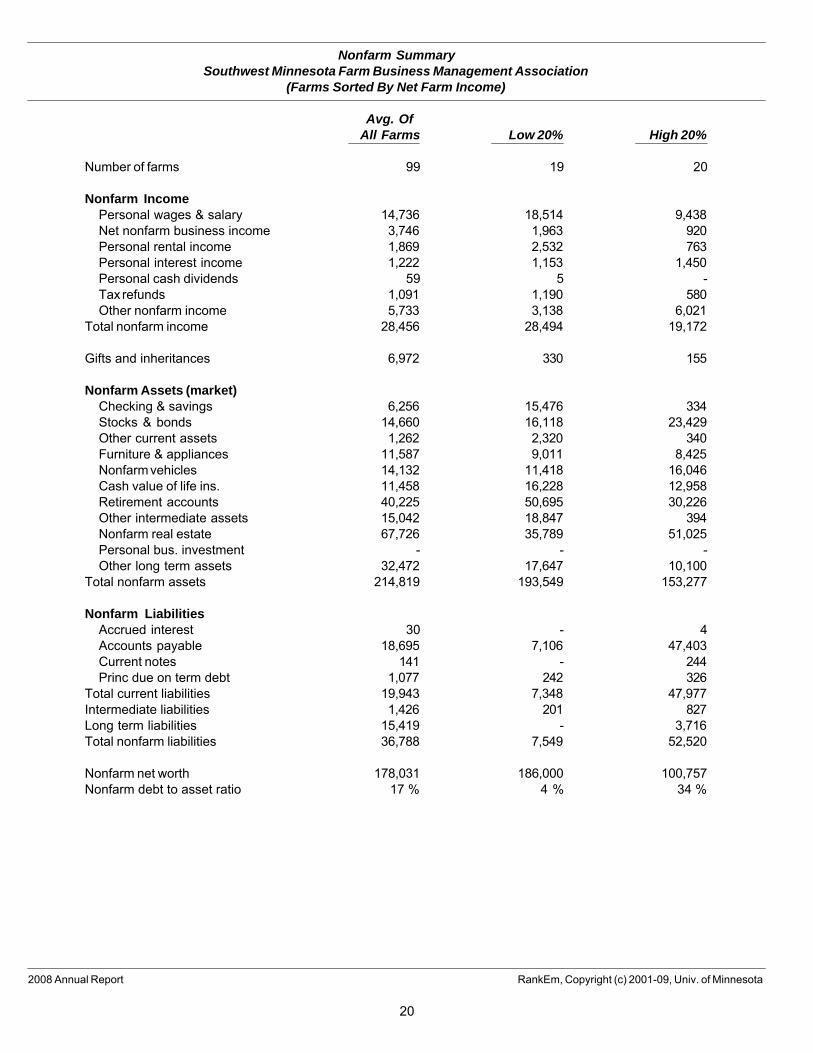
Nonfarm Summary
This table summarizes nonfarm earnings for the average farm and details nonfarm assets andliabilities.
7
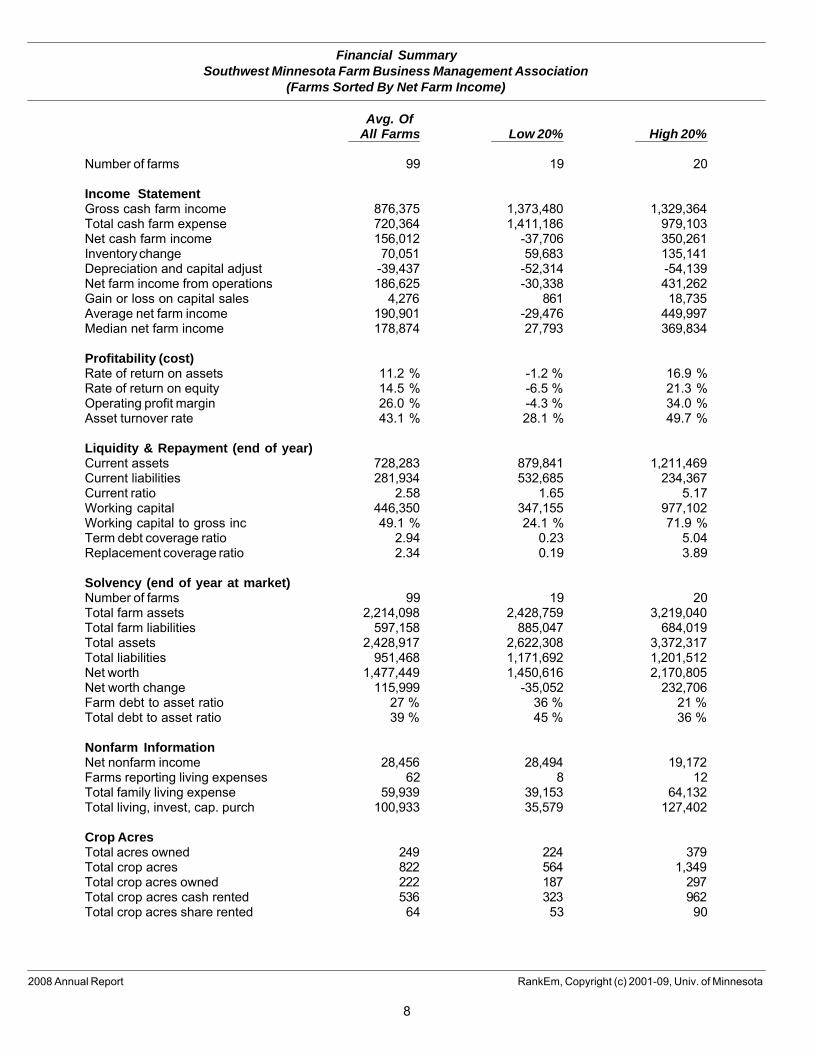
Financial SummarySouthwest Minnesota Farm Business Management Association
(Farms Sorted By Net Farm Income)
Avg. OfAll Farms Low 20% High 20%
Number of farms 99 19 20
Income StatementGross cash farm income 876,375 1,373,480 1,329,364Total cash farm expense 720,364 1,411,186 979,103Net cash farm income 156,012 -37,706 350,261Inventory change 70,051 59,683 135,141Depreciation and capital adjust -39,437 -52,314 -54,139Net farm income from operations 186,625 -30,338 431,262Gain or loss on capital sales 4,276 861 18,735Average net farm income 190,901 -29,476 449,997Median net farm income 178,874 27,793 369,834
Profitability (cost)Rate of return on assets 11.2 % -1.2 % 16.9 %Rate of return on equity 14.5 % -6.5 % 21.3 %Operating profit margin 26.0 % -4.3 % 34.0 %Asset turnover rate 43.1 % 28.1 % 49.7 %
Liquidity & Repayment (end of year)Current assets 728,283 879,841 1,211,469Current liabilities 281,934 532,685 234,367Current ratio 2.58 1.65 5.17Working capital 446,350 347,155 977,102Working capital to gross inc 49.1 % 24.1 % 71.9 %Term debt coverage ratio 2.94 0.23 5.04Replacement coverage ratio 2.34 0.19 3.89
Solvency (end of year at market)Number of farms 99 19 20Total farm assets 2,214,098 2,428,759 3,219,040Total farm liabilities 597,158 885,047 684,019Total assets 2,428,917 2,622,308 3,372,317Total liabilities 951,468 1,171,692 1,201,512Net worth 1,477,449 1,450,616 2,170,805Net worth change 115,999 -35,052 232,706Farm debt to asset ratio 27 % 36 % 21 %Total debt to asset ratio 39 % 45 % 36 %
Nonfarm InformationNet nonfarm income 28,456 28,494 19,172Farms reporting living expenses 62 8 12Total family living expense 59,939 39,153 64,132Total living, invest, cap. purch 100,933 35,579 127,402
Crop AcresTotal acres owned 249 224 379Total crop acres 822 564 1,349Total crop acres owned 222 187 297Total crop acres cash rented 536 323 962Total crop acres share rented 64 53 90
2008 Annual Report RankEm, Copyright (c) 2001-09, Univ. of Minnesota
8
Financial Standards MeasuresSouthwest Minnesota Farm Business Management Association
(Farms Sorted By Net Farm Income)
Avg. OfAll Farms Low 20% High 20%
Number of farms 99 19 20
LiquidityCurrent ratio 2.58 1.65 5.17Working capital 446,350 347,155 977,102Working capital to gross inc 49.1 % 24.1 % 71.9 %
Solvency (market)Farm debt to asset ratio 41 % 48 % 35 %Farm equity to asset ratio 59 % 52 % 65 %Farm debt to equity ratio 0.69 0.92 0.55
Profitability (cost)Rate of return on farm assets 11.2 % -1.2 % 16.9 %Rate of return on farm equity 14.5 % -6.5 % 21.3 %Operating profit margin 26.0 % -4.3 % 34.0 %Net farm income 190,901 -29,476 449,997EBIDTA 258,326 65,744 523,473
Repayment CapacityCapital debt repayment capacity 186,272 15,547 398,894Capital debt repayment margin 123,007 -52,306 319,734Replacement margin 106,606 -67,308 296,404Term debt coverage ratio 2.94 0.23 5.04Replacement coverage ratio 2.34 0.19 3.89
EfficiencyAsset turnover rate (cost) 43.1 % 28.1 % 49.7 %Operating expense ratio 71.6 % 95.4 % 61.5 %Depreciation expense ratio 4.3 % 3.6 % 4.0 %Interest expense ratio 3.3 % 2.6 % 2.9 %Net farm income ratio 21.0 % -2.0 % 33.1 %
2008 Annual Report RankEm, Copyright (c) 2001-09, Univ. of Minnesota
9
Farm Income StatementSouthwest Minnesota Farm Business Management Association
(Farms Sorted By Net Farm Income)
Avg. OfAll Farms Low 20% High 20%
Number of farms 99 19 20
Cash Farm IncomeBarley 348 863 -Beans, Navy 417 - -Corn 226,404 59,808 415,992Corn Silage 753 - -Hay, Alfalfa 22,223 504 105,471Oats 362 - -Peas, Processing 430 - -Soybeans 180,025 129,544 294,762Stover 1,339 - 6,437Sugar Beets 695 - -Sweet Corn, Processing 1,247 692 -Wheat, Spring 704 917 1,562Wheat, Winter 839 - 3,339Miscellaneous crop income 609 1,163 119Beef Cow-Calf, Beef Calves 3,403 - -Beef Replacement Heifers 350 - -Beef Backgrounding 699 1,722 -Beef Finishing 39,807 22,116 33,542Beef Yearlings 6,272 - 31,046Dairy, Milk 64,002 - 278,546Dairy, Dairy Calves 275 - 1,133Dairy Replacement Heifers 611 - 3,022Dairy Finishing 2,633 - -Hogs, Farrow To Finish, Raised Ho 13,960 8,334 1,821Hogs, Finish Feeder Pigs 6,585 21,772 -Sheep, Market Lamb Prod, Mkt Lamb 2,052 - 5,514Sheep, Market Lamb Prod, Wool 46 - 160Hogs, Weaning to Finish 206,518 1,041,764 -Cull breeding livestock 3,542 1,745 10,044Misc. livestock income 415 - -Direct & CC govt payments 11,593 8,097 20,893CRP payments 741 1,824 1,299Other government payments 4,892 2,529 6,129Custom work income 19,796 31,786 22,086Patronage dividends, cash 7,818 3,598 12,636Insurance income 12,194 26,794 15,989Contract livestock income 15,920 2,625 4,684Other farm income 15,859 5,281 53,139
Gross Cash Farm Income 876,375 1,373,480 1,329,364
2008 Annual Report RankEm, Copyright (c) 2001-09, Univ. of Minnesota
10
Farm Income Statement (Continued)Southwest Minnesota Farm Business Management Association
(Farms Sorted By Net Farm Income)
Avg. OfAll Farms Low 20% High 20%
Number of farms 99 19 20
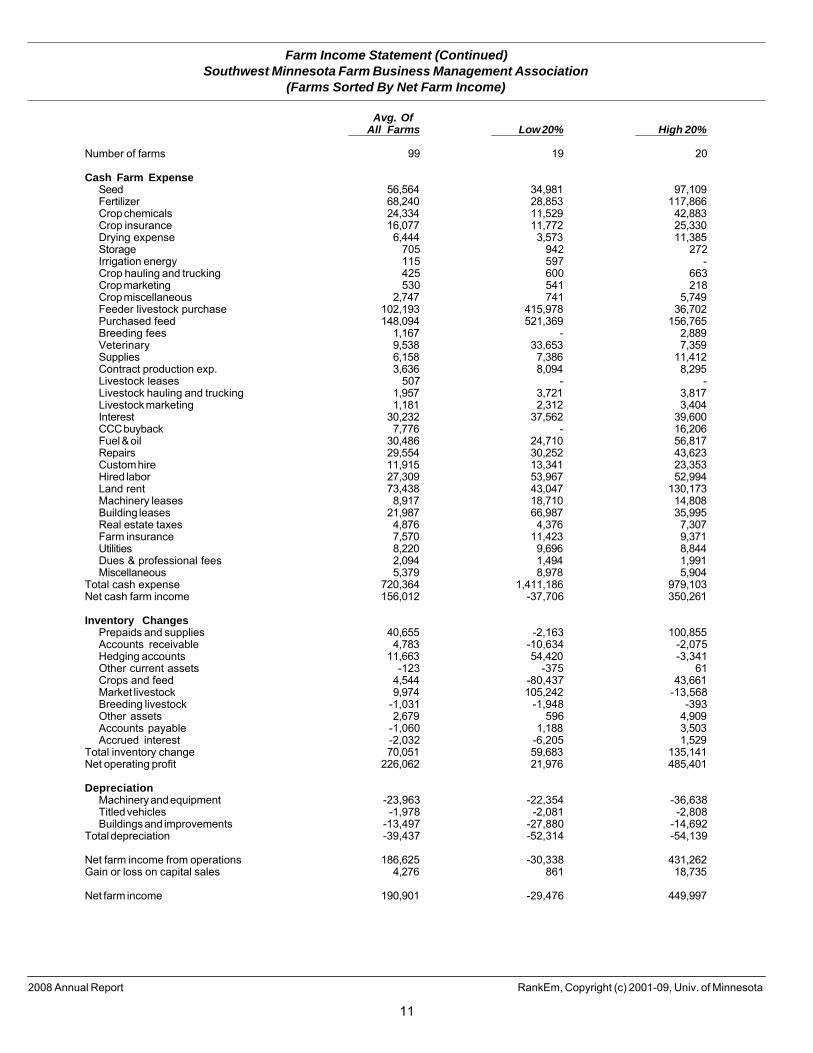
Cash Farm ExpenseSeed 56,564 34,981 97,109Fertilizer 68,240 28,853 117,866Crop chemicals 24,334 11,529 42,883Crop insurance 16,077 11,772 25,330Drying expense 6,444 3,573 11,385Storage 705 942 272Irrigation energy 115 597 -Crop hauling and trucking 425 600 663Crop marketing 530 541 218Crop miscellaneous 2,747 741 5,749Feeder livestock purchase 102,193 415,978 36,702Purchased feed 148,094 521,369 156,765Breeding fees 1,167 - 2,889Veterinary 9,538 33,653 7,359Supplies 6,158 7,386 11,412Contract production exp. 3,636 8,094 8,295Livestock leases 507 - -Livestock hauling and trucking 1,957 3,721 3,817Livestock marketing 1,181 2,312 3,404Interest 30,232 37,562 39,600CCC buyback 7,776 - 16,206Fuel & oil 30,486 24,710 56,817Repairs 29,554 30,252 43,623Custom hire 11,915 13,341 23,353Hired labor 27,309 53,967 52,994Land rent 73,438 43,047 130,173Machinery leases 8,917 18,710 14,808Building leases 21,987 66,987 35,995Real estate taxes 4,876 4,376 7,307Farm insurance 7,570 11,423 9,371Utilities 8,220 9,696 8,844Dues & professional fees 2,094 1,494 1,991Miscellaneous 5,379 8,978 5,904
Total cash expense 720,364 1,411,186 979,103Net cash farm income 156,012 -37,706 350,261
Inventory ChangesPrepaids and supplies 40,655 -2,163 100,855Accounts receivable 4,783 -10,634 -2,075Hedging accounts 11,663 54,420 -3,341Other current assets -123 -375 61Crops and feed 4,544 -80,437 43,661Market livestock 9,974 105,242 -13,568Breeding livestock -1,031 -1,948 -393Other assets 2,679 596 4,909Accounts payable -1,060 1,188 3,503Accrued interest -2,032 -6,205 1,529
Total inventory change 70,051 59,683 135,141Net operating profit 226,062 21,976 485,401
DepreciationMachinery and equipment -23,963 -22,354 -36,638Titled vehicles -1,978 -2,081 -2,808Buildings and improvements -13,497 -27,880 -14,692
Total depreciation -39,437 -52,314 -54,139
Net farm income from operations 186,625 -30,338 431,262Gain or loss on capital sales 4,276 861 18,735
Net farm income 190,901 -29,476 449,997
2008 Annual Report RankEm, Copyright (c) 2001-09, Univ. of Minnesota
11
Profitability MeasuresSouthwest Minnesota Farm Business Management Association
(Farms Sorted By Net Farm Income)
Avg. OfAll Farms Low 20% High 20%
Number of farms 99 19 20
Profitability (assets valued at cost)Net farm income from operations 186,625 -30,338 431,262Rate of return on assets 11.2 % -1.2 % 16.9 %Rate of return on equity 14.5 % -6.5 % 21.3 %Operating profit margin 26.0 % -4.3 % 34.0 %Asset turnover rate 43.1 % 28.1 % 49.7 %
Farm interest expense 32,264 43,768 38,071Value of operator lbr and mgmt. 47,369 34,942 73,107Return on farm assets 171,519 -21,513 396,227Average farm assets 1,527,797 1,787,214 2,342,710Return on farm equity 139,256 -65,280 358,155Average farm equity 962,118 1,004,396 1,680,375Value of farm production 658,576 502,997 1,165,151
Avg. OfAll Farms Low 20% High 20%
Number of farms 99 19 20
Profitability (assets valued at market)Net farm income from operations 179,745 8,004 362,505Rate of return on assets 7.8 % 0.7 % 10.7 %Rate of return on equity 10.6 % -2.1 % 14.8 %Operating profit margin 25.0 % 3.3 % 28.1 %Asset turnover rate 31.3 % 21.5 % 38.2 %
Farm interest expense 32,264 43,768 38,071Value of operator lbr and mgmt. 47,369 34,942 73,107Return on farm assets 164,640 16,829 327,469Average farm assets 2,107,375 2,337,381 3,050,926Return on farm equity 132,376 -26,938 289,398Average farm equity 1,249,207 1,282,196 1,957,334Value of farm production 658,576 502,997 1,165,151
2008 Annual Report RankEm, Copyright (c) 2001-09, Univ. of Minnesota
12
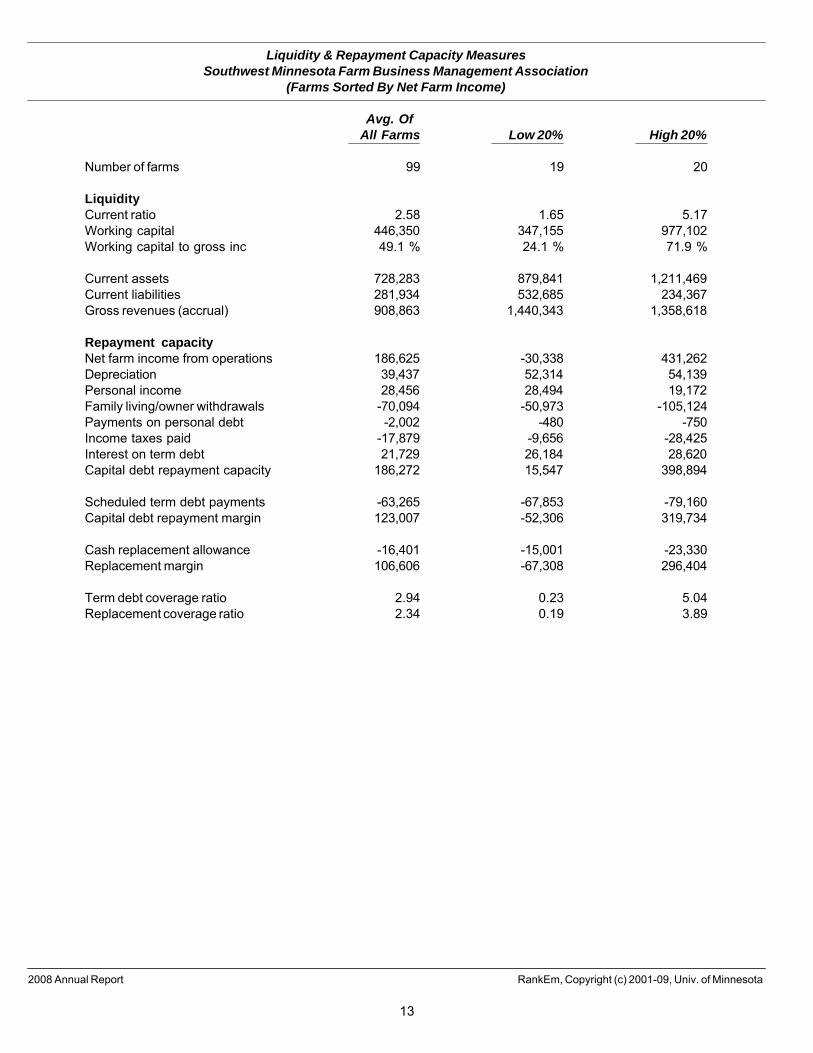
Liquidity & Repayment Capacity MeasuresSouthwest Minnesota Farm Business Management Association
(Farms Sorted By Net Farm Income)
Avg. OfAll Farms Low 20% High 20%
Number of farms 99 19 20
LiquidityCurrent ratio 2.58 1.65 5.17Working capital 446,350 347,155 977,102Working capital to gross inc 49.1 % 24.1 % 71.9 %
Current assets 728,283 879,841 1,211,469Current liabilities 281,934 532,685 234,367Gross revenues (accrual) 908,863 1,440,343 1,358,618
Repayment capacityNet farm income from operations 186,625 -30,338 431,262Depreciation 39,437 52,314 54,139Personal income 28,456 28,494 19,172Family living/owner withdrawals -70,094 -50,973 -105,124Payments on personal debt -2,002 -480 -750Income taxes paid -17,879 -9,656 -28,425Interest on term debt 21,729 26,184 28,620Capital debt repayment capacity 186,272 15,547 398,894
Scheduled term debt payments -63,265 -67,853 -79,160Capital debt repayment margin 123,007 -52,306 319,734
Cash replacement allowance -16,401 -15,001 -23,330Replacement margin 106,606 -67,308 296,404
Term debt coverage ratio 2.94 0.23 5.04Replacement coverage ratio 2.34 0.19 3.89
2008 Annual Report RankEm, Copyright (c) 2001-09, Univ. of Minnesota
13
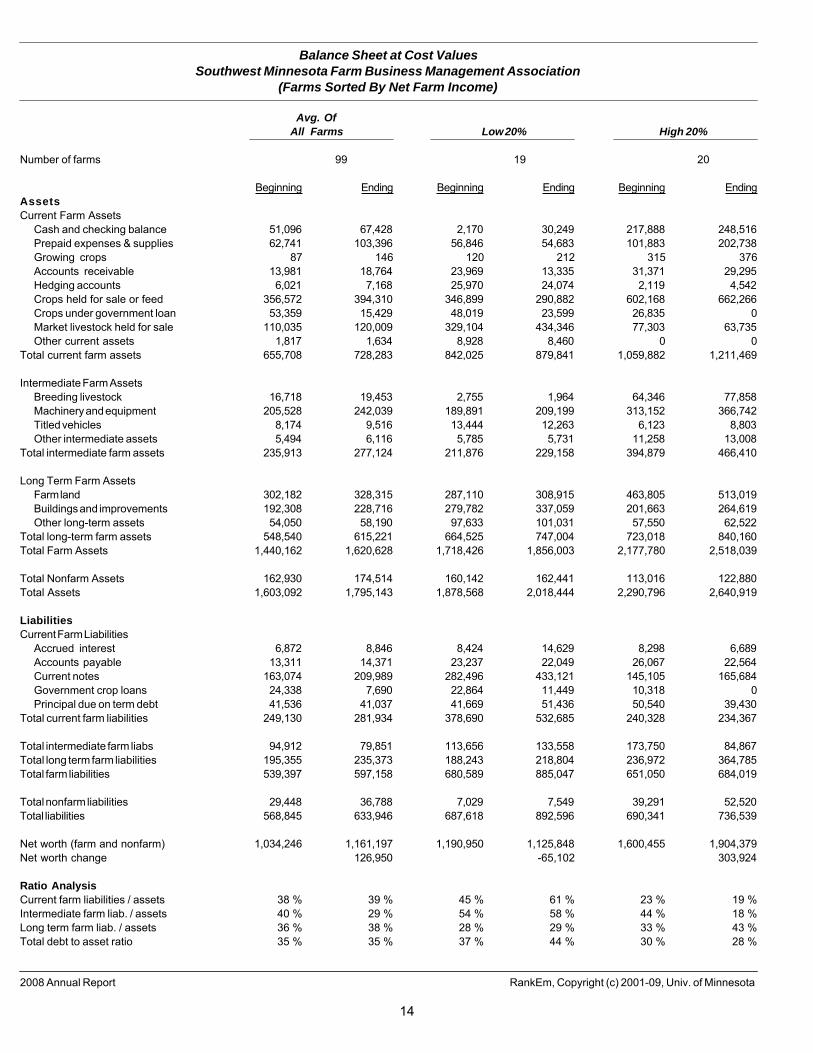
Balance Sheet at Cost ValuesSouthwest Minnesota Farm Business Management Association
(Farms Sorted By Net Farm Income)
Avg. Of
All Farms Low 20% High 20%
Number of farms 99 19 20
Beginning Ending Beginning Ending Beginning EndingAssets
Current Farm AssetsCash and checking balance 51,096 67,428 2,170 30,249 217,888 248,516Prepaid expenses & supplies 62,741 103,396 56,846 54,683 101,883 202,738Growing crops 87 146 120 212 315 376Accounts receivable 13,981 18,764 23,969 13,335 31,371 29,295Hedging accounts 6,021 7,168 25,970 24,074 2,119 4,542Crops held for sale or feed 356,572 394,310 346,899 290,882 602,168 662,266Crops under government loan 53,359 15,429 48,019 23,599 26,835 0Market livestock held for sale 110,035 120,009 329,104 434,346 77,303 63,735Other current assets 1,817 1,634 8,928 8,460 0 0
Total current farm assets 655,708 728,283 842,025 879,841 1,059,882 1,211,469
Intermediate Farm AssetsBreeding livestock 16,718 19,453 2,755 1,964 64,346 77,858Machinery and equipment 205,528 242,039 189,891 209,199 313,152 366,742Titled vehicles 8,174 9,516 13,444 12,263 6,123 8,803Other intermediate assets 5,494 6,116 5,785 5,731 11,258 13,008
Total intermediate farm assets 235,913 277,124 211,876 229,158 394,879 466,410
Long Term Farm AssetsFarm land 302,182 328,315 287,110 308,915 463,805 513,019Buildings and improvements 192,308 228,716 279,782 337,059 201,663 264,619Other long-term assets 54,050 58,190 97,633 101,031 57,550 62,522
Total long-term farm assets 548,540 615,221 664,525 747,004 723,018 840,160Total Farm Assets 1,440,162 1,620,628 1,718,426 1,856,003 2,177,780 2,518,039
Total Nonfarm Assets 162,930 174,514 160,142 162,441 113,016 122,880Total Assets 1,603,092 1,795,143 1,878,568 2,018,444 2,290,796 2,640,919
Liabilities
Current Farm LiabilitiesAccrued interest 6,872 8,846 8,424 14,629 8,298 6,689Accounts payable 13,311 14,371 23,237 22,049 26,067 22,564Current notes 163,074 209,989 282,496 433,121 145,105 165,684Government crop loans 24,338 7,690 22,864 11,449 10,318 0Principal due on term debt 41,536 41,037 41,669 51,436 50,540 39,430
Total current farm liabilities 249,130 281,934 378,690 532,685 240,328 234,367
Total intermediate farm liabs 94,912 79,851 113,656 133,558 173,750 84,867Total long term farm liabilities 195,355 235,373 188,243 218,804 236,972 364,785Total farm liabilities 539,397 597,158 680,589 885,047 651,050 684,019
Total nonfarm liabilities 29,448 36,788 7,029 7,549 39,291 52,520Total liabilities 568,845 633,946 687,618 892,596 690,341 736,539
Net worth (farm and nonfarm) 1,034,246 1,161,197 1,190,950 1,125,848 1,600,455 1,904,379Net worth change 126,950 -65,102 303,924
Ratio Analysis
Current farm liabilities / assets 38 % 39 % 45 % 61 % 23 % 19 %Intermediate farm liab. / assets 40 % 29 % 54 % 58 % 44 % 18 %Long term farm liab. / assets 36 % 38 % 28 % 29 % 33 % 43 %Total debt to asset ratio 35 % 35 % 37 % 44 % 30 % 28 %
2008 Annual Report RankEm, Copyright (c) 2001-09, Univ. of Minnesota
14
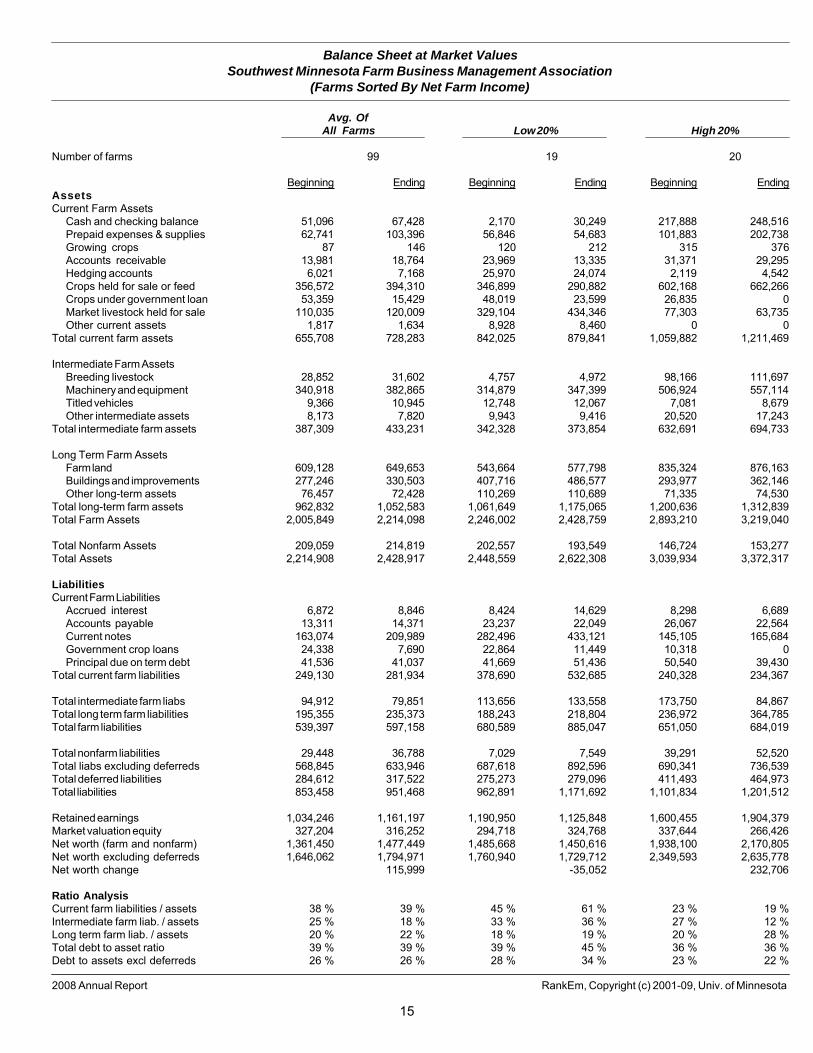
Balance Sheet at Market ValuesSouthwest Minnesota Farm Business Management Association
(Farms Sorted By Net Farm Income)
Avg. OfAll Farms Low 20% High 20%
Number of farms 99 19 20
Beginning Ending Beginning Ending Beginning EndingAssetsCurrent Farm Assets
Cash and checking balance 51,096 67,428 2,170 30,249 217,888 248,516Prepaid expenses & supplies 62,741 103,396 56,846 54,683 101,883 202,738Growing crops 87 146 120 212 315 376Accounts receivable 13,981 18,764 23,969 13,335 31,371 29,295Hedging accounts 6,021 7,168 25,970 24,074 2,119 4,542Crops held for sale or feed 356,572 394,310 346,899 290,882 602,168 662,266Crops under government loan 53,359 15,429 48,019 23,599 26,835 0Market livestock held for sale 110,035 120,009 329,104 434,346 77,303 63,735Other current assets 1,817 1,634 8,928 8,460 0 0
Total current farm assets 655,708 728,283 842,025 879,841 1,059,882 1,211,469
Intermediate Farm AssetsBreeding livestock 28,852 31,602 4,757 4,972 98,166 111,697Machinery and equipment 340,918 382,865 314,879 347,399 506,924 557,114Titled vehicles 9,366 10,945 12,748 12,067 7,081 8,679Other intermediate assets 8,173 7,820 9,943 9,416 20,520 17,243
Total intermediate farm assets 387,309 433,231 342,328 373,854 632,691 694,733
Long Term Farm AssetsFarm land 609,128 649,653 543,664 577,798 835,324 876,163Buildings and improvements 277,246 330,503 407,716 486,577 293,977 362,146Other long-term assets 76,457 72,428 110,269 110,689 71,335 74,530
Total long-term farm assets 962,832 1,052,583 1,061,649 1,175,065 1,200,636 1,312,839Total Farm Assets 2,005,849 2,214,098 2,246,002 2,428,759 2,893,210 3,219,040
Total Nonfarm Assets 209,059 214,819 202,557 193,549 146,724 153,277Total Assets 2,214,908 2,428,917 2,448,559 2,622,308 3,039,934 3,372,317
LiabilitiesCurrent Farm Liabilities
Accrued interest 6,872 8,846 8,424 14,629 8,298 6,689Accounts payable 13,311 14,371 23,237 22,049 26,067 22,564Current notes 163,074 209,989 282,496 433,121 145,105 165,684Government crop loans 24,338 7,690 22,864 11,449 10,318 0Principal due on term debt 41,536 41,037 41,669 51,436 50,540 39,430
Total current farm liabilities 249,130 281,934 378,690 532,685 240,328 234,367
Total intermediate farm liabs 94,912 79,851 113,656 133,558 173,750 84,867Total long term farm liabilities 195,355 235,373 188,243 218,804 236,972 364,785Total farm liabilities 539,397 597,158 680,589 885,047 651,050 684,019
Total nonfarm liabilities 29,448 36,788 7,029 7,549 39,291 52,520Total liabs excluding deferreds 568,845 633,946 687,618 892,596 690,341 736,539Total deferred liabilities 284,612 317,522 275,273 279,096 411,493 464,973Total liabilities 853,458 951,468 962,891 1,171,692 1,101,834 1,201,512
Retained earnings 1,034,246 1,161,197 1,190,950 1,125,848 1,600,455 1,904,379Market valuation equity 327,204 316,252 294,718 324,768 337,644 266,426Net worth (farm and nonfarm) 1,361,450 1,477,449 1,485,668 1,450,616 1,938,100 2,170,805Net worth excluding deferreds 1,646,062 1,794,971 1,760,940 1,729,712 2,349,593 2,635,778Net worth change 115,999 -35,052 232,706
Ratio AnalysisCurrent farm liabilities / assets 38 % 39 % 45 % 61 % 23 % 19 %Intermediate farm liab. / assets 25 % 18 % 33 % 36 % 27 % 12 %Long term farm liab. / assets 20 % 22 % 18 % 19 % 20 % 28 %Total debt to asset ratio 39 % 39 % 39 % 45 % 36 % 36 %Debt to assets excl deferreds 26 % 26 % 28 % 34 % 23 % 22 %
2008 Annual Report RankEm, Copyright (c) 2001-09, Univ. of Minnesota
15
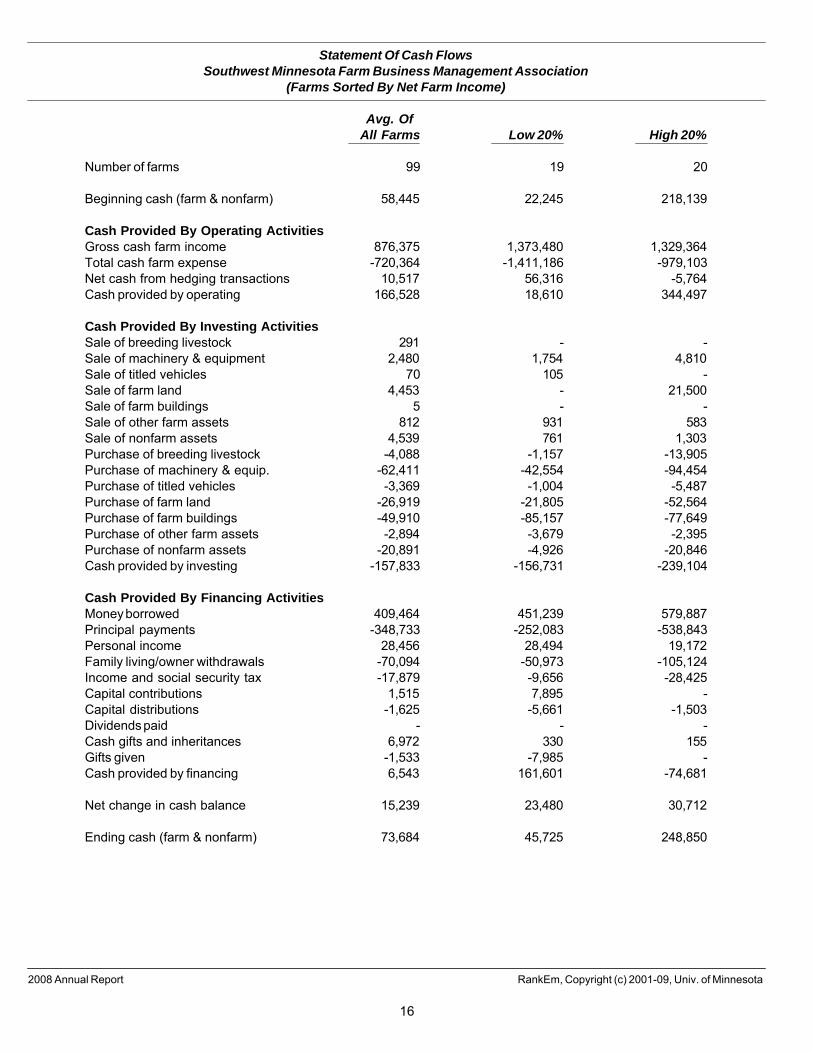
Statement Of Cash FlowsSouthwest Minnesota Farm Business Management Association
(Farms Sorted By Net Farm Income)
Avg. OfAll Farms Low 20% High 20%
Number of farms 99 19 20
Beginning cash (farm & nonfarm) 58,445 22,245 218,139
Cash Provided By Operating ActivitiesGross cash farm income 876,375 1,373,480 1,329,364Total cash farm expense -720,364 -1,411,186 -979,103Net cash from hedging transactions 10,517 56,316 -5,764Cash provided by operating 166,528 18,610 344,497
Cash Provided By Investing ActivitiesSale of breeding livestock 291 - -Sale of machinery & equipment 2,480 1,754 4,810Sale of titled vehicles 70 105 -Sale of farm land 4,453 - 21,500Sale of farm buildings 5 - -Sale of other farm assets 812 931 583Sale of nonfarm assets 4,539 761 1,303Purchase of breeding livestock -4,088 -1,157 -13,905Purchase of machinery & equip. -62,411 -42,554 -94,454Purchase of titled vehicles -3,369 -1,004 -5,487Purchase of farm land -26,919 -21,805 -52,564Purchase of farm buildings -49,910 -85,157 -77,649Purchase of other farm assets -2,894 -3,679 -2,395Purchase of nonfarm assets -20,891 -4,926 -20,846Cash provided by investing -157,833 -156,731 -239,104
Cash Provided By Financing ActivitiesMoney borrowed 409,464 451,239 579,887Principal payments -348,733 -252,083 -538,843Personal income 28,456 28,494 19,172Family living/owner withdrawals -70,094 -50,973 -105,124Income and social security tax -17,879 -9,656 -28,425Capital contributions 1,515 7,895 -Capital distributions -1,625 -5,661 -1,503Dividends paid - - -Cash gifts and inheritances 6,972 330 155Gifts given -1,533 -7,985 -Cash provided by financing 6,543 161,601 -74,681
Net change in cash balance 15,239 23,480 30,712
Ending cash (farm & nonfarm) 73,684 45,725 248,850
2008 Annual Report RankEm, Copyright (c) 2001-09, Univ. of Minnesota
16
Crop Production and Marketing SummarySouthwest Minnesota Farm Business Management Association
(Farms Sorted By Net Farm Income)
Avg. OfAll Farms Low 20% High 20%
Number of farms 99 19 20
Acreage SummaryTotal acres owned 249 224 379Total crop acres 822 564 1,349Crop acres owned 222 187 297Crop acres cash rented 536 323 962Crop acres share rented 64 53 90Total pasture acres 6 7 20Percent crop acres owned 27 % 33 % 22 %
Average Price Received (Cash Sales Only)Soybeans per bushel 10.83 10.78 11.21Corn per bushel 4.51 4.40 4.78Hay, Grass per ton 83.11 - -Hay, Alfalfa per ton 101.71 - -Wheat, Spring per bushel 7.83 - -Oats per bushel 4.09 - -
Average Yield Per AcreCorn (bushel) 172.31 162.44 177.88Soybeans (bushel) 44.20 43.43 43.58Hay, Alfalfa (ton) 4.87 - 4.99Corn Silage (ton) 22.13 - 22.44Hay, Grass (ton) 2.69 - -Wheat, Spring (bushel) 49.15 - -Oats (bushel) 90.71 - -
2008 Annual Report RankEm, Copyright (c) 2001-09, Univ. of Minnesota
17
Household and Personal ExpensesSouthwest Minnesota Farm Business Management Association
(Farms Sorted By Net Farm Income)
Avg. OfAll Farms Low 20% High 20%
Number of farms 62 8 12
Average family size 3.0 1.6 3.3
Family Living ExpensesFood and meals expense 7,916 5,877 8,780Medical care 3,693 3,087 2,869Health insurance 4,764 4,987 3,384Cash donations 4,831 2,074 7,094Household supplies 6,210 2,030 7,413Clothing 2,210 1,688 2,187Personal care 2,397 2,642 4,076Child / Dependent care 298 - 335Alimony and child support - - -Gifts 3,682 2,336 2,425Education 3,569 194 8,109Recreation 4,008 4,302 3,725Utilities (household share) 2,699 1,609 2,666Personal vehicle operating exp 5,359 3,603 4,629Household real estate taxes 253 73 204Dwelling rent 243 - 206Household repairs 1,582 1,335 918Personal interest 1,018 - 594Disability / Long term care ins 256 125 464Life insurance payments 1,812 1,872 1,692Personal property insurance 116 38 50Miscellaneous 2,807 1,132 2,212
Total cash family living expense 59,724 39,003 64,032Family living from the farm 216 150 100Total family living 59,939 39,153 64,132
Other Nonfarm ExpendituresIncome taxes 19,836 5,818 34,976Furnishing & appliance purchases 2,057 985 1,147Nonfarm vehicle purchases 5,401 961 7,495Nonfarm real estate purchases 9,596 - 5,674Other nonfarm capital purchases 715 - 4Nonfarm savings & investments 2,039 -11,189 14,076
Total other nonfarm expenditures 39,643 -3,424 63,370
Total cash family livinginvestment & nonfarm capital purch 99,366 35,579 127,402
2008 Annual Report RankEm, Copyright (c) 2001-09, Univ. of Minnesota
18
Operator and Labor InformationSouthwest Minnesota Farm Business Management Association
(Farms Sorted By Net Farm Income)
Avg. OfAll Farms Low 20% High 20%
Number of farms 99 19 20
Operator InformationAverage number of operators 1.2 1.1 1.3Average age of operators 51.4 52.8 49.8Average number of years farming 27.8 27.4 26.6
Results Per OperatorWorking capital 387,620 329,798 781,681Total assets (market) 2,109,323 2,491,193 2,697,854Total liabilities 826,275 1,113,108 961,210Net worth (market) 1,283,048 1,378,085 1,736,644Net worth excl deferred liabs 1,558,791 1,643,227 2,108,622
Gross farm income 789,276 1,368,326 1,086,894Total farm expense 627,206 1,397,147 741,884Net farm income from operations 162,069 -28,821 345,010
Net nonfarm income 24,712 27,070 15,337Family living & tax withdrawals 76,398 57,597 106,839
Total acres owned 216.6 212.7 303.6Total crop acres 713.7 535.4 1,079.1Crop acres owned 192.8 177.9 237.8Crop acres cash rented 465.5 307.3 769.7Crop acres share rented 55.5 50.3 71.7Total pasture acres 5.2 6.2 15.9
Labor AnalysisNumber of farms 99 19 20Total unpaid labor hours 2,136 1,831 2,212Total hired labor hours 1,995 3,761 4,174Total labor hours per farm 4,131 5,592 6,386Unpaid hours per operator 1,855 1,740 1,769Value of farm production / hour 159.43 89.95 182.47Net farm income / unpaid hour 87.38 -16.57 194.98Average hourly hired labor wage 13.19 14.08 12.53
Partnerships & LLCsNumber of farms 9 2 2Number of operators 2.1 - -Owner withdrawals per farm 119,963 - -Withdrawals per operator 56,825 - -
CorporationsNumber of farms 5 2 2Number of operators 1.8 - -
2008 Annual Report RankEm, Copyright (c) 2001-09, Univ. of Minnesota
19
Nonfarm SummarySouthwest Minnesota Farm Business Management Association
(Farms Sorted By Net Farm Income)
Avg. OfAll Farms Low 20% High 20%
Number of farms 99 19 20
Nonfarm IncomePersonal wages & salary 14,736 18,514 9,438Net nonfarm business income 3,746 1,963 920Personal rental income 1,869 2,532 763Personal interest income 1,222 1,153 1,450Personal cash dividends 59 5 -Tax refunds 1,091 1,190 580Other nonfarm income 5,733 3,138 6,021
Total nonfarm income 28,456 28,494 19,172
Gifts and inheritances 6,972 330 155
Nonfarm Assets (market)Checking & savings 6,256 15,476 334Stocks & bonds 14,660 16,118 23,429Other current assets 1,262 2,320 340Furniture & appliances 11,587 9,011 8,425Nonfarm vehicles 14,132 11,418 16,046Cash value of life ins. 11,458 16,228 12,958Retirement accounts 40,225 50,695 30,226Other intermediate assets 15,042 18,847 394Nonfarm real estate 67,726 35,789 51,025Personal bus. investment - - -Other long term assets 32,472 17,647 10,100
Total nonfarm assets 214,819 193,549 153,277
Nonfarm LiabilitiesAccrued interest 30 - 4Accounts payable 18,695 7,106 47,403Current notes 141 - 244Princ due on term debt 1,077 242 326
Total current liabilities 19,943 7,348 47,977Intermediate liabilities 1,426 201 827Long term liabilities 15,419 - 3,716Total nonfarm liabilities 36,788 7,549 52,520
Nonfarm net worth 178,031 186,000 100,757Nonfarm debt to asset ratio 17 % 4 % 34 %
2008 Annual Report RankEm, Copyright (c) 2001-09, Univ. of Minnesota
20
Crop Reports
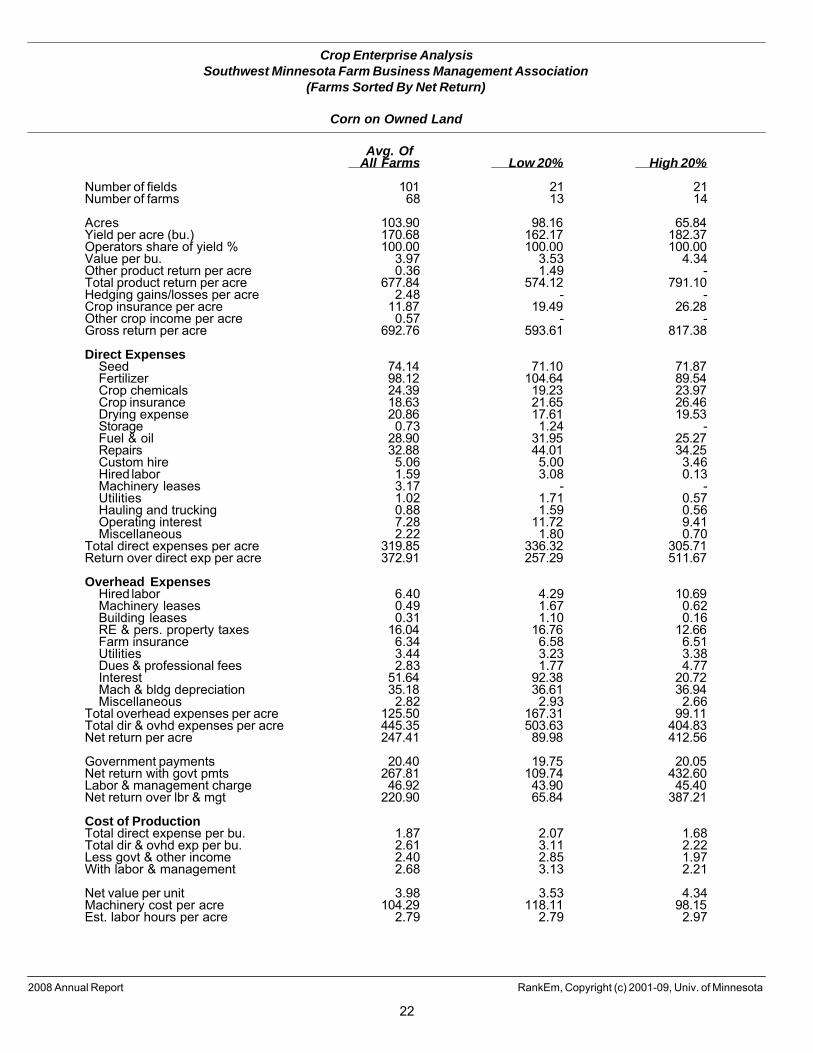
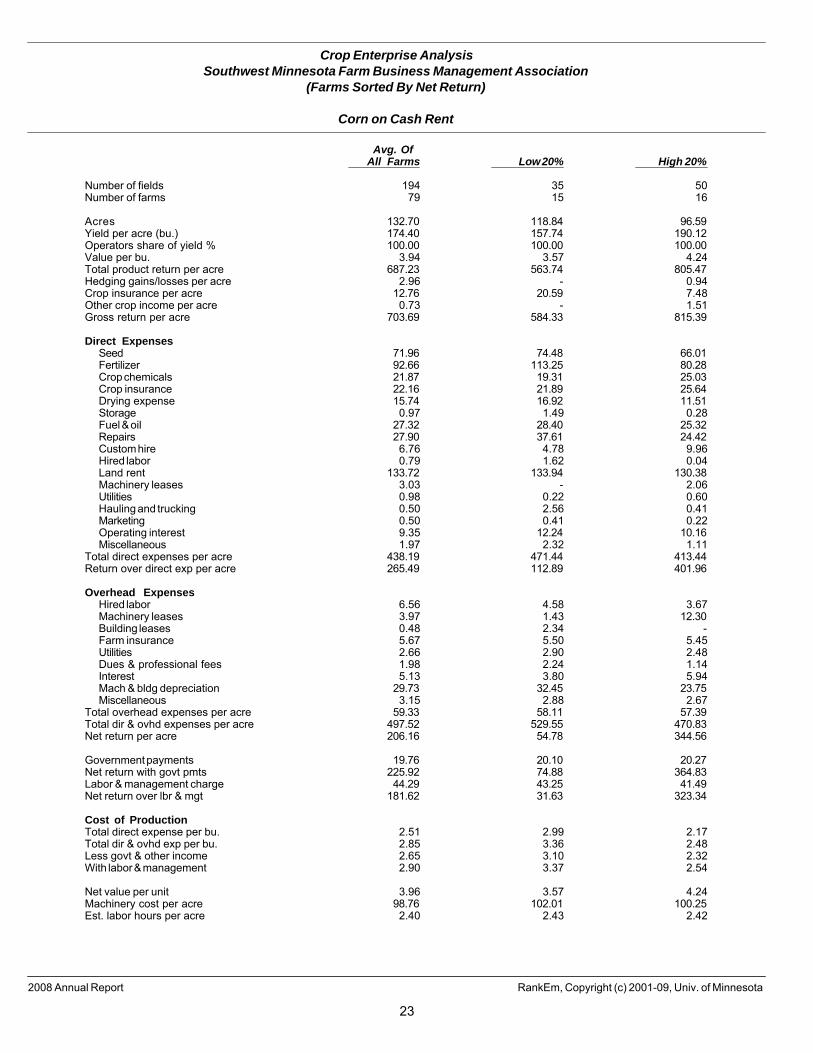
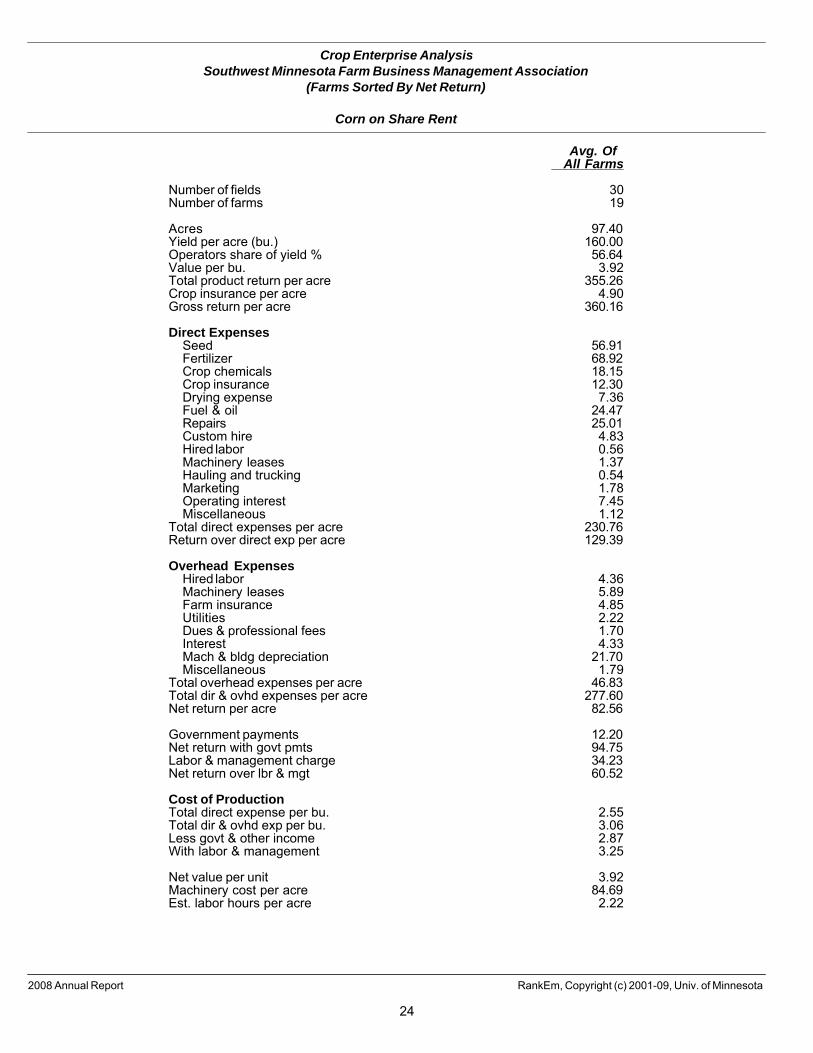
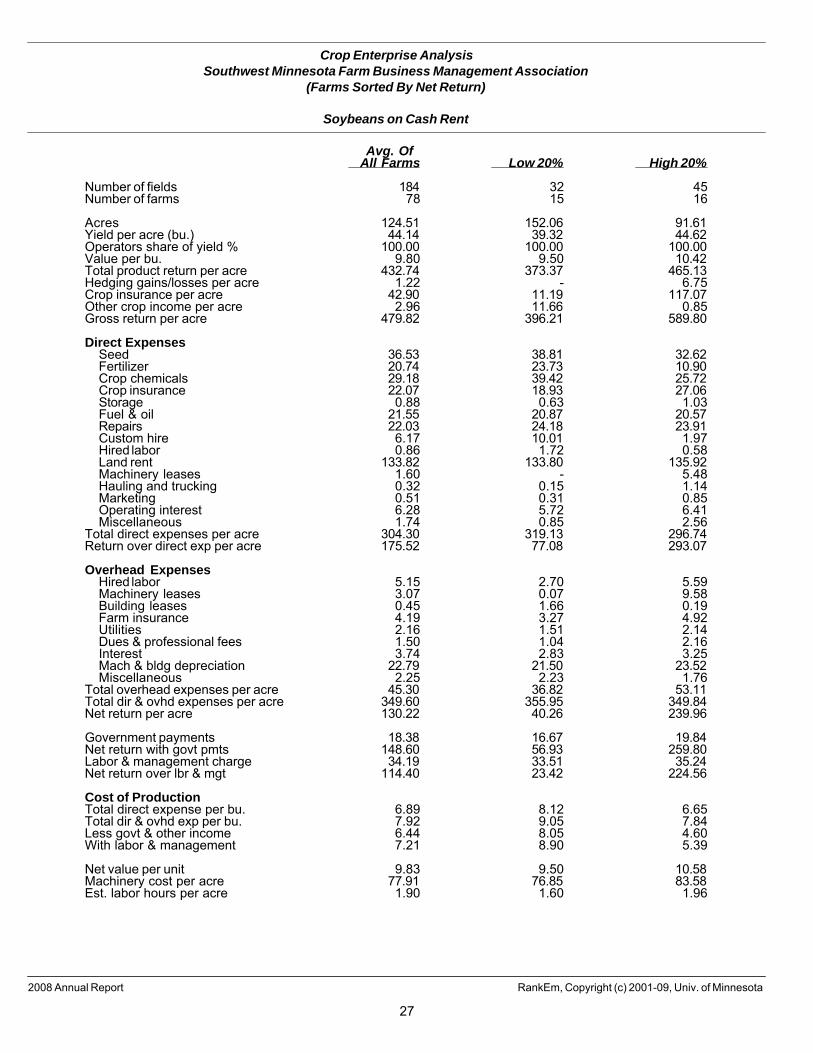
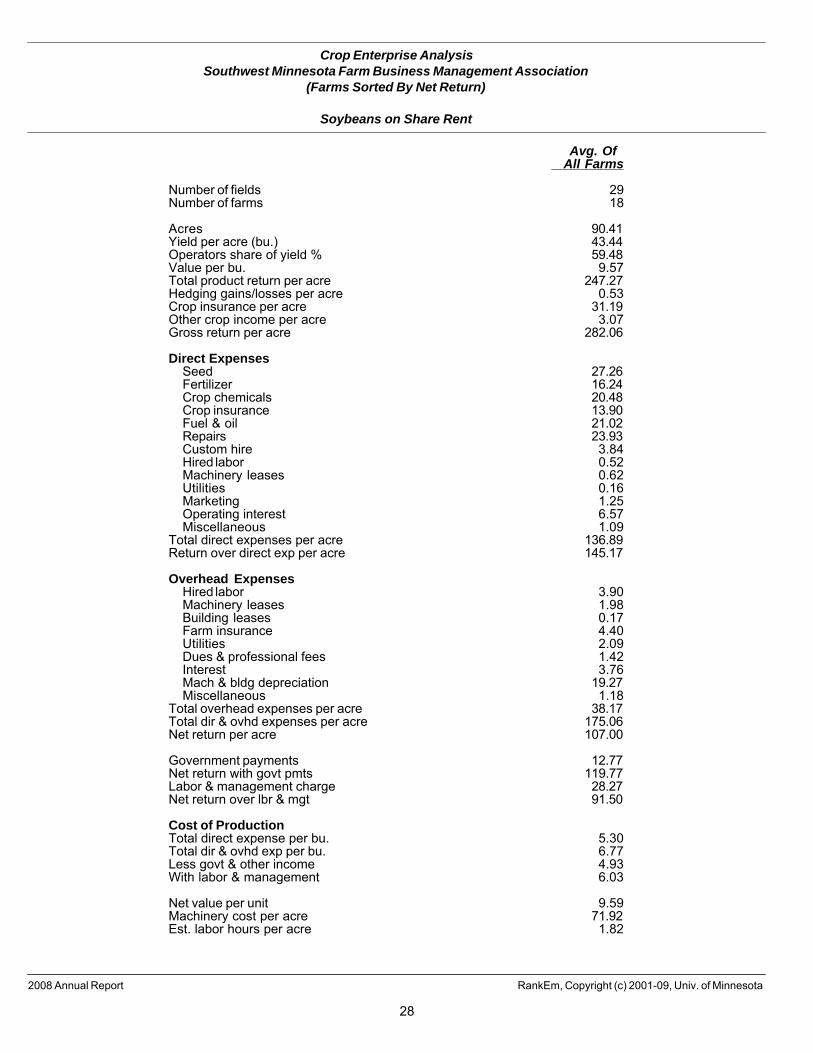
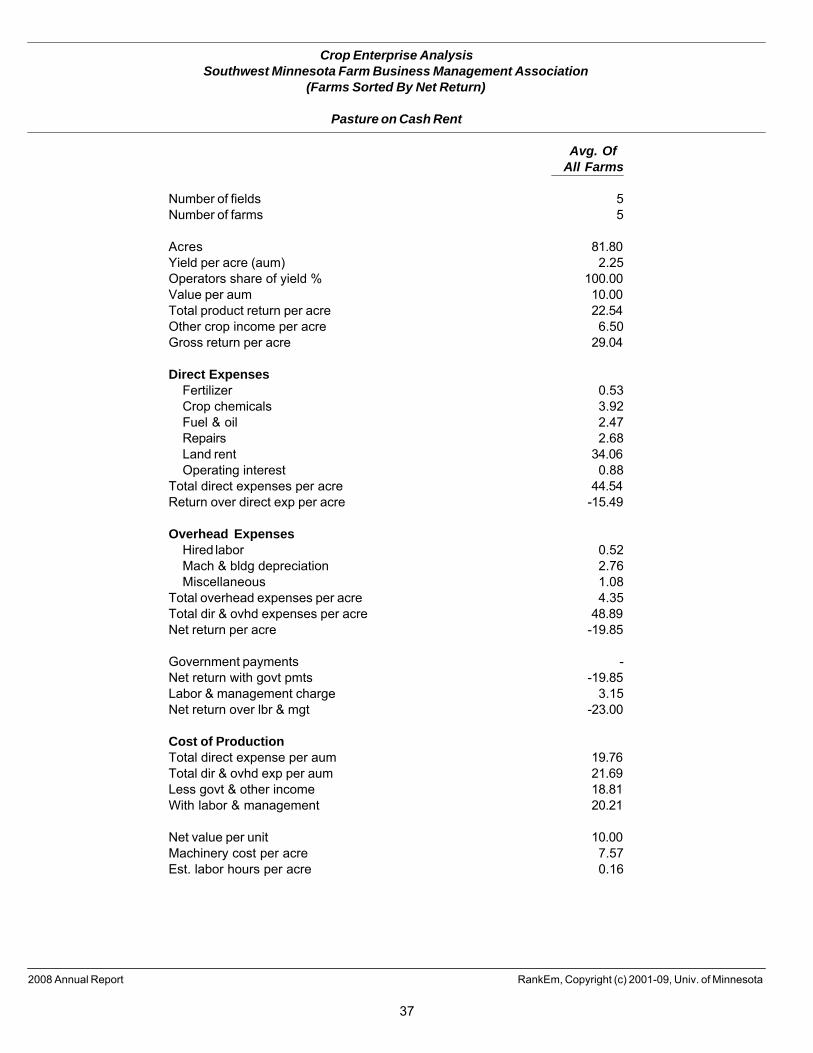
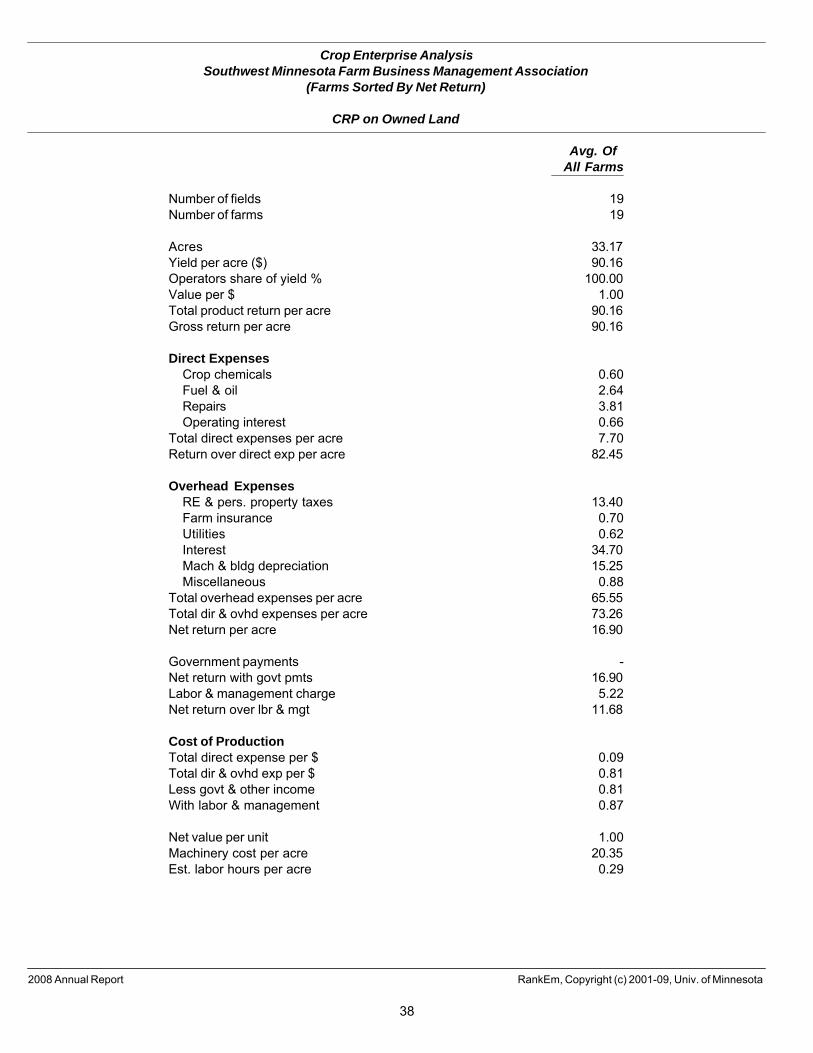
The Crop Enterprise Analysis tables show the average physical production, gross return, direct costs,overhead costs, and net returns per acre. There are potentially three tables for each crop dependingon the farmer's tenure on the land: owned land, cash rented land, and share rented land. Farms areclassified into low 20% or high 20% on the basis of net return per acre. The classification is doneseparately for each table.
Gross Return Per Acre includes the value of the crop produced plus any other income directlyassociated with production of the crop, including hedging gains or loses, LDP payments, cropinsurance proceeds and any disaster payments that might have been received. It does not includedirect and counter-cyclical government payments (see Net Return With Government Payments).
The Value Per Unit is assigned by the producer. For cash crops, the value is based on the actualsales price for production sold or contracted before year-end and the inventory value for crops stillin inventory at year-end. The local harvest-time price is used for forages and other feed crops.
Net Return Per Acre is the amount contributed toward operator labor, management, and equitycapital. Any wages and benefits paid to the operator are removed from labor costs (and added toLabor and Management Charge) so that all farms are on equal footing. Land costs include land renton the rented land pages but only actual interest paid and real estate taxes on owned land. For thisreason, net returns from owned and rented land should not be compared.
Net Return With Government Payments is the net return per acre after decoupled governmentpayments such as direct and counter-cyclical government payments have been added. Thesepayments are generally allocated evenly per acre across all crops except vegetables and pasture.
Net Return Over Labor and Management is the return, including government payments, remainingafter compensating the operator for unpaid labor and management. This is the per acre return toequity capital.
Cost of Production shows the average cost per unit produced in each cost category. Total Direct andOverhead Expense per Unit is the breakeven price needed to cover cash costs and depreciation. LessGovernment and Other Income is the breakeven price if government payments and anymiscellaneous income are used to offset some expenses. With Labor and Management is thebreakeven price to provide a labor and management return for the operator(s).
Machinery Cost Per Acre includes fuel and oil, repairs, custom hire, machinery lease payments,machinery depreciation, and interest on intermediate debt.
21
Crop Enterprise AnalysisSouthwest Minnesota Farm Business Management Association
(Farms Sorted By Net Return)
Corn on Owned Land
Avg. OfAll Farms Low 20% High 20%
Number of fields 101 21 21Number of farms 68 13 14
Acres 103.90 98.16 65.84Yield per acre (bu.) 170.68 162.17 182.37Operators share of yield % 100.00 100.00 100.00Value per bu. 3.97 3.53 4.34Other product return per acre 0.36 1.49 -Total product return per acre 677.84 574.12 791.10Hedging gains/losses per acre 2.48 - -Crop insurance per acre 11.87 19.49 26.28Other crop income per acre 0.57 - -Gross return per acre 692.76 593.61 817.38
Direct ExpensesSeed 74.14 71.10 71.87Fertilizer 98.12 104.64 89.54Crop chemicals 24.39 19.23 23.97Crop insurance 18.63 21.65 26.46Drying expense 20.86 17.61 19.53Storage 0.73 1.24 -Fuel & oil 28.90 31.95 25.27Repairs 32.88 44.01 34.25Custom hire 5.06 5.00 3.46Hired labor 1.59 3.08 0.13Machinery leases 3.17 - -Utilities 1.02 1.71 0.57Hauling and trucking 0.88 1.59 0.56Operating interest 7.28 11.72 9.41Miscellaneous 2.22 1.80 0.70
Total direct expenses per acre 319.85 336.32 305.71Return over direct exp per acre 372.91 257.29 511.67
Overhead ExpensesHired labor 6.40 4.29 10.69Machinery leases 0.49 1.67 0.62Building leases 0.31 1.10 0.16RE & pers. property taxes 16.04 16.76 12.66Farm insurance 6.34 6.58 6.51Utilities 3.44 3.23 3.38Dues & professional fees 2.83 1.77 4.77Interest 51.64 92.38 20.72Mach & bldg depreciation 35.18 36.61 36.94Miscellaneous 2.82 2.93 2.66
Total overhead expenses per acre 125.50 167.31 99.11Total dir & ovhd expenses per acre 445.35 503.63 404.83Net return per acre 247.41 89.98 412.56
Government payments 20.40 19.75 20.05Net return with govt pmts 267.81 109.74 432.60Labor & management charge 46.92 43.90 45.40Net return over lbr & mgt 220.90 65.84 387.21
Cost of ProductionTotal direct expense per bu. 1.87 2.07 1.68Total dir & ovhd exp per bu. 2.61 3.11 2.22Less govt & other income 2.40 2.85 1.97With labor & management 2.68 3.13 2.21
Net value per unit 3.98 3.53 4.34Machinery cost per acre 104.29 118.11 98.15Est. labor hours per acre 2.79 2.79 2.97
2008 Annual Report RankEm, Copyright (c) 2001-09, Univ. of Minnesota
22
Crop Enterprise AnalysisSouthwest Minnesota Farm Business Management Association
(Farms Sorted By Net Return)
Corn on Cash Rent
Avg. OfAll Farms Low 20% High 20%
Number of fields 194 35 50Number of farms 79 15 16
Acres 132.70 118.84 96.59Yield per acre (bu.) 174.40 157.74 190.12Operators share of yield % 100.00 100.00 100.00Value per bu. 3.94 3.57 4.24Total product return per acre 687.23 563.74 805.47Hedging gains/losses per acre 2.96 - 0.94Crop insurance per acre 12.76 20.59 7.48Other crop income per acre 0.73 - 1.51Gross return per acre 703.69 584.33 815.39
Direct ExpensesSeed 71.96 74.48 66.01Fertilizer 92.66 113.25 80.28Crop chemicals 21.87 19.31 25.03Crop insurance 22.16 21.89 25.64Drying expense 15.74 16.92 11.51Storage 0.97 1.49 0.28Fuel & oil 27.32 28.40 25.32Repairs 27.90 37.61 24.42Custom hire 6.76 4.78 9.96Hired labor 0.79 1.62 0.04Land rent 133.72 133.94 130.38Machinery leases 3.03 - 2.06Utilities 0.98 0.22 0.60Hauling and trucking 0.50 2.56 0.41Marketing 0.50 0.41 0.22Operating interest 9.35 12.24 10.16Miscellaneous 1.97 2.32 1.11
Total direct expenses per acre 438.19 471.44 413.44Return over direct exp per acre 265.49 112.89 401.96
Overhead ExpensesHired labor 6.56 4.58 3.67Machinery leases 3.97 1.43 12.30Building leases 0.48 2.34 -Farm insurance 5.67 5.50 5.45Utilities 2.66 2.90 2.48Dues & professional fees 1.98 2.24 1.14Interest 5.13 3.80 5.94Mach & bldg depreciation 29.73 32.45 23.75Miscellaneous 3.15 2.88 2.67
Total overhead expenses per acre 59.33 58.11 57.39Total dir & ovhd expenses per acre 497.52 529.55 470.83Net return per acre 206.16 54.78 344.56
Government payments 19.76 20.10 20.27Net return with govt pmts 225.92 74.88 364.83Labor & management charge 44.29 43.25 41.49Net return over lbr & mgt 181.62 31.63 323.34
Cost of ProductionTotal direct expense per bu. 2.51 2.99 2.17Total dir & ovhd exp per bu. 2.85 3.36 2.48Less govt & other income 2.65 3.10 2.32With labor & management 2.90 3.37 2.54
Net value per unit 3.96 3.57 4.24Machinery cost per acre 98.76 102.01 100.25Est. labor hours per acre 2.40 2.43 2.42
2008 Annual Report RankEm, Copyright (c) 2001-09, Univ. of Minnesota
23
Crop Enterprise AnalysisSouthwest Minnesota Farm Business Management Association
(Farms Sorted By Net Return)
Corn on Share Rent
Avg. OfAll Farms
Number of fields 30Number of farms 19
Acres 97.40Yield per acre (bu.) 160.00Operators share of yield % 56.64Value per bu. 3.92Total product return per acre 355.26Crop insurance per acre 4.90Gross return per acre 360.16
Direct ExpensesSeed 56.91Fertilizer 68.92Crop chemicals 18.15Crop insurance 12.30Drying expense 7.36Fuel & oil 24.47Repairs 25.01Custom hire 4.83Hired labor 0.56Machinery leases 1.37Hauling and trucking 0.54Marketing 1.78Operating interest 7.45Miscellaneous 1.12
Total direct expenses per acre 230.76Return over direct exp per acre 129.39
Overhead ExpensesHired labor 4.36Machinery leases 5.89Farm insurance 4.85Utilities 2.22Dues & professional fees 1.70Interest 4.33Mach & bldg depreciation 21.70Miscellaneous 1.79
Total overhead expenses per acre 46.83Total dir & ovhd expenses per acre 277.60Net return per acre 82.56
Government payments 12.20Net return with govt pmts 94.75Labor & management charge 34.23Net return over lbr & mgt 60.52
Cost of ProductionTotal direct expense per bu. 2.55Total dir & ovhd exp per bu. 3.06Less govt & other income 2.87With labor & management 3.25
Net value per unit 3.92Machinery cost per acre 84.69Est. labor hours per acre 2.22
2008 Annual Report RankEm, Copyright (c) 2001-09, Univ. of Minnesota
24
25
Crop Enterprise AnalysisSouthwest Minnesota Farm Business Management Association
(Farms Sorted By Net Return)
Soybeans on Owned Land
Avg. OfAll Farms Low 20% High 20%
Number of fields 82 14 17Number of farms 57 11 12
Acres 90.22 80.96 83.03Yield per acre (bu.) 44.79 42.56 48.44Operators share of yield % 100.00 100.00 100.00Value per bu. 9.71 9.48 10.14Total product return per acre 434.66 403.61 491.20Hedging gains/losses per acre -0.15 - -Crop insurance per acre 38.33 26.64 56.39Other crop income per acre 0.68 1.57 -Gross return per acre 473.53 431.82 547.59
Direct ExpensesSeed 37.19 42.65 35.28Fertilizer 23.57 31.56 13.69Crop chemicals 30.42 31.57 31.95Crop insurance 19.76 19.08 23.46Fuel & oil 24.17 28.99 19.90Repairs 25.86 23.85 29.21Custom hire 3.91 4.96 3.16Hired labor 1.66 3.06 -Machinery leases 1.29 4.49 1.89Utilities 0.59 0.27 0.18Marketing 0.68 0.92 0.42Operating interest 6.21 6.69 5.49Miscellaneous 2.32 2.70 0.91
Total direct expenses per acre 177.61 200.78 165.55Return over direct exp per acre 295.92 231.04 382.04
Overhead ExpensesHired labor 6.20 2.85 5.11Building leases 0.19 0.91 0.02RE & pers. property taxes 15.43 17.76 15.85Farm insurance 5.69 4.74 6.10Utilities 2.91 3.43 2.86Dues & professional fees 2.99 1.29 1.94Interest 43.03 87.84 40.79Mach & bldg depreciation 27.53 20.79 23.41Miscellaneous 2.66 1.88 2.55
Total overhead expenses per acre 106.64 141.48 98.62Total dir & ovhd expenses per acre 284.25 342.26 264.17Net return per acre 189.28 89.56 283.42
Government payments 18.94 18.97 21.34Net return with govt pmts 208.22 108.53 304.75Labor & management charge 41.70 35.14 38.20Net return over lbr & mgt 166.52 73.39 266.56
Cost of ProductionTotal direct expense per bu. 3.97 4.72 3.42Total dir & ovhd exp per bu. 6.35 8.04 5.45Less govt & other income 5.06 6.93 3.85With labor & management 5.99 7.76 4.64
Net value per unit 9.70 9.48 10.14Machinery cost per acre 81.31 80.73 75.02Est. labor hours per acre 2.49 1.93 2.99
2008 Annual Report RankEm, Copyright (c) 2001-09, Univ. of Minnesota
26
Crop Enterprise AnalysisSouthwest Minnesota Farm Business Management Association
(Farms Sorted By Net Return)
Soybeans on Cash Rent
Avg. OfAll Farms Low 20% High 20%
Number of fields 184 32 45Number of farms 78 15 16
Acres 124.51 152.06 91.61Yield per acre (bu.) 44.14 39.32 44.62Operators share of yield % 100.00 100.00 100.00Value per bu. 9.80 9.50 10.42Total product return per acre 432.74 373.37 465.13Hedging gains/losses per acre 1.22 - 6.75Crop insurance per acre 42.90 11.19 117.07Other crop income per acre 2.96 11.66 0.85Gross return per acre 479.82 396.21 589.80
Direct ExpensesSeed 36.53 38.81 32.62Fertilizer 20.74 23.73 10.90Crop chemicals 29.18 39.42 25.72Crop insurance 22.07 18.93 27.06Storage 0.88 0.63 1.03Fuel & oil 21.55 20.87 20.57Repairs 22.03 24.18 23.91Custom hire 6.17 10.01 1.97Hired labor 0.86 1.72 0.58Land rent 133.82 133.80 135.92Machinery leases 1.60 - 5.48Hauling and trucking 0.32 0.15 1.14Marketing 0.51 0.31 0.85Operating interest 6.28 5.72 6.41Miscellaneous 1.74 0.85 2.56
Total direct expenses per acre 304.30 319.13 296.74Return over direct exp per acre 175.52 77.08 293.07
Overhead ExpensesHired labor 5.15 2.70 5.59Machinery leases 3.07 0.07 9.58Building leases 0.45 1.66 0.19Farm insurance 4.19 3.27 4.92Utilities 2.16 1.51 2.14Dues & professional fees 1.50 1.04 2.16Interest 3.74 2.83 3.25Mach & bldg depreciation 22.79 21.50 23.52Miscellaneous 2.25 2.23 1.76
Total overhead expenses per acre 45.30 36.82 53.11Total dir & ovhd expenses per acre 349.60 355.95 349.84Net return per acre 130.22 40.26 239.96
Government payments 18.38 16.67 19.84Net return with govt pmts 148.60 56.93 259.80Labor & management charge 34.19 33.51 35.24Net return over lbr & mgt 114.40 23.42 224.56
Cost of ProductionTotal direct expense per bu. 6.89 8.12 6.65Total dir & ovhd exp per bu. 7.92 9.05 7.84Less govt & other income 6.44 8.05 4.60With labor & management 7.21 8.90 5.39
Net value per unit 9.83 9.50 10.58Machinery cost per acre 77.91 76.85 83.58Est. labor hours per acre 1.90 1.60 1.96
2008 Annual Report RankEm, Copyright (c) 2001-09, Univ. of Minnesota
27
Crop Enterprise AnalysisSouthwest Minnesota Farm Business Management Association
(Farms Sorted By Net Return)
Soybeans on Share Rent
Avg. OfAll Farms
Number of fields 29Number of farms 18
Acres 90.41Yield per acre (bu.) 43.44Operators share of yield % 59.48Value per bu. 9.57Total product return per acre 247.27Hedging gains/losses per acre 0.53Crop insurance per acre 31.19Other crop income per acre 3.07Gross return per acre 282.06
Direct ExpensesSeed 27.26Fertilizer 16.24Crop chemicals 20.48Crop insurance 13.90Fuel & oil 21.02Repairs 23.93Custom hire 3.84Hired labor 0.52Machinery leases 0.62Utilities 0.16Marketing 1.25Operating interest 6.57Miscellaneous 1.09
Total direct expenses per acre 136.89Return over direct exp per acre 145.17
Overhead ExpensesHired labor 3.90Machinery leases 1.98Building leases 0.17Farm insurance 4.40Utilities 2.09Dues & professional fees 1.42Interest 3.76Mach & bldg depreciation 19.27Miscellaneous 1.18
Total overhead expenses per acre 38.17Total dir & ovhd expenses per acre 175.06Net return per acre 107.00
Government payments 12.77Net return with govt pmts 119.77Labor & management charge 28.27Net return over lbr & mgt 91.50
Cost of ProductionTotal direct expense per bu. 5.30Total dir & ovhd exp per bu. 6.77Less govt & other income 4.93With labor & management 6.03
Net value per unit 9.59Machinery cost per acre 71.92Est. labor hours per acre 1.82
2008 Annual Report RankEm, Copyright (c) 2001-09, Univ. of Minnesota
28
29
Crop Enterprise AnalysisSouthwest Minnesota Farm Business Management Association
(Farms Sorted By Net Return)
Corn Silage on Owned Land
Avg. OfAll Farms
Number of fields 10Number of farms 9
Acres 83.33Yield per acre (ton) 22.35Operators share of yield % 100.00Value per ton 25.34Total product return per acre 566.36Crop insurance per acre 7.91Gross return per acre 574.27
Direct ExpensesSeed 60.35Fertilizer 80.48Crop chemicals 18.76Crop insurance 14.28Fuel & oil 33.77Repairs 35.29Custom hire 15.53Hired labor 3.76Machinery leases 32.03Utilities 1.06Operating interest 4.74Miscellaneous 2.78
Total direct expenses per acre 302.83Return over direct exp per acre 271.44
Overhead ExpensesHired labor 5.71RE & pers. property taxes 15.14Farm insurance 3.73Utilities 1.97Dues & professional fees 1.22Interest 55.19Mach & bldg depreciation 28.67Miscellaneous 2.46
Total overhead expenses per acre 114.08Total dir & ovhd expenses per acre 416.91Net return per acre 157.36
Government payments 18.55Net return with govt pmts 175.91Labor & management charge 25.89Net return over lbr & mgt 150.01
Cost of ProductionTotal direct expense per ton 13.55Total dir & ovhd exp per ton 18.65Less govt & other income 17.47With labor & management 18.63
Net value per unit 25.34Machinery cost per acre 147.34Est. labor hours per acre 2.56
2008 Annual Report RankEm, Copyright (c) 2001-09, Univ. of Minnesota
30
Crop Enterprise AnalysisSouthwest Minnesota Farm Business Management Association
(Farms Sorted By Net Return)
Corn Silage on Cash Rent
Avg. OfAll Farms
Number of fields 10Number of farms 9
Acres 61.25Yield per acre (ton) 21.82Operators share of yield % 100.00Value per ton 29.07Total product return per acre 634.19Crop insurance per acre 13.01Gross return per acre 647.20
Direct ExpensesSeed 71.18Fertilizer 77.57Crop chemicals 18.13Crop insurance 13.99Fuel & oil 38.99Repairs 25.69Custom hire 18.22Hired labor 2.03Land rent 120.34Machinery leases 10.84Operating interest 7.30Miscellaneous 7.36
Total direct expenses per acre 411.64Return over direct exp per acre 235.56
Overhead ExpensesHired labor 12.03Farm insurance 3.82Utilities 1.79Dues & professional fees 0.97Interest 2.53Mach & bldg depreciation 27.08Miscellaneous 3.23
Total overhead expenses per acre 51.44Total dir & ovhd expenses per acre 463.08Net return per acre 184.12
Government payments 20.24Net return with govt pmts 204.36Labor & management charge 36.57Net return over lbr & mgt 167.79
Cost of ProductionTotal direct expense per ton 18.87Total dir & ovhd exp per ton 21.23Less govt & other income 19.70With labor & management 21.38
Net value per unit 29.07Machinery cost per acre 120.66Est. labor hours per acre 2.97
2008 Annual Report RankEm, Copyright (c) 2001-09, Univ. of Minnesota
31
Crop Enterprise AnalysisSouthwest Minnesota Farm Business Management Association
(Farms Sorted By Net Return)
Hay, Alfalfa on Owned Land
Avg. OfAll Farms
Number of fields 9Number of farms 8
Acres 31.02Yield per acre (ton) 4.61Operators share of yield % 100.00Value per ton 123.18Total product return per acre 567.34Gross return per acre 567.34
Direct ExpensesFertilizer 36.51Crop chemicals 8.11Crop insurance 1.61Fuel & oil 39.80Repairs 40.68Custom hire 19.01Hired labor 4.80Machinery leases 30.31Utilities 1.16Operating interest 3.39Miscellaneous 1.90
Total direct expenses per acre 187.27Return over direct exp per acre 380.07
Overhead ExpensesHired labor 4.77Building leases 0.69RE & pers. property taxes 17.33Farm insurance 5.25Utilities 2.46Dues & professional fees 1.31Interest 76.64Mach & bldg depreciation 36.53Miscellaneous 2.33
Total overhead expenses per acre 147.31Total dir & ovhd expenses per acre 334.58Net return per acre 232.76
Government payments 18.07Net return with govt pmts 250.83Labor & management charge 36.03Net return over lbr & mgt 214.80
Cost of ProductionTotal direct expense per ton 40.66Total dir & ovhd exp per ton 72.64Less govt & other income 68.72With labor & management 76.54
Net value per unit 123.18Machinery cost per acre 167.84Est. labor hours per acre 3.22
2008 Annual Report RankEm, Copyright (c) 2001-09, Univ. of Minnesota
32
Crop Enterprise AnalysisSouthwest Minnesota Farm Business Management Association
(Farms Sorted By Net Return)
Hay, Alfalfa on Cash Rent
Avg. OfAll Farms
Number of fields 18Number of farms 12
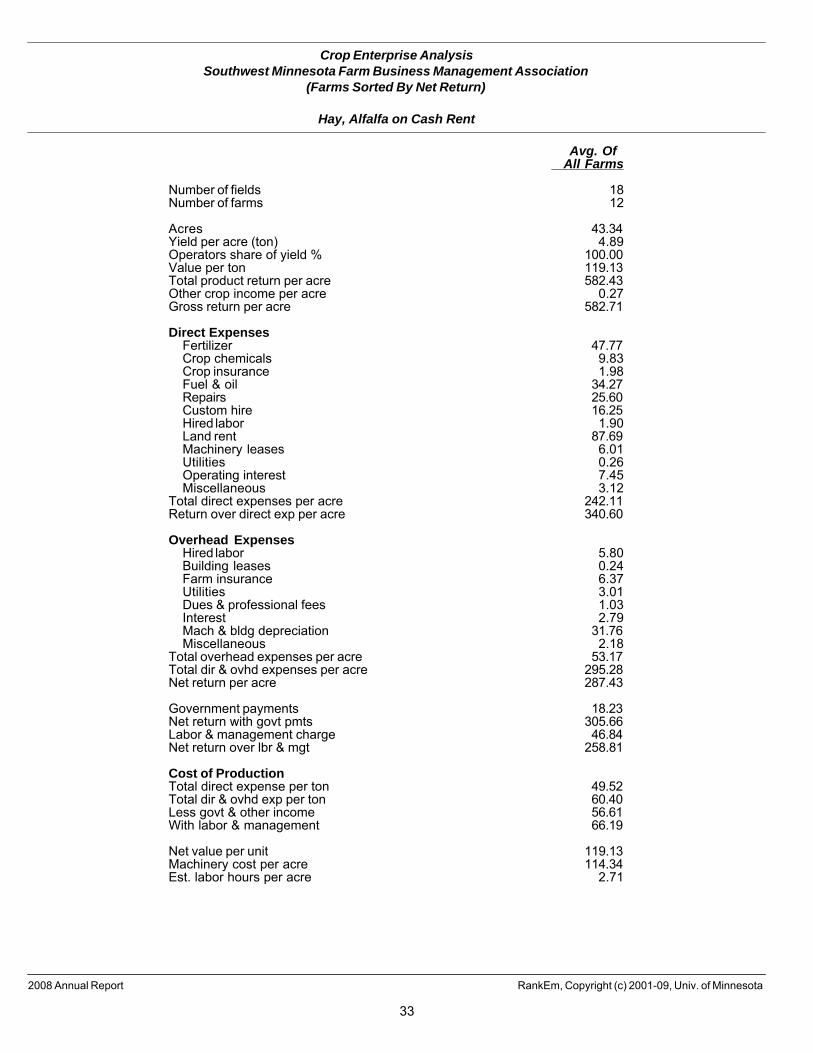
Acres 43.34Yield per acre (ton) 4.89Operators share of yield % 100.00Value per ton 119.13Total product return per acre 582.43Other crop income per acre 0.27Gross return per acre 582.71
Direct ExpensesFertilizer 47.77Crop chemicals 9.83Crop insurance 1.98Fuel & oil 34.27Repairs 25.60Custom hire 16.25Hired labor 1.90Land rent 87.69Machinery leases 6.01Utilities 0.26Operating interest 7.45Miscellaneous 3.12
Total direct expenses per acre 242.11Return over direct exp per acre 340.60
Overhead ExpensesHired labor 5.80Building leases 0.24Farm insurance 6.37Utilities 3.01Dues & professional fees 1.03Interest 2.79Mach & bldg depreciation 31.76Miscellaneous 2.18
Total overhead expenses per acre 53.17Total dir & ovhd expenses per acre 295.28Net return per acre 287.43
Government payments 18.23Net return with govt pmts 305.66Labor & management charge 46.84Net return over lbr & mgt 258.81
Cost of ProductionTotal direct expense per ton 49.52Total dir & ovhd exp per ton 60.40Less govt & other income 56.61With labor & management 66.19
Net value per unit 119.13Machinery cost per acre 114.34Est. labor hours per acre 2.71
2008 Annual Report RankEm, Copyright (c) 2001-09, Univ. of Minnesota
33
Crop Enterprise AnalysisSouthwest Minnesota Farm Business Management Association
(Farms Sorted By Net Return)
Hay, Grass on Owned Land
Avg. OfAll Farms
Number of fields 8Number of farms 8
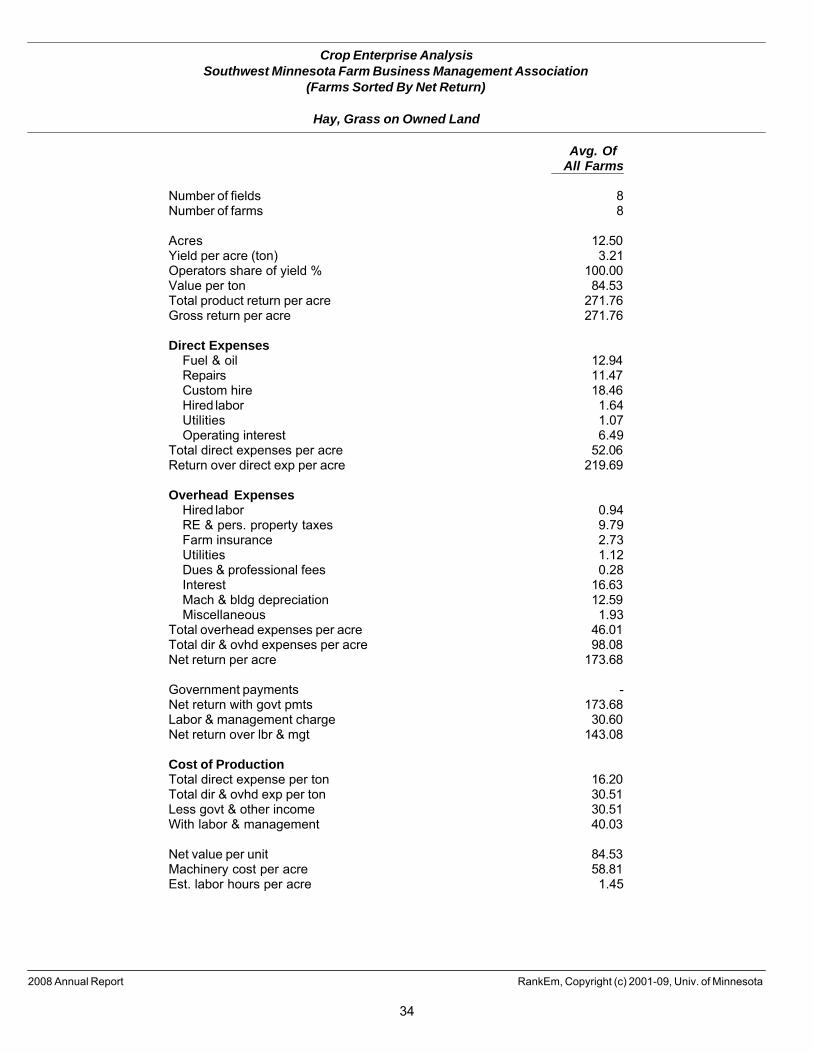
Acres 12.50Yield per acre (ton) 3.21Operators share of yield % 100.00Value per ton 84.53Total product return per acre 271.76Gross return per acre 271.76
Direct ExpensesFuel & oil 12.94Repairs 11.47Custom hire 18.46Hired labor 1.64Utilities 1.07Operating interest 6.49
Total direct expenses per acre 52.06Return over direct exp per acre 219.69
Overhead ExpensesHired labor 0.94RE & pers. property taxes 9.79Farm insurance 2.73Utilities 1.12Dues & professional fees 0.28Interest 16.63Mach & bldg depreciation 12.59Miscellaneous 1.93
Total overhead expenses per acre 46.01Total dir & ovhd expenses per acre 98.08Net return per acre 173.68
Government payments -Net return with govt pmts 173.68Labor & management charge 30.60Net return over lbr & mgt 143.08
Cost of ProductionTotal direct expense per ton 16.20Total dir & ovhd exp per ton 30.51Less govt & other income 30.51With labor & management 40.03
Net value per unit 84.53Machinery cost per acre 58.81Est. labor hours per acre 1.45
2008 Annual Report RankEm, Copyright (c) 2001-09, Univ. of Minnesota
34
Crop Enterprise AnalysisSouthwest Minnesota Farm Business Management Association
(Farms Sorted By Net Return)
Hay, Grass on Cash Rent
Avg. OfAll Farms
Number of fields 5Number of farms 5
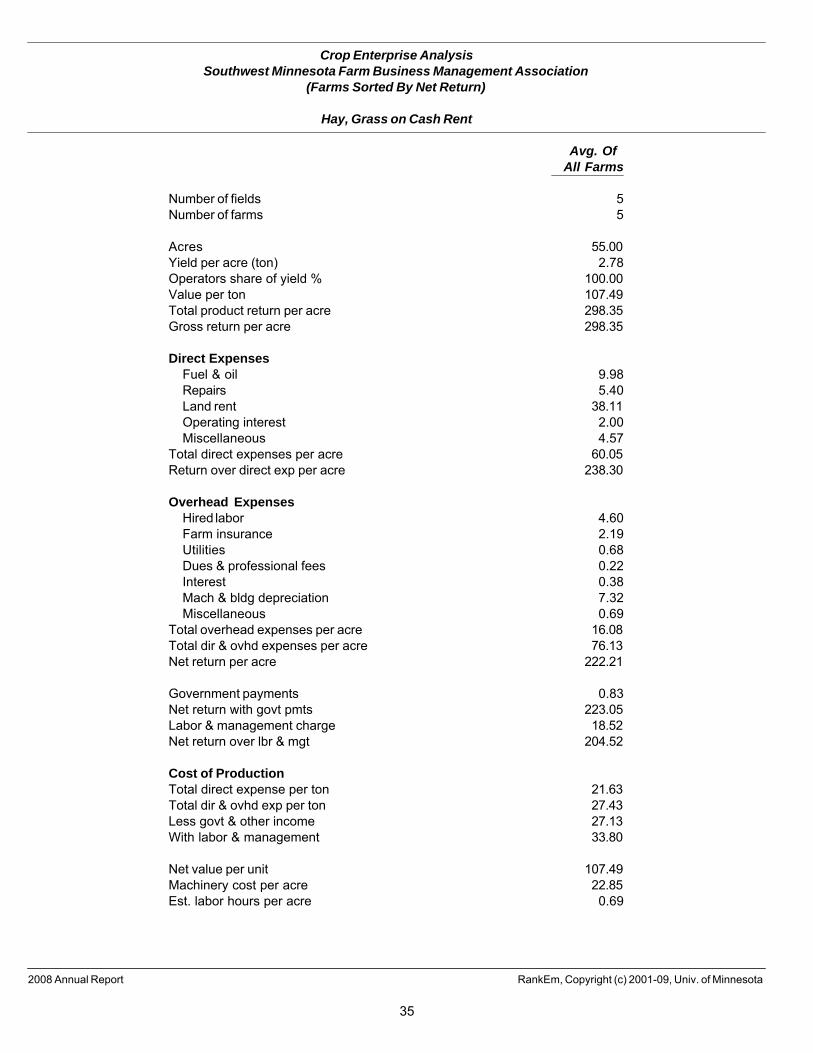
Acres 55.00Yield per acre (ton) 2.78Operators share of yield % 100.00Value per ton 107.49Total product return per acre 298.35Gross return per acre 298.35
Direct ExpensesFuel & oil 9.98Repairs 5.40Land rent 38.11Operating interest 2.00Miscellaneous 4.57
Total direct expenses per acre 60.05Return over direct exp per acre 238.30
Overhead ExpensesHired labor 4.60Farm insurance 2.19Utilities 0.68Dues & professional fees 0.22Interest 0.38Mach & bldg depreciation 7.32Miscellaneous 0.69
Total overhead expenses per acre 16.08Total dir & ovhd expenses per acre 76.13Net return per acre 222.21
Government payments 0.83Net return with govt pmts 223.05Labor & management charge 18.52Net return over lbr & mgt 204.52
Cost of ProductionTotal direct expense per ton 21.63Total dir & ovhd exp per ton 27.43Less govt & other income 27.13With labor & management 33.80
Net value per unit 107.49Machinery cost per acre 22.85Est. labor hours per acre 0.69
2008 Annual Report RankEm, Copyright (c) 2001-09, Univ. of Minnesota
35
Crop Enterprise AnalysisSouthwest Minnesota Farm Business Management Association
(Farms Sorted By Net Return)
Pasture on Owned Land
Avg. OfAll Farms
Number of fields 5Number of farms 5
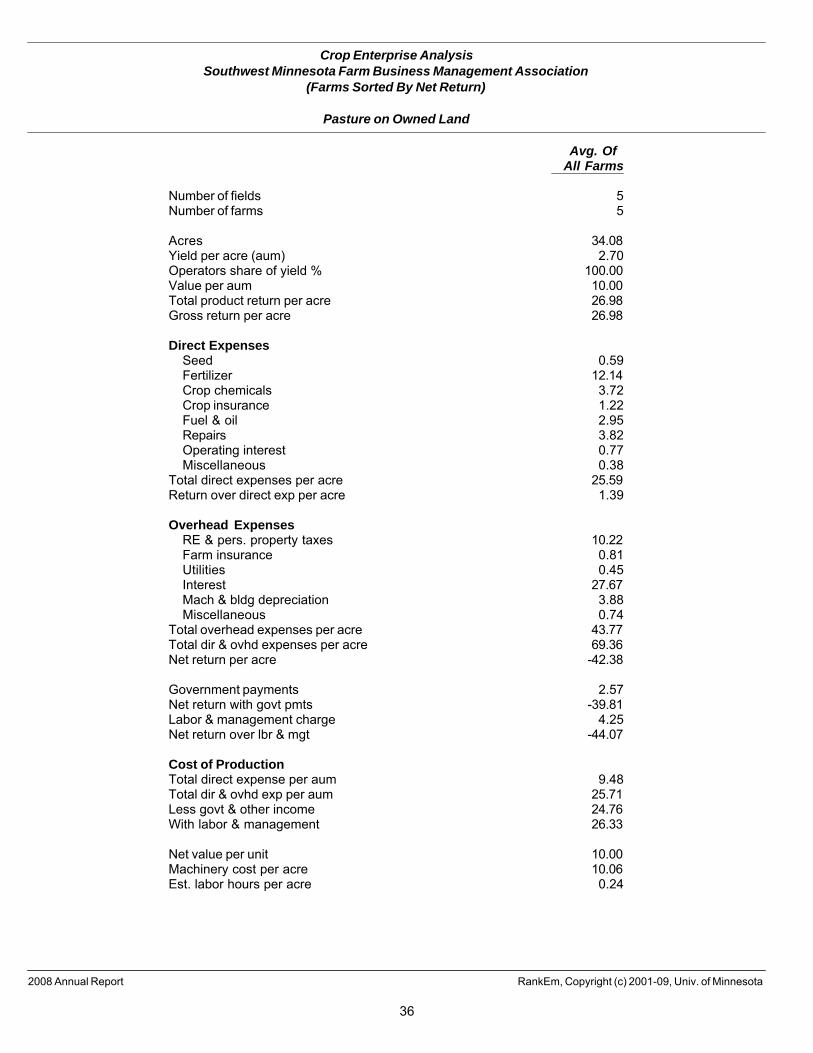
Acres 34.08Yield per acre (aum) 2.70Operators share of yield % 100.00Value per aum 10.00Total product return per acre 26.98Gross return per acre 26.98
Direct ExpensesSeed 0.59Fertilizer 12.14Crop chemicals 3.72Crop insurance 1.22Fuel & oil 2.95Repairs 3.82Operating interest 0.77Miscellaneous 0.38
Total direct expenses per acre 25.59Return over direct exp per acre 1.39
Overhead ExpensesRE & pers. property taxes 10.22Farm insurance 0.81Utilities 0.45Interest 27.67Mach & bldg depreciation 3.88Miscellaneous 0.74
Total overhead expenses per acre 43.77Total dir & ovhd expenses per acre 69.36Net return per acre -42.38
Government payments 2.57Net return with govt pmts -39.81Labor & management charge 4.25Net return over lbr & mgt -44.07
Cost of ProductionTotal direct expense per aum 9.48Total dir & ovhd exp per aum 25.71Less govt & other income 24.76With labor & management 26.33
Net value per unit 10.00Machinery cost per acre 10.06Est. labor hours per acre 0.24
2008 Annual Report RankEm, Copyright (c) 2001-09, Univ. of Minnesota
36
Crop Enterprise AnalysisSouthwest Minnesota Farm Business Management Association
(Farms Sorted By Net Return)
Pasture on Cash Rent
Avg. OfAll Farms
Number of fields 5Number of farms 5
Acres 81.80Yield per acre (aum) 2.25Operators share of yield % 100.00Value per aum 10.00Total product return per acre 22.54Other crop income per acre 6.50Gross return per acre 29.04
Direct ExpensesFertilizer 0.53Crop chemicals 3.92Fuel & oil 2.47Repairs 2.68Land rent 34.06Operating interest 0.88
Total direct expenses per acre 44.54Return over direct exp per acre -15.49
Overhead ExpensesHired labor 0.52Mach & bldg depreciation 2.76Miscellaneous 1.08
Total overhead expenses per acre 4.35Total dir & ovhd expenses per acre 48.89Net return per acre -19.85
Government payments -Net return with govt pmts -19.85Labor & management charge 3.15Net return over lbr & mgt -23.00
Cost of ProductionTotal direct expense per aum 19.76Total dir & ovhd exp per aum 21.69Less govt & other income 18.81With labor & management 20.21
Net value per unit 10.00Machinery cost per acre 7.57Est. labor hours per acre 0.16
2008 Annual Report RankEm, Copyright (c) 2001-09, Univ. of Minnesota
37
Crop Enterprise AnalysisSouthwest Minnesota Farm Business Management Association
(Farms Sorted By Net Return)
CRP on Owned Land
Avg. OfAll Farms
Number of fields 19Number of farms 19
Acres 33.17Yield per acre ($) 90.16Operators share of yield % 100.00Value per $ 1.00Total product return per acre 90.16Gross return per acre 90.16
Direct ExpensesCrop chemicals 0.60Fuel & oil 2.64Repairs 3.81Operating interest 0.66
Total direct expenses per acre 7.70Return over direct exp per acre 82.45
Overhead ExpensesRE & pers. property taxes 13.40Farm insurance 0.70Utilities 0.62Interest 34.70Mach & bldg depreciation 15.25Miscellaneous 0.88
Total overhead expenses per acre 65.55Total dir & ovhd expenses per acre 73.26Net return per acre 16.90
Government payments -Net return with govt pmts 16.90Labor & management charge 5.22Net return over lbr & mgt 11.68
Cost of ProductionTotal direct expense per $ 0.09Total dir & ovhd exp per $ 0.81Less govt & other income 0.81With labor & management 0.87
Net value per unit 1.00Machinery cost per acre 20.35Est. labor hours per acre 0.29
2008 Annual Report RankEm, Copyright (c) 2001-09, Univ. of Minnesota
38
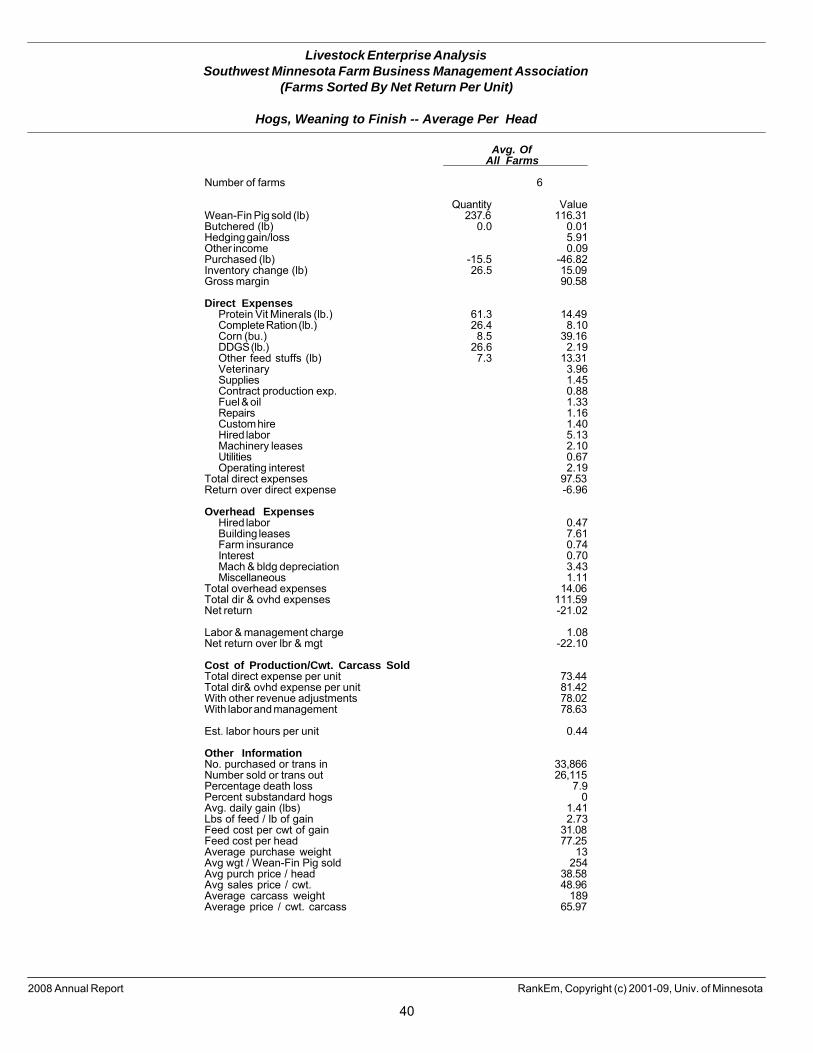
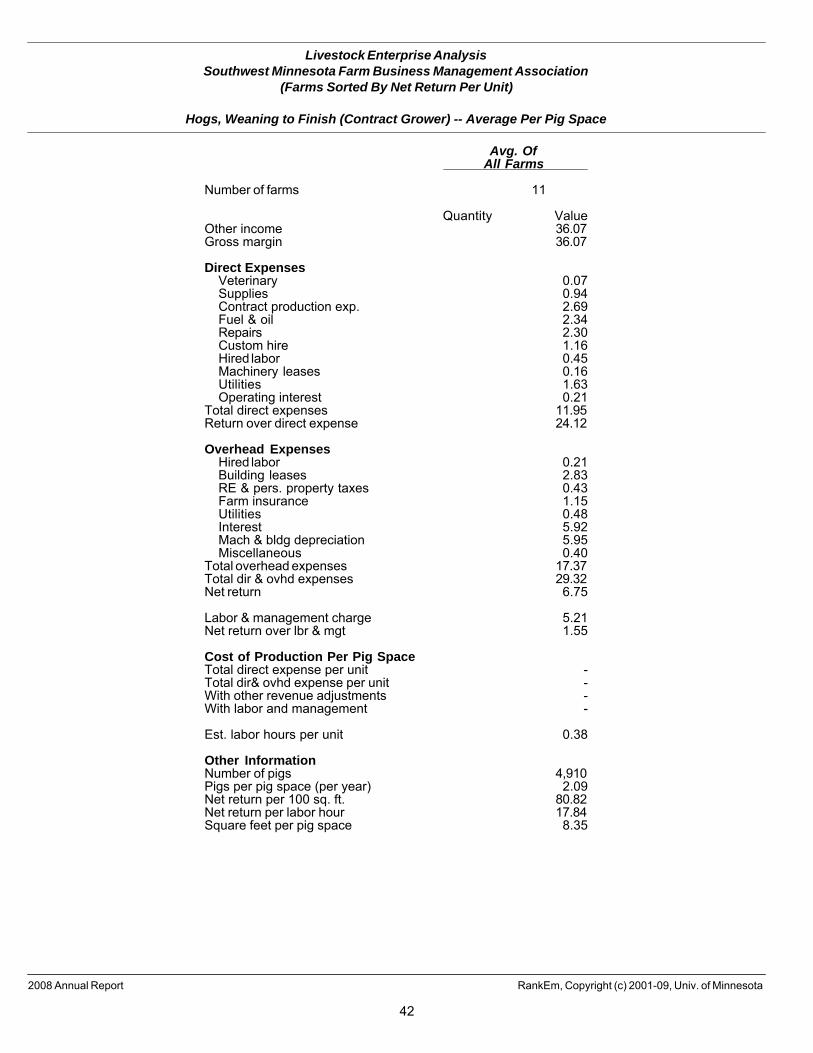
Livestock ReportsThe Livestock Enterprise Analysis tables show the average physical production, gross margin overpurchase costs, direct costs, overhead costs, and net returns per budget unit.
The “Dairy” table contains the information for only the milking herd (which includes dry cows).“Dairy Replacement Heifers” are those heifers kept for replacement into the milking herd. The“Dairy and Replacement Heifers” table is for the whole herd and includes those farms in the “Dairy”and “Dairy Replacement Heifers” tables; it does not include “Dairy Steers.”
Gross Margin is the accrual gross value added by the enterprise. It includes income from sale ofoffspring and livestock products, cull income, non-cash transfers to other enterprises, and the valueof production used in the home or for feed. It also includes the value of inventory change frombeginning to the end of the year. The cost of livestock purchased and the value of animalstransferred in are deducted.
Net Return is the amount contributed by a unit of the enterprise toward operator labor, management,and equity capital. Any wages and benefits paid to the operator are removed from labor costs (andadded to Labor and Management Charge) so that all farms are on equal footing.
Net Return Over Labor and Management is the return remaining after compensating the operatorfor unpaid labor and management. This is the per unit return to equity capital.
Cost of Production section shows the average cost per unit sold in each cost category. Total directand overhead expense per unit is the breakeven price needed to cover cash costs and depreciation.For grow/finish enterprises, this includes the purchase cost or transfer in value of the animal. Withother revenue adjustments is the breakeven price adjusted for cull sales, other offspring sales, thecost of replacement stock, and any other miscellaneous income. This assumes that some costs canbe covered by these other income sources. With labor and management is the final breakeven priceto provide a labor and management return for the operator(s).
Other Information contains both economic and technical efficiency measures for each enterprise. Rounding of individual items for the report may have caused minor discrepancies with the calculatedtotals. If fewer than 5 farms have a certain livestock enterprise, that information is not reported.If there are fewer than 25 farms, the high and low groups are not reported.
39
Livestock Enterprise AnalysisSouthwest Minnesota Farm Business Management Association
(Farms Sorted By Net Return Per Unit)
Hogs, Weaning to Finish -- Average Per Head
Avg. OfAll Farms
Number of farms 6
Quantity ValueWean-Fin Pig sold (lb) 237.6 116.31Butchered (lb) 0.0 0.01Hedging gain/loss 5.91Other income 0.09Purchased (lb) -15.5 -46.82Inventory change (lb) 26.5 15.09Gross margin 90.58
Direct ExpensesProtein Vit Minerals (lb.) 61.3 14.49Complete Ration (lb.) 26.4 8.10Corn (bu.) 8.5 39.16DDGS (lb.) 26.6 2.19Other feed stuffs (lb) 7.3 13.31Veterinary 3.96Supplies 1.45Contract production exp. 0.88Fuel & oil 1.33Repairs 1.16Custom hire 1.40Hired labor 5.13Machinery leases 2.10Utilities 0.67Operating interest 2.19
Total direct expenses 97.53Return over direct expense -6.96
Overhead ExpensesHired labor 0.47Building leases 7.61Farm insurance 0.74Interest 0.70Mach & bldg depreciation 3.43Miscellaneous 1.11
Total overhead expenses 14.06Total dir & ovhd expenses 111.59Net return -21.02
Labor & management charge 1.08Net return over lbr & mgt -22.10
Cost of Production/Cwt. Carcass SoldTotal direct expense per unit 73.44Total dir& ovhd expense per unit 81.42With other revenue adjustments 78.02With labor and management 78.63
Est. labor hours per unit 0.44
Other InformationNo. purchased or trans in 33,866Number sold or trans out 26,115Percentage death loss 7.9Percent substandard hogs 0Avg. daily gain (lbs) 1.41Lbs of feed / lb of gain 2.73Feed cost per cwt of gain 31.08Feed cost per head 77.25Average purchase weight 13Avg wgt / Wean-Fin Pig sold 254Avg purch price / head 38.58Avg sales price / cwt. 48.96Average carcass weight 189Average price / cwt. carcass 65.97
2008 Annual Report RankEm, Copyright (c) 2001-09, Univ. of Minnesota
40

Livestock Enterprise AnalysisSouthwest Minnesota Farm Business Management Association
(Farms Sorted By Net Return Per Unit)
Hogs, Weaning to Finish -- Average Per Cwt. Carcass Sold
Avg. OfAll Farms
Number of farms 6
Quantity ValueWean-Fin Pig sold (lb) 134.96 66.08Butchered (lb) 0.02 0.01Hedging gain/loss 3.36Other income 0.05Purchased (lb) -8.82 -26.60Inventory change (lb) 15.08 8.57Gross margin 51.46
Direct ExpensesProtein Vit Minerals (lb.) 34.80 8.23Complete Ration (lb.) 15.00 4.60Corn (bu.) 4.80 22.25DDGS (lb.) 15.10 1.24Other feed stuffs (lb) 4.15 7.56Veterinary 2.25Supplies 0.83Contract production exp. 0.50Fuel & oil 0.76Repairs 0.66Custom hire 0.80Hired labor 2.91Machinery leases 1.19Utilities 0.38Operating interest 1.25
Total direct expenses 55.41Return over direct expense -3.95
Overhead ExpensesHired labor 0.26Building leases 4.32Farm insurance 0.42Interest 0.40Mach & bldg depreciation 1.95Miscellaneous 0.63
Total overhead expenses 7.99Total dir & ovhd expenses 63.40Net return -11.94
Labor & management charge 0.61Net return over lbr & mgt -12.55
Cost of Production/Cwt. Carcass SoldTotal direct expense per unit 73.44Total dir& ovhd expense per unit 81.42With other revenue adjustments 78.02With labor and management 78.63
Est. labor hours per unit 0.25
Other InformationNo. purchased or trans in 33,866Number sold or trans out 26,115Percentage death loss 7.9Percent substandard hogs 0Avg. daily gain (lbs) 1.41Lbs of feed / lb of gain 2.73Feed cost per cwt of gain 31.08Feed cost per head 77.25Average purchase weight 13Avg wgt / Wean-Fin Pig sold 254Avg purch price / head 38.58Avg sales price / cwt. 48.96Average carcass weight 189Average price / cwt. carcass 65.97
2008 Annual Report RankEm, Copyright (c) 2001-09, Univ. of Minnesota
41
Livestock Enterprise AnalysisSouthwest Minnesota Farm Business Management Association
(Farms Sorted By Net Return Per Unit)
Hogs, Weaning to Finish (Contract Grower) -- Average Per Pig Space
Avg. OfAll Farms
Number of farms 11
Quantity ValueOther income 36.07Gross margin 36.07
Direct ExpensesVeterinary 0.07Supplies 0.94Contract production exp. 2.69Fuel & oil 2.34Repairs 2.30Custom hire 1.16Hired labor 0.45Machinery leases 0.16Utilities 1.63Operating interest 0.21
Total direct expenses 11.95Return over direct expense 24.12
Overhead ExpensesHired labor 0.21Building leases 2.83RE & pers. property taxes 0.43Farm insurance 1.15Utilities 0.48Interest 5.92Mach & bldg depreciation 5.95Miscellaneous 0.40
Total overhead expenses 17.37Total dir & ovhd expenses 29.32Net return 6.75
Labor & management charge 5.21Net return over lbr & mgt 1.55
Cost of Production Per Pig SpaceTotal direct expense per unit -Total dir& ovhd expense per unit -With other revenue adjustments -With labor and management -
Est. labor hours per unit 0.38
Other InformationNumber of pigs 4,910Pigs per pig space (per year) 2.09Net return per 100 sq. ft. 80.82Net return per labor hour 17.84Square feet per pig space 8.35
2008 Annual Report RankEm, Copyright (c) 2001-09, Univ. of Minnesota
42
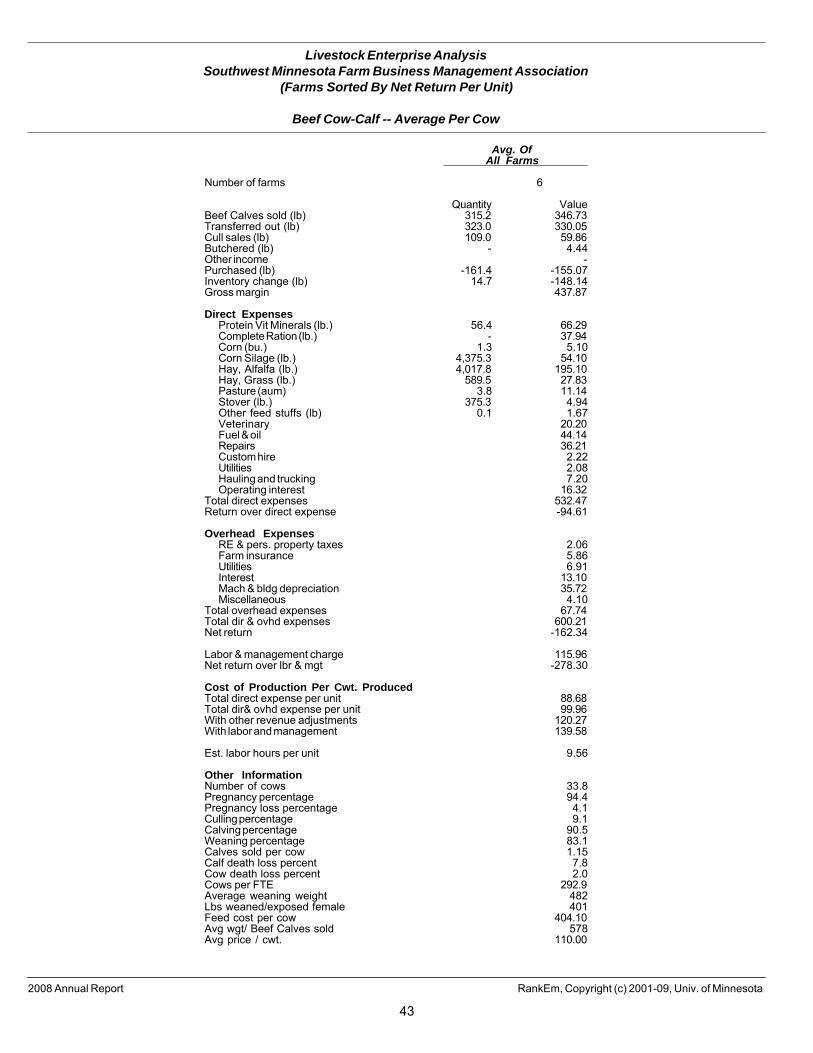
Livestock Enterprise AnalysisSouthwest Minnesota Farm Business Management Association
(Farms Sorted By Net Return Per Unit)
Beef Cow-Calf -- Average Per Cow
Avg. OfAll Farms
Number of farms 6
Quantity ValueBeef Calves sold (lb) 315.2 346.73Transferred out (lb) 323.0 330.05Cull sales (lb) 109.0 59.86Butchered (lb) - 4.44Other income -Purchased (lb) -161.4 -155.07Inventory change (lb) 14.7 -148.14Gross margin 437.87
Direct ExpensesProtein Vit Minerals (lb.) 56.4 66.29Complete Ration (lb.) - 37.94Corn (bu.) 1.3 5.10Corn Silage (lb.) 4,375.3 54.10Hay, Alfalfa (lb.) 4,017.8 195.10Hay, Grass (lb.) 589.5 27.83Pasture (aum) 3.8 11.14Stover (lb.) 375.3 4.94Other feed stuffs (lb) 0.1 1.67Veterinary 20.20Fuel & oil 44.14Repairs 36.21Custom hire 2.22Utilities 2.08Hauling and trucking 7.20Operating interest 16.32
Total direct expenses 532.47Return over direct expense -94.61
Overhead ExpensesRE & pers. property taxes 2.06Farm insurance 5.86Utilities 6.91Interest 13.10Mach & bldg depreciation 35.72Miscellaneous 4.10
Total overhead expenses 67.74Total dir & ovhd expenses 600.21Net return -162.34
Labor & management charge 115.96Net return over lbr & mgt -278.30
Cost of Production Per Cwt. ProducedTotal direct expense per unit 88.68Total dir& ovhd expense per unit 99.96With other revenue adjustments 120.27With labor and management 139.58
Est. labor hours per unit 9.56
Other InformationNumber of cows 33.8Pregnancy percentage 94.4Pregnancy loss percentage 4.1Culling percentage 9.1Calving percentage 90.5Weaning percentage 83.1Calves sold per cow 1.15Calf death loss percent 7.8Cow death loss percent 2.0Cows per FTE 292.9Average weaning weight 482Lbs weaned/exposed female 401Feed cost per cow 404.10Avg wgt/ Beef Calves sold 578Avg price / cwt. 110.00
2008 Annual Report RankEm, Copyright (c) 2001-09, Univ. of Minnesota
43

Livestock Enterprise AnalysisSouthwest Minnesota Farm Business Management Association
(Farms Sorted By Net Return Per Unit)
Beef Finishing -- Average Per Head
Avg. OfAll Farms
Number of farms 10
Quantity ValueFinish Beef sold (lb) 1,289.8 1,237.10Transferred out (lb) 9.9 9.94Cull sales (lb) 4.2 4.22Butchered (lb) 4.2 3.96Other income -Purchased (lb) -457.4 -504.27Transferred in (lb) -29.1 -29.37Inventory change (lb) -143.0 -212.42Gross margin 509.17
Direct ExpensesCorn Gluten (lb.) 1,069.8 34.98Corn Distillers Grn (dry) (lb.) 115.6 9.68Protein Vit Minerals (lb.) 337.3 55.93Complete Ration (lb.) - 6.21Corn (bu.) 59.0 264.75Corn Silage (lb.) 3,069.0 38.13Hay, Alfalfa (lb.) 252.4 14.03Hay, Grass (lb.) 144.9 6.18Haylage, Alfalfa (lb.) 106.2 2.13Other feed stuffs (lb) 429.5 8.38Veterinary 10.22Supplies 11.32Fuel & oil 12.68Repairs 12.08Custom hire 13.10Hauling and trucking 14.78Operating interest 28.10
Total direct expenses 542.66Return over direct expense -33.49
Overhead ExpensesHired labor 5.27RE & pers. property taxes 1.69Farm insurance 3.81Utilities 2.42Interest 13.57Mach & bldg depreciation 19.04Miscellaneous 4.58
Total overhead expenses 50.37Total dir & ovhd expenses 593.03Net return -83.86
Labor & management charge 31.51Net return over lbr & mgt -115.37
Cost of Production Per Cwt. ProducedTotal direct expense per unit 98.52Total dir& ovhd expense per unit 102.40With other revenue adjustments 102.40With labor and management 104.82
Est. labor hours per unit 2.74
Other InformationNo. purchased or trans in 280Number sold or trans out 362Percentage death loss 1.1Avg. daily gain (lbs) 2.61Lbs of conc / lb of gain 7.49Lbs of feed / lb of gain 9.85Feed cost per cwt of gain 64.90Feed cost per head 440.39Average purchase weight 645Avg wgt / Finish Beef sold 1,333Avg purch price / cwt. 110.25Avg sales price / cwt. 95.92
2008 Annual Report RankEm, Copyright (c) 2001-09, Univ. of Minnesota
44
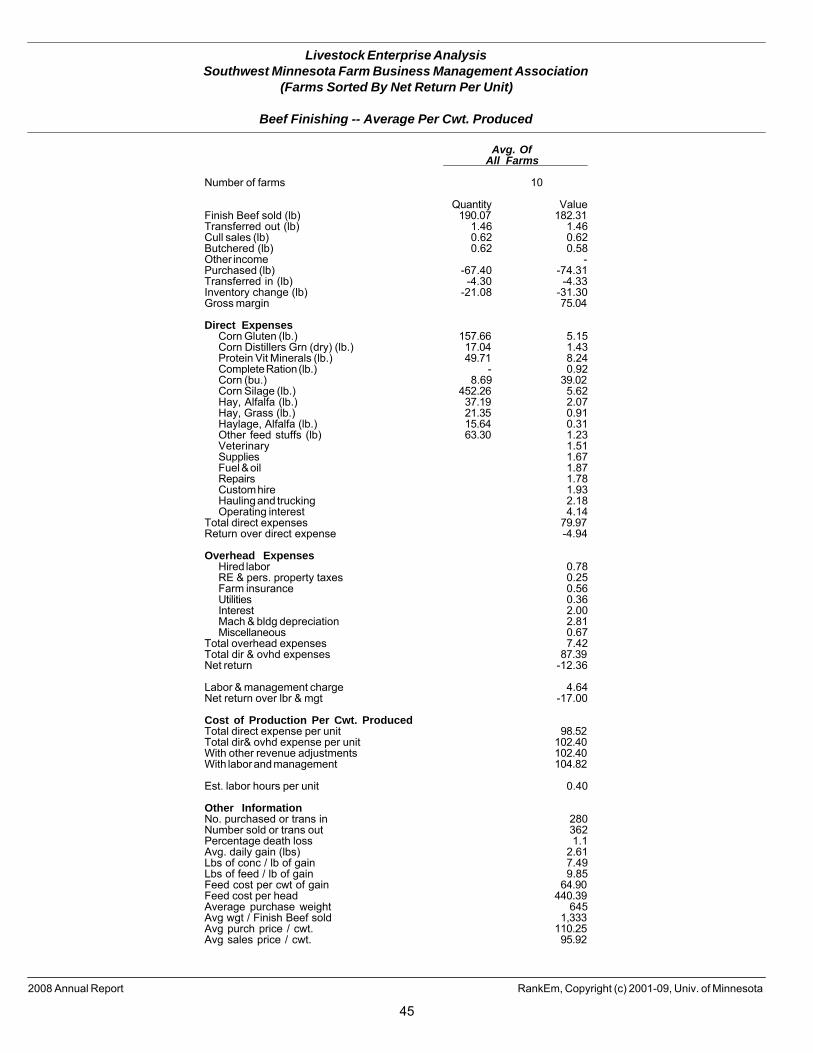
Livestock Enterprise AnalysisSouthwest Minnesota Farm Business Management Association
(Farms Sorted By Net Return Per Unit)
Beef Finishing -- Average Per Cwt. Produced
Avg. OfAll Farms
Number of farms 10
Quantity ValueFinish Beef sold (lb) 190.07 182.31Transferred out (lb) 1.46 1.46Cull sales (lb) 0.62 0.62Butchered (lb) 0.62 0.58Other income -Purchased (lb) -67.40 -74.31Transferred in (lb) -4.30 -4.33Inventory change (lb) -21.08 -31.30Gross margin 75.04
Direct ExpensesCorn Gluten (lb.) 157.66 5.15Corn Distillers Grn (dry) (lb.) 17.04 1.43Protein Vit Minerals (lb.) 49.71 8.24Complete Ration (lb.) - 0.92Corn (bu.) 8.69 39.02Corn Silage (lb.) 452.26 5.62Hay, Alfalfa (lb.) 37.19 2.07Hay, Grass (lb.) 21.35 0.91Haylage, Alfalfa (lb.) 15.64 0.31Other feed stuffs (lb) 63.30 1.23Veterinary 1.51Supplies 1.67Fuel & oil 1.87Repairs 1.78Custom hire 1.93Hauling and trucking 2.18Operating interest 4.14
Total direct expenses 79.97Return over direct expense -4.94
Overhead ExpensesHired labor 0.78RE & pers. property taxes 0.25Farm insurance 0.56Utilities 0.36Interest 2.00Mach & bldg depreciation 2.81Miscellaneous 0.67
Total overhead expenses 7.42Total dir & ovhd expenses 87.39Net return -12.36
Labor & management charge 4.64Net return over lbr & mgt -17.00
Cost of Production Per Cwt. ProducedTotal direct expense per unit 98.52Total dir& ovhd expense per unit 102.40With other revenue adjustments 102.40With labor and management 104.82
Est. labor hours per unit 0.40
Other InformationNo. purchased or trans in 280Number sold or trans out 362Percentage death loss 1.1Avg. daily gain (lbs) 2.61Lbs of conc / lb of gain 7.49Lbs of feed / lb of gain 9.85Feed cost per cwt of gain 64.90Feed cost per head 440.39Average purchase weight 645Avg wgt / Finish Beef sold 1,333Avg purch price / cwt. 110.25Avg sales price / cwt. 95.92
2008 Annual Report RankEm, Copyright (c) 2001-09, Univ. of Minnesota
45
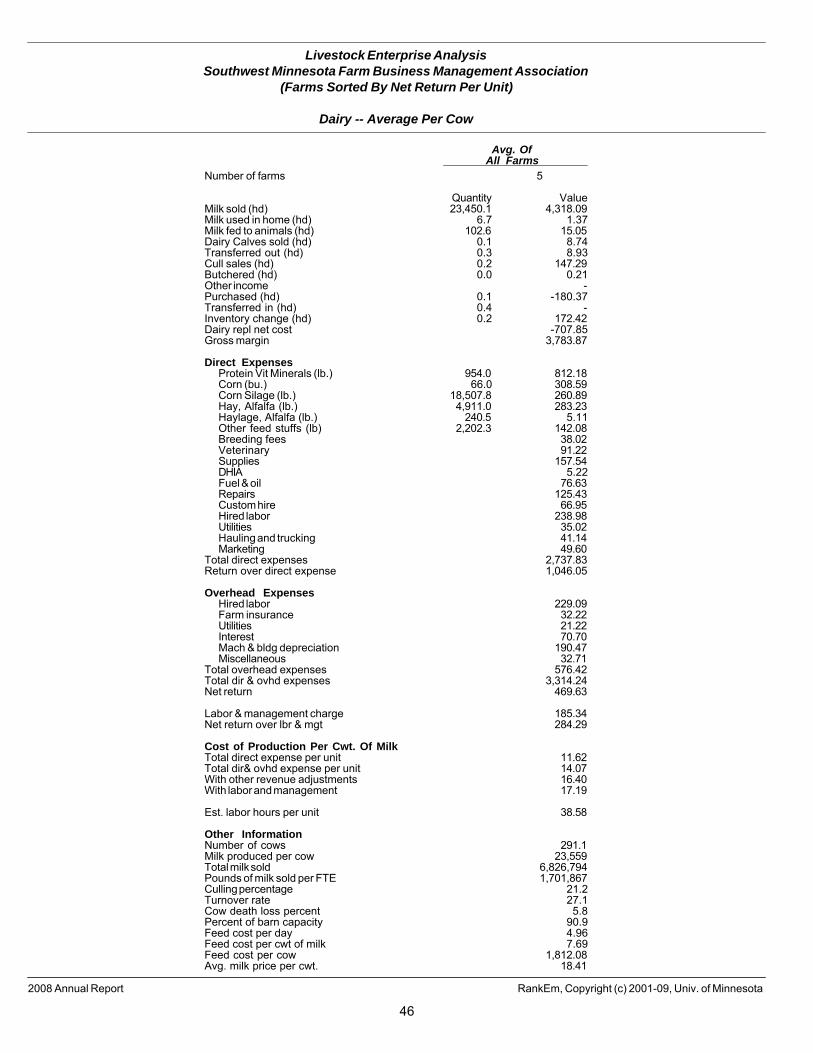
Livestock Enterprise AnalysisSouthwest Minnesota Farm Business Management Association
(Farms Sorted By Net Return Per Unit)
Dairy -- Average Per Cow
Avg. OfAll Farms
Number of farms 5
Quantity ValueMilk sold (hd) 23,450.1 4,318.09Milk used in home (hd) 6.7 1.37Milk fed to animals (hd) 102.6 15.05Dairy Calves sold (hd) 0.1 8.74Transferred out (hd) 0.3 8.93Cull sales (hd) 0.2 147.29Butchered (hd) 0.0 0.21Other income -Purchased (hd) 0.1 -180.37Transferred in (hd) 0.4 -Inventory change (hd) 0.2 172.42Dairy repl net cost -707.85Gross margin 3,783.87
Direct ExpensesProtein Vit Minerals (lb.) 954.0 812.18Corn (bu.) 66.0 308.59Corn Silage (lb.) 18,507.8 260.89Hay, Alfalfa (lb.) 4,911.0 283.23Haylage, Alfalfa (lb.) 240.5 5.11Other feed stuffs (lb) 2,202.3 142.08Breeding fees 38.02Veterinary 91.22Supplies 157.54DHIA 5.22Fuel & oil 76.63Repairs 125.43Custom hire 66.95Hired labor 238.98Utilities 35.02Hauling and trucking 41.14Marketing 49.60
Total direct expenses 2,737.83Return over direct expense 1,046.05
Overhead ExpensesHired labor 229.09Farm insurance 32.22Utilities 21.22Interest 70.70Mach & bldg depreciation 190.47Miscellaneous 32.71
Total overhead expenses 576.42Total dir & ovhd expenses 3,314.24Net return 469.63
Labor & management charge 185.34Net return over lbr & mgt 284.29
Cost of Production Per Cwt. Of MilkTotal direct expense per unit 11.62Total dir& ovhd expense per unit 14.07With other revenue adjustments 16.40With labor and management 17.19
Est. labor hours per unit 38.58
Other InformationNumber of cows 291.1Milk produced per cow 23,559Total milk sold 6,826,794Pounds of milk sold per FTE 1,701,867Culling percentage 21.2Turnover rate 27.1Cow death loss percent 5.8Percent of barn capacity 90.9Feed cost per day 4.96Feed cost per cwt of milk 7.69Feed cost per cow 1,812.08Avg. milk price per cwt. 18.41
2008 Annual Report RankEm, Copyright (c) 2001-09, Univ. of Minnesota
46

Livestock Enterprise AnalysisSouthwest Minnesota Farm Business Management Association
(Farms Sorted By Net Return Per Unit)
Dairy Replacement Heifers -- Average Per Head
Avg. OfAll Farms
Number of farms 5
Quantity ValueReplacements sold (hd) 0.3 53.63Transferred out (hd) 0.4 496.88Cull sales (hd) 0.0 2.83Other income -Transferred in (hd) 0.3 -41.93Inventory change (hd) 0.0 -116.87Gross margin 394.54
Direct ExpensesProtein Vit Minerals (lb.) 91.5 61.00Complete Ration (lb.) 57.7 11.53Corn (bu.) 12.1 56.35Corn Silage (lb.) 5,182.3 74.95Hay, Alfalfa (lb.) 3,082.9 171.22Hay, Grass (lb.) 81.3 3.25Oatlage (lb.) 119.1 1.19Oats (bu.) 0.7 2.11Pasture (aum) 0.3 2.98Other feed stuffs (lb) 43.6 1.74Breeding fees 10.80Veterinary 20.54Supplies 3.46Contract production exp. 108.33Fuel & oil 11.88Repairs 9.43Custom hire 18.45
Total direct expenses 569.22Return over direct expense -174.68
Overhead ExpensesHired labor 27.12Building leases 10.46Farm insurance 4.72Utilities 2.86Dues & professional fees 0.57Interest 11.82Mach & bldg depreciation 30.31Miscellaneous 3.96
Total overhead expenses 91.82Total dir & ovhd expenses 661.04Net return -266.51
Labor & management charge 26.80Net return over lbr & mgt -293.31
Cost of ProductionPer Head Per DayTotal direct expense per unit 1.99Total dir& ovhd expense per unit 2.24With other revenue adjustments 2.24With labor and management 2.31
Est. labor hours per unit 5.81
Other InformationNo. purchased or trans in 96Number sold or trans out 177Average number of head 275Percentage death loss 3.8Feed cost per average head 386.32Feed cost/head sold/trans 602.79Total cost/head sold/trans 1,316.64Feed cost per head per day 1.06Avg. wgt / Replacements sold 175Avg. sales price / head 214.37
2008 Annual Report RankEm, Copyright (c) 2001-09, Univ. of Minnesota
47
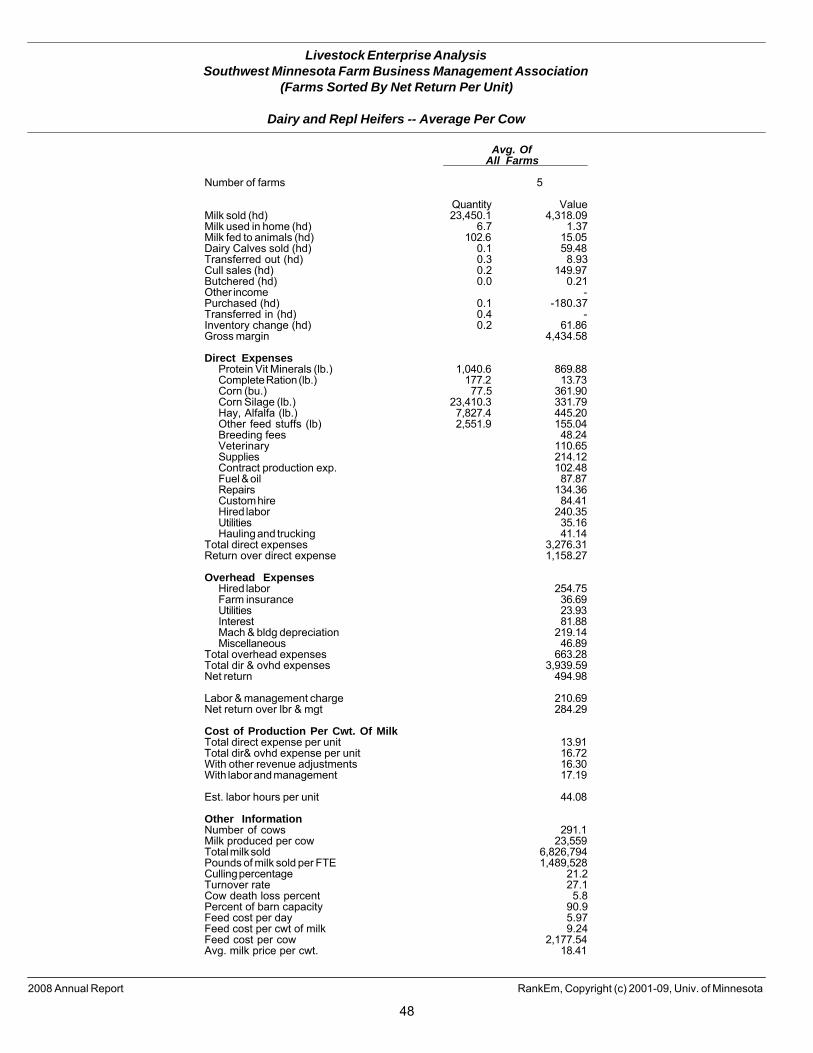
Livestock Enterprise AnalysisSouthwest Minnesota Farm Business Management Association
(Farms Sorted By Net Return Per Unit)
Dairy and Repl Heifers -- Average Per Cow
Avg. OfAll Farms
Number of farms 5
Quantity ValueMilk sold (hd) 23,450.1 4,318.09Milk used in home (hd) 6.7 1.37Milk fed to animals (hd) 102.6 15.05Dairy Calves sold (hd) 0.1 59.48Transferred out (hd) 0.3 8.93Cull sales (hd) 0.2 149.97Butchered (hd) 0.0 0.21Other income -Purchased (hd) 0.1 -180.37Transferred in (hd) 0.4 -Inventory change (hd) 0.2 61.86Gross margin 4,434.58
Direct ExpensesProtein Vit Minerals (lb.) 1,040.6 869.88Complete Ration (lb.) 177.2 13.73Corn (bu.) 77.5 361.90Corn Silage (lb.) 23,410.3 331.79Hay, Alfalfa (lb.) 7,827.4 445.20Other feed stuffs (lb) 2,551.9 155.04Breeding fees 48.24Veterinary 110.65Supplies 214.12Contract production exp. 102.48Fuel & oil 87.87Repairs 134.36Custom hire 84.41Hired labor 240.35Utilities 35.16Hauling and trucking 41.14
Total direct expenses 3,276.31Return over direct expense 1,158.27
Overhead ExpensesHired labor 254.75Farm insurance 36.69Utilities 23.93Interest 81.88Mach & bldg depreciation 219.14Miscellaneous 46.89
Total overhead expenses 663.28Total dir & ovhd expenses 3,939.59Net return 494.98
Labor & management charge 210.69Net return over lbr & mgt 284.29
Cost of Production Per Cwt. Of MilkTotal direct expense per unit 13.91Total dir& ovhd expense per unit 16.72With other revenue adjustments 16.30With labor and management 17.19
Est. labor hours per unit 44.08
Other InformationNumber of cows 291.1Milk produced per cow 23,559Total milk sold 6,826,794Pounds of milk sold per FTE 1,489,528Culling percentage 21.2Turnover rate 27.1Cow death loss percent 5.8Percent of barn capacity 90.9Feed cost per day 5.97Feed cost per cwt of milk 9.24Feed cost per cow 2,177.54Avg. milk price per cwt. 18.41
2008 Annual Report RankEm, Copyright (c) 2001-09, Univ. of Minnesota
48
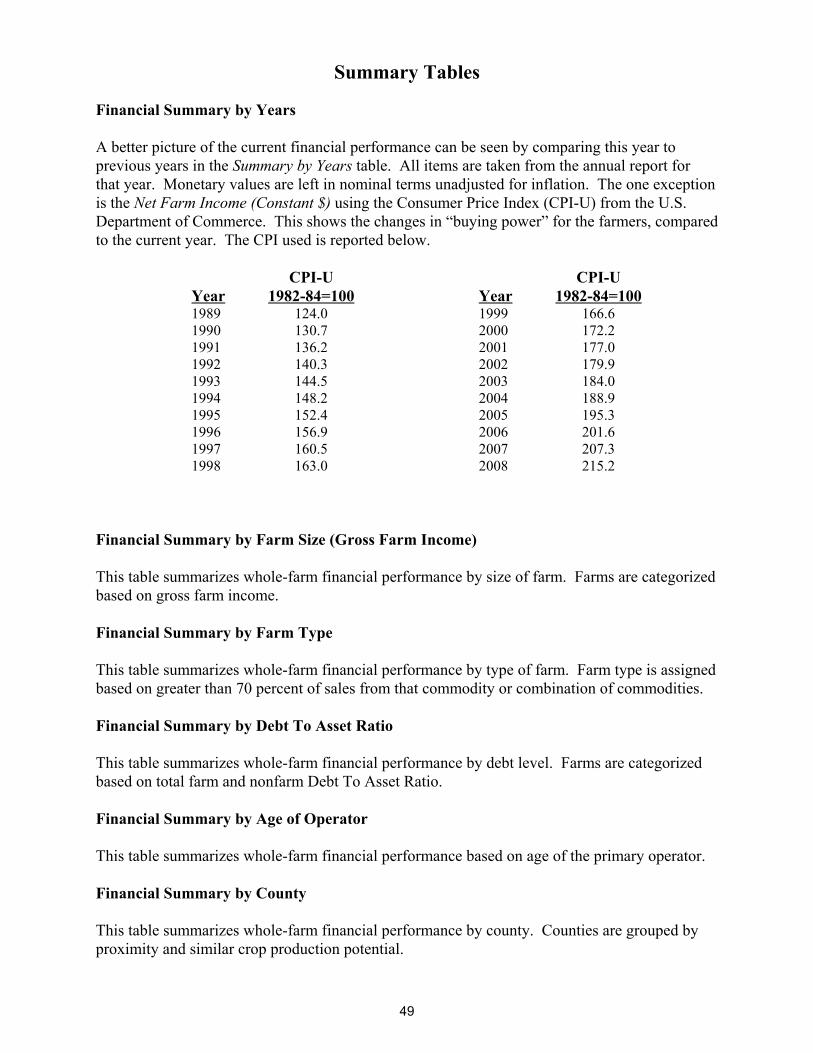
Summary Tables
Financial Summary by Years
A better picture of the current financial performance can be seen by comparing this year toprevious years in the Summary by Years table. All items are taken from the annual report forthat year. Monetary values are left in nominal terms unadjusted for inflation. The one exceptionis the Net Farm Income (Constant $) using the Consumer Price Index (CPI-U) from the U.S.Department of Commerce. This shows the changes in “buying power” for the farmers, comparedto the current year. The CPI used is reported below.
CPI-U CPI-UYear 1982-84=100 Year 1982-84=1001989 124.0 1999 166.61990 130.7 2000 172.21991 136.2 2001 177.01992 140.3 2002 179.91993 144.5 2003 184.01994 148.2 2004 188.91995 152.4 2005 195.31996 156.9 2006 201.61997 160.5 2007 207.31998 163.0 2008 215.2
Financial Summary by Farm Size (Gross Farm Income)
This table summarizes whole-farm financial performance by size of farm. Farms are categorizedbased on gross farm income.
Financial Summary by Farm Type
This table summarizes whole-farm financial performance by type of farm. Farm type is assignedbased on greater than 70 percent of sales from that commodity or combination of commodities.
Financial Summary by Debt To Asset Ratio
This table summarizes whole-farm financial performance by debt level. Farms are categorizedbased on total farm and nonfarm Debt To Asset Ratio.
Financial Summary by Age of Operator
This table summarizes whole-farm financial performance based on age of the primary operator.
Financial Summary by County
This table summarizes whole-farm financial performance by county. Counties are grouped byproximity and similar crop production potential.
49
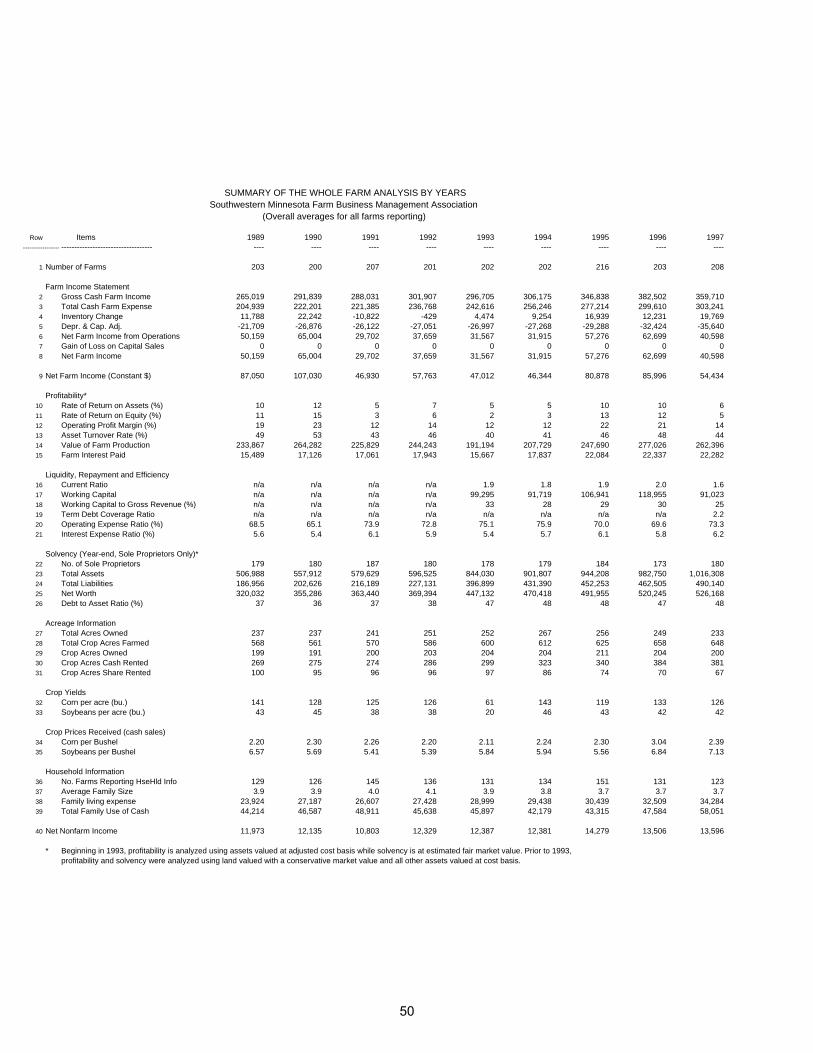
Row Items 1989 1990 1991 1992 1993 1994 1995 1996 1997----------------- ----------------------------------- ---- ---- ---- ---- ---- ---- ---- ---- ----
1 Number of Farms 203 200 207 201 202 202 216 203 208
Farm Income Statement2 Gross Cash Farm Income 265,019 291,839 288,031 301,907 296,705 306,175 346,838 382,502 359,7103 Total Cash Farm Expense 204,939 222,201 221,385 236,768 242,616 256,246 277,214 299,610 303,2414 Inventory Change 11,788 22,242 -10,822 -429 4,474 9,254 16,939 12,231 19,7695 Depr. & Cap. Adj. -21,709 -26,876 -26,122 -27,051 -26,997 -27,268 -29,288 -32,424 -35,6406 Net Farm Income from Operations 50,159 65,004 29,702 37,659 31,567 31,915 57,276 62,699 40,5987 Gain of Loss on Capital Sales 0 0 0 0 0 0 0 0 08 Net Farm Income 50,159 65,004 29,702 37,659 31,567 31,915 57,276 62,699 40,598
9 Net Farm Income (Constant $) 87,050 107,030 46,930 57,763 47,012 46,344 80,878 85,996 54,434
Profitability*10 Rate of Return on Assets (%) 10 12 5 7 5 5 10 10 611 Rate of Return on Equity (%) 11 15 3 6 2 3 13 12 512 Operating Profit Margin (%) 19 23 12 14 12 12 22 21 1413 Asset Turnover Rate (%) 49 53 43 46 40 41 46 48 4414 Value of Farm Production 233,867 264,282 225,829 244,243 191,194 207,729 247,690 277,026 262,39615 Farm Interest Paid 15,489 17,126 17,061 17,943 15,667 17,837 22,084 22,337 22,282
Liquidity, Repayment and Efficiency16 Current Ratio n/a n/a n/a n/a 1.9 1.8 1.9 2.0 1.617 Working Capital n/a n/a n/a n/a 99,295 91,719 106,941 118,955 91,02318 Working Capital to Gross Revenue (%) n/a n/a n/a n/a 33 28 29 30 2519 Term Debt Coverage Ratio n/a n/a n/a n/a n/a n/a n/a n/a 2.220 Operating Expense Ratio (%) 68.5 65.1 73.9 72.8 75.1 75.9 70.0 69.6 73.321 Interest Expense Ratio (%) 5.6 5.4 6.1 5.9 5.4 5.7 6.1 5.8 6.2
Solvency (Year-end, Sole Proprietors Only)*22 No. of Sole Proprietors 179 180 187 180 178 179 184 173 18023 Total Assets 506,988 557,912 579,629 596,525 844,030 901,807 944,208 982,750 1,016,30824 Total Liabilities 186,956 202,626 216,189 227,131 396,899 431,390 452,253 462,505 490,14025 Net Worth 320,032 355,286 363,440 369,394 447,132 470,418 491,955 520,245 526,16826 Debt to Asset Ratio (%) 37 36 37 38 47 48 48 47 48
Acreage Information27 Total Acres Owned 237 237 241 251 252 267 256 249 23328 Total Crop Acres Farmed 568 561 570 586 600 612 625 658 64829 Crop Acres Owned 199 191 200 203 204 204 211 204 20030 Crop Acres Cash Rented 269 275 274 286 299 323 340 384 38131 Crop Acres Share Rented 100 95 96 96 97 86 74 70 67
Crop Yields32 Corn per acre (bu.) 141 128 125 126 61 143 119 133 12633 Soybeans per acre (bu.) 43 45 38 38 20 46 43 42 42
Crop Prices Received (cash sales)34 Corn per Bushel 2.20 2.30 2.26 2.20 2.11 2.24 2.30 3.04 2.3935 Soybeans per Bushel 6.57 5.69 5.41 5.39 5.84 5.94 5.56 6.84 7.13
Household Information36 No. Farms Reporting HseHld Info 129 126 145 136 131 134 151 131 12337 Average Family Size 3.9 3.9 4.0 4.1 3.9 3.8 3.7 3.7 3.738 Family living expense 23,924 27,187 26,607 27,428 28,999 29,438 30,439 32,509 34,28439 Total Family Use of Cash 44,214 46,587 48,911 45,638 45,897 42,179 43,315 47,584 58,051
40 Net Nonfarm Income 11,973 12,135 10,803 12,329 12,387 12,381 14,279 13,506 13,596
* Beginning in 1993, profitability is analyzed using assets valued at adjusted cost basis while solvency is at estimated fair market value. Prior to 1993,profitability and solvency were analyzed using land valued with a conservative market value and all other assets valued at cost basis.
SUMMARY OF THE WHOLE FARM ANALYSIS BY YEARSSouthwestern Minnesota Farm Business Management Association
(Overall averages for all farms reporting)
50
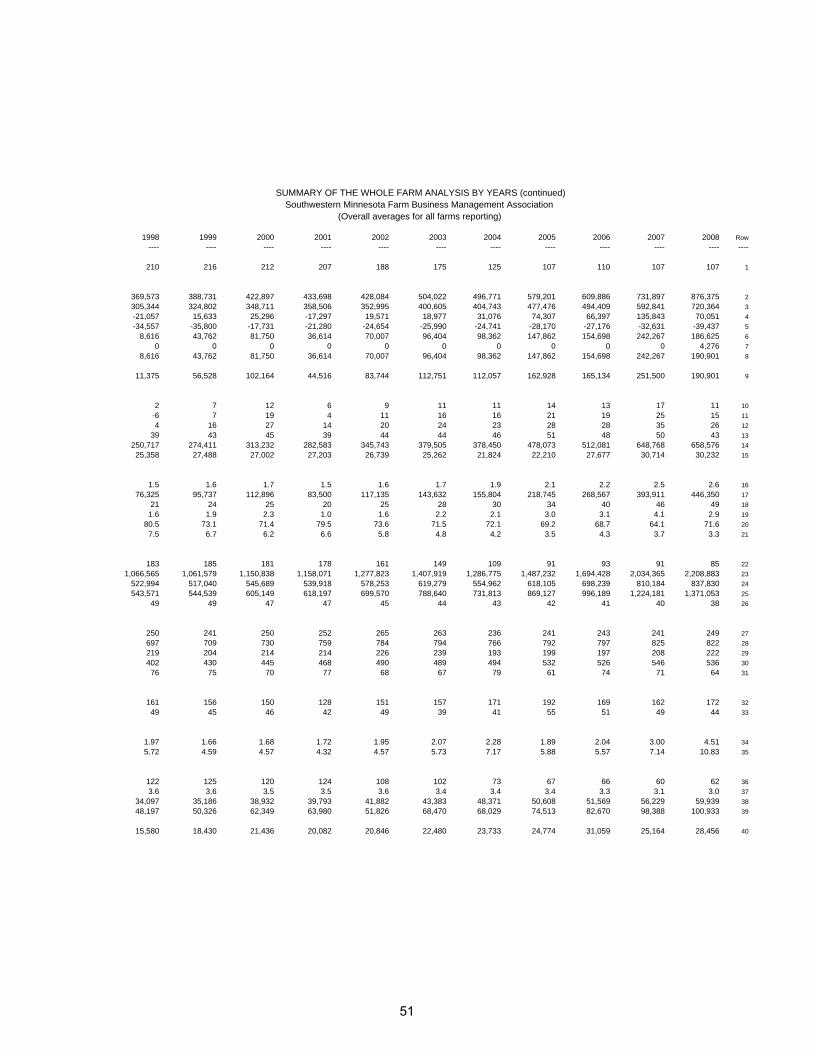
1998 1999 2000 2001 2002 2003 2004 2005 2006 2007 2008 Row ---- ---- ---- ---- ---- ---- ---- ---- ---- ---- ---- ----
210 216 212 207 188 175 125 107 110 107 107 1
369,573 388,731 422,897 433,698 428,084 504,022 496,771 579,201 609,886 731,897 876,375 2305,344 324,802 348,711 358,506 352,995 400,605 404,743 477,476 494,409 592,841 720,364 3-21,057 15,633 25,296 -17,297 19,571 18,977 31,076 74,307 66,397 135,843 70,051 4-34,557 -35,800 -17,731 -21,280 -24,654 -25,990 -24,741 -28,170 -27,176 -32,631 -39,437 5
8,616 43,762 81,750 36,614 70,007 96,404 98,362 147,862 154,698 242,267 186,625 60 0 0 0 0 0 0 0 0 0 4,276 7
8,616 43,762 81,750 36,614 70,007 96,404 98,362 147,862 154,698 242,267 190,901 8
11,375 56,528 102,164 44,516 83,744 112,751 112,057 162,928 165,134 251,500 190,901 9
2 7 12 6 9 11 11 14 13 17 11 10-6 7 19 4 11 16 16 21 19 25 15 114 16 27 14 20 24 23 28 28 35 26 12
39 43 45 39 44 44 46 51 48 50 43 13250,717 274,411 313,232 282,583 345,743 379,505 378,450 478,073 512,081 648,768 658,576 1425,358 27,488 27,002 27,203 26,739 25,262 21,824 22,210 27,677 30,714 30,232 15
1.5 1.6 1.7 1.5 1.6 1.7 1.9 2.1 2.2 2.5 2.6 1676,325 95,737 112,896 83,500 117,135 143,632 155,804 218,745 268,567 393,911 446,350 17
21 24 25 20 25 28 30 34 40 46 49 181.6 1.9 2.3 1.0 1.6 2.2 2.1 3.0 3.1 4.1 2.9 19
80.5 73.1 71.4 79.5 73.6 71.5 72.1 69.2 68.7 64.1 71.6 207.5 6.7 6.2 6.6 5.8 4.8 4.2 3.5 4.3 3.7 3.3 21
183 185 181 178 161 149 109 91 93 91 85 221,066,565 1,061,579 1,150,838 1,158,071 1,277,823 1,407,919 1,286,775 1,487,232 1,694,428 2,034,365 2,208,883 23
522,994 517,040 545,689 539,918 578,253 619,279 554,962 618,105 698,239 810,184 837,830 24543,571 544,539 605,149 618,197 699,570 788,640 731,813 869,127 996,189 1,224,181 1,371,053 25
49 49 47 47 45 44 43 42 41 40 38 26
250 241 250 252 265 263 236 241 243 241 249 27697 709 730 759 784 794 766 792 797 825 822 28219 204 214 214 226 239 193 199 197 208 222 29402 430 445 468 490 489 494 532 526 546 536 3076 75 70 77 68 67 79 61 74 71 64 31
161 156 150 128 151 157 171 192 169 162 172 3249 45 46 42 49 39 41 55 51 49 44 33
1.97 1.66 1.68 1.72 1.95 2.07 2.28 1.89 2.04 3.00 4.51 345.72 4.59 4.57 4.32 4.57 5.73 7.17 5.88 5.57 7.14 10.83 35
122 125 120 124 108 102 73 67 66 60 62 363.6 3.6 3.5 3.5 3.6 3.4 3.4 3.4 3.3 3.1 3.0 37
34,097 35,186 38,932 39,793 41,882 43,383 48,371 50,608 51,569 56,229 59,939 3848,197 50,326 62,349 63,980 51,826 68,470 68,029 74,513 82,670 98,388 100,933 39
15,580 18,430 21,436 20,082 20,846 22,480 23,733 24,774 31,059 25,164 28,456 40
SUMMARY OF THE WHOLE FARM ANALYSIS BY YEARS (continued)Southwestern Minnesota Farm Business Management Association
(Overall averages for all farms reporting)
51
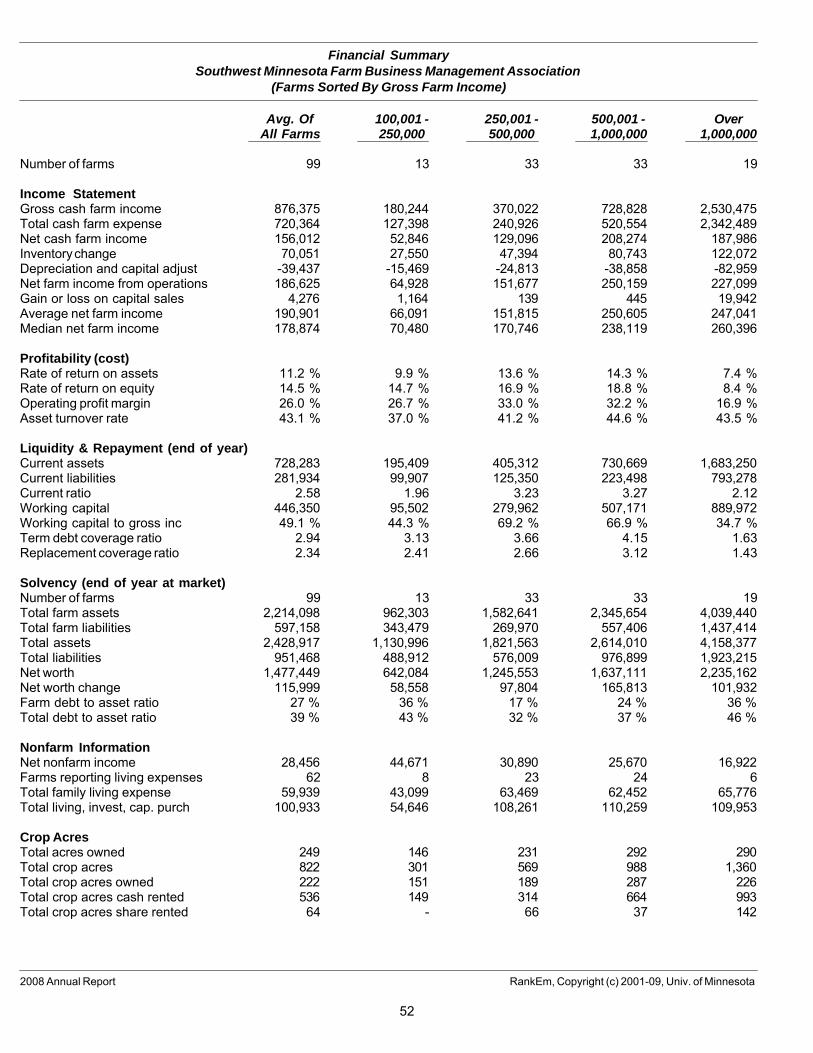
Financial SummarySouthwest Minnesota Farm Business Management Association
(Farms Sorted By Gross Farm Income)
Avg. Of 100,001 - 250,001 - 500,001 - OverAll Farms 250,000 500,000 1,000,000 1,000,000
Number of farms 99 13 33 33 19
Income StatementGross cash farm income 876,375 180,244 370,022 728,828 2,530,475Total cash farm expense 720,364 127,398 240,926 520,554 2,342,489Net cash farm income 156,012 52,846 129,096 208,274 187,986Inventory change 70,051 27,550 47,394 80,743 122,072Depreciation and capital adjust -39,437 -15,469 -24,813 -38,858 -82,959Net farm income from operations 186,625 64,928 151,677 250,159 227,099Gain or loss on capital sales 4,276 1,164 139 445 19,942Average net farm income 190,901 66,091 151,815 250,605 247,041Median net farm income 178,874 70,480 170,746 238,119 260,396
Profitability (cost)Rate of return on assets 11.2 % 9.9 % 13.6 % 14.3 % 7.4 %Rate of return on equity 14.5 % 14.7 % 16.9 % 18.8 % 8.4 %Operating profit margin 26.0 % 26.7 % 33.0 % 32.2 % 16.9 %Asset turnover rate 43.1 % 37.0 % 41.2 % 44.6 % 43.5 %
Liquidity & Repayment (end of year)Current assets 728,283 195,409 405,312 730,669 1,683,250Current liabilities 281,934 99,907 125,350 223,498 793,278Current ratio 2.58 1.96 3.23 3.27 2.12Working capital 446,350 95,502 279,962 507,171 889,972Working capital to gross inc 49.1 % 44.3 % 69.2 % 66.9 % 34.7 %Term debt coverage ratio 2.94 3.13 3.66 4.15 1.63Replacement coverage ratio 2.34 2.41 2.66 3.12 1.43
Solvency (end of year at market)Number of farms 99 13 33 33 19Total farm assets 2,214,098 962,303 1,582,641 2,345,654 4,039,440Total farm liabilities 597,158 343,479 269,970 557,406 1,437,414Total assets 2,428,917 1,130,996 1,821,563 2,614,010 4,158,377Total liabilities 951,468 488,912 576,009 976,899 1,923,215Net worth 1,477,449 642,084 1,245,553 1,637,111 2,235,162Net worth change 115,999 58,558 97,804 165,813 101,932Farm debt to asset ratio 27 % 36 % 17 % 24 % 36 %Total debt to asset ratio 39 % 43 % 32 % 37 % 46 %
Nonfarm InformationNet nonfarm income 28,456 44,671 30,890 25,670 16,922Farms reporting living expenses 62 8 23 24 6Total family living expense 59,939 43,099 63,469 62,452 65,776Total living, invest, cap. purch 100,933 54,646 108,261 110,259 109,953
Crop AcresTotal acres owned 249 146 231 292 290Total crop acres 822 301 569 988 1,360Total crop acres owned 222 151 189 287 226Total crop acres cash rented 536 149 314 664 993Total crop acres share rented 64 - 66 37 142
2008 Annual Report RankEm, Copyright (c) 2001-09, Univ. of Minnesota
52
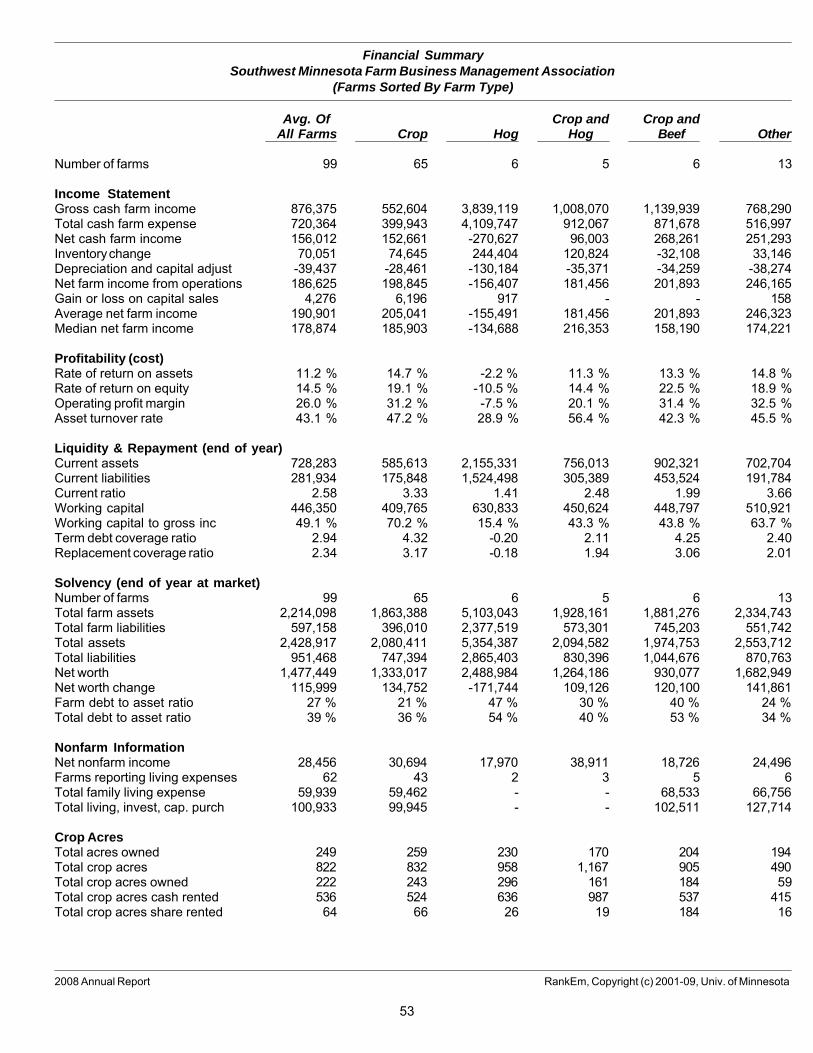
Financial SummarySouthwest Minnesota Farm Business Management Association
(Farms Sorted By Farm Type)
Avg. Of Crop and Crop andAll Farms Crop Hog Hog Beef Other
Number of farms 99 65 6 5 6 13
Income StatementGross cash farm income 876,375 552,604 3,839,119 1,008,070 1,139,939 768,290Total cash farm expense 720,364 399,943 4,109,747 912,067 871,678 516,997Net cash farm income 156,012 152,661 -270,627 96,003 268,261 251,293Inventory change 70,051 74,645 244,404 120,824 -32,108 33,146Depreciation and capital adjust -39,437 -28,461 -130,184 -35,371 -34,259 -38,274Net farm income from operations 186,625 198,845 -156,407 181,456 201,893 246,165Gain or loss on capital sales 4,276 6,196 917 - - 158Average net farm income 190,901 205,041 -155,491 181,456 201,893 246,323Median net farm income 178,874 185,903 -134,688 216,353 158,190 174,221
Profitability (cost)Rate of return on assets 11.2 % 14.7 % -2.2 % 11.3 % 13.3 % 14.8 %Rate of return on equity 14.5 % 19.1 % -10.5 % 14.4 % 22.5 % 18.9 %Operating profit margin 26.0 % 31.2 % -7.5 % 20.1 % 31.4 % 32.5 %Asset turnover rate 43.1 % 47.2 % 28.9 % 56.4 % 42.3 % 45.5 %
Liquidity & Repayment (end of year)Current assets 728,283 585,613 2,155,331 756,013 902,321 702,704Current liabilities 281,934 175,848 1,524,498 305,389 453,524 191,784Current ratio 2.58 3.33 1.41 2.48 1.99 3.66Working capital 446,350 409,765 630,833 450,624 448,797 510,921Working capital to gross inc 49.1 % 70.2 % 15.4 % 43.3 % 43.8 % 63.7 %Term debt coverage ratio 2.94 4.32 -0.20 2.11 4.25 2.40Replacement coverage ratio 2.34 3.17 -0.18 1.94 3.06 2.01
Solvency (end of year at market)Number of farms 99 65 6 5 6 13Total farm assets 2,214,098 1,863,388 5,103,043 1,928,161 1,881,276 2,334,743Total farm liabilities 597,158 396,010 2,377,519 573,301 745,203 551,742Total assets 2,428,917 2,080,411 5,354,387 2,094,582 1,974,753 2,553,712Total liabilities 951,468 747,394 2,865,403 830,396 1,044,676 870,763Net worth 1,477,449 1,333,017 2,488,984 1,264,186 930,077 1,682,949Net worth change 115,999 134,752 -171,744 109,126 120,100 141,861Farm debt to asset ratio 27 % 21 % 47 % 30 % 40 % 24 %Total debt to asset ratio 39 % 36 % 54 % 40 % 53 % 34 %
Nonfarm InformationNet nonfarm income 28,456 30,694 17,970 38,911 18,726 24,496Farms reporting living expenses 62 43 2 3 5 6Total family living expense 59,939 59,462 - - 68,533 66,756Total living, invest, cap. purch 100,933 99,945 - - 102,511 127,714
Crop AcresTotal acres owned 249 259 230 170 204 194Total crop acres 822 832 958 1,167 905 490Total crop acres owned 222 243 296 161 184 59Total crop acres cash rented 536 524 636 987 537 415Total crop acres share rented 64 66 26 19 184 16
2008 Annual Report RankEm, Copyright (c) 2001-09, Univ. of Minnesota
53
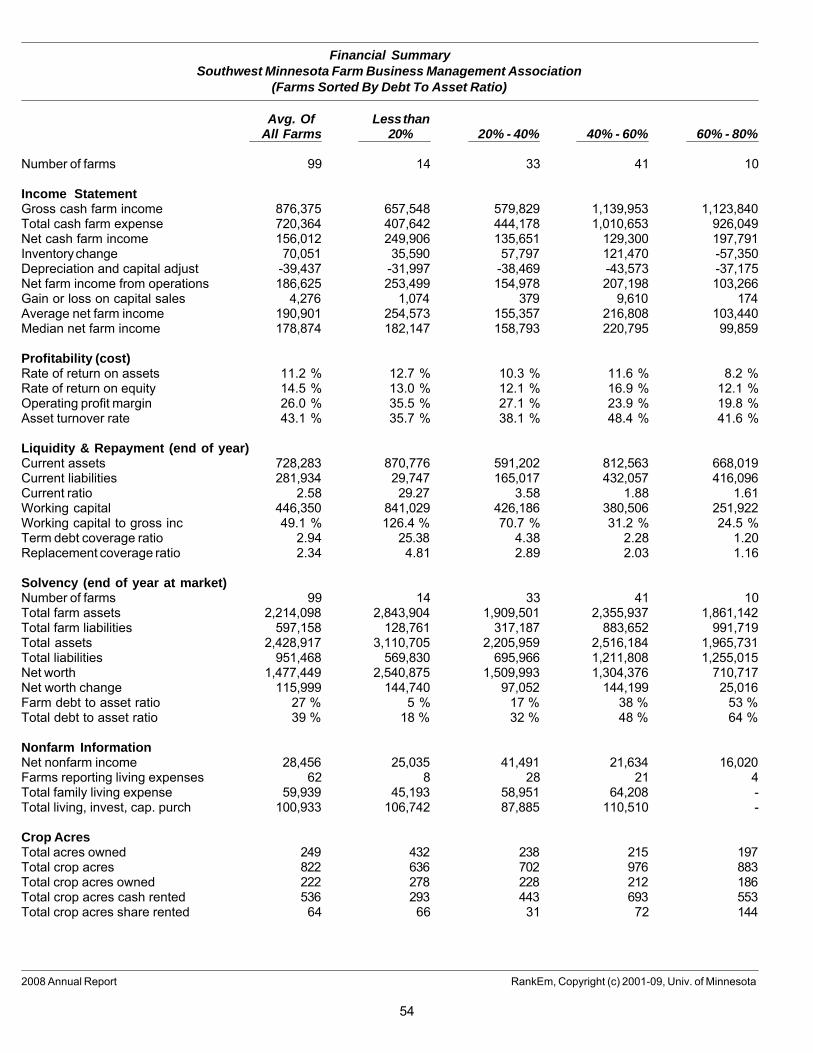
Financial SummarySouthwest Minnesota Farm Business Management Association
(Farms Sorted By Debt To Asset Ratio)
Avg. Of Less thanAll Farms 20% 20% - 40% 40% - 60% 60% - 80%
Number of farms 99 14 33 41 10
Income StatementGross cash farm income 876,375 657,548 579,829 1,139,953 1,123,840Total cash farm expense 720,364 407,642 444,178 1,010,653 926,049Net cash farm income 156,012 249,906 135,651 129,300 197,791Inventory change 70,051 35,590 57,797 121,470 -57,350Depreciation and capital adjust -39,437 -31,997 -38,469 -43,573 -37,175Net farm income from operations 186,625 253,499 154,978 207,198 103,266Gain or loss on capital sales 4,276 1,074 379 9,610 174Average net farm income 190,901 254,573 155,357 216,808 103,440Median net farm income 178,874 182,147 158,793 220,795 99,859
Profitability (cost)Rate of return on assets 11.2 % 12.7 % 10.3 % 11.6 % 8.2 %Rate of return on equity 14.5 % 13.0 % 12.1 % 16.9 % 12.1 %Operating profit margin 26.0 % 35.5 % 27.1 % 23.9 % 19.8 %Asset turnover rate 43.1 % 35.7 % 38.1 % 48.4 % 41.6 %
Liquidity & Repayment (end of year)Current assets 728,283 870,776 591,202 812,563 668,019Current liabilities 281,934 29,747 165,017 432,057 416,096Current ratio 2.58 29.27 3.58 1.88 1.61Working capital 446,350 841,029 426,186 380,506 251,922Working capital to gross inc 49.1 % 126.4 % 70.7 % 31.2 % 24.5 %Term debt coverage ratio 2.94 25.38 4.38 2.28 1.20Replacement coverage ratio 2.34 4.81 2.89 2.03 1.16
Solvency (end of year at market)Number of farms 99 14 33 41 10Total farm assets 2,214,098 2,843,904 1,909,501 2,355,937 1,861,142Total farm liabilities 597,158 128,761 317,187 883,652 991,719Total assets 2,428,917 3,110,705 2,205,959 2,516,184 1,965,731Total liabilities 951,468 569,830 695,966 1,211,808 1,255,015Net worth 1,477,449 2,540,875 1,509,993 1,304,376 710,717Net worth change 115,999 144,740 97,052 144,199 25,016Farm debt to asset ratio 27 % 5 % 17 % 38 % 53 %Total debt to asset ratio 39 % 18 % 32 % 48 % 64 %
Nonfarm InformationNet nonfarm income 28,456 25,035 41,491 21,634 16,020Farms reporting living expenses 62 8 28 21 4Total family living expense 59,939 45,193 58,951 64,208 -Total living, invest, cap. purch 100,933 106,742 87,885 110,510 -
Crop AcresTotal acres owned 249 432 238 215 197Total crop acres 822 636 702 976 883Total crop acres owned 222 278 228 212 186Total crop acres cash rented 536 293 443 693 553Total crop acres share rented 64 66 31 72 144
2008 Annual Report RankEm, Copyright (c) 2001-09, Univ. of Minnesota
54
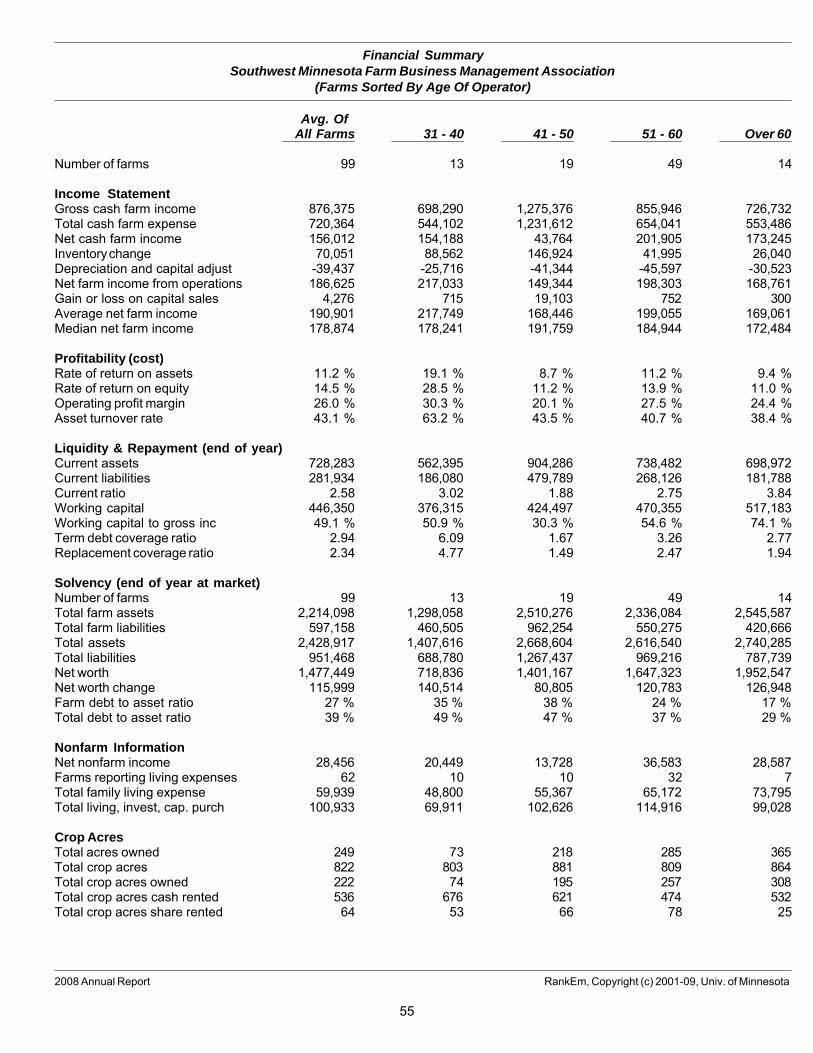
Financial SummarySouthwest Minnesota Farm Business Management Association
(Farms Sorted By Age Of Operator)
Avg. OfAll Farms 31 - 40 41 - 50 51 - 60 Over 60
Number of farms 99 13 19 49 14
Income StatementGross cash farm income 876,375 698,290 1,275,376 855,946 726,732Total cash farm expense 720,364 544,102 1,231,612 654,041 553,486Net cash farm income 156,012 154,188 43,764 201,905 173,245Inventory change 70,051 88,562 146,924 41,995 26,040Depreciation and capital adjust -39,437 -25,716 -41,344 -45,597 -30,523Net farm income from operations 186,625 217,033 149,344 198,303 168,761Gain or loss on capital sales 4,276 715 19,103 752 300Average net farm income 190,901 217,749 168,446 199,055 169,061Median net farm income 178,874 178,241 191,759 184,944 172,484
Profitability (cost)Rate of return on assets 11.2 % 19.1 % 8.7 % 11.2 % 9.4 %Rate of return on equity 14.5 % 28.5 % 11.2 % 13.9 % 11.0 %Operating profit margin 26.0 % 30.3 % 20.1 % 27.5 % 24.4 %Asset turnover rate 43.1 % 63.2 % 43.5 % 40.7 % 38.4 %
Liquidity & Repayment (end of year)Current assets 728,283 562,395 904,286 738,482 698,972Current liabilities 281,934 186,080 479,789 268,126 181,788Current ratio 2.58 3.02 1.88 2.75 3.84Working capital 446,350 376,315 424,497 470,355 517,183Working capital to gross inc 49.1 % 50.9 % 30.3 % 54.6 % 74.1 %Term debt coverage ratio 2.94 6.09 1.67 3.26 2.77Replacement coverage ratio 2.34 4.77 1.49 2.47 1.94
Solvency (end of year at market)Number of farms 99 13 19 49 14Total farm assets 2,214,098 1,298,058 2,510,276 2,336,084 2,545,587Total farm liabilities 597,158 460,505 962,254 550,275 420,666Total assets 2,428,917 1,407,616 2,668,604 2,616,540 2,740,285Total liabilities 951,468 688,780 1,267,437 969,216 787,739Net worth 1,477,449 718,836 1,401,167 1,647,323 1,952,547Net worth change 115,999 140,514 80,805 120,783 126,948Farm debt to asset ratio 27 % 35 % 38 % 24 % 17 %Total debt to asset ratio 39 % 49 % 47 % 37 % 29 %
Nonfarm InformationNet nonfarm income 28,456 20,449 13,728 36,583 28,587Farms reporting living expenses 62 10 10 32 7Total family living expense 59,939 48,800 55,367 65,172 73,795Total living, invest, cap. purch 100,933 69,911 102,626 114,916 99,028
Crop AcresTotal acres owned 249 73 218 285 365Total crop acres 822 803 881 809 864Total crop acres owned 222 74 195 257 308Total crop acres cash rented 536 676 621 474 532Total crop acres share rented 64 53 66 78 25
2008 Annual Report RankEm, Copyright (c) 2001-09, Univ. of Minnesota
55
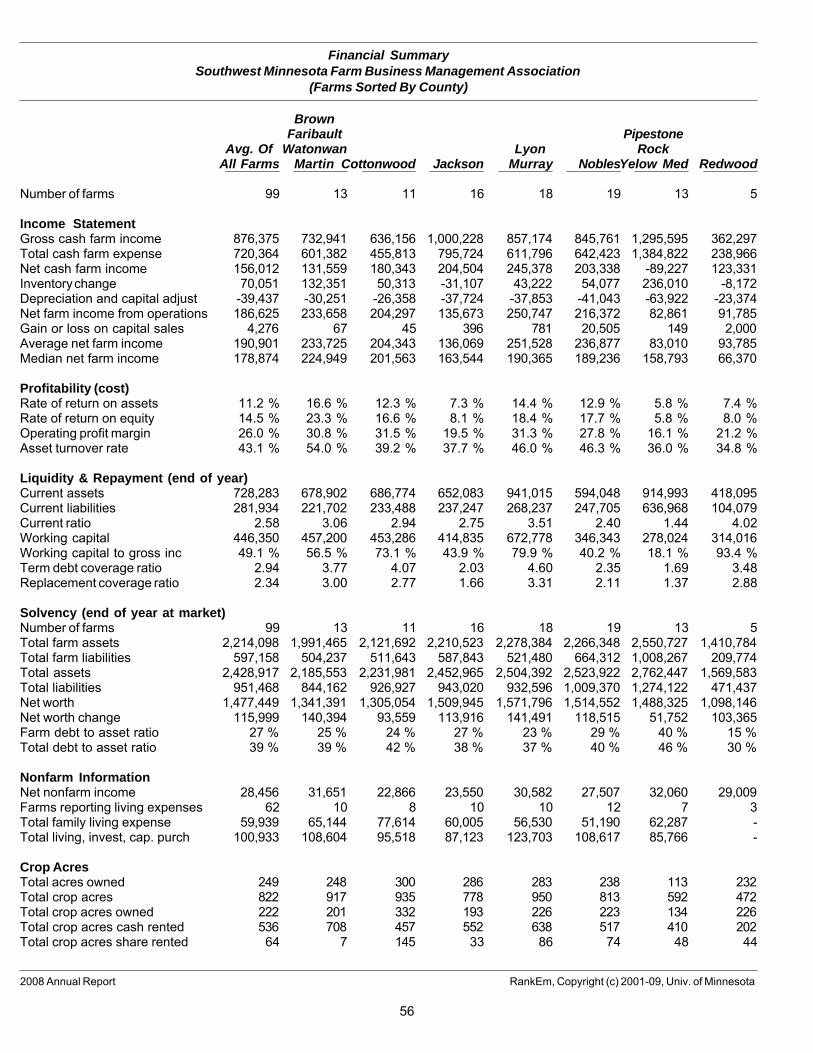
Financial SummarySouthwest Minnesota Farm Business Management Association
(Farms Sorted By County)
BrownFaribault Pipestone
Avg. Of Watonwan Lyon RockAll Farms Martin Cottonwood Jackson Murray NoblesYelow Med Redwood
Number of farms 99 13 11 16 18 19 13 5
Income StatementGross cash farm income 876,375 732,941 636,156 1,000,228 857,174 845,761 1,295,595 362,297Total cash farm expense 720,364 601,382 455,813 795,724 611,796 642,423 1,384,822 238,966Net cash farm income 156,012 131,559 180,343 204,504 245,378 203,338 -89,227 123,331Inventory change 70,051 132,351 50,313 -31,107 43,222 54,077 236,010 -8,172Depreciation and capital adjust -39,437 -30,251 -26,358 -37,724 -37,853 -41,043 -63,922 -23,374Net farm income from operations 186,625 233,658 204,297 135,673 250,747 216,372 82,861 91,785Gain or loss on capital sales 4,276 67 45 396 781 20,505 149 2,000Average net farm income 190,901 233,725 204,343 136,069 251,528 236,877 83,010 93,785Median net farm income 178,874 224,949 201,563 163,544 190,365 189,236 158,793 66,370
Profitability (cost)Rate of return on assets 11.2 % 16.6 % 12.3 % 7.3 % 14.4 % 12.9 % 5.8 % 7.4 %Rate of return on equity 14.5 % 23.3 % 16.6 % 8.1 % 18.4 % 17.7 % 5.8 % 8.0 %Operating profit margin 26.0 % 30.8 % 31.5 % 19.5 % 31.3 % 27.8 % 16.1 % 21.2 %Asset turnover rate 43.1 % 54.0 % 39.2 % 37.7 % 46.0 % 46.3 % 36.0 % 34.8 %
Liquidity & Repayment (end of year)Current assets 728,283 678,902 686,774 652,083 941,015 594,048 914,993 418,095Current liabilities 281,934 221,702 233,488 237,247 268,237 247,705 636,968 104,079Current ratio 2.58 3.06 2.94 2.75 3.51 2.40 1.44 4.02Working capital 446,350 457,200 453,286 414,835 672,778 346,343 278,024 314,016Working capital to gross inc 49.1 % 56.5 % 73.1 % 43.9 % 79.9 % 40.2 % 18.1 % 93.4 %Term debt coverage ratio 2.94 3.77 4.07 2.03 4.60 2.35 1.69 3.48Replacement coverage ratio 2.34 3.00 2.77 1.66 3.31 2.11 1.37 2.88
Solvency (end of year at market)Number of farms 99 13 11 16 18 19 13 5Total farm assets 2,214,098 1,991,465 2,121,692 2,210,523 2,278,384 2,266,348 2,550,727 1,410,784Total farm liabilities 597,158 504,237 511,643 587,843 521,480 664,312 1,008,267 209,774Total assets 2,428,917 2,185,553 2,231,981 2,452,965 2,504,392 2,523,922 2,762,447 1,569,583Total liabilities 951,468 844,162 926,927 943,020 932,596 1,009,370 1,274,122 471,437Net worth 1,477,449 1,341,391 1,305,054 1,509,945 1,571,796 1,514,552 1,488,325 1,098,146Net worth change 115,999 140,394 93,559 113,916 141,491 118,515 51,752 103,365Farm debt to asset ratio 27 % 25 % 24 % 27 % 23 % 29 % 40 % 15 %Total debt to asset ratio 39 % 39 % 42 % 38 % 37 % 40 % 46 % 30 %
Nonfarm InformationNet nonfarm income 28,456 31,651 22,866 23,550 30,582 27,507 32,060 29,009Farms reporting living expenses 62 10 8 10 10 12 7 3Total family living expense 59,939 65,144 77,614 60,005 56,530 51,190 62,287 -Total living, invest, cap. purch 100,933 108,604 95,518 87,123 123,703 108,617 85,766 -
Crop AcresTotal acres owned 249 248 300 286 283 238 113 232Total crop acres 822 917 935 778 950 813 592 472Total crop acres owned 222 201 332 193 226 223 134 226Total crop acres cash rented 536 708 457 552 638 517 410 202Total crop acres share rented 64 7 145 33 86 74 48 44
2008 Annual Report RankEm, Copyright (c) 2001-09, Univ. of Minnesota
56
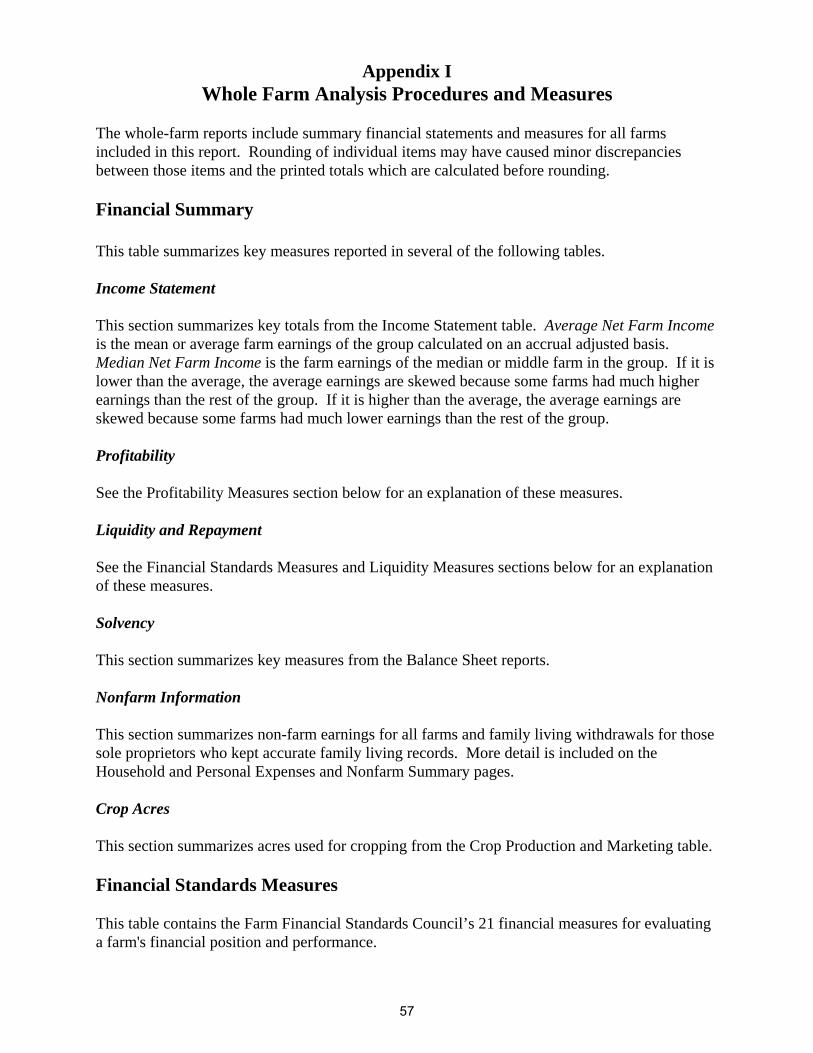
Appendix IWhole Farm Analysis Procedures and Measures
The whole-farm reports include summary financial statements and measures for all farmsincluded in this report. Rounding of individual items may have caused minor discrepanciesbetween those items and the printed totals which are calculated before rounding.
Financial Summary
This table summarizes key measures reported in several of the following tables.
Income Statement
This section summarizes key totals from the Income Statement table. Average Net Farm Incomeis the mean or average farm earnings of the group calculated on an accrual adjusted basis. Median Net Farm Income is the farm earnings of the median or middle farm in the group. If it islower than the average, the average earnings are skewed because some farms had much higherearnings than the rest of the group. If it is higher than the average, the average earnings areskewed because some farms had much lower earnings than the rest of the group.
Profitability
See the Profitability Measures section below for an explanation of these measures.
Liquidity and Repayment
See the Financial Standards Measures and Liquidity Measures sections below for an explanationof these measures.
Solvency
This section summarizes key measures from the Balance Sheet reports.
Nonfarm Information
This section summarizes non-farm earnings for all farms and family living withdrawals for thosesole proprietors who kept accurate family living records. More detail is included on theHousehold and Personal Expenses and Nonfarm Summary pages.
Crop Acres
This section summarizes acres used for cropping from the Crop Production and Marketing table.
Financial Standards Measures
This table contains the Farm Financial Standards Council’s 21 financial measures for evaluatinga farm's financial position and performance.
57
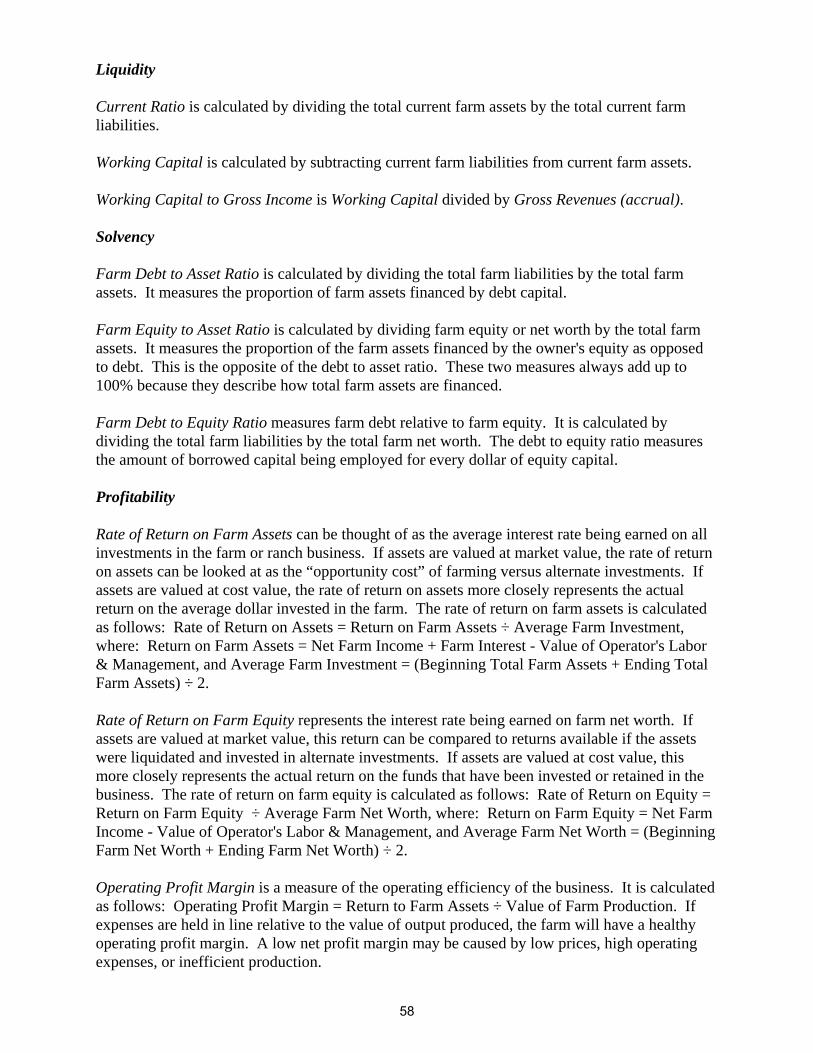
Liquidity
Current Ratio is calculated by dividing the total current farm assets by the total current farmliabilities.
Working Capital is calculated by subtracting current farm liabilities from current farm assets.
Working Capital to Gross Income is Working Capital divided by Gross Revenues (accrual).
Solvency
Farm Debt to Asset Ratio is calculated by dividing the total farm liabilities by the total farmassets. It measures the proportion of farm assets financed by debt capital.
Farm Equity to Asset Ratio is calculated by dividing farm equity or net worth by the total farmassets. It measures the proportion of the farm assets financed by the owner's equity as opposedto debt. This is the opposite of the debt to asset ratio. These two measures always add up to100% because they describe how total farm assets are financed.
Farm Debt to Equity Ratio measures farm debt relative to farm equity. It is calculated bydividing the total farm liabilities by the total farm net worth. The debt to equity ratio measuresthe amount of borrowed capital being employed for every dollar of equity capital.
Profitability
Rate of Return on Farm Assets can be thought of as the average interest rate being earned on allinvestments in the farm or ranch business. If assets are valued at market value, the rate of returnon assets can be looked at as the “opportunity cost” of farming versus alternate investments. Ifassets are valued at cost value, the rate of return on assets more closely represents the actualreturn on the average dollar invested in the farm. The rate of return on farm assets is calculatedas follows: Rate of Return on Assets = Return on Farm Assets ÷ Average Farm Investment,where: Return on Farm Assets = Net Farm Income + Farm Interest - Value of Operator's Labor& Management, and Average Farm Investment = (Beginning Total Farm Assets + Ending TotalFarm Assets) ÷ 2.
Rate of Return on Farm Equity represents the interest rate being earned on farm net worth. Ifassets are valued at market value, this return can be compared to returns available if the assetswere liquidated and invested in alternate investments. If assets are valued at cost value, thismore closely represents the actual return on the funds that have been invested or retained in thebusiness. The rate of return on farm equity is calculated as follows: Rate of Return on Equity =Return on Farm Equity ÷ Average Farm Net Worth, where: Return on Farm Equity = Net FarmIncome - Value of Operator's Labor & Management, and Average Farm Net Worth = (BeginningFarm Net Worth + Ending Farm Net Worth) ÷ 2.
Operating Profit Margin is a measure of the operating efficiency of the business. It is calculatedas follows: Operating Profit Margin = Return to Farm Assets ÷ Value of Farm Production. Ifexpenses are held in line relative to the value of output produced, the farm will have a healthyoperating profit margin. A low net profit margin may be caused by low prices, high operatingexpenses, or inefficient production.
58
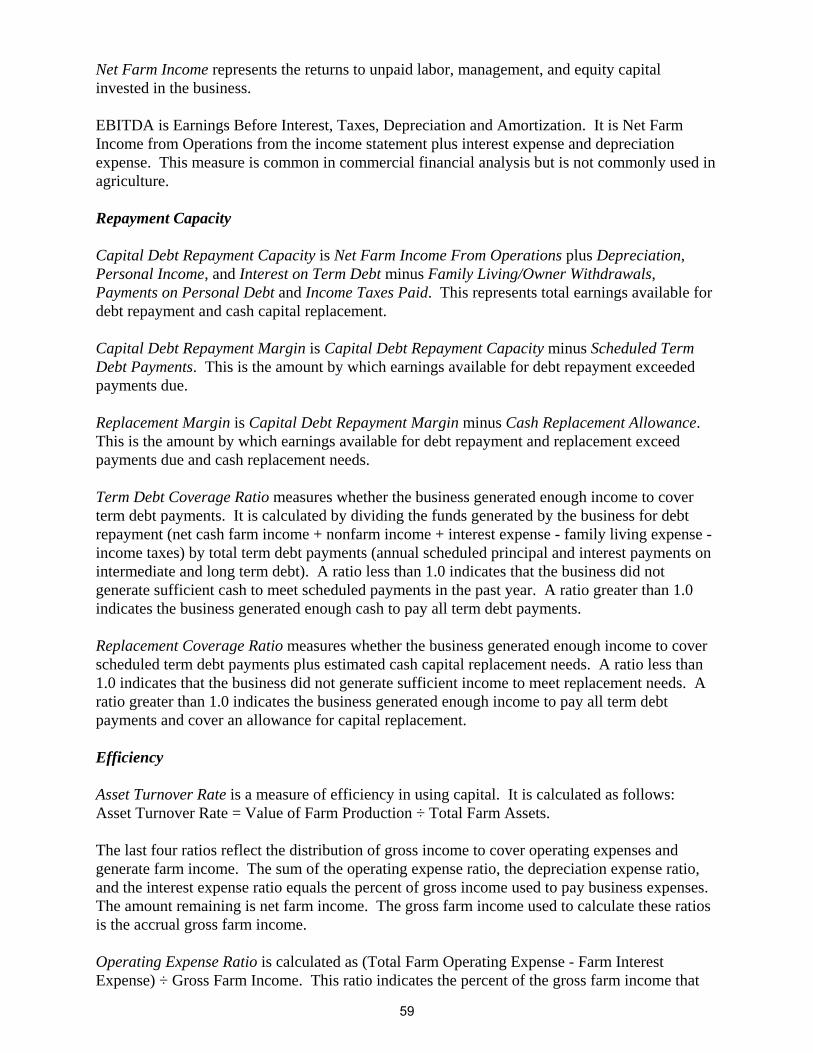
Net Farm Income represents the returns to unpaid labor, management, and equity capitalinvested in the business.
EBITDA is Earnings Before Interest, Taxes, Depreciation and Amortization. It is Net FarmIncome from Operations from the income statement plus interest expense and depreciationexpense. This measure is common in commercial financial analysis but is not commonly used inagriculture.
Repayment Capacity
Capital Debt Repayment Capacity is Net Farm Income From Operations plus Depreciation,Personal Income, and Interest on Term Debt minus Family Living/Owner Withdrawals,Payments on Personal Debt and Income Taxes Paid. This represents total earnings available fordebt repayment and cash capital replacement.
Capital Debt Repayment Margin is Capital Debt Repayment Capacity minus Scheduled TermDebt Payments. This is the amount by which earnings available for debt repayment exceededpayments due.
Replacement Margin is Capital Debt Repayment Margin minus Cash Replacement Allowance. This is the amount by which earnings available for debt repayment and replacement exceedpayments due and cash replacement needs.
Term Debt Coverage Ratio measures whether the business generated enough income to coverterm debt payments. It is calculated by dividing the funds generated by the business for debtrepayment (net cash farm income + nonfarm income + interest expense - family living expense -income taxes) by total term debt payments (annual scheduled principal and interest payments onintermediate and long term debt). A ratio less than 1.0 indicates that the business did notgenerate sufficient cash to meet scheduled payments in the past year. A ratio greater than 1.0indicates the business generated enough cash to pay all term debt payments.
Replacement Coverage Ratio measures whether the business generated enough income to coverscheduled term debt payments plus estimated cash capital replacement needs. A ratio less than1.0 indicates that the business did not generate sufficient income to meet replacement needs. Aratio greater than 1.0 indicates the business generated enough income to pay all term debtpayments and cover an allowance for capital replacement.
Efficiency
Asset Turnover Rate is a measure of efficiency in using capital. It is calculated as follows: Asset Turnover Rate = Value of Farm Production ÷ Total Farm Assets.
The last four ratios reflect the distribution of gross income to cover operating expenses andgenerate farm income. The sum of the operating expense ratio, the depreciation expense ratio,and the interest expense ratio equals the percent of gross income used to pay business expenses. The amount remaining is net farm income. The gross farm income used to calculate these ratiosis the accrual gross farm income.
Operating Expense Ratio is calculated as (Total Farm Operating Expense - Farm InterestExpense) ÷ Gross Farm Income. This ratio indicates the percent of the gross farm income that
59
was used to pay operating expenses. Total farm operating expense is the accrual total operatingexpense.
Depreciation Expense Ratio is calculated as Depreciation ÷ Gross Farm Income. This ratioindicates the percent of the gross farm income that was used to cover depreciation and othercapital adjustments.
Interest Expense Ratio is calculated as Farm Interest Expense ÷ Gross Farm Income. This ratioindicates the percent of the gross farm income used for farm interest expenses. This is the sameratio as the accrual interest as a percent of income from the Liquidity table.
Net Farm Income Ratio is calculated as Net Farm Income ÷ Gross Farm Income. This ratioindicates the percent of the gross farm income that remained after all expenses.
Farm Income Statement
The Farm Income Statement is a summary of income, expenses, and resultant profit or loss fromfarming operations during the calendar year. The first section lists cash farm income from allsources. The second section lists cash expenses. “Interest” includes only interest actually paid. No opportunity charges on farm equity capital or unpaid labor are included. The differencebetween Gross Cash Farm Income and Total Cash Expense is the Net Cash Farm Income. Thisis net farm income on a cash basis.
The third and fourth sections deal with noncash changes in the farm business. The InventoryChanges and Depreciation sections are used to convert the cash income statement (Net CashFarm Income) derived from the first two sections into an accrual income statement. Theresulting “Net Farm Income” represents the return to the operator's and family's unpaid labor,management, and equity capital (net worth). In other words, it represents the return to all of theresources which are owned by the farm family and, hence, not purchased or paid a wage. However, it does not include any asset appreciation, debt forgiveness or asset repossessions.
Profitability Measures
Profitability is measured using assets valued first at cost and then at market. The reports includefive measures of profit followed by the values used to calculate the measures.
Net Farm Income is repeated from the Farm Income Statement report. When assets are valued atmarket, it includes the change in market valuation of capital for the year.
Rate of Return on Assets is the Return to Farm Assets divided by Average Farm Assets.
Rate of Return on Equity is the Return to Farm Equity divided by Average Farm Equity.
Operating Profit Margin is the Return to Farm Assets divided by Value of Farm Production.
Asset Turnover Rate is the Value of Farm Production divided by Average Farm Assets.
Farm Interest Expense is the accrued interest cost so it will be different from the cash interestpaid shown in the Farm Income Statement.
60
Value of Operator's Labor and Management is its opportunity cost. It is assigned by farm withinsuggested guidelines.
Return on Farm Assets is calculated by adding Farm Interest Expense and Net Farm Income andthen subtracting the Value of Operator's Labor and Management.
Average Farm Assets is the average of beginning and ending total farm assets for all farms, notjust those included in the Balance Sheet report.
Return to Farm Equity is calculated by subtracting the Value of Operator's Labor andManagement from Net Farm Income.
Average Farm Equity is the average of beginning and ending farm net worth.
Value of Farm Production is gross farm income minus feeder livestock and feed purchased andadjusted for inventory changes in crops, market livestock and breeding livestock.
Liquidity and Repayment Capacity Measures
Current Ratio is total Current Assets divided by total Current Liabilities.
Working Capital is total Current Assets minus total Current Liabilities.
Working Capital to Gross Income is Working Capital divided by Gross Revenues (accrual).
Current Assets are taken from the ending balance sheet and include all assets that will be sold orused up in production within one business year.
Current Liabilities are taken from the ending balance sheet and include all loans and other debtdue to be repaid within one business year. Principal due within a twelve months on intermediateand long term loans is included.
Gross Revenues (accrual) is gross cash farm income from the income statement adjusted forinventory changes in crops and feed, market livestock, accounts receivable, hedging accounts,breeding livestock and other income related inventories.
Net Farm Income from Operations is from the Income Statement.
Depreciation is the total depreciation from the Income Statement. It is added as a source ofrepayment because it is a non-cash expense that was subtracted to arrive at Net Farm IncomeFrom Operations.
Personal Income is the average for all farms, not including Gifts and Inheritances.
61
Family Living/Owner Withdrawals is the amount of owner withdrawals for family living,partnership withdrawals, and corporate dividends. Reported withdrawals are adjusted to includeany discrepancy with actual cash disappearance.
Payments on personal debt is the total principal payments made during the year on all non-farmloans.
Income Taxes Paid are total federal, state, and social security taxes paid during the year on farmand personal earnings.
Interest on Term Debt is the amount of interest paid on intermediate and long term loans duringthe year. Interest is added as a source of repayment because it was previously subtracted toarrive at Net Farm Income from Operations.
Capital Debt Repayment Capacity is Net Farm Income From Operations plus Depreciation,Personal Income, and Interest on Term Debt minus Family Living/Owner Withdrawals,Payments on Personal Debt and Income Taxes Paid. This represents total earnings available fordebt repayment and cash capital replacement.
Scheduled Term Debt Payments is the scheduled amount of principal and interest payments dueon farm intermediate and long term loans from the beginning balance sheet.
Capital Debt Repayment Margin is Capital Debt Repayment Capacity minus Scheduled TermDebt Payments. This is the amount by which earnings available for debt repayment exceededpayments due.
Cash Replacement Allowance is the estimated amount of cash needed to cover the portion ofcapital replacement needs that normally come from cash flow. It is estimated for each operatorbased on their financial structure.
Replacement Margin is Capital Debt Repayment Margin minus Cash Replacement Allowance. This is the amount by which earnings available for debt repayment and replacement exceedpayments due and cash replacement needs.
Term Debt Coverage Ratio is Capital Debt Repayment Capacity divided by Scheduled TermDebt Payments. This represents how many times scheduled payments are covered by repaymentcapacity.
Replacement Coverage Ratio is Capital Debt Repayment Capacity divided by the total ofScheduled Term Debt Payments and the Cash Replacement Allowance. This represents howmany times scheduled payments and cash replacement needs are covered by repayment capacity.
Balance Sheets at Cost and Market Values
These tables include all farm and personal assets and liabilities reported by these farms on theirbeginning and ending balance sheets. Government crop loans are treated consistently as loans
62
on these tables, meaning that the full asset value is included as an asset and total accrued interestand outstanding principal balances are included as liabilities. Capital assets are valued atoriginal purchase price minus economic depreciation on the Cost Value table. Assets are valuedat a conservative market value on the Market Value table. Deferred liabilities are included onthe Market Value table. Deferred liabilities are an estimate of the taxes that would be due if thebusiness was liquidated on the date of the balance sheet.
Statement of Cash Flows
This table reports the sources from which cash was available or obtained and where that cashwas used or remains at the end of the year.
Crop Production and Marketing Summary
This table contains three sections. The first section reports average acreage by tenure andgeneral use. The next two sections show average price received from cash sales and averageyields for major crops.
Household and Personal Expenses
For those farms that kept records, the household and personal expenses are summarized in thistable. Since not all farms keep these records, the number of farms may be different for eachgroup. Averages are determined by the number of farms keeping these records.
Operator and Labor Information
This table has four sections. The first reports the averages for the number of operators per farm,the operator's age, and the number of years farming. The second section reports variousmeasures and results per operator compared to per farm in other reports.
The third section reports the amount of labor used and the returns to that labor. Total UnpaidLabor Hours and Total Hired Labor Hours are based on farmers’ estimates of labor use. Nolabor records are kept for unpaid labor. Value of Farm Production/Hour is the Value of FarmProduction divided by Total Labor Hours per Farm. Net Farm Income/Unpaid Hour is Net FarmIncome divided by Total Unpaid Labor Hours.
The fourth section reports the number of partnerships and withdrawals in each grouping.
Nonfarm Summary
This table reports the income from nonfarm sources which is included in a farmer's total netincome. Not all farms have nonfarm income, but the figure reported is the average over all farmsnot just those reporting nonfarm income. Also reported are the beginning and ending values fornonfarm assets for all farms (not just sole proprietors).
63

64
Appendix IICrop Enterprise Analysis Procedures and Measures
The Crop Enterprise Analysis tables show the profitability of each crop enterprise produced by five or more farms.
Gross Return is the average Yield multiplied by the Value Per Unit plus any other production orincome related to the crop. Value Per Unit for cash crops is the average sales price for cropssold before the end of the year and the average ending inventory value for crops remainingunsold. For feed crops, it is the estimated harvest-time value. LDP payments and othercommodity-specific income are added to estimate the total value received for crop production.
Direct Expenses include expenses that are directly related to the production of the specific crop. Most direct expenses are directly assigned to production of the crop and simply divided by acres. Some, such as Fuel and Oil and Repairs, which are difficult to assign directly to specific fields orcrops, are determined by allocating the total annual expense across all enterprises usingallocation factors entered for each crop.
Overhead Expenses are also determined by allocating the total annual expense across allenterprises using allocation factors entered for each crop.
Net Return per Acre is the Gross Return per Acre minus Total Direct and Overhead Expenses.
Net return with government payments is Net Return per Acre plus Government Payments. Government Payments includes only direct payments and counter-cyclical payments. Paymentsthat are directly attached to production of the crop, such as LDP and disaster payments areincluded in Gross Return. Because direct government payments have been decoupled fromactual production, these payments are generally allocated to all crops excluding vegetables andpasture. This is done for each farm by allocating the direct payments from the whole farm tothese crops.
Net Return over Labor and Management is calculated by allocating the farmer's charge forunpaid labor and management across all enterprises and subtracting it from Net Return WithGovernment Payments.
Cost of Production is calculated by dividing the total expense for each category by the yield peracre. Total Expense Less Government and Other Income is total expense minus governmentpayments, income from secondary products, and other income, divided by yield per acre.
Machinery Cost Per Acre is the sum of fuel and oil, repairs, custom hire expense, machinerylease payments, machinery depreciation, and interest on intermediate debt divided by acres.
Estimated Labor Hours Per Acre is calculated by allocating the farmer's estimate of totaloperator and hired labor hours for the year across all enterprises.
65
Rounding of individual items for the report may have caused minor discrepancies with thecalculated totals. If fewer than 5 farms have a certain crop enterprise, that information is notreported. If there are fewer than 25 farms, the high and low groups are not reported.
66
Appendix IIILivestock Enterprise Analysis Procedures and Measures
The Livestock Enterprise Analysis tables show the profitability of each livestock enterpriseproduced by five or more farms.
Gross Margin includes product and livestock sales, cull sales, the value of offspring transferredout of the enterprise, the value of inventory change from beginning to end of year, and any otherincome assigned to the enterprise. Livestock purchases and the value of animals transferred infrom other enterprises are subtracted.
Direct Expenses include expenses that are directly related to the specific livestock enterprise. Feed and most other direct expenses are directly assigned based on farm records. Some, such asFuel and Oil and Repairs, which are difficult to assign directly to enterprises, are determined byallocating the total annual expense across all enterprises using allocation factors entered for eachfarm.
Overhead Expenses are also determined by allocating the total annual expense across allenterprises using allocation factors entered for each farm.
Net Return is the Gross Return minus Total Direct and Overhead Expenses.
Net Return over Labor and Management is calculated by allocating the farmer's charge forunpaid labor and management across all enterprises and subtracting it from Net Return.
Estimated Labor Hours is calculated by allocating the farmer's estimate of total operator andhired labor hours for the year across all enterprises.
Cost of Production is calculated by dividing the total expense for each category by TotalProduction. For grow/finish enterprises, the Purchases and Transfers In are included in directexpense. Cull sales, other offspring sales, and any other miscellaneous income are subtractedand replacement purchases and transfers in are added to arrive at the cost With other revenueadjustments. With Labor and Management is the cost with other revenue adjustments plus theproducer’s charge for operator’s labor and management. This is the breakeven price for theprimary product to provide a return for operator labor and management.
The last section of each livestock table contains both economic and technical efficiencymeasures. Lbs. feed per lb. of gain is the pounds of total feed divided by Total production. Forgrains, these pounds per bushel are used: corn, 56; oats, 32; barley, 48; grain sorghum, 56;wheat, 60; and millet, 48. For these forages, the units are converted to pounds and then adjustedby these factors: alfalfa haylage, 0.5; corn silage, 0.33; oatlage, 0.5; sorghum silage, 0.33; andsmall grain silage, 0.33.
67
The calving and weaning percentages are calculated as the number of calves which are calvedand weaned, respectively, divided by the number of cows which are supposed to bear young.
Rounding of individual items for the report may have caused minor discrepancies with thecalculated totals. If fewer than 5 farms have a certain livestock enterprise, that information is notreported. If there are fewer than 25 farms, the high and low groups are not reported.
68
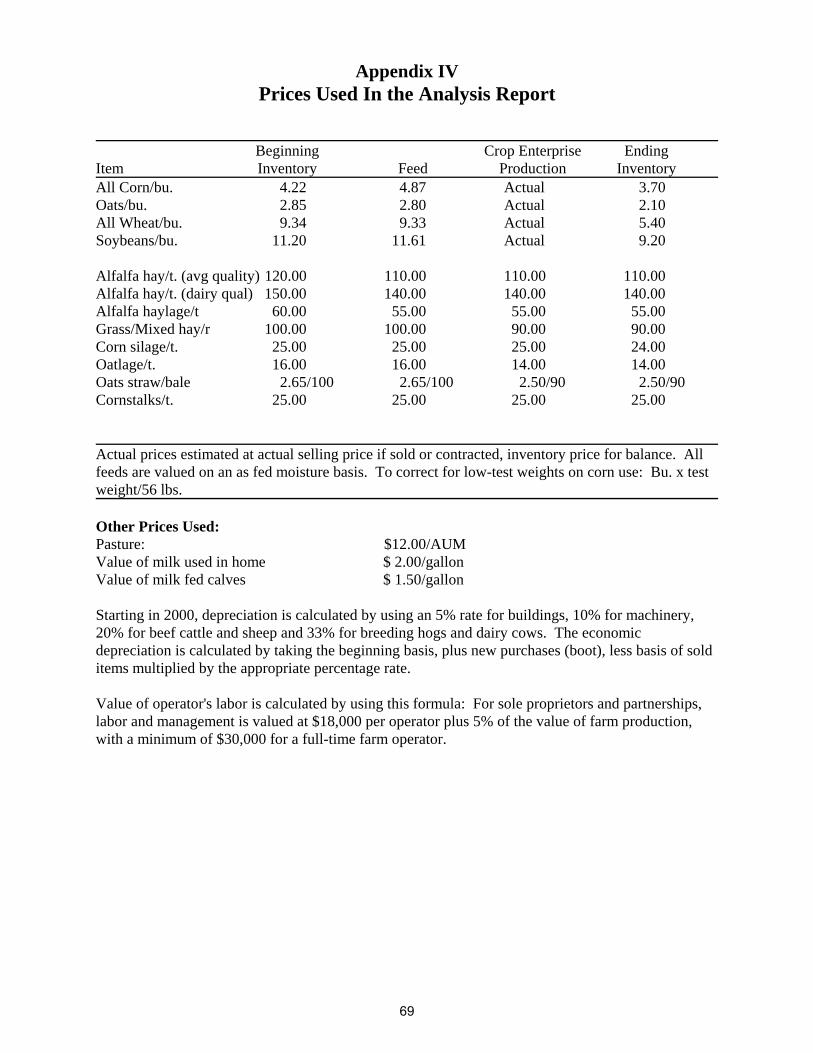
Appendix IVPrices Used In the Analysis Report
Beginning Crop Enterprise EndingItem Inventory Feed Production InventoryAll Corn/bu. 4.22 4.87 Actual 3.70Oats/bu. 2.85 2.80 Actual 2.10All Wheat/bu. 9.34 9.33 Actual 5.40Soybeans/bu. 11.20 11.61 Actual 9.20
Alfalfa hay/t. (avg quality) 120.00 110.00 110.00 110.00Alfalfa hay/t. (dairy qual) 150.00 140.00 140.00 140.00Alfalfa haylage/t 60.00 55.00 55.00 55.00Grass/Mixed hay/r 100.00 100.00 90.00 90.00Corn silage/t. 25.00 25.00 25.00 24.00Oatlage/t. 16.00 16.00 14.00 14.00Oats straw/bale 2.65/100 2.65/100 2.50/90 2.50/90Cornstalks/t. 25.00 25.00 25.00 25.00
Actual prices estimated at actual selling price if sold or contracted, inventory price for balance. Allfeeds are valued on an as fed moisture basis. To correct for low-test weights on corn use: Bu. x testweight/56 lbs.
Other Prices Used:Pasture: $12.00/AUM Value of milk used in home $ 2.00/gallonValue of milk fed calves $ 1.50/gallon
Starting in 2000, depreciation is calculated by using an 5% rate for buildings, 10% for machinery,20% for beef cattle and sheep and 33% for breeding hogs and dairy cows. The economicdepreciation is calculated by taking the beginning basis, plus new purchases (boot), less basis of solditems multiplied by the appropriate percentage rate.
Value of operator's labor is calculated by using this formula: For sole proprietors and partnerships,labor and management is valued at $18,000 per operator plus 5% of the value of farm production,with a minimum of $30,000 for a full-time farm operator.
69

70
The University of Minnesota is committed to the policy that all persons shall have equal access toits programs, facilities, and employment without regard to race, color, creed, religion, nationalorigin, sex, age, marital status, disability, public assistance status, veteran status, or sexualorientation.
Information on other titles in this series may be obtained from Waite Library, University ofMinnesota, Department of Applied Economics, 1994 Buford Avenue, 232 ClaOff, St. Paul, MN55108-6040, U.S.A. The Waite Library e-mail address is: [email protected]. This paper isavailable electronically from AgEcon Search at http://agecon.lib.umn.edu.
The entire report is available at: http://www.cffm.umn.edu/Publications/Pubs/FBMA/SW_MN_FBMA_2008.pdf