Embed Size (px)
Citation preview
Academia Journal of Scientific Research 6(5): 194-203, May 2018 DOI: 10.15413/ajsr.2018.0183 ISSN 2315-7712 ©2018 Academia Publishing
Research Paper
Farm level estimation of greenhouse gas emissions: A case study on a farm in the Central Upper Karoo, RSA
Accepted 15th January, 2018 ABSTRACT The livestock industry has a role to play in ensuring responsible agricultural practices to reduce Greenhouse gas (GHG) emissions because climate change also affects the sustainability of the industry itself. It is mostly at the production level that effective measures to reduce emissions can be taken. However, at the farm level, most farmers do not have the means or tools to evaluate their emissions so that they can adopt management strategies accordingly. The aim of this study therefore, was to evaluate the potential for farm level estimation of GHG emissions and develop a user-friendly, cost-effective and reliable tool that can be used at farm level. A case-study approach was followed and process mapping was conducted as a basis for the evaluation of the selected farm’s GHG emissions. Significant GHG aspects were identified from the inputs, processes and outputs on the farm. The equations, emission factors and other estimates from Intergovernmental Panel on Climate Change (IPCC) (2006) guidelines and Du Toit et al. (2013), were used for the estimation of the GHG emissions emanating directly from livestock activities on the farm. Other sources including data from Eskom, the United States Environmental Protection Agency (EPA) and the UK’s Department for Environment, Food and Rural Affairs (Defra) were used for emissions resulting from energy use and fertiliser application. The results were used to evaluate the potential and practicality of developing an estimation tool for use at a farm situation. The synthetic nitrogen fertiliser, electricity and fuel were identified as the largest sources of emissions associated with on-farm feed/crop production. It can be concluded that greenhouse gas emissions can be managed at farm level using a simple and cost effective method that will contribute to more effective management of emissions on farms. In terms of overall emissions from the different emission aspects, enteric fermentation emission had the largest share of the total farm emissions followed by energy use. The Nguni cattle on the farm had the largest contribution of the total farm emissions from the animal categories on the farm. The different sources were categorised as energy use, enteric fermentation, managed soils, manure management and other sources to be included in the estimation model because of their significance on GHG emissions on the farm. The farm level approaches will go a long way towards meeting the national and even the global goal of reducing emissions from the livestock sector. Key words: Climate change, farm carbon footprint, GHG, estimation model, emission factors, process mapping, GHG aspects.
INTRODUCTION Livestock production contributes to climate change in a feedback loop within which it contributes to the problem
and suffers from the effects (Scholtz et al., 2013). Therefore, a solution has to be found to ensure the
Philemon Thokozani Ngala Grootfontein Agricultural Development Institute, Private Bag X529, Middelburg (EC), South Africa. E-mail: [email protected].
Academia Journal of Scientific Research; Ngala. 195
contribution of livestock to GHG emissions is minimised while ensuring that productivity is not compromised.
Many studies on carbon emissions and the proposed management strategies (Intergovernmental Panel on Climate Change (IPCC), 2006; Garnett, 2010; Food and Agriculture Organisation (FAO), 2010; Capper, 2011; Zervas and Tsiplakou, 2012; Du Toit et al., 2013) have not come down to the farmer. This is despite the fact that, it is precisely at the production level that these strategies to minimise livestock carbon emissions can be effected. The challenge however, is to find cost-effective, non-laborious and user-friendly methods to measure GHG emissions at farm level. This will greatly contribute to the farmer’s ability to respond to potential reductions in the farm’s GHG emissions.
Most of the calculators that are offered online do not provide a reliable tool because of inter alia; the calculators are not user-friendly, unsuitable for the geographic area (that is, they are too generic or suitable for some areas only) and lack of consistency and transparency about the methods and estimates used (Padgett et al., 2007).
Various methods for direct measurements of GHG emissions, particularly methane (CH4) have been developed (Storm et al., 2012; Broucek, 2014). Direct measurements may provide more accurate emission estimates, but the technologies and methods used are too expensive and some are too technical for the farm situation. As a result, the need was identified for the development of a more reliable farm level tool that is derived from scientific findings and suitable for the geographic area or agro-ecological zone. The aim of this study therefore was to evaluate the potential for farm level estimation of GHG emissions using the available estimation values and develop a user-friendly, cost-effective and reliable tool that can be used at farm level.
MATERIALS AND METHODS
Study area The main study was conducted on a farm situated at a farming community called Baroda. Baroda is located along the Great Fish River, 5.5 km east of Cradock (32.0024° S; 25.5112°) in the Eastern Cape Province, South Africa. The farm is called Sarnia Farm and is 115 ha in size with two production aspects, which are animal and feed/crop production. The area is a predominantly small-stock producing area with some beef, dairy and game farming in some parts. The animals are mostly kept under extensive farming with supplementation during the drier parts of the year and cultivated pastures dominating along the Great Fish River.
Scope of the study The carbon footprint exercise was at farm level, that is, it
focused on activities up to the farm gate. Product processing, transportation, and the whole product chain outside the farm gate did not form part of this project. The study did not attempt to compare between different breeds, farming systems, management practices and other variables. Process mapping A process map is an illustrative description of all the activities, inputs and outputs of the farm’s entire operation. The activities from the supply of inputs to the last stage of production when the final product is ready to leave the farm were recorded in the data form. For this purpose, a cross-functional process mapping as described by RF Electronics (1996) was selected taking into account the scope of the study. Cross-functional process maps provide a full description of the operation by outlining how tasks, inputs, outputs and the interfaces in the production process flow and interact (RF Electronics, 1996). A data form was developed and provided for a wide scope to ensure inclusion of all farm-relevant information. The animals were categorised in line with the study by Du Toit et al. (2013) for the purpose assigning the emission factors to each animal category. Identification of carbon aspects The process map was used for the identification of environmental aspects relating to carbon emissions of all the activities, processes, inputs and outputs on the farm. GHG aspects from processes (chemical, biological or physical) that are associated with each aspect (input, activity and output) were identified using available literature. Other GHG aspects, such as chemicals were identified by obtaining information from the source/manufacturer (website, label or visit nearest suppliers such as agricultural cooperatives), identifying the active ingredient as most products are presented in trade names and analysing the active substance for environmental impacts linked to carbon emissions. The aspects were then categorised into three different categories following the IPCC (2006) guidelines and the GHG Protocol. Estimating carbon emissions from each aspect Estimation factors, equations and other default values were used for the calculation of emissions from the various identified aspects (Table 1). For consistency, the equations according to the IPCC (2006) guidelines were used. Customised emission or conversion factors (Eskom, 2015; Du Toit et al., 2013) were used and where specific information was not available, generic factors (Defra,
Academia Journal of Scientific Research; Ngala. 196
Table 1: Equations for the estimation of carbon emission according to IPCC (2006).
GHG aspect Aspect description GHG Equation
Enteric fermentation Animal categories CH4 Enteric = MEFenteric x no. animals
Manure Manure deposited on feed CH4 Manure CH4 = MEFmanure x no. animals
Metabolism of urine and faeces on feed N2O Manure N2O = NEFmanure x no. animals
Managed soils Synthetic fertiliser N2O N2O-NSF = EFSF x quantity (kg) applied
Manure fertiliser on feed N2O N2O-NPrP = EFPrP x FRN released yr-1
Energy use Electricity CO2 E = EF(E) x Amount (kWh)
Fuel CO2 F = EF(F) x Volume (litre)
Where: MEFmanure = methane emission factor for manure, NEFmanure = Nitrous oxide emission factor for manure, EFSF = Emission factor for synthetic fertiliser application, N2O-NPrP = Nitrous oxide emission from Nitrogen in manure and urine, EFPrP = Emission factor nitrous oxide emission from nitrogen in manure and urine.
Table 2: Emission factors (Du Toit et al., 2013; Defra, 2015; Eskom, 2015; IPCC, 2006).
C-aspect Description Emission factor Unit
Enteric fermentation
Bulls 113 Kg CH4 head-1 yr-1 Cows 92.6 Heifers 75.9 Oxen 89.4 Young oxen 51.6 Calves 51.6 Adult rams 15 Adult ewes 7.4 Young rams 10.5 Young ewes 5.8 Weaners 3.55 Lambs 2.76
Manure Bulls 0.022 Kg CH4 head-1 yr-1
Cows 0.018 Heifers 0.016 Oxen 0.018 Young oxen 0.012 Calves 0.012 Adult rams 0.005 Adult ewes 0.0022 Young rams 0.0032 Young ewes 0.002 Weaners 0.001 Lambs 0.0007
Managed soils
Synthetic 0,01 kg N2O-N (kg N)-1 Cattle manure 0.02 kg N2O-N (kg N)-1 Sheep manure 0.01 kg N2O-N (kg N)-1
Energy
Electricity 0.98 Kg CO2/kWh Diesel 2.717 Kg CO2/litre
2015; IPCC, 2006) were used (Table 2).
The Eskom charges that were used were presented as the average active energy charge of the high demand
season (72.25 c/kWh) and low demand season (56.18 c/kWh) for the transmission zone (Eskom, 2015). Therefore, 64.22 c/kWh was used for the conversion of the
Academia Journal of Scientific Research; Ngala. 197
Table 3: Summary of production inputs, outputs and processes of the farm.
Output Size Production processes Inputs
Lucerne 45 ha
Land preparation, cultivation, irrigation, pest control, weed control, cutting, baling, removal of bales
Fuel, fertilisers, water, electricity, pesticides, herbicides
Maize 50 ha
Land preparation, cultivation, irrigation, pest and weed control, combine harvesting, transportation
Fuel, fertilisers, water, electricity, pesticides, herbicides
Rye grass 20 ha
Land preparation, cultivation, irrigation, pest and weed control
Fuel, fertilisers, water, electricity, pesticides, herbicides
Dormer sheep 373 General flock management Lucerne, rye grass, Nutritub, salt block, Embavit TM ,Embamin TM, Dazzle , wound spray, Prodose Orange, PAB
Nguni cattle 41 General flock management Lucerne, rye grass, natural feed, vaccines
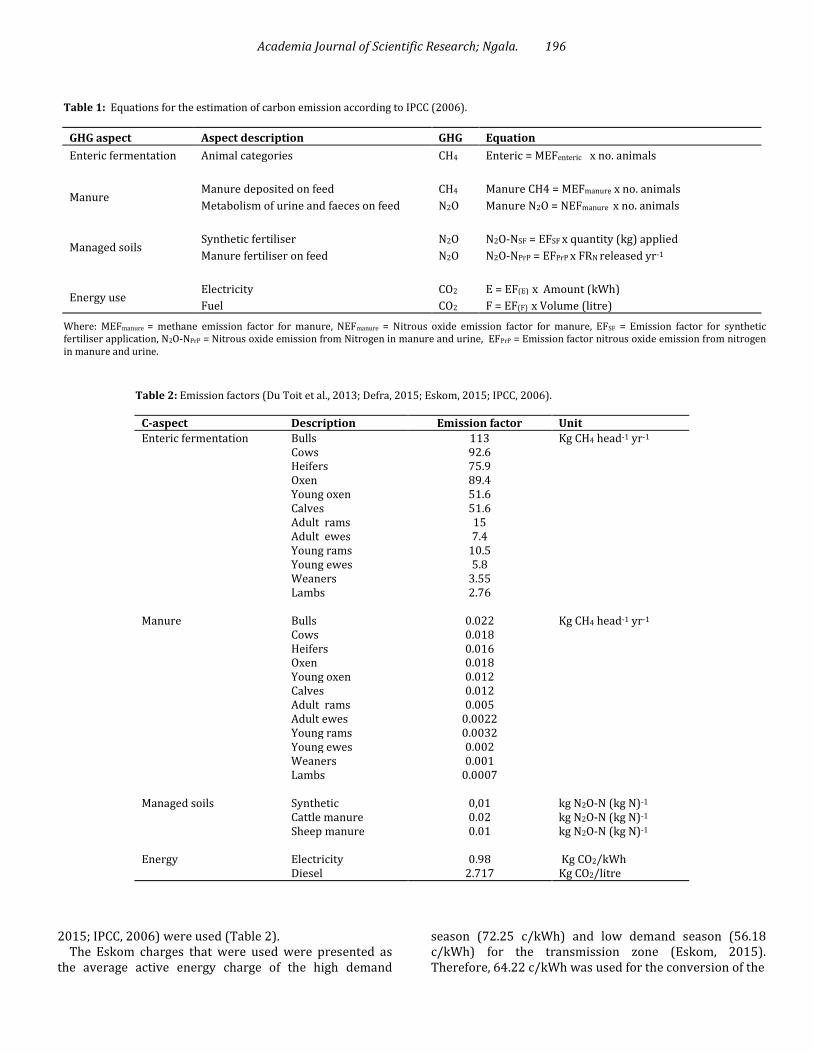
Figure 2. Land utilisation profile of the farm.
Figure 1: Land utilisation profile of the farm.
electricity cost into kWh. Where: EF(E) = Emission factor for electricity usage. EF(F) = Emission factor for fuel (diesel) consumption. RESULTS AND DISCUSSION The process map The farm had two production components, namely animal production and feed/crop production (Table 3). The main commodities of the farm were maize, lucerne, dual-purpose sheep and beef cattle. The feed/crop production component plays a dual role, providing support to the animal production component as animal feed and playing an important role as a distinct maize and lucerne
production business operation that provides additional income for the farm. In terms of energy use, the feed/crop production aspect was the largest energy consumer with much of the energy used for irrigation, water pumping and transport.
The size of the farm under irrigation was 115 ha, which is 77% of the total farm size, consisting of the maize field, lucerne and rye grass. The land utilisation figures of the farm (Figure 1) appear to suggest a farming system called Arid and semi-arid tropics and subtropics mixed system (MIA). This may appear to be inconsistent with the stated status of the farm as a livestock farm with animal production as the main enterprise. This is however, consistent with Robinson et al. (2011) that the MIA system traditionally appears to focus on crop production as the main source of income with an extensive livestock production playing a secondary role.

Academia Journal of Scientific Research; Ngala. 198
Table 4: Identification of GHG aspects from production inputs and outputs.
Inputs Source processes GHG Category/scope
Nitrogen fertiliser Fertiliser application (Nitrification and denitrification) N2O, CH4 Managed Soils
Waste
Pesticides Production off –farm
Pollution/waste management
CO2 Pollution/waste
Roundup® (herbicide) Soil storage/microbial activity
Production off-farm
Pollution/waste management
N2O
CO2
Offsets
Pollution/waste
Water Carbon storage CO2 Offsets
Electricity Off-farm production and on-farm energy use CO2 Energy use
Fuel Energy use/combustion CO2 Energy use
Multivax Production off-farm CO2 Off-farm
EmbavitTM Production off-farm CO2 Off-farm
Vitamin A&E Production off-farm CO2 Off-farm
PAB Production off-farm CO2 Off-farm
Wound spray Production off-farm CO2 Off-farm
Prodose orange Production off-farm CO2 Off-farm
Dazzle for blue flystrike Production off-farm CO2 Off-farm
Nutritub Feeding/Enteric fermentation
Production off-farm
CH4, CO2 Enteric fermentation
Off- farm
Salt block Feeding/Enteric fermentation
Production off-farm
CH4, CO2 Enteric fermentation
Off-farm
Lucerne Feeding/Enteric fermentation, photosynthesis , soil storage/processes
CH4, N2O, CO2 Enteric fermentation
Offsets
Rye grass Feeding/Enteric fermentation
Photosynthesis, Soil storage/processes
CH4, N2O, CO2 Enteric fermentation
Offsets
Natural veld Feeding/Enteric fermentation
Photosynthesis, Soil storage/processes
CH4, N2O, CO2 Enteric fermentation
Offsets
Maize Photosynthesis, Soil storage/processes CO2, N2O Offsets
Wool - - -
Animals Enteric fermentation CH4 Enteric fermentation
Manure Microbial decomposition CH4 Manure management
Managed soils
Identification of GHG aspects The results of carbon aspects from production inputs and outputs are summarised in Table 4. A number of aspects that were identified are linked to off-farm emissions emanating from manufacturing processes, storage and transportation. Aspects that result in on-farm emissions
include the nitrogen fertiliser, animal categories, animal feed, fuel and some aspects that contribute to pollution and forming part of the emissions from waste management.
The carbon aspects identified from the process map were categorised in accordance with with the GHG Protocol, IPCC (2006) guidelines and also taking into
Academia Journal of Scientific Research; Ngala. 199
0.02%
0.40%
1.29%
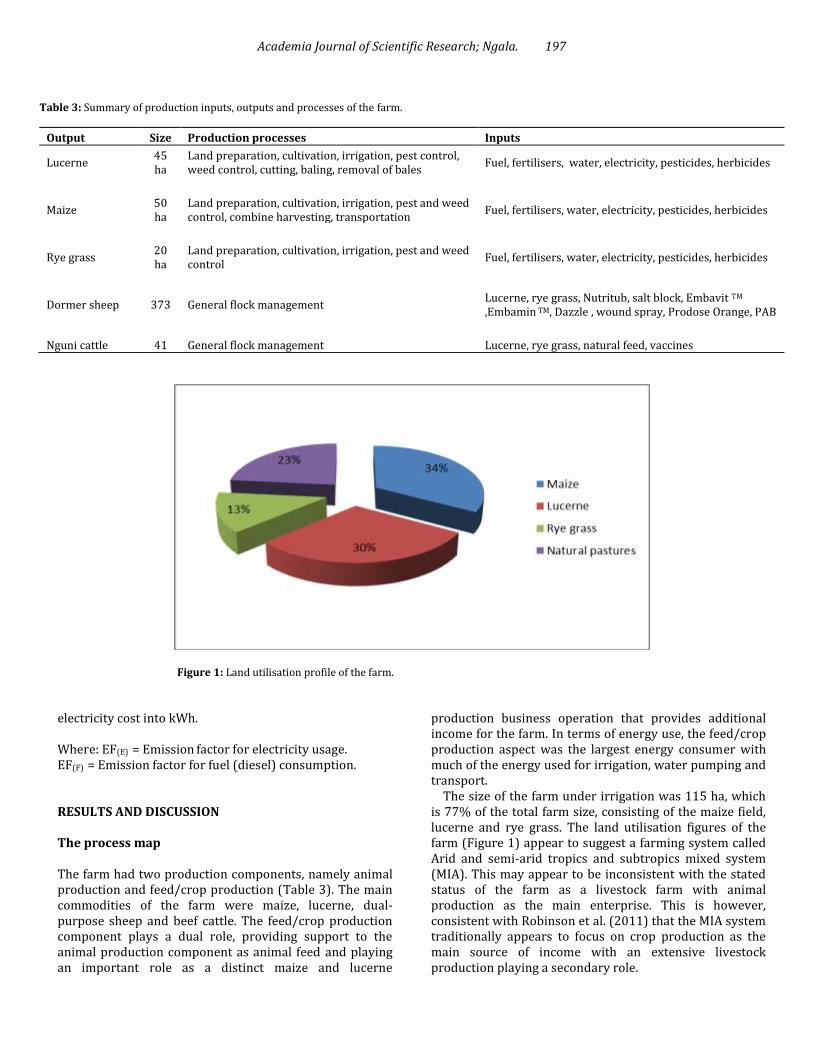
Figure 2: GHG emission profile of the farm by GHG category.
account the objectives of the study. The aspects were categorised as Managed soils, Pollution/waste, energy use, enteric fermentation, manure management, offsets and off-farm emissions. Offsets are all the aspects that have a potential impact in reducing carbon emissions by absorbing or sequestering carbon dioxide or any other GHG. Off-farm emissions are all the aspects that may not directly contribute to emissions through on-farm use, but are emanating from processes outside the farm gate that include manufacturing processes, storage and transportation. The farmer inherits the emissions from these aspects and therefore, they should be included in the farm’s GHG emission inventory.
Manure contributes to both the manure management and managed soils categories. According to IPCC (2006), nitrous oxide emissions emanating from manure management deposited on the veld are accounted for under Managed Soils because of the fertiliser role deposited manure plays in stimulating microbial activity for the production of nitrous oxide in the soil (EPA, 2012).
The IPCC (2006) guidelines deal with crop agriculture separately from livestock agriculture. However, given the scope of the farm’s operations and the growing trend towards on-farm feed production, the emissions from this aspect cannot be ignored. The carbon aspects that were identified for the feed production component, electricity, fuel and fertiliser, were however, included in the various categories. Estimation of carbon emissions from the identified aspects Enteric fermentation was by far the largest contributor to GHG emissions (70%) as measured in carbon dioxide
equivalent (Figure 2). This was followed by fuel, which contributed a notable portion of emissions at 17%. Energy use in total contributed 28% (electricity and fuel) of all emissions and this is significant according to the IPCC (2006) estimations. According to the estimates by Opio et al. (2013), feed emissions contributed the largest portion of the total sector emissions even though enteric fermentation was the largest source of emissions emanating directly from the livestock category. However, the estimates included a wide range of activities associated with feed emissions including processing, transportation and also emissions categorised separately in this study as managed soils.
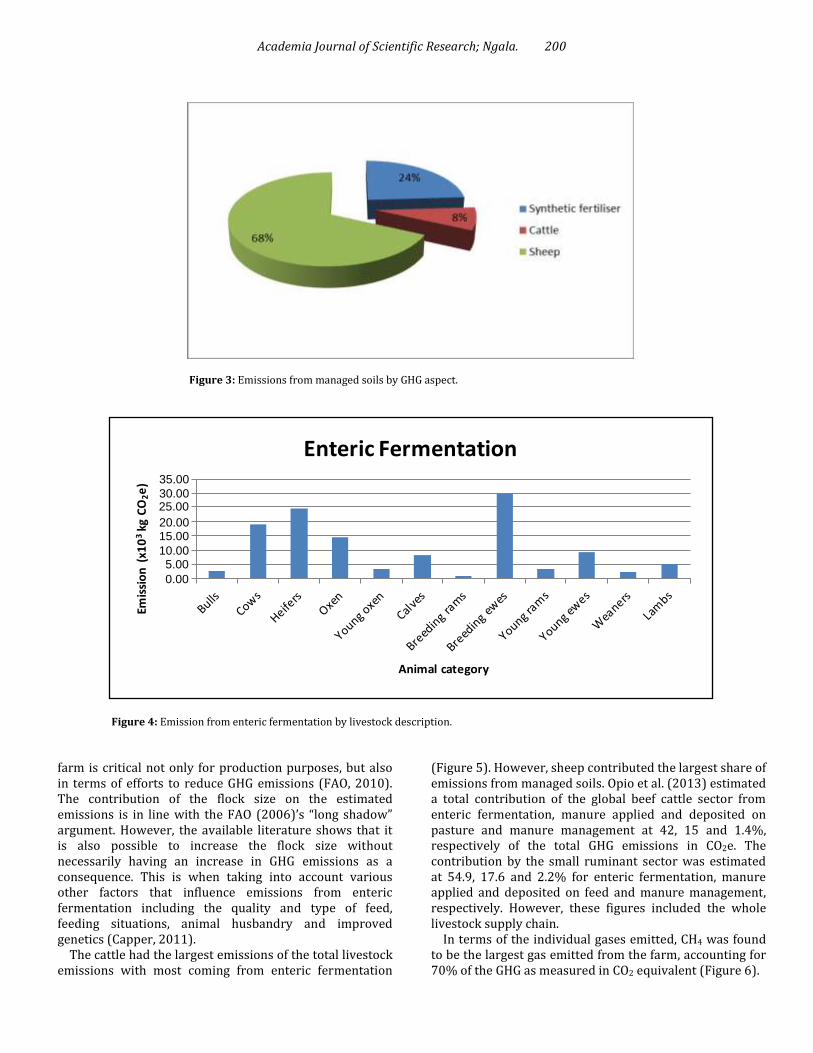
The total contribution from managed soils (fertilisers and manure deposited on pasture) was about 2% of the total emissions with small ruminants (sheep) contributing the largest share of emissions of the total managed soil emissions (Figure 3).
Given that, the feed production component is the major energy user on the farm, classifying the managed soils aspect and energy use as part of feed emissions means that feed production contributed an estimated 30% of the total farm’s emissions. However, this also includes emissions associated with maize production which is a distinct operation not intended for animal feed. But it also excludes contributions from the offsets and off-farm aspect categories. Therefore, taking these dynamics into account, the results are consistent with various other studies (FAO, 2010; Capper, 2011; Gerber et al., 2013).
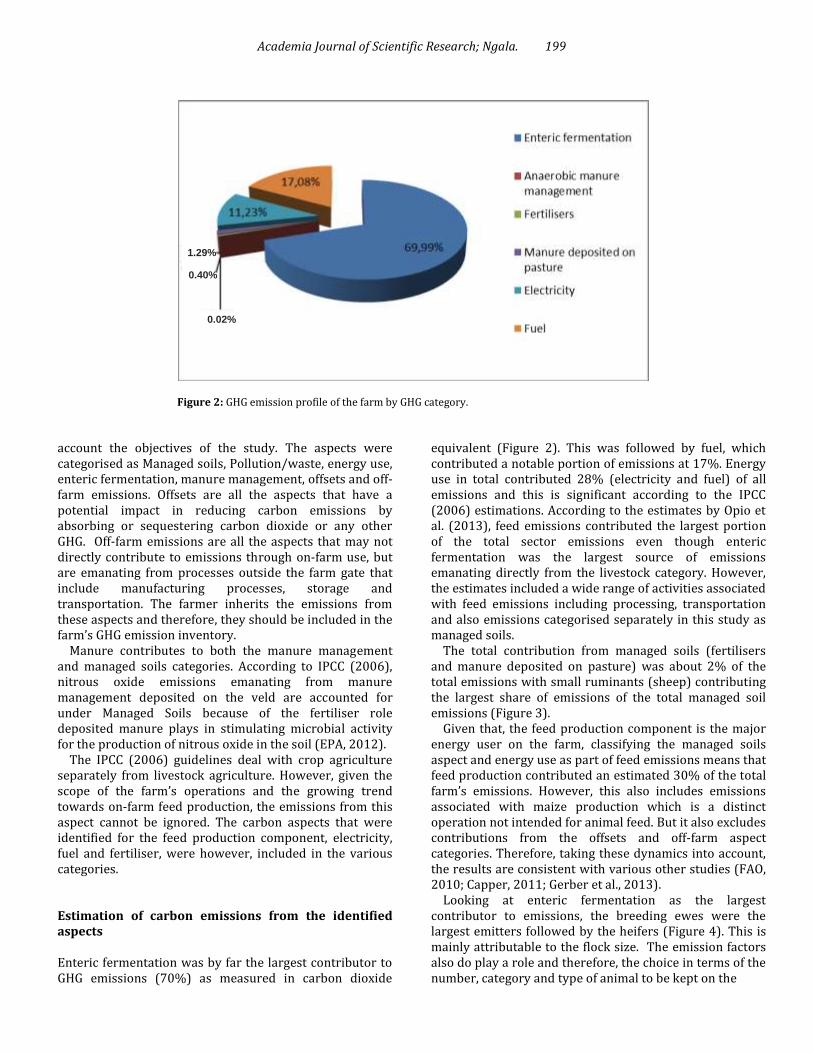
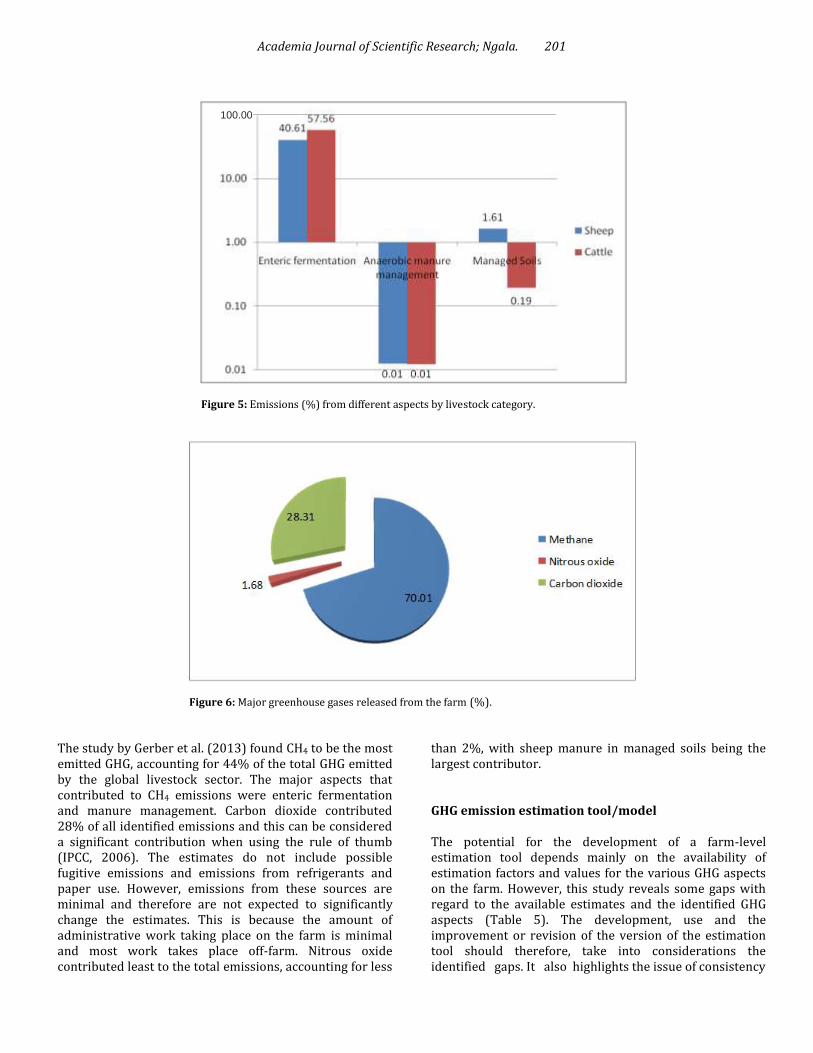
Looking at enteric fermentation as the largest contributor to emissions, the breeding ewes were the largest emitters followed by the heifers (Figure 4). This is mainly attributable to the flock size. The emission factors also do play a role and therefore, the choice in terms of the number, category and type of animal to be kept on the
Academia Journal of Scientific Research; Ngala. 200
Figure 3. GHG emission profile of the farm by GHG category
Figure 4. Emissions from managed soils by GHG aspect
Figure 3: Emissions from managed soils by GHG aspect.
0,005,00
10,0015,0020,0025,0030,0035,00
Emis
sio
n (
x10
3kg
CO
2e
)
Animal category
Enteric Fermentation
35.00
30.00 25.00
20.00 15.00
10.00 5.00
0.00
Figure 4: Emission from enteric fermentation by livestock description.
farm is critical not only for production purposes, but also in terms of efforts to reduce GHG emissions (FAO, 2010). The contribution of the flock size on the estimated emissions is in line with the FAO (2006)’s “long shadow” argument. However, the available literature shows that it is also possible to increase the flock size without necessarily having an increase in GHG emissions as a consequence. This is when taking into account various other factors that influence emissions from enteric fermentation including the quality and type of feed, feeding situations, animal husbandry and improved genetics (Capper, 2011).
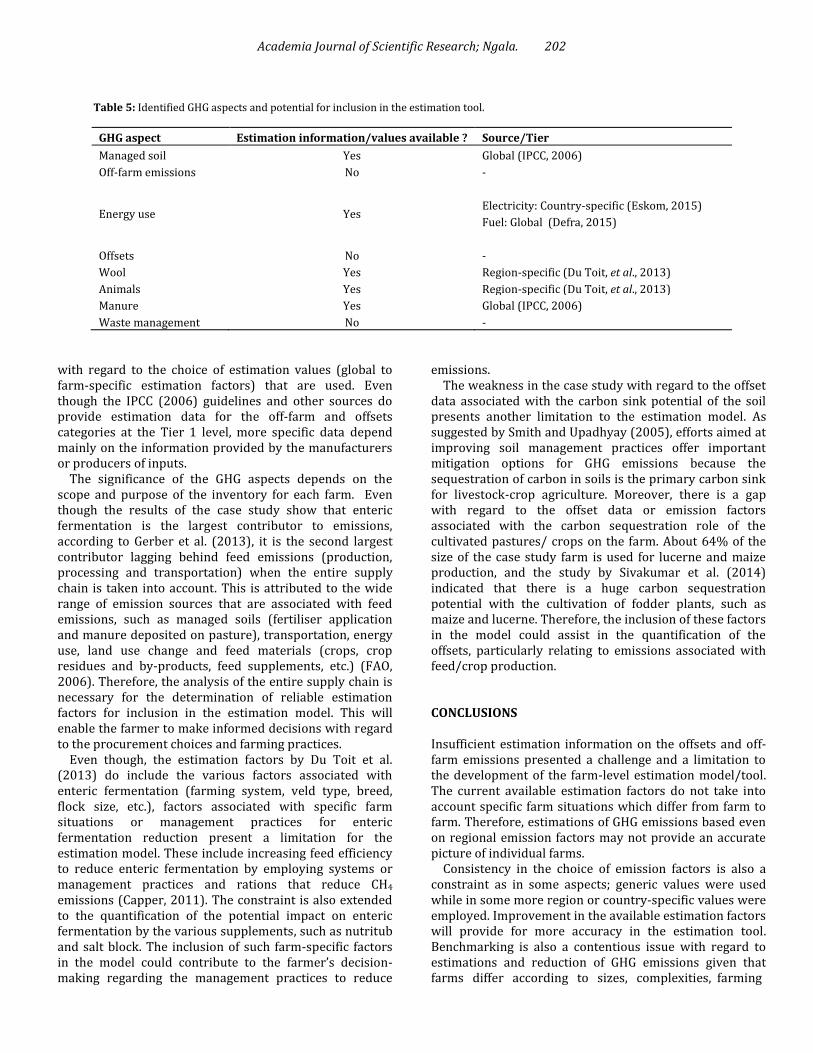
The cattle had the largest emissions of the total livestock emissions with most coming from enteric fermentation
(Figure 5). However, sheep contributed the largest share of emissions from managed soils. Opio et al. (2013) estimated a total contribution of the global beef cattle sector from enteric fermentation, manure applied and deposited on pasture and manure management at 42, 15 and 1.4%, respectively of the total GHG emissions in CO2e. The contribution by the small ruminant sector was estimated at 54.9, 17.6 and 2.2% for enteric fermentation, manure applied and deposited on feed and manure management, respectively. However, these figures included the whole livestock supply chain.
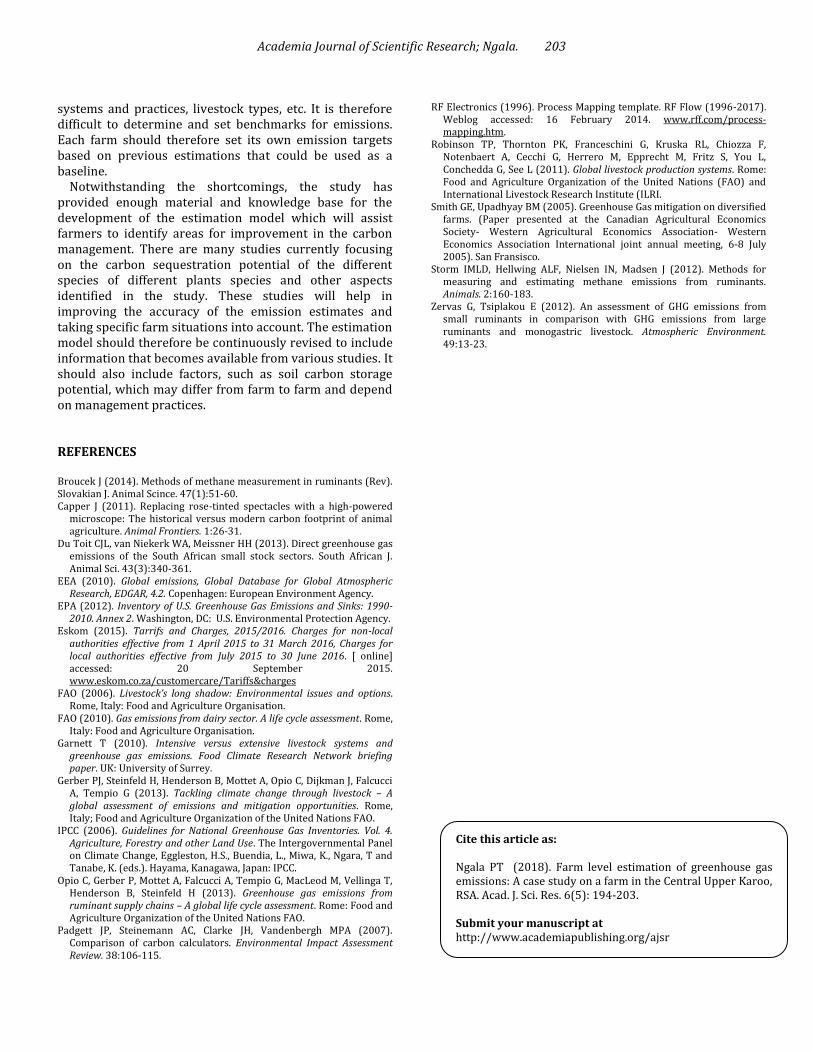
In terms of the individual gases emitted, CH4 was found to be the largest gas emitted from the farm, accounting for 70% of the GHG as measured in CO2 equivalent (Figure 6).
Academia Journal of Scientific Research; Ngala. 201
100.00
Figure 5: Emissions (%) from different aspects by livestock category.
Figure 6: Major greenhouse gases released from the farm (%).
The study by Gerber et al. (2013) found CH4 to be the most emitted GHG, accounting for 44% of the total GHG emitted by the global livestock sector. The major aspects that contributed to CH4 emissions were enteric fermentation and manure management. Carbon dioxide contributed 28% of all identified emissions and this can be considered a significant contribution when using the rule of thumb (IPCC, 2006). The estimates do not include possible fugitive emissions and emissions from refrigerants and paper use. However, emissions from these sources are minimal and therefore are not expected to significantly change the estimates. This is because the amount of administrative work taking place on the farm is minimal and most work takes place off-farm. Nitrous oxide contributed least to the total emissions, accounting for less
than 2%, with sheep manure in managed soils being the largest contributor. GHG emission estimation tool/model The potential for the development of a farm-level estimation tool depends mainly on the availability of estimation factors and values for the various GHG aspects on the farm. However, this study reveals some gaps with regard to the available estimates and the identified GHG aspects (Table 5). The development, use and the improvement or revision of the version of the estimation tool should therefore, take into considerations the identified gaps. It also highlights the issue of consistency
Academia Journal of Scientific Research; Ngala. 202
Table 5: Identified GHG aspects and potential for inclusion in the estimation tool.
GHG aspect Estimation information/values available ? Source/Tier
Managed soil Yes Global (IPCC, 2006)
Off-farm emissions No -
Energy use Yes Electricity: Country-specific (Eskom, 2015)
Fuel: Global (Defra, 2015)
Offsets No -
Wool Yes Region-specific (Du Toit, et al., 2013)
Animals Yes Region-specific (Du Toit, et al., 2013)
Manure Yes Global (IPCC, 2006)
Waste management No -
with regard to the choice of estimation values (global to farm-specific estimation factors) that are used. Even though the IPCC (2006) guidelines and other sources do provide estimation data for the off-farm and offsets categories at the Tier 1 level, more specific data depend mainly on the information provided by the manufacturers or producers of inputs.
The significance of the GHG aspects depends on the scope and purpose of the inventory for each farm. Even though the results of the case study show that enteric fermentation is the largest contributor to emissions, according to Gerber et al. (2013), it is the second largest contributor lagging behind feed emissions (production, processing and transportation) when the entire supply chain is taken into account. This is attributed to the wide range of emission sources that are associated with feed emissions, such as managed soils (fertiliser application and manure deposited on pasture), transportation, energy use, land use change and feed materials (crops, crop residues and by-products, feed supplements, etc.) (FAO, 2006). Therefore, the analysis of the entire supply chain is necessary for the determination of reliable estimation factors for inclusion in the estimation model. This will enable the farmer to make informed decisions with regard to the procurement choices and farming practices.
Even though, the estimation factors by Du Toit et al. (2013) do include the various factors associated with enteric fermentation (farming system, veld type, breed, flock size, etc.), factors associated with specific farm situations or management practices for enteric fermentation reduction present a limitation for the estimation model. These include increasing feed efficiency to reduce enteric fermentation by employing systems or management practices and rations that reduce CH4 emissions (Capper, 2011). The constraint is also extended to the quantification of the potential impact on enteric fermentation by the various supplements, such as nutritub and salt block. The inclusion of such farm-specific factors in the model could contribute to the farmer’s decision-making regarding the management practices to reduce
emissions. The weakness in the case study with regard to the offset
data associated with the carbon sink potential of the soil presents another limitation to the estimation model. As suggested by Smith and Upadhyay (2005), efforts aimed at improving soil management practices offer important mitigation options for GHG emissions because the sequestration of carbon in soils is the primary carbon sink for livestock-crop agriculture. Moreover, there is a gap with regard to the offset data or emission factors associated with the carbon sequestration role of the cultivated pastures/ crops on the farm. About 64% of the size of the case study farm is used for lucerne and maize production, and the study by Sivakumar et al. (2014) indicated that there is a huge carbon sequestration potential with the cultivation of fodder plants, such as maize and lucerne. Therefore, the inclusion of these factors in the model could assist in the quantification of the offsets, particularly relating to emissions associated with feed/crop production. CONCLUSIONS Insufficient estimation information on the offsets and off-farm emissions presented a challenge and a limitation to the development of the farm-level estimation model/tool. The current available estimation factors do not take into account specific farm situations which differ from farm to farm. Therefore, estimations of GHG emissions based even on regional emission factors may not provide an accurate picture of individual farms.
Consistency in the choice of emission factors is also a constraint as in some aspects; generic values were used while in some more region or country-specific values were employed. Improvement in the available estimation factors will provide for more accuracy in the estimation tool. Benchmarking is also a contentious issue with regard to estimations and reduction of GHG emissions given that farms differ according to sizes, complexities, farming
Academia Journal of Scientific Research; Ngala. 203 systems and practices, livestock types, etc. It is therefore difficult to determine and set benchmarks for emissions. Each farm should therefore set its own emission targets based on previous estimations that could be used as a baseline.
Notwithstanding the shortcomings, the study has provided enough material and knowledge base for the development of the estimation model which will assist farmers to identify areas for improvement in the carbon management. There are many studies currently focusing on the carbon sequestration potential of the different species of different plants species and other aspects identified in the study. These studies will help in improving the accuracy of the emission estimates and taking specific farm situations into account. The estimation model should therefore be continuously revised to include information that becomes available from various studies. It should also include factors, such as soil carbon storage potential, which may differ from farm to farm and depend on management practices. REFERENCES Broucek J (2014). Methods of methane measurement in ruminants (Rev). Slovakian J. Animal Scince. 47(1):51-60. Capper J (2011). Replacing rose-tinted spectacles with a high-powered
microscope: The historical versus modern carbon footprint of animal agriculture. Animal Frontiers. 1:26-31.
Du Toit CJL, van Niekerk WA, Meissner HH (2013). Direct greenhouse gas emissions of the South African small stock sectors. South African J. Animal Sci. 43(3):340-361.
EEA (2010). Global emissions, Global Database for Global Atmospheric Research, EDGAR, 4.2. Copenhagen: European Environment Agency.
EPA (2012). Inventory of U.S. Greenhouse Gas Emissions and Sinks: 1990-2010. Annex 2. Washington, DC: U.S. Environmental Protection Agency.
Eskom (2015). Tarrifs and Charges, 2015/2016. Charges for non-local authorities effective from 1 April 2015 to 31 March 2016, Charges for local authorities effective from July 2015 to 30 June 2016. [ online] accessed: 20 September 2015. www.eskom.co.za/customercare/Tariffs&charges
FAO (2006). Livestock’s long shadow: Environmental issues and options. Rome, Italy: Food and Agriculture Organisation.
FAO (2010). Gas emissions from dairy sector. A life cycle assessment. Rome, Italy: Food and Agriculture Organisation.
Garnett T (2010). Intensive versus extensive livestock systems and greenhouse gas emissions. Food Climate Research Network briefing paper. UK: University of Surrey.
Gerber PJ, Steinfeld H, Henderson B, Mottet A, Opio C, Dijkman J, Falcucci A, Tempio G (2013). Tackling climate change through livestock – A global assessment of emissions and mitigation opportunities. Rome, Italy; Food and Agriculture Organization of the United Nations FAO.
IPCC (2006). Guidelines for National Greenhouse Gas Inventories. Vol. 4. Agriculture, Forestry and other Land Use. The Intergovernmental Panel on Climate Change, Eggleston, H.S., Buendia, L., Miwa, K., Ngara, T and Tanabe, K. (eds.). Hayama, Kanagawa, Japan: IPCC.
Opio C, Gerber P, Mottet A, Falcucci A, Tempio G, MacLeod M, Vellinga T, Henderson B, Steinfeld H (2013). Greenhouse gas emissions from ruminant supply chains – A global life cycle assessment. Rome: Food and Agriculture Organization of the United Nations FAO.
Padgett JP, Steinemann AC, Clarke JH, Vandenbergh MPA (2007). Comparison of carbon calculators. Environmental Impact Assessment Review. 38:106-115.
RF Electronics (1996). Process Mapping template. RF Flow (1996-2017). Weblog accessed: 16 February 2014. www.rff.com/process-mapping.htm.
Robinson TP, Thornton PK, Franceschini G, Kruska RL, Chiozza F, Notenbaert A, Cecchi G, Herrero M, Epprecht M, Fritz S, You L, Conchedda G, See L (2011). Global livestock production systems. Rome: Food and Agriculture Organization of the United Nations (FAO) and International Livestock Research Institute (ILRI.
Smith GE, Upadhyay BM (2005). Greenhouse Gas mitigation on diversified farms. (Paper presented at the Canadian Agricultural Economics Society- Western Agricultural Economics Association- Western Economics Association International joint annual meeting, 6-8 July 2005). San Fransisco.
Storm IMLD, Hellwing ALF, Nielsen IN, Madsen J (2012). Methods for measuring and estimating methane emissions from ruminants. Animals. 2:160-183.
Zervas G, Tsiplakou E (2012). An assessment of GHG emissions from small ruminants in comparison with GHG emissions from large ruminants and monogastric livestock. Atmospheric Environment. 49:13-23.
Cite this article as: Ngala PT (2018). Farm level estimation of greenhouse gas emissions: A case study on a farm in the Central Upper Karoo, RSA. Acad. J. Sci. Res. 6(5): 194-203. Submit your manuscript at http://www.academiapublishing.org/ajsr