Embed Size (px)
Citation preview

Farm Subsidies, Agricultural R&D, and Obesity
Julian M. AlstonDepartment of Agricultural and Resource Economics
University of California, Davis
Workshop on Farm and Food Policy and ObesityMay 21-22, 2010
UC Davis Conference Center

Based mainly on:
Alston, J.M., D.A. Sumner, and S.A. Vosti. “Farm Subsidies and Obesity in the United States: National Evidence and International Comparisons.” Food Policy 33(6) (December 2008): 470-479.

Motivation ● It is commonly suggested that farm subsidies contribute
significantly to obesity and reducing these subsidies would go a long to solving the problem
● In 2008 Barak Obama, citing Michael Pollan, told Time magazine:
[Farm subsidies are] contributing to type 2 diabetes, stroke and heart disease, obesity, all the things that are driving our huge explosion in health care costs.
● This view has become accepted as a fact, in spite of No real evidence presented Questions about the nature of effects Grounds for skepticism about the size of effects

USDA Program Expenditure in 2009
Percent of Total
billions of dollars percent
Food, Nutrition, & Consumer Services 82.2 64.5
Farm Service Agency 15.6 12.2
Natural Resources & Environment 10.1 7.9
Risk Management 6.5 5.1
Rural Development 3.3 2.6
Research, Education, & Economics 3.0 2.3
Foreign Agricultural Service 2.6 2.0
Marketing & Regulatory Programs 2.4 1.9
Other -3.4 -2.7
TOTAL 127.8 100.0

Farm Program ExpendituresCCC Outlays by Fiscal Year
0.0
5.0
10.0
15.0
20.0
25.0
30.0
35.0
billio
n do
llars
1990 FACT Act 1996 FAIR Act 2002 FSRI Act 2008 FCSE Act
Estimates
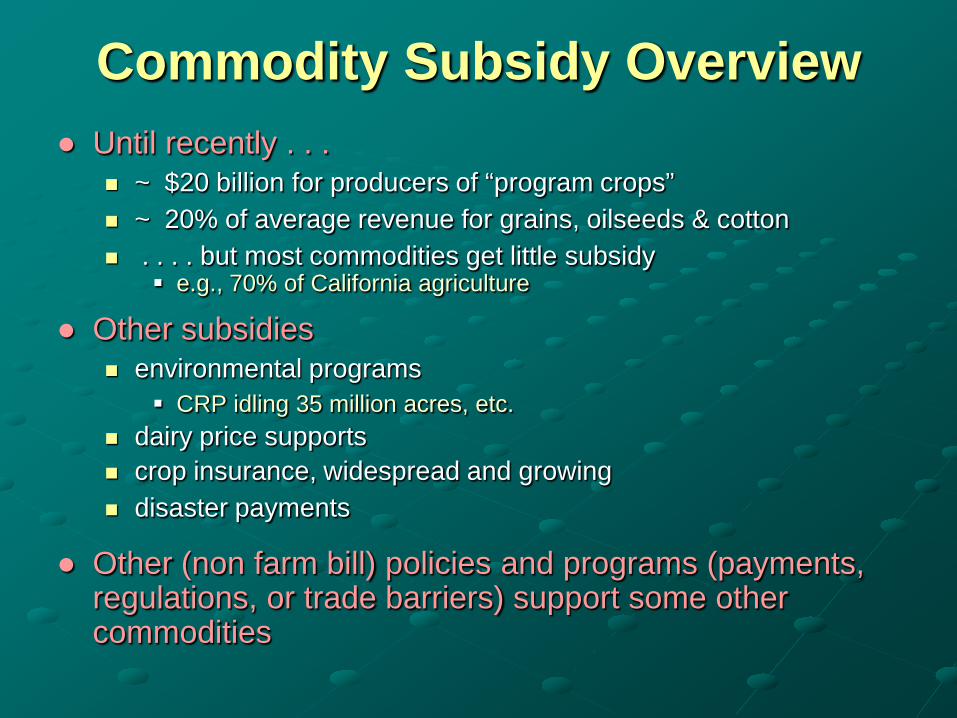
Commodity Subsidy Overview● Until recently . . .
~ $20 billion for producers of “program crops” ~ 20% of average revenue for grains, oilseeds & cotton . . . . but most commodities get little subsidy
e.g., 70% of California agriculture
● Other subsidies environmental programs
CRP idling 35 million acres, etc. dairy price supports crop insurance, widespread and growing disaster payments
● Other (non farm bill) policies and programs (payments, regulations, or trade barriers) support some other commodities
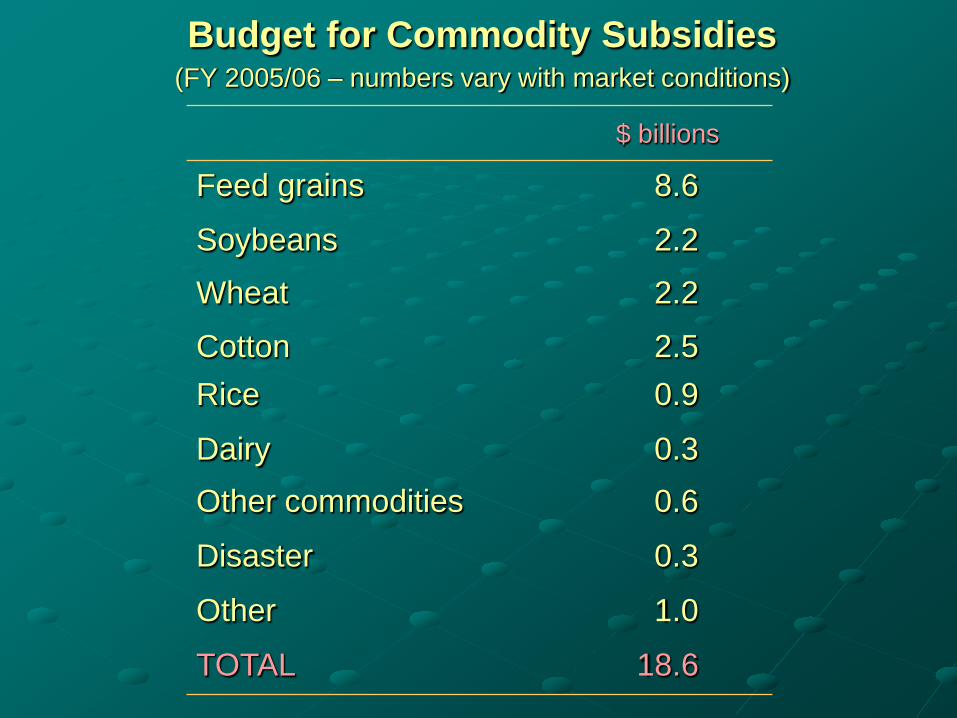
Budget for Commodity Subsidies (FY 2005/06 – numbers vary with market conditions)
$ billions
Feed grains 8.6
Soybeans 2.2Wheat 2.2
Cotton 2.5Rice 0.9
Dairy 0.3Other commodities 0.6
Disaster 0.3
Other 1.0
TOTAL 18.6
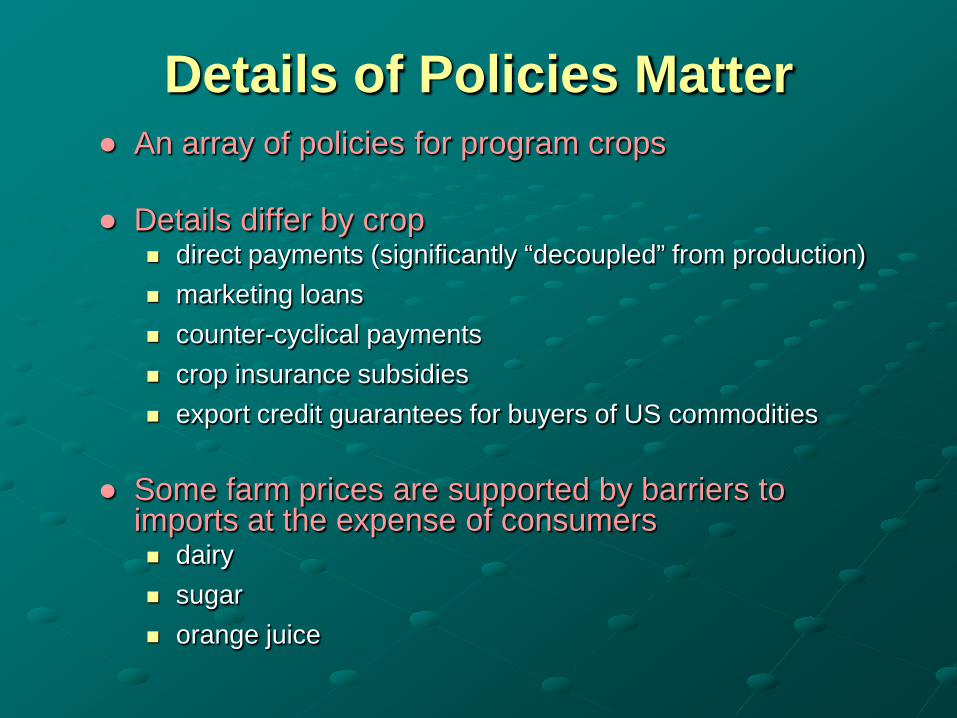
Details of Policies Matter● An array of policies for program crops
● Details differ by crop direct payments (significantly “decoupled” from production) marketing loans counter-cyclical payments crop insurance subsidies export credit guarantees for buyers of US commodities
● Some farm prices are supported by barriers to imports at the expense of consumers dairy sugar orange juice

Implicit Model● Simplistic model
Textbook subsidy => increase in producer price and production, a decrease in the consumer price, and an increase in consumption
● More detailed mechanism Subsidies reduce market prices of farm commodities, especially those
that are important ingredients of more fattening foods
Lower farm commodity prices lower costs of food manufacturing
Food industry passes these cost savings on to consumers
Consumers increase their consumption of more-fattening foods
● Size of effect? If effect at any step is small, total effect is small
If effect at every step is small combined effect is negligible

In reality . . . .
● Lower impact on production and prices than text-book model would indicate because
Other policies (e.g., acreage set-asides) have contained production response
Conservation Reserve Program removes 36 million acres (about 8 percent of cropland) from production
A significant share of subsidies (~ 50%) are based on historical yields and acreage
Policies make some commodities more expensive for the food industry – especially sugar, dairy

Consequently. . . ● Effects on commodity prices: modest and mixed
● Effects on food prices: even smaller
Commodity costs are a small share of food costs ~ 20% or less
Even with complete pass through, percentage effects on food prices must be small
$20 billion represents less than 3 percent of total U.S. food consumption expenditure in recent years
● Effects on consumption must be very small given limited consumer demand response to price

Percentage Changes in Quantity and Price in 2016 after Phasing Out all U.S. Agricultural Subsidies and
Protection over 2007-2016Source: ABARE (2006) Report
Commodity % QuantityChange
% Price Change
Soybeans -2.86 -1.14
Wheat -7.58 1.52
Corn -3.79 0.26
Rice -11.71 -3.87
Sugar -33.31 -15.30
Fruit and Vegetables 4.42 -5.16
Beef Cattle 1.44 -3.31
Pigs and Poultry 0.41 -0.01
Milk -0.45 -0.01
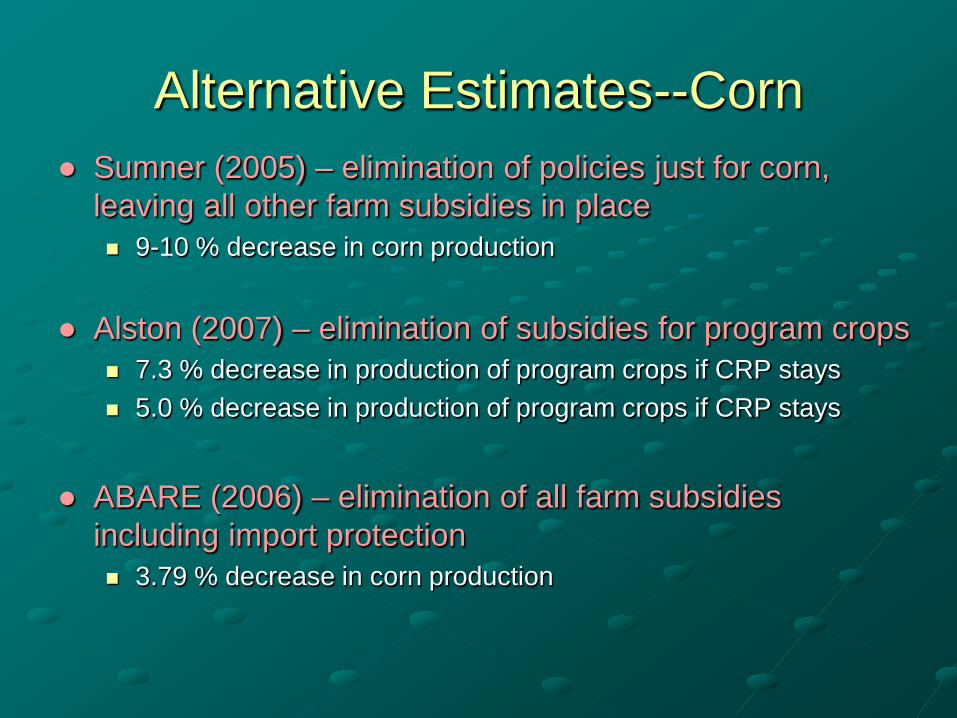
Alternative Estimates--Corn● Sumner (2005) – elimination of policies just for corn,
leaving all other farm subsidies in place 9-10 % decrease in corn production
● Alston (2007) – elimination of subsidies for program crops 7.3 % decrease in production of program crops if CRP stays 5.0 % decrease in production of program crops if CRP stays
● ABARE (2006) – elimination of all farm subsidies including import protection 3.79 % decrease in corn production

Corn Prices and Consumers
● Corn and other feedstuffs < 40% of farm cost of livestock
● Farm cost of livestock ~ 20% of the retail cost of meat
● A 5% decrease in corn price < 0.4 % decrease in retail price of meat < 0.2 % increase in consumption of meat?

Caloric Sweeteners
● What about High Fructose Corn Syrup (HFCS)?
● Growth in consumption of HFCS was caused mainly by restrictions on imports of sugar Higher price of sugar Switch from sugar to HFCS (reinforced by corn policy)
● Overall effect of sugar policy and corn policy Higher price of caloric sweeteners Less total consumption of caloric sweeteners A change in the mix to consume more HFCS and less
sugar

International Evidence● Simple causation from farm subsidies to obesity is
also inconsistent with patterns across countries

Farm Support in OECD Countries[Total US$ 280 billion in 2004]
0
10
20
30
40
50
60
70
1986 1989 1992 1995 1998 2001 2004p
PSE
(%)
OECD EU USA Japan

International ComparisonsPercent of Males and
Females 15 and Older who were Obese in 2005
(BMI>30) Average 1986-01Country Male Female PSE
percent percentUnited States 36.5 41.8 19.7Mexico 24.0 34.3 13.2Australia 23.8 24.9 7.9Canada 23.7 23.2 24.4New Zealand 23.0 31.5 3.6United Kingdom 21.6 24.2 37.3France 7.8 6.6 37.3Korean Republic 4.1 10.1 69.3Japan 1.8 1.5 58.8

International ComparisonsPercent of Males and
Females 15 and Older who were Obese in 2005
(BMI>30) Average 1986-01Country Male Female PSE CSE
percent percentUnited States 36.5 41.8 19.7 -1.1Mexico 24.0 34.3 13.2 -4.1Australia 23.8 24.9 7.9 -5.1Canada 23.7 23.2 24.4 -17.4New Zealand 23.0 31.5 3.6 -6.0United Kingdom 21.6 24.2 37.3 -32.9France 7.8 6.6 37.3 -32.9Korean Republic 4.1 10.1 69.3 -66.0Japan 1.8 1.5 58.8 -53.0

Burgernomics!

Obesity and Average Relative Big Mac Price
y = -16.75x + 35.99
R2 = 0.24
y = -18.48x + 39.16
R2 = 0.22
0.00
5.00
10.00
15.00
20.00
25.00
30.00
35.00
40.00
45.00
0.60 0.80 1.00 1.20 1.40 1.60 1.80
Average Relative Big Mac Price 1986-2006
Perc
ent
of P
opul
atio
n th
at is
Obe
se (B
MI>
30)
Males Females
Linear Trend (Males) Linear Trend (Females)

Agricultural R&D and Obesity

Nominal Prices of U.S. Farm Products, 1949-2004
0
100
200
300
400
500
600
1949 1954 1959 1964 1969 1974 1979 1984 1989 1994 1999 2004
Pric
e In
dex
(194
9=10
0)
.
Year
Fruit and nut crops
Vegetables
Field crops
Nursery & greenhouse
Livestock
Specialty crops
Alston, J.M. and P. G. Pardey, 2008. “Public Funding for Research into Specialty Crops.” HortScience 43(5):1461-1470.

0
20
40
60
80
100
120
140
1949 1954 1959 1964 1969 1974 1979 1984 1989 1994 1999 2004
Pric
e In
dex
(194
9=10
0)
Year
Fruit and nut cropsVegetablesField cropsNur. & greenhouseLivestockSpecialty crops
Real Prices (I-GDP) of U.S. Farm Products, 1949-2004
Alston, J.M. and P. G. Pardey, 2008. “Public Funding for Research into Specialty Crops.” HortScience 43(5):1461-1470.

Commodity Category Percentage Changes between 1949 and 2004 in
Production Nominal Price Real Price
Supply Growth
ε = 1.0 ε = 0.5
Livestock 112 207 -54.1 167.1 139.6
Field Crops 178 90 -71.6 250.4 214.2
Vegetables 162 389 -27.9 189.9 176.0
Fruits and Nuts 183 419 -22.5 205.5 194.3
Greenhouse & Nursery 642 534 -20.2 662.2 652.1
Alston, J.M. and P. G. Pardey, 2008. “Public Funding for Research into Specialty Crops.” HortScience 43(5):1461-1470.
Growth in Production and Prices of Agricultural Commodities, 1949-2004

Are We Doing Too Much Ag. R&D?

R&D Policy Issues (1)
● Multiple Markets, Multiple Distortions
Appropriability problems => underinvestment overall, especially in certain types of R&D
Commodity policies distort decisions affecting natural resource-use, production and consumption
Externalities in the health care distort decisions about consumption, lifestyle, and health outcomes

R&D Policy Issues (2)
● Targets and Instruments
Agricultural R&D is not likely to be an effective instrument of public health policy
● Environmental externalities, health-care externalities, and other distortions
MAY have implications for the total amount and balance of public R&D investments that will maximize national benefits
BUT these effects are probably marginal

Conclusion (1)
● Farm subsidy policies have had small effects on commodity prices much smaller effects on retail prices even smaller effects on consumption
● Thus the effect of U.S. farm commodity subsidy policies
on obesity must be very small – compared with other factors, negligible
farm subsidies may be ineffective, wasteful, and unfair, but eliminating them would not make a dent in America’s obesity problem

Conclusion (2)
● Burgernomics results suggest Policies that affect food commodity prices
appreciably could influence food consumption and obesity in the ways our text book models predict
● Effects are mitigated by factors that mute price transmission from farmers
to consumers generally low elasticities of demand
● Abby Okrent has a useful model for quantifying these effects

Conclusion (3)● Agricultural R&D can have meaningful effects
on relative prices of food commodities but it takes a long time
● Even so, agricultural R&D is not the right instrument for public health policy The primary purpose of agricultural R&D policy is to
correct for underinvestment in some types of R&D The socially optimal total investment and balance of
investments is not likely to depend much on whether we allow for the effects on social costs of obesity
● Implications for R&D policy anyway?

Model of Agricultural R&D and Commodity Prices
PriceSS0
DS
PS0
I0
QS0
NB(externality) ≈ ksPS0QS0-E(QO1-QO0)-cost to taxpayer
Quantity
Specialty Crop Output Other Crop Output
SO0
DO0
SS1
PS1
I1
QS1
ksPS0
QO0 Quantity
DO1
QO1
PO1
PO0
DO1-E
E
Increasing R&D funding for or subsidizing specialty cropsNB(no externality)≈ ksPS0QS0-cost to taxpayer

Model of Agricultural R&D and Commodity Prices
PriceSS0
SS1
DS
PS0
I0
QS0 Quantity
Specialty Crop Output Other Crop Output
SO0
DO0PS1
I1
QS1
ksPS0
QO0 Quantity
DO1
QO1
PO1
PO0
DO1-E
SO1
Reallocating R&D funding from other crops to specialty crops or subsidizing specialty crops with a tax on other crops
E
QO2
NB (externality) ≈ ksPS0QS0-koPO0QO0-E(QO1-QO0)
koPO0