Embed Size (px)
Citation preview
Farmland Values and Rental
Trends
Purdue Land Values Seminar
March 27, 2013
F. Howard Halderman AFM
Halderman Farm Management Service/
Halderman Real Estate Services
March 2013 Purdue Land Value Seminar 2013
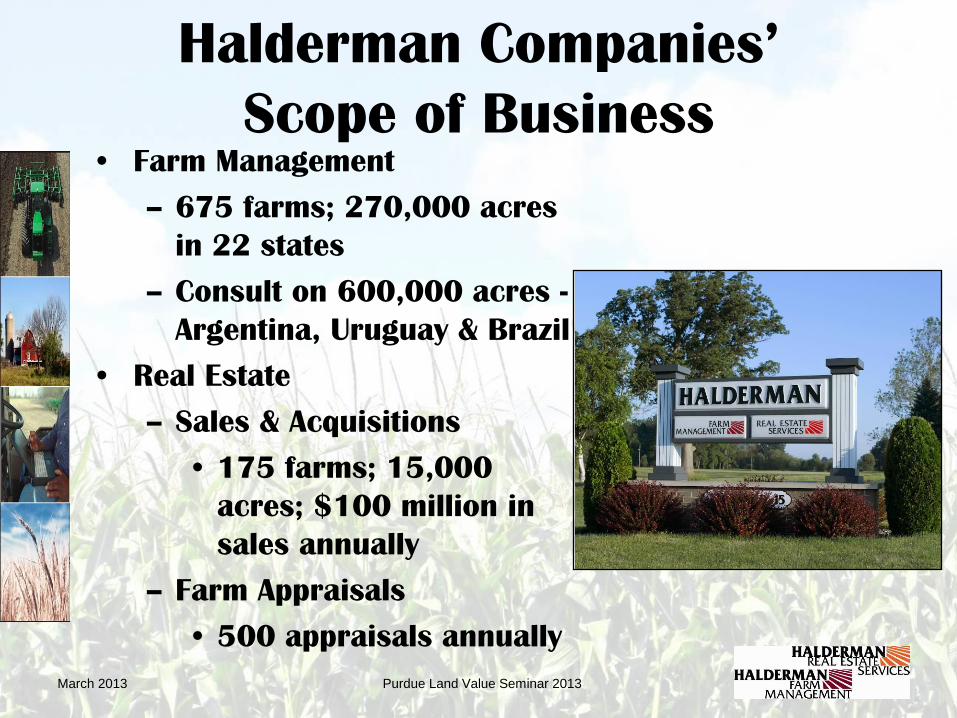
Halderman Companies’
Scope of Business • Farm Management
– 675 farms; 270,000 acres
in 22 states
– Consult on 600,000 acres -
Argentina, Uruguay & Brazil
• Real Estate
– Sales & Acquisitions
• 175 farms; 15,000
acres; $100 million in
sales annually
– Farm Appraisals
• 500 appraisals annually
March 2013 Purdue Land Value Seminar 2013
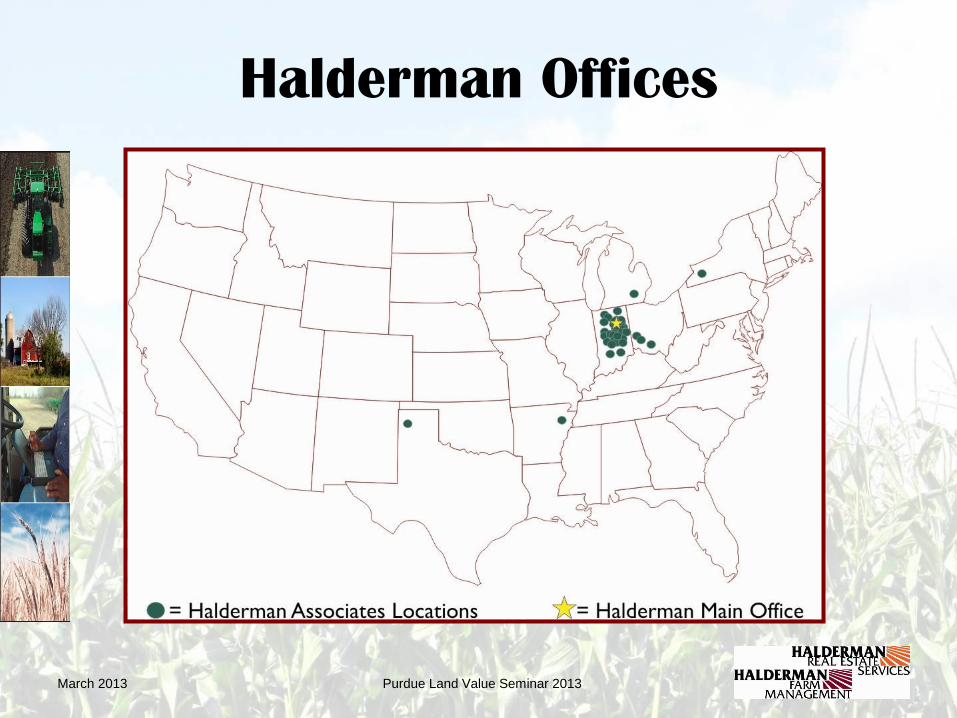
Halderman Offices
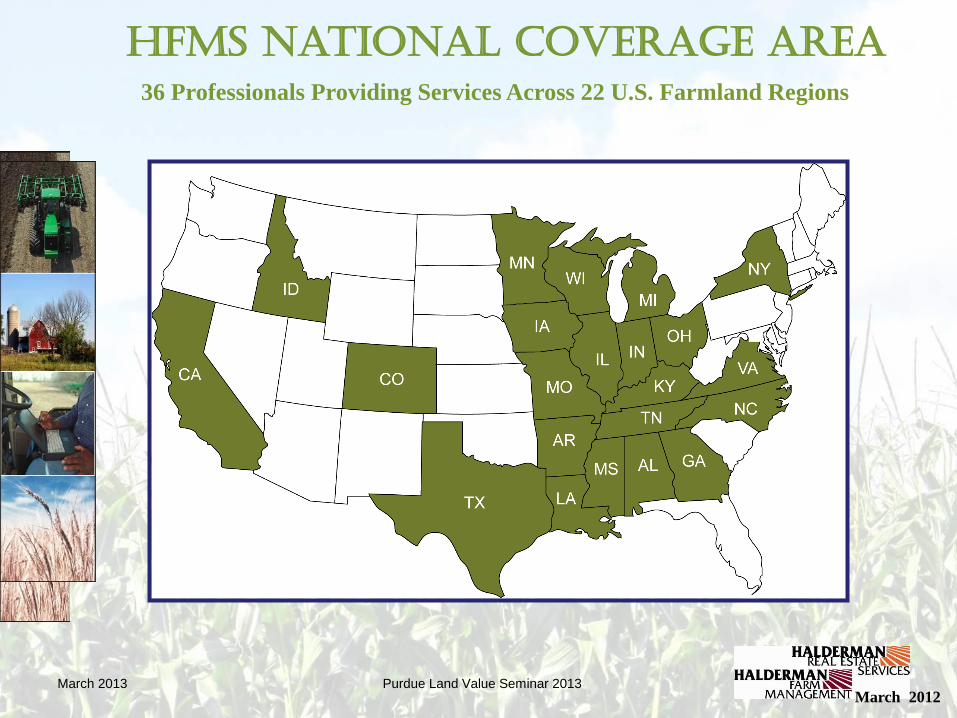
HFMS National Coverage Area
36 Professionals Providing Services Across 22 U.S. Farmland Regions
March 2012 March 2013 Purdue Land Value Seminar 2013
March 2013 Purdue Land Value Seminar 2013
Farm Land Why it might be the best investment in
your portfolio!
Purdue Land Value Seminar 2013
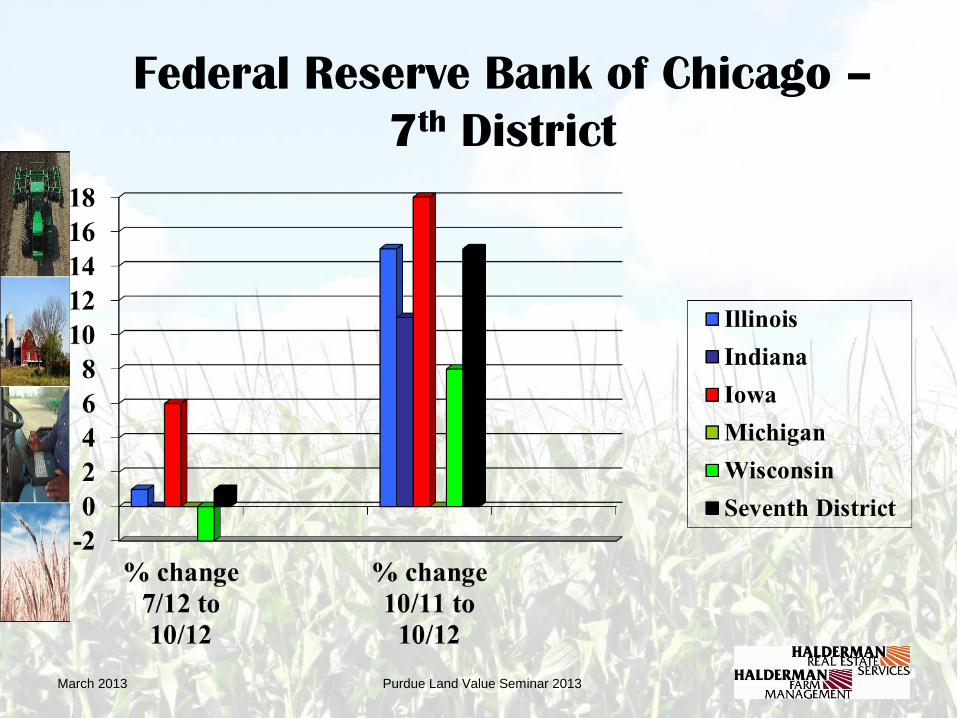
Federal Reserve Bank of Chicago –
7th District
March 2013
Purdue Land Value Seminar 2013
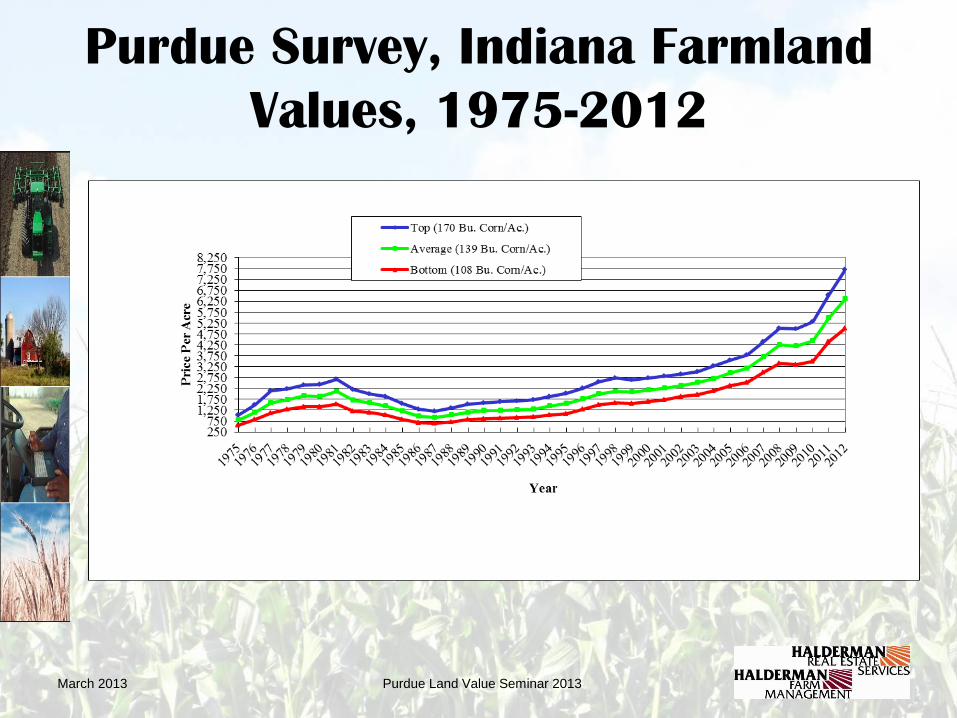
Purdue Survey, Indiana Farmland
Values, 1975-2012
March 2013
March 2013 Purdue Land Value Seminar 2013
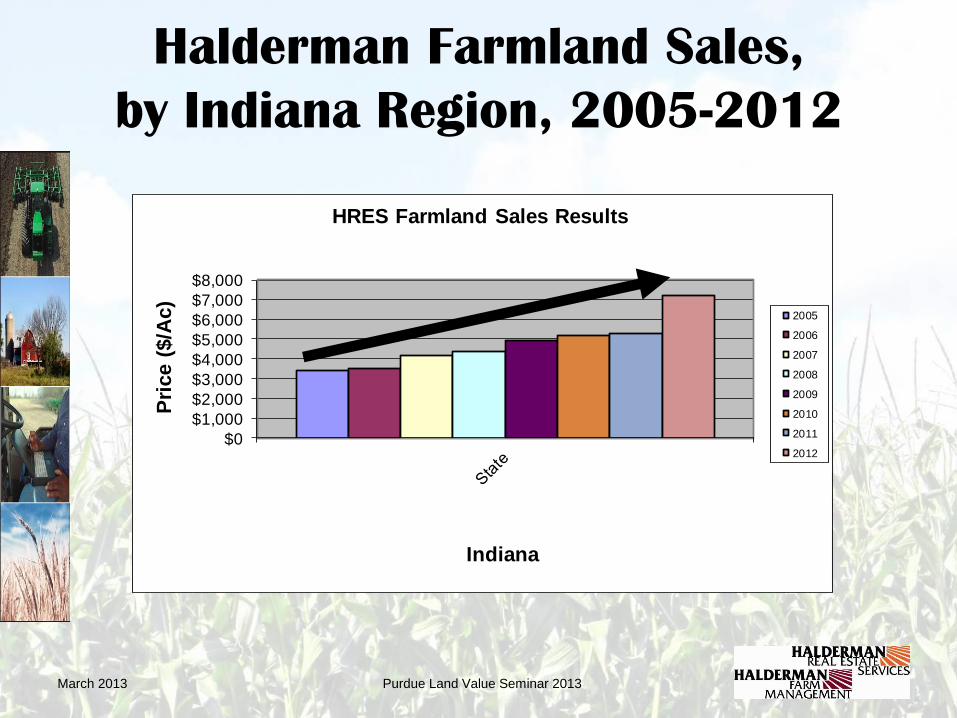
Halderman Farmland Sales,
by Indiana Region, 2005-2012
$0
$1,000
$2,000
$3,000
$4,000
$5,000
$6,000
$7,000
$8,000
Pri
ce (
$/A
c)
Indiana
HRES Farmland Sales Results
2005
2006
2007
2008
2009
2010
2011
2012
Purdue Land Value Seminar 2013
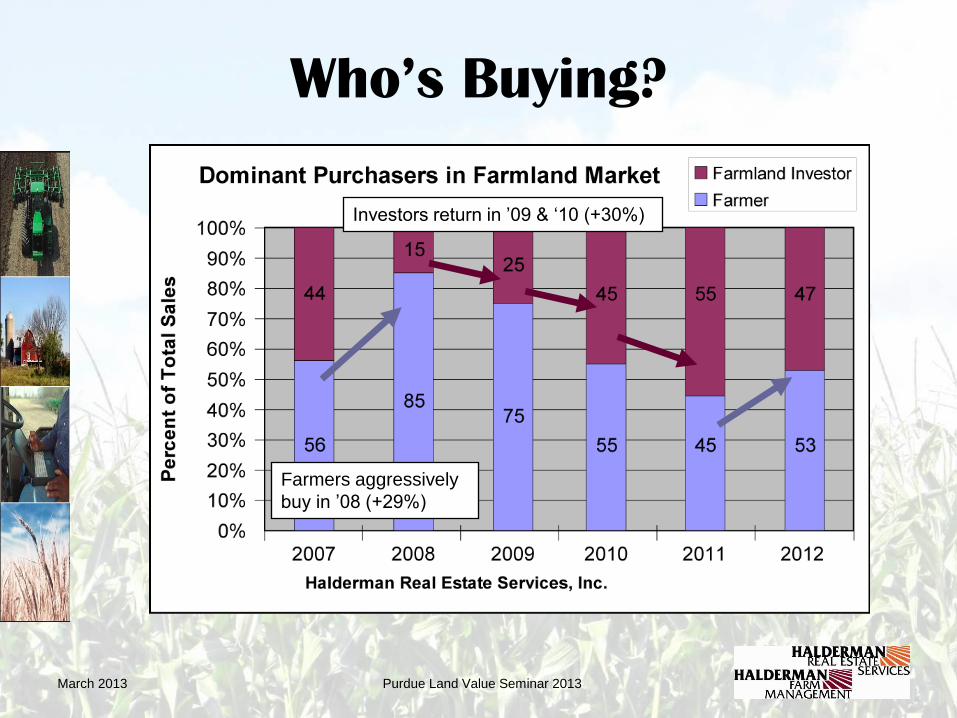
Who’s Buying?
March 2013
Farmers aggressively
buy in ’08 (+29%)
Investors return in ’09 & ‘10 (+30%)
Purdue Land Value Seminar 2013
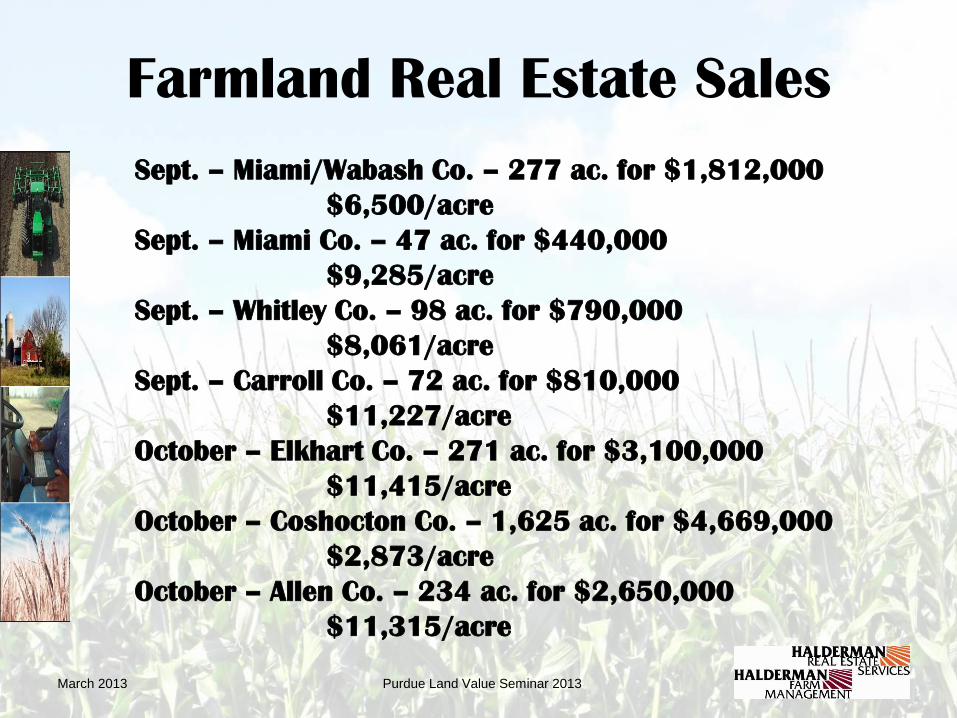
Farmland Real Estate Sales
Sept. – Miami/Wabash Co. – 277 ac. for $1,812,000
$6,500/acre
Sept. – Miami Co. – 47 ac. for $440,000
$9,285/acre
Sept. – Whitley Co. – 98 ac. for $790,000
$8,061/acre
Sept. – Carroll Co. – 72 ac. for $810,000
$11,227/acre
October – Elkhart Co. – 271 ac. for $3,100,000
$11,415/acre
October – Coshocton Co. – 1,625 ac. for $4,669,000
$2,873/acre
October – Allen Co. – 234 ac. for $2,650,000
$11,315/acre
March 2013
Purdue Land Value Seminar 2013
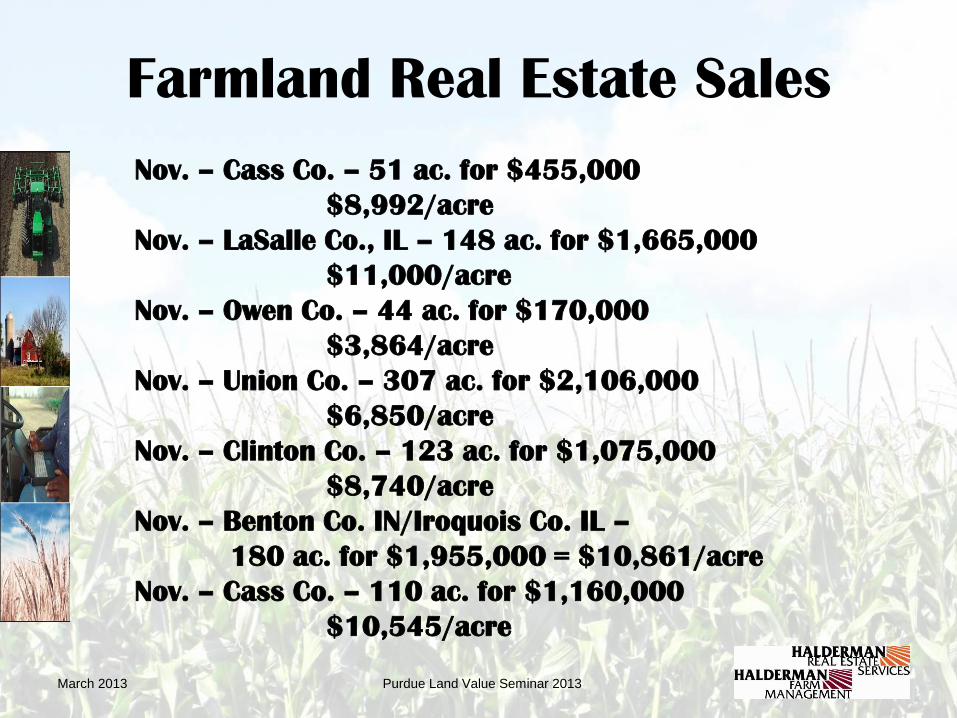
Farmland Real Estate Sales
Nov. – Cass Co. – 51 ac. for $455,000
$8,992/acre
Nov. – LaSalle Co., IL – 148 ac. for $1,665,000
$11,000/acre
Nov. – Owen Co. – 44 ac. for $170,000
$3,864/acre
Nov. – Union Co. – 307 ac. for $2,106,000
$6,850/acre
Nov. – Clinton Co. – 123 ac. for $1,075,000
$8,740/acre
Nov. – Benton Co. IN/Iroquois Co. IL –
180 ac. for $1,955,000 = $10,861/acre
Nov. – Cass Co. – 110 ac. for $1,160,000
$10,545/acre
March 2013
Purdue Land Value Seminar 2013
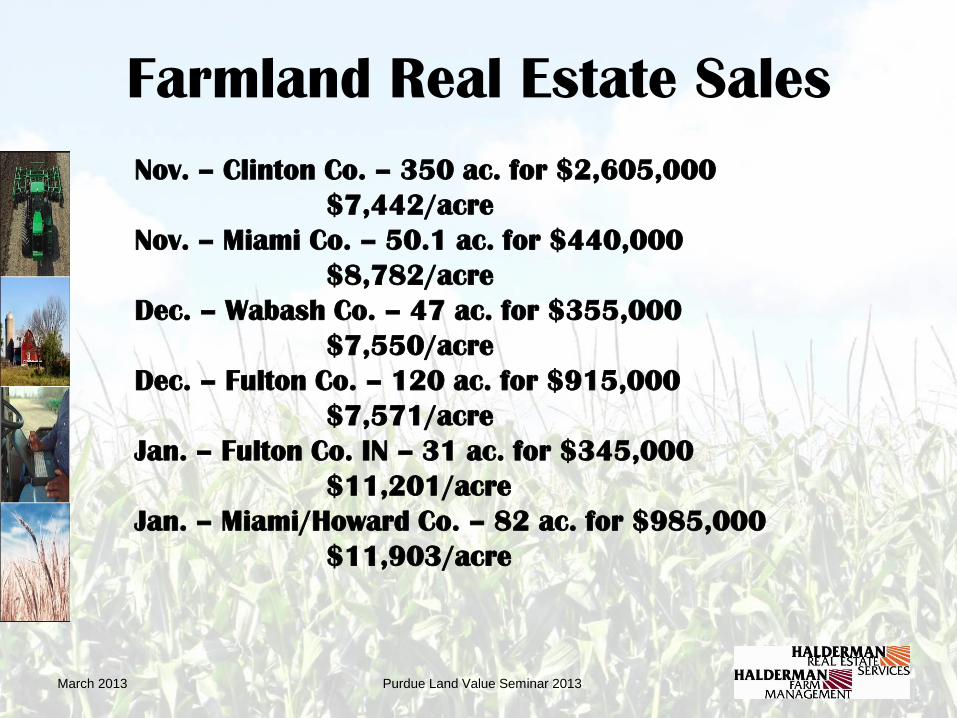
Farmland Real Estate Sales
Nov. – Clinton Co. – 350 ac. for $2,605,000
$7,442/acre
Nov. – Miami Co. – 50.1 ac. for $440,000
$8,782/acre
Dec. – Wabash Co. – 47 ac. for $355,000
$7,550/acre
Dec. – Fulton Co. – 120 ac. for $915,000
$7,571/acre
Jan. – Fulton Co. IN – 31 ac. for $345,000
$11,201/acre
Jan. – Miami/Howard Co. – 82 ac. for $985,000
$11,903/acre
March 2013
Purdue Land Value Seminar 2013
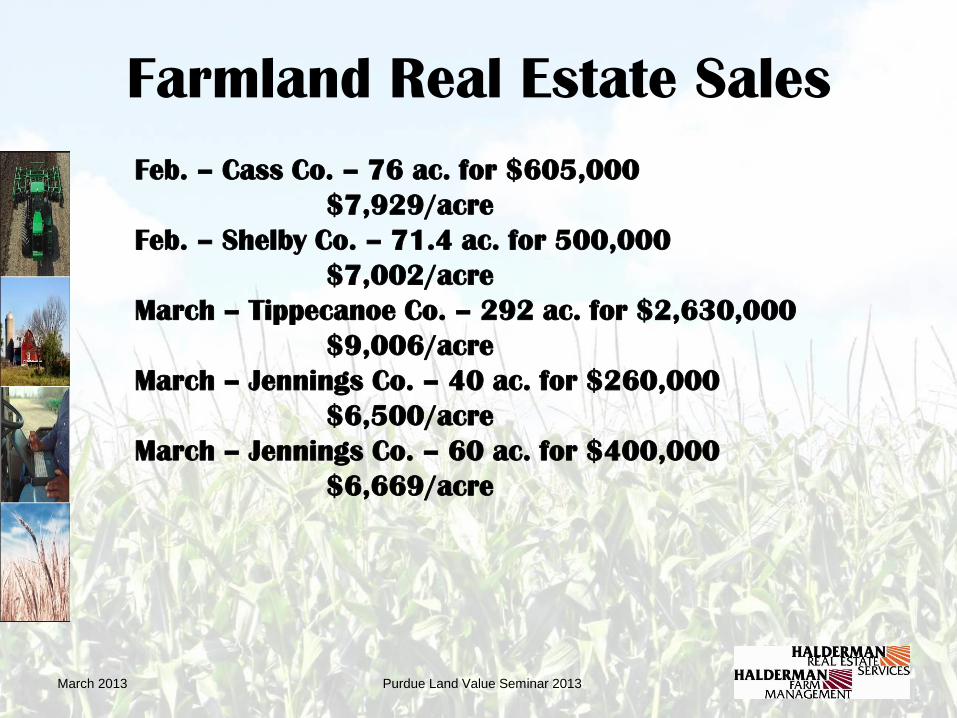
Farmland Real Estate Sales
Feb. – Cass Co. – 76 ac. for $605,000
$7,929/acre
Feb. – Shelby Co. – 71.4 ac. for 500,000
$7,002/acre
March – Tippecanoe Co. – 292 ac. for $2,630,000
$9,006/acre
March – Jennings Co. – 40 ac. for $260,000
$6,500/acre
March – Jennings Co. – 60 ac. for $400,000
$6,669/acre
March 2013
Farmland Investment
Characteristics -
Remain the same!
WHY FARMLAND?
March 2013 Purdue Land Value Seminar 2013
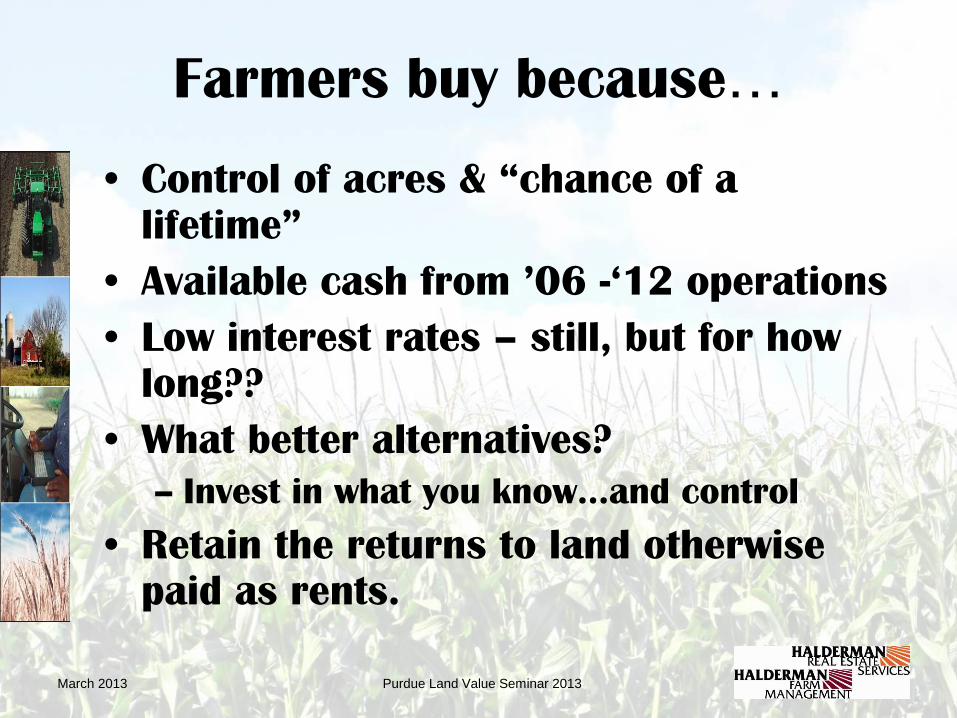
Farmers buy because…
• Control of acres & “chance of a
lifetime”
• Available cash from ’06 -‘12 operations
• Low interest rates – still, but for how
long??
• What better alternatives?
– Invest in what you know…and control
• Retain the returns to land otherwise
paid as rents.
March 2013 Purdue Land Value Seminar 2013
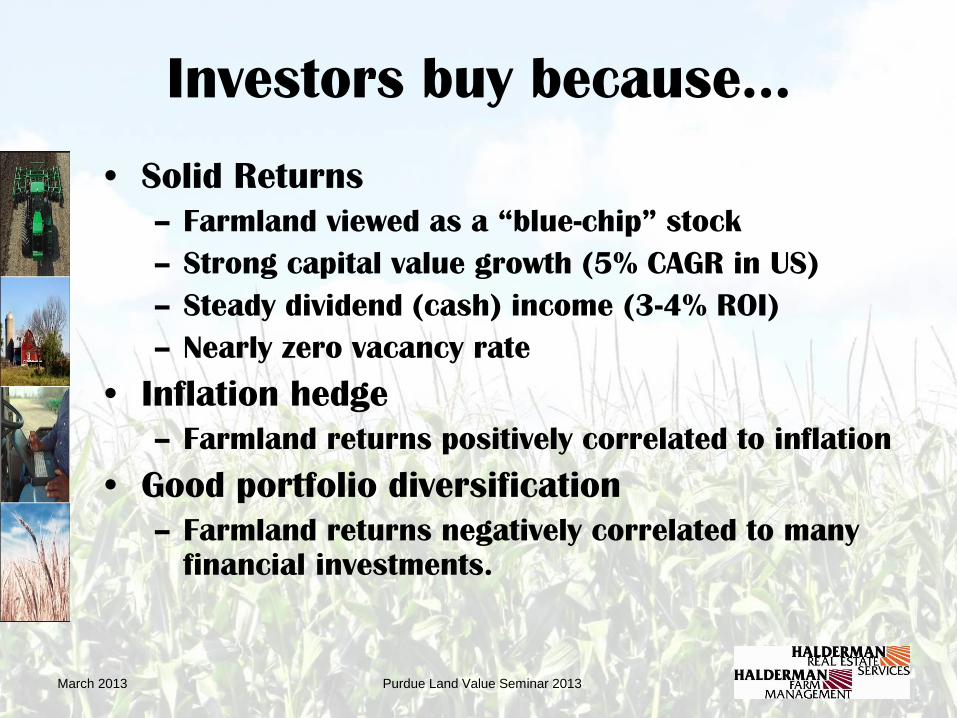
Investors buy because…
• Solid Returns
– Farmland viewed as a “blue-chip” stock
– Strong capital value growth (5% CAGR in US)
– Steady dividend (cash) income (3-4% ROI)
– Nearly zero vacancy rate
• Inflation hedge
– Farmland returns positively correlated to inflation
• Good portfolio diversification
– Farmland returns negatively correlated to many
financial investments.
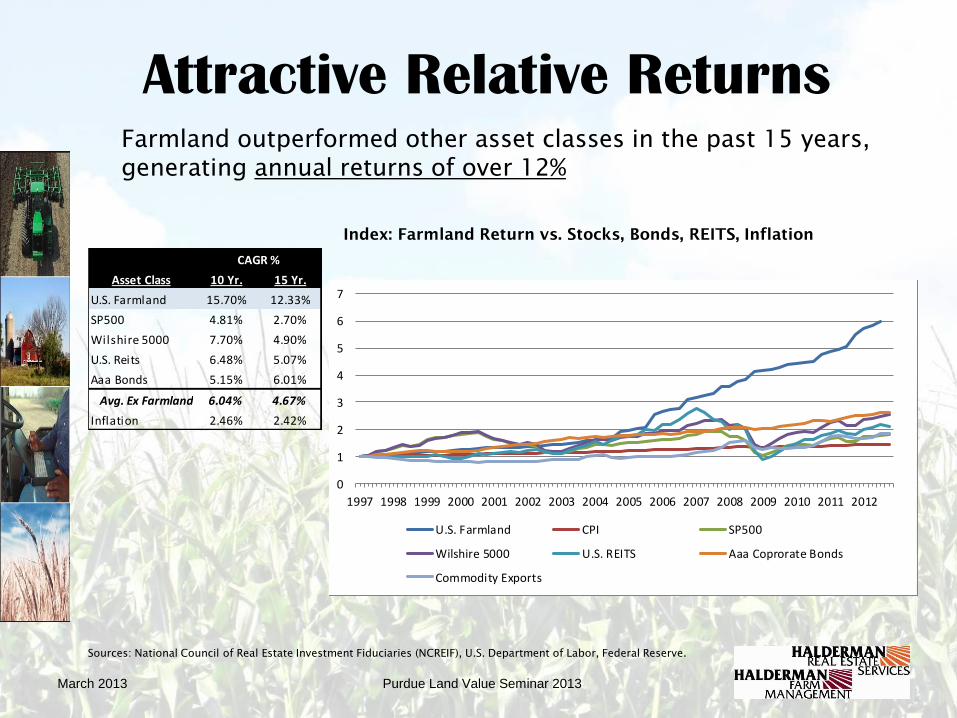
Index: Farmland Return vs. Stocks, Bonds, REITS, Inflation
Sources: National Council of Real Estate Investment Fiduciaries (NCREIF), U.S. Department of Labor, Federal Reserve.
Farmland outperformed other asset classes in the past 15 years,
generating annual returns of over 12%
Attractive Relative Returns
Asset Class 10 Yr. 15 Yr.
U.S. Farmland 15.70% 12.33%
SP500 4.81% 2.70%
Wilshire 5000 7.70% 4.90%
U.S. Reits 6.48% 5.07%
Aaa Bonds 5.15% 6.01%
Avg. Ex Farmland 6.04% 4.67%
Inflation 2.46% 2.42%
CAGR %
0
1
2
3
4
5
6
7
1997 1998 1999 2000 2001 2002 2003 2004 2005 2006 2007 2008 2009 2010 2011 2012
U.S. Farmland CPI SP500
Wilshire 5000 U.S. REITS Aaa Coprorate Bonds
Commodity Exports
March 2013 Purdue Land Value Seminar 2013
March 2013 Purdue Land Value Seminar 2013
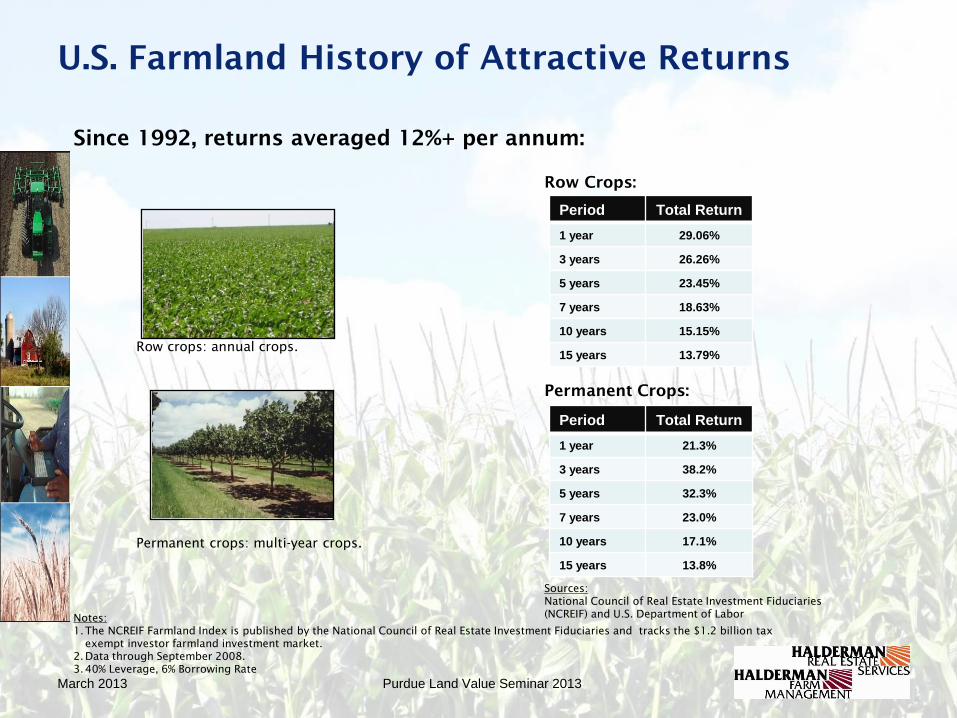
Since 1992, returns averaged 12%+ per annum:
U.S. Farmland History of Attractive Returns
Notes:
1.The NCREIF Farmland Index is published by the National Council of Real Estate Investment Fiduciaries and tracks the $1.2 billion tax
exempt investor farmland investment market.
2.Data through September 2008.
3.40% Leverage, 6% Borrowing Rate
Permanent Crops:
Row Crops:
Row crops: annual crops.
Permanent crops: multi-year crops.
Sources:
National Council of Real Estate Investment Fiduciaries
(NCREIF) and U.S. Department of Labor
Period Total Return
1 year 29.06%
3 years 26.26%
5 years 23.45%
7 years 18.63%
10 years 15.15%
15 years 13.79%
Period Total Return
1 year 21.3%
3 years 38.2%
5 years 32.3%
7 years 23.0%
10 years 17.1%
15 years 13.8%
March 2013 Purdue Land Value Seminar 2013
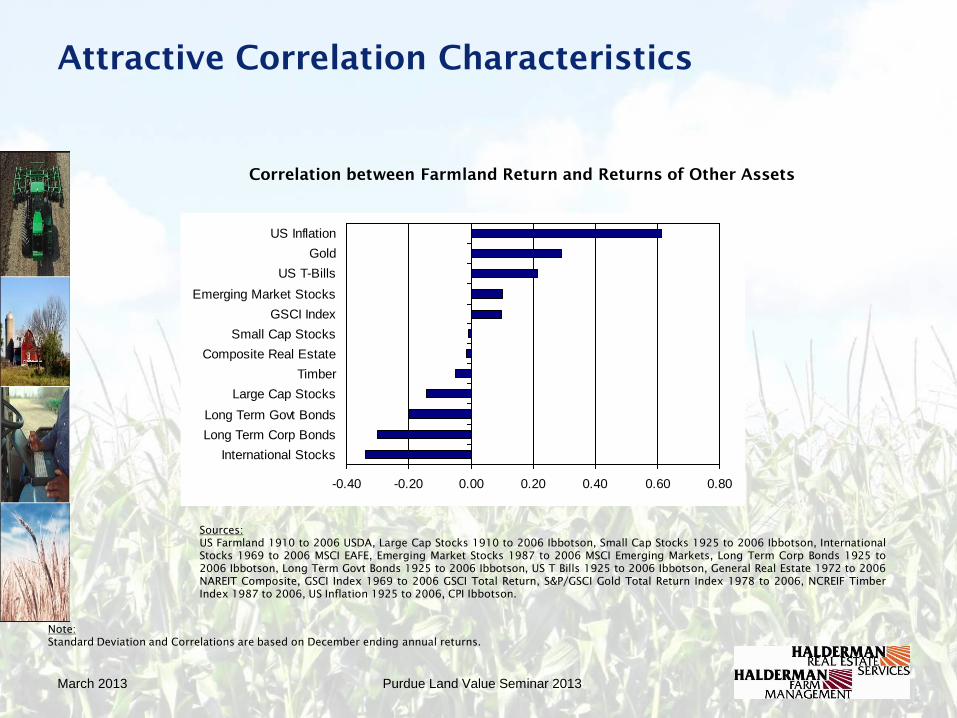
Sources:
US Farmland 1910 to 2006 USDA, Large Cap Stocks 1910 to 2006 Ibbotson, Small Cap Stocks 1925 to 2006 Ibbotson, International
Stocks 1969 to 2006 MSCI EAFE, Emerging Market Stocks 1987 to 2006 MSCI Emerging Markets, Long Term Corp Bonds 1925 to
2006 Ibbotson, Long Term Govt Bonds 1925 to 2006 Ibbotson, US T Bills 1925 to 2006 Ibbotson, General Real Estate 1972 to 2006
NAREIT Composite, GSCI Index 1969 to 2006 GSCI Total Return, S&P/GSCI Gold Total Return Index 1978 to 2006, NCREIF Timber
Index 1987 to 2006, US Inflation 1925 to 2006, CPI Ibbotson.
Attractive Correlation Characteristics
Correlation between Farmland Return and Returns of Other Assets
Note:
Standard Deviation and Correlations are based on December ending annual returns.
-0.40 -0.20 0.00 0.20 0.40 0.60 0.80
International Stocks
Long Term Corp Bonds
Long Term Govt Bonds
Large Cap Stocks
Timber
Composite Real Estate
Small Cap Stocks
GSCI Index
Emerging Market Stocks
US T-Bills
Gold
US Inflation
March 2013 Purdue Land Value Seminar 2013
Farm Land Where do values go from here?
March 2013 Purdue Land Value Seminar 2013
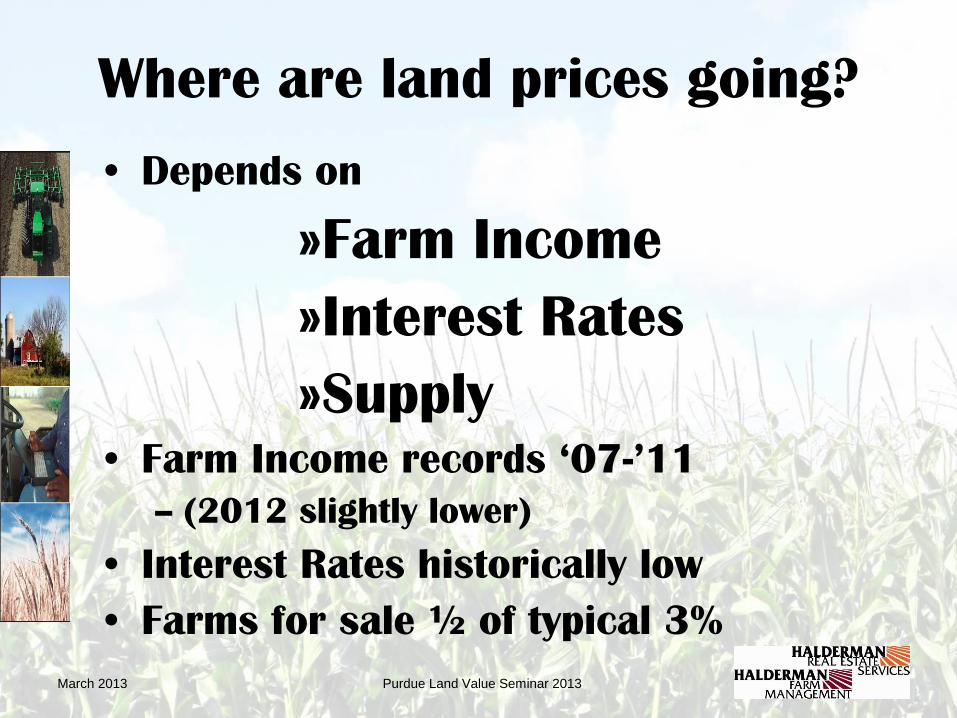
Where are land prices going?
• Depends on
»Farm Income
»Interest Rates
»Supply • Farm Income records ‘07-’11
– (2012 slightly lower)
• Interest Rates historically low
• Farms for sale ½ of typical 3%
March 2013 Purdue Land Value Seminar 2013
Farm Land Leases Farmland is worth what it earns!
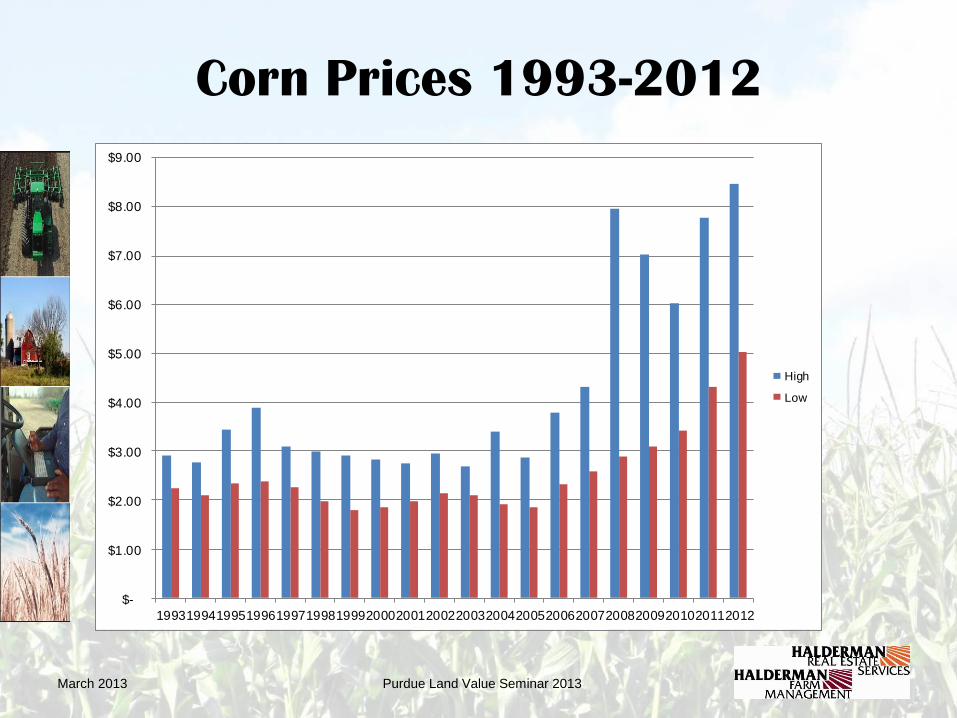
Corn Prices 1993-2012
March 2013 Purdue Land Value Seminar 2013
$-
$1.00
$2.00
$3.00
$4.00
$5.00
$6.00
$7.00
$8.00
$9.00
19931994199519961997199819992000200120022003200420052006200720082009201020112012
High
Low
Purdue Land Value Seminar 2013
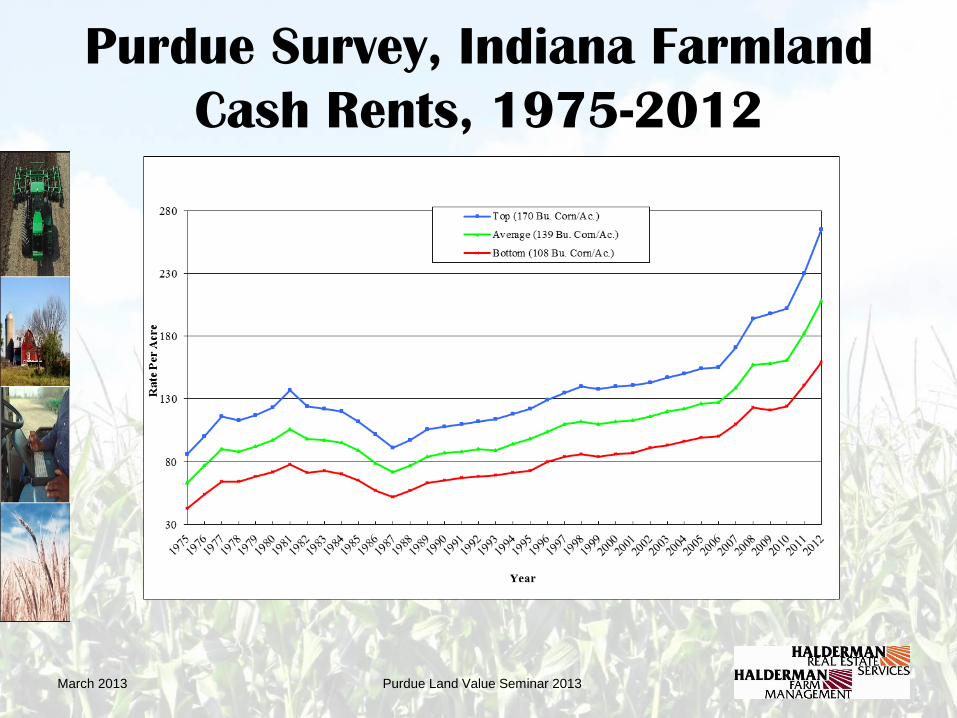
Purdue Survey, Indiana Farmland
Cash Rents, 1975-2012
March 2013
March 2013 Purdue Land Value Seminar 2013
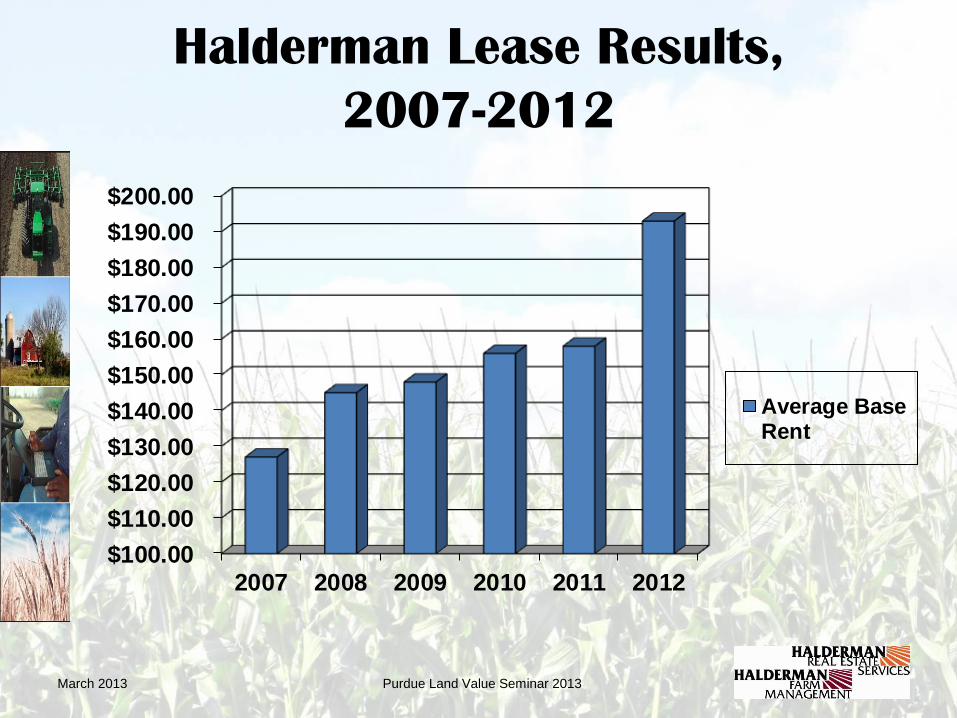
Halderman Lease Results,
2007-2012
$100.00
$110.00
$120.00
$130.00
$140.00
$150.00
$160.00
$170.00
$180.00
$190.00
$200.00
2007 2008 2009 2010 2011 2012
Average BaseRent
Purdue Land Value Seminar 2013
Farmland Real Estate in 2013:
A Bubble?
• Land Value Bulls Say . . .
– Low amount of debt in agriculture
• ¾’s D/A <50% and 75% fixed
– Low interest rates (QE 3?)
- World population growth
- Bio Fuels – demand remains
- Potential for Inflation
- Water resources & competition
- Low supply of farms for sale
March 2013
Purdue Land Value Seminar 2013
What Could Make this A Bubble?
(Winter 2013)
• Land Value Bears say . . . What if?
– Value of dollar strengthening continues =
lower exports = lower commodity prices
– Worldwide recession deepens = deflation
and therefore lower demand (Chinese GDP
below 7% & EU concerns)
– Change in biofuels mandates in primary
row crops
– Demand destruction from high prices
March 2013
Purdue Land Value Seminar 2013
What Could Make this A Bubble?
(Winter 2013)
• Interest rates increase due to hyper -
inflation
• Residential Bubble Similarities Develop
– Speculative purchases of land for capital
appreciation gains
– Purchases with significant debt financing
on the belief that land value increases will
cover collateral needs
• Other asset classes’ returns improve!
March 2013
Purdue Land Value Seminar 2013
What Could Make this A Bubble?
(Winter 2013)
• What if??
– Commodity prices erode due to demand
destruction from high prices
– Worldwide Recession occurs (again!)
– Farm incomes decline
– Capital gains tax increases happen
• (As of 1/1/13 cap gains did increase to 20%
for some and the 3.8% for Health Care Reform)
March 2013
March 2013 Purdue Land Value Seminar 2013
Your Questions?
F. Howard Halderman
President
Halderman Farm Management Service Inc.
Halderman Real Estate Services Inc.
PO Box 297
Wabash, IN 46992
Ofc: 800-424-2324
Fax: 260-563-8889
[email protected] or www.halderman.com