Embed Size (px)
Citation preview
Chapter 8
Fate of Agrochemicals during Processing of Grapes to Raisins
Chapter -8
Fate of Selected Agrochemicals
during Processing of Grapes to
Raisin
Chapter 8
224
ABSTRACT
The grapes (Thompson, Sonaka, Manik Chamman, Tas-A-Ganesh, sharad
Seedles etc) were processed into raisin using 3% Potassium carbonate and 1%
dipping oil. Under these conditions the treated grapes were selected for the
degradation study of few selected chemicals during processing to raisin. In this
study, most of the chemicals have DT50 less than 3days with the correlation
coefficient (r2) value varied from 0.96 to 0.99. Fipronil showed fipronil sulfone as a
degradation product during the processing.So both the chemicals included for the
residue definition.
8.1 INTRODUCTION
The world production of grapes is presently 65,486,235 MTs and India
accounts for 1.2 million Mt of grapes, which makes a share of 1.83 percent of the
world production and 3 percent of the total fruit production in the country. Area
under this fruit has been increased by 50% and its production by 71% in the country
in the last decade (1994-2004) due to the economic importance of this fruit. Its
economic significance is due to good back up of grape industry in terms of backward
and forward linkage that offers employment to large number of skilled and unskilled
people on the farm, trade and service. India has achieved the highest productivity of
20 t/ha in the production of table grapes. Presently in India about 78 percent of grape
is used for table purpose, nearly 17-20 percent is dried for raisin production, while
1.5 percent is used for juice and only 0.5 percent is used in manufacturing wine.
Though this fruit is processed to the largest extent relative to other fruits in the
country the processing of this fruit in our country is very less as compared to the
traditional grape growing countries in the world where more than 80 percent of the
produce is processed in the form of wine, raisin and juice. The various processed
products that could be prepared from grape are raisin, wine, juice, squash, syrup,
jam, jelly, vinegar, pickles, chocolates, tartaric acid, oil, cattle feed, tannin.
However, the processed products viz. wine, raisins and grape juice from the grape
are the most popular products all over the world.
Presently the fresh grape industry in the country is facing problems in
marketing of the produce in both domestic and international market and in such
situation the maximum benefits from grape cultivation can be derived by
Chapter 8
225
establishing the processing industries for production of value added products like
good quality wine, raisin and juice which has market potential for domestic as well
as international market.
Raisin is prepared from the sound dried grapes of the varieties conforming to
the characteristics of Vitis vinifera L. processed in an appropriate manner into a form
of marketable raisin with or without coating with suitable optional ingredients [1].
Economic analysis indicates a continuous increase in production and development of
raisin trade in international market. USA is the largest producer of raisin in the
world, followed by Turkey. These two countries together contribute to around 80%
of the global production. Worldwide, the major exporting countries are Turkey, Iran,
Chile, UAE, Greece, USA, South Africa, Belgium and Argentina. While the
importing ones are UK, Germany, Russia, Netherlands, Canada, Japan and France.
In India, raisin is mostly produced in Sangli, Solapur and Nasik districts of
Maharashtra and Bijapur district in Karnataka. Out of the total production of 1.3
million tons of table grapes, around 15-17% of the fresh produce is dried to raisins.
In 2003, the raisin production reached to 65,000 tons, which stands 3rd in the world
after USA and Turkey. In spite of such a huge production, India has not yet
attempted to export raisins.
Raisin is mostly produced from the varieties viz. Thompson Seedless and its
clones like Manik Chaman. Besides, E 12/7, E 12/3, Mint Seedless and KR White
are also proved to be promising varieties. The technique of raisin production in
India is mostly based on the dipping of the berries in Australian dip emulsion, which
contains 2.4% potassium carbonate and 1.5% ethyl oleate and subsequent drying in
shade in open tier system. The place, Junoni, in Sangola taluka of Solapur district in
Maharashtra has been selected for the establishment and promotion of grape drying
units on large scale based on its appropriate geological and weather data and proved
the place most suitable in terms of latitude, longitude, rainfall, temperature,
humidity, air velocity, etc. for drying the grape in natural way. “Junoni” a barren
land is presently leading the raisin activities in the country and has now turned into
industrial urban town.
Chapter 8
226
a. Characters of Good Raisin
Good and uniform appearance of produce in terms of its color (perfectly green
or grey-green), size (round) and smooth texture. More pulp content and a pleasing
taste free from injuries so that no sugar coat outside and intactness of skin and its
outer layers.
b. Global Raisin Production
USA, Turkey and South Africa are the largest raisin producers at the global
level besides Greece, Australia, Iran, Afghanistan, China, Russia and others. India
has achieved the raisin production level i.e. in the range of 55,000 to 65,000 tonnes
next to Turkey at world level although there is no price stability for raisin production
in last two years due to saturation of production. Efforts on improvement in quality
of the Indian raisins vis-à-vis the imported of product is yet to be initiated for the
export market by the Indian industry.
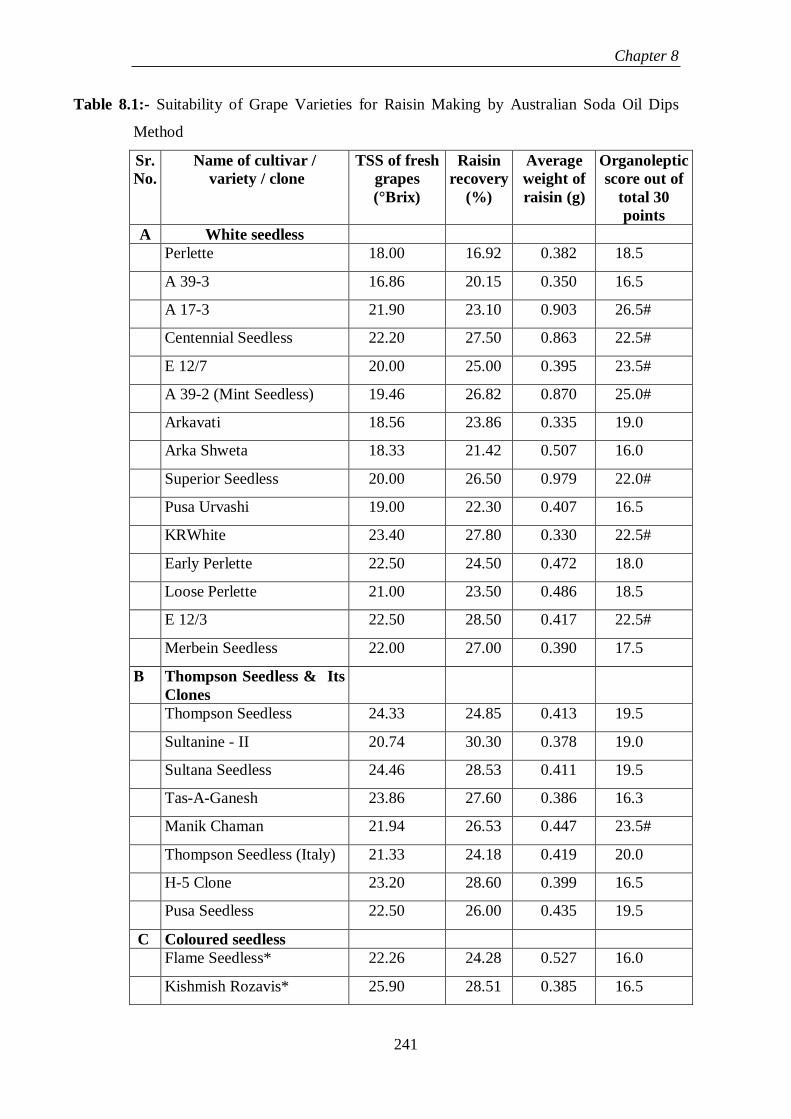
c. Grape Varieties for Raisin Making
Major production of raisin (90 per cent) in the world is from Thompson
seedless. Besides the other varieties viz. Muscat of Alexandria, Waltham Cross and
other white and colored seeded varieties are also used for raisin production. In India,
Thompson Seedless and its mutants viz. Sonaka, Tas-A-Ganesh. Manik Chaman are
mainly used for raisin production although Arkavati variety developed at IIHR,
Bangalore found to be the best due to its high yield for this product. NRC for
Grapes, Pune have also come out with other varieties viz. A 17-3, E 12/3, Mint
Seedless, Superior Seedless, KR White, Manik Chaman, A18-3 (Coloured seedless)
and Cardinal (for manukka) for the production of raisin but industry has yet to accept
on commercial footing. Data on these varieties after due evaluation at NRC for
Grapes, Pune is presented in Table 8.1. [2] The studies also indicated that we could
further diversify the raisins based on colour and flavour characteristics; while
manukkas (seeded dry grapes) from cvs. Cardinal and Spin Sahebi were also
acceptable.
Chapter 8
227
d. Cultural Practices Used for Good Raisin Production
Excellent canopy and health of the leaves contributes a lot for the good and
quality production of grape and so also its resultant dried product. After October
pruning, about 32oC dry heat units have been recommended for achieving the
production of 10 to 12 tonnes of grape per acre with 23° brix in grape, For 1 kg berry
production, an area more than 10 cm2 has been recommended. An area of 13 to 19
cm2 is followed in USA and South Africa. Treatments of GA application and
girdling are hardly followed for grape production meant for raisin in these countries.
Adequate canopy to cover and protect the bunches from sunlight is another factor for
keeping green color in grapes for raisin production. Higher doses of nitrogen reduce
the pulp, firmness in berries and therefore monitoring of nitrogen in annual cycle
once in soil and twice in grape leaf petiole is must for quality raisin production.
Further, application of phosphoric acid, calcium chloride and magnesium sulphate in
the form of spray on set berries is an important operation in view of obtaining good
color and texture in the berry skin.
Appropriate quantity of water and its stage of application once fruits are set on
the vine is also an important operation. In view of this, water level of 10-35° cm bar
up to veraison and 10 to 45-50° cm bar quantity after veraison is desirable for quality
raisin production. If the water is given in more quantity before harvest, the raisins
become sticky during storage. Finally a stage of harvesting berry for raisin
production determines the raisin yield and quality. Average maturity of berry in the
whole vineyard at harvesting time has to be more than 22°Brix for good color and
good yield.
e. Technology for Raisin Production
Grape berry has juice/pulp containing sugar, acids, flavonoids, vitamin and
minerals and outer protective skin with different layers. Drying process has to be
selective to remove the water from berry without affecting outer skin structure and
arrangement of wax plates. The quality of waxy layers in terms of wax plates is
about 0.1 mg/cm2. This layer only protects the berries from getting dried in fresh
form. During storage of berries at ambient and low temperature, the water moves out
from the stalk and rachis and not from the skin coated with white waxy layer and this
result in drying of pedicels in first instant and then berry drop.
Chapter 8
228
Waxy layer on the green berry skin is the main target of various pretreatment
of grape berries for quickening the drying process. Many treatments have been
worked out in different countries after various research trials and an appropriate and
economic treatment have been listed below for drying of grapes.
A water solution containing 2.5 kg of potassium carbonate and 1.5 L of ethyl
oleate in every 100 L for dipping berries has been suggested. A dipping time of 3
minutes duration has been recommended to increase water removal @ of 1.4 mg/cm2
in comparison to 0.4 mg/cm2 in control. However, the cumulative quantity of waxes
has been reduced only by 13 per cent in treated berries and therefore the drying
effects is due to loosening of waxy plates on the outer skin and not removing the
wax on the skin. This has been further proved based on the microscopic studies on
skin structure with such treatments and without treatment in Australia.
When drying occurs fast, the sugar concentration increases in berry in short
possible time and therefore the enzymatic reactions of peroxidase and polyphenolase
also gets reduced and thereby leading less browning of the product. This process also
helps in suppressing the microbial and fungal growth during drying process. A
temperature of 25°C and above in dipping emulsion has been recommended for good
results. A berry picks up approximately 35 µ mol solution and looses 70 percent
during draining and utilizes only about 10-12 µ mol. A pH of such solution has been
suggested always in the range of 9.5 to 11.00. A pH more than 11.00 breaks the skin
and less than 9.5 favours microbial growth and fermentation. This treatment is more
effective when berries have attained the maturity of 20° brix and above and in other
cases there is less pick up of dipping solution and therefore no effect.
In case of higher levels of dipping oil (pickup by skin 7200 ppm); there will be
sucking of moisture in berries from outside this results in unpleasant taste in the
product. Water removal from berries takes place in three stages in treated berries. In
first stage, the moisture removal is highest reducing initial weight to 40 to 50 per
cent. When there is drying of 50 per cent, surface free area of berry is reduced by 28
per cent and as a result the water removal process is slowed down subsequently.
In second and third stage, the water is removed from pulp to skin and then
removed by evaporation. This process continues till berry is dried to the extent of 13
Chapter 8
229
per cent moisture. Drying sheds based on covered iron rack system are fabricated
where the numbers of shelves are kept from six to eleven with interspaces varying
from 22.9 cm to 45 cm. The rows of racks are generally spaced apart from a distance
of 60 to 150 cm. The length of the rack could be from 600 to 1800 cm having South-
North orientation and flow of dry air from West to East. This is a modified drying
system of Australia, The shelves of iron rack are netted with nylon mesh and density
of fresh grapes on this mat for drying is maintained from 1.7 to 2.2 g/cm2 depending
upon the height of shelf from 22.9 cm to 45 cm. This Australian method of dipping
and rack system for drying has reduced the drying period to 10-12 days when
compared to 20-22 days in conventional method. On the contrary, in USA, the
grapes are dried without any treatment by spreading on graft paper placed between
grapevine rows in vineyard. While in South Africa this is done on concrete slab. In
both the cases the drying is in open sunshine and not in shed as followed in
Australia. In Afghanistan, the drying is done in closed rooms by hanging the bunches
to the ropes and it takes about 40 to 45 days for drying. If grapes are grown without
following training and pruning and yield is just 1.5 to 2 tons/acre with T.S.S from 28
to 32, when no fertilizers are used.
Separation of dried grapes from its stalks and rachis in bunches is done using
machines designed and fabricated for this purpose locally. However this was being
done manually in the past, while the operation of sorting and grading of dried berries
continued with the manual if appropriate machine is not available.
f. Packing and Storage
Final packing of produce is done in 400 gauge LDPE film bags and stored in
corrugated boxes of 5 to 15 kg capacity at low temperature (4°C) to preserve the
original raisin color and attack of larvae.
g. Quality Compliance
The potential of raisin industry in terms of the marketing of this product in
domestic and international market for import substitution and better utilization of the
grapes. Besides, there is possibility of diversification of raisin industry by promoting
the production of flavored and colored raisins. The Indian raisins produced in India
comply with quality in terms of physical, chemical and microbiological counts
Chapter 8
230
specified under the Codex standard except the number of cap stem and stem pieces
in unit quantity. The details are given in Tables 8.2 and 8.3. The cleaning of Indian
raisins after drying the grapes is not efficient to comply with the Codex standard and
therefore, improvement has to be made in respect of cleaning of raisins preferably by
adopting mechanical means. Further, moisture levels are low and thereby their
texture and mouth feel is hard and therefore, this needs to be increased to 15 - 16.5%
to have better mouth feel and soft texture. To have Indian raisin product of
international quality standard, the cleaning has to be done by mechanical means and
the drying has to be completed at moisture level of 15 - 16.5%. The packaging and
labeling has also to be improved to comply our product with the international quality
standard.
The fate of the residues of benalaxyl, dimethoate, iprodione, metalaxyl,
phosalone, procymidone, and vinclozolin in sunlight and oven raisin processing was
studied. The drying process caused a fruit concentration factor of 4, while the
decreases in residue with the two drying processes were different for the different
pesticides. In sunlight-drying the residue level in the raisins was identical to that in
the fresh fruits for benalaxyl, metalaxyl, and phosalone, whereas it was higher for
iprodione (1.6) and lower for vinclozolin and dimethoate (one-third and one-fifth,
respectively). The ovendrying process was preceded by washing, which caused
residue decreases for iprodione and procymidone of 57 and 41%, respectively,
whereas no decrease was observed in all of the other pesticides. During oven-drying
pesticide residues in raisins with respect to fresh fruits showed an increase of 2.7 for
phosalone, the same values for benalaxyl, metalaxyl, and procymidone, and lower
values for vinclozolin and dimethoate. Sunlight-drying was more effective for
phosalone and vinclozolin, whereas oven-drying was more effective for iprodione
and procymidone, which was due to the washing effect rather than to dehydration.
The experiments carried out with a model system showed that the decrease in
dimethoate is attributable to heat, whereas in benalaxyl, procymidone, and phosalone
it is due to codistillation and in iprodione and metalaxyl to the combined action of
heat and codistillation[3].
Quinoxyfen is a new fungicide that belongs to the family of the quinolines,
recently introduced to control powdery mildew (Uncinula necator). The fate of
Chapter 8
231
quinoxyfen residues from vine to wine and in their processing products was studied.
After the last of four applications at the recommended rate, 0.38 mg/kg of residue
was found on the grapes, which is under the legal limit fixed in Italy (0.5 mg/ kg).
The degradation rate was according to a pseudo-first-order kinetics (r2) 0.964 and the
half-life was 7.24 days [4]. Prolonged and repeated uses of these fungicides caused
resistance, thus reducing their efficacy. It was thus necessary to provide new
molecules that acted with different mechanisms. Two methods are used for the
production of raisins: exposure to sunlight and oven drying. The drying process
determined a concentration of the fruit of a factor 4. Therefore, the pesticide residues
on grapes at harvest could theoretically increase by the same factor, if no loss
occurred during the drying process. The residue levels of benalaxyl, phosalone,
metalaxyl, and procymidone in sun-dried grapes were the same as those on the fresh
grapes, whereas those of iprodione were higher (1.6 times) and those for vinclozolin
and dimethoate lower (one-third and one-fifth, respectively). In the oven-drying
process, benalaxyl, metalaxyl, and vinclozolin showed the same residue value in
both fresh and dried fruits, whereas iprodione and procymidone resides were lower
in raisins than in fresh fruits. This was due to the washing procedure that was carried
out on the grape before they were placed in the oven. Dimethoate showed a decrease
similar to that obtained by sunlight. Phosalone underwent a smaller degradation in
the oven than when dried in the sun, perhaps because it is more sensitive to the solar
radiation[4].
Azoxystrobin, a fungicide of the strobilurin group, has an European Union
maximum residue level (MRL) of 2 mg kg-1 for grapes. This work aimed to assess
residues on fresh and washed grapes and on raisins following processing with (i)
alkali treatment and sun drying and (ii) sun drying only. QUADRIS 25% SC was
applied according to good agricultural practice for two consecutive years on a typical
cv. Thomson seedless and a seed-producing clone. Samples were collected 0, 15, and
21 days post application and analyzed using gas chromatography/electron capture
detection; recoveries were 86 ( 12% for grapes and 99 ( 15% for raisins. Residues on
grapes were 0.49-1.84 mg/kg, and washing removed 75% of the residue. Residues in
raisins produced from seedless grapes were 0.51-1.49 (treatment 1) and 1.42-2.08
mg/kg (treatment 2), with residue transfer factors sometimes >1, even following
alkali treatment, which reduced residues considerably [5].
Chapter 8
232
8.2 MATERIALS AND METHODS
8.2.1 Degradation Experiment in Raisin Making
Fipronil was applied to grapes as per spray schedule and harvested after 30
days after spray. Also few selected chemicals (Table 8.4 a) were applied to grapes
in field conditions and brought into laboratory next day for raisin making. The
berries were washed with water to remove the dust particles and contaminants. Then
1% dipping oil (Priyal, Omega fine chemicals, Mumbai) and 3% potassium
carbonate (Merck India ltd. Mumbai.) in 1000 mL water was prepared and properly
stirred for mixing. The intact bunches were dipped in this solution for one minute
and kept on tray for drying under raisin dryer Figure. The dryer tmperature was kept
at 35oC±2 for day time (12 hrs only). The sampling was started after 1 hour i.e. 0, 1,
3, 5 and 10 day and the samples were kept in deep freeze (-20oC) till analysis. Raisin
weight loss was also measured every day.
8.2.2 Sample Preparation and Analysis
A sample (10 g) was extracted with 10 mL ethyl acetate (0.1% formic acid) by
addition of 10 g sodium sulphate anhydrous. The mixture was homogenized and
centrifuged for 5 min. at 3000 rpm. The supernatant was cleaned with PSA and GCB
and evaporated under N2 gas and finally reconstituted in methanol and water with
0.1% acetic acid. A 10 µL sample was injected into LC-MS/MS. The LC-MS/MS
conditions are given in chapter 4.
Survey- Raisin samples (20 numbers) were collected from various raisin yards in
Solapur and Sangli district of Maharashtra and Bijapur of Karnataka by following
the standard sampling technique [6] recommended by the Bureau of Indian Standards.
At first the lots containing raisins from the same vineyard were selected.
Sampling was done separately for each individual variety of grapes. Each lot was
divided into 10 primary sampling units. From each primary unit, 500 g of raisins
were collected at random. The primary samples thus collected were mixed with each
other to get a composite representative sample of 5 kg. Each composite sample was
then separately spread on a clean piece of cloth in a single layer and mixed
thoroughly by quartering. From each composite sample, 2 kg raisins were collected
Chapter 8
233
at random to get representative laboratory sample, which were subsequently used for
analysis of physico-chemical and organoleptic parameters.
8.2.3 Quality evaluation (Codex Standard)
As per the Codex standards, the heavy metals like lead and arsenic should be
below their limits of detection as per the AOAC analytical method. Here the
analytical method used was atomic absorption spectrophotometry. As per the Codex
standards, the concentration of pesticides approved for grapes should be below their
corresponding maximum residue limits (MRLs) for grapes and raisins, whereas, for
those pesticides, which are banned or restricted for use in grape agriculture
horticulture, the concentration should essentially be at a level below their limits of
detection by AOAC method of analysis.
Most of the samples collected belonged to variety, 'Thompson Seedless' and its
clones and only two samples belonged to the variety, 'Sharad Seedless,' originally
Kishmish Chernyi which originated from Russia. All the samples were of seedless
type. Representative samples of raisins were constituted and subjected to analysis of
various quality parameters set by the Codex Alimentarius Commission [1] two
imported samples received from USA in polyethylene packets of 250 g each were
used as standard checks to compare the results obtained with the Indian samples.
Analysis: The samples were analysed for the following physic-chemical parameters
by the standard procedures.
Physical Parameters-
Pieces of Stem: Portion of the branch or main stem were counted for each
sample and reported as number per Kg.
Cap-Stem: Cap-stem is the small woody stem that attaches the grape berries
to the branch of the bunch. Any cap-stems exceeding 3 mm in length were counted
as directed by Codex standard and reported as number per 500 g.
Immature or Undeveloped Raisins: The completely shrivelled, raisins with
practically no flesh, produced from extremely light weight berries, were counted
and reported as percent by weight.
Damaged Raisins: The raisins affected by sunburn, scars, mechanical injury
or other similar means, which seriously affect the appearance and palatability, were
counted and reported as percent by weight.
Chapter 8
234
Sugared Raisins: The raisins with external or internal sugar crystals, which
are readily apparent and seriously affect the appearance of the raisins were counted
and reported as percent by weight.
Moisture: Representative samples of raisins of 20 g each were cut into small
pieces and dried in a hot air oven at 70°C till the constant weight. The percent
moisture contents were determined from the difference between initial weights of
samples [7].
Chemical Parameters
Mineral Impurities: The samples were analysed for the contents of heavy
metal impurities, viz. arsenic and lead by atomic absorption spectroscopy.
Mineral oil: Raisin samples (10g) were extracted in hexane (10mL). The
hexane extract thus obtained was filtered through Whatmann No.1 filter paper and
then concentrated to dryness in a rotary evaporator at 40°C. The residue was re-
dissolved in 2 ml HPLC grade hexane and injected into gas chromatograph
equipped with BP17 capillary column and flame ionisation detector to estimate
traces of ethyl oleate (the active ingredient of dipping oil) if any, in the raisins.
Sulphur Dioxide: Free and total Sulphur dioxide contents were monitored in
Sulphur-bleached raisin samples by modified Ripper titration method [8].
Sorbitol: Sorbitol was extracted by boiling the raisins (50 g) in distilled water
(100 mL) for 1 hour. The extract was filtered and concentrated to dryness in a
rotary evaporator under vacuum. The residue was dissolved in 10 mL distilled
water and estimated by HPCL using RI detector.
Browning: Raisin samples (5 g) were soaked in distilled water (100 mL) for
3 hours with occasional swirling. The supernatant was filtered through Whatmann
No. 41 filter paper. The absorbance of the supernatant filtrate was measured by a
UV/VIS spectrophotometer at 420 nm[9].
Pesticide Residues: All the samples were subjected to multiresidue analysis
for pesticides belonging to various chemical groups by using LC-MS/MS and GC-
MS techniques[10, 11].
Presence of Synthetic Colour: Quality analysis was done to explore the
presence of any synthetic colour in the raisins by visible spectrophotometry using
standards procedure.
Chapter 8
235
Ochrotoxin: Test was performed by HPLC analysis to check the presence of
mycotoxin in raisin. [12].
C. Organoleptic Parameters
The raisin samples were assessed for the standard organoleptic attributes using
5-point Hedonic scale for the food products. The samples were examined through
sensory evaluation for colour, appearance, flavour (aroma/taste) and texture (feel-
soft/hard) by a judging committee comprising of people from both the sexes and
socioeconomic conditions. The judges were requested to score from 1-5 according to
acceptance and preference. The scores were classified into five categories, viz. 1
(Dislike very much), 2 (Dislike), 3 (Neither like nor dislike), 4 (Like) and 5 (Like
very much). The samples were statistically compared on the basis of the scores they
received using single factor ANOVA[13].
8.3 RESULTS AND DISCUSSION
8.3.1 Quality Evaluation
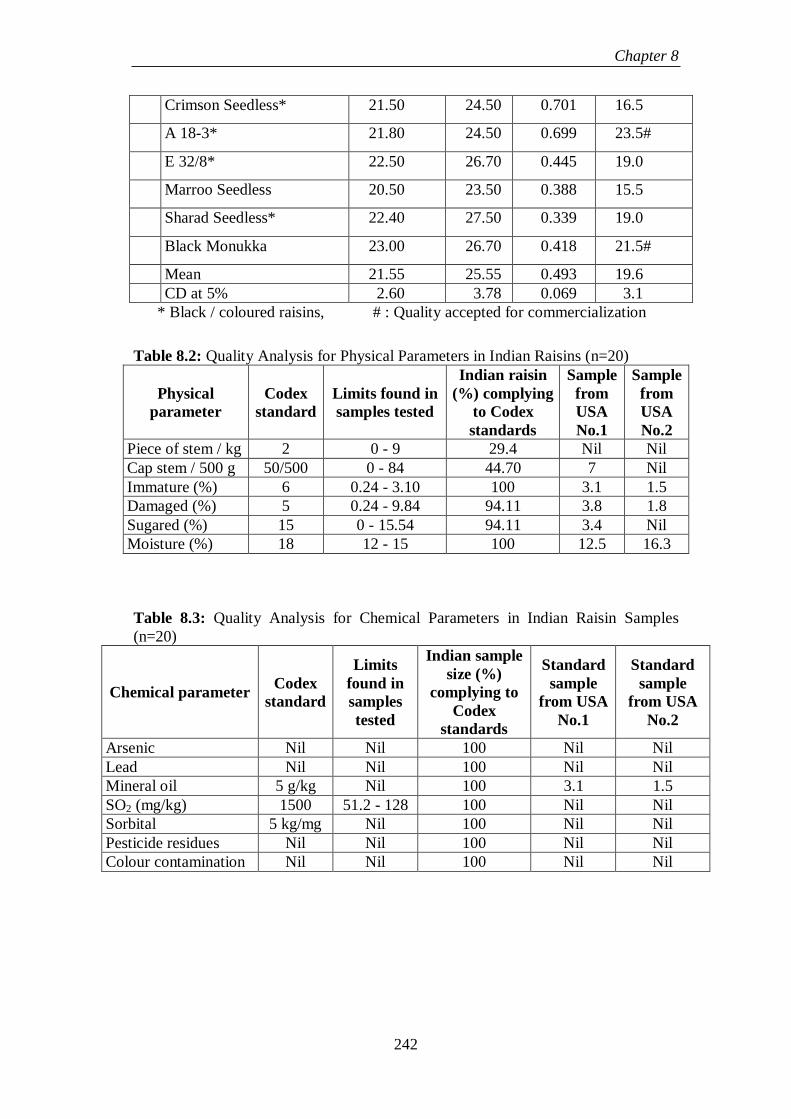
The physical parameters of Indian raisins are presented in Table 8.2. The
results of analysis of physical parameters revealed that numbers of piece of stem and
cap-stem were more than the allowance limit in majority of the Indian samples. In
case of 'piece of stem', even 9 pieces per Kg were recorded in contrast to the
allowance of 2 per Kg only. Similarly, with regard to the number of cap stem, only
44.7% samples could comply with the Codex standard. Bunches and the pedicels are
the sources of stem pieces and cap stems in the raisins. Their number depends upon
the efficiency of cleaning of the raisins followed after the drying to get rid of them.
This is done either manually or mechanically. In Indian products, this operation is
being done by both the methods depending upon the availability of facilities. The
results indicate lack of appropriate technology followed for cleaning of the raisins.
The progressive raisin makers and the growers associations are importing suitable
machines for efficient cleaning of the raisins.
The number of immature berries was within the allowance limits of the Codex
standard. This indicates that the grapes used for raisin making were harvested at the
right stage of maturity or sometimes at over maturity. None of the samples exceeded
the allowance limits for the defects related to the number of damaged and sugared
Chapter 8
236
raisins. The number of damaged berries depends upon the selection of bunches for
raisin making and the injury received during handling and processing. Not much
damage/ injury occurs during harvesting. The sugared berries appear as result of pre-
cultural factors, use of more nitrogen and more irrigation at the stage of harvest, etc.
which results in development of minute cracks on the surface of the berries, through
which sugar sap oozes out and gets crystallized on the surface of the berries.
Generally, the defects relating to immature, damaged and sugared raisins are related
to initial selection and grading of bunches for drying and the treatments given to
berries before drying for enhancing moisture removal. Extent of treatment
sometimes damages the outer skin and this results in damaged and sugared berries
after drying and therefore utmost care is required during selection and sorting of
grape bunches and the type of treatment given for hastening drying.
Ethyl oleate and potassium carbonate used in dipping oil, a treatment given to
berries before drying, removes the waxy layer on the berries and develops minute
cracks on the surface of skin through which moisture gets evaporated and the drying
is speeded up. The moisture content of the samples ranged between 12-15%, which
is much below the maximum level of 18% prescribed under the Codex standard.
Moisture content depends upon the method qf drying and its control. Higher
moisture results in spoilage under Indian conditions if not packed properly and
stored at ambient temperature, whereas, low moisture level means loss of weight and
hardness in the product. The results indicate that the technique by which fresh grapes
were dried to raisins were of satisfactory nature. Moisture level of 12 to 15% in the
product gives a dry and hard feel the product, while 15-18% may give a feel of wet
and soft product. Therefore, a moisture level of 15-16.5% is an appropriate range
keeping in view the softness of the product, organoleptic qualities including mouth
feel, protection from microbial spoilage and production from chemical changes. We
may therefore fix our maximum moisture level at 15-16.5%. Colour of the product
also depends on the level of moisture, packaging and storage temperature etc.
Appropriate packaging and storage after drying, is a prerequisite for maintaining the
level of moisture during storage.
Data on chemical parameters are presented in Table 8.3. Analysis of heavy
metals indicates no contamination of lead or arsenic in the raisins. Lead is a
Chapter 8
237
contaminant that mostly appears in a food from polluted air through vehicular
emission and use of impure agrochemicals, while arsenic appears in food
commodities through root absorption from contaminated ground water. Both lead
and arsenic are toxic to human beings and the environment. The results suggest that
the raisin yards in India are not exposed to poisonous heavy metals like lead.
Similarly, the water sourced was free from arsenic contamination.No traces of
mineral oil could be detected in the raisin samples. The gas chromatographic
analysis did not show any peak corresponding to ethyl oleate, the major component
of dipping oil.
The grapes are treated with Sulphur with the objective to get rid of microbial
contamination and give the raisins a golden appearance. In view of the poor
consumer acceptance of the golden bleached raisins and increasing demand for the
green raisins, the raisin growers are gradually discontinuing this practice. However,
in the Sulphur bleached raisins, the Sulphur dioxide (SO2) contents were fairly low
as compared to the Codex standard. The HPLC analysis for sorbitol did not show
presence of this compound in any of the samples. Sorbitol is a. dextrose alcohol
which sweetens a food when added. Sorbitol test is the indicator of the presence of
artificial sweetener in a food product. Absence of sorbitol indicates that the Indian
raisins were free from the traces of any artificial sweetener.
The absorbance reading of the aqueous extracts of the samples mostly fall
within 0.10. Such low absorbance reading indicates that browning is not a problem
for Indian raisins due to their storage at low temperature and also the low moisture
content. The absorbance reading for the standard samples received from USA were
0.068 and 0.178, on par with Indian samples. The raisins were free from any
food/industrial grade synthetic colour. Addition of synthetic green colour is done to
make raisins more attractive and natural to the consumers. However, it is not
permitted as per the PFA and FPO regulations.
The raisin samples collected during studies were found to be free from any
pesticide residues. Grape is a crop, which receives regular application of various
pesticides for the management of pests and diseases throughout the year. This leads
to apprehension regarding the presence pesticide residues in grape berries at harvest.
The absence of pesticide residues indicates that either the raisins were produced from
Chapter 8
238
grapes produced through good agricultural practices or the residues might have got
degraded during processing of the fresh grapes to raisins. All the samples were
sreened for the mycotoxin test (Ochrotoxin A) by HPLC analysis, and the results
indicated that there was no contamination. Indian raisins were thus found to be free
from contamination of any objectionable microorganism.
Organoleptic tests indicated that only 12% samples were liked for their colour
and texture; whereas, only 18% of the samples were liked for their taste. In overall
acceptability analysis, the consumers accepted only 12% samples. All the
organoleptic attributes were strongly correlated with each other as well as
acceptability. All the 'liked' samples belonged to Thompson Seedless variety and
were of green colour. The respondents did not accept the coloured raisins prepared
out of Sharad Seedless/Flame Seedless variety because of poor appearance, flavour
and texture. This means that Indian green raisins have general acceptance among the
consumers. A subjective analysis indicates that poor quality of the raisins was might
be due to poor raw material used for drying. If grapes of superior quality were used
for raisin making, then certainly, the raisin quality would be accepted by the
consumers. There is necessity to develop strategies to improve overall quality of the
raisins with reference to the organoleptic acceptance.
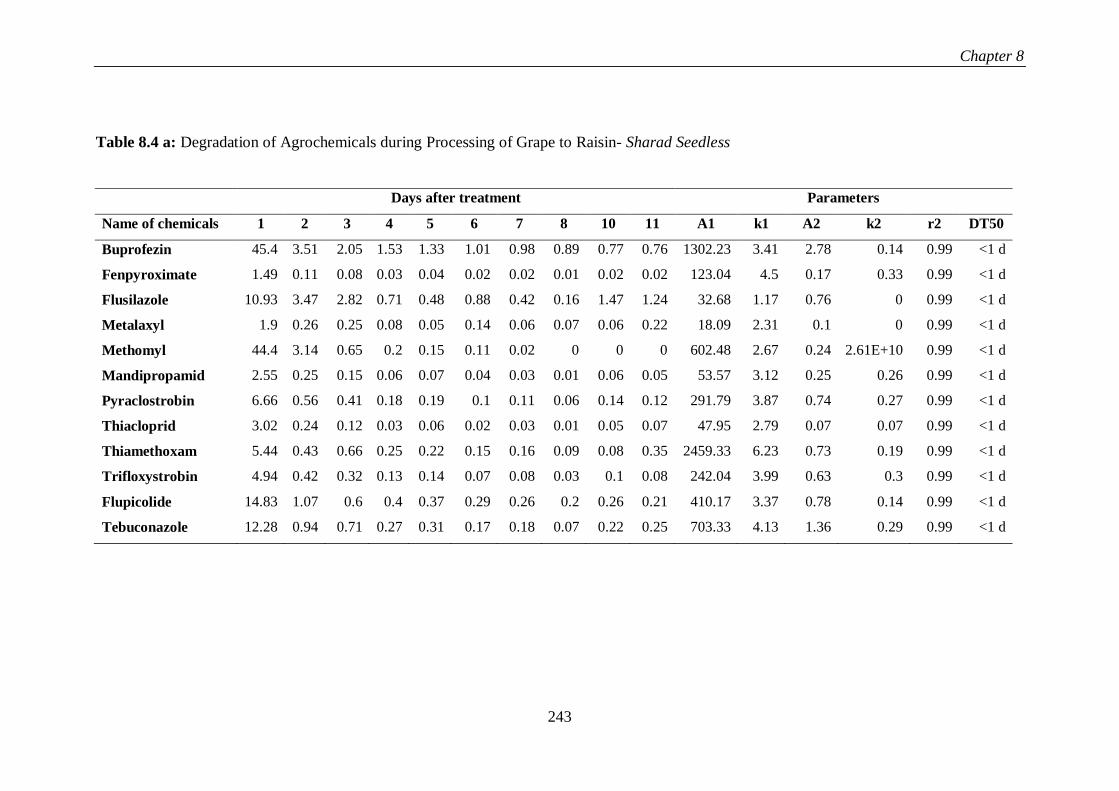
8.3.2 Identification and Quantification
The extractable residues of the pesticides in the sharad seedless variety were
measured at regular intervals. The kinetics of the residue data was evaluated by
fitting the data into 1st, square root 1st and 1st + 1st order kinetic models, which were
furthermore compared for the best fit. For all the pesticides, the dissipation rate was
faster at the beginning, which slowed down with time. An excellent fit of residue
data to the 1st + 1st order model was observed for all the pesticides with R2 > 0.99 in
each case. The empirical square root 1st order model gave relatively poor fit. The 1st
+ 1st order model also gave the most realistic half-life value as compared to the other
two models. The typical nature of dissipation suggests the fit of data to a two-
compartment 1st + 1st order kinetics model, where, one part of the residue is
immediately available for rapid degradation, leaving the other part for slower
degradation. The other fraction is subsequently released and dissipated at a relatively
slower rate. For all chemicals, the distribution in the first compartment was higher
Chapter 8
239
compared to the second. Degradation in the first compartment was significantly
higher than in the second compartment. In all cases DT50 was less than 1 day (Table
8.4 a).
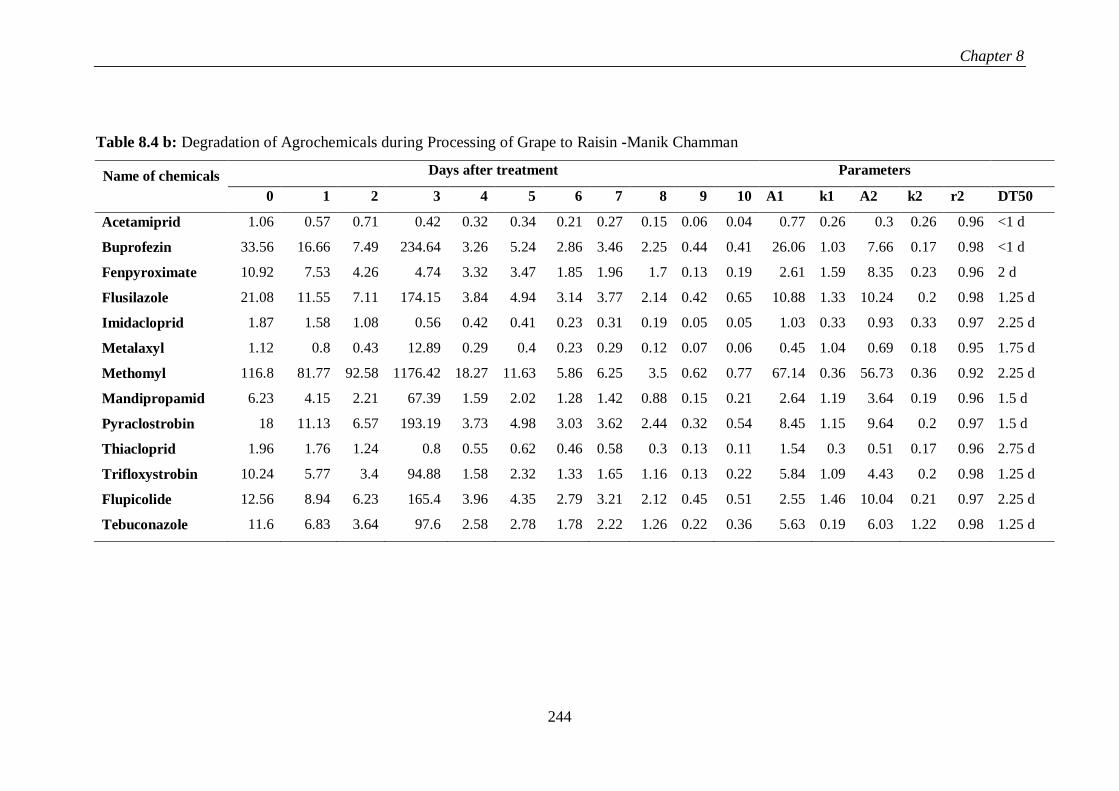
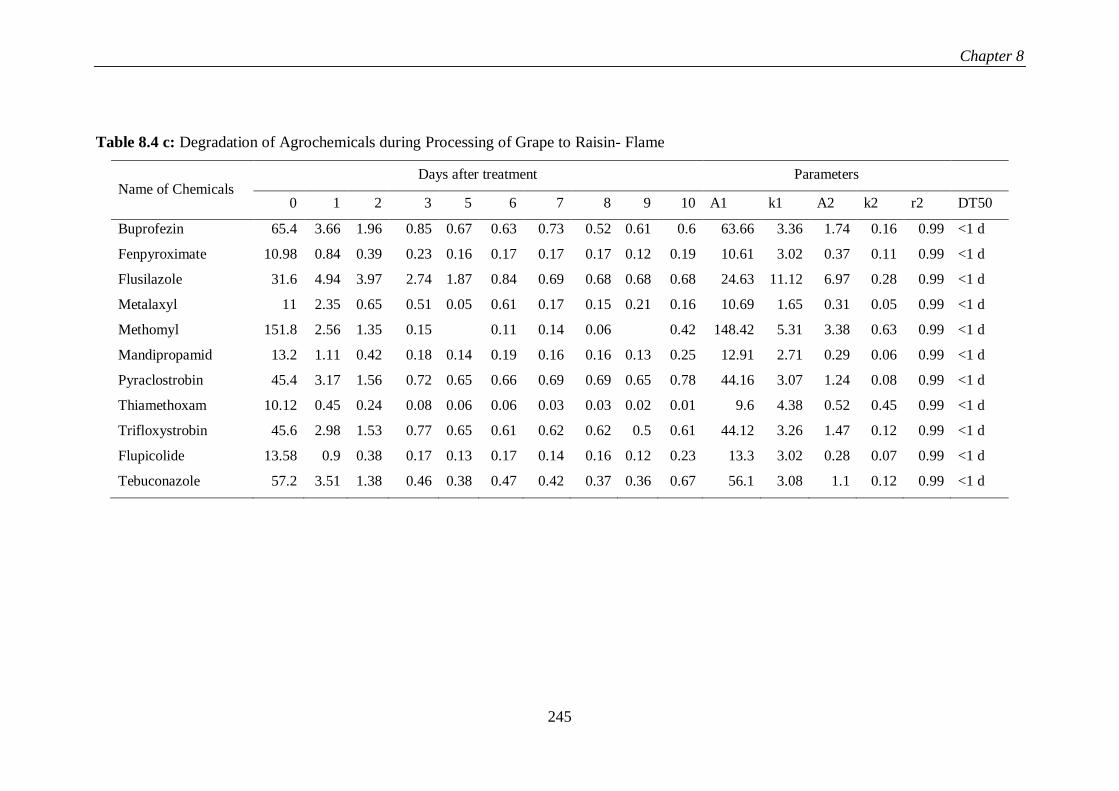
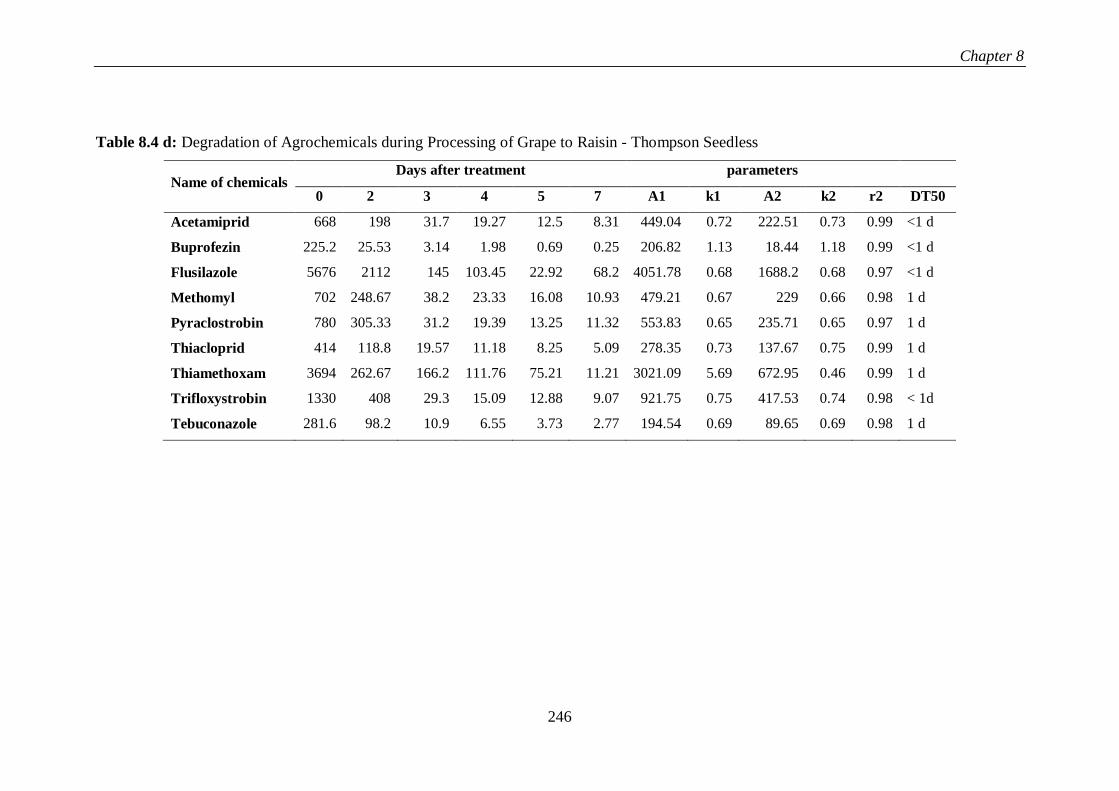
The extractable residues of the pesticides in the Manik Chamman, Flame and
Thompson seedless variety were measured as above. An excellent fit of residue data
to the 1st + 1st order model was observed for all these varieties for all the pesticides
with R2 > 0.97, 0.99 and 0.97 respectively in each case. DT50 ranged from less than 1
day to 2 days for Manik Chaman (Table 8.4 b) and less than 1 day for flame and
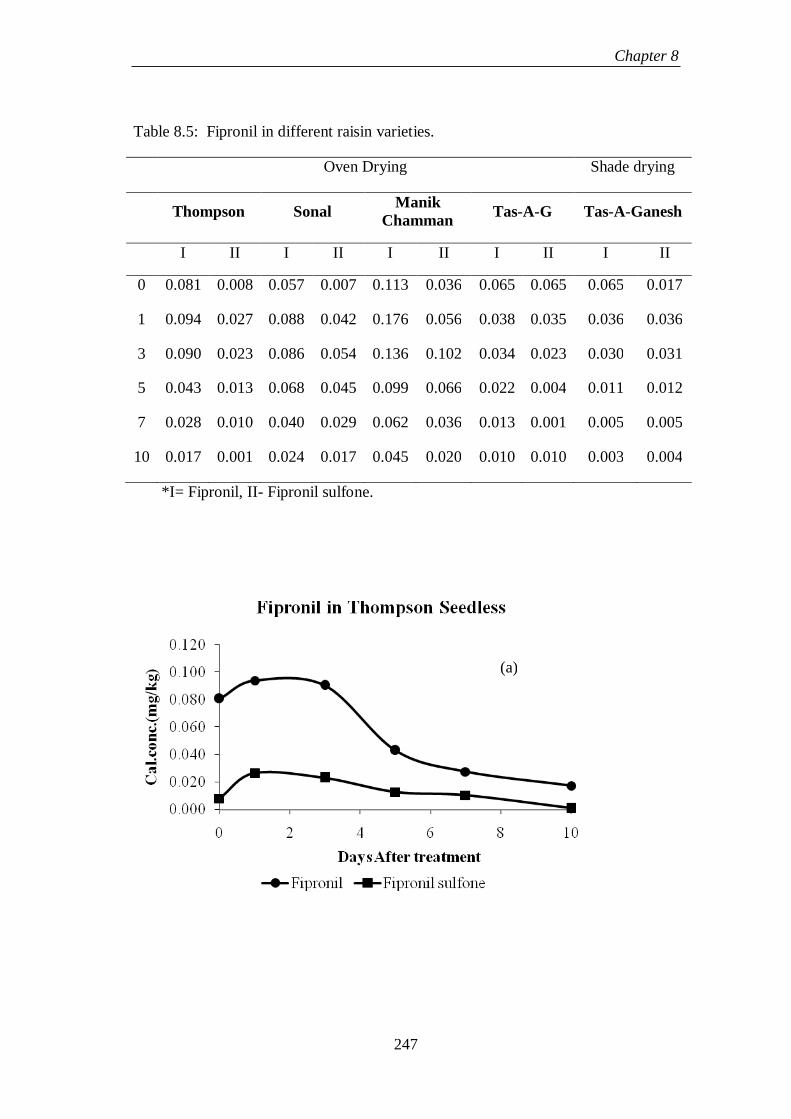
Thompson Seedless (Table 8.4 c and Table 8.4 d). The extractable residues of
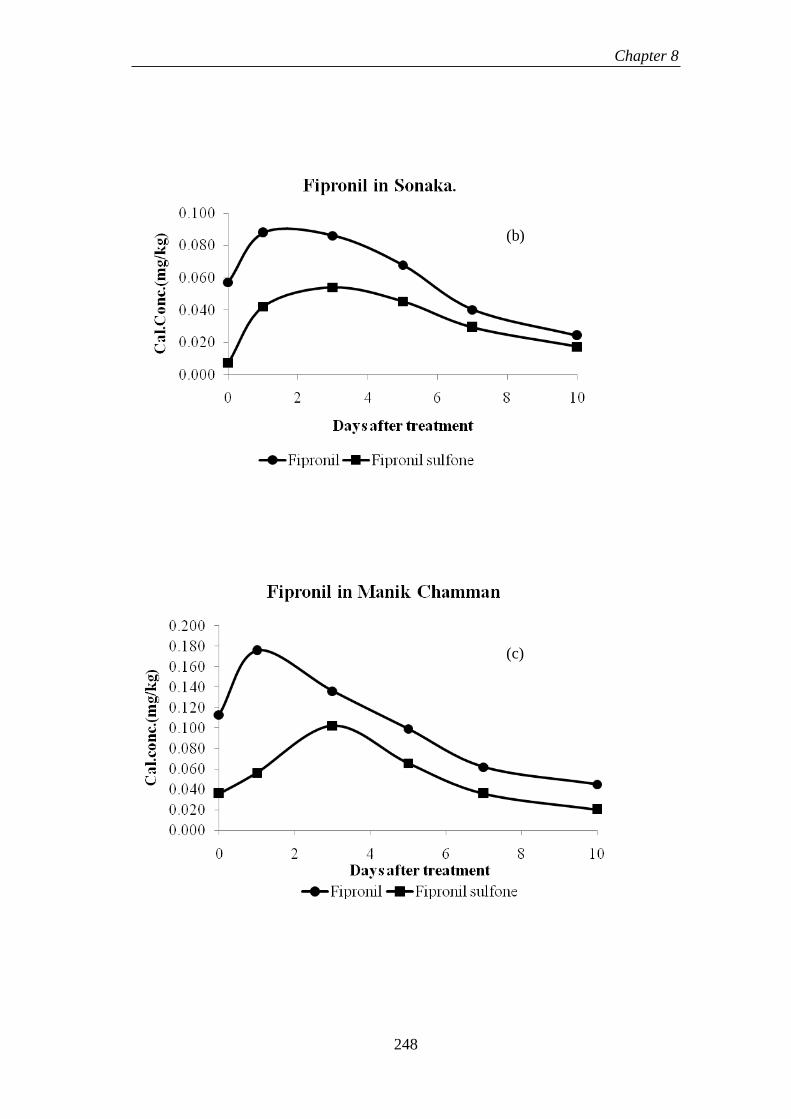
fipronil in the grape matrix were measured at regular intervals. The kinetics of the
residue data was evaluated by fitting the data into 1st, square root 1st and 1st + 1st
order kinetic models, which were furthermore compared for the best fit. An excellent
fit of residue data to the 1st + 1st order model was observed for all the pesticides
with R2 > 0.97 in each case. The empirical square root 1st order model gave
relatively poor fit for. The 1st + 1st order model also gave the most realistic half-life
value as compared to the other two models. The typical nature of dissipation
suggests the fit of data to a two-compartment 1st + 1st order kinetics model, where,
one part of the residue is immediately available for rapid degradation, leaving the
other part for slower degradation. The other fraction is subsequently released and
dissipated at a relatively slower rate. For all matrices, the distribution in the first
compartment was similar compared to the second. Degradation in the first
compartment was also comparable to the second compartment. In all cases DT50
ranged from 3 days to 6 days.
8.4 CONCLUSION
The study has clearly brought out that the Indian raisin samples conform to all
the parameters specified under the Codex standard except the number of cap stems
and stem pieces in unit quantity. This reveals that our cleaning of raisins after drying
the grapes is not efficient to comply with the Codex standard and therefore,
improvement has to be made in respect of cleaning of raisins, preferably by adopting
mechanical means. Further, our moisture levels are low and thereby their texture in
mouth feel is hard and therefore, this needs to be increased to 15-16.5% to have
Chapter 8
240
better mouth feel. The packaging and labelling have also to be improved to comply
our product with the international quality standard.
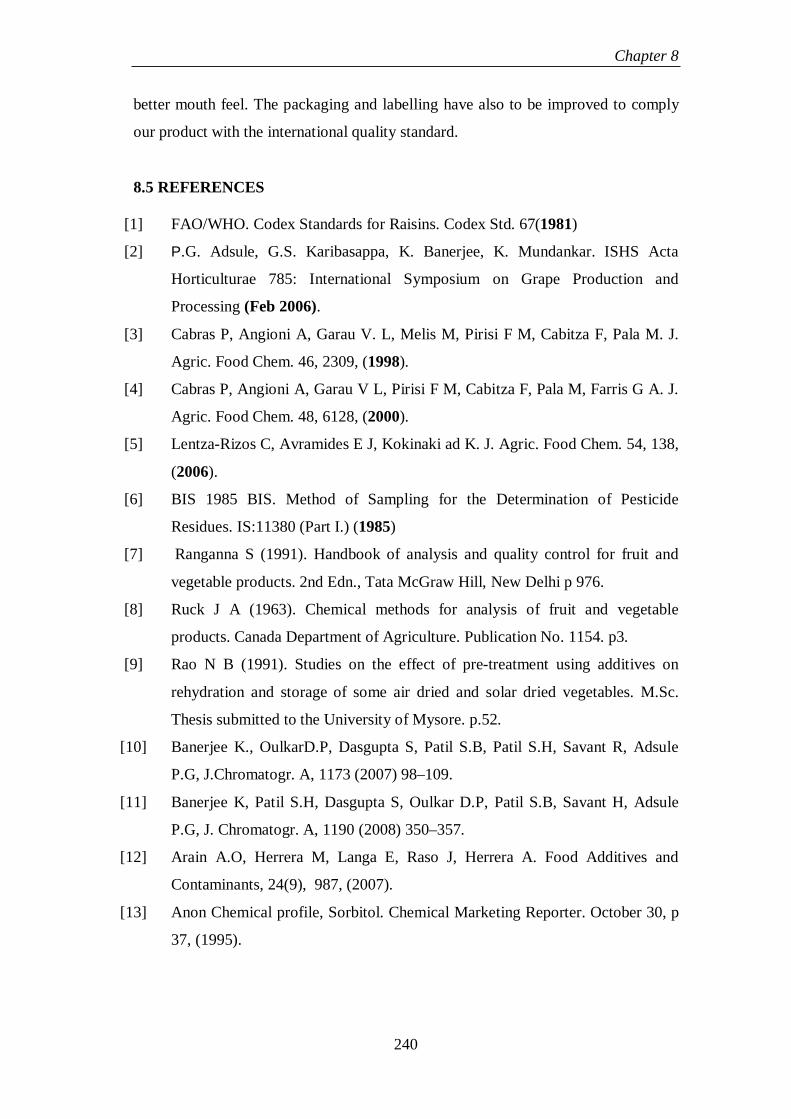
8.5 REFERENCES
[1] FAO/WHO. Codex Standards for Raisins. Codex Std. 67(1981)
[2] P.G. Adsule, G.S. Karibasappa, K. Banerjee, K. Mundankar. ISHS Acta
Horticulturae 785: International Symposium on Grape Production and
Processing (Feb 2006).
[3] Cabras P, Angioni A, Garau V. L, Melis M, Pirisi F M, Cabitza F, Pala M. J.
Agric. Food Chem. 46, 2309, (1998).
[4] Cabras P, Angioni A, Garau V L, Pirisi F M, Cabitza F, Pala M, Farris G A. J.
Agric. Food Chem. 48, 6128, (2000).
[5] Lentza-Rizos C, Avramides E J, Kokinaki ad K. J. Agric. Food Chem. 54, 138,
(2006).
[6] BIS 1985 BIS. Method of Sampling for the Determination of Pesticide
Residues. IS:11380 (Part I.) (1985)
[7] Ranganna S (1991). Handbook of analysis and quality control for fruit and
vegetable products. 2nd Edn., Tata McGraw Hill, New Delhi p 976.
[8] Ruck J A (1963). Chemical methods for analysis of fruit and vegetable
products. Canada Department of Agriculture. Publication No. 1154. p3.
[9] Rao N B (1991). Studies on the effect of pre-treatment using additives on
rehydration and storage of some air dried and solar dried vegetables. M.Sc.
Thesis submitted to the University of Mysore. p.52.
[10] Banerjee K., OulkarD.P, Dasgupta S, Patil S.B, Patil S.H, Savant R, Adsule
P.G, J.Chromatogr. A, 1173 (2007) 98–109.
[11] Banerjee K, Patil S.H, Dasgupta S, Oulkar D.P, Patil S.B, Savant H, Adsule
P.G, J. Chromatogr. A, 1190 (2008) 350–357.
[12] Arain A.O, Herrera M, Langa E, Raso J, Herrera A. Food Additives and
Contaminants, 24(9), 987, (2007).
[13] Anon Chemical profile, Sorbitol. Chemical Marketing Reporter. October 30, p
37, (1995).
Chapter 8
241
Table 8.1:- Suitability of Grape Varieties for Raisin Making by Australian Soda Oil Dips
Method
Sr. No.
Name of cultivar / variety / clone
TSS of fresh grapes (°Brix)
Raisin recovery
(%)
Average weight of raisin (g)
Organoleptic score out of
total 30 points
A White seedless Perlette 18.00 16.92 0.382 18.5
A 39-3 16.86 20.15 0.350 16.5
A 17-3 21.90 23.10 0.903 26.5#
Centennial Seedless 22.20 27.50 0.863 22.5#
E 12/7 20.00 25.00 0.395 23.5#
A 39-2 (Mint Seedless) 19.46 26.82 0.870 25.0#
Arkavati 18.56 23.86 0.335 19.0
Arka Shweta 18.33 21.42 0.507 16.0
Superior Seedless 20.00 26.50 0.979 22.0#
Pusa Urvashi 19.00 22.30 0.407 16.5
KRWhite 23.40 27.80 0.330 22.5#
Early Perlette 22.50 24.50 0.472 18.0
Loose Perlette 21.00 23.50 0.486 18.5
E 12/3 22.50 28.50 0.417 22.5#
Merbein Seedless 22.00 27.00 0.390 17.5
B Thompson Seedless & Its Clones
Thompson Seedless 24.33 24.85 0.413 19.5
Sultanine - II 20.74 30.30 0.378 19.0
Sultana Seedless 24.46 28.53 0.411 19.5
Tas-A-Ganesh 23.86 27.60 0.386 16.3
Manik Chaman 21.94 26.53 0.447 23.5#
Thompson Seedless (Italy) 21.33 24.18 0.419 20.0
H-5 Clone 23.20 28.60 0.399 16.5
Pusa Seedless 22.50 26.00 0.435 19.5
C Coloured seedless Flame Seedless* 22.26 24.28 0.527 16.0
Kishmish Rozavis* 25.90 28.51 0.385 16.5
Chapter 8
242
Crimson Seedless* 21.50 24.50 0.701 16.5
A 18-3* 21.80 24.50 0.699 23.5#
E 32/8* 22.50 26.70 0.445 19.0
Marroo Seedless 20.50 23.50 0.388 15.5
Sharad Seedless* 22.40 27.50 0.339 19.0
Black Monukka 23.00 26.70 0.418 21.5#
Mean 21.55 25.55 0.493 19.6 CD at 5% 2.60 3.78 0.069 3.1
* Black / coloured raisins, # : Quality accepted for commercialization
Table 8.2: Quality Analysis for Physical Parameters in Indian Raisins (n=20)
Physical parameter
Codex standard
Limits found in samples tested
Indian raisin (%) complying
to Codex standards
Sample from USA No.1
Sample from USA No.2
Piece of stem / kg 2 0 - 9 29.4 Nil Nil Cap stem / 500 g 50/500 0 - 84 44.70 7 Nil Immature (%) 6 0.24 - 3.10 100 3.1 1.5 Damaged (%) 5 0.24 - 9.84 94.11 3.8 1.8 Sugared (%) 15 0 - 15.54 94.11 3.4 Nil Moisture (%) 18 12 - 15 100 12.5 16.3
Table 8.3: Quality Analysis for Chemical Parameters in Indian Raisin Samples (n=20)
Chemical parameter Codex standard
Limits found in samples tested
Indian sample size (%)
complying to Codex
standards
Standard sample
from USA No.1
Standard sample
from USA No.2
Arsenic Nil Nil 100 Nil Nil Lead Nil Nil 100 Nil Nil Mineral oil 5 g/kg Nil 100 3.1 1.5 SO2 (mg/kg) 1500 51.2 - 128 100 Nil Nil Sorbital 5 kg/mg Nil 100 Nil Nil Pesticide residues Nil Nil 100 Nil Nil Colour contamination Nil Nil 100 Nil Nil
Chapter 8
243
Table 8.4 a: Degradation of Agrochemicals during Processing of Grape to Raisin- Sharad Seedless
Days after treatment Parameters
Name of chemicals 1 2 3 4 5 6 7 8 10 11 A1 k1 A2 k2 r2 DT50
Buprofezin 45.4 3.51 2.05 1.53 1.33 1.01 0.98 0.89 0.77 0.76 1302.23 3.41 2.78 0.14 0.99 <1 d
Fenpyroximate 1.49 0.11 0.08 0.03 0.04 0.02 0.02 0.01 0.02 0.02 123.04 4.5 0.17 0.33 0.99 <1 d
Flusilazole 10.93 3.47 2.82 0.71 0.48 0.88 0.42 0.16 1.47 1.24 32.68 1.17 0.76 0 0.99 <1 d
Metalaxyl 1.9 0.26 0.25 0.08 0.05 0.14 0.06 0.07 0.06 0.22 18.09 2.31 0.1 0 0.99 <1 d
Methomyl 44.4 3.14 0.65 0.2 0.15 0.11 0.02 0 0 0 602.48 2.67 0.24 2.61E+10 0.99 <1 d
Mandipropamid 2.55 0.25 0.15 0.06 0.07 0.04 0.03 0.01 0.06 0.05 53.57 3.12 0.25 0.26 0.99 <1 d
Pyraclostrobin 6.66 0.56 0.41 0.18 0.19 0.1 0.11 0.06 0.14 0.12 291.79 3.87 0.74 0.27 0.99 <1 d
Thiacloprid 3.02 0.24 0.12 0.03 0.06 0.02 0.03 0.01 0.05 0.07 47.95 2.79 0.07 0.07 0.99 <1 d
Thiamethoxam 5.44 0.43 0.66 0.25 0.22 0.15 0.16 0.09 0.08 0.35 2459.33 6.23 0.73 0.19 0.99 <1 d
Trifloxystrobin 4.94 0.42 0.32 0.13 0.14 0.07 0.08 0.03 0.1 0.08 242.04 3.99 0.63 0.3 0.99 <1 d
Flupicolide 14.83 1.07 0.6 0.4 0.37 0.29 0.26 0.2 0.26 0.21 410.17 3.37 0.78 0.14 0.99 <1 d
Tebuconazole 12.28 0.94 0.71 0.27 0.31 0.17 0.18 0.07 0.22 0.25 703.33 4.13 1.36 0.29 0.99 <1 d
Chapter 8
244
Table 8.4 b: Degradation of Agrochemicals during Processing of Grape to Raisin -Manik Chamman
Name of chemicals Days after treatment Parameters
0 1 2 3 4 5 6 7 8 9 10 A1 k1 A2 k2 r2 DT50
Acetamiprid 1.06 0.57 0.71 0.42 0.32 0.34 0.21 0.27 0.15 0.06 0.04 0.77 0.26 0.3 0.26 0.96 <1 d
Buprofezin 33.56 16.66 7.49 234.64 3.26 5.24 2.86 3.46 2.25 0.44 0.41 26.06 1.03 7.66 0.17 0.98 <1 d
Fenpyroximate 10.92 7.53 4.26 4.74 3.32 3.47 1.85 1.96 1.7 0.13 0.19 2.61 1.59 8.35 0.23 0.96 2 d
Flusilazole 21.08 11.55 7.11 174.15 3.84 4.94 3.14 3.77 2.14 0.42 0.65 10.88 1.33 10.24 0.2 0.98 1.25 d
Imidacloprid 1.87 1.58 1.08 0.56 0.42 0.41 0.23 0.31 0.19 0.05 0.05 1.03 0.33 0.93 0.33 0.97 2.25 d
Metalaxyl 1.12 0.8 0.43 12.89 0.29 0.4 0.23 0.29 0.12 0.07 0.06 0.45 1.04 0.69 0.18 0.95 1.75 d
Methomyl 116.8 81.77 92.58 1176.42 18.27 11.63 5.86 6.25 3.5 0.62 0.77 67.14 0.36 56.73 0.36 0.92 2.25 d
Mandipropamid 6.23 4.15 2.21 67.39 1.59 2.02 1.28 1.42 0.88 0.15 0.21 2.64 1.19 3.64 0.19 0.96 1.5 d
Pyraclostrobin 18 11.13 6.57 193.19 3.73 4.98 3.03 3.62 2.44 0.32 0.54 8.45 1.15 9.64 0.2 0.97 1.5 d
Thiacloprid 1.96 1.76 1.24 0.8 0.55 0.62 0.46 0.58 0.3 0.13 0.11 1.54 0.3 0.51 0.17 0.96 2.75 d
Trifloxystrobin 10.24 5.77 3.4 94.88 1.58 2.32 1.33 1.65 1.16 0.13 0.22 5.84 1.09 4.43 0.2 0.98 1.25 d
Flupicolide 12.56 8.94 6.23 165.4 3.96 4.35 2.79 3.21 2.12 0.45 0.51 2.55 1.46 10.04 0.21 0.97 2.25 d
Tebuconazole 11.6 6.83 3.64 97.6 2.58 2.78 1.78 2.22 1.26 0.22 0.36 5.63 0.19 6.03 1.22 0.98 1.25 d
Chapter 8
245
Table 8.4 c: Degradation of Agrochemicals during Processing of Grape to Raisin- Flame
Name of Chemicals Days after treatment Parameters
0 1 2 3 5 6 7 8 9 10 A1 k1 A2 k2 r2 DT50
Buprofezin 65.4 3.66 1.96 0.85 0.67 0.63 0.73 0.52 0.61 0.6 63.66 3.36 1.74 0.16 0.99 <1 d
Fenpyroximate 10.98 0.84 0.39 0.23 0.16 0.17 0.17 0.17 0.12 0.19 10.61 3.02 0.37 0.11 0.99 <1 d
Flusilazole 31.6 4.94 3.97 2.74 1.87 0.84 0.69 0.68 0.68 0.68 24.63 11.12 6.97 0.28 0.99 <1 d
Metalaxyl 11 2.35 0.65 0.51 0.05 0.61 0.17 0.15 0.21 0.16 10.69 1.65 0.31 0.05 0.99 <1 d
Methomyl 151.8 2.56 1.35 0.15 0.11 0.14 0.06 0.42 148.42 5.31 3.38 0.63 0.99 <1 d
Mandipropamid 13.2 1.11 0.42 0.18 0.14 0.19 0.16 0.16 0.13 0.25 12.91 2.71 0.29 0.06 0.99 <1 d
Pyraclostrobin 45.4 3.17 1.56 0.72 0.65 0.66 0.69 0.69 0.65 0.78 44.16 3.07 1.24 0.08 0.99 <1 d
Thiamethoxam 10.12 0.45 0.24 0.08 0.06 0.06 0.03 0.03 0.02 0.01 9.6 4.38 0.52 0.45 0.99 <1 d
Trifloxystrobin 45.6 2.98 1.53 0.77 0.65 0.61 0.62 0.62 0.5 0.61 44.12 3.26 1.47 0.12 0.99 <1 d
Flupicolide 13.58 0.9 0.38 0.17 0.13 0.17 0.14 0.16 0.12 0.23 13.3 3.02 0.28 0.07 0.99 <1 d
Tebuconazole 57.2 3.51 1.38 0.46 0.38 0.47 0.42 0.37 0.36 0.67 56.1 3.08 1.1 0.12 0.99 <1 d
Chapter 8
246
Table 8.4 d: Degradation of Agrochemicals during Processing of Grape to Raisin - Thompson Seedless
Name of chemicals Days after treatment parameters
0 2 3 4 5 7 A1 k1 A2 k2 r2 DT50
Acetamiprid 668 198 31.7 19.27 12.5 8.31 449.04 0.72 222.51 0.73 0.99 <1 d
Buprofezin 225.2 25.53 3.14 1.98 0.69 0.25 206.82 1.13 18.44 1.18 0.99 <1 d
Flusilazole 5676 2112 145 103.45 22.92 68.2 4051.78 0.68 1688.2 0.68 0.97 <1 d
Methomyl 702 248.67 38.2 23.33 16.08 10.93 479.21 0.67 229 0.66 0.98 1 d
Pyraclostrobin 780 305.33 31.2 19.39 13.25 11.32 553.83 0.65 235.71 0.65 0.97 1 d
Thiacloprid 414 118.8 19.57 11.18 8.25 5.09 278.35 0.73 137.67 0.75 0.99 1 d
Thiamethoxam 3694 262.67 166.2 111.76 75.21 11.21 3021.09 5.69 672.95 0.46 0.99 1 d
Trifloxystrobin 1330 408 29.3 15.09 12.88 9.07 921.75 0.75 417.53 0.74 0.98 < 1d
Tebuconazole 281.6 98.2 10.9 6.55 3.73 2.77 194.54 0.69 89.65 0.69 0.98 1 d
Chapter 8
247
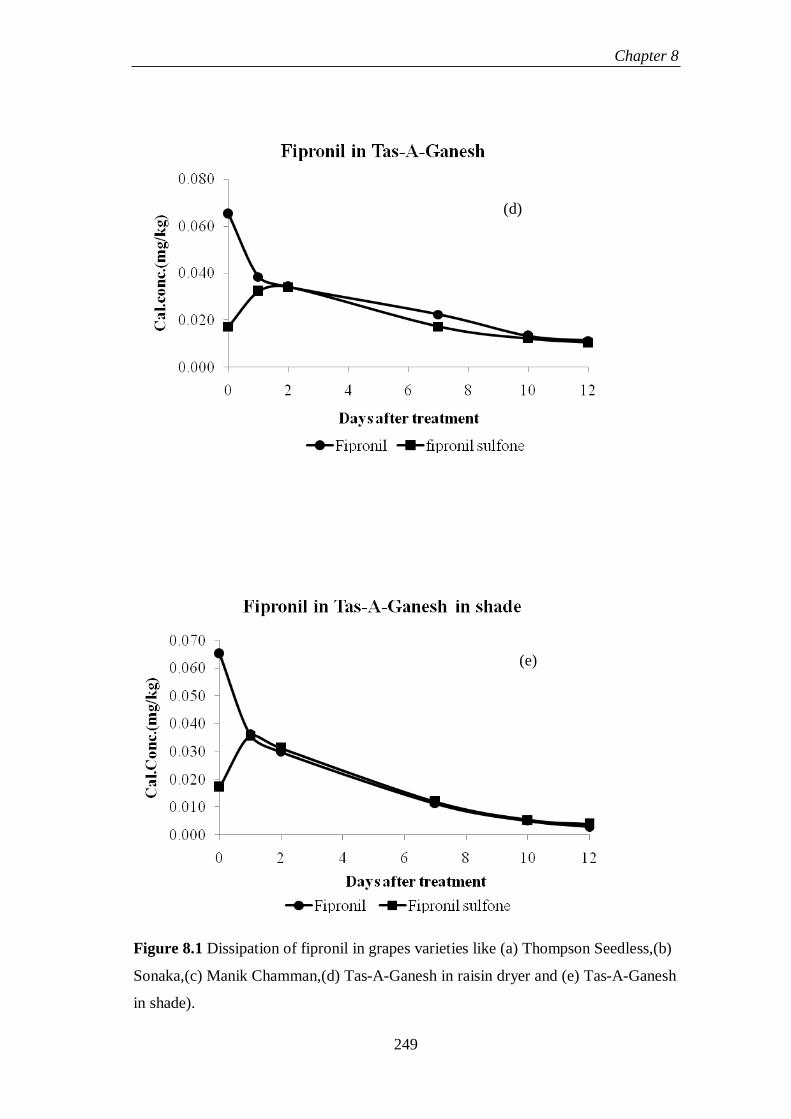
Table 8.5: Fipronil in different raisin varieties.
Oven Drying Shade drying
Thompson Sonal Manik Chamman Tas-A-G Tas-A-Ganesh
I II I II I II I II I II
0 0.081 0.008 0.057 0.007 0.113 0.036 0.065 0.065 0.065 0.017
1 0.094 0.027 0.088 0.042 0.176 0.056 0.038 0.035 0.036 0.036
3 0.090 0.023 0.086 0.054 0.136 0.102 0.034 0.023 0.030 0.031
5 0.043 0.013 0.068 0.045 0.099 0.066 0.022 0.004 0.011 0.012
7 0.028 0.010 0.040 0.029 0.062 0.036 0.013 0.001 0.005 0.005
10 0.017 0.001 0.024 0.017 0.045 0.020 0.010 0.010 0.003 0.004
*I= Fipronil, II- Fipronil sulfone.
(a)
Chapter 8
248
(b)
(c)
Chapter 8
249
Figure 8.1 Dissipation of fipronil in grapes varieties like (a) Thompson Seedless,(b)
Sonaka,(c) Manik Chamman,(d) Tas-A-Ganesh in raisin dryer and (e) Tas-A-Ganesh
in shade).
(d)
(e)