Embed Size (px)
Citation preview

1
FATE, TRANSPORT, AND RISK ASSESSMENT OF BIOSOLIDS-BORNE TRICLOSAN (TCS)
By
MANMEET WARIA
A DISSERTATION PRESENTED TO THE GRADUATE SCHOOL OF THE UNIVERSITY OF FLORIDA IN PARTIAL FULFILLMENT
OF THE REQUIREMENTS FOR THE DEGREE OF DOCTOR OF PHILOSOPHY
UNIVERSITY OF FLORIDA
2011

2
© 2011 Manmeet Waria

3
This dissertation is dedicated to my family

4
ACKNOWLEDGMENTS
It is a pleasure to thank all those who made this dissertation possible. I am
heartily thankful to my supervisor Dr. George O‘Connor whose encouragement and
support from preliminary to the concluding level enabled me to develop understanding
of the subject. I would also like to thank my co-advisor Dr. Gurpal Toor and committee
members Drs. John Thomas, Chris Wilson, Ed Topp and Margaret James for their
contribution by providing laboratory space as well as guidance at all times.
Special thanks go to Dr. Andy Ogram, Abid Al-Agely and Hee-Sung who
provided guidance during the analysis of my microbiological work; Dr. George
Hochmuth and Dr. Maria Silveira for their assistance and guidance in my plant uptake
work.
Thank you to Bob Querns, Dawn Lucas, and Yu Wang for providing expertise on
instrumentation in their laboratories. Words get short to describe the help of some folks
at the Gulf Coast Research and Education Center especially Dr. Bielinski, Nancy West,
Elizabeth Golden, Maninder Chahal and Gitta Shurberg. I also want to thank the past
members of the Soil Chemistry group, including Liz Snyder, Sampson Agyin-Birikorang,
Matt Miller, Daniel Moura, Augustine Obour, and Jaya Das for all their help and support.
I am indebted to the funding agency Metropolitan Water Reclamation District of
Greater Chicago (MWRDGC) for funding the research and their personnel (Kuldip
Kumar, Lakhwinder Hundal) for helping me collect useful field samples.
I like to thank the Almighty for giving me the strength to achieve my goal; my
loving husband Varinder Pannu, my parents Sarbdeep Kaur and Balwant Singh, siblings
Harveen Bajwa, Naveen Sidhu and Kanwar Sandeep Singh, for their love and support
and for being there and loving me always.

5
Lastly, I offer my regards and blessings to all my friends (Gur reet Brar, Raman
Brar, Milap Sandhu, Aman Sandhu, Preetie Sood, Rupesh Bhomia, and Maninder
Singh), and to all of those who supported me in any respect during the completion of my
project.

6
TABLE OF CONTENTS page
ACKNOWLEDGMENTS .................................................................................................. 4
LIST OF TABLES .......................................................................................................... 11
LIST OF FIGURES ........................................................................................................ 14
LIST OF ABBREVIATIONS ........................................................................................... 16
ABSTRACT ................................................................................................................... 17
CHAPTER
1 INTRODUCTION AND PROJECT OBJECTIVES ................................................... 19
Background ............................................................................................................. 19
Objective 1: Quantify TCS Concentrations in Biosolids .................................... 27
Objective 2: Determine/Verify Basic Physico-Chemical Properties of TCS ...... 28
Objective 3: Determine the Degradation (Persistence) of Biosolids-Borne TCS ............................................................................................................... 29
Objective 4: Determine the Impacts of Biosolids-Borne TCS to Soil Organisms ..................................................................................................... 29
Objective 5: Determine the Toxicity of Biosolids-Borne TCS on Microbial Reactions ...................................................................................................... 30
Objective 6: Quantify the Phytoavailability of Biosolids-Borne TCS ................. 30
Objective 7: Quantify the Leaching Potential of Biosolids-Borne TCS .............. 31
Ultimate Objective: Risk Assessment of Biosolids-Borne TCS ............................... 31
2 BIOSOLIDS-BORNE TCS CONCENTRATIONS .................................................... 34
Background ............................................................................................................. 34
Material and Methods ............................................................................................. 34
Results and Discussion ........................................................................................... 36
3 BASIC PHYSICO-CHEMICAL PROPERTIES OF TCS .......................................... 40
Background ............................................................................................................. 40
Material and Methods ............................................................................................. 43
Solubility ........................................................................................................... 43
Partitioning Coefficients (Kd and Koc) ................................................................ 45
Results and Discussion ........................................................................................... 47
4 BIODEGRADATION OF BIOSOLIDS-BORNE TCS ............................................... 53
Background ............................................................................................................. 53

7
Material and Methods ............................................................................................. 56
Chemicals, Biosolids and Soils ......................................................................... 56
Biodegradation Study Design ........................................................................... 56
Base Trap Analysis and Soil Sample Extraction ............................................... 58
Sequential Extraction Scheme ......................................................................... 59
Radiological-Thin-Layer-Chromatography (RAD-TLC) for Extract Speciation .. 60
Statistical Analysis ............................................................................................ 61
Results and Discussion ........................................................................................... 61
Mass Balance and Mineralization of 14C-TCS .................................................. 61
Total Carbon Dioxide (CO2) Analyses .............................................................. 64
Metabolite Identification .................................................................................... 65
Half-life (Persistence) Determination ................................................................ 67
Comparison of TCS Persistence in Amended, Un-Amended, and Field Soils .. 70
5 IMPACTS OF BIOSOLIDS-BORNE TCS ON SOIL DWELLING ORGANISMS ...... 82
Background ............................................................................................................. 82
Material and Methods ............................................................................................. 85
Chemicals, Biosolids and Soils ......................................................................... 85
Range-Finding Toxicity Test Design ................................................................. 86
Definitive Toxicity Test Design ......................................................................... 87
Earthworm Bioaccumulation Test ..................................................................... 88
Design for the laboratory study .................................................................. 88
Bioaccumulation in field soils ..................................................................... 88
Sample extraction and derivatization for earthworm bioaccumulation ....... 89
Instrument analyses and quantification ...................................................... 90
Results and Discussion ........................................................................................... 91
Range-Finding Toxicity Test ............................................................................. 91
Definitive Toxicity Test (IFS Soil) ...................................................................... 92
Bioaccumulation Laboratory Study ................................................................... 94
Bioaccumulation Field Test .............................................................................. 99
6 BIOSOLIDS-BORNE TCS EFFECTS ON SOIL MICROBES ................................ 106
Background ........................................................................................................... 106
Material and Methods ........................................................................................... 110
Chemicals, Biosolids, and Soils ...................................................................... 110
Microbial Toxicity (Range-Finding) Test Design ............................................. 112
Microbial Toxicity (Definitive) Test Design ...................................................... 113
Sample Preparation and Analyses for Microbial Toxicity Test ........................ 113
Microbial Community Structure Test Design .................................................. 115
Extraction for Bacterial Count ......................................................................... 116
Statistical Analysis .......................................................................................... 117
Results and Discussion ......................................................................................... 117
Microbial Toxicity (Range-Finding) Test ......................................................... 117
Microbial Toxicity (Definitive) Test .................................................................. 118
Effect on respiration rates ........................................................................ 118

8
Effect on nitrogen cycle ............................................................................ 119
Bacterial DNA analysis ................................................................................... 122
Microbial Community Structure Analysis ........................................................ 123
Bacterial Counts ............................................................................................. 124
7 PLANT TOXICITY AND BIOACCUMULATION OF BIOSOLIDS-BORNE TCS .... 134
Background ........................................................................................................... 134
Material and Methods ........................................................................................... 139
Soils and Chemicals ....................................................................................... 139
Toxicty and Bioaccumulation Study Design .................................................... 140
Bioaccumulation Field Study .......................................................................... 142
Plant Harvesting and Sample Preparation...................................................... 143
Instrument Analysis and Quantitation ............................................................. 144
Results and Discussion ......................................................................................... 145
Plant Biomass Yields ...................................................................................... 145
Uptake in the Above-Ground Biomass (Lettuce, Radish and Bahia Grass Leaves) ....................................................................................................... 147
Uptake in the Below-Ground Biomass (Radish Root) ..................................... 148
Bioaccumulation Field Study .......................................................................... 149
Model-Predicted TCS Concentrations in Plant Tissue .................................... 150
Mechanism of Bioaccumulation and Comparison with Other Studies ............ 151
Degradation in Soils ....................................................................................... 153
Comparison with Real World TCS Concentrations ......................................... 154
8 MOBILITY OF TRICLOSAN (TCS) IN BIOSOLIDS-AMENDED SOILS ................ 163
Background ........................................................................................................... 163
Materials and Methods .......................................................................................... 167
Experimental Design ...................................................................................... 167
Soils, Biosolids and Chemicals ....................................................................... 168
Tagging and Application of Biosolids .............................................................. 168
Pore Volume Determination ........................................................................... 169
Leachate Collection and Analysis ................................................................... 169
Determination of 14C Activity in the Soil .......................................................... 170
Results and Discussion ......................................................................................... 170
Leachate Recoveries and Tracer Breakthrough ............................................. 170 14C in Leachates and Recoveries by Combustion .......................................... 171 14C Recoveries by Extraction and Extract Speciation ..................................... 174
Comparison with CMLS Model ....................................................................... 175
Implications of TCS Movement ....................................................................... 177
9 RISK ASSESSMENT OF BIOSOLIDS-BORNE TCS ............................................ 184
Background ........................................................................................................... 184
Pathways of Exposure .......................................................................................... 187
Exclusion of Exposure Pathways .......................................................................... 187

9
Risk to Humans .............................................................................................. 187
Risk to Aquatic Organisms ............................................................................. 189
Reference Dose Calculation ................................................................................. 192
Parameters for Risk Estimation ............................................................................ 194
Environmental Fate ........................................................................................ 194
Effect on Soil Dwelling Organisms ................................................................. 194
Toxicity to earthworms ............................................................................. 194
Bioaccumulation in earthworms ............................................................... 195
Toxicity and Bioaccmulutaion in Plant Biomass ............................................. 195
Avian and Mammalian Toxicity ....................................................................... 195
Screening-Level Assessment ............................................................................... 196
Exposure Concentration Calculation .............................................................. 196
Screening-Level Hazard Index Calculation..................................................... 197
Tier 2 Assessment ................................................................................................ 197
Consideration of TCS Degradation ................................................................. 197
Pathway 1: Biosolidssoilplant (direct phytotoxicity) ........................... 199
Pathway 8: Biosolidssoilsoil organism .............................................. 199
Pathway 9: Biosolidssoilsoil organismpredator .................................... 200
Sources of Uncertainty in Our Risk Estimation ............................................... 200
Calculation of Preliminary Biosolids-Borne TCS Pollutant Limits ................... 201
Cumulative pollutant loading rates (CPLRs) ............................................ 201
Annual pollutant loading rate (APLR) ....................................................... 202
Ceiling concentration limit ........................................................................ 202
Pollutant concentration limit ..................................................................... 203
10 SUMMARY AND CONCLUSIONS ........................................................................ 219
Summary of Intermediate Objective Results ......................................................... 219
Objective 1: Quantify TCS Concentration in Biosolids .................................... 219
Objective 2: Determine/Verify Basic Physico-Chemical Properties of TCS .... 219
Objective 3: Determine the Degradation (Persistence) of Biosolids-Borne TCS ............................................................................................................. 220
Objective 4: Determine the Impacts of Biosolids-Borne TCS to Soil Organisms ................................................................................................... 221
Objective 5: Determine the Toxicity of Biosolids-Borne TCS on Microbial Reactions .................................................................................................... 222
Objective 6 and 7: Quantify the Phytoavailability and Leaching Potential of Biosolids-Borne TCS ................................................................................... 223
Ultimate Objective: Risk Assessment of Biosolids-Borne TCS ....................... 224
Future Studies ...................................................................................................... 225
APPENDIX
A EXPLANATION OF THE SEQUENTIAL EXTRACTION SCHEME ....................... 227
B SUPPLEMENATAL DATA FOR CHAPTER 7 ....................................................... 229

10
C LIMITS OF DETECTION, QUANTITATION AND RECOVERIES ......................... 230
WORKS CITED ........................................................................................................... 231
BIOGRAPHICAL SKETCH .......................................................................................... 250

11
LIST OF TABLES
Table page 1-1 Toxicity end-points of TCS for some aquatic species ......................................... 33
2-1 Triclosan (TCS) concentrations in fifteen biosolids (n = 3) obtained from wastewater treatment plants across the U.S. ..................................................... 38
3-1 Physico-chemical Properties of TCS reported in the literature. .......................... 49
3-2 Water solubility (mg L-1) of TCS at various pH values ........................................ 50
3-3 Mean log partition coefficients (Kd and Koc) (n=3) ± standard error (S.E) for TCS .................................................................................................................... 51
4-1 Selected physico-chemical properties of the soils and biosolids used in the study ................................................................................................................... 73
4-2 Biodegradation experiment treatments ............................................................... 73
4-3 Percent recoveries ± standard errors of 14C-TCS in IFS (Immokalee fine sand) biotic soil treatment [week (wk) 0-18]. ...................................................... 74
4-4 Percent recoveries ± standard errors of 14C-TCS in IFS (Immokalee fine sand) inhibited soil treatment [week (wk) 0-18]. .................................................. 74
4-5 Percent recoveries ± standard errors of 14C-TCS in ASL (Ashkum silty clay loam) biotic soil treatment [week (wk) 0-18]. ...................................................... 75
4-6 Percent recoveries ± standard errors of 14C-TCS in ASL (Ashkum silty clay loam) inhibited soil treatment [week (wk) 0-18]. .................................................. 75
4-7 Rate constants (k) and regression coefficients (R2) obtained for the biodegradation data ............................................................................................ 76
5-1 Major physico-chemical properties of the soils and biosolids utilized in the present study .................................................................................................... 101
5-2 Measured [average; n = 4 and standard error (SE)] TCS concentrations (mg kg-1) and bioaccumulation factors (BAFs) in earthworms grown in the Immokalee fine sand (IFS) ............................................................................... 102
5-3 Measured (average; n = 4 and SE) TCS concentrations (mg kg-1) and bioaccumulation factors (BAFs) in earthworms grown in the Ashkum silty clay loam soil (ASL) ................................................................................................. 102

12
5-4 Measured TCS concentrations (mg kg-1) and bioaccumulation factors (BAFs) in the earthworms collected from the field equilibrated biosolids-amended landscaping soil ................................................................................................ 103
6-1 The grouping of the various substrates in the biolog ECO plates (Garland and Mills, 1991). ............................................................................................... 126
6-2 Average bacterial count (number) in soils with varying biosolids application rates, TCS concentrations and textures .......................................................... 126
7-1 Selected physico-chemical properties of the soils and biosolids used in the present study. ................................................................................................... 157
7-2 Yield of plant parts of three plant species represented by fresh weights (g) in the control and biosolids-amended treatments ................................................. 157
7-3 Measured TCS concentrations (average; n = 3 or 4 and SD) and bioaccumulation factors (BAF) and BASL4 model calculated BAFs in the lettuce leaves .................................................................................................... 158
7-4 Measured TCS concentrations (average; n = 3 or 4 and SD) and bioaccumulation factors (BAF) and BASL4 model calculated BAFs in the radish leaves .................................................................................................... 158
7-5 Measured TCS concentrations (average; n = 3 or 4 and SD) and bioaccumulation factors (BAF) and BASL4 model calculated BAFs in the Bahia grass....................................................................................................... 158
7-6 Measured TCS concentrations (average; n = 3 or 4 and SD) and bioaccumulation factors (BAF) and BASL4 model calculated BAFs in the radish root ........................................................................................................ 159
7-7 Bioaccumulations factors (BAF) [average (n=3) and standard error (SE)] obtained in grains of soybean grown in field soils. ............................................ 159
7-8 Bioaccumulations factors (BAF) [average (n=3) and standard error (SE)] obtained in leaves of corn grown in field soils. ................................................. 159
7-9 Measured TCS soil concentrations in lettuce treatments (means; n = 3 or 4 and SD) before and after the plant accumulation study and the corresponding % disappearance. ............................................................................................. 160
7-10 Measured TCS soil concentrations in radish treatments (means; n = 3 or 4 and SD) before and after the plant accumulation study and the corresponding % disappearance. ............................................................................................. 160

13
7-11 Measured TCS soil concentrations in bahia grass treatments (means; n = 3 or 4 and SD) before and after the plant accumulation study and the corresponding % disappearance. ..................................................................... 160
8-1 Amount and schedule of leaching events for the empirical and stochastic irrigation regimes. ............................................................................................. 179
8-2 Average percent recoveries ± standard deviation of 14C (by combustion procedure) by depth in the control and biosolids treatment .............................. 179
8-3 Average percent extraction recoveries of 14C ± standard deviation in the top depth of the control and biosolids treatment. .................................................... 180
8-4 Speciation of 14C extracted ± standard deviation in the top depth of control and biosolids treatments for each irrigation regime. ......................................... 180
9-1 Human and ecological exposure pathways for land-applied biosolids (US EPA, 1995). ...................................................................................................... 204
9-2 Acute aquatic toxicity endpoints of TCS from published studies. ...................... 206
9-3 Chronic aquatic toxicity endpoints of TCS from published studies. .................. 207
9-4 Redefined human and ecological exposure pathways for land-applied biosolids. .......................................................................................................... 209
9-5 Data utilized for the calculation of RfD for humans and animals....................... 210
9-6 Various parameters used for conducting the preliminary risk estimation. ......... 211
9-7 Equations used to calculate screening level hazard indices (HI) (considering no TCS degradation). ....................................................................................... 216
B-1 Average bioaccumulation factors (BAF) in the radish and lettuce leaves after excluding the highest treatment (Trt 3). ............................................................ 229
C-1 Limits of detection, quantitation and percent recoveries for TCS and Me-TCS in various matrices. ........................................................................................... 230

14
LIST OF FIGURES
Figure page 1-1 Chemical structure of Triclosan [TCS; 5-chloro-2-(2,4-dichloro phenoxy)
phenol, CAS 3380-34-5] ..................................................................................... 33
2-1 Representative biosolids TCS concentrations collected from various sources.. ............................................................................................................. 39
3-1 Calculated octanol-water partitioning coefficient (log Kow) curve and dissociation diagram for TCS. ............................................................................. 52
4-1 Schematic of the biodegradation experimental design (Adapted from Snyder, 2009) .................................................................................................................. 76
4-2 Mean percent recoveries (n=4) of 14C-TCS in various fractions from biosolids-amended Immokalee fine sand (IFS) ................................................... 77
4-3 Mean percent recoveries (n=4) of 14C-TCS in various fractions from biosolids-amended Ashkum silty clay loam (ASL). ............................................. 78
4-4 Mean cumulative CO2 production ± standard error bars from biosolids-amended (a) Immokalee fine sand (IFS) (b) Ashkum silty clay loam (ASL) soil. ..................................................................................................................... 79
4-5 Typical RAD-TLC chromatograph (bottom) and a representative ―fingerprint‖ (top) for (a) week 0 extracts, (b) week 3-18 extracts. ......................................... 80
4-6 Chemical structure of Triclosan and Methyl triclosan ....................................... 80
4-7 Primary degradation half-life (d) estimated using a zero-order model from the proportions of 14C-detected as TCS and Me-TCS for biosolids-amended soils. ................................................................................................................... 81
5-1 The earthworm survival (%) as affected by the biosolids-borne TCS concentration and the duration of earthworm exposure, range-finding test ...... 104
5-2 The mean earthworm survival (%) (n=4) ± standard deviation as affected by the biosolids-borne TCS concentration and the duration of earthworm exposure, definitive toxicity test. ....................................................................... 105
6-1 Total CO2 evolution (mg) over various times in the (a) IFS and (b) ASL soils amended with biosolids spiked with a range of TCS concentrations, unreplicated range-finding test. ........................................................................ 127
15
6-2 NH4+-NH3 concentrations (mg kg-1) over time (Days 0-28) in the (a) IFS and
(b) ASL soils amended with biosolids spiked with a range of TCS concentrations, unreplicated range-finding test. ............................................... 128
6-3 N03--N02
--N concentrations (mg kg-1) over time (Days 0-28) in the (a) IFS and (b) ASL soils amended with biosolids spiked with a range of TCS concentrations, unreplicated range-finding test. ............................................... 129
6-4 Mean total CO2 (mg) as a function of TCS concentrations and time (Days 0-28) in (a) ASL and (b) IFS soils (like letters indicate no significant difference between treatments), definitive test. ................................................................. 130
6-5 Mean (a) NH4 –N and (b) N03
--N02--N concentrations (n=3) as a function of
biosolids TCS concentration and time (Days 0-28) in ASL soils ....................... 131
6-6 Mean (a) NH4 -N and (b) N03
--N02--N concentrations (n=3) as a function of
biosolids TCS concentration and time (Days 0-28) in IFS soils. ....................... 132
6-7 Average (n=3) well color development (AWCD) for the substrate types in the various soil samples developed 40 days after the incubation of the biolog plates. ............................................................................................................... 133
7-1 Representative photos of lettuce (A and B) and radish (C and D) plants that compare plant growth in the control and treatments.† ...................................... 161
7-2 Representative photos of bahia grass that compare plant growth in various TCS treatments.† ............................................................................................. 162
8-1 Percent recovery of the amount of water that was collected at bottom of the column at various intervals during the study period. ......................................... 181
8-2 Chloride breakthrough curves in control and biosolids-amended soils of the (a) empirical and (b) stochastic irrigation regimes. ........................................... 182
8-3 Prediction of chemical movement obtained using the CMLS model. The graph represents the depth of DCPA movement .............................................. 183
9-1 Log of predicted TCS concentrations (mg kg-1) assuming no TCS loss, and expected TCS concentrations (considering degradation) ................................. 218
B-1 Comparison of bioaccumulation factors in radish root (below-ground) and lettuce leaves (above-ground) .......................................................................... 229

16
LIST OF ABBREVIATIONS
BAF-QSAR Bioaccumulation Factor-Quantitative Structure-Activity Relationship
BASL4 Biosolids amended soil level four model
bw Body weight
ECOSAR Ecological Structure Activity Relationships
HPLC High Performance Liquid Chromatography
LC Lethal concentration
LC/MS Liquid Chromatography Mass Spectrometry
LD Lethal dose
LOAEC Lowest Observed Adverse Effect Concentration
LOD Limit of Detection
LOEC Lowest Observed Effect Concentration
LOQ Limit of Quantitation
MWRDGC Metropolitan Water Reclamation District of Greater Chicago
NOAEC No Observed Adverse Effect Concentration
NOEC No Observed Effect Concentration
OPPTS Office of Prevention, Pesticides and Toxic Substances
PBT Persistence, Bioaccumulation and Toxicity
QSAR Quantity Structure Activity Relationship
QSPR Quantitative Structure Property Relationship
RfD Reference dose
TNSSS Targeted National Sewage Sludge Survey
USEPA United States Environmental Protection Agency
wk Week
WWTPs Wastewater treatment plants

17
Abstract of Dissertation Presented to the Graduate School of the University of Florida in Partial Fulfillment of the Requirements for the Degree of Doctor of Philosophy
FATE, TRANSPORT, AND RISK ASSESSMENT
OF BIOSOLIDS-BORNE TRICLOSAN (TCS)
By
Manmeet Waria
May 2011
Chair: George O‘Connor Cochair: Gurpal Toor Major: Soil and Water Science
Triclosan (TCS) is an antimicrobial compound used in many personal care
products, and is a common constituent of domestic wastewater. Removal rates of TCS
in wastewater treatment plants are typically >95% and most of the TCS partitions
(accumulates) in sludge solids. Sludge processed to produce biosolids is often land
applied, and can transfer TCS to agricultural soils. The objectives of this research were
to evaluate the environmental fate and ecological effects of biosolids-borne TCS
following biosolids land application. As previously published TCS risk assessments
were based on the data derived from models or unpublished sources, we used
measured TCS concentrations, properties, fate, and transport data to conduct a more
realistic risk assessment. The TCS concentrations measured in representative biosolids
were 1 to 40 mg kg-1 (mean = 18 ± 12 mg kg-1). Water solubility measured at neutral pH
was 9 mg L-1, and increased to nearly 800 mg L-1 at two pH units above the pKa of ~8.
The log Kd of TCS in biosolids was 4.15 ± 0.03 and log Koc was 4.68 ± 0.07. A TCS
biodegradation study determined a primary degradation half-life of ~100 d and a
degradation product (Methyl TCS) was identified. Biosolids TCS concentrations of ≤105

18
mg kg-1 did not affect the earthworm survival, suggesting an estimated lethal TCS
concentration (LC50) >105 mg kg-1. Bioaccumulation factors (BAF) in earthworms were
4.3 to 12 depending on soil texture. Investigation of TCS effects on microbial processes
suggested that biosolids TCS concentrations ≤500 mg kg-1 had no significant effect on
the microbially-mediated processes. Plant bioaccumulation of TCS was minimal in
radish (BAF = 0.004) and bahia grass leaves (BAF = <0.001), but greater in lettuce
leaves (BAF = 0.04) and radish roots (BAF = 0.43). No significant leaching of TCS
occurred beyond the biosolids incorporation depth of 0 to 2.5 cm in amended soil. A
preliminary (multi-pathway, multi-target) risk assessment identified American woodcock
as the most sensitive species. A tier-2 assessment, utilizing less conservative
estimates, suggested minimal risk of biosolids-borne TCS to human and environmental
health, when biosolids are land applied in a sustainable manner.

19
CHAPTER 1 INTRODUCTION AND PROJECT OBJECTIVES
Background
Chemicals from domestic, municipal, industrial, or agricultural sources that are
present in the environment, but not commonly monitored are termed emerging
contaminants (ECs). The term ―emerging‖ does not infer that the chemicals are new, but
that the interest of scientific community in the chemicals is recent (Aga, 2009). Such
chemicals have been recently detected in a variety of matrices including surface water,
groundwater, sediments, and biosolids as a result of improved analytical capabilities.
One important group of ECs includes the pharmaceuticals and personal care products
(PPCPs). The primary route of PPCPs entry into the environment is through human use.
With expanding population and increased human use of PPCPs, the appropriate
treatment and disposal of these chemicals after use is becoming a cause of concern.
Wastewater produced by domestic use enters and is treated in wastewater treatment
plants (WWTPs). The products of the WWTPs are reclaimed liquid (effluent) and solid
(sludge). The liquid is typically discharged to surface waters and the solid, after
processing to reduce water content and pathogens, is called biosolids and is often
suitable for land application. Biosolids can contain a variety of ECs (such as PPCPs),
due to stability and sorption of ECs to organic rather than aqueous fraction during the
WWTP processing.
Options for biosolids disposal include land application, incineration and landfill
disposal. The nutrient-rich and organic nature of biosolids makes it a valuable resource
for land application to improve soil fertility and is currently considered the most suitable
way of biosolids disposal (Epstein, 2002). Despite the benefits of land application,

20
careful monitoring is essential to ensure the safe and sustainable reuse of biosolids.
The USEPA conducted four surveys over the years (1982-2009) to identify
contaminants in biosolids for possible regulatory action. One purpose of the most recent
survey (USEPA, 2009a) was to obtain information on the presence and levels of certain
contaminants of emerging concern (such as PPCPs). Triclosan (TCS) was included
among several hundred (n = 145) other chemicals such as polycyclic aromatic
hydrocarbons (PAHs), polybrominated diphenyl ethers (PBDEs), antibiotics, drugs,
hormones and steroids. The survey results suggested that land application of biosolids
can transfer several of the chemicals, including TCS, to the terrestrial environment in
sizeable amounts.
Triclosan [TCS, Irgasan DP 300 (trade name); 5-chloro-2-(2,4-dichloro phenoxy)
phenol, CAS 3380-34-5] is an antimicrobial compound active against gram-positive,
gram-negative bacteria, fungi and viruses. Triclosan is added to a variety of personal
care products, including soaps, detergents, and cosmetics for its sanitizing properties
(Heidler and Halden, 2007). Effectiveness of TCS as an antimicrobial agent is attributed
to inhibition of the enzyme enoyl-acyl carrier protein reductase that is involved in
bacterial lipid biosynthesis (Levy et al., 1999; Heath and Rock, 2000). Brausch et al.
(2010) suggested that algal sensitivity to TCS is due to the disruption of lipid
biosynthesis, membrane destablization (Lyrge et al., 2003; Franz et al., 2008) and
uncoupling of phosphorylation (Newton et al., 2005). The typical range of TCS
concentrations in personal care products is 0.1 to 0.3% (w/w), which is sufficient to
inhibit the activity of bacteria, molds, and yeasts (McAvoy et al., 2002).

21
Effects of TCS human exposure through personal care products are well studied.
Acceptance of wide usage of TCS containing personal care products is based on the
reports of no adverse effects of TCS on humans, except skin irritation and dermatitis
(Dayan, 2007). However, the use of TCS containing products for household purposes
and skin-care was implicated in the occurrence of TCS in human breast milk (<20-300
µg kg lipid wt-1) (Adolfsson-Erici et al., 2002; Ye et al., 2005), human urine (2.4-3790 µg
L-1) (Calafat et al., 2008), and blood (0.010 to 38 ng g-1) (Allmyr et al., 2006). Dayan
(2007) conducted a human risk assessment in children exposed to TCS-containing milk.
Even conservative estimates (highest reported TCS concentration in consumed milk) of
exposure represented minimal risk to children from the TCS present in the milk (Dayan,
2007). Other adverse effects that can impact humans have been suggested. Wang et
al. (2004) reported that TCS can act as a selective inhibitor of sulfotransferase and
glucuronosyl transferase enzymes with an inhibitory concentration (IC50) range of 430
to 2152 µg L-1 in the human liver. The two enzymes catalyze the conjugation of
xenobiotics, increasing their solubility, and promoting excretion from the human bodies.
James et al. (2010) suggested that TCS (concentration <0.03 µg L-1) might endanger
pregnancy in sheep by reducing the total placental estrogen secretion in target tissues
critical for the maintenance of pregnancy. A threshold of toxicological concern of 30 µg
kg-1 d-1 was estimated to represent the highest dose to which a person could be
exposed over a lifetime with no expected adverse health effect (EPHC, 2008). Several
risk assessments conducted based on the toxicological, phramacokinetic and clinical
data suggested limited toxicity of TCS from personal care products (Rodricks et al.,

22
2010; Barbolt, 2002; Gilbert and McBain, 2002; Moss et al., 2000). Thus, human effects
are deemed inconsequential, and are not directly studied here.
Following use, much of the unused TCS becomes a component of domestic
wastewater. The products of WWTPs are liquids (effluents) and solids (sludge).
Processed sludge forms biosolids, which may then be land applied. Despite monitoring
data demonstrating significant TCS removal (98 ± 1%, Heidler and Halden, 2007) in
activated sludge (consists of aerobic conditions promoting biological processes)
systems, the relative roles of biodegradation and sorption in TCS removal from influents
are not conclusively documented (Heidler and Halden, 2007; McAvoy et al., 2002;
Sabaliunas et al., 2003; Singer et al., 2002). Bester (2003) reported 30% TCS sorption
on sludge, whereas Heidler and Halden (2007) estimated that 50 ± 19% of TCS
accumulated in the sludge and 48 ± 19% was biotransformed in a full scale activated
sludge treatment unit.
The 2002 USGS survey of 139 streams expected to be influenced by WWTPs
effluent detected TCS in over 60% of the streams at a median concentration of 0.14 µg
L-1 and a maximum of 2.3 μg L-1 (Kolpin et al., 2002). Triclosan was one of the five most
frequently detected contaminants, behind widely recognized contaminants such as
coprostanol, cholesterol, N, N-diethyl toluamide, and caffeine. Recently, Brausch and
Rand (2010) reported the detection of TCS in 57% of the surface water (rivers, streams)
samples with a median concentration ~0.05 μg L-1. Benotti et al. (2009) surveyed 19
drinking water treatment plants where the source water was impacted by wastewater
and reported TCS median concentration of 0.003 μg L-1 (detected in six plants) in
source water, and 0.0012 μg L-1 (detected in one plant) in finished drinking water.

23
Detection of TCS in aqueous systems is of concern because TCS can photo-degrade to
dioxins (Latch et al., 2005), and the binuclear aromatic ring of TCS (Figure 1-1) is also
present in dioxins. Halden and Paull (2005) and Heidler and Halden (2007) opined that
the structural similarity suggests that TCS may persist and bioaccumulate in a manner
similar to dioxins. Adverse effects of TCS in various aquatic species are illustrated in
Table 1-1. A species sensitivity distribution (SSD) diagram is another approach to
identify the aquatic risk of TCS. Capdevielle et al. (2008) conducted a risk assessment
of TCS in freshwater environments using the SSD approach. The toxicity distribution
was constructed based on chronic toxicity data for several (n=14) aquatic species, and
represents a more realistic threshold of toxicity values (as it considered multiple
species) as compared to no effect concentration approach based on a single most
sensitive species (e.g., data in Table 1-1). Ratios of the predicted environmental
concentration (PEC) to the predicted no effect concentration (PNEC) ratios were <1 for
most aquatic populations, suggesting low risks to even the most sensitive aquatic
species (Capdevielle et al., 2008). Thus, the risk to sensitive species is low even at the
highest likely exposure, which typically occurs immediately downstream of WWTPs.
Capdevielle et al. (2008) opined that, at current TCS usage, TCS is not expected to
adversely impact aquatic species. Although the TCS aquatic effects are important
based on the toxicity data (Table 1-1), the Capdevielle et al. (2008) study results
suggested minimal aquatic TCS effects. Therefore, the focus of the present study is on
the occurence of TCS in soils impacted by land-applied biosolids.
In the US, WWTPs generate approximately 7 million Mg of biosolids each year
(USGS, 2008), of which 63% (National Research Council, 2002) is land applied.

24
Biosolids TCS concentrations have been reported in several recent studies (Langdon et
al., 2011; McClellan and Halden, 2010; Cha and Cupples, 2009; Xia et al., 2009; Heilder
and Halden, 2009; USEPA, 2009a) and suggest a representative concentration range of
10 to 20 mg kg-1 in typical biosolids. Reported TCS concentrations in the extensive (78
WWTPs) 2009 Targeted National Sewage Sludge Survey (TNSSS) (USEPA, 2009a)
were 0.4 to 133 mg kg-1 with an overall mean of 16 ± 65 mg kg-1 (including statistical
outliers). The treatment plants selected for the survey received secondary treatment or
better, but the final products included some materials that were not processed to meet
land application standards with respect to disinfection and chemical removal usually
obtained by tertiary treatment (USEPA, 2009a). Assuming a TCS concentration of 16
mg kg-1 (mean from TNSSS) in activated sludge, an estimated 1.5-6.5×10⁴ kg year-1
TCS is land applied nationwide. The mass estimate would differ depending on the
actual concentration of TCS in the biosolids, but the practice of biosolids land
application clearly represents a mechanism for introducing substantial amounts of TCS
into the environment. Reports of TCS presence in earthworms (Kinney et al., 2008),
algae, snails (Coogan et al., 2007; 2008) and in dolphin‘s plasma (0.18 ng g wet wt-1;
Fair et al., 2009) highlight the ability of TCS to accumulate in a variety of organisms.
Additionally, some worry that the TCS present in the environment could contribute to the
spread of antibacterial resistance and could threaten human drug therapy (Birosova and
Mikulasova, 2009; Pycke et al., 2010; Rooklidge, 2004; McMurry et al., 1998).
Little is known about the risk of biosolids-borne TCS that is land applied. Risk
quantification of a chemical requires information on the toxicity of the chemical, as well
as exposure. The presence of chemical in the environment is not a hazard unless

25
humans or other organisms are exposed to concentrations sufficient to induce an
adverse effect. Further, the adverse effect will vary with exposure times, and depend on
whether an exposure is chronic or acute especially if a chemical has endocrine effects.
The environmental fate and transport of biosolids-borne TCS is particularly important to
identify the relevant exposed populations and to conduct meaningful environmental and
human health risk assessments.
Various studies characterized components of TCS behavior in non biosolids
amended (un-amended) soils, but few studies focused on biosolids-amended soils. The
average half-life of TCS estimated from studies (Kwon et al., 2010; Lozano et al., 2010;
Higgins et al., 2011; Walters et al., 2011) conducted in amended soils was generally
>100 d, i.e., TCS was deemed persistent. Further, various studies (e.g. Miyazaki et al.,
1984; McAvoy et al., 2002; Lindstrom et al., 2002, Coogan et al., 2007; 2008)
suggested that TCS was methylated to Me-TCS in effluents, biosolids, fish bodies,
algae, and snails. However, it is uncertain if Me-TCS is formed in biosolids-amended
soils, and if it persists or is further mineralized to CO2. Limited data available for Me-
TCS partitioning suggest that Me-TCS is more hydrophobic (log Kow = 5.2) than TCS
(log Kow = 4.8) (Boehmer et al., 2004), and likely to be less bioavailable than TCS.
Earthworm toxicity data in un-amended soils suggest minimal toxicity of TCS to
earthworms (Higgins et al., 2011). The bioaccumulation data were variable in
earthworms grown in TCS spiked un-amended soil, and in biosolids-amended soil,
creating a need for a definitive assessment. Waller and Kookana (2009) and Butler et
al. (2011) suggested inhibitory effects of TCS on some microbially-mediated reactions
and on microbial community structure in soil (no biosolids). Triclosan may behave

26
differently in biosolids-amended soil due to reduced bioavailability of TCS, and needs
further investigation.
Plant TCS accumulation was reported (Wu et al., 2010) in a single crop
(soybean, Glycine max) grown in a biosolids-amended soil, but the study was
confounded by the use of biosolids with extremely low solids content (19 g L-1 vs avg of
300 g L-1). A chemical‘s transport potential and bioavailability is likely influenced by the
type of biosolids applied to the soils (Edwards et al., 2009). Model estimated leaching
potential of TCS was minimal in amended soils (Cha and Cupples, 2010). Another
antimicrobial chemical, [i.e., triclocarban, (TCC)] was minimally phytoaccumulated and
leached (Snyder et al., 2011) in a biosolids-amended soil. The same study reported
formation of TCC bound (non-extractable) residues. We speculated that because TCS
has a reported range of low water solubility values (1.9-17 mg L-1) and because the
partitioning coefficient of TCS (log Koc = 4.3) is even greater than TCC (log Koc = 3.88)
(Agyin-Birikorang et al., 2010), TCS should tend to partition onto soils and sediments.
Fuhr et al. (1998) defined bound residues as ―compounds in soil, plant, or animal which
persist in the matrix in the form of the parent substance or its metabolite(s) after
extractions. The extraction method must not substantially change the compounds
themselves or the structure of the matrix‖. Due to high partitioning coefficient of TCS
(log Kd = 2.3), it is expected to form bound residues and have minimal potential of
leaching and phytoaccumulation in biosolids-amended soils, as with TCC. Several
ecological risk assessments were conducted recently (Reiss et al., 2009; Fuchsman et
al., 2010; Langdon et al., 2010) that addressed the risk of TCS from biosolids-amended
soils. Langdon et al. (2010) quantified the risk to aquatic organisms from surface runoff

27
and leaching of TCS from biosolids-amended soils and found some hazard to the most
sensitive aquatic species; but, acknowledged that the risk might have been
overestimated. Both Reiss et al. (2009) and Fuschman et al. (2010) suggested minimal
risk to terrestrial organisms from biosolids-borne TCS, but most of the data utilized in
the assessments were derived from models or extracted from unpublished sources.
Thus, a characterization of biosolids-borne TCS fate, transport and risk assessment
based on measured data is necessary.
Based on the available literature for TCS, appropriate hypotheses for the project were
formulated as follows:
Biosolids-borne TCS and its metabolites are persistent (half-life >60d) in the environment.
Biosolids-borne TCS forms bound residues of limited bio- and environmental-lability.
Exposure to biosolids-borne TCS poses minimal risk to soil micro and macro organisms.
Biosolids-borne TCS has minimal mobility (leaching tendency) and phytoavailability.
Biosolids-borne TCS poses minimal risk to human and environmental health.
The ultimate goal of our study was to perform a human and ecological health risk
assessment of biosolids-borne TCS. The following intermediate objectives were
designed to test the first four hypotheses and to obtain data required to fulfill the
ultimate objective.
Objective 1: Quantify TCS Concentrations in Biosolids
The largest database of biosolids TCS concentrations is the 2009 TNSSS
(USEPA, 2009a), representing 78 WWTPs across the U.S. Reported TCS
concentrations range from 0.4 to 133 mg kg-1 (mean = 16 ± 65 mg kg-1, including
statistical outliers). The large variability in the TNSSS data likely represents inclusion of

28
some unique WWTPs producing sewage sludge with exceptionally high (minimally
processed) and low (probably processed by tertiary treatment) product concentrations
of TCS. Our objective was to determine the TCS concentration in additional biosolids.
Biosolids analyzed in our study included some from the TNSSS (USEPA, 2009a), and
some from WWTPs managed by Metropolitan Water Reclamation District of Greater
Chicago (MWRDGC). The biosolids from MWRDGC were chosen as the District serves
a large metropolitan area and because the MWRDGC biosolids TCS concentrations
were expected to be modest. The low initial concentrations were particularly useful for
our studies as we tested the effect of variable (spiked) TCS concentrations on various
microbial phenomena (microbial respiration, nitrification and ammonification) (Chapter
2).
Objective 2: Determine/Verify Basic Physico-Chemical Properties of TCS
Chemical‘s water solubility and partitioning coefficients (Kow, Kd and Koc) are
critical to characterizing the fate and transport of environmental contaminants. Solubility
and partitioning behavior relate to a chemical‘s availability for degradation, leaching,
plant uptake and bioaccumulation in organisms. Conflicting TCS solubility data exist in
the literature, making accurate predictions of environmental fate and transport
problematic. The water solubility of TCS was measured at various pH values as TCS is
a weak acid and is expected to be more soluble at pH values greater than its acid
dissociation constant (pKa). In addition, the partitioning coefficient of TCS in various
biosolids was determined (Chapter 3). Agyin-Birikorang et al. (2010) measured the
partitioning coefficients (Kd and Koc) of TCS in biosolids and biosolids-amended soils.
But, the coefficients of TCS inherent to biosolids have not been determined. The
inherent coefficients are likely to be greater than the coefficients in spiked systems as

29
inherent TCS is expected to be thoroughly incorporated and evenly distributed within
the organic component of the biosolids.
Objective 3: Determine the Degradation (Persistence) of Biosolids-Borne TCS
Knowledge of a chemical‘s persistence is fundamental to estimating the
chemical‘s fate and transport in the environment. Further, chemicals may degrade to
form metabolites that may be more hydrophilic or lipophilic than the parent and behave
differently. Persistence of TCS in aerobic soils and sediments is reasonably well
studied, but TCS degradation in biosolids-amended soils is less studied. A few studies
reported degradation of TCS in amended soils, but the half-lives were based on the loss
of extractable TCS with time, and may not be accurate as loss of extractable TCS may
simply represent the conversion of extractable TCS to non-extractable (bound residue)
forms. We utilized biosolids spiked with 14C-TCS to determine the degradation
(mineralization/ primary degradation) potential of TCS in two biosolids-amended soils,
identified the metabolites and assessed the bound residue formation (Chapter 4).
Objective 4: Determine the Impacts of Biosolids-Borne TCS to Soil Organisms
Accurate estimates of TCS toxicity and bioaccumulation are critical to conduct
ecological and human health risk assessments. A few researchers [e.g., Kinney et al.
(2008); Higgins et al. (2011)] have directly addressed the effect of biosolids-borne TCS
on terrestrial organisms. However, the results were confounded either by the detection
of significant amounts of TCS in the control soil or by the lack of sufficient number of
replicates. We conducted a laboratory study (USEPA, 1996b) using spiked biosolids to
investigate the toxicity and bioaccumulation of biosolids-borne TCS to earthworms.
Further, long-term bioavailability of TCS, was estimated by utilizing earthworms recently

30
collected from a field soil amended with biosolids two years earlier at a high application
rate (Chapter 5).
Objective 5: Determine the Toxicity of Biosolids-Borne TCS on Microbial Reactions
Triclosan can affect the rate of microbial reactions like respiration and nitrification
in un-amended soil systems (Waller and Kookana, 2009; Butler et al., 2011). To our
knowledge, however, potential impacts of biosolids-borne TCS on soil micro-organisms
or microbially-mediated reactions have not been published. We examined the impacts
of biosolids-borne TCS on microbial processes using USEPA (1996c) methods in two
soils with contrasting physico-chemical properties. Further, changes in microbial counts
and community structure due to biosolids-borne TCS are not known, and may affect
ecosystem processes (such as nutrient recycling) and the effectiveness of microbial
invasions (such as growth of pathogens) (Garland, 1997). We utilized several sets of
biosolids-amended soils to perform bacterial counts and to quantify changes in
microbial community structure. A direct bacterial count method (Matsunaga et al., 1995)
and biolog ECO plates were utilized to quantify the effects of biosolids-borne TCS
(Chapter 6).
Objective 6: Quantify the Phytoavailability of Biosolids-Borne TCS
Literature provides evidence of plant accumulation of polar and non-polar organic
compounds. A few studies of TCS toxicity and accumulation were conducted in soil-less
cultures (Herklotz et al., 2010), un-amended soils (no biosolids) (Liu et al., 2009) and
saturated systems (wetlands) (Stevens et al., 2009) that suggested the possibility of
TCS plant accumulation from land-applied biosolids. Because chemical toxicity and
bioaccumulation can vary with the species tested (Duarte-Davidson and Jones, 1996),

31
we utilized four plant species representing monocotyledons (monocots), dicotyledons
(dicots), above-ground (leaves), and below-ground (roots) biomass as well as grasses.
A field-equilibrated soil previously amended with a high biosolids application rate was
utilized as the growth media for the plants (Chapter 7).
Objective 7: Quantify the Leaching Potential of Biosolids-Borne TCS
Despite the occurrence of TCS in biosolids, and frequency of biosolids land
application, little is known about the mobility of TCS in biosolids-amended soils. The
partition coefficient of TCS (log Koc = 4.26; Agyin-Birikorang et al., 2010) measured in
amended soils suggests that TCS has a propensity to partition onto soils and sediments
in the environment. Our study explored the mobility of TCS in a biosolids-amended soil
subjected to repeated irrigations (Chapter 8).
Ultimate Objective: Risk Assessment of Biosolids-Borne TCS
Several ecological risk assessments were conducted recently (Reiss et al., 2009;
Fuchsman et al., 2010; Langdon et al., 2010) but most of the data used in the
assessments were derived from models or extracted from unpublished sources.Thus, a
characterization of biosolids-borne TCS behavior, and a risk assessment based on
measured data are necessary.
Studies mentioned in each of the intermediate objectives are described in
Chapters 2 to 8. Each intermediate objective is presented as a separate chapter in the
dissertation, and each chapter has specific hypotheses and objectives. Data
accumulated from our studies and from published sources were used to identify various
pathways of TCS exposure from biosolids land-application practices, and to perform an
integrated human and ecological risk assessment of biosolids-borne TCS applied to

32
soils (Chapter 9). Suggestions for the future direction of biosolids-borne TCS work are
included.

33
Table 1-1. Toxicity end-points of TCS for some aquatic species
a no-observable-adverse-effect-level,
b effective concentration,
c lethal concentration,
d inhibitory
concentration
Figure 1-1. Chemical structure of Triclosan [TCS; 5-chloro-2-(2,4-dichloro phenoxy) phenol, CAS 3380-34-5]
Toxic effect Species Toxicity endpoint Reference
Endocrine disruption
Activation of the human pregnane X receptor
>2870 µg L-1
Jacobs et al. (2005)
Toxic effects
Rainbow trout (Oncorhynchus mykiss)
NOAELa of 71.3 µg L-1 Orvos et al. (2002)
Toxic effects
Daphnia magna EC50b of 390 µgL-1 Orvos et al. (2002)
Toxic effects
Amphibian larvae (Xenopus laevis)
LC50c of 259 µgL-1 Palenske et al.
(2010)
Gene expression
American bullfrog (Rana catesbiana)
0.15-1.4 µg L-1 Veldhoen et al. (2006)
Growth
Freshwater microalga (Pseudokirchneriella subcapitata)
72-h IC50d of 0.53 µg L-1 Yang et al. (2008)
Genotoxic and cytotoxic effects
Zebra mussel hemocytes
0.692 ngL-1 Binelli et al. (2009)

34
CHAPTER 2 BIOSOLIDS-BORNE TCS CONCENTRATIONS
Background
Numerous biosolids TCS concentrations are reported in the literature. The mean
TCS concentration of 12.6 ± 3.8 mg kg-1 was reported for the composited biosolids
archived from the 2001 Targeted National Sewage Sludge Survey (TNSSS) (McClellan
and Halden, 2010). The largest database of biosolids TCS concentrations is the 2009
TNSSS report (USEPA, 2009a), and reports a TCS concentration range of 0.4 to133 mg
kg-1 (mean=16 ± 65 mg kg-1, including statistical outliers) representing 78 WWTPs
sampled in the survey. The WWTPs selected for the survey received secondary
treatment or better, but the final products included some materials not processed to
meet land application standards (USEPA, 2009a). Some of the WWTPs in the survey
were likely not as efficient in removing TCS. Thus, the large variability in the TNSSS
data might represent some unique WWTPs producing sewage sludge with exceptionally
high (minimally processed) and low product concentrations (probably processed by
tertiary treatment) of TCS. Biosolids analyzed in our study included some from the
TNSSS (USEPA, 2009a), and some from WWTPs managed by Metropolitan Water
Reclamation District of Greater Chicago (MWRDGC). Our objective was to determine
the TCS concentration in representative biosolids including the biosolids utilized in our
experiments.
Material and Methods
Fifteen biosolids were analyzed to determine the TCS concentrations as
described in Heidler et al. (2006). Four biosolids samples were collected by the
MWRDGC personnel and promptly shipped to the laboratory on ice packs. The samples

35
were frozen (-20°C) until analysis. We also utilized biosolids collected for a previous
triclocarban project (biosolids also utilized in the TNSSS by USEPA, 2009) which were
frozen at -20°C until analysis. Briefly, the biosolids samples were thawed, lyophilized,
and 1 g (dry wt. equivalent) samples were extracted twice with 20 mL of methanol
(MeOH) + acetone (50:50, v/v) in triplicate. The samples were shaken for 18 h on a
platform shaker, followed by sonication (2 h) (Branson 2210, Danbury, CT; temp. 40°C,
60 sonications min-1). The extract was centrifuged at 800 x g, dried under N2 gas and
reconstituted in 50:50 MeOH: Milli-Q water. The samples were then fortified with TCS-
d7 internal standard and analyzed by Liquid Chromatography Mass Spectrometry
(LC/MS) (TSQ Quantum, Thermo Scientific, Williston, VT, USA). Chromatography was
performed on Phenomenex Luna C18 column (3 µm particle size, 2×100 mm;
Phenomenex, Inc., Torrance, CA) with sample injection volume of 5 µL min-1. The
mobile phase consisted of water: MeOH with 1mM ammonium acetate at a flow rate of
300 µL min-1. The gradient consisted of 25:75 water: MeOH (held for 1 min), increasing
to 0:100 (water : MeOH) held for 5 min. and decreasing back to 25:75 water: MeOH
(over 0.5 min). Mass spectrometry was performed using selective ion monitoring in
negative ionization mode. Linear calibration consisted of eight standard levels (0-500 ng
g-1). Detection was based on a characteristic molecular ion TCS (m/z 287) as well as
TCS with the naturally occurring isotope 37Cl (m/z 289, 291). The TCS concentrations
were corrected for the TCS recoveries (recovery = 64 ± 5%) determined by spiking
known 14C-TCS activities in the biosolids. The samples ran for 12 min with an average
retention time of 8 min. The limit of detection (LOD) was 0.40 ng g-1 and limit of
quantitation (LOQ) was 1.3 ng g-1. The LOD and LOQ values were calculated as 3-fold

36
and 10-fold, respectively, the standard deviation in the signal from multiple runs of the
lowest calibration standard (Signal/Noise >10) (USEPA, 1984). The details of detection
limits and recoveries are provided in the Appendix C.
Results and Discussion
The measured TCS concentrations in 15 biosolids were 0.40 to 40 mg kg-1 with
an average of 18 ± 12 mg kg-1 and a median concentration of 21 mg kg-1 (Table 2-1).
The average and median concentrations are consistent with the mean 2009 TNSSS
(USEPA, 2009a) value (16 ± 65 mg kg -1), and the mean (12.6 ± 3.8 mg kg-1) of
composited samples archived from the 2001 TNSSS (McClellan and Halden, 2010).
The majority of the biosolids analyzed in our study were anaerobically digested, but
differences in TCS concentrations could have occurred due to differences in digestion
periods (time), inputs, or dewatering methods (air-dried vs cake) (Table 2-1). The
measured unpublished and published biosolids TCS concentrations are summarized in
Figure 2-1. The Figure 2-1 illustrates variability in TCS concentrations (0.4-133 mg kg-1)
in a variety of biosolids including the ones from our study and other studies from U.S,
Canada, Australia, Spain and Germany. A typical representative range of biosolids TCS
concentration appears to be ~10 to 20 mg kg-1 (Figure 2-1), consistent with the mean
TCS concentration (16 ± 65 mg kg-1) reported in the 2009 TNSSS (USEPA, 2009a). Xia
et al. (2010) found significantly greater median TCS concentrations in un-composted
(9.6 mg kg-1) biosolids than in composted (1.2 mg kg-1) biosolids obtained from 16
WWTPs located in Georgia, South Carolina, Colorado, Illinois, and California. They also
observed greater TCS concentrations in biosolids obtained from WWTPs serving
residential areas than industrial areas (Xia et al., 2010). Xia et al. (2010) results suggest
37
that TCS concentrations can vary widely, but the concentrations are consistent with the
wide range of TCS concentrations reported in the 2009 TNSSS and in our study.
Of particular interest were the biosolids (anaerobically digested) obtained from
MWRDGC, as the District serves a large metropolitan area and much of the biosolids is
land applied. The TCS concentrations averaged 6 mg kg-1 in air-dried and 7 mg kg-1 in
centrifuge cake samples of Stickney plant biosolids. Calumet plant samples had
average TCS concentrations of 0.4 ± 0.0 mg kg-1 in air-dried and 4.7 ± 0.1 mg kg-1 in
centrifuge cake samples. Our values for the Stickney plant are consistent with data for
the TCS concentration (6.4 ± 0.3 mg kg-1) of composited three year samples
(dewatered) reported by Higgins et al. (2011). Triclosan concentrations in all MWRDGC
materials were less than the nationwide representative concentration range (~10 to 20
mg kg-1) (Figure 2-1). If the samples of biosolids furnished to us or the concentrations
reported for composited samples (Higgins et al., 2011) are truly representative of the
products produced year-round, the TCS concentrations in biosolids produced by major
Chicago WWTPs can be regarded as modest to low. The concentrations are much
smaller than values of 16 ± 65 mg TCS kg-1 (USEPA, 2009a) and 30 ± 11 mg TCS kg-1
(Heidler and Halden, 2007), suggesting that the initial environmental and human health
concerns expressed by Heidler and Halden (2007) based on an assumed TCS
concentration of 30 mg kg-1 may be over-estimated. The lower concentrations of TCS in
biosolids from Stickney and Calumet WWTPs, however, do not necessarily mean
minimal risk to human or the environmental health. Concerns about biosolids-borne
persistence, environmental fate, phytoavailability and mobility require quantification, as
outlined in the later chapters.

38
Table 2-1. Triclosan (TCS) concentrations in fifteen biosolids (n = 3) obtained from wastewater treatment plants across the U.S.
Biosolids ‡ Identification † Treatment Process
TCS content mg kg-1
UNKB Anaerobic digestion 33 ± 0.7 UNKC Anaerobic digestion (33 d) 21 ± 0.8 UNKD Anaerobic digestion 40 ± 3 UNKE Anaerobic digestion 22 ± 0.4 UNKF Anaerobic digestion 20 ± 1 UNKG Anaerobic digestion 31 ± 0.6 UNKH Anaerobic digestion 25 ± 1 UNKI Anaerobic digestion 1 ± 0.1 UNKJ Unknown 22 ± 0.4 UNKK Unknown 23 ± 1 UNKL Unknown 11 ± 2 CHBC Stickney water
reclamation plant, Chicago
Anaerobic digestion (air-dried)
6
CLBC Stickney water reclamation plant,
Chicago
Anaerobic digestion (centrifuged cake)
7 ± 0.3
CHAD Calumet water reclamation plant,
Chicago
Anaerobic digestion (air- dried)
0.4 ± 0.0
CHCC Calumet water reclamation plant,
Chicago
Anaerobic digestion (centrifuged cake)
4.7 ± 0.1
Overall average 18 ± 12
† Empty boxes represent the treatment plants whose locations are unknown ‡ Acronyms are given for identification purposes only

39
Figure 2-1. Representative biosolids TCS concentrations collected from various
sources. The n represents the number of biosolids samples. For McClellan and Halden (2010) n = 110 representing composite biosolids from 94 wastewater treatment plants.
Represents the 95th percentile value for TCS concentration in the 2009 TNSSS (USEPA, 2009a) Represent our qualitative assessment of the range of typical, representative TCS concentrations in biosolids.
0
20
40
60
80
100
120
140T
CS
(m
g k
g-1
) 25thPercentile
Minimum
Mean
Maximum
75thPercentile

40
CHAPTER 3 BASIC PHYSICO-CHEMICAL PROPERTIES OF TCS
Background
Chemical solubility and partitioning coefficients (Kow, Kd and Koc) are important
factors for characterizing the fate and transport of environmental contaminants.
Relationships between solubility, Kow and Koc are often (log-log) linear, but the specific
relationship varies with the class of compounds (Lyman, 1990). The relationships can
be used to calculate Koc from the available Kow and solubility data. In general, adsorption
of a contaminant is directly related to the partitioning coefficient and inversely related to
contaminant solubility (Comfort et al., 1994).
Water solubility is an important chemical property that strongly influences a
compound‘s environmental transport, bioavailability, and degradation rate (Delgado,
2002). Conflicting TCS solubility data exist in the literature, making accurate predictions
of environmental fate and transport of TCS problematic. Solubility values calculated
from the Ecological Structure Activity Relationships (ECOSAR) model and PBT
(Persistence, Bioaccumulation and Toxicity) Profiler vary from 1.97-4.6 mg L-1 (Halden
and Paull, 2005) (Table 3-1). Actual solubility measurements vary from 10 mg L-1 (Ciba
Speciality Chemicals, 2001a) to 17 mg L-1 (MITI, 1992). The variability in the reported
and the modeled values of solubility requires resolution. The pKa value of TCS is
reported as 8.14 (Jakel, 1990) and TCS water solubility is expected to vary significantly
with pH because the weak acid dissociates to a more soluble form as pH approaches
and exceeds the pKa of TCS.
The octanol-water partition coefficient (Kow) is the ratio of the concentration of a
chemical in octanol and in water at equilibrium at a specified temperature. Octanol is an

41
organic solvent regarded as a surrogate for hydrophobic lipids. The Kow value is used in
many environmental models, e.g., Bioaccumulation Factor-Quantitative Structure-
Activity Relationship (BAF-QSAR) and Quantitative Structure Property Relationship
(QSPR) to estimate the fate of chemicals in the environment. The Kow also provides an
estimate of a chemical‘s potential to bioaccumulate and bioconcentrate in the food-web
(Dimitrov et al., 2003).
The log octanol/water partition (Kow) coefficient of TCS is calculated to be 4.8 (at
25°C, pH 7) using KowWIN model (Halden and Paull, 2005) (Table 3-1). The model
estimates log Kow values of organic chemicals using an atom/fragment contribution
method developed by Syracuse Research Corporation. Experimentally determined
values of TCS are similar: log Kow, 4.76 (Lei and Snyder, 2007; Wezel and Jager, 2002),
and 4.70 (Ying et al., 2007) (Table 3-1). Although the collective data are in close
agreement, the pH values at which the Kow measurements were made are not known
and Kow is expected to decrease at pH ≥ pKa values. We calculated TCS dissociation
and log Kow values as a function of pH using an equation that estimates the log Kow of
chlorophenols with varying pH (Nowosielski and Fein, 1998). Calculations suggest
decreases in log Kow of TCS at pH values above pKa. The Kow vs pH curve (Figure 3-1)
closely resembles an acid dissociation curve, but is offset to higher pH values. Log Kow
values are minimally affected at pH≤pKa, but a significant decrease at greater pH
values. The predicted log Kow becomes pH-independent at pH ≥ pKa+3, with a value 2.9
log units less than normally assessed (Figure 3-1). A decrease in log Kow values at
higher pH predicts lower concentrations partitioned to biosolids and greater
concentration in the aqueous phase during sewage treatment involving lime stabilization

42
(pH = 12). However, such high pH values are not common in most conventional sewage
treatment or biosolids-amended soil systems.
The consistency of log Kow literature values (4.8 and 4.76) and the negligible
change in log Kow values predicted at pH values (<7) representative of most sewage
treatment systems (or amended soils) convinced us that it was unnecessary to conduct
measurement of Kow at different pH values. However, variation of TCS solubility with pH
has not been addressed. Therefore, we measured the TCS solubility at pH = pKa (8.14)
and 2 units above (10.14) and below (6.14) the pKa.
Mobility of TCS in biosolids-amended soil determines the potential for soil and
groundwater contamination. The relatively high log Kow (4.8) of TCS suggests extensive
retention in (or on) biosolids and limited transport in soil systems, but, mobility may vary
with the soil pH. Recent data obtained for a sandy loam and a silt loam soil (no added
biosolids) using spiked TCS concentrations of 0.2, 0.5,1 and 2 mg L-1, suggest relatively
low values of log Kd of ~2.4 and log Koc of ~2.3 (Karnjanapiboonwong et al., 2008).
Other estimated and measured values of log Koc reported are much greater: 4.26
(estimated, Ying et al. 2007) and 4.6 (measured, Heim, 1997), and a log Kd of 4.3
(measured Heim, 1997). The partitioning coefficients of added TCS in biosolids (Kd and
Koc) or in biosolids-amended soils have not been determined.
Alternatively, Kd and Koc can be measured directly in biosolids (―inherent Kd and
Koc‖) (Carballa et al., 2008). Triclosan entering WWTPs is present throughout the entire
biosolids production process. The compound ―ages‖ as an inherent component of the
solid fraction from the time TCS enters the waste stream to eventual biosolids land-
application. As such, biosolids-borne TCS is expected to be thoroughly incorporated

43
and evenly distributed within the organic component of the biosolids. A spike,
alternatively, is added to the exterior of the matrix and allowed to react after the
biosolids are produced. A TCS spike is not expected to sorb as completely or uniformly
as an inherent component of biosolids within the time frame of a typical partitioning
experiment (<24 h). A Kd value estimated using a spiked matrix could then
underestimate the true solid-phase partitioning of hydrophobic compounds, such as
TCS. Inherent Kd values were measured for a similar compound TCC (Triclocarban) in
several biosolids and differed from spiked Kd values (Snyder, 2009). We measured the
inherent Kd and Koc values of TCS in various biosolids.
Material and Methods
Solubility
Water solubility was measured according to the EPA standard method guideline
of Office of Prevention, Pesticides and Toxic Substances (OPPTS) 830.7840 (USEPA,
1996a). The OPPTS is now renamed to Office of Chemical Safety and Pollution
Prevention (OCSPP) but the guideline remains identified as OPPTS, and is used
throughout the dissertation. The EPA guidance describes three major methods (shake-
flask, generator column, column elution) for the solubility measurement depending on
the expected solubility of the compound. The shake flask method is intended for
compounds with solubilities >10 mg L-1, whereas the column elution method is intended
for compounds with solubilities ≤10 mg L-1. The literature contains variable TCS
solubility values, but measured values are reportedly >10 mg L-1. Thus, the simple
shake flask method was employed in our study. Solubility measurements were
performed at pH values two units above and below the pKa as well at pH = pKa. A
preliminary test was performed to estimate the quantity of TCS necessary to saturate

44
the desired volume of water. Approximately 5× the quantity of material determined in the
preliminary test was weighed into nine Teflon tubes (3 replicates for each pH value) with
stoppers. Water (30 mL) was added to the 40 mL tubes and the pH of the water was
adjusted to 6.14, 8.14 and 10.14. The pH adjustment was performed by adding acid
(HCl) or base (KOH) to attain target pH values. The tubes were then agitated at room
temperature (20-25°C). Additional monitoring of pH was conducted every 12 h during
the initial 24 h agitation and at each 24 h after wards. At sampling times of 1, 2 and 3 d
the tubes were removed and 1mL of the aliquot was collected The 1 mL of water
removed was replaced by adding 1 mL additional water to maintain constant volume of
the solution. The removed aliquot was centrifuged (8000 × g) for 10 min and the TCS
concentration in the clear aqueous sample was measured. Samples were quantified on
LC/MS (Thermo scientific discovery max TSQ Quantum) in negative ionization mode.
Chromatography was carried out on C18 column (5 µm particle size, 2.1 x100 mm;
Phenomenex). Mobile phase consisted of water: MeOH with 1mM ammonium acetate at
a flow rate of 300 µL min-1. The gradient consisted of 25:75 water: MeOH (held for 1
min), increasing to 0:100 (water : MeOH), held for 5 min. and decreasing back to 25:75
water: MeOH (up to 12 min). Linear calibration consisted of eight standard levels (0-500
ng g-1). The TCS quantification was performed by the isotope dilution method using the
13C12 internal standard with a run time of 12 min. The ion monitoring was performed at
m/z values of 287 for TCS and 293 for 13C12 TCS. The m/z of 289, 291, 295 and 297
were used as qualifying ions due to the presence of naturally occurring 37Cl atoms in the
organic molecules.The limit of detection (LOD) was 0.4 ng mL-1 and the limit of
quantitation (LOQ) was 1 ng mL-1. The LOD and LOQ values were calculated as 3-fold

45
and 10-fold, respectively, the standard deviation in the signal from multiple runs of the
lowest calibration standard (Signal/Noise >10) (USEPA, 1984). The details of detection
limits and recoveries are provided in the Appendix C.
Partitioning Coefficients (Kd and Koc)
The Kd value of TCS was previously measured (Agyin-Birikorang et al., 2010)
according to the EPA standard method guideline for soil and sediment (OPPTS
835.1220) (USEPA, 2007). The measurement was performed in biosolids, soils and
biosolids-amended soils. Details are described by Agyin-Birikorang et al. (2010). Briefly,
0.8 mL of the stock solution (1.29 × 10⁵ dpm 14C-TCS mL-1) was utilized to prepare a
working solution (250 mL) in 0.01 M CaCl2. The batch experiment involved addition of
2.5 mL of the 14C-TCS working solution to triplicate 0.5 g (oven-dry equivalent) samples
of the biosolids (1:5; g solid: mL solution) + Control samples containing TCS spiked
CaCl2 (no biosolids). Ten biosolids used in TCS concentration determination (Chapter
2) were used in the partitioning study along with 5 additional biosolids received as a part
of the USEPA TNSSS (USEPA, 2009a). The samples and controls were analyzed for
14C-TCS throughout the experiment to monitor the stability of the TCS concentration in
the solution phase. No, or minimal, degradation was expected during the 24 h study
given the estimated half-life of TCS in biosolids-amended soils (100 d) (Chapter 4).
Replicated blank samples, containing 0.5 g of biosolids and 2.5 mL of 0.01 M TCS free
CaCl2, were also included. Samples were equilibrated on an end-over-end shaker for 24
h (based on a preliminary kinetic study), and subsequently centrifuged (8000×g) for 10
min at constant temperature (24 ± 2°C). Supernatant aliquots (1mL) were added to 10
mL of Ecoscint A scintillation cocktail (National Diagnostics, Georgia) in 20 mL glass
scintillation vials. Radioactivity was determined via liquid scintillation counting with

46
background correction against blanks (14C-free 0.01 M CaCl2). Controls (no biosolids)
were utilized for determining the initial concentration (C0). The amount of TCS
partitioning onto the biosolids solid phase was calculated as a percentage of 14C-TCS
initial activity added and the change in activity in the solution phase over time. Partition
coefficients (Kd) were estimated for TCS adsorption on seventeen biosolids as:
Kd = Activity of TCS adsorbed/kg biosolids Activity of TCS in solution/ L solution
Seven biosolids were utilized to measure ―inherent‖ log Kd and Koc values. The
concept of inherent Kd and Koc has been previously utilized for determining the
coefficients in pharmaceuticals and musk fragrances (Carballa et al., 2008). Biosolids
with known biosolids treatment process, and high TCS concentrations (≥20mg kg-1,
Chapter 2, Table 2-1) were selected to improve the probability of detecting TCS in the
aqueous phase by LC/MS (limited due to LOQ of 1 ng mL-1). The whole biosolids (cake)
was extracted with an organic extractant (methanol, acetone mixture) to determine the
total TCS concentration (sorbed + aqueous) as described in Chapter 2 (Table 2-1). A
separate sample of biosolids (cake) was then centrifuged to obtain a sample of the
presumed equilibrium solution and analyzed for TCS. The concentration of TCS sorbed
was obtained by subtracting the mass of TCS in supernatant from the total TCS.
Estimation of Kd (―inherent Kd‖) was obtained by taking the ratio of the sorbed TCS to
the supernatant TCS. The mean Kd and Koc values were calculated based on actual
measurement of five biosolids supernatant TCS concentrations and on two biosolids
concentrations estimated from the LOQ of the instrument.

47
Results and Discussion
Measured TCS water solubilities were 9 mg L-1 (pH = 6.14), 27 mg L-1 (pH = pKa=
8.14) and 800 mg L-1 (pH = 10.14) (Table 3-2). The overall 90-fold increase in the
solubility resulted from dissociation of the neutral acid to anionic species. Increased
solubility at higher pH portends greater concentration in the aqueous phase during
sewage treatment processes utilizing lime stabilization and in high pH soils. Extremely
high pH levels are not common in most sewage treatment systems or in most soils,
except some sodic soils. The solubility of TCS measured at pH 6.14 (i.e., 9 mg L-1)
appears reasonable for predicting the fate and transport of TCS in many soils. Thus,
typical biosolids applied to typical, near-neutral soils would be expected to demonstrate
a TCS water solubility of 9 mg L-1, which is similar to reported measured values of 10
and 17 mg L-1 (Ciba Specialty Chemicals, 2001; MITI, 1992), but greater than calculated
values of 1.97 to 4.6 mg L-1 obtained using Quantity Structure Activity Relationship
(QSAR) and Estimation Programs Interface (EPI Suite v3.10) (Halden and Paull, 2005,
Ying et al., 2007). The models underestimated the solubility of TCS and thus, the log
Kow values were expected to be overestimated by the model. However, the measured
and model estimated log Kow values (4.8 and 4.76) were relatively consistent The
unexpected relationship between TCS solubility and log Kow values highlights the
importance of measured data collected by standardized methodology.
Mean log Kd values ± standard error (S.E.) were 3.76 ± 0.04 and log Koc values
were 4.30 ± 0.03 in TCS spiked biosolids (Table 3-3). The log Koc values were similar to
estimated values in soil of 4.26 (Ying et al., 2007), but slightly lower than measured
value of 4.6 reported by Heim (1997). The log Kd and Koc values suggest relatively
strong sorption of TCS to the biosolids and low mobility in acid and circum neutral

48
(pH=6.5-7.5) soils. Also, the same biosolids were utilized to measure Kd and Koc directly
from biosolids (unspiked or ―inherent Kd and Koc‖). The mean (n=7) inherent log Kd was
4.15 ± 0.03, and log Koc was 4.68 ± 0.07. Based on the limited number of biosolids
analyzed, the differences were not statistically significant, but the inherent log Kd and
Koc values tend to be greater than the spiked log Kd and Koc values (Table 3-3). The log
Kd values determined for biosolids (4.15 ± 0.03) was greater than those determined for
soils (2.25 ± 0.26) and biosolids-amended soils (2.31 ± 0.19) (Agyin-Birikorang et al.,
2010). The difference in the coefficients was attributed to the difference in organic
carbon among the various matrices. Following normalization to organic carbon, the
coefficients (Koc) determined in the soils, biosolids and biosolids-amended soils were
not significantly different and averaged 4.26 ± 0.31 (Agyin-Birikorang et al., 2010). Thus,
a specific or narrow range of TCS partitioning coefficient (Koc) can serve as a first
approximation to describe the behavior of TCS in soils or other matrices. The Koc values
measured in our study and reported in other studies suggest significant adsorption of
TCS to the soils and or biosolids. Thus, the mobility of TCS in biosolids-amended soils
is expected to be restricted and the extent of retardation to be highly dependent on the
organic carbon content of the amended soils and pH in case of calcareous soils.

49
Table 3-1. Physico-chemical Properties of TCS reported in the literature.
Property Value References Comments
Molecular Weight (g mol-1
) 289.55 Formula (C12H9Cl3O2) CAS Registry no (3380-34-5)
Solubility (mg L-1
)
1.97-4.6
10
17
(Halden and Paull,2005)
(Ciba Speciality Chemicals, 2001a) (MITI, 2002)
Estimated
Measured
log Kow
4.8
4.70
4.76
4.76
(Halden and Paull, 2005)
(Ying et al., 2007)
(Lei and Snyder, 2007)
(Wezel and Jager, 2002)
Estimated Kow WIN
Estimated PBT Profiler
Measured
Measured
log Koc 4.26 4.6
(Ying et al., 2007) (Heim, 1997)
Soils (1.3% OC) PBT profiler, Measured
pKa 8.14 (Jakel,1990)
Vapor Pressure (mm Hg at 200C)
4 × 10
-6 (Ciba Specialty Chemicals, 2001b) Non –Volatile
Henry‘s Law Constant (atm-m3 mole
-1
at 250C)
4.99×10⁻⁹
(Meylan and Howard, 1991) Estimated
Half-life (d)
120(Soils) 540(Sediment)
60 (Soils) 240 (Sediment) 18-58 persistent
540 15-35 12-15 107
56-107
(Ying et al., 2007)
(Ying et al., 2007), (Wu et al., 2009)
(Miller et al., 2008) (Ciba Speciality Chemicals, 2001a)
(Xu et al., 2009) (Lozano et al., 2010) (Kwon et al, 2010)
Estimated PBT Profiler, USEPA
Level III fugacity model
Measured Aerobic, anaerobic soils
Sediments
Soils Soils
Biosolids-amended soils Biosolids- amended soils
.
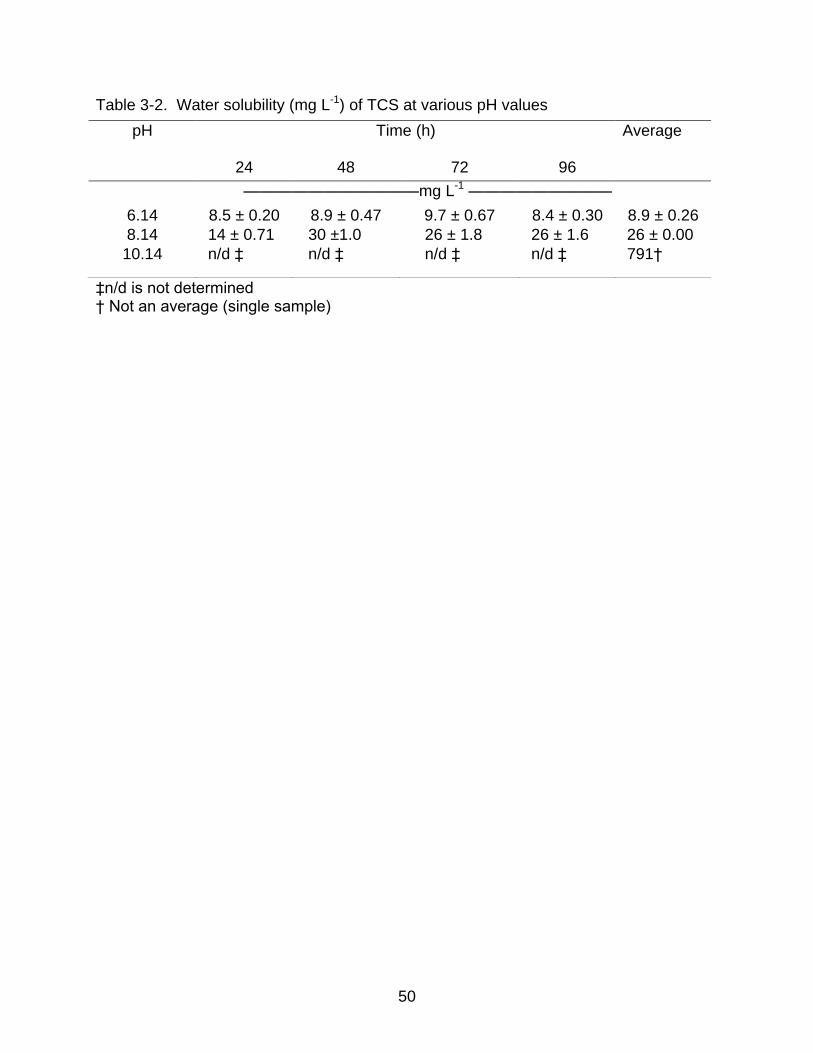
50
Table 3-2. Water solubility (mg L-1) of TCS at various pH values
‡n/d is not determined † Not an average (single sample)
pH
Time (h) Average
24 48 72 96
———————————mg L-1 —————————
6.14 8.5 ± 0.20 8.9 ± 0.47 9.7 ± 0.67 8.4 ± 0.30 8.9 ± 0.26
8.14 14 ± 0.71 30 ±1.0 26 ± 1.8 26 ± 1.6 26 ± 0.00
10.14 n/d ‡ n/d ‡ n/d ‡ n/d ‡ 791†

51
Table 3-3. Mean log partition coefficients (Kd and Koc) (n=3) ± standard error (S.E) for TCS on spiked (Agyin-Birikorang et al., 2010) and unspiked (inherent) biosolids (our study).
Spiked Kd, Koc on biosolids Inherent Kd, Koc
(Our study)
Biosolids
Treatment process
log Kd
Fraction Organic carbon
log Koc
log Kd
log Koc
UNKB Anaerobic digestion
3.68 ± 0.02 0.38 4.19 ± 0.02 3.99 ± 0.01 4.51±0.00
UNKC Anaerobic digestion
3.79 ± 0.02 0.37 4.28 ± 0.02 3.88 ± 0.04 4.30±0.14
UNKD Anaerobic digestion
3.74 ± 0.01 0.31 4.35 ± 0.01 4.78†±0.00 5.35†±0.07
UNKE Anaerobic digestion
3.61 ± 0.03 0.32 4.09 ± 0.07 4.51†±0.01 5.01†±0.00
UNKF Anaerobic digestion
3.62 ± 0.04 0.21 4.35 ± 0.04 3.85±0.03 4.60±0.03
UNKG Anaerobic digestion
3.76 ± 0.02 0.42 4.21 ± 0.04 4.17±0.08 4.55±0.18
UNKH Anaerobic digestion
3.77 ± 0.01 0.30 4.35 ± 0.01 3.88±0.06 4.44±0.06
UNKI Anaerobic digestion
3.63 ± 0.04 0.24 4.30 ± 0.04
UNKK Unknown 3.75 ± 0.01 0.28 4.35 ± 0.01
GRU 3.90 ± 0.02 0.38 4.31 ± 0.02
OSBC Anaerobic digestion
3.93 ± 0.01 0.42 4.37 ± 0.01
ORBC-BL Untreated (before lime stabilization)
3.85 ± 0.03 0.41 4.26 ± 0.05
ORBC-AL Lime stabilization (following lime addition)
3.68 ± 0.03 0.34 4.22 ± 0.07
RCKF Anaerobic digestion
3.85 ± 0.01 0.39 4.31 ± 0.01
CFBC Anaerobic digestion
3.95 ± 0.01 0.41 4.38 ± 0.03
CALC Anaerobic digestion
3.70 ± 0.03 0.28 4.36 ± 0.03
CHCC Anaerobic digestion
3.67 ± 0.02 0.28 4.35 ± 0.02
Average 3.76 ± 0.04 4.30 ± 0.03 4.15 ± 0.03 4.68 ± 0.07
†Estimated using the ½ LOQ (Limit of quantitation) of LC/MS

52
Figure 3-1. Calculated octanol-water partitioning coefficient (log Kow) curve and
dissociation diagram for TCS.
1.9
2.4
2.9
3.4
3.9
4.4
4.9
0
20
40
60
80
100
0 2 4 6 8 10 12 14
log K
ow
Perc
en
t dis
socia
tio
n
pH
Percent dissociation
log Kow
53
CHAPTER 4 BIODEGRADATION OF BIOSOLIDS-BORNE TCS
Background
The antimicrobial triclosan (TCS) is a common constituent of domestic
wastewater and >50% of TCS mass entering the WWTPs partitions into biosolids
(Langdon et al., 2011; McClellan and Halden, 2010; Cha and Cupples, 2009; Xia et al.,
2009; Heilder and Halden, 2009; USEPA, 2009a). Land application of biosolids
transfers TCS to soils where its fate and transport depends on TCS persistence in the
terrestrial environment. Biodegradation half-lives for TCS in aerobic soils have been
estimated using fugacity-based models like Persistence, Bioaccumulation, and Toxicity
(PBT) Profiler (USEPA) (t1/2 = 60-120 d) and measured [t1/2
= 18 d (Ying et al., 2007)
and 2 to 13 d (Kwon et al., 2010)] (Table 3-1). Miller et al. (2008) suggested long-term
persistence of TCS in anaerobic sediments (40 years), compared to the estimated
(PBT) half-life of 540 d under anaerobic soil conditions. Persistence of TCS in aerobic
soils and sediments is reasonably well studied, but TCS degradation in biosolids-
amended soils is less studied. Degradation studies in biosolids-amended soils are
important, as TCS preferentially partitions into biosolids potentially reducing TCS
bioavailability to degrading organisms.
Lozano et al. (2010) estimated a TCS half-life of 107 d in a biosolids-amended
soil (unknown soil texture), while Kwon et al. (2010) reported measured half-lives
ranging from 56 to 107 d in two biosolids-amended loam soils [fine loam, pH:7.8, coarse
loam, pH:4.7]. Recently, a mesocosm study conducted in Maryland resulted in an
estimated first order half-life of 182-193 d (Walters et al., 2010). Higgins et al. (2011)
reported a smaller half-life (42 d) in a biosolids-amended field soil (silty clay loam).

54
However, Higgins et al. (2011) half-life estimate was approximate, as the authors
acknowledged that the study did not intend to calculate degradation. Kwon et al. (2010),
Lozano et al. (2010), Walters et al. (2010), and Higgins et al. (2011) reported loss of
extractable TCS with time, but did not distinguish between compound loss due to TCS
mineralization [conversion to carbon dioxide (CO2)] or primary degradation (formation of
metabolite from the parent compound). Loss of extractable TCS may represent the
conversion of initially extractable TCS to non-extractable (bound) residues with time.
Snyder et al. (2010) reported the formation of triclocarban (TCC) bound (non-
extractable) residues in biosolids-amended soils. We speculated that because TCS has
a reported low water solubility value (1.9-9 mg L-1) and because the partitioning
coefficient of TCS (log Koc = 4.3) is even greater than TCC (log Koc = 3.88) (Agyin-
Birikorang et al., 2010), TCS should tend to partition into organic C in soils and
sediments and form bound residues as well. An accurate measurement of TCS half-life
should include the determination of TCS mineralization, or primary degradation,
identification of metabolites, and demonstration of mass balance.
Transformation by biological methylation forms methyl ether derivatives that are
usually more lipophilic than the parent compounds (Valo and Salkinoja-Salonen, 1986;
Neilson et al., 1983). Tulp et al. (1979) reported that TCS degrades by hydroxylation of
benzene ring and cleavage of the ether bond forming dichlorophenols in urine samples.
Hundt et al. (2000) showed that TCS microbial degradation can form Methyl-TCS (Me-
TCS), dichlorophenols, and conjugated metabolites where carbohydrates are connected
to the hydroxyl group of TCS. Miyazaki et al. (1984) reported Me-TCS in fish, but it was
unclear whether the methylation occurred in the surface water or in the fish body.

55
However, a later study (Balmer et al., 2004) confirmed the presence of Me-TCS in
surface water as well as fish bodies. Lindstrom et al. (2002) reported that Me-TCS
formed in wastewater effluents and surface waters through biological methylation.
Evidence of TCS methylation was also obtained from the presence of the anisole in
semi-permeable membrane devices (SPMDs). Lindstrom et al. (2002) opined that the
presence of only Me-TCS (no TCS) in SPMDs might represent significant
bioaccumulation potential of Me-TCS. Further, McAvoy et al. (2002) detected Me-TCS
(0.13-0.45 µg g-1) in sludge and aerobically digested biosolids obtained from two
WWTPs in Ohio. Xia (2010) reported that TCS biomethylated to a small quantity (~9%)
of Me-TCS in a biosolids-amended soil (sandy loam) utilized for a TCS leaching study.
Thus, we might expect formation of Me-TCS under aerobic conditions when biosolids-
borne TCS is added to the soils. However, it is uncertain if the formed Me-TCS persists
or further mineralizes to CO2. Limited data for Me-TCS partitioning suggest that Me-TCS
is more hydrophobic (log Kow = 5.2) than TCS (log Kow = 4.8) (Boehmer et al., 2004),
and therefore, Me-TCS is likely to be less bioavailable than TCS and more likely to form
bound residues.
We hypothesize that biosolids-borne TCS and its metabolites are persistent in
the environment. The objective of our study was to determine the degradation
(mineralization/primary degradation) potential of TCS in two biosolids-amended soils.
Specifically, we sought to (i) identify the TCS metabolites (ii) determine the
mineralization and/or primary degradation half-lives, and (iii) assess the extent of bound
residue formation. We conducted a biodegradation study in soils using 14C-TCS spiked
biosolids under biotic and inhibited biotic aerobic conditions to determine the
56
degradation rates of TCS in biosolids-amended soils. Aerobic conditions were chosen
as biosolids-borne TCS is expected to undergo primarily aerobic degradation under the
typical conditions of surface applied and incorporated biosolids. The biodegradation
study was conducted according to the United States Environmental Protection Agency
(USEPA) Office of Prevention, Pesticides and Toxic Substances (OPPTS) Harmonized
Fate, Transport and Transformation Test Guidelines; Soil Biodegradation (835.3300)
(USEPA, 1998).
Material and Methods
Chemicals, Biosolids and Soils
Radiolabeled 14C–TCS uniformly on the chlorophenol ring (specific activity - 48
mCi mmol-1 and 99% purity) was custom synthesized by Tjaden Biosciences
(Burlington, IA). Ecoscint A liquid scintillation cocktail was purchased from National
Diagnostics (Atlanta, GA) and the Me-TCS standard from Wellington laboratories
(Shawnee Mission, KS). All other chemicals and solvents were purchased from Fisher
Scientific (Atlanta, GA). An anaerobically digested biosolids (CHCC, solids: 320 g kg-1)
was collected from a domestic WWTP in Illinois. The biosolids contained 5 mg kg-1 of
TCS and non-detectable (<0.7 mg kg-1) Me-TCS (Chapter 2). Two soils, the Immokalee
fine sand (IFS) (sandy, siliceous, hyperthermic Arenic Alaquods) and the Ashkum silty
clay loam (ASL) (fine, mixed, superactive, mesic Typic Endoaquolls) were collected
from sites with no known history of receiving land-applied biosolids or sludge. Select
physico-chemical properties of soils and the biosolids are presented in Table 4-1.
Biodegradation Study Design
The biodegradation study consisted of 146 glass, round-bottom, 30 mL glass
centrifuge tubes (2 soils × 1 biosolids × 1 rate × 4 replicates × 8 sampling periods × 2

57
treatments (biotic/inhibited) + 18 controls). The first set of controls consisted of 1
biosolids × no spike of 14C–TCS × 2 soils × 2 treatments (biotic/inhibited) × 4 replicates
(Table 4-2). The absence of evolved 14CO2 in controls would confirm no cross-
contamination in the system. The second set of controls consisted of 14C–TCS spiked
into autoclaved water. Evolved 14CO2 will indicate soil-independent abiotic TCS
degradation (e.g., photolysis). Treatments were prepared by first weighing CHCC
biosolids (0.10 g dry wt. equivalent) in centrifuge tubes. A sub-stock of 14C (1.3 ×10⁶
dpm 14C-TCS g-1) was prepared in 1mL methanol (MeOH) and dissolved in 200 mL of
deionized distilled (DDI) water. One mL of sub-stock TCS was spiked onto the CHCC
biosolids sample and allowed to equilibrate for 24 h at room temperature. Equilibrium
between spiked TCS and the biosolids was assumed to have occurred in 24 h as
suggested by Agyin-Birikorang et al. (2010) who reported TCS sorption equilibrium
within 24 h of incubation. The spiked biosolids was mixed with 10 g (dry wt.) of two soils
to simulate a realistic field application rate (22 Mg ha-1 or ~10 tons acre-1 equivalent).
The biosolids-amended soils were vortexed for 30 s to promote uniform mixing of the
spiked biosolids and the soil sample.
The radioisotope spiking increased the effective biosolids-borne TCS
concentration to 40 mg TCS kg-1, and the final nominal TCS concentration in the
amended soil was 0.4 mg TCS kg-1 dry weight. Treated samples were aerobically
incubated under biotic or inhibited conditions, and soil water contents were maintained
at field capacity (i.e. 100 g kg-1 for IFS and 300 g kg-1 for the ASL soils) throughout the
experiment. Inhibited treatments quantified the effects of non-microbial reactions on
TCS degradation and were facilitated by adding 1200 mg kg-1 of 0.1% sodium azide

58
(Fischer et al., 2005). Biosolids-amended soil samples were weighed at each of the 8
sampling times, and DDI was added to the samples when the difference in weights
between initial (week 0) and subsequent samplings was >5%.
The biodegradation study setup was adapted from Snyder (2009) and is shown
in Figure 4-1. Briefly, each centrifuge tube was connected to a series of three glass
trapping vials (base traps) containing 5 mL of 0.2 M potassium hydroxide (KOH). The
base traps collected 14CO2 (representing 14C-TCS mineralization) and CO2
(representing microbial respiration). A pump provided samples with humidified air
stripped of CO2 through a series of containers containing, sequentially, 1 M KOH, CO2
free DDI water (prepared by boiling water for extended time), soda lime [Calcium
hydroxide (Ca(OH)2)>80%, KOH<3%, sodium hydroxide (NaOH)<2%, Ethyl violet<1%],
1 M KOH, and CO2 free DDI water. The first glass vial remained empty to prevent
backflow into the centrifuge tube if the pump failed. The samples were incubated at
~23°C in the hood to avoid possible fugitive radiolabel vapor escape into the room.
Base Trap Analysis and Soil Sample Extraction
Once a week, base traps at position-1 were removed, the remaining traps were
moved forward, and a fresh trap added to the newly open position-3. The sampling
schedule included soil sample removal at 0, 2, 4, 6, 8, 10, 12, 14 and 18 weeks. Four
samples of each amended soil treatment were periodically removed (sacrificial
sampling) and sequentially extracted by sonicating (Branson 2210, Danbury, CT; temp.
40°C, 60 Hz min-1) for 1h with 20 mL each of DDI water (twice), MeOH (twice), and 1 M
NaOH (once) and finally centrifuged (~800×g for 60 min) to isolate residual soil. A
subsample (1g, dry wt.) of the residual soil was combusted at 900°C in a Harvey
Oxidizer, Model OX-500 (Tappan, NY). Another subsample of residual soil was

59
extracted with a mixture of MeOH+acetone (twice) (50:50 v/v). In addition, all the base
traps attached to the samples (three for each sample) were removed at each final
sampling time. Aliquots (~500 µL) of the supernatants removed from various extracts
and base traps were mixed with 15 mL Ecoscint A and stored for 24 h. A liquid
scintillation counter (LSC) Model LS 6500 (Beckman Coulter, Irvine, CA, USA) was
utilized to quantify 14C (5 min counts). Evolved 14CO2 from the oxidizer was also trapped
in 15 mL cocktail (Harvey, Tappan, NY) and the radioactivity quantified by LSC.
Removed base traps were also analyzed for total CO2 (Anderson, 1982) to
assess possible effects of added 14C-TCS on overall microbial respiration in biotic
treatments. Adverse effects were considered possible because of the relatively high
total TCS concentration (40 mg kg-1) in biosolids spiked with 14C-TCS.
Sequential Extraction Scheme
The sequential extraction scheme was modified from a previous study on
triclocarban (TCC) biodegradation (Snyder et al., 2010) and represents the extraction of
fractions of TCS of assumed varying availabilities (lability) in the soil. The explanation of
the sequential extraction scheme is provided in Appendix A. We termed 14C in the water
and MeOH extracts as labile, and 14C in NaOH, MeOH+acetone extracts and the
combustible fractions as non-labile (bound). The non-labile fractions included: humic-
associated (NaOH), loosely sorbed (MeOH+acetone), and bound (combustible)
fractions of TCS. The lability assignments are operationally defined (and somewhat
arbitrary), but consistent with extraction schemes used by others (Semple et al., 2003;
Hickman and Reid, 2005; Heidler et al., 2006; Snyder et al., 2010).

60
Radiological-Thin-Layer-Chromatography (RAD-TLC) for Extract Speciation
At each sampling time, aliquots of extracts from the first MeOH and the first
MeOH+acetone extractions were separately air-dried using an aquarium pump and
reconstituted in ~30 µL MeOH. Thin layer chromatography (TLC) plates were used to
identify 14C-labeled moieties (parent and metabolites) from the various extracts. The
plates were spotted with reconstituted MeOH extract and developed in a chamber
saturated with solvent vapors of mobile phase. The mobile phase consisted of
Chloroform+Formic acid (99:1, v/v). The TLC plates were either glass backed Partisil
LK5D, silica gel 150 Aº, 20×20 cm (Piscataway, NJ) for performing RAD-TLC, or glass
backed 20×10 cm silica gel 60F254 plates (E. Merck, Darmstadt, Germany) for
fluorescent TLC (used for metabolite identification). Fluorescent TLC plates were
analyzed by hand-held U-V light (Model UVG-54; San Gabriel, CA), and RAD-TLC
plates were analyzed by RAD-TLC instant imager (PerkinElmer Life and Analytical
Sciences, Waltham, MA). We initially intended to perform RAD-TLC analysis on water
and NaOH extracts as well, but the analyses were not possible due to insufficient
amounts of radioactivity in the two fractions for peak quantification. The limit of
quantitation (LOQ) of all species (parent and metabolites) using RAD-TLC imager was
~1000 dpm, which represented ~8% of the total 14C added in the system.
The relative amounts of the TCS and the metabolite were measured at each
sampling time in the two extracts. The relative proportion of 14C-TCS and metabolite in
the water fraction was assumed to be same as in the MeOH fraction and the proportion
in NaOH and bound fractions were assumed to be same as in MeOH+acetone fraction.
The assumptions were made because the LOQ of the RAD-TLC imager was greater
than the quantity of 14C in the water and NaOH extracts. Based on the aforementioned

61
assumptions, concentrations of TCS and metabolite were estimated for all the extracts
and the data were utilized to estimate the primary degradation half-life of TCS to the
metabolite.
Statistical Analysis
Carbon dioxide data were analyzed using the general linear model (PROC GLM)
of the SAS software, version 9.1 (SAS institute, 2002). Values of CO2 evolved over time
were compared among the various treatments using the multiple slope comparison
option of the regression procedure (SAS institute, 2002).
Results and Discussion
Mass Balance and Mineralization of 14C-TCS
Percent total recoveries of 14C in the IFS soil treatments varied from 86 to 103%,
with an average of 92.8% for biotic (Table 4-3), and 93.4% for inhibited treatments
(Table 4-4). Total recoveries in the ASL soil treatments were 100 to 109% with an
average of 104% for biotic (Table 4-5), and 105% for the inhibited treatments (Table 4-
6). As the average recoveries in our system were >90%, we did not expect that TCS
volatilized as a gas and escaped the system at any time during the experiment. The
percent total recoveries obtained in the biodegradation study were deemed acceptable,
but to simplify the discussion of 14C-TCS partitioning into various fractions, the data
were normalized (Figures 4-2, 4-3) by dividing 14C in each fraction by the total 14C
recovered from each soil at each sampling time. In addition, the Figures 4-2 and 4-3
include the 14C associated with the MeOH+acetone extraction of the combustible
(bound) fraction.
Mineralization of 14C-TCS to 14CO2 in the two soils (IFS and ASL) was minimal
(<0.5%) through the study period (18 week) (Figures 4-2, 4-3). The different percentage

62
of TCS mineralization in the either soil is within the variable total recoveries (range: 86-
103%) in the two soil treatments, and is not considered significant. Al-Rajab et al.
(2009) also reported minimal (<1%) TCS mineralization in a 42-d degradation study of
TCS spiked to dewatered biosolids that was then mixed with soil [sandy loam; Organic
matter (OM): 37 g kg-1]. Further, the two controls did not detect any 14CO2 suggesting
no cross-contamination or abiotic TCS degradation in the system.
In the IFS soil biotic treatment (Figure 4-2a), >90% of spiked 14C-TCS was water
+MeOH extractable (labile) at week 0, but extractability decreased to ~35% at 18 week.
The large recovery in the labile fraction at week 0, suggests initial reversible sorption of
14C-TCS to the solid phase. The percentages of radioactivity in the combustible (bound)
and NaOH extractable fractions at week 0 were 2% and 0.1%, respectively, but
increased to nearly 40% in the bound, and 20% in NaOH extractable fractions (week
18). Radioactivity in the water fraction remained fairly constant at 2-4%, much lower
than the radioactivity in other fractions. The MeOH+acetone extractable 14C increased
from 1% at week 0 to nearly 10% by week 18. Thus, over the 18 week study period , the
IFS biotic treatment data revealed a decrease in water+MeOH extractability (TCS
lability) with time, and concomitant increases in the non-labile (NaOH, MeOH+acetone
extractable and bound) fractions. Similar trends of greater percent extractability in the
labile fraction and low percentages in non-labile fractions occurred in the inhibited
treatment of IFS soil (Figure 4-2b), but the radioactivity in the bound fraction did not
increase over time as in biotic treatments. The lack of increasing trend over time in the
inhibited treatment suggests microbially-mediated TCS partitioning into the non-labile
fraction.

63
Similarly, the data for the ASL soil biotic treatment revealed a trend of reduced
extractability of labile 14C-TCS fraction from week 0 (40%) through week 18 (7%)
(Figure 4-3a). About 60% of the added 14C in biotic and inhibited treatments was
immediately associated with the non-labile (NaOH, MeOH+acetone, bound) fractions,
suggesting limited TCS lability. The bound 14C in the ASL biotic treatment increased
from week 0 (~30%) to ≥40% as early as week 4 (Figure 4-3a), whereas the conversion
to the bound fraction was slower in the inhibited treatment, reaching >40% at week 18
(Figure 4-3b). Faster partitioning of 14C-TCS into the non-labile fraction in the biotic
treatment again suggests microbially-mediated alteration of TCS that hastened the
conversion of labile fraction to the non-labile bound fraction.
Recoveries of 14C-TCS in the labile fraction were consistently greater in the IFS
(Figures 4-2a and b) than in the ASL soil treatments (Figure 4-3a and b). The greater
clay and organic carbon (OC) contents in the ASL soil (340 g kg-1 clay, 34 g kg-1 OC)
than in the IFS soil (<10 g kg-1clay, 11 g kg-1 OC) likely promoted stronger interaction of
TCS with the ASL soil and reduced TCS lability. At week 0, 30% of the 14C-TCS
partitioned into bound fraction (non-labile) in the ASL soil, whereas the bound fraction
was 2-3% in IFS soil, suggesting an interactive effect of soil texture and OC content on
the partitioning of 14C-TCS into labile and non-labile fractions. Agyin-Birikorang et al.
(2010) conducted a sorption/desorption study on the same soils used herein and
reported that log Kd in the IFS soil (1.87 ± 0.21) was significantly smaller than in the ASL
soil (2.64 ± 0.19), suggesting texture and OC content effects on TCS partitioning into
sorbed and aqueous phases.

64
Total Carbon Dioxide (CO2) Analyses
The TCS spiked ASL soil biotic treatment had the greatest CO2 evolution rate
(Figure 4-4b), and the CO2 evolution rate of the unspiked ASL soil biotic treatment was
similar to the spiked treatment until week 13. The similarity was not surprising as the
soil microbes were likely utilizing more abundant C sources (biosolids or soil OC) rather
than the small amount of added TCS. In the IFS soil, biotic treatments exhibited the
greatest CO2 evolution rates followed by IFS unspiked biotic, IFS inhibited biotic, IFS
unspiked inhibited biotic and the spiked water control (Figure 4-4a). The trend is
expected, as the micro-organisms will be actively growing in biotic, but less so in the
inhibited biotic treatments. The smaller rates of CO2 evolution from the unspiked IFS soil
biotic treatment, as compared to the unspiked ASL soil biotic treatment, may represent
differences in microbial community size, or the relative abundance of available C
sources in the IFS (11 g kg-1 OC) and ASL soils (34 g kg-1 OC) (Table 4-1). Despite the
addition of sodium azide in the inhibited biotic treatments at week 0, microbial activity
continued, but at a reduced rate compared to the biotic treatments. Cumulative CO2
evolved from spiked water-only control (no soil) was the least, as compared to all other
treatments, which confirmed the effectiveness of CO2 scrubbing system.
The IFS soil data revealed significant differences (p<0.05) among all treatments,
except between the spiked inhibited biotic and the unspiked inhibited biotic treatment,
and between the unspiked inhibited biotic and the spiked water control (Figure 4-4a).
The ASL soil data revealed no significant differences between the biotic and unspiked
biotic treatments, nor between the inhibited biotic and unspiked inhibited biotic
treatments (Figure 4-4b). However, there were significant differences among the biotic,
inhibited biotic and the spiked water control (soil less) in the ASL soil.

65
Cumulative CO2 increased through week 18 in both biotic soil treatments,
suggesting normal microbial activity throughout the biodegradation experiment (Figure
4-4). Thus, the biosolids-amended soil TCS concentration (0.40 mg kg-1) used in our
experiment did not significantly affect CO2 evolution at any time. The results are in
accordance with a study on a similar antimicrobial (TCC) where the CO2 evolution rates
were unaffected by the addition of TCC at concentration range of 0.24-7 mg kg-1 in
biosolids-amended Florida Immokalee sand (Snyder et al., 2011). Waller and Kookana
(2009) spiked a sandy soil (clay: 100 g kg-1, OC: 8.5 g kg-1) and a clayey soil (clay: 480
g kg-1, OC: 18.5 g kg-1) with 0, 1, 5, 10, 50, and 100 mg TCS kg-1 soil, and monitored
changes in substrate (glucose) induced respiration in soils (no biosolids). There were no
TCS concentration effects on microbial respiration up to 100 mg TCS kg-1 soil. Butler et
al. (2011) examined basal and substrate induced respiration in three soils (no biosolids)
- sandy loam (OC-17 g kg-1), clay (OC-27 g kg-1) and loamy sand (OC-23 g kg-1) spiked
with a range of TCS concentrations (0-1000 mg kg-1). Results suggested some
inhibition of respiration 2-4 days after spiking at TCS concentrations >10 mg kg-1, but
respiration recovered to the control level by day 6 and overall, there was no effect of
TCS spiking.
Metabolite Identification
Each RAD-TLC analysis (up to week 2) of MeOH and MeOH+acetone extracts of
both soils and treatments revealed a single major peak and an overall ―fingerprint‖
corresponding to a 14C-TCS standard (Figure 4-5a). There were no peaks suggesting
TCS metabolites up to week 2. At week 3, an additional peak (peak 3) appeared in the
chromatogram of biotic treatments (Figure 4-5b). The additional peak appeared farther
from TCS on the TLC plate and was demonstrated to be Me-TCS. Methyl-TCS is a

66
reported metabolite of TCS (Figure 4-6), with a log Kow of 5.2 (vs log Kow = 4.8 for TCS)
(Boehmer et al., 2004), and is formed by the methylation of hydroxyl group of TCS. The
peak could not be conclusively identified with RAD-TLC due of unavailability of a 14C-
Me-TCS standard. Rather, the identification was performed using fluorescent
chromatography and a cold Me-TCS standard. Chromatography resulted in distinct
bands under UV light of Me-TCS that aligned with the cold Me-TCS standard. Further
confirmation was performed by comparing retention factors (Rf). The Rf values
measured in samples taken at various sampling times were 0.6 to 0.65 for TCS and
from 0.72 to 0.75 for Me-TCS. The relative Rf (Rf for TCS/ Rf for Me-TCS) were 0.83 to
0.86. Based on co-migration with an authentic standard, the metabolite was identified as
Me-TCS. Analyses of extracts through week 18 revealed continued presence of Me-
TCS in biotic treatments for both soils, but no metabolites in inhibited treatments.
The formation of Me-TCS in the present study corresponds well with the previous
studies suggesting Me-TCS formation in a variety of matrices (Coogan et al., 2007,
2008; Miyazaki et al., 1984; Lindstrom et al., 2002; McAvoy et al., 2002; Bester, 2005).
Methyl TCS bioaccumulated in algae and snails when exposed to effluent containing
Me-TCS in the concentration range of 50 to 400 ng L-1 (Coogan et al., 2007, 2008).
Hundt et al. (2000) found Me-TCS as one of the microbial degradation metabolites in
fungus (T.Versicolor) cell cultures incubated with TCS. Poulsen and Bester (2010)
detected Me-TCS (up to 70 ng g-1) in sewage sludge composted under thermophilic
conditions. The bacterial species Rhodococcus (strain CG-1, CP-2), Mycobacterium
(CG-2) and Actinomycetes methylated several chlorophenols (Haggblom et al., 1988;
Neilson et al., 1983). Triclosan belongs to the class of chlorophenols and may be

67
methylated by a similar mechanism. An unpublished report (Christensen, 1994)
estimated that up to 70-80% of TCS degraded to Me-TCS in a 64 d study conducted on
three sludge amended soils (Arkansas silt loam, Kansas loam and Wisconsin sandy
loam). Unfortunately, details of the experimental design of this unpublished study were
not available. In contrast to the above studies, Xia (2010) reported that TCS
biomethylated to only a small quantity (~9%) of Me-TCS after 101 d of biosolids-
amended soil (pH = 5.7, sandy loam) incubation in a TCS leaching study. The present
study is apparently the first published study that suggests Me-TCS as a major
biodegradation metabolite of TCS in biosolids-amended soils.
The mass balance for 14C-TCS for both soils indicated that the total radioactivity
decreased in MeOH extracts and increased in the combustible (bound residue) fraction
with time. The increase of 14C in the bound fraction did not affect the relative peak
heights of TCS and Me-TCS in MeOH extracts in the RAD-TLC analysis. The peak for
Me-TCS and percent radioactivity associated with the peak was always smaller than the
corresponding values for TCS. However, bound residue characterization (MeOH:
acetone extract) suggested an increase in peak height of Me-TCS and no change in
TCS peak height with time, indicating Me-TCS formation and partitioning of both TCS
and Me-TCS to the bound fraction. The increase in peak height of Me-TCS with time
suggests preferential partitioning of Me-TCS over TCS in the bound fraction.
Half-life (Persistence) Determination
The inhibited biotic treatments produced no detectable metabolites, and there
was minimal TCS mineralization (<1%) during the 18 week incubation study. Half-life
determination was not possible, and TCS would be regarded as persistent (half-life
>>120 d) in inhibited biotic soils.

68
Biotic treatments in both soils also had minimal mineralization (<0.5%) of added
TCS. Our study suggests the appearance of a metabolite in the biotic treatment in both
soils. The relative proportions of TCS and Me-TCS (of the total 14C measured) in biotic
treatments were utilized to estimate the primary degradation half-life of TCS (Figure. 4-
7a, b).
The ratios of the two compounds were different in the two soils. In the IFS
extracts, ~2-3% of Me-TCS appeared at week 3, and increased to 10% at week 6, and
stayed at ~10% for the rest of the study (Figure. 4-7a). In the ASL soil, Me-TCS also
appeared at week 3 (~15%), and increased to 60% at week 12. After 18 week, 80% of
14C was detected as Me-TCS and 20% as TCS (Figure. 4-7b). The proportions of TCS
and Me-TCS and the variations with time were fitted using zero and first order models
(Table 4-7). The zero order model fitted better (R2 = 0.95-0.97) to the ASL soil data than
the first order model (0.76-0.91), and thus, the zero order model was utilized to estimate
the time taken for 50% of TCS to disappear and 50% of Me-TCS to appear in the soils.
The estimated half-lives were 11 week (77 d) for ASL soil (Figure 4-7b), and >18 week
(>126 d) for the IFS soil (Figure. 4-7a). Our half-life estimations are in contrast to
expectation based on the lability estimations, as the greater labile or bioavailable
fraction was detected in the IFS soil. Thus, it appears that the operationally-defined
extraction scheme described herein may not accurately predict the degradation
potential of TCS. However, our results were consistent with another study (Kwon et al.,
2010) that reported faster TCS transformation in a fine loam soil than a coarse loam
soil. Kwon et al. (2010) attributed the difference to the greater microbial population in
the fine textured soil (9×10⁶ CFU g-1 dry soil) than in the to the coarse textured soil

69
(5×10⁶ CFU g-1 dry soil). Half-lives determined herein are similar to the TCS
disappearance (loss of extractable TCS) half-life of 107 d (Lozano et al., 2010)
determined for a field soil (unknown soil texture) amended with a range of biosolids
application rates (9-25 Mg ha-1) (inherent TCS-15.8 mg kg-1 biosolids). Our estimates
are also consistent with a TCS disappearance (loss of extractable TCS) half-life of 50 to
106 d measured in a laboratory incubation of biosolids-amended fine loam and coarse
loam soil (Kwon et al., 2010). In contrast, Higgins et al. (2011) reported a smaller half-
life (42 d) in a biosolids-amended field soil (silty clay loam). However, the half-life was
approximate, as the study was not adequately designed to quantitatively assess
degradation.
The loss of extractable TCS as the criterion for TCS degradation used in the
above studies is apparently useful for approximating the half-life of TCS, but provides
no information on the degradation metabolites. A half-life range of ~77 to >126 d,
average ~100 d would be a reasonable first approximation of TCS persistence in typical
biosolids-amended soils. We partially accept our hypothesis that TCS is persistent in
biosolids-amended soil, as a chemical is termed persistent if the half-life is >60 d
(USEPA, 1999). The persistence of metabolite (Me-TCS) was not quantified in the
present study and should be a topic of future research.
Our half-life estimation included assumptions that the proportions of TCS and
Me-TCS in the water are same as in the MeOH fraction, and the proportions in
MeOH+acetone are same as in the other non-labile fractions. But, the relative
proportions of TCS and Me-TCS could vary among the various fractions and thus, our
estimate of half-lives could be in error. However, the consistency of half-life values

70
determined in the present study and other studies that used loss of extractable TCS as
the criteria of persistence leads us to believe that our assumptions were justifiable.
Comparison of TCS Persistence in Amended, Un-Amended, and Field Soils
Reported degradation rates of TCS in soils not amended with biosolids are
typically much greater than the rates measured in biosolids-amended soils. Ying et al.
(2007) conducted a biodegradation study in a loam soil (pH 7.4; 13 g kg-1 OC) where
TCS (1 mg kg-1) was spiked in the soil and incubated under aerobic and anaerobic
conditions for 70 d. The half-life, quantified via loss of extractable TCS over time, was
18 d under aerobic conditions, and TCS was reported to be persistent under anaerobic
conditions. A similar laboratory study was conducted by Kwon et al. (2010) with two
soils incubated for 100 d. The soils included a fine loam (pH 7.8; 18 g kg-1) and a coarse
loam (pH 4.7; 6.5 g kg-1) spiked with TCS (1 mg kg-1), either directly or as a part of
biosolids. The half-life estimated (loss of extractable TCS) in the unamended soils was
2 to 13 d, but the addition of biosolids and/or soil sterilization significantly retarded
degradation (Kwon et al., 2010). The reported half-lives were 50 to108 d in biosolids-
amended treatments and 51 to 60 d in unamended sterilized soil.
Al-Rajab et al. (2009) compared TCS mineralization rates in soil (sandy loam;
OM: 37 g kg-1) alone, and soil amended with either liquid or dewatered biosolids. Spiked
TCS mineralized more (~5%) in un-amended soil and soil amended with liquid biosolids
(~17%) than in soil amended with dewatered biosolids (~1%). The greater
mineralization in the liquid biosolids treatment was attributed to biosolids stimulation of
TCS degrading micro-organisms due to readily available OC in liquid biosolids. The
slower degradation in the soil amended with dewatered biosolids was attributed either to
the sorption of TCS to the biosolids in forms that are not readily available to degrading

71
organisms, or to the preference of the soil microbes for biosolids, rather than TCS, as a
carbon source. The assumption of sorption reducing bioavailability in the dewatered
biosolids was also consistent with the zero-order mineralization kinetics determined for
the dewatered biosolids treatments, as compared to the approximately first order
kinetics for soil-alone and the liquid biosolids (Al Rajab et al., 2009). Wu et al. (2009)
conducted a study involving TCS spiked (2 mg kg-1) in two soils (sandy loam and a silty
clay), with and without biosolids, and incubated under aerobic conditions. In contrast to
the previously mentioned studies (Ying et al., 2007; Al-Rajab et al., 2009; Kwon et al.,
2010), Wu et al. (2009) found no significant affect of biosolids on TCS degradation,
despite increased TCS sorption; half-lives were 20 to 58 d, irrespective of the presence
of biosolids. Results of most of the published studies (Ying et al., 2007; Al-Rajab et al.,
2009; Kwon et al., 2010), except Wu et al. (2009), agree with our assessment that the
persistence of biosolids-borne TCS (cake or dewatered) is considerably greater than the
persistence of TCS in un-amended soils.
Persistence of biosolids-borne TCS was estimated in laboratory incubations
here, but persistence is expected to vary under field conditions. Al-Rajab et al. (2009)
opined that TCS degradation rates can vary with temperature, soil moisture conditions,
and the degree of biosolids incorporation in soils. Field amended soils, though
dominantly aerobic, can contain anaerobic micro-sites (especially inside biosolids
clumps) that could hinder microbial degradation process. Field soil temperatures and
moisture contents are also expected to be much more variable and extreme than in
well-controlled laboratory incubations. Field degradation rates can be expected to lie
between the degradation rates determined in aerobic laboratory conditions and those in

72
anaerobic sediments, especially when the fields are even periodically anaerobic or
under drought for a long time. Cha and Cupples (2009) described a field study where
biosolids were applied on ten sites between 2003 and 2007, and Xia et al. (2010)
investigated a site where biosolids had been applied for 33 years. Both studies
estimated the TCS concentrations based on the biosolids loading rates and
approximate biosolids TCS concentrations. The measured TCS soil concentrations in
the two studies [Cha and Cupples (2009); Xia et al. (2010)] were much smaller than the
expected concentrations suggesting significant degradation, but half-lives were not
estimated in the either study. Lozano et al. (2010) suggested TCS degradation half-lives
(t1/2 = 107d) rates from field data (unknown soil texture), similar to our laboratory
determination (t1/2 = 100d). Lozano et al. (2010) suggested a degradation model based
on the field data that could be applicable for laboratory and field conditions. There are a
variety of conditions that can affect the TCS degradation under field conditions, but
based on our data and the available literature, we conclude that laboratory estimations
successfully approximate persistence under field conditions.
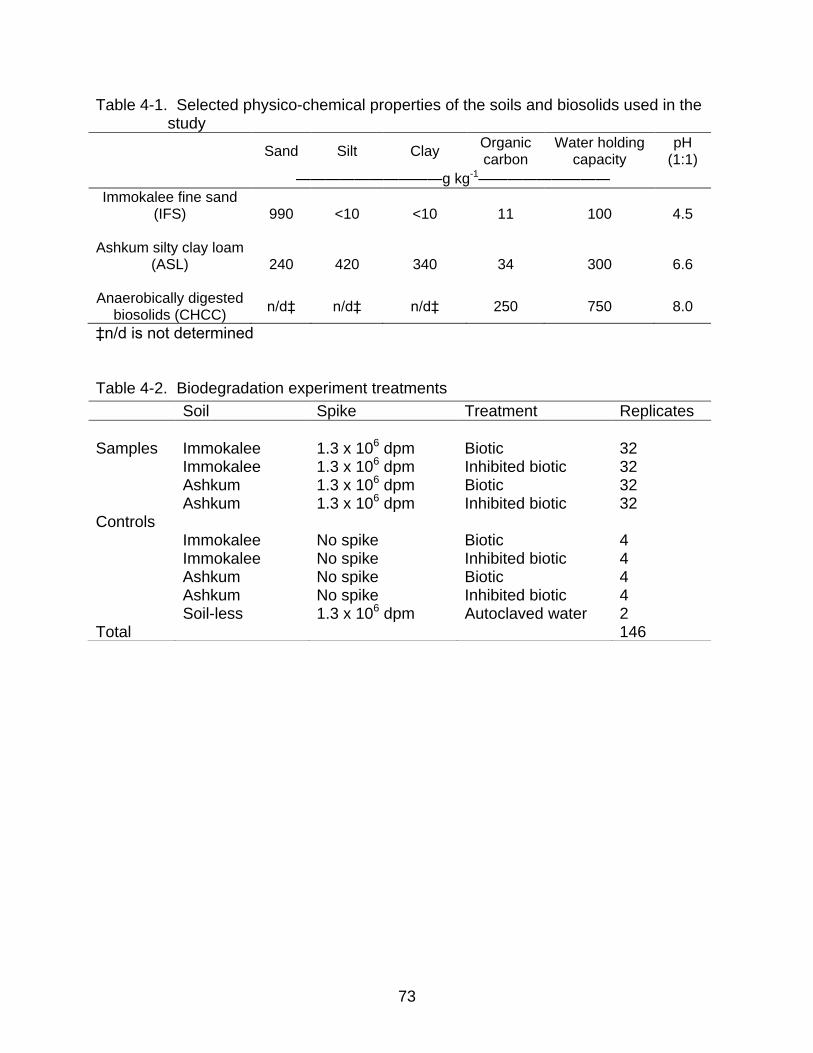
73
Table 4-1. Selected physico-chemical properties of the soils and biosolids used in the study
Sand Silt Clay Organic carbon
Water holding capacity
pH (1:1)
——————————g kg-1—————————
Immokalee fine sand (IFS)
990 <10 <10 11 100 4.5
Ashkum silty clay loam (ASL)
240 420 340 34 300 6.6
Anaerobically digested biosolids (CHCC)
n/d‡ n/d‡ n/d‡ 250 750 8.0
‡n/d is not determined
Table 4-2. Biodegradation experiment treatments
Soil Spike Treatment Replicates
Samples
Immokalee
1.3 x 10⁶ dpm
Biotic
32
Immokalee 1.3 x 10⁶ dpm Inhibited biotic 32 Ashkum 1.3 x 10⁶ dpm Biotic 32 Ashkum 1.3 x 10⁶ dpm Inhibited biotic 32 Controls Immokalee No spike Biotic 4 Immokalee No spike Inhibited biotic 4 Ashkum No spike Biotic 4 Ashkum No spike Inhibited biotic 4 Soil-less 1.3 x 10⁶ dpm Autoclaved water 2 Total 146

74
Table 4-3. Percent recoveries ± standard errors of 14C-TCS in IFS (Immokalee fine sand) biotic soil treatment [week (wk) 0-18].
Time (weeks) Recovery (%)
Fraction wk0 wk2 wk4 wk6 wk9 wk12 wk15 wk18
H20 3.7±0.1 3.5±0.5 2.2±0.1 2.5±0.3 2.2±0.2 2.0±0.2 4.6±0.3 6.4±0.4
MeOH 88±1.7 79±4.3 63±3.3 62±4.5 46±4.6 45±4.4 35±2.3 33±0.4
NaOH 0.1±0.1 6.2±4.9 12±1.9 11±0.5 14±1.3 15±1.5 18±1.7 18±0.9
14CO2 0.0±0.0 0.0±0.0 0.0±0.0 0.0±0.0 0.2±0.0 0.2±0.0 0.4±0.0 0.5±0.0
Combustion 2.0±0.2 5.4±0.4 9.4±1.6 14±0.8 29±3.0 31±2.2 33±1.5 45±5.8
Total 94±3.2 95±7.2 86±1.7 91±3.5 91±1.5 96±5.3 91±3.0 102±5 Overall average total recovery (wk0-18) 92.8±5.9
Table 4-4. Percent recoveries ± standard errors of 14C-TCS in IFS (Immokalee fine sand) inhibited soil treatment [week (wk) 0-18].
Time (weeks) Recovery (%)
Fraction wk0 wk2 wk4 wk6 wk9 wk12 wk15 wk18
H20 3.4±0.4 4.3±1.2 4.2±0.8 4.8±0.3 4.0±0.4 5.2±0.4 8±0.8 7.5±1.7
MeOH 87±3.9 71±2.8 76±2.9 67±0.8 73±4.0 74±2.7 63±5.7 72±4.4
NaOH 1.1±0.1 8.4±1.6 2.3±0.8 7.2±0.8 4.7±0.5 7.0±0.7 23±3.4 6.7±1.5
14CO2 0.0±0.0 0.0±0.0 0.0±0.0 0.0±0.0 0.1±0.1 0.1±0.0 0.4±0.0 0.4±0.0
Combustion 2.9±0.4 11±1.5 3.6±0.5 11±1.8 7.7±1.3 5.6±0.8 8.5±0.8 7.4±0.9
Total 95±3.2 94±1.7 86±1.8 91±1.9 91±2.2 92±1.4 103±6.7 94±6.0 Overall average total recovery (wk0-18) 93.4±5.6

75
Table 4-5. Percent recoveries ± standard errors of 14C-TCS in ASL (Ashkum silty clay loam) biotic soil treatment [week (wk) 0-18].
Time (weeks) Recovery (%)
Fraction wk0 wk2 wk4 wk6 wk9 wk12 wk15 wk18
H20 0.5±0.0 0.2±0.0 0.1±0.1 0.1±0.0 0.3±0.0 0.3±0.0 0.3±0.0 0.4±0.0
MeOH 41±6.4 25±4.0 19±2.3 20±2.8 11±0.5 10±1.3 15±1.1 6.7±2.9
NaOH 1.2±1.5 7.5±3.9 5.5±0.7 5±0.7 3.1±0.3 3.7±0.4 4.6±0.4 2.5±0.8
14CO2 0.0±0.0 0.0±0.0 0.0±0.0 0.0±0.0 0.0±0.0 0.1±0.0 0.3±0.0 0.3±0.0
Combustion 65±5.1 71±5.1 82±4.3 82±6.2 86±9.5 87±9.9 85±5.0 90±3.7
Total 108±9.2 103±7.2 106±4.7 106±6.2 100±9.1 101±8.4 105±6.0 100±5.6 Overall average total recovery (wk0-18) 104±3.2
Table 4-6. Percent recoveries ± standard errors of 14C-TCS in ASL (Ashkum silty clay loam) inhibited soil treatment [week (wk) 0-18].
Time (weeks) Recovery (%)
Fraction wk0 wk2 wk4 wk6 wk9 wk12 wk15 wk18
H20 0.5±0.0 0.3±0.0 0.2±0.0 0.2±0.0 0.3±0.03 0.4±0.0 0.5±0.1 0.3±0.0
MeOH 40±3.0 26±7.4 23±4.0 20±2.9 25±2.5 29±2.8 21±1.7 7.3±1.3
NaOH 2.3±0.2 5.8±2.8 10±1.5 6.4±0.6 10±0.9 11±0.9 18±1.7 6.3±1.8
14CO2 0.0±0.0 0.0±0.0 0.0±0.0 0.0±0.0 0.0±0.0 0.0±0.0 0.1±0.0 0.2±0.2
Combustion 61±3.0 75±7.0 74±6.0 76±8.2 69±5.9 59±5.9 65±3.6 95±6.2
Total 104±5.5 106±7.8 106±4.9 103±7.4 104±6.4 99±6.5 105±4.7 109±6.7 Overall average total recovery (wk0-18) 104±3.2

76
Table 4-7. Rate constants (k) and regression coefficients (R2) obtained for the biodegradation data according to zero and first order models.
Zero order First order k (µg g-1 wk-1) R2 k (wk-1) R2
TCS IFS soil -0.835 0.77 -0.004 0.78 ASL soil -4.452 0.97 -0.036 0.91
Me-TCS
IFS soil 0.823 0.74 0.059 0.70 ASL soil 4.460 0.95 0.089 0.76
Figure 4-1. Schematic of the biodegradation experimental design (Adapted from Snyder, 2009)
Multi-sample rack
Biosolids amended soil sample
Air-flow
Air-flow
Air pump
1 N KOH
Base traps
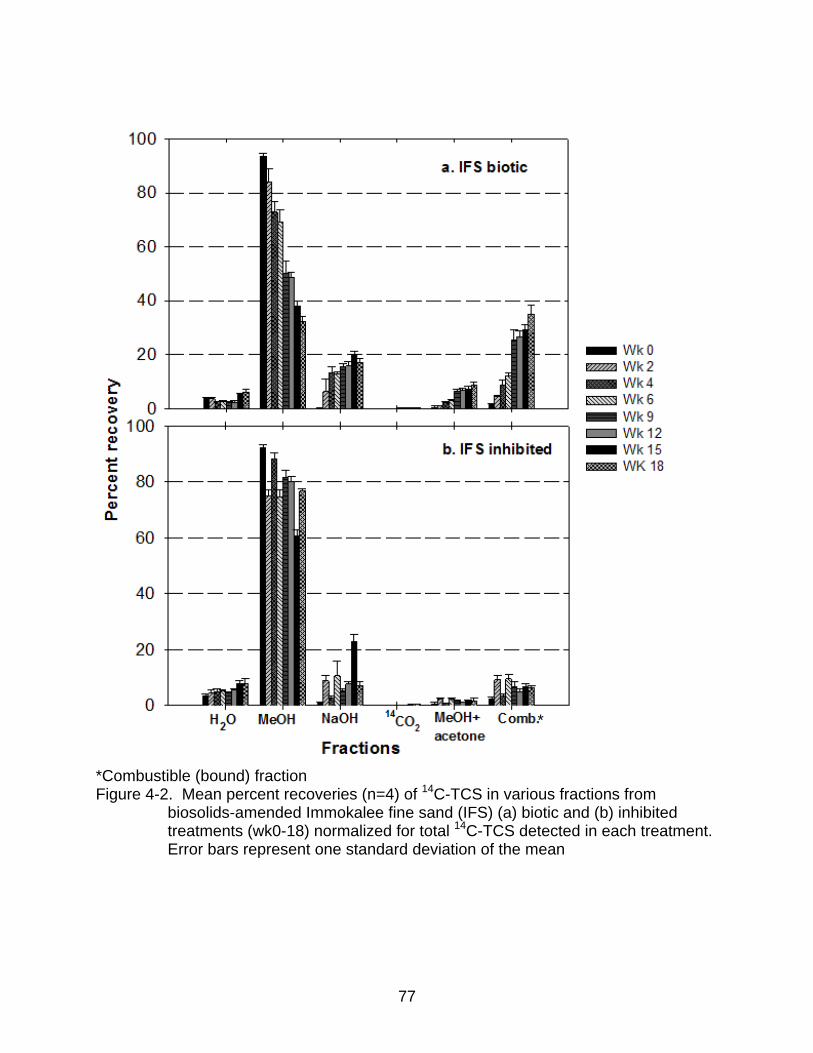
77
*Combustible (bound) fraction Figure 4-2. Mean percent recoveries (n=4) of 14C-TCS in various fractions from
biosolids-amended Immokalee fine sand (IFS) (a) biotic and (b) inhibited treatments (wk0-18) normalized for total 14C-TCS detected in each treatment. Error bars represent one standard deviation of the mean
*
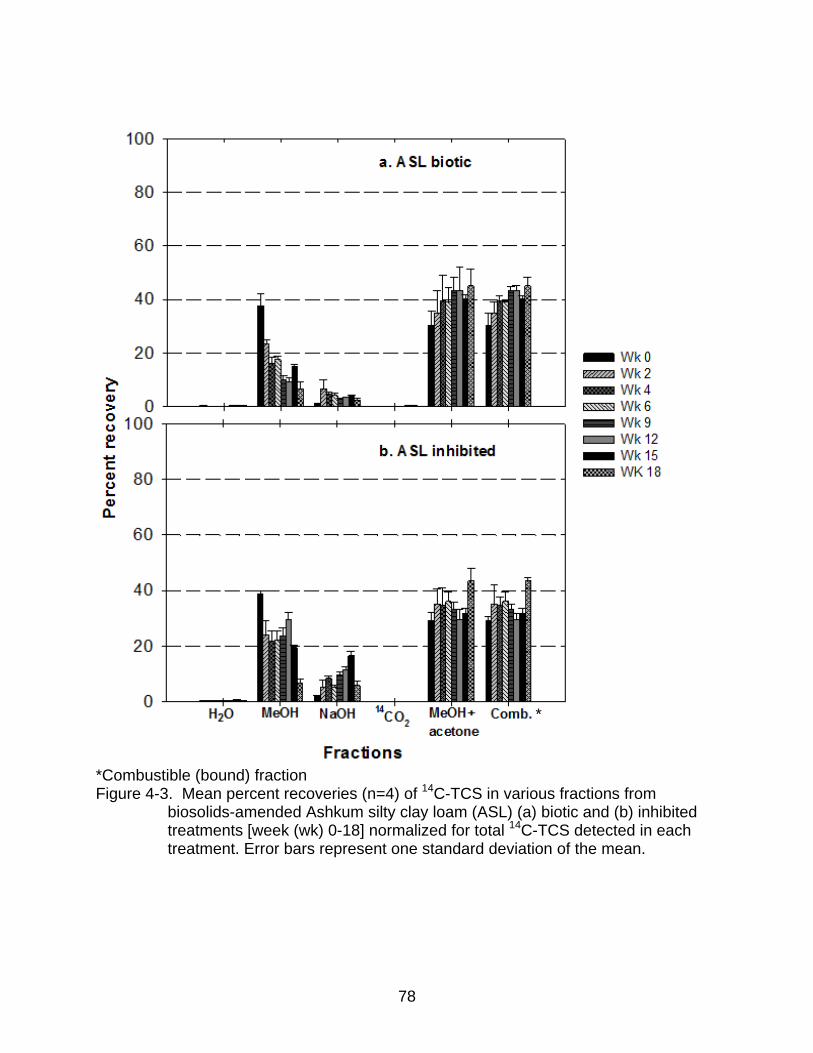
78
*Combustible (bound) fraction Figure 4-3. Mean percent recoveries (n=4) of 14C-TCS in various fractions from
biosolids-amended Ashkum silty clay loam (ASL) (a) biotic and (b) inhibited treatments [week (wk) 0-18] normalized for total 14C-TCS detected in each treatment. Error bars represent one standard deviation of the mean.
*

79
Figure 4-4. Mean cumulative CO2 production ± standard error bars from biosolids-
amended (a) Immokalee fine sand (IFS) (b) Ashkum silty clay loam (ASL) soil treatments over 18 weeks (same letters represent no statistical difference among treatments).
Cum
ula
tive
CO
2 (
mg)
evo
lutio
n
0
5
10
15
20IFS biotic
IFS unspiked biotic
IFS inhibited
IFS unspiked inhibited
Spiked water control
Time (weeks)
0 2 4 6 8 10 12 14 16 18 20
0
5
10
15
20
ASL biotic
ASL unspiked biotic
ASL unspiked inhibited
ASL inhibited
Spiked water control
a
b
c
a
a
b
b
c
Additional azide
Additional azide
a. IFS soil
b. ASL soil
(A) (B)

80
Figure 4-5. Typical RAD-TLC chromatograph (bottom) and a representative ―fingerprint‖ (top) for (a) week 0 extracts, (b) week 3-18 extracts for Immokalee fine sand (IFS) and Ashkum silty clay loam (ASL) soils. Peak 1 represent impurities, peak 2 represents TCS and peak 3 represents Me-TCS.
Figure 4-6. Chemical structure of Triclosan [TCS; 5-chloro-2-(2,4-dichloro phenoxy) phenol], and Methyl triclosan [Me-TCS; 2,4-dichloro-1-(4-chloro-2-methoxyphenoxy) benzene].
Biomethylation

81
Figure 4-7. Primary degradation half-life (d) estimated using a zero-order model from
the proportions of 14C-detected as TCS and Me-TCS for biosolids-amended (a) Immokalee fine sand (IFS) biotic (b) Ashkum silty clay loam (ASL) biotic soil treatments. The intersection of dotted lines in (b) represents our estimation of degradation half-life.

82
CHAPTER 5 IMPACTS OF BIOSOLIDS-BORNE TCS ON SOIL DWELLING ORGANISMS
Background
Toxicity of a chemical depends on the chemical‘s bioavailability in the
environment, rather than total chemical concentration in a soil (Alexander, 1999), as the
latter often fails to predict the toxicity or bioaccumulation in an organism accurately.
Further, a chemical‘s bioavailability and extractability tends to decrease as contact time
between the chemical and the soil increases (Alexander et al., 2000) making
assessment of bioavailability via determination of total concentration problematic.
Bioavailability assessments are performed using toxicity tests (Singh and Ward, 2004).
The tests generally involve exposure of test organism to the chemical of interest at
varying concentrations, and subsequent monitoring of biological end-points (e.g.
mortality, reproduction, growth, and behavioral changes). Effects on reproduction,
growth, and development are the most useful data for conducting a risk assessment.
However, only mortality data [e.g. lethal dose (LD 50) or lethal concentration (LC 50)]
are measured for majority of chemicals (Singh and Ward, 2004). These data may not be
sufficient to protect ecological health, but are critical in conducting screening level risk
assessments in the absence of chronic toxicity or reproduction effect data.
Triclosan is a constituent of various personal care products and is commonly
detected in biosolids (Chapter 2). Concern for TCS effects arise when biosolids are land
applied. A TCS degradation half-life of ~100 d, and the appearance of a metabolite
[Methyl-TCS (Me-TCS)] (Chapter 4) suggest that both TCS and Me-TCS could exist in
soils for extended times and have the potential to adversely affect or bioaccumulate in
soil dwelling organisms. Bioaccumulation studies conducted on aquatic species suggest
83
that algae and snails are good candidates for assessing chemical‘s distribution in the
environment and conducting aquatic risk assessments. Coogan et al. (2007, 2008)
reported bioaccumulation of TCS and the degradation metabolite (Me-TCS) in algae
and snails grown in surface water and streams affected by wastewater effluent. The
measured bioaccmumulation factors (BAFs) were ≥1000, which suggest rapid TCS
accumulation in the organisms in the aquatic environments. However, TCS
bioavailability is likely to be smaller in soils because TCS has hydrophobic properties
and tends to partition to the solid fraction of soils and sediments.
Earthworms are appropriate model organisms for estimating chemical‘s toxicity
and bioavailability in soils. Earthworms live in close contact with soil, have thin
permeable cuticles, and the majority of the worm diet consists of soil (Suter et al.,
2000). Further, earthworms are exposed to chemicals through both ingestion and
dermal contact, and represent a significant portion of diet of many vertebrates (Suter et
al., 2000). Thus, earthworms are often used as surrogates for other soil-dwelling
organisms for conducting ecological risk assessments.
Samsoe-Petersen et al. (2003) found no negative effect of TCS on earthworm
survival at a concentration ≤1,026 mg kg-1 in an artificial soil. Lin et al. (2010)
suggested no adverse effect on the earthworm survival at TCS soil concentrations ≤100
mg kg-1. Kinney et al. (2008) screened 70+ organic compounds in earthworms collected
31 and 156 d post application (18 Mg ha-1) of biosolids to soil. The data suggested TCS
accumulation in earthworms with BAFs ranging from 10.8 to 27. The authors
hypothesized the mobilization of TCS directly from biosolids (solid phase) to the
earthworms. The study results were confounded by the detection of significant TCS

84
(833 µg kg-1) in the control (no amendments for last 7 years) as well as in biosolids-
amended soil. Kinney et al. (2008), however, concluded that anthropogenic exposure to
chemicals like TCS is widespread, bioaccumulation is likely, and urged further
quantification. Reiss et al. (2009) conducted a terrestrial risk assessment for TCS and
addressed the exposure to TCS experienced by earthworms (no BAFs reported),
terrestrial plants and soil organisms from biosolids-amended soil as well as secondary
exposure to birds and mammals. Lin et al. (2010) conducted a toxicity test on
earthworms (Eisenia fetida) exposed to TCS spiked in soil (no biosolids). The study
examined the activity of enzymes such as catalase, superoxide dismutase to assess
TCS toxicity. Results suggested that TCS (>1 mg kg soil-1) is genotoxic and caused
oxidative stress in earthworms. Unfortunately, Lin et al. (2010) reported no
bioaccmulation data. Higgins et al. (2011) examined TCS bioaccumulation in
earthworms grown in field soils collected from Illinois previously amended with biosolids.
The bioaccumulation results were variable with no clear relationship between TCS
exposure levels and concentration in the earthworms. The authors acknowledged that
the bioaccumulation was estimated based on a few samples (no replicates), and the
internal inconsistency of the data led to inconclusive results.
Internally consistent earthworm toxicity data for un-amended soils (Lin et al.,
2010; Samsoe-Peterson et al., 2003) generally suggest minimal toxicity to earthworm
health. However, bioaccumulation data were variable in earthworms grown in TCS
spiked un-amended soil and biosolids-amended soil. Accurate estimates of biosolids-
borne TCS toxicity and bioaccumulation are critical to accurately assessing ecological
health risk.

85
We hypothesize that:
Biosolids-borne TCS is not toxic to earthworms but can accumulate in their tissues.
The extent of accumulation in earthworms varies with soil TCS concentration, and conditions in which earthworms are grown (laboratory vs field).
The objective was to investigate the toxicity and bioaccumulation of biosolids-
borne TCS to earthworms. The laboratory study was conducted following the Office of
Prevention, Pesticides and Toxic Substances (OPPTS) Earthworm Sub-chronic Toxicity
Test guideline (Guideline 850.6200) (USEPA, 1996b). The guideline requires a range-
finding and a definitive test, and prescribes direct addition of the chemical of interest to
a natural soil. The protocol was modified herein to deliver TCS as a component of
biosolids in an effort to better mimic the primary mechanism of TCS transfer to the soil
through biosolids. To estimate the longer-term bioavailability of TCS, we also analyzed
earthworms recently collected from a field soil previously amended with biosolids and a
representative control site.
Material and Methods
Chemicals, Biosolids and Soils
Triclosan (CAS No. 101-20-2; >99.9% purity) standard was purchased from
United States Pharmacopeia (USP) (Maryland, USA). Internal standard (13C12-TCS),
pyridine, bis (trimethylsilyl) trifluoroacetamide (BSTFA) +1% trimethylchloro silane
(TMCS) were obtained from Sigma-Aldrich (St. Louis, MO). Methyl-TCS standard was
purchased from Wellington Laboratories (Shawnee Mission, KS). Potassium chloride
and solvents [methanol (MeOH), acetone] of HPLC grade or greater were purchased
from Sigma Aldrich (St. Louis, MO), JT Baker (Phillipsburg, NJ) or Fisher Scientific
(Atlanta, GA). Anaerobically digested cake biosolids (identification code: CHCC) was

86
collected from a domestic WWTP in Illinois; this sample had an inherent TCS
concentration of 5 mg kg-1 (Chapter 2). Two soils, an Immokalee fine sand (IFS) (sandy,
siliceous, hyperthermic Arenic Alaquods), and the Ashkum silty clay loam (ASL) (fine,
mixed, superactive, mesic Typic Endoaquolls) were collected from sites with no known
history of receiving land-applied biosolids or sludge. An artificial soil (68% silica sand,
20% kaolin clay, 10% sphagnum peat moss, 2% calcium carbonate; all by weight.) was
prepared by mixing the various ingredients in the laboratory as prescribed by OPPTS
guidelines (USEPA, 1996b) and utilized in the earthworm toxicity test along with the two
natural soils. The earthworms were purchased from Carolina biologicals (NC). Prior to
use, the earthworms were grown in moist peat moss (growing medium) and fed with
worm food (Magic products, WI) each day for 3 weeks.
Range-Finding Toxicity Test Design
A range-finding test was conducted to identify the appropriate range of biosolids-
borne TCS concentrations for a subsequent definitive toxicity assessment. Two-gram
samples of oven-dry CHCC biosolids (TCS = 5 mg kg-1) were spiked with 0, 10, 100,
1000, or 10,000 mg TCS kg-1 biosolids using MeOH as the carrier solvent, and were
subsequently dried, re-wetted, and equilibrated for 48 h. Treatment spikes were in
addition to the biosolids inherent TCS concentration, so the nominal final concentrations
were 5, 15, 105, 1005, and 10,005 mg TCS kg-1 biosolids. The EPA guideline
prescribes the use of an artificial soil to avoid synergistic effects with unknown
chemicals present in natural soils. We also included two natural soils to estimate TCS
toxicity in real world scenarios.
Biosolids were amended to 200 g (dry wt.) of the artificial, IFS and ASL soils at a
22 Mg ha-1 equivalent rate in 800 mL glass Mason jars. The major physico-chemical

87
properties of the soils and biosolids used in the toxicity and bioaccumulation study are
described in Table 5-1. Earthworms were hand picked from the growing medium and
washed with deionized water before use in the toxicity test. The soils were brought to
field capacity (artificial, 35%; IFS, 10%; ASL, 30% by wt.) and ten Eisenia fetida
earthworms were added to each sample. Also included were un-amended soil control
to quantify potential effects of biosolids addition, and carrier solvent-free biosolids-
amended soil control (no additional TCS spike) to quantify carrier solvent effect. Lids
were placed loosely on top of the incubation jars to reduce moisture loss and to prevent
earthworm escape. Dead earthworms at the soil surface were counted and removed as
necessary each day, and the number of living earthworms were tallied each week for
four weeks (28 d). Replicates are not required by the OPPTS range-finding guideline,
nor are extraneous food sources. The USEPA guideline also prescribes that the test
results become unacceptable if ≥20% earthworm die-off occurs in the control.
Definitive Toxicity Test Design
Results of the range-finding test suggested a narrower range of TCS
concentrations for the definitive test with the IFS soil. Thus, the test included biosolids
spiked at concentrations of 2.5, 5, 10, 50, and 100 mg additional TCS kg-1 biosolids.
The test procedure was same as the range-finding test except that the definitive test
included four replicates for each treatment. Accounting for the inherent TCS
concentrattion of 5 mg kg-1, the nominal final concentrations were 5, 7.5, 10, 15, 55 and
105 mg kg-1 biosolids. Also included were the soil-only control and the solvent-free
biosolids-amended soil control. Statistical analyses were performed with SAS software,
version 9.1 (SAS Institute, 2002) using the Tukey‘s studentized range test (HSD) to
assess the treatment effect.

88
Earthworm Bioaccumulation Test
Design for the laboratory study
An earthworm TCS bioaccumulation test was run concurrently with the definitive
earthworm toxicity test. The test included both IFS and ASL soils to quantify TCS
earthworm accumulation in soils of different textures. The TCS treatments included a
lower concentration range (as determined by the range-finding test) as live earthworms
were required for quantifying chemical accumulation. Two-gram samples of CHCC
biosolids were spiked with 0, 2.5, 5, 10, 50, and 100 mg additional TCS kg-1 biosolids
and amended to the IFS and ASL soils, in quadruplicate as in the definitive toxicity test.
The nominal final concentrations were 5, 7.5, 10, 15, 55 and 105 mg TCS kg-1 biosolids.
Surviving earthworms at the end of week 4 (28 d) were removed, counted, washed, and
weighed. The earthworms were allowed to depurate for 24h in petridishes lined with
moistened filter paper (Banks et al., 2006), and were subsequently frozen until
analyses. We recognize that the birds and worm-eating animals feed on non-depurated
earthworms, but depuration is prescribed by the OPPTS procedure (USEPA, 1996b).
Depuration allows earthworms to excrete TCS-contaminated soil or organic matter
remaining in the gut, so that the measured TCS concentration in earthworms reflects
accumulation in the tissue, rather than TCS sorbed to gut contents.
Bioaccumulation in field soils
Longer-term bioavailability of TCS was estimated by utilizing earthworms and
corresponding soil samples collected at a field site in Illinois.The site received a single
application of CHCC biosolids (application rate of 228 Mg ha-1) in 2008 and the
earthworms were collected in 2010. Earthworms were also collected from an adjacent
control site (18 m apart; same soil texture) that had no history of biosolids application.

89
The earthworms were collected utilizing the hot mustard extraction method described in
Lawrence and Bowers (2002). Briefly, a mustard (allyl isothio cyanate) solution is
applied to the soil surface which encourages earthworm emergence to escape the
mustard‘s irritant properties. The method was efficient in collecting a consistent number
(≥20 from each location) of earthworms and did not require digging or hand-sorting. The
collected worms were kept in wet peat moss in aerated bags and promptly shipped to
the laboratory under ice packs. Upon arrival, earthworms were cleaned with DDI water
to remove peat moss residue, kept in petridishes with wet filter paper and allowed to
depurate for 24 hours.
Sample extraction and derivatization for earthworm bioaccumulation
A sample extraction technique was modeled after those described by Higgins et
al. (2009) and Snyder et al. (2011) with few modifications. Laboratory collected frozen
earthworms were thawed, and fresh earthworms from the field were transferred to
aluminum weigh boats, dried at 50°C to a constant weight, and ground. The dried and
ground tissue (0.5-1 g) was loaded into 25 mL glass centrifuge tubes. A solvent mixture
(10 mL) of MeOH+acetone (50:50, v/v) was added to each centrifuge tube. The
extraction was performed on a platform shaker for 18 h, followed by 60 min of
sonication (Branson 2210, Danbury, CT; temp. 40°C, 60 sonications min-1) in a water
bath. Suspensions were centrifuged at 800 x g, and the supernatant was transferred to
20 mL glass scintillation vials. The extraction procedure was performed twice and the
extracts were combined and dried under a gentle nitrogen stream. The extracts were
reconstituted in 1 mL of MeOH and transferred to 2 mL microcentrifuge tubes. The
microcentrifuge tubes were then centrifuged at 18,000 × g for 30 min, supernatant
removed and transferred to 1 mL GC vials, 13C12-TCS was added, and the mixture dried

90
under a mild N2 stream. We included solvent controls (containing no TCS) that were
subjected to the same extraction procedure to confirm that TCS was not introduced
during the extraction. The derivatization was performed according to the method by
Shareef et al. (2006) with slight modification. Briefly, the dried contents were
reconstituted in a mixture of 4:1 of derivatization agent BSTFA +1% TMCS and the
solvent (pyridine), vortexed for 10 s, and heated in a dry bath for 1h. The samples were
then transferred to fresh GC vials with glass inserts and Teflon lined caps. Fresh
earthworms (untreated) were also depurated, frozen, thawed and spiked with known
concentrations of TCS, 13C12-TCS and Me-TCS. The spiked samples were incubated for
24 h to allow carrier solvent evaporation. Earthworms containing spiked chemicals were
extracted with the same solvent mixture of MeOH+acetone (as described above) to
determine percent recoveries which were >90% for spiked TCS and Me-TCS.
Instrument analyses and quantification
The samples obtained after the derivatization step (as described above) were
analyzed by splitless injection (5 µL) on the Varian 4000 Gas Chromatograph (GC)
equipped with Restek Rxi-5Sil column coupled with Varian 4000 MS/MS. The GC
column was initially held at 100ºC for 1 min, and then increased to 310ºC at a rate of
10ºC min-1 with no final hold time. Helium was used as a carrier gas. The ion trap,
manifold and transfer line temperatures were 200, 80 and 270ºC, respectively, and the
ionization source was internal/electron ionization. Data acquisition monitored two
fragment ions for each compound. The ion masses were m/z of 345/347 for TCS
trimethylsilylether, 302/304 for TCS-OMe, and internal standard 13C12 TCS-
trimethylsilylether mass was monitored at 357/359. The samples ran for 22 minutes with
an average retention time of 14.8 min for all compounds. For quantification, an 8-point

91
internal calibration curve was generated in the TCS concentration range of 1-1000 ng g-
1 with an average R2 >0.999. The LOD was 0.22 µg g-1 and LOQ was 0.7 µg g -1 for both
TCS and Me-TCS in the earthworm tissue. The LOD and LOQ values were calculated
as 3-fold and 10-fold, respectively, the standard deviation in the signal from multiple
runs of the lowest calibration standard (Signal/Noise >10) (USEPA, 1984). The details
of detection limits and recoveries are provided in the Appendix C.
Results and Discussion
Range-Finding Toxicity Test
Biosolids TCS concentrations ≤10,005 mg kg-1 had minimal adverse effect on
earthworm survival in the ASL and artificial soils. In the ASL soil, all the earthworms in
all the treatments survived at the end of week 4, except a 10% die-off at a concentration
of 1005 mg kg-1 (Figure 5-1b). Similarly, in the artificial soil, TCS concentration did not
adversely affect the worm survival, except for a 20% die-off at a concentration of 105
mg kg-1 and 10% die-off at 5 mg kg-1 (solvent-free) (Figure 5-1c). We attributed the
death of 20% of the earthworms (2 earthworms out of 10) to natural causes (such as
lack of sufficient food or stress), due to lack of adverse effect at greater (>105 mg kg-1)
concentrations. The data suggest that TCS concentration ≤10,005 mg kg-1 biosolids
(equivalent to an amended soil concentration of 100 mg kg-1) have no adverse effect on
earthworm survival in the ASL and the artificial soils.
Earthworms in the IFS soil were adversely affected by TCS addition. By week 4,
nearly 100% mortality occured at TCS concentrations ≥5 mg kg-1 biosolids (Figure 5-
1a). There was a 25% die-off at week 4 even in the soil-only control (no biosolids). Due
to the >20% die-off in the control, the experimental results were unacceptable. The die-
off could be attributed to the lack of sufficient food for the worm survival without

92
biosolids, as no extraneous food source was supplied. The earthworm survival differed
in the TCS treatments and the solvent-free control (biosolids-amended) had a 100%
die-off by week 4. We tentatively attributed the die-off in the solvent-free control to the
absence of solvent residues acting as a food source to the earthworms. No further
investigation for the causes of the die-off was performed as it was a range-finding test.
Definitive conclusions and calculation of LC50 values can only be performed in the
definitive study, which includes replicates. However, the EPA guidelines do not require
a definitive test if the LC50 value is greater than the highest concentration tested (i.e.
10,005 mg kg-1 biosolids). Thus, due to the lack of adverse effects in the ASL and
artificial soils, only the IFS soil was utilized in the definitive toxicity test.
Definitive Toxicity Test (IFS Soil)
The mean earthworm survival was >90% in all the treatments as well as in soil-
only control, except at concentrations of 10 and 15 mg TCS kg-1 biosolids (Figure 5-2).
Unlike in the range-finding test, the soil-only control (no biosolids) appeared to provide
sufficient nutrients for earthworm survival up to week 4. There were no adverse TCS
treatment, biosolids addition, or carrier solvent addition effects on the survival of the
earthworms. The earthworm survival was slightly affected in the concentration range of
10 to 105 mg TCS kg-1 biosolids, but there was no statistical difference among the
various treatments due to the large standard deviations (Figure 5-2). Thus, no adverse
effect was observed on the earthworm survival up to a TCS biosolids concentration of
105 mg kg-1. Adverse effects were not anticipated due to Me-TCS exposure, as a
suggested degradation half-life of TCS is at least 77 d (Chapter 4), so significant Me-
TCS formation was not expected in the short length (28 d) of our present study. A
definitive earthworm LC50 value cannot be calculated from our study because there was

93
no significant adverse effect up to the maximum tested concentration. The estimated
LC50 value in the IFS soil is >105 mg TCS kg-1 biosolids. If the biosolids LC50 value is
~100 mg TCS kg-1, the application of biosolids at 22 Mg ha-1 followed by incorporation
at 15 cm depth (~100 fold dilution of the TCS concentration), results in LC50 of ~1 mg
TCS kg-1 soil. Similarly, the range-finding test cannot be used to calculate an LC50 value
as no replicates were involved; however, a rough approximation yields an LC50 value of
>10,005 mg TCS kg-1 biosolids or >100 mg TCS kg-1 soil for the artificial and the ASL
soils.
The ecological structure activity relationship (ECOSAR) program (USEPA,
2009b) is a model based on the structure-activity relationship concept, and predicts the
aquatic toxicity of a chemical. The toxicity is estimated based on the similarity of a
chemical‘s structure to other chemicals for which the aquatic toxicity has been
previously measured. Extrapolation from aquatic to terrestrial toxicity may not be
accurate (Hartnik et al., 2008), but for the sake of comparison, ECOSAR was utilized to
calculate LC50 value for terrestrial species. Most calculations in the ECOSAR program
are based on the chemical‘s Kow and do not consider soil/sediment parameters where
the organism is growing. The earthworm 14-d LC50 value predicted by the ECOSAR
program is ~22 mg TCS kg-1 soil. Our estimated LC50 value in IFS soil (~1 mg kg-1) was
much smaller, and the LC50 value in the other two soils (>100 mg kg-1) was considerably
greater than the value calculated by the ECOSAR. Thus, the ECOSAR underestimates
the toxicity in one (IFS) soil and over-estimates the toxicity in the other two (artificial and
ASL) soils. The model estimated LC50 values should be used with caution.

94
Our toxicity data in the artificial and the ASL soil are consistent with a short-term
(2 week) Danish study (Samsoe-Petersen et al., 2003) in which there was no negative
effect of TCS on earthworm survival at a concentration ≤1,026 mg kg-1 in a similar
artificial soil. A 14-d TCS exposure study (Lin et al., 2010) was conducted in a soil
similar in texture to ASL soil, but with lower OC content (pH = 8.1, OC = 12.8 g kg-1).
Data suggested no adverse effect on the earthworm survival at TCS soil concentrations
≤100 mg kg-1. Although our results were in agreement with the published studies, the
LC50 values determined in our short-term study are best regarded as estimates, due to
lack of adverse effects at the highest concentration tested. Future investigations could
include long-term TCS impact studies or studies using greater TCS concentrations
although greater concentrations are environmentally unrealistic. Further, toxicity effects
of major metabolite of TCS (Me-TCS) were not assessed in our study and should be
addressed.
Bioaccumulation Laboratory Study
The measured TCS concentrations accumulated by earthworms incubated in two
soils amended with biosolids-borne TCS are presented in Tables 5-2 and 5-3. The
earthworm tissue concentrations were utilized to calculate BAF values for each soil.
Degradation study results (Chapter 4) suggested the formation of Me-TCS in the
biosolids-amended soils (t1/2 ~77d). We might expect formation of Me-TCS in amended
soils and/or biosolids and possible subsequent accumulation in earthworms. However,
given the short length of the earthworm bioaccumulation study (28 d) and a suggested
half-life of at least 77 d (Chapter 4), we did not expect significant Me-TCS formation
from the added TCS. In addition, the Me-TCS concentration in the biosolids used in this
study was below the LOQ (0.7 mg kg-1) of the instrument. Thus, as expected, we did not

95
detect Me-TCS in earthworms exposed to the incubated amended soils or Me-TCS
inherent to the biosolids.
Uptake assessment occured through the calculation of bioaccumulation factors
(BAFs) expressed as the ratio of TCS concentration in the earthworm tissue to the TCS
concentration in the soil in which the worm was exposed to TCS. The average BAF
values in the two soils, irrespective of the spiked TCS concentration, were 6.5 ± 0.84 for
the IFS soil (Table 5-2) and 12 ± 3.08 for the ASL soil (Table 5-3). The average values
were significantly different (p<0.05) from each other. The difference in BAFs in the two
soils might reflect differences in physico-chemical properties of the two soils. The soils
differed in native soil organic carbon (OC) contents (11 g kg-1 for IFS soil and ~34 g kg-1
for ASL soil, Table 5-1), suggesting more accumulation in soil with greater OC content.
Application of biosolids with an OC content of 250 g kg-1 at a rate of 22 Mg ha-1 adds an
additional 2.7 g kg-1 of OC to both soils, but the total OC in the amended IFS soil (13.7 g
kg-1) was still smaller than the amended ASL soil (36.7 g kg-1). The trend is possibly due
to earthworm‘s preferential feeding on the soil with greater OC content, and ingesting
both OC and TCS that were associated with the biosolids. Our results were consistent
with a bioaccumulation study (Snyder et al., 2011) conducted on a similar antimicrobial
compound triclocarban (TCC). The measured BAF value was greater in the silty clay
loam (20 ± 2.1) than in the sand (18 ± 3.5), but the results were not significantly
different. Luo et al. (2008) opined that besides the OC content, the bioaccumulation
may also vary with the chemical tested, and perhaps with the composition of organic
matter.

96
The BAFs obtained in our study were generally not a function of spiked TCS
concentration. In the IFS soil, the BAFs were not significantly different in various TCS
treatments. Some concentration dependent accumulation was observed in the ASL soil,
with significantly greater accumulation at a concentration of 0.10 mg TCS kg-1 soil,
however, there was no significant difference in accumulation among other TCS
treatments. Kinney et al. (2008) determined earthworm TCS BAFs of 10.8 and 27 for a
soil (sandy clay loam; OC-12 g kg-1) amended with biosolids either 31 or 156 d
previously. The inherent TCS concentration of biosolids applied was 10.5 mg kg-1.
Earthworm samples were collected from a soybean field site receiving biosolids as a
fertilizer for the first time. The range of BAFs obtained in our study (6.5-12.7) is within
the range reported by Kinney et al. (2008), despite the shorter (28 d) exposure time
used in our study. Further, we used Biosolids-Amended Soil Level IV (BASL4) model
(Webster and Mackay, 2007) to estimate earthworm bioaccumulation. The program
utilizes the concept of fugacity, and models chemical distribution in soil by assuming
that the medium in which organisms are growing could be either at equilibrium, steady-
state, or non-steady state. In our study, earthworms were exposed to soil in closed jars,
so we can assume a steady-state condition for modeling purposes. The model
parameters were selected based on the physiochemical properties of TCS and soil type
where the organisms were grown. BASL4 assumes that the properties of invertebrate
and mammals are representative of earthworms and shrews, respectively (Hendriks et
al., 1995; Armitage, 2004). The BASL4 predicted average BAF value for IFS soil (5.0 ±
0.0) was reasonably close to the measured value (6.5 ± 0.84) (Table 5-2). For the ASL

97
soil, the predicted average BAF value (2.2 ± 0.0) was much less than the measured
value (12 ± 3.1) (Table 5-3).
The partitioning theory for traditional hydrophobic organic contaminants (HOC) is
commonly used to predict the partitioning of chemicals to invertebrates from sediments
(Higgins et al., 2009). The bioaccumulation potential is calculated by using the lipid
normalized worm and organic carbon normalized soil chemical concentrations. The
HOC theory predicts a biota-sediment accumulation factor (BSAF) of approximately 1.6
for nonmetabolized organic compounds if the log Kow of a compound is less than 6
(Morrison et al., 1996).
The BSAF values were estimated in our study as:
org dry wt ococ lip
soil dry wt lip
C , /fBSAF ,
C , /f (5-1)
The f lip (fraction of lipid) in the earthworm is 0.032 ± 0.01 (Higgins et al., 2010)
and foc (fraction of organic carbon) is 0.011 for IFS soil and 0.034 for ASL soil (Table 5-
1). The estimated BSAF values were 1.0 ± 0.27 for the IFS soil and 9.63 ± 3.29 for the
ASL soil. A lower than expected BSAF for the ASL soil may suggest either the
metabolism of TCS or decreased TCS bioavailability. Alternatively, the difference likely
suggests that HOC theory does not accurately predict the TCS accumulation in
earthworms. Higgins et al. (2011) suggested that bioaccumulation of a similar chemical
(TCC) was somewhat consistent with the HOC theory; but, some reduction in TCC
bioavailability was observed.
The HOC theory assumes equilibrium between the soil solid and soil water
phases, which is not always true. Further, the expected BSAF value is ~ 1.6 when the
earthworms acquire the chemical only from the soil solution. Soil dwelling earthworms

98
can accumulate TCS from the soil solution, direct ingestion of soil or biosolids and from
direct partitioning of biosolids-borne TCS to the worm tissue (Kinney et al., 2008).
Higgins et al. (2011) examined the bioaccumulation of TCS in earthworms grown in field
soils previously amended with biosolids. The range of BSAF values was 0.31 to 1.2,
and there was no dependence of bioaccumulation on TCS exposure levels. After
adjusting the BSAF values from Higgins et al. (2011) to dry weight of soil and
earthworms, the estimated BAF values were 2 to 2.3 in the sand and 1.3 in the silty clay
loam. The BAF values estimated using Higgins et al. (2011) BSAF data were smaller
than the range of BAF values obtained in our study (6.5-12.7). The difference in values
may be attributed to the lack of replicates in the Higgins et al. (2011) study that
minimizes the significance of their data.
The TCS concentration in earthworm tissue can also be calculated using a
mechanistic approach proposed by Jager (1998) that assumes hydrophobic partitioning
between the soil pore-water and the earthworm tissue. The bioconcentration factor in
that case can be calculated as:
0.84 0.01*
*
owearthworm
oc oc
KBCF
f K (5-2)
Inserting the foc (fraction of soil organic carbon) value of 0.011 (IFS) and 0.034
(ASL), a log Kow of 4.8 and log Koc in biosolids-amended soils of 4.26 (Agyin-Birikorang
et al., 2010), yields a bioconcentration factor of 1.85 for IFS soil and 4.30 for ASL soil.
The values underestimate the potential for bioaccumulation reported in the literature
and our measured values. Soil pore-water earthworm models have been criticized
(Suter et al., 2000) for potentially underestimating the contaminant uptake in cases
where absorption via gut is the primary mechanism (e.g. earthworms).

99
Models (BASL4 and partitioning) appear to underestimate the bioaccumulation
potential of TCS by earthworms, as the models assume bioaccumulation to occur only
from soil pore-water. Earthworm bioaccumulation of TCS also does not appear to follow
HOC theory. Thus, the various estimates should be used with caution.
Bioaccumulation Field Test
The average TCS concentration measured in the earthworms collected in a field
equilibrated soil was 4.3 ± 1.9 mg kg-1 corresponding to a BAF value of 4.3 ± 0.7 (Table
5-4). Grab soil samples collected from the same area where the earthworms were
collected averaged 0.99 mg TCS kg-1amended soil. The BAF value in the earthworms
collected from the three locations within the amended soil were 2.68 to 5.93. The TCS
concentrations in the earthworm tissues were variable among the three locations,
ideally representing varying activity patterns in the soil. Earthworms occupy a range of
soil depths depending on the season, species and life history stage (Bouche and
Gardner, 1984) and may be exposed to varying amounts of chemical. Triclosan
concentrations were non-detect in earthworms and soil collected from a representative
control site.
The texture of the field soil was similar to the ASL soil used in our laboratory
study, but the average BAF value in the field collected earthworms was significantly
smaller (p<0.05) than the average values in laboratory study. Even when we compare
the average BAF obtained in the field soil with the BAF in the similar ASL laboratory
treatment (1 mg TCS kg-1 soil, Table 5-3), the BAF was significantly greater in the
laboratory study (12 ± 3.1) than in the field soil (4.3 ± 1.9). The difference may reflect
greater TCS availability under laboratory conditions, as TCS was spiked to the
laboratory study soils as opposed to inherent TCS in field soils; the inherent log Kd

100
values tend to be greater than the spiked log Kd values (Chapter 3). We also speculated
that high rate of biosolids-borne TCS applied in the field conditions, though dominantly
aerobic, may experience anaerobic micro-sites (especially inside biosolids clumps) that
could hinder the chemical‘s movement and bioavailability and, hence, lower the
accumulation in earthworms. The BAF values (2.68-12.7) (laboratory and field) in the
present study was smaller than the BAF values (10.8-27) reported by Kinney et al.
(2008). The implications of earthworm bioaccumulation to TCS ecological risk
assessment are unknown, but Snyder (2009) estimated that the earthworm–predator
pathway was limiting in a biosolids-borne TCC risk assessment. The risk estimation of
biosolids-borne TCS to earthworms and other organisms are critical to identify potential
pathways of concern.
Biosolids-borne TCS accumulates in, but is not toxic to, earthworms (hypothesis
1). We partially accept the second hypothesis also, as the earthworm accumulation
varied significantly between laboratory and field conditions, but the accumulation did not
vary with TCS concentration in biosolids. Implications of TCS accumulation in
earthworms are assessed via a risk estimation of biosolids-borne TCS (Chapter 9).

101
Table 5-1. Major physico-chemical properties of the soils and biosolids utilized in the present study
Soil Texture Organic carbon pH (1:1)
g kg-1
Immokalee fine sand (IFS) Sand 11 4.5 Ashkum silty clay loam (ASL) Silty clay loam 34 6.6
Artificial soil Peat moss-10% Ca carbonate- 2%
48 7.7
Biosolids (CHCC) n/d‡ 250 8.0
Field control landscaping Clay loam 40 7.8 Field amended landscaping Silty clay loam 80 7.1
‡n/d is not determined

102
Table 5-2. Measured [average; n = 4 and standard error (SE)] TCS concentrations (mg
kg-1) and bioaccumulation factors (BAFs) in earthworms grown in the Immokalee fine sand (IFS) (same letters represent no statistical difference among treatments).
Table 5-3. Measured (average; n = 4 and SE) TCS concentrations (mg kg-1) and
bioaccumulation factors (BAFs) in earthworms grown in the Ashkum silty clay loam soil (ASL) (same letters represent no statistical difference among treatments).
Nominal spiked soil concentration
Measured earthworm tissue
concentration
Mean BAFs† dry wt.
Calculated BAF (BASL4)
–––––––––mg kg-1–––––––––– 0 <LOQ‡ <14 2.2
0.025 <LOQ‡ <4.7 2.2 0.05 1.1±0.1 7.4±2.3 a 2.2 0.10
1 1.6±0.3
12.6±0.7 18±1.3 b 12±0.7 a
2.2 2.2
Average 12±3.1 § 2.2±0.0
† The BAF values were calculated by accounting for the total TCS concentration (5 mg kg-1
of inherent biosolids and the spiked)
‡<LOQ is not quantifiable (Signal/Noise >10). The limit of quantitation of TCS was 0.7 ug g -1
for the earthworm tissue. The concentrations < LOQ were estimated as ½ the LOQ of the instrument. § The average BAFs excluded the samples where TCS concentrations in earthworms are <LOQ
Nominal spiked soil concentration
Measured earthworm tissue
concentration
Mean BAFs† dry wt.
Calculated BAF (BASL4)
–––––––––mg kg-1–––––––––– 0 <LOQ ‡ <7 5.0
0.025 0.5±0.0 7.3±1.9 a 5.0 0.05 0.5±0.1 4.9±1.4 a 5.0 0.10 0.5 1
0.6±0.1 4.9±0.5 7.3±1.0
4.3±1.4 a 8.8±0.9 a 7.3±1.0 a
5.0 5.0 5.0
Average 6.5±0.8 5.0±0.0

103
Table 5-4. Measured TCS concentrations (mg kg-1) and bioaccumulation factors (BAFs) in the earthworms collected from the field equilibrated biosolids-amended landscaping soil (same letters represent no statistical difference among treatments).
Inherent amended soil concentration
Measured earthworm tissue concentration
BAFs dry wt.
–––––––––mg kg-1–––––––––– Location 1 0.99 2.6±0.2 2.7±0.2 a Location 2 0.99 4.4±2.5 4.4±2.5 a Location 3 0.99 5.9±0.9 5.9±0.9 a Overall average 4.3±1.9 4.3±0.7

104
Figure 5-1. The earthworm survival (%) as affected by the biosolids-borne TCS concentration and the duration of earthworm exposure (weeks) in the biosolids-amended (a) Immokalee fine sand (IFS), (b) Ashkum silty clay loam (ASL), and (c) Artificial soils, range-finding test
Eart
hw
orm
Surv
ival (%
)
0
20
40
60
80
100
0
20
40
60
80
100
Biosolids TCS concentration (mg kg-1)
Soil only 5 5 (no solvent) 15 105 1005 10005
0
20
40
60
80
100
Wk 1
Wk 2
Wk 3
Wk 4
a.
b.
c.

105
Figure 5-2. The mean earthworm survival (%) (n=4) ± standard deviation as affected by the biosolids-borne TCS concentration and the duration of earthworm exposure in (weeks) in biosolids-amended Immokalee fine sand (IFS), definitive toxicity test.
Biosolids TCS concentration (mg kg-1
)
Soil only 5 (No solvent) 5 7.5 10 15 55 105
Eart
hw
orm
Surv
ival (%
)
0
20
40
60
80
100
120 Wk 1
Wk 2
Wk 3
Wk 4

106
CHAPTER 6 BIOSOLIDS-BORNE TCS EFFECTS ON SOIL MICROBES
Background
The nutrient and organic rich solid product of wastewater treatment plants
(WWTPs) is called biosolids. Land application of biosolids recycles the nutrients to
accelerate plant growth and supply abundant carbon for sustainable agriculture. In the
U.S. WWTPs generate approximately 7 million Mg of biosolids each year (USGS,
2008), 63% of which is land applied (NRC, 2002). Land application is considered the
most suitable means of biosolids disposal/use (Epstein, 2002).
Besides acting as a nutrient boost for agriculture, biosolids addition changes
diversity, richness, and structure of plant, animal and microbial communities (USEPA,
1991). Microbial community changes may affect ecosystem processes (such as nutrient
recycling) and the effectiveness of microbial invasions (such as growth of pathogens)
(Garland, 1997). Dennis and Fresquez (1989) suggested that biosolids (22-90 Mg ha-1)
application improved soil fertility by changing the soil microbial composition. Garcia-Gil
et al. (2004) found that microbial biomass, respiration, and enzymatic activities
increased following biosolids (36 Mg ha-1) application. Sullivan et al. (2006a) analyzed
the long-term (12 years) impacts of biosolids application on microbial communities using
biolog plate analysis that compared substrate utilization by microbial communities in
control and amended soils. Analysis indicated quicker substrate utilization by
communities in amended than in control soil plots, suggesting that biosolids addition
changed the microbial community structure (Sullivan et al., 2006a). Similarly, Zerzghi et
al. (2010a) observed that long-term (20 years) biosolids application enhanced the
activity and density of microbes and changed the microbial community composition.

107
Along with the microbial community changes, biosolids addition may alter soil
microbial diversity and microbial processes. Soil microbial diversity is critical in
maintaining soil processes such as decomposition of organic matter and nutrient cycling
(Garbeva et al., 2004). Zerzghi et al. (2010b) examined the microbial diversity in soils
following biosolids (8-72 Mg ha-1) applied each year for 20 years. The results suggested
no adverse effect of biosolids application on the microbial diversity. The diversity in
amended soil either remained the same or increased following biosolids addition. Rojas-
Oropeza et al. (2010) amended a saline-sodic sand with biosolids (28-115 Mg ha-1 soil),
and observed increased microbial diversity and rates of microbial processes
(ammonification and nitrification). Further, biosolids addition elevated microbial
respiration (CO2 production) rates in soils (Barbarick et al., 2004; Sullivan et al., 2006a)
even 6 to 12 years following the biosolids amendment. Holt et al. (2010) observed
increased N mineralization (conversion of organic N to NH4-N) due to organic N addition
through biosolids application. Dennis and Fresquez (1989) reported that biosolids
application increased most of the microbial populations but, fungal diversity decreased
initially. Consistently, Kourtev et al. (2003) found that bacteria dominate in fertile (e.g.,
biosolids applied) soils and the fungi occur more frequently in infertile ecosystems.
Thus, the biosolids application may, or may not, alter microbial diversity, but may
change individual microbial species and their activities (e.g. N-cycling, respiration)
(Lawlora et al., 2000).
Besides supplying nutrients and carbon to soil, biosolids add a variety of organic
contaminants. A recent Targeted National Sewage Sludge Survey (TNSSS, USEPA,
2009a) found various contaminants of emerging concern in the biosolids. Triclosan

108
(TCS) was included among several hundred chemicals such as polycyclic aromatic
hydrocarbons (PAHs), polybrominated diphenyl ethers (PBDEs), antibiotics, drugs,
hormones and steroids. Triclosan is an antimicrobial compound frequently added in
liquid soaps, detergents and household products, which lead to transfer of TCS to
WWTPs, and then partition to biosolids. The TNSSS results suggested that biosolids
land application can transfer several chemicals, including TCS, to the soil environment.
Previous studies suggested changes in microbial community diversity, structure, and
microbially-mediated reactions following biosolids (unknown TCS concentrations)
addition, but the effects of TCS have not been quantified.
Previous studies (Hansen et al., 2001; Ingerslev et al., 2001; Schmitt et al., 2004)
suggest adverse effects of antibiotics on the number of soil micro-organisms and
microbial community structure. Similar to antibiotics, TCS (an anti-microbial) may also
affect soil micro-organisms. Studies (Liu et al., 2009; Waller and Kookana, 2007)
conducted in soils (no biosolids) suggest TCS effects on microbial diversity and
structure. Liu et al. (2008) evaluated the effects of TCS spiked in soil (no biosolids) on
the soil microbial number and functional diversity. The results suggested that soil TCS
concentrations (>10 mg kg-1) increased carbon source utilization, but had no effect on
the microbial population numbers and diversity. Waller and Kookana (2009) found
increased carbon utilization at spiked TCS concentration <50 mg kg-1 soil, and
suggested microbial structure changes. Svenningsen et al. (2011) suggested a
decrease in cultivable microbial numbers when a sewage-drain field soil was exposed to
a TCS (4 mg kg-1 soil). Further, the same study suggested increased persistence of
ibuprofen and alkylbenzene sulfonate in the presence of TCS (>0.16 mg kg-1 soil) in the

109
same soil. The only study of TCS spiked in biosolids-amended soil is preliminary work
by Young (2011, unpublished, personal communication), and suggested adverse effects
on the overall community composition. Thus, definitive effects of biosolids-borne TCS
on microbial community structure changes need quantification. Further, changes in
microbial count (number) following TCS addition have not been reported.
Similar to affects of biosolids addition, biosolids-borne TCS may affect
microbially-mediated reactions. Zhao (2006) suggested that TCS inhibited nitrification
via competitive inhibition of the enzyme ammonia monooxygenase (AMO) in
Nitrosomonas europaea, and the inhibition occurs in both sludge and soils (Stasinakis
et al., 2007). In a laboratory study, McBain et al. (2004) reported occurrence of TCS
resistant strains of E. coli, however, the study found no TCS-resistant ammonia
oxidizers even after chronic TCS exposure. Waller and Kookana (2009) measured
inhibitory effects of TCS concentration (50-500 mg kg-1 soil) on nitrification, respiration
and enzyme activity in Australian soils (un-amended, no biosolids). Butler et al. (2011)
evaluated basal and substrate induced respiration following TCS spiking (0-1000 mg kg-
1) in un-amended soils (sandy loam, loamy sand, and clay). Results suggest that TCS
inhibited initial respiration in the unacclimated soils, but following the respiking, TCS
acted as a C source and stimulated respiration, at least at TCS concentration <100 mg
TCS kg-1 soil.
Overall, the literature suggests that microbes and microbially-mediated reactions
can be altered by biosolids addition or TCS spiked in to soils. However, biosolids-borne
TCS may have a reduced bioavailability and its effect may be different from TCS spiked
110
directly in the soil. We hypothesize that biosolids-borne TCS has no adverse effect on
soil micro-organisms or microbial-mediated reactions. Objectives of our study were to:
Determine the impacts of biosolids-borne TCS on microbial processes.
Determine the microbial community structure changes in soils following the addition of biosolids-borne TCS.
Determine the changes in microbial count (number) in soils following the addition of biosolids-borne TCS.
Effects on microbial processes were assessed according to the United States
Environmental Protection Agency (USEPA) Office of Prevention, Pesticides, and Toxic
Substances (OPPTS) Soil Microbial Community Toxicity Test (Guideline 850.5100)
(USEPA, 1996c). The guideline focuses on the effect of added chemical on the
microbial processes of ammonification, nitrification, and respiration. The guideline
requires a range-finding and a definitive test, and prescribes direct addition of the
chemical of interest to a natural soil. The protocol was modified herein to deliver TCS as
a component of biosolids in an effort to better simulate the primary mechanism of TCS
transfer to the soil in land-applied biosolids.
Microbial community structure changes were assessed by the community-level
physiological profiling (CLPP) technique (Schmitt et al., 2004), utilizing biolog plates.
The bacterial count (number) was assessed by direct counting (Matsunaga et al., 1995).
Material and Methods
Chemicals, Biosolids, and Soils
Triclosan (CAS No. 101-20-2; >99.9% purity) standard was purchased from
United States Pharmacopeia (USP) (Maryland, USA). Methanol (MeOH), phenol
phthalein indicator, potassium chloride (KCl), potassium hydroxide (KOH), sodium
hydroxide (NaOH), barium chloride (BaCl2), hydrochloric acid (HCl), nitrate (NO3-) and
111
ammonium (NH4+) standards were purchased from Sigma Aldrich (St. Louis, MO) or
Fisher Scientific (Atlanta, GA). Anaerobically digested biosolids (solid content = 320 g
kg-1) (identification code: CHCC) was collected from a domestic WWTP plant in Illinois
and had an inherent TCS concentration of 5 mg kg-1 (Chapter 2). Two soils, an
Immokalee fine sand (IFS) (sandy, siliceous, hyperthermic Arenic Alaquods) [organic
carbon (OC): 11 g kg-1], and the Ashkum silty clay loam (ASL) (fine, mixed, superactive,
mesic Typic Endoaquolls) (OC: 34 g kg-1) were collected from sites with no known
history of receiving land-applied biosolids or sludge and utilized in microbial toxicity test.
Bacterial count and microbial community structure analysis included three sets of
soil samples. One set consisted of the control soils (no biosolids) and the soils (lowest
and highest spiked TCS concentration treatments) from the microbial toxicity test. The
second set of samples consisted of the field landscaping control (no biosolids) (clay
loam, OC: 40 g kg-1), and the landscaping soil field-equilibrated for two years following
amendment with 228 Mg ha-1 biosolids (silty clay loam, OC: 84 g kg-1, TCS
concentration: ~1 mg kg-1 amended soil). The landscaping soils were collected from
Illinois fields in 2010, air-dried and promptly sent to our laboratory. A third set of
samples were obtained from Will (WL, silty clay loam) and Kankakee (KK, fine sand)
Counties (Illinois) field research plots. The selected WL and KK soils were the controls
(no biosolids), and the soil amended with 118 Mg ha-1 biosolids in 2006 (WL TRT), and
155 Mg ha-1 biosolids in 2007 (KK TRT); soils were sampled in 2008. The WL and KK
samples (both control and treatment) were air-dried and stored at room temperature.
The soils were shipped to our laboratory in 2010 and utilized as such. Collectively, the

112
three sets of samples offered a wide array of soil textures, biosolids loading rates, TCS
soil concentrations and time since last biosolids amendment.
Microbial Toxicity (Range-Finding) Test Design
The microbial toxicity test included a range-finding and a definitive test. The
range-finding test was conducted to identify the appropriate range of biosolids-borne
TCS concentrations for a subsequent definitive toxicity assessment. One gram samples
of oven-dry CHCC biosolids (Inherent TCS-5 mg kg-1) were spiked with 0, 10, 100,
1000, or 10,000 mg TCS kg-1 biosolids using MeOH as the carrier solvent and were
subsequently dried, re-wetted, and equilibrated for 48 h in 300 mL glass Mason jars.
Treatment spikes were added in addition to the inherent TCS concentrations, so the
final nominal concentrations were 5, 15, 105, 1005, and 10,005 mg TCS kg-1 biosolids.
Biosolids were amended to 100 g (dry wt.) of IFS and ASL soils at an equivalent rate of
22 Mg ha-1, and amended soils brought to field capacity (10% for IFS and 30% for ASL
by wt.). A soil-only control, a carrier solvent-free biosolids-amended soil control (~5 mg
TCS kg-1 biosolids), and an empty jar (to confirm efficacy of the CO2 scrubber system)
were also included in the unreplicated study.
The jars were aerated with CO2-free humidified air at approximately 22°C.
Incoming air was stripped of CO2 and humidified by pumping ambient air first through 2
M KOH, followed by CO2-free water, a column of soda lime chips (Ca (OH)2>80%,
KOH< 3%, NaOH< 2%, Ethyl violet<1%), additional 2 M KOH, and once more through
CO2-free water. Carbon dioxide evolved from each treatment jar was taken as a
measure of microbial respiration, and was collected in a series of two base traps each
containing 100 mL of 0.15 M KOH.
113
Microbial Toxicity (Definitive) Test Design
In response to adverse effects observed in the ASL and IFS soils, a
concentration range of 0 to 1000 mg TCS kg-1 biosolids was selected for the definitive
toxicity test. Biosolids were spiked with 5, 10, 50, 100 and 500 mg TCS kg-1 biosolids in
the ASL soil. An additional treatment of 1000 mg TCS kg-1 biosolids was included in the
IFS soil. Treatment spikes were added in addition to the inherent TCS concentration, so
the nominal final TCS biosolids concentrations were 5, 10, 15, 55, 105, 505 and 1005
mg TCS kg-1. Three replicates were prepared for each treatment and the control, and
for each sampling period.
Sample Preparation and Analyses for Microbial Toxicity Test
Samples were removed from the aeration unit and analyzed in the same manner
in both the range-finding and definitive tests. Base traps (containing KOH) connected to
the treatment jars were removed and replaced with fresh KOH on days 5, 14, and 28,
and analyzed for CO2 (Anderson, 1982). A solution of BaCl2 was used to first precipitate
the carbonates (representing trapped CO2) in a known volume of base, and
subsequently centrifuged at ~2,000×g for 10 min. One mL of the supernatant was then
transferred to a glass 20 mL scintillation vial, treated with phenolphthalein indicator, and
titrated to pH of 8 to 9 with 0.1 M HCl. The unused KOH remaining in the base trap was
used to calculate the moles of KOH neutralized by evolved CO2.
Also on days 0, 5 and 28, subsets (10 g dry wt.) of amended soil were sampled
and shaken with 100 mL 1 M KCl to extract N03--N02
--N and NH4-N (Bremner, 1996).
Extracts were filtered (0.45 µm) and analyzed for NO3--NO2
--N (USEPA, 1993a, Method
353.2) and NH4-N (USEPA, 1993b, Method 350.1) to assess TCS impacts on
nitrification and ammonification, respectively. Method 353.2 accomplishes NO3-

114
reduction by passing soil extract through a copper-cadmium coil, and the resultant total
NO2- is reacted with multiple reagents to form an azo dye for colorimetric analysis.
Results were reported as mg N03--N02
—N per kg soil or biosolids-amended soil. Method
EPA 350.1 results in conversion of extracted NH4+
to NH3, which then reacts with phenol
to yield indophenol for colorimetric analysis. Results are reported as mg NH4-N per kg
soil or biosolids-amended soil. A rapid flow analyzer (Alpkem, VA) was utilized for NO3--
NO2--N analysis, and AQ2 discrete analyzer (SEAL, WI) was utilized for the NH4-N
analysis.
Soil samples from control and highest TCS spiked treatments, (IFS-500 and
ASL-500) utilized in the definitive test were subjected to molecular (DNA) analysis. The
analysis included DNA isolation and amplification. The DNA was extracted from the
soils (0.25 g wet weight) using MoBio PowerSoil® DNA Isolation Kit (MoBio
Laboratories, Solana Beach, CA) according to the manufacturer instructions, and stored
at -20C until use. Polymerase chain reaction (PCR) amplification of bacterial amoB
gene was performed using primers amoA1F (5'-GGGGTTTCTACTGGTGGT-3') and
amoA2R (5'-CCCCTCKGSAAAGCCTTCTTC-3') (Rotthauwe et al., 1997) and GoTaq
Green Master Mix (Promega, Madison, WI). The reaction mixture contained 25 μl
Master Mix, 0.5 μM of each primer, 2 μl of a ten-fold DNA dilute, and distilled water to
make a total volume of 50 μl. The PCR was conducted with a BioRad iCycler thermal
cycler (Hercules, CA) under the following thermo-cycling conditions: initial enzyme
activation and denaturation at 95°C for 15 min, 35 cycles of 95°C for 30 sec, 55°C for 45
sec, and 72°C for 45 sec, with a final extension step at 72°C for 7 min. From the PCR
reaction, a 491bp fragment of AOB gene was amplified.

115
The PCR amplification of amoA was conducted using primers A19F (5'-ATG GTC
TGG CT (AT) AGA CG-3') and 643R (5'-TCC CAC TT (AT) GAC CA (AG) GCG GCC
ATC CA-3') (Leininger et al., 2006), which produce a 624bp amplicon. The same PCR
mixture used for amoB was used for amoA, except for the primers. The thermo-cycle
consisted of the denaturation of 15 min at 95°C, followed by 30 sec at 95°C, 45 sec at
55°C, and 45 sec extension at 72°C for 30 cycles, and a final extension of 72°C for
7min. The PCR products were analyzed by electrophoresis through 1.5% Tris-acetate-
EDTA (TAE) agarose gels, and visualized by staining ethidium bromide and exposure
under UV light.
Microbial Community Structure Test Design
Microbial community structure changes were assessed with the community-level
physiological profiling (CLPP) technique (Schmitt et al., 2004), utilizing microtiter biolog
plates. Prefilled microtiter plates (ECO microplate; Biolog, Hayward, CA) contained
triplicates of 31 organic substrates such as sugars, and amino acids, as well as a
tetrazolium dye. Microbial growth on the substrates is assessed from the color
development in tetrazolium dye contained in the wells (Rutgers et al., 1998).
Tetrazolium dye can be reduced to a soluble puple formazan product by live microbial
cells. The amount of formazan is measured spectrophotometically at 590 nm. Quantity
of color development or formazan product is directly proportional to the number of living
and respiring cells (Cory et al., 1991).
Subsamples (10 g dry wt.) of soil were extracted with 100 mL phosphate buffer,
prepared by mixing 61.5 mL of 1M dipotassium hydrogen phosphate (K2HPO4.3H2O)
and 38.5 mL of 1M potassium dihydrogen phosphate (KH2PO4). The suspension was
shaken for 20 min on a reciprocating shaker, and then centrifuged for 10 min at 8000×g.

116
Supernatants were transferred into micro-centrifuge tubes, immediately frozen under
liquid nitrogen, and stored in the freezer until analysis. A nine-fold dilution (estimated in
a preliminary study as being sufficient to contain appropriate number of bacteria) was
performed on the extracts using the phosphate buffer, and 100 µL of each diluted
extract was transferred to biolog plate wells. The plates were covered with aluminum foil
and stored in the dark at 20 to 25°C. Temporal analysis of plates included measuring
the absorbance of the whole plate at the wavelength of 590 nm every day for 10 d and
every other day for the next 20 d on the Bio-TekFL600 micro plate reader (MTX labs,
VA). The color development (absorbance) in the plate wells represented the extent of
substrate utilization by the microbes, representing growth.
The absorbance was separately measured for each substrate, but the substrates
were later grouped into categories (Table 6-1): acids, amino acids, polymers, amines,
carbohydrates, and miscellaneous based on the classification by Garland and Mills
(1991). The substrate absorbance was calculated by subtracting the absorbance of
water controls measured at corresponding times.
Extraction for Bacterial Count
The total bacterial count was estimated by direct counting using a fluorescein
isothiocyanate (FITC) stain (Matsunaga et al., 1995). Five grams of soil (dry wt.) was
shaken vigorously with 45 mL of 0.1% agar solution. After 30s, a 10 µL of aliquot was
spread evenly onto a pre-marked 1 cm2 area on a slide. The slide was kept on a
warmer to heat fix the bacteria. One drop of FITC stain was added on the slide and left
to dry for 3 min. Excess stain was washed off with 0.5 M sodium carbonate-bicarbonate
(Na2CO3-NaHCO3) buffer, and the washed slide mounted with glycerol (pH = 9.6) before
putting the cover slide. Bacteria were counted within four microscopic fields at 400×

117
using an Optiphot Biological UV Microscope (Nikon, NY), and the mean counts
recorded. The mean counts represent only viable bacteria, as the technique fails to
stain the dead bacteria.
Statistical Analysis
Statistical analysis was performed using SAS software, version 9.1 (SAS
institute, 2002). The Tukey‘s studentized range test was used to assess statistical
differences at each sampling period across treatments. Regression analysis with the
ESTIMATE procedure assessed the statistical differences between sampling periods
within treatments.
Results and Discussion
Microbial Toxicity (Range-Finding) Test
Respiration measures the overall activity of a microbial community. The substrate
(biosolids) induced respiration was quantified following OPPTS guideline using CO2
evolution as a measure of microbial respiration. Biosolids addition increased microbial
respiration (CO2 evolution) over time, but some respiration inhibition occurred due to
TCS spiking (Figure 6-1). At 28 d, biosolids TCS spiking caused a reduction of ~27% (at
TCS concentration=1005 mg kg-1), and ~42% (at TCS concentration=10,005 mg kg-1) in
total CO2 evolution in the IFS treatments (Figure 6-1a). For ASL treatments, biosolids
TCS (concentration=10,005 mg kg-1) caused ~10% reduction in total CO2 evolution
relative to the unspiked biosolids-amended control (Figure 6-1b). Further, biosolids
addition increased the NH4-N production in both soils. Up to day 5, TCS spiking did not
inhibit the NH4-N production (Figure 6-2), and at the study termination (28d), TCS
inhibition of NH4-N only occurred at a TCS concentration of 10,005 mg kg-1 biosolids in
the IFS soil (Figure 6-2a). Biosolids or TCS addition did not affect the production of N03-

118
-N02--N in the IFS soil (Figure 6-3a), but the ASL soil behaved differently. Biosolids TCS
concentrations ≥15 mg kg-1 reduced the N03--N02
--N production by 75% as compared to
unspiked biosolids-amended control (Figure 6-3b).
Microbial Toxicity (Definitive) Test
Effect on respiration rates
Biosolids TCS concentrations ≤1005 mg kg-1 in the IFS soil, and ≤505 mg kg-1 in
ASL soil, did not affect cumulative respiration at any sampling time. Addition of biosolids
significantly increased the total CO2 production in both soils (Figure 6-4a, b), except for
one treatment (15 mg TCS kg-1 biosolids) in the IFS soil (Figure 6-4b). The cumulative
CO2 evolution in the 15 mg TCS kg-1 treatment was significantly smaller than the other
TCS treatments, and likely represented an unexplained analytical error. The only effect
on microbial respiration was due to biosolids addition, likely attributable to increased
substrate induced respiration following the addition of labile organic carbon.
Our results agree with the results from previous studies (Barbarick et al., 2004;
Sullivan et al., 2006a). Barbarick et al. (2004) found increased microbial respiration
rates in shrubland and grassland soils amended with biosolids (30-40 Mg ha-1) 6 years
prior. The increased respiration was attributed to the availability of additional carbon
substrates furnished by the biosolids (Barbarick et al., 2004). Sullivan et al. (2006a)
positively correlated biosolids addition and CO2 evolution in semi-arid rangeland soil
(sandy loam, pH=6.2). The CO2 production was enhanced, and the metabolism of the
microbial community elevated, even 12 years following biosolids application.
Our CO2 evolution data suggest that TCS concentrations ≤505mg kg-1 biosolids
do not adversely affect respiration rates, similar to studies assessing the effects of TCS
spiked in to soils (Butler et al., 2011; Waller and Kookana, 2009). Waller and Kookana

119
(2009) found no negative effect on substrate induced respiration at spiked TCS
concentrations <50 mg kg-1 soil (equivalent to our 5000 mg TCS kg-1 biosolids
treatment). Butler et al. (2011) assessed basal and substrate induced respiration
changes following TCS spiking in un-amended soils. Three soils- sandy loam [organic
carbon (OC)-17 g kg-1], clay (OC-27 g kg-1) and loamy sand (OC-23 g kg-1) were spiked
with a range of TCS concentrations (0-1000 mg kg-1). Results suggest respiration
inhibition at TCS concentration >10 mg kg-1 soil (equivalent to our >1000 mg kg-1
biosolids treatment) within 6 h from the initial TCS spiking, but the inhibition
disappeared after 2 to 4 d. Respiking of TCS to the same soil, caused an initial
microbial stimulation of respiration up to day 4, but the respiration rates returned to the
baseline by day 6. Authors reported that TCS inhibited initial respiration rates (6h) in the
unacclimated soils, but following the respiking, TCS acted as a C source and stimulated
respiration at least at the low TCS concentrations (<100 mg kg-1) (Butler et al., 2011)
Thus, the stimulation of microbial respiration observed in our study could be a combined
effect of TCS and biosolids serving as C sources, especially at TCS concentration ≤10
mg kg-1 amended soil.
Spiked TCS concentrations did not significantly affect total CO2 evolved, and the
results were consistent with our range-finding test, and previous two studies conducted
in spiked soils (no biosolids) (Waller and Kookana, 2009; Butler et al., 2011). Our study
suggested that biosolids addition, however, stimulated microbial respiration.
Effect on nitrogen cycle
Ashkum silty clay loam (ASL) soil- A TCS concentration ≤505 mg kg-1 biosolids
did not significantly affect the NH4-N production in biosolids-amended soil or the control
at 5d (Figure 6-5a). At day 28, NH4-N production surprisingly declined in all treatments

120
independent of biosolids or TCS additions so there was no significant effect of biosolids
or TCS concentration on NH4-N production (Figure 6-5a). The abrupt decrease in NH4-N
production from day 5 to 28 cannot be easily explained because of a gap between the
sampling times. Consistent with our study, a 28 d incubation study (Snyder et al., 2011)
revealed insignificant differences in NH4-N production at triclocarban concentrations up
to ~717 mg kg-1 biosolids following biosolids addition to a silty loam soil.
Biosolids addition significantly decreased the N03--N02
--N production at day 5
(Figure 6-5b). However, N03--N02
--N production in spiked biosolids treatments was not
significantly different than the un-spiked biosolids-amended control (Inherent TCS=5 mg
kg-1). At day 28, N03--N02
--N concentrations increased (as compared to day 5), resulting
in no overall TCS or biosolids addition effect on N03--N02
--N production at biosolids TCS
concentration of ≤505 mg kg-1.
Given reports (Zhao, 2006; Stasinakis et al., 2007) that TCS inhibits the
nitrification process in sludge and soils, we compared the relationship between the
ammonification and nitrification processes in our study. Accumulation of NH4-N at day 5
coincided with a decrease in N03--N02
--N production that might suggest TCS inhibition of
nitrification. However, between days 5 and 28, unknown changes in the study conditions
appeared to disturb the microbial community structure (or conditions), which overcame
any TCS inhibition of nitrification and caused a rapid conversion of NH4-N to N03--N02
--
N.
Immokalee fine sand (IFS) soil- A similar study conducted with the IFS soil
included an additional sampling period of 14d to avoid the unexplainable changes
observed in ASL soil data interpretation due to long sampling intervals.

121
Ammonium production increased following biosolids addition (Figure 6-6a). At
day 5, a TCS biosolids concentration of 1005 mg kg-1 caused the greatest NH4-N
production, but TCS addition effect was not significant. All the biosolids-amended
treatments increased NH4-N production at day 5, except the treatment with 505 mg TCS
kg-1 biosolids, where the effect did not appear until day 14 (Figure 6-6a). At day 5, the
biosolids or TCS additions did not affect N03--N02
—N production. At day 28, biosolids
addition caused a significant reduction in N03--N02
--N concentrations (Figure 6-6a, b).
Holt et al. (2010) investigated the production of NH4-N from a soil (unknown
texture) amended with biosolids (18 Mg ha-1). The results suggested that diazotrophs
fixed more N following biosolids addition up to 42 d, but the stimulation disappeared at
84 d causing no difference in NH4-N production in control and amended soils. Authors
concluded that biosolids amendment added organic N causing rapid NH4-N production,
and that inherent biosolids-borne chemicals (e.g., PPCPs, unknown concentrations) did
not adversely affect N cycling. Similarly, Barbarick et al. (2006) attributed elevated N
mineralization rates in soil to addition of organic N through biosolids application.
Waller and Kookana (2009) monitored changes in N mineralization in sand (OC:
8.5 g kg-1) and clay (OC: 18.5 g kg-1) soils spiked with 0, 1, 5, 10, 50, and 100 mg TCS
kg-1 soil. Nitrification process was not adversely affected at TCS concentrations ranging
from 5 to 50 mg kg-1 soil (corresponds to equivalent concentrations of 500 to 5000 mg
kg-1 biosolids).
As with CO2 evolution and NH4-N production, the N03--N02
--N production data at
study termination (28 d) suggest significant biosolids addition effects, but no TCS
treatment effect, up to 1005 mg TCS kg -1 biosolids in the IFS soil.
122
Bacterial DNA analysis
Zhao (2006) reported that TCS inhibited ammonia monooxygenase (AMO), the
first enzyme in the two step nitrification process. The AMO is encoded by two genes
from Archeal amoA and bacterial amoA. Archeal amoA dominates in most environments
(Leininger et al., 2006). In a preliminary study, we measured the relative concentrations
of the two forms of bacterial DNA from IFS control (soil-only), 5 (only biosolids inherent
TCS), and 505 mg TCS kg-1 biosolids (spiked TCS) treatments. There were no
significant differences in archeal amoA concentrations among the treatments but high
variability made the final results inconclusive. The preliminary data suggest minimal
effects of biosolids-borne TCS addition on the archeal amoA that is likely to be involved
in N-cycling at least in one soil. The inconclusive results with bacterial amoA due to
TCS spiking requires further investigation perhaps in various soils.
Collectively, the soil microbial toxicity test data suggest no TCS spiking effects on
respiration, nitrification or ammonification up to a TCS biosolids concentration of 505 mg
kg-1 amended to the ASL soil, and up to 1005 mg kg-1 amended to the IFS soil. The
differences in NH4-N and NO3--NO2
--N production between the two soils may reflect
differences in the availability of TCS, or other C containing substrates in the two soils
(Table 5-1). Triclosan availability could differ in the two soils due to less TCS retention
in the IFS soil (log Kd = 1.87 ± 0.21), than in the ASL soil (log Kd = 2.64 ± 0.19) (Agyin-
Birikorang et al., 2010). Waller and Kookana (2009) monitored changes in N
mineralization in two soils and suggested that the TCS concentration required to affect
nitrification was ten times greater in the clay soil (50 mg TCS kg-1) than in the sand (5
mg TCS kg-1).

123
Thus, TCS concentrations of 25 to 50-fold greater (500 mg kg-1) than normally
found (~10 to 20 mg kg-1) in most land-applied biosolids did not cause microbial toxicity,
at least using microbial respiration and nitrogen cycling as indicators. The effects of
long-term biosolids applications are known. Our study and other published studies
(Waller and Kookana, 2009; Butler et al., 2011) are short-term and may not represent
the effects of long-term biosolids-borne TCS application.
Microbial Community Structure Analysis
The average well color development (AWCD) in various substrates is illustrated
in Figure 6-7. Data obtained for each substrate were combined into the general
category of carboxylic acids, amino acids, polymers, amines, carbohydrates, and
miscellaneous. At study termination (day 40), the well color development varied,
suggesting different utilization of the six types of carbon substrates in different soils
(Figure 6-7).
Polymers were utilized most readily, carbohydrates were utilized least readily,
and the remaining substrate groups were moderately utilized. Addition of biosolids or
TCS did not appear to increase substrate utilization as compared to the control, except
in IFS soil where the addition of biosolids alone (IFS-0) inhibited the utilization of most
groups of substrates, except the polymers. The addition of biosolids spiked with TCS in
the IFS soil (IFS-500) resulted in similar color development as in the control (IFS
control). High (landscaping) and multiple (WL and KK) loads of biosolids and associated
TCS did not increase substrate utilization as compared to the respective controls. Thus,
neither inhibition nor stimulation of carbon substrate utilization occurred due to TCS or
biosolids addition, suggesting minimal disturbance of the microbial community structure
at least with AWCD as an indicator. Results are at odds with the assumption that

124
microbial community structures would vary with soil texture or biosolids and TCS
addition.
Young (2011, unpublished, personal communication) suggested adverse effects
of TCS spiked in biosolids on the overall community composition using biolog plates
and PCA (principle component analysis). However, a direct comparison and evaluation
of the two studies was not possible due different quantification methods. Additional
investigation of our data should involve the quantification of the overall well color
development for all substrates in each treatment and plotting the various microbial
communities using a PCA method.
Various studies (Barbarick et al., 2004; Garcia-Gil et al., 2004; Sullivan et al.,
2006b) suggested shifts in soil microbial community structure due to the addition of
biosolids alone. Thus, the changes in community structure observed in Young (2011)
study may simply be a biosolids effect. In fact, he observed a greater effect of biosolids
as compared to TCS concentration effects.
Bacterial Counts
The average bacterial counts were greater in the ASL, landscaping and WL soil
control than in the IFS and KK control soils, but the differences were not significant. The
trends may be a texture effect, because ASL and landscaping soils (soil collected from
an area utilizing for landscaping purposes in Illinois) are silty clay loams, whereas, the
IFS and KK are sands. Addition of biosolids increased the bacterial counts in all soils as
compared to the control soils (Table 6-2). Biosolids addition likely provided organic
carbon for enhancing the bacterial growth.
The ASL soil treated with TCS spiked biosolids (ASL-500) had significantly
greater bacterial counts than the corresponding IFS treatments (IFS-500) (p<0.05).

125
Biosolids application rates were same in the two soils, but greater bacterial number
enhancement occured in the ASL soil spiked with TCS concentration (ASL-500), which
is likely a TCS addition effect in the ASL soil. The landscaping biosolids-amended
treatment (landscaping TRT) had significantly greater (p<0.0001) bacterial counts than
the landscaping control soil, or the biosolids-amended ASL, IFS, WL and KK soils which
may have occurred following the application of high loads (228 Mg ha-1) of biosolids.
Addition of TCS significantly increased bacterial counts in the ASL-500 treatment as
well as in the WL amended treatment (WL TRT) compared to the soil control (ASL
control and WL control) and the biosolids-amended unspiked treatments (ASL-0).
There is no evidence of bacterial growth inhibition following high (landscaping
TRT) or multiple (WL TRT, KK TRT) biosolids applications or high TCS concentrations
(990 ug kg-1) in amended soil. The bacterial counts were greater in biosolids-amended
silty clay loam soil (ASL) than in amended sand (IFS), suggesting a texture effect.
Zerzghi et al. (2010a) evaluated the effect of 20 years of biosolids land application (8-24
Mg ha-1year-1) on the microbial population and activity in soil (southwestern desert soil).
Direct counts suggested differences in total microbial counts between the control and
amended soils, but the difference was not significant. The authors concluded that even
long-term (20 years) biosolids applications, resulting in high total biosolids loads (160-
480 Mg ha-1) did not affect microbial numbers of bacteria, actinomycetes and fungi.
We accept our hypothesis that biosolids-borne TCS has no adverse effect on soil
micro-organisms, using microbially-mediated processes, community structure, and
bacterial counts as indicators.

126
Table 6-1. The grouping of the various substrates in the biolog ECO plates (Garland and Mills, 1991).
Acids Galactonic acid
Galacturonic acid 2-hydroxy benzoic acid 4-hydroxy benzoic acid
Itaconic acid Ketobutryic acid
Malic acid Pyruvic acid
Glucosaminic acid
Amino acids Arginine
Asparagine Phenylalanine
Serine Threonine
Glutamic acid
Polymers Tween 40 Tween 80 Glycogen
Amines Pheny ethyl
amine Glucosamine Putresoine
Carbohydrates Cellobiose
Lactose Methyl glucosidase
D-xylose
Miscellaneous Erthristol Mannitol
Cyclodextrin Glucose-1-phosphate Glycerol phosphate
Table 6-2. Average bacterial count (number) in soils with varying biosolids application
rates, TCS concentrations and textures (same letters represent no significant difference among treatments).
Treatment Biosolids rates (Mg ha-1)
TCS concentration
(µg kg-1)
Texture Average ± standard deviation of count of bacteria per g of soil
Landscaping control
na‡ nd† Clay loam 2.5*108 ± 1.1*108 b
Landscaping TRT 228 (one time) 990 Silty clay loam 1.0*109 ± 2.0*108 a ASL control na‡ nd† Silty clay loam 3.4*108 ± 2.3*108 b ASL-0 22 5 Silty clay loam 4.0*108 ± 2.3*108 b ASL-500 22 500 Silty clay loam 5.3*108 ± 2.0*108 c
IFS control na‡ nd† Sand 1.7*108 ± 6.8*107 b IFS-0 22 5 Sand 2.7*108 ± 1.6*108 b IFS-500 22 500 Sand 3.8 *108 ± 1.4*108 b
WL control na‡ 1 Silty clay loam 2.3*108 ±1.5*108 b
WL TRT 116 (multiple) 41 Silty clay loam 5.2*108± 1.6*108 c KK control na‡ 0.8 Sand 2.1*108± 7.3*107 b KK TRT 154(multiple) 18 Sand 2.8*108± 1.4*108 b
nd†: Concentrations were below the detection limit of the instrument na‡: No application of biosolids

127
Figure 6-1. Total CO2 evolution (mg) over various times in the (a) IFS and (b) ASL soils amended with biosolids spiked with a range of TCS concentrations, unreplicated range-finding test.
0
50
100
150
200
250
300
CO
2 E
volv
ed (
mg)
Biosolids TCS concentration (mg kg-1)
Days 0-5 Days 5-28 Days 0-28
0
60
120
180
240
300
360
420
CO
2 E
volv
ed (
mg)
Biosolids TCS concentration (mg kg-1)
a. IFS soil
b. ASL soil

128
Figure 6-2. NH4
+-NH3 concentrations (mg kg-1) over time (Days 0-28) in the (a) IFS and (b) ASL soils amended with biosolids spiked with a range of TCS concentrations, unreplicated range-finding test.
0
20
40
60
80
100
120
140
160N
H4
+-N
H3 in
bio
solid
s am
end
ed s
oils
(m
g k
g-1
)
Biosolids TCS concentration (mg kg-1)
Day 0 Day 5 Day 28
0
5
10
15
20
25
30
NH
4+-N
H3
in b
ioso
lids a
me
nd
ed
so
ils
(mg
kg
-1)
Biosolids TCS concentration (mg kg-1)
Day 0 Day 5 Day 28
a. IFS soil
b. ASL soil

129
Figure 6-3. N03
--N02--N concentrations (mg kg-1) over time (Days 0-28) in the (a) IFS
and (b) ASL soils amended with biosolids spiked with a range of TCS concentrations, unreplicated range-finding test.
0
1
2
3
4
5
6
7
8N
O3
- -N
O2
- in
bio
solid
s am
ende
d s
oils
(m
g
kg
-1)
Biosolids TCS concentration (mg kg-1)
Day 0 Day 5 Day 28
0
10
20
30
40
50
NO
3- -
NO
2- in
bio
so
lids a
me
nd
ed
so
ils (
mg
kg
-1)
Biosolids TCS concentration (mg kg -1)
Day 0 Day 5 Day 28
a. IFS soil
b. ASL soil

130
Figure 6-4. Mean total CO2 (mg) as a function of TCS concentrations and time (Days 0-28) in (a) ASL and (b) IFS soils (like letters indicate no significant difference between treatments), definitive test.
Biosolids TCS concentration (mg kg-1)
Soil only 5 10 15 55 105 505
CO
2 e
vo
lve
d (
mg
)
0
100
200
300
400
500
600
b
a,b
b
a
a,b
a
a. ASL soil
b. IFS soil
b
a,b a a
a,b
a,b a,b
Soil only 5 15 105 505 1005
CO
2 e
vo
lve
d (
mg
)
0
100
200
300
400
500
600days 0-5
days 5-28
days 0-28

131
Figure 6-5. Mean (a) NH4
–N and (b) N03--N02
--N concentrations (n=3) as a function of biosolids TCS concentration and time (Days 0-28) in ASL soils (like letters indicate no significant difference between treatments), definitive test.
Soil only 5 10 15 55 105 505
NH
4-N
co
nc
en
tra
tio
n i
n s
oil
s (
mg
kg
-1)
0
50
100
150
200
Soil only 5 10 15 55 105 505
NO
3
- -NO
2
- co
nc
en
tra
tio
n s
oil
s (
mg
kg
-1)
0
10
20
30
40
50
day 0
day 5
day 28
a. ASL soil NH4-N
b. ASL soil NO3
--NO
2
-
bc e
a,b c,b
e ee e e e
a
a,b
a,b
a,b
a
a
a,b
a,b
a,b
a
aa
a,b
a
b
a,b
a
b
a,b
a
b
a,b
a
a
b
a
b
b
a
ba,b
Biosolids TCS concentration (mg kg-1
)

132
Figure 6-6. Mean (a) NH4
-N and (b) N03--N02
--N concentrations (n=3) as a function of biosolids TCS concentration and time (Days 0-28) in IFS soils (like letters indicate no significant difference between treatments), definitive test.
Biosolids TCS concentration (mg kg-1)
Soil only 5 15 105 505 1005NO
3
- - NO
2
- co
ncen
trati
on
in
so
ils (
mg
kg
- 1)
0
10
20
30
40
50Soil only 5 15 105 505 1005
NH
4-N
co
ncen
trati
on
in
so
ils (
mg
kg
-1)
0
50
100
150
200
day 0
day 5
day 14
day 28
a. IFS soil NH4-N
b. IFS soil NO3
--NO
2
-
b c b b
a
a
a
a,b
a,b
a
a
a
aa
a,b
a,b
aaa
b
a
a
a
a,b
b
b
a a
a a
a
aa,b a,ba,b
a
aa
a
a
a
aa,b
ab
a,ba,b
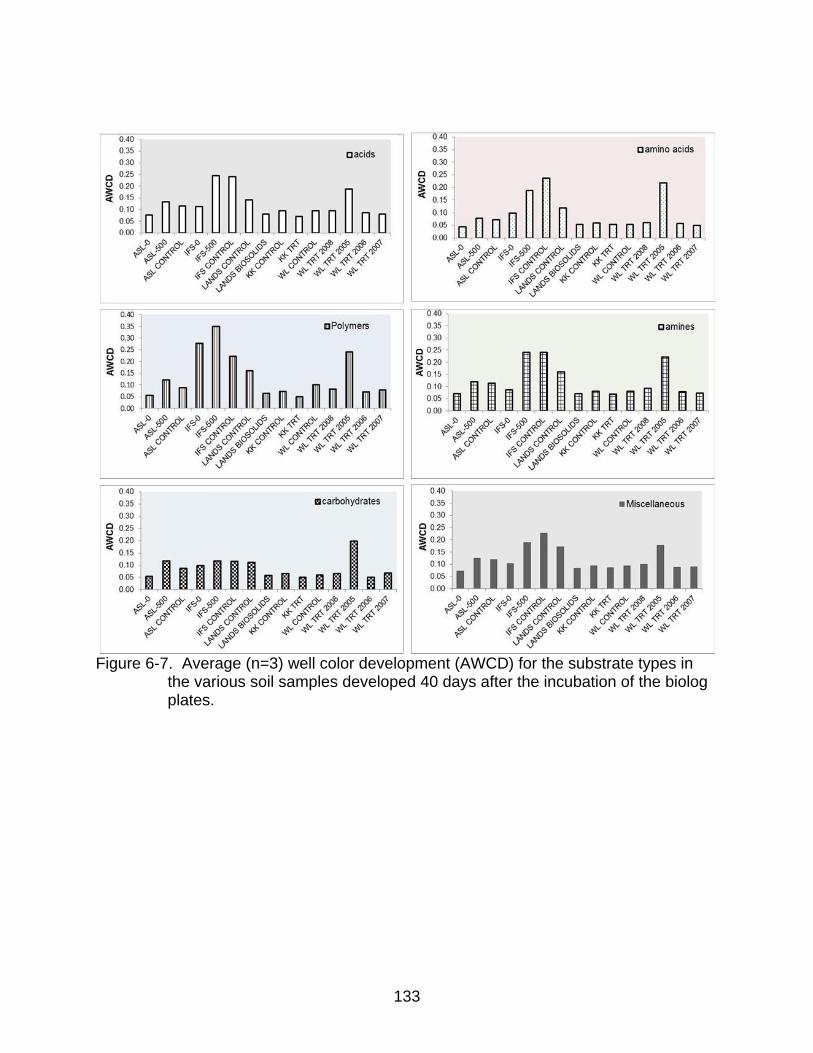
133
Figure 6-7. Average (n=3) well color development (AWCD) for the substrate types in
the various soil samples developed 40 days after the incubation of the biolog plates.

134
CHAPTER 7 PLANT TOXICITY AND BIOACCUMULATION OF BIOSOLIDS-BORNE TCS
Background
Food chain bioaccumulation begins with chemical uptake by plants. Chemicals
can enter plants by partitioning from contaminated soil solutions to the roots, and be
translocated through xylem tissue (the xylem transports water from roots to leaves by
transpiration). Chemicals may enter the vegetation directly by gas-phase and particle-
phase deposition on leaves, enter the stomata and be translocated through phloem
tissue (the phloem transports photosynthesis products from leaves to plant parts)
(Simonich and Hites, 1995). Chemicals may also directly partition from soil particles to
the root epidermis or the cortex and accumulate in the root (Leewen and Vermeire,
2007). The pathway of chemical uptake by plants depends on (a) chemical‘s properties
such as water solubility, lipophilicity, and vapor pressure; (b) environmental conditions
like temperature, organic carbon (OC) content of soil, and (c) plant species
characteristics like surface area of the leaf and root mass (Simonich and Hites, 1995).
Root uptake from soil solution is a dominant pathway for hydrophilic compounds
characterized by high water solubility, low vapor pressure and low log Kow values (<4).
Such compounds move from the outer to the inner root, and are translocated via the
xylem to various plant parts (Paterson et al., 1994). However, the translocation to plant
parts is limited by the TSCF (transpiration stream concentration factor). The TSCF is a
function of chemical‘s Kow and is the ratio of chemical concentration in the xylem sap to
the chemical concentration in the solution surrounding the root. Lipophilic organic
compounds (log Kow > 4) such as organochlorine pesticides and polycyclic aromatic
hydrocarbons do not enter the root xylem, but preferentially partition to the root

135
epidermis or the soil solids (Paterson et al., 1994; Schroll et al., 1994) and accumulate
in the root. Petersen et al. (2003) proposed an alternate mechanism of plant
contamination through rainfall induced splashing of soils when biosolids are applied.
However, the authors later concluded that the added biosolids did not increase the risk
of rain induced splashing and the proposed mechanism is insignificant (Petersen et al.,
2003). Thus, plant uptake of a chemical depends on chemical properties (solubility,
Kow), plant characterstics (lipid content, leaf orientation, TSCF) and soil properties
(organic carbon).
Hulster et al. (1994) found that three cucurbitaceae species (zucchini, pumpkin
and cucumber) grown in soils accumulated and translocated high concentrations of
highly lipophilic PCDD/Fs (Polychlorinated Dibenzo-p-dioxins and dibenzofurans).
Uptake by cucumber occurred through particle-phase deposition. The exact mechanism
of fruit (zucchini and pumpkin) accumulation was not elucidated, but Hulster et al.
(1994) opined that uptake occurred through roots due to increased chemical availability
in the presence of unique species-specific root exudates. Several studies (Farkas et al.,
2009; Kumar et al., 2005; Boxall et al., 2006; Dolliver et al., 2007) reported plant
accumulation and phytotoxic effects of antibiotics in un-amended and manure-amended
soils. Triclosan (TCS) is an antimicrobial, and a common component of waste-water. At
the wastewater treatment, TCS partitions mainly into biosolids. Biosolids-borne TCS can
be land applied, and plants exposed to TCS may exhibit phytotoxicities or accumulate
TCS in a manner similar to antibiotics. In a recent presentation, Kumar (2010)
presented a ‗Kumar‘s rule of 3‘ to prioritize pharmaceuticals and personal care products
for plant uptake studies. According to the rule, the chemicals that have a molecular

136
weight less than 450, log Kow less than 3, number of H-bond donors less than three, and
number of H-bond acceptors of less than six should be studied in field uptake studies
for conducting risk assessment. Triclosan obeyed all the rules except that the log Kow of
TCS is greater than three.
Herklotz et al. (2010) studied TCS toxicity in hydroponic system, and suggested
adverse effects of TCS on the germination of cabbage (Brassica rapa var. pekinensis)
and Wisconsin fast plants (Brassica rapa) with a lethal concentration (LC) of 0.44 mg
TCS L-1 water. Stevens et al. (2009) evaluated TCS effects on the germination and
bioaccumulation in three wetland plants (Sesbania herbacea, Eclipta prostrata,
and Bidens frondosa). A TCS concentration of 100 mg L-1 water reduced the rate of
seed germination in two species (S. herbacea and B. frondosa). Triclosan also
accumulated in the shoots of S. herbacea, with a bioconcentration factor (BCF) of <10,
and in roots of B. frondosa with a bioaccumulation factor (BAF) ranging from 53 to 101.
A few unpublished studies (Hoberg, 1992; Schwab and Heim, 1997; cited in Reiss et al.,
2009), and a published study (Liu et al., 2009) reported TCS plant toxicity in soil
systems not amended with biosolids. Hoberg (1992) suggested adverse effects of TCS
on cucumber, with a shoot length No Observed Effect Concentration (NOEC) of 0.096
mg kg-1 soil, and a Lowest Observed Effect Concentration (LOEC) of 0.28 mg kg-1 soil.
Schwab and Heim (1997) evaluated TCS effects on cucumber seedling emergence,
shoot length, root and shoot weight and reported a NOEC of 1 mg kg-1 soil. Liu et al.
(2008) suggested a shoot height inhibition effect concentration (EC10) of 6 mg TCS kg-1
soil for cucumber, and a LOEC of 10 mg kg-1 soil for rice root length. The studies
described above suggested toxicity and bioaccumulation of TCS to plants grown in

137
hydroponics and in un-amended soil. Simlar to accumulation in un-amended soil, plants
grown in biosolids-amended soil may accumulate TCS or experience TCS toxicity.
Thus, the consumers eating plants grown in amended soil may be unknowingly
ingesting TCS.
A few studies evaluated TCS plant accumulation following land-applied biosolids.
Xia et al. (2010) found TCS concentrations <6.5 ng g-1 [Limit of quantitation (LOQ) of the
instrument] in corn (Zea Mays) stover collected from long-term biosolids-amended
(various rates) field soils (calcareous mine spoil; pH 7.8) with TCS soil concentrations
ranging from 10 to 50 ng g-1. The results suggest minimal TCS accumulation by corn, a
monocotyledon (monocot). However, the toxicity and bioaccumulation of TCS might
vary with the plant species, and characterstics of soil (Duarte-Davidson and Jones,
1996; Suter, 2007). Wu et al. (2010) evaluated the TCS uptake by a soybean (Glycine
max), a dicotyledon (dicot), under green house conditions. The biosolids were spiked
with TCS and amended (11 Mg ha-1) to soil (sand, pH = 5.1, OC = 16 g kg-1) to achieve
a final TCS concentration of 70 ng g-1 amended soil. Results suggested TCS
contamination of root tissue, and translocation to above-ground biomass. The plants,
harvested at the full seed stage (110 d), accumulated TCS in the root (76.8 ± 3.1 ng g-
1), stem (136 ± 66 ng g-1), leaf (120 ± 37 ng g-1), and beans (12.6 ± 2.3 ng g-1). The BCF
values were measured at first harvesting (60d) and at full seed stage (110d). The BCF
from soils to roots were 3 to 6.5 and 1 to 2 in the roots to leaves (Wu et al., 2010). The
Wu et al. (2010) study was conducted in a spiked system, where TCS bioavailability and
accumulation potential may differ from systems with inherent TCS (biosolids-borne).
Further, the study utilized a single crop, and the biosolids had a solids content (19 g L-
138
1), which is much less than the solids content of biosolids (~300 g kg-1) routinely used
for land application in the U.S. Chemical transport potential and bioavailability is likely
influenced by the type of biosolids applied to the soils (Edwards et al., 2009), with a
greater chemical availability in biosolids with low solids content. In addition, a TCS
degradation half-life of 100 d and the appearance of a metabolite [Methyl-TCS (Me-
TCS)] (Chapter 4) of greater Kow suggest that both TCS and Me-TCS could exist in soils
for extended times following biosolids amendment. The metabolite may also possess
phytoaccumulative potential.
The present study investigated the TCS toxicity and accumulation in multiple
food crops [lettuce (Lactuca sativa), radish (Raphanus sativus), cucumber (Cucumic
sativus), bahia grass (Paspalum notatum)], utilizing cake biosolids (commonly used in
the U.S.), and a field-equilibrated soil. The soil received a single large application (228
Mg ha-1) of biosolids that was incorporated and mixed with 15 to 20 cm of soil in 2008.
The amended soil sampled in 2010 contained an inherent TCS concentration of ~1 mg
kg-1 soil.
A chemical similar to TCS [i.e triclocarban, (TCC)] was minimally phyto
accumulated by bahia grass (Snyder et al., 2011) grown in a biosolids-amended soil.
We speculated that, because the partitioning coefficient of TCS (log Koc = 4.26) is even
greater than TCC (log Koc = 3.82) (Agyin-Birikorang et al., 2010), TCS should partition
more extensively to soil OC and be less phytoavailable. We hypothesize that biosolids-
borne TCS has minimal phytotoxicity and phytoaccumulation potential. Our study
objective was to evaluate the toxicity and plant uptake of TCS by several crops grown in
a soil previously amended with biosolids. Further, the uptake of an expected metabolite

139
was assessed by analyzing the plants for Me-TCS. Plant toxicity and accumulation was
investigated in vegetables grown for edible portions in temperature controlled growth
rooms, and bahia grass grown in a greenhouse. In addition, empirical models and
equations were used for bioaccumulation estimation and comparison with measured
values.
Material and Methods
Soils and Chemicals
Triclosan (CAS No. 101-20-2; >99.9% purity) standard was purchased from
United States Pharmacopeia (USP) (Maryland, USA). Internal standard (13C12-TCS),
pyridine, BSTFA (bis (trimethylsilyl) trifluoroacetamide) +1% TMCS (trimethylchloro
silane) were obtained from Sigma-Aldrich (St. Louis, MO). Methyl-TCS (Me-TCS)
standard was purchased from Wellington laboratories (Shawnee Mission, KS).
Potassium chloride (KCl), methanol (MeOH), acetone of HPLC grade or greater were
purchased from Sigma Aldrich (St. Louis, MO), JT Baker (Phillipsburg, NJ) or Fisher
Scientific (Atlanta, GA). The biosolids-amended soil was collected in 2010 from a
landscaping site in Illinois last amended with biosolids (~228 Mg ha-1) in 2008. Control
soil samples were collected from an adjoining site (18 m away, same soil texture) with
no known history of receiving land-applied biosolids or sludge. The collected soil
samples were air-dried for 1 week and sent to our laboratory in ~18 L buckets. Select
physico-chemical properties of the control and the biosolids-amened soils are presented
in Table 7-1. Water soluble fertilizer was supplied as Miracle Grow [24-8-16; nitrogen
(N)-phosphorus (P)-potassium (K)] obtained from a local store. The vegetable seeds
were purchased from Burpee seeds (Warminster, PA). Oasis HLB extraction cartridges
140
(3 cm3, 250 mg) for solid phase extraction (SPE) were purchased from Waters
(Mississauga, ON, Canada).
Toxicty and Bioaccumulation Study Design
The study included 4 crops × 3 treatments × 4 replicates and a control (four
replicates). Biosolids-amended and control soils were air-dried and sieved through a 2
mm sieve. Organic carbon was determined using the standard Walkley-Black method
(Walkley and Black, 1934), assuming that 77% of the total OC was oxidized (Nelson
and Somers, 1996). Soil ammonium concentration was determined by extracting with
2M KCl (USEPA, 1993b, Method 350.1). Approximately 2 kg (air dried) of control and
biosolids-amended soils were weighed in 15 cm (diameter) pots (bulk density of 1.6 g
cm-3) lined with a cloth screen to hold the soil. After weighing, the soils were thinly
spread in plastic trays to facilitate uniform application of treatments. The treatments
included amended soil with inherent TCS (990 ng g-1), and the same soil spiked with
5000 and 10,000 ng TCS g-1 soil. Treatment (Trt) spikes were supplemented to the
inherent TCS concentration in the amended soil; thus, the final nominal concentrations
were 990 (Trt 1), 5990 (Trt 2), and 10,900 ng TCS g-1 soil (Trt 3). The TCS
concentrations utilized are much greater than normally expected in soils amended with
typical biosolids applied at agronomic rates, but were useful to obtain a dose-response
relationship and to maximize potential plant accumulation of TCS. The Trt 1 was unique
as TCS occurred inherent to the biosolids and is expected to represent a real world
(field-equilibrated) scenario. Methanol was utilized as a carrier solvent for spiking in the
other treatments, and was allowed to evaporate in a hood as the soils equilibrated with
the spikes for 48 h. After spiking and equilibration, the soil was packed into pots and
brought to pot holding capacity. In a preliminary study, the pot holding capacity was

141
determined by saturating a pot with excess water, and allowing free drainage for 24 h.
Water retained by the soil column after free drainage stopped was considered the pot
holding capacity. Pot holding capacity (water content = 400 g kg-1 soil) is greater than
the field capacity (water content = 300 g kg-1) due to the textural discontinuity between
the soil, the cloth liner, and drainage holes present in the pots.
The crops consisted of gourmet blend lettuce (Lactuca sativa), crimson giant
radish (Raphanus sativus), bahia grass (Paspalum notatum), and baby cucumber
(Cucumic sativus). Crop species represented monocots (bahia grass), dicots (lettuce,
radish, cucumber), above-ground (lettuce, cucumber, radish leaves and bahia grass),
and below-ground (radish) biomasses. All the crops were planted from seeds. For bahia
grass, the recommended seeding rate of 10.9 Mg ha-1 was increased to 22 Mg ha-1
(equivalent to 2 g seeds per pot) to ensure sufficient and rapid soil surface coverage.
Lettuce and radish were planted using an excess seeding rate of ~30 seeds per pot,
and cucumber was planted using four seeds per pot. Seeds were covered with wet
paper towels and misted every 3 to 4 h until germination. Growth conditions for
vegetables included controlled chambers with a 24-h temperature maintained between
20 to 25°C, and a provision of 40-watt florescent bulbs for 15h photoperiod,
corresponding to a light intensity of 7000 to 10,000 lux. Bahia grass was grown in a
greenhouse, maintained at a suggested temperature range of 26 to 35°C (Newman et
al., 2010). Nanopure water was utilized for irrigation when the water content in the pots
was ≤80% of the pot holding capacity or when the soil surface appeared dry. On an
average, plants received water once daily. Saucers placed beneath the pots collected

142
any leachate, and the collected water was immediately poured back on to the soils to
avoid TCS leaching losses.
The first vegetable thinning occurred at a plant height of at least 2.5 cm, which
was 5 d for radish, and 10 d for lettuce and cucumber. No thinning was required for
bahia grass. During the first thinning, excess or weak plants were removed. The second
thinning (15 d) reduced the number of plants to 6 to 10 in each pot for radish and
lettuce, and to two plants for cucumber. A suggested solution for growing pot
vegetables consisted of 30g of 20-20-20 (N-P-K) analysis water-soluble fertilizer mixed
with 20 L of water (Stephens, 2009). A commercially available soluble fertilizer ―Miracle
grow‖ (N-P-K: 24-8-16) was deemed sufficiently close to the recommended dosage, and
was prepared by mixing 4 g of solid fertilizer with 4 L of water. Ten days after the
germination, control pots were provided with liquid fertilizer at weekly intervals until
harvesting. Biosolids-amended soil was deemed to contain sufficient nutrients to permit
healthy plant growth as illustrated by the physico-chemical properties of the amended
soil (Table 7-1), and were not fertilized.
Bioaccumulation Field Study
We utilized paired soil and plant samples from a site in Fulton County, IL amended
at high biosolids application rates for 16 years, resulting in total loads of 1084 to 1180
Mg biosolids ha-1. The last biosolids application occurred in 2000, and the plant samples
were collected in 2001, 2002, 2004 and 2006. Plant samples included three field
replicates for each crop and for each year. The soil and plant samples were collected,
air-dried and stored in a cool and dry place at room temperature until they were sent to
us in 2010. The available samples included a monocot (corn leaves) and a dicot

143
(soybean grains). The field samples addressed the possibility of long-term TCS and Me-
TCS plant bioaccumulation in a monoct and a dicot.
Plant Harvesting and Sample Preparation
Harvesting of radish and lettuce plants occurred 40 d after germination. Bahia
grass was harvested 60 d after the initial soil preparation, as the grass required
reseeding due to poor initial crop cover. Harvested plants were washed with nano-pure
water, fresh weights determined, and biomass (leaves and roots) was separated, dried
separately at 50°C to constant weight, and the dried tissue ball milled. Soils were
collected from each treatment and replicate immediately before and after the study, and
dried to constant weight at 50°C.
A sample extraction technique for TCS was modeled after that described by
Snyder et al. (2011) with some modifications. The dried soil and plant tissues (0.5-1 g)
were loaded into 25 mL glass centrifuge tubes and extracted with 10 mL of
MeOH+acetone (50:50, v/v). The extraction was performed on a platform shaker for 18
h, followed by 60 min of sonication in a water bath (Branson 2210, Danbury, CT; temp.
40°C, 60 sonications min-1). Suspensions were centrifuged at 800 x g, and the
supernatant transferred to 20 mL glass scintillation vials. The extraction procedure was
performed twice and the extracts were combined, dried (under N2), reconstituted in
MeOH and transferred to microcentrifuge tubes. The microcentrifuge tubes were
centrifuged at 18,000 × g for 30 min, and supernatant transferred to GC vials, and again
dried (under N2). Dried extracts were then reconstituted in MeOH, followed by cleanup
using Oasis HLB SPE cartridges (Chu and Metcalfe, 2007). After the cleanup, the
extract was transferred to amber GC vials, an internal standard 13C12-TCS (50 ng mL-1)
was added, and the extracts dried.

144
Derivatization was performed according to Shareef et al. (2006) with slight
modification. Briefly, the dried extracts were reconstituted in a mixture of 4:1 of
derivatization agent (BSTFA +1% TMCS) and a solvent (pyridine), vortexed for 10 s,
and heated in a dry bath for 1h. The samples were then transferred to fresh GC vials
with glass inserts and Teflon lined caps. A set of plant samples from the control soil was
spiked with TCS and Me-TCS, and subjected to the same extraction procedure. The
average percent recoveries of the spiked TCS and Me-TCS in the plants were >90%.
Instrument Analysis and Quantitation
The samples obtained after the derivatization step were analyzed by splitless
injection (5 µL) on a Varian 4000 Gas Chromatograph equipped with a Restek Rxi-5Sil
column coupled with a Varian 4000 MS/MS. The GC/MS conditions were modeled after
Balmer et al. (2004) with some modifications.The GC column temperature was initially
held at 100ºC for 1 min, and then increased to 310ºC at a rate of 10ºC min-1 with no final
hold time. The carrier gas was helium, the ion trap, manifold and transfer line
temperatures were 200, 80 and 270ºC, respectively, and the ionization source was
internal/electron ionization. Data acquisition monitored two fragment ions for each
compound. The ion masses were m/z of 345/347 for TCS trimethylsilylether, 302/304 for
Me-TCS. The internal standard 13C12 TCS-trimethylsilyl ether mass was monitored at
357/359. The samples ran for 22 min, with an average retention time of 14.8 min for all
compounds. For quantification, an 8-point internal calibration curve was generated in
the TCS concentration range of 1 to 1000 ng g-1, average R2 >0.999. The detection
limits were determined at a signal to noise (S/N) ratio of >10. The limit of detection
(LOD) was 0.28 ng g-1 and limit of quantitation (LOQ) was 1 ng g-1 for both TCS and
Me-TCS in the plant tissues. The LOD and LOQ values were calculated as 3-fold and

145
10-fold, respectively, the standard deviation in the signal from multiple runs of the
lowest calibration standard (Signal/Noise >10) (USEPA, 1984). The details of detection
limits and recoveries are provided in the Appendix C.
Results and Discussion
Plant Biomass Yields
Assessment of adverse effects of biosolids-borne TCS on plant growth was by
visual examination and by measuring plant biomass yields. Figures 7-1 and 7-2 are
representative pictures of lettuce, radish and bahia grass, and show no obvious
differences in the health of plants exposed to various soil TCS concentrations. Height
and vigor appeared to be superior in all the plants grown in treated soils (biosolids
amended) than in the control soil irrespective of the TCS concentration; i.e. TCS spiking
did not adversely affect the appearance of any plant species. Our observation was
consistent with reports of better growing grass (Poa pratensis) in fields of the biosolids-
amended soil than the control soils utilized in our study. Differences in field growth were
not quantified, but were visually obvious (Kuldip Kumar, personal communication,
2011).
Biosolids addition significantly increased the lettuce yields (fresh and dry wt.) in
Trt 1 relative to the control. Lettuce growth in Trt 2 and Trt 3, however, was inhibited
and plant fresh weights were significantly smaller than in Trt 1 (Table 7-2). The
observed difference appeared at a concentration of 5990 ng TCS g-1 amended soil. The
lettuce dry weights were not adversely affected at any concentration used.
Fresh weights of bahia grass were significantly greater in all of the TCS
treatments than in the controls, suggesting enhancement of plant growth by biosolids or
TCS addition (Table 7-2). Fresh weights of radish root in control, Trt 1 and Trt 2 were

146
not significantly different, but the weight in Trt 3 was significantly smaller than all other
treatments (Table 7-2). The data suggest some inhibition of radish root growth at an
amended soil concentration of 9150 ng TCS g-1. Thus, using fresh biomass yields as
the criteria, an amended soil concentration of 9150 ng TCS g-1 (Trt 3) can be regarded
as the LOEC for radish root growth. For lettuce, Trt 1 (4570 ng g-1) is regarded as the
LOEC, and for bahia grass the NOEC is at least the highest TCS concentration (9150
ng g-1) utilized in the study. In contrast, dry biomass yield data suggest essentially no
inhibition effect of spiked TCS. Only the radishes grown in Trt 2 had significantly smaller
yields, but the yields were similar to the control, suggesting no overall growth inhibition
(Table 7-2). Greater yield as a result of biosolids treatments was the only significant
effect. Thus, based on dry biomass yields, NOEC for all the plants is at least 9150 ng g-
1 (Trt 3).
Most TCS toxicity studies conducted in soils are either un-published or limited to
TCS effects on germination rates [Stevens et al. (2009); Hoberg (1992) Schwab and
Heim (1997)]. Only Liu et al. (2009) quantified TCS toxicity by growing cucumber and
rice plants exposed to a range of TCS concentrations (1-300 mg kg-1). The authors
suggested a shoot height inhibition effect concentration of 6 mg TCS kg-1 soil for
cucumber and a LOEC of 10 mg TCS kg-1 soil for rice root length. Comparisons of our
study results with those of Liu et al. (2009) are confounded because the latter study
involved no biosolids. Nevertheless, our estimated LOEC and NOEC values are within
the range reported in the Liu et al. (2009) study. Data suggest that fresh biomass yields
of lettuce and radish are adversely affected at TCS concentrations ranging from 5990 to
10990 ng g-1 amended soil, but no TCS concentration affected the dry biomass yields.

147
Cucumber plants utilized in our study behaved different than the other crops. Due
to delay in fruiting of the plants, we allowed the cucumber to grow for a longer time. The
cucumber variety chosen for the study was cross-pollinated, but the closed growth
rooms had no facility for bee pollination. Thus, we hand pollinated the female flowers
when they appeared, but were apparently unsuccessful as few fruit formed and plants
started to senesce before fruiting. Overall, cucumber growth was poor in all the
treatments and is unexplained. However, we do not believe the severe senescence and
poor fruit growth was a biosolids or TCS treatment effect because similar problems
occurred with plants grown in the control treatment. Due to problems in growing the
cucumber plants and poor fruit yield, bioaccumulation data were of limited use. A few
fruit were extracted to quantify the bioaccumulation. The TCS and Me-TCS
concentrations were below the detection limit (<LOQ of 1 ng g-1) of the instrument in all
the treatments, suggesting minimal accumulation based on the limited samples.
Uptake in the Above-Ground Biomass (Lettuce, Radish and Bahia Grass Leaves)
Uptake assessment occured through the calculation of bioaccumulation factors
(BAFs) expressed as the ratio of TCS concentration in the plant to the TCS
concentration in the soil in which the plant grew. Triclosan accumulated in the above-
ground biomass of all the crops, but the extent of accumulation was crop specific, and
varied with the amended soil TCS concentration. The greatest TCS concentration (897
± 117 ng g-1) accumulated in lettuce grown in amended soil with initial TCS
concentration of 10145 ± 1042 ng g-1 (Trt 3). The average BAF values, irrespective of
the TCS treatments, were 0.04 ± 0.04 for lettuce leaves (Table 7-3), and 0.004 ± 0.002
for the radish leaves (Table 7-4). The BAF values in Trt 3 for both lettuce and radish
leaves were significantly greater (p<0.001) than in Trt 1 and 2. Bahia grass leaves

148
accumulated no detectable TCS (<LOQ of 1 ng g-1), resulting in an estimated BAF of
<0.0001 for all the treatments (Table 7-5). On an average, lettuce leaves experienced
10-fold greater TCS accumulation than the radish leaves and ~40-fold more than bahia
grass. Duarte-Davidson and Jones (1996) suggested that physico-chemical properties
of organic chemicals and plant species affect the accumulation of polar and non-polar
compounds. Schroll and Scheunert (1992) suggested greater bioaccumulation of
hexachlorobenzene in dicots (lettuce and carrots) than in monocots (like maize, oats
and barley), but did not suggest an explanation. Our study included both dicots (radish,
lettuce) and monocots (bahia grass), and TCS accumulation was crop specific. Greater
TCS accumulation (0.004-0.43) occured in the dicots (radish and lettuce) than in the
monocot (bahia grass) (Tables 7-3 through 7-5). The 10-fold difference in BAF value
between the radish and lettuce leaves suggest variable accumulation in plants due to
different plant characterstics (e.g., lipid content). Suter (2007) suggested that water and
lipid content in plant tissues may affect the contaminant uptake by plants.
Bioaccumulation factors ≤ 0.01 are typically considered inconsequential (O‘Connor,
1996). Thus, the data suggest inconsequential accumulation in radish (BAF = 0.004)
and bahia grass leaves (BAF = <0.001) but some accumulation in lettuce leaves (BAF =
0.04) grown in soil spiked with exceptionally high TCS concentrations. The
bioaccumulation potential increased with TCS concentration
Uptake in the Below-Ground Biomass (Radish Root)
Radishes grown in soil spiked with Trt 3 (TCS concentration = 9905 ± 702 ng g-1)
accumulated the greatest amount of TCS (9150 ± 1187 ng g-1), corresponding to a BAF
value of 0.93 ± 0.14 (Table 7-6). The average BAF in radish root (0.43 ± 0.38), was 10-
fold the BAF (0.04 ± 0.04) in lettuce, and 100-fold the BAF (BAF = 0.004) in radish

149
leaves. Figure B-1 (Appendix B) compares the BAF values in the radish root and lettuce
leaves at various TCS concentrations. The data suggest significantly (p<0.05) greater
TCS accumulation in below-ground biomass (i.e radish roots) than in above-ground
biomass (i.e. lettuce leaves). Triclosan plant concentrations and BAFs increased with
TCS concentration in amended soil (Trt 1 to 3), but the accumulation in Trt 3 was
significantly greater (p <0.001) than in the Trt 1 and 2 (Table 7-6).
The above-ground and below-ground plant tissues analyzed for TCS were
simultaneously analyzed for Me-TCS, and the Me-TCS concentrations were below the
detection limit (1 ng g-1) for all the treatments.
Bioaccumulation Field Study
Concentrations in the soils collected from soybean fields were relatively constant
(51-56 ng TCS g-1 soil) in various years (Table 7-7), whereas soil concentrations in the
corn leaf fields were variable (43-100 ng TCS g-1 soil) (Table 7-8). The plant samples
also displayed variable TCS accumulation (Table 7-7 and 7-8). The monocot (corn leaf)
accumulated less TCS than soybean (dicot) grain. Soybean grain BAF values varied
widely across years with a greater accumulation (average BAF = 0.16 ± 0.15) in 2002
than 2001 (average BAF = 0.06 ± 0.09) (Table 7-7). Two of the three soybean samples
from 2001 had BAF values <0.01, representing minimal accumulation (Table 7-7). The
BAF values for all the corn leaf samples collected in 2006 were <0.01(Table 7-8),
representing inconsequential accumulation. Some corn samples collected in 2004
accumulated non-negligible amounts of TCS, with an average BAF value of 0.07 ± 0.05
(Table 7-8), but variability among the samples was large. Methyl-TCS concentrations
were non-detectable in all the field grown plants. Collectively, the field samples
represented longer-term measures of TCS phytoavailability than the growth chamber

150
studies. The field results were highly variable, but, were generally consistent with the
growth chamber and greenhouse data. Thus, TCS accumulation was slightly greater in
the dicot (soybean) than the monocot (corn) plants. The maximum BAF value calculated
for the field grown plants was 0.16.
Model-Predicted TCS Concentrations in Plant Tissue
The measured BAFs in various plants can be compared to BAFs predicted by a
Biosolids-Amended Soil: Level 4 (BASL4) computer model (Webster and Mackay,
2007). The model parameters were chosen based on the physico-chemical properties of
TCS and soils in which the plants were grown. The model predicted different BAFs for
above-ground and below-ground biomasses and grass, but failed to distinguish between
the radish and lettuce leaves. Further, the model predicts no significant difference
among BAFs at various soil TCS concentrations. The BASL4 predicted BAFs (dry wt.)
were 23 ± 1.2 for radish root, 6.1 ± 0.32 for lettuce and radish leaf, and 10.8 ± 0.45 for
bahia grass tissue (Tables 7-3 through 7-6). Modeled (using BASL4) BAF values over
predicts bioaccumulation in all plants and plant parts, and suggest significant TCS
bioaccumulation. In contrast, measurement suggest that plant uptake of biosolids-borne
TCS is generally minimal and strongly influenced by soil TCS concentrations. The only
similarity between the modeled and measured values is the prediction of greater TCS
accumulation in below-ground (i.e roots) than the above-ground (i.e leaves) biomass.
Plant accumulation of organic chemicals has been predicted using empirical
equations and the accumulation is believed to depend heavily on chemical partitioning
coefficient (Kow) with no consideration of soil characterstics or chemical exposure times.
Such equations were previously utilized for risk estimation of various chemicals by
USEPA. Travis and Arms (1988) derived an equation (equation 7-1) to describe

151
bioaccumulation of 29 hydrophobic chemicals including pesticides and dioxins in above-
ground plant biomass (multiple crop species). The equation was derived for pesticides
with a log Kow ranging from 1.75 and 6.15. The log Kow of TCS is 4.8 and thus, TCS
bioaccumulation may be expected to follow the prediction.
log Up -0.578 log Kow 1.588 (7-1)
Where Up : Uptake coefficient (equivalent to BAF), and the numerical values are
regression parameters; using log Kow of TCS as 4.8,
Calculated uptake coefficient (Up) for TCS was 0.065 for all the above-ground biomass.
The estimated BAF value exceeded the measured BAF values for lettuce, radish and
bahia grass leaves and underestimated BAF for radish root. Suter (2007) opined that
the accumulation of chemicals is less likely to follow the empirical model predictions if
the chemical, soil and plant species are different than the ones used to derive the
model. A definitive prediction could only be made using the empirical models if the
models are validated to a wide range of chemicals, soils and plants. Thus, the models
and empirical equations (Equation 7-1) overpredict the phytoaccumulation of TCS, and
the estimates should be used with caution.
Mechanism of Bioaccumulation and Comparison with Other Studies
The BAF values obtained in our study suggest some accumulation in the below-
ground biomass (roots), and translocation to the above-ground biomass (leaves), but
accumulation was greater in the root crop than in above-ground biomass. Mechanistic
explanations for the difference are not known. The Henry‘s constant (H) for TCS at 25°C
is small (10-9), so vapor phase movement is likely minimal. Rather, movement in the
aqueous phase and/or direct partitioning from soil to lipid rich plant tissue is likely critical

152
(Trapp and McFarlene, 1995). Trapp and McFarlene (1995) and Wild and Jones (1992)
suggested that lipophilic compounds with log Kow >4 (like TCS) have a limited transport
across the endodermis membrane through soil solution. Further, Trapp and McFarlene
(1995) suggested that non-ionized chemicals entering the plants through root or leaves
move in the plant with water flow in the xylem, but TCS movement with water is limited
because of the low water solubility.Thus, TCS is expected to move (partition) from soil
solids to lipid enriched outer root parts and accumulate there. The abovementioned
concept is partially true in our study as we observed a greater accumulation in the
radish roots than in the leaves suggesting a direct partitioning to roots, but detection of
small levels of TCS in the leaves suggests that at least some translocation occurred
from the root to the leaves even when the expectation of movement was minimal.
Wu et al. (2010) evaluated the TCS uptake by soybean (Glycine max) from a soil
(sand, pH = 5.1, OC = 16 g kg-1) amended with spiked biosolids (11 Mg ha-1) to obtain a
final TCS concentration of 70 ng g-1 amended soil. Data suggested plant TCS
accumulation, and the range of BAFs (1-6.5) was greater than the range of BAFs
obtained in our greenhouse and field samples (<0.0001 to 0.43). Difference in biosolids
type and application rates likely caused different bioaccumulation in the two studies.
The biosolids utilized in the Wu et al. (2010) study contained much less solids content
(19 g L-1) than biosolids (300 g kg-1) used in our studies; lower solids content would
mean a greater relative TCS aqueous phase concentration, greater bioavailability and
greater plant accumulation. In addition, the two studies differed in the biosolids loading
rates. Wu et al. (2010) applied a biosolids load of 11 Mg ha-1, compared with loading
rate of 228 Mg ha-1 used herein, which may have affected TCS bioavailability. Trapp

153
and McFarlene (1995) suggested that high biosolids application increases the OC
content of soils and reduces TCS uptake by roots and translocation via xylem; thus,
reducing the extent of plant accumulation.
Previous studies also suggested variable accumulation of antimicrobials and
antibiotics (Boxall et al., 2006; Dolliver et al., 2007) in various plant parts. Boxall et al.
(2006) investigated the accumulation of antibiotics (concentration = 1 mg kg-1 soil) in
soil (loamy sand), and found that some of the antibiotics accumulated more in the body
of the carrot, whereas some accumulated more in the outer peel of the carrot. Similarly,
Dolliver et al. (2007) evaluated the accumulation of antibiotic sulfamethazine in potatoes
grown in silt loam soil (pH: 7.0; OC: 27 g kg-1). Sulfamethazine accumulated more in the
outer skin of the tuber than the center of the potato. The molecular weight, pKa and
structure of TCS is similar to the antimicrobials (trimethoprim, sulfadiazine) described in
Boxall et al. (2006), and was expected to accumulate in a similar manner. Thus, similar
to our study, the abovementioned studies suggest variable accumulation in various
plant parts.
Degradation in Soils
The percent disappearance of TCS was calculated based on the TCS
concentrations measured in soil immediately before and after the greenhouse study
(Table 7-8 to 7-10). The data suggest TCS disappearance in all treatments utilized in
our study. The soil used to grow lettuce and radish was collected after 40 d, whereas
soil sample used to grow bahia grass was collected after 60 d. Previous TCS
degradation data (Chapter 4) and values obtained from the literature suggest a primary
degradation half-life (time for 50% disappearance) of TCS of ~100 d (across soil types),
and formation of a metabolite (Me-TCS). Thus, after 40-60 d of plant growth in the soil,
154
we expected ~20-25% degradation/disappearance of TCS. Data (Table 7-9), however,
suggest a maximum disappearance of 15%. The estimated percent disappearance was
variable (shown by large standard errors associated with the data) and did not increase
with TCS concentration (Tables 7-8 through 7-10). Further, no metabolite (Me-TCS)
was detected in the system suggesting that either the metabolite (Me-TCS) appeared
and became non-extractable with time, or the Me-TCS did not form due to reduced
bioavailability of TCS. Reduction in TCS bioavailability may occur because high
biosolids application (228 Mg ha-1) is expected to favor strong interaction of TCS with
OC matrix (Alexander, 1995). Wild and Jones (1991) observed slower degradation of
diethylhexyl phthalate (DEHP) in soil amended with high biosolids application (90 Mg
ha-1), than in same soil amended at agronomic rates (22 Mg ha-1). These authors
opined that the high biosolids dosages either decreased the DEHP bioavailability or
created partial anaerobic soil conditions that slowed the degradation. Our study may
also possess anaerobic microsites due to high water content (450 g kg-1 soil) of the
soils. Appearance of Me-TCS and subsequent conversion to non-extractable fraction
with time may also occur, similar to previous observations (Chapter 4). Further, Me-TCS
was not detected in any of the plant parts, consistent with the absence of detectable
Me-TCS in biosolids and soils utilized herein.
Comparison with Real World TCS Concentrations
The spiked TCS concentration range utilized in the present study was 990-10990
ng g-1 amended soil. The TCS concentration in Trt 1 (~990 ng g-1 amended soil) is
equivalent to an agronomic application rate (22 Mg ha-1) of biosolids containing a TCS
concentration of 16000 ng g-1 (mean concentration from TNSSS, 2009) for at least 6
years assuming no TCS losses. The Trt 1 was unique among other treatments as TCS

155
occured inherent to the biosolids (no spike additions), and is expected to represent a
real world scenario.
Soils with high biosolids applications resulting in high TCS concentrations similar
to Trt 1 utilized herein are sometimes used in real world for landscaping purposes. In
fact, a biosolids application of 228 Mg ha-1 occurred on the landscaping field-
equilibrated soil utilized herein. Landscaping soils similar to the one mentioned above
may be used for growing grass, but likely not for vegetables. Thus, the vegetables
grown in the landscaping soil represents a worst-case estimate. Treatments 2 (5990 ng
g-1) and Trt 3 (10990 ng g-1) were included in the study design to obtain a dose-
response relationship. Biosolids containing a TCS concentration of 133 mg TCS kg-1
(highest biosolids concentration from TNSSS, 2009), applied for 10 years and assuming
no TCS loss, results in a TCS concentration of 13300 ng TCS g-1 amended soil. Thus,
the TCS concentration in Trt 3 was unrealistic. The Trt 1 and 2 are more reasonable,
but still represent applications of representative biosolids at agronomic rates for up to 6-
30 years, and assume no TCS loss over time. The BAFs were reestimated by excluding
Trt 3. The resulting average BAF values were 0.02 for lettuce leaves and 0.26 for radish
roots (Table B-1, Appendix B), as compared to the 0.04 and 0.43 with all treatments
included.
Further, plant accumulation may differ when TCS is inherent vs spiked into the
biosolids. Langdon (2010, personal communication) found different dissipation/
degradation rates of TCS when TCS occurs inherently vs when TCS is spiked into
biosolids. Difference in dissipation rates may occur as the spiked TCS is likely to sorb to
the outer portion of the biosolids and therefore be more available to microbes in the

156
presence of O2 causing faster TCS degradation. Different dissipation rates between the
inherent vs spiked systems might have created variable bioavailabilities in our Trt 1
(inherent TCS), Trt 2 and 3 (spiked TCS) causing different accumulation. A relationship
between accumulation and chemical occuring in spiked vs inherent form could not be
established, as our study was confounded by the different concentrations in the two
treatments; however, accumulation data in plants exposed to Trt 1 are likely more
accurate.
Thus, while the TCS concentrations utilized in our study were unrealistic for
typical biosolids applied at agronomic rates, results may mimic phytoavailability
following long-term biosolids applications, or exceptionally high application rates.
Results suggest that inherent or spiked biosolids-borne TCS applied at excessively high
concentrations and applied for multiple years will not result in significant accumulation of
TCS in above-ground plant parts; however some accumulation is possible in root crops
like radish.

157
Table 7-1. Selected physico-chemical properties of the soils and biosolids used in the present study.
Soils Organic carbon
Mehlich-1 P NH4+-N
pH (1:1)
EC
Texture
g kg-1 ——mg kg-1—— µS cm-1
Control 30 ± 0.4 3.2 ± 0.2 8.9 ± 0.2 6.0 ± 1.7 512 ± 25 Clay loam
Filed biosolids amended
84 ± 0.3 790 ± 12 27 ± 1.4 7.1 ± 0.0 506 ± 2.3 Silty clay
loam
Table 7-2. Yield of plant parts of three plant species represented by fresh weights (g) in the control and biosolids-amended treatments (same letters represent no statistical difference among treatments).
Plant type Amended- soil TCS concentration (ng g-1)
(Treatment)
Fresh weight (g) Dry weight (g)
Lettuce Control
990 (Trt 1) 5990 (Trt 2)
10990 (Trt 3)
25.7 ± 0.90 c 79.7 ± 6.77 b 55.6 ± 9.23 a 55.9 ± 6.28 a
6.17 ±1.00 a 13.2 ± 4.94 b 13.7 ± 4.15 b 15.2 ± 3.69 b
Bahia grass Control
990 (Trt 1) 5990 (Trt 2)
10990 (Trt 3)
12.5 ± 1.07 a 42.2 ± 3.70 b 30.2 ± 7.23 b 27.7 ± 9.83 b
0.10 ± 0.02 a 7.82 ± 0.61 b 4.54 ± 1.26 b 6.41 ± 4.78 b
Radish Control
990 (Trt 1) 5990 (Trt 2)
10990 (Trt 3)
22.5 ± 6.31 a 26.9 ± 9.70 a 17.3 ± 2.60 a 11.1 ± 2.10 b
3.70 ± 0.64 a 7.98 ± 0.97 b 4.55 ± 0.75 a 7.56 ± 3.16 b

158
Table 7-3. Measured TCS concentrations (average; n = 3 or 4 and SD) and bioaccumulation factors (BAF) and BASL4 model calculated BAFs in the lettuce leaves grown in a biosolids- amended silty clay loam soil (same letters represent no statistical difference among treatments).
Type of application (Treatment)
Measured biosolids-amended soil concentration
Measured plant tissue
concentration
Mean BAF dry wt.
Calculated BAF
(BASL4) –––––––––ng g-1––––––––––
Inherent (Trt 1) 1015 ± 94.2 10.7 ± 2.1 0.01 ± 0.00 a 5.92 a Spiked (Trt 2) 4570 ± 448 119 ±14 0.03 ± 0.00 b 6.47 a Spiked (Trt 3) 10145 ±1043 897 ±117 0.09 ± 0.01 c 5.93 a
Average 0.04 ± 0.04 6.10 ± 0.32
Table 7-4. Measured TCS concentrations (average; n = 3 or 4 and SD) and bioaccumulation factors (BAF) and BASL4 model calculated BAFs in the radish leaves grown in a biosolids amended silty clay loam soil (same letters represent no statistical difference among treatments).
Type of application (Treatment)
Measured biosolids-amended soil concentration
Measured plant tissue
concentration
Mean BAF dry wt.
Calculated BAF
(BASL4) –––––––––ng g-1––––––––––
Inherent (Trt 1) 989 ± 68.4 <1 <0.001 a 5.92 a Spiked (Trt 2) 4531 ± 439 16.9 ± 2.20 0.004 ± 0.00 a 6.47 a Spiked (Trt 3) 9905 ± 702 62.8 ± 21.3 0.006 ± 0.00 b 5.93 a
Average 0.004 ±0.002 6.10 ± 0.32
Table 7-5. Measured TCS concentrations (average; n = 3 or 4 and SD) and bioaccumulation factors (BAF) and BASL4 model calculated BAFs in the Bahia grass grown in a biosolids-amended silty clay loam soil (same letters represent no statistical difference among treatments).
Type of application (Treatment)
Measured biosolids-amended soil concentration
Measured plant tissue
concentration
Mean BAF dry wt.
Calculated BAF
(BASL4) –––––––––ng g-1––––––––––
Inherent (Trt 1) 977 ± 68.4 <1 <0.0001 a 10.9 a Spiked (Trt 2) 4492 ± 395 <1 <0.0001 a 11.2 a Spiked (Trt 3) 9221 ± 832 <1 <0.0001 a 10.3 a
Average <0.0001 10.8 ± 0.45
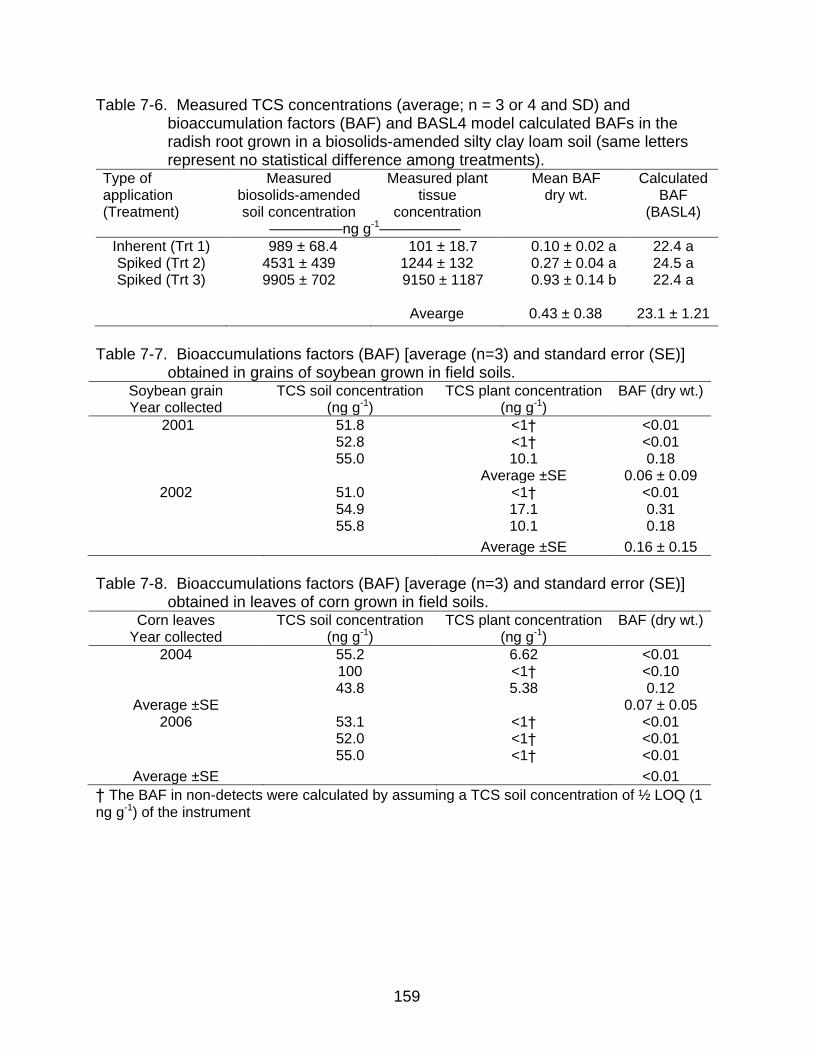
159
Table 7-6. Measured TCS concentrations (average; n = 3 or 4 and SD) and bioaccumulation factors (BAF) and BASL4 model calculated BAFs in the radish root grown in a biosolids-amended silty clay loam soil (same letters represent no statistical difference among treatments).
Type of application (Treatment)
Measured biosolids-amended soil concentration
Measured plant tissue
concentration
Mean BAF dry wt.
Calculated BAF
(BASL4) –––––––––ng g-1––––––––––
Inherent (Trt 1) 989 ± 68.4 101 ± 18.7 0.10 ± 0.02 a 22.4 a Spiked (Trt 2) 4531 ± 439 1244 ± 132 0.27 ± 0.04 a 24.5 a Spiked (Trt 3) 9905 ± 702 9150 ± 1187 0.93 ± 0.14 b 22.4 a
Avearge 0.43 ± 0.38 23.1 ± 1.21
Table 7-7. Bioaccumulations factors (BAF) [average (n=3) and standard error (SE)]
obtained in grains of soybean grown in field soils. Soybean grain Year collected
TCS soil concentration (ng g-1)
TCS plant concentration (ng g-1)
BAF (dry wt.)
2001 51.8 <1† <0.01 52.8 <1† <0.01 55.0 10.1 0.18 Average ±SE 0.06 ± 0.09
2002 51.0 <1† <0.01 54.9 17.1 0.31 55.8 10.1 0.18
Average ±SE 0.16 ± 0.15
Table 7-8. Bioaccumulations factors (BAF) [average (n=3) and standard error (SE)]
obtained in leaves of corn grown in field soils. Corn leaves
Year collected TCS soil concentration
(ng g-1) TCS plant concentration
(ng g-1) BAF (dry wt.)
2004 55.2 6.62 <0.01 100 <1† <0.10 43.8 5.38 0.12
Average ±SE 0.07 ± 0.05 2006 53.1 <1† <0.01
52.0 <1† <0.01 55.0 <1† <0.01
Average ±SE <0.01
† The BAF in non-detects were calculated by assuming a TCS soil concentration of ½ LOQ (1
ng g-1) of the instrument

160
Table 7-9. Measured TCS soil concentrations in lettuce treatments (means; n = 3 or 4 and SD) before and after the plant accumulation study and the corresponding % disappearance.
Type of application (Treatment)
Initial TCS soil concentrations
Final TCS soil concentrations
% disappearance
–––––––––ng g-1–––––––––– Inherent (Trt 1) 1015 ± 94.2 873 ± 95.2 13 ± 10 Spiked (Trt 2) 4570 ± 448.4 4372 ± 438 3.2 ± 17 Spiked (Trt 3) 10145 ±1043 8826 ± 875 12 ± 5.9
Table 7-10. Measured TCS soil concentrations in radish treatments (means; n = 3 or 4 and SD) before and after the plant accumulation study and the corresponding % disappearance.
Type of application (Treatment)
Initial TCS soil concentrations
Final TCS soil concentrations
% disappearance
–––––––––ng g-1–––––––––– Inherent (Trt 1) 989 ± 68.4 874 ± 93 11 ± 10 Spiked (Trt 2) 4531 ± 439 4224 ± 386 7 ± 6 Spiked (Trt 3) 9905 ± 702 8422 ± 472 15 ± 9
Table 7-11. Measured TCS soil concentrations in bahia grass treatments (means; n = 3 or 4 and SD) before and after the plant accumulation study and the corresponding % disappearance.
Type of application (Treatment)
Initial TCS soil concentrations
Final TCS soil concentrations
% disappearance
–––––––––ng g-1–––––––––– Inherent (Trt 1) 977 ± 68.4 956 ± 43.4 1.8 ± 8.0 Spiked (Trt 2) 4492 ± 395 4080 ± 330 8.8 ± 8.9 Spiked (Trt 3) 9221 ± 832 8654 ± 613 5.8 ± 8.0

161
Figure 7-1. Representative photos of lettuce (A and B) and radish (C and D) plants that
compare plant growth in the control and treatments.†
†Control: no biosolids, Trt 1(no spike) = TCS spiked concentration of 990 ng g-1
†Trt 2 (5 ppm TCS) = TCS spiked concentration of 5990 ng g
-1
A B
C D
A B
C D

162
Figure 7-2. Representative photos of bahia grass that compare plant growth in various
TCS treatments.†
†Trt 1(no spike) = TCS spiked concentration of 990 ng g-1
†Trt 2 (5 ppm TCS) = TCS spiked concentration of 5990 ng g
-1
†Trt 3 (10 ppm) = TCS spiked concentration of 10,990 ng g-1
A. B.

163
CHAPTER 8 MOBILITY OF TRICLOSAN (TCS) IN BIOSOLIDS-AMENDED SOILS
Background
Triclosan [5-chloro-2-(2,4-dichlorophenoxy)-phenol] (TCS) is an antimicrobial
agent commonly added to a number of consumer products. Plastic and textile
manufacturing industries use TCS as an additive. The inherent antibacterial property of
TCS makes it an effective agent for use in household articles like sponges and kitchen
chopping boards. The incorporation of TCS in a vast array of products results in its
discharge to wastewater treatment plants (WWTPs).
The products of WWTPs are liquids (effluents) and solids (sludge). Processed
sludge forms biosolids, which may then be land applied. The hydrophobic nature of TCS
(log Kow 4.6 to 4.8: Halden and Paull, 2005; Ying et al., 2007) portends significant
partitioning of TCS originally in wastewater streams into biosolids. Reported biosolids
TCS concentrations in the extensive (78 WWTPs) 2009 Targeted National Sewage
Sludge Survey (TNSSS) (USEPA, 2009a) were 0.4 to 133 mg kg-1 with an overall mean
of 16 ± 65 mg kg-1 (including statistical outliers). An average WWTP in U.S. produces
240 kg dry weight of biosolids per million litres of wastewater treated (Kinney et al.,
2006). Nationally, WWTPs produce about 7 million Mg of biosolids each year, ~63% of
which is land applied (NRC, 2002). Assuming an average biosolids-borne TCS
concentration of 16 mg kg-1 (mean value from TNSSS), land application represents a
potentially significant source (~70 Mg year-1) of TCS to the land.
Some worry that the TCS presence in the environment could contribute to the
spread of bacterial resistance and threaten human drug therapy (Birosova and
Mikulasova, 2009; Pycke et al., 2010; McMurry et al., 1998). McMurry et al. (1998)
164
recovered TCS-resistant E.coli on agar plates with a mutation of fab 1 gene. Besides,
TCS affects aquatic organisms by blocking enzyme carrying proteins, causing concerns
of the possible build-up of bacterial resistance in these organisms (Nghiem and
Coleman, 2008). Numerous aquatic TCS toxicity data are summarized in Table 1-1
(Chapter 1). Triclosan can be toxic to fish with chronic toxicity value of 22 mg L-1
(Lindstrom et al., 2002). Orvos et al. (2002) reported TCS toxicity to Daphnia magna
with a 48-h median effective concentration (EC50) of 390 mg L-1 and fathead minnow
(Pimephales promelas) with a 96-h median lethal concentration (LC50) of 260 mg L-1.
Therefore, movement of TCS through and over biosolids-amended soils to surface
waters could be an environmental concern.
Despite the occurrence of TCS in biosolids, and frequency of biosolids land
application, little is known about the mobility of TCS in amended soils. Cha and Cupples
(2010) assessed the leaching potential of TCS in biosolids-amended soils using
biodegradation and sorption data in a simple leaching model developed for pesticides
(Gustafson, 1989). The model involved calculation of leaching potential using
groundwater ubiquity scores (GUS); and chemicals with GUS<2.8 were termed non-
leachable. This model assumed reversible chemical sorption and first order chemical
degradation half-life. The model predicted that TCS in biosolids amended to sandy and
loam soils (concentration = 0.05-2 mg TCS kg-1 amended soil) would experience
insignificant leaching (GUS<0.7). Topp et al. (2008) used simulated rainfall in field
studies to estimate the runoff potential of TCS in soil amended with surface applied and
incorporated liquid biosolids. Triclosan appeared in runoff water from the surface
applied liquid biosolids treatment collected immediately and 266 d after the biosolids

165
application. The reason for TCS appearance at day 266 was not known but was
attributed to the persistence of TCS in bound residues especially during the winter
months. Sabourin et al. (2009) conducted a similar TCS leaching study following the
application of dewatered biosolids. Less than 1% of the total biosolids TCS mass
appeared in the runoff water suggesting minimal mobility.
Lapen et al. (2008) suggested a potential for TCS transport via shallow tile
drainage systems to surface waters. Triclosan was detected in tile drains when soils
received either liquid or dewatered biosolids (Lapen et al., 2008; Edwards et al., 2009).
Greater TCS concentrations (3.68 µg L-1) in tile drains appeared following liquid
biosolids application (Lapen et al., 2008) than appearing following dewatered biosolids
application (0.24 µg L-1) (Edwards et al., 2009). Xia et al. (2010) reported that 49 to 64%
of total TCS mass applied in biosolids treatments was found at a depth of 30 to 120 cm,
suggesting significant leaching in soils amended with biosolids for 33 years. The studies
described above represent somewhat unique conditions. Lapen et al. (2008) utilized
liquid biosolids (11.9 g solids L-1 biosolids), the soil in Xia et al. (2010) was a calcareous
mine spoil (pH = 7.8) and the biosolids used in Edwards et al. (2009) had high pH
(~7.5). Liquid biosolids portends greater amounts of TCS in the aqueous phase as the
fluidity of liquid biosolids is similar to water. The high pH in two systems was close to
the pKa of TCS (~8); likely making the dissociated TCS more available for transport
within and over the soil surface.
The log Koc values determined in soils, biosolids, and biosolids-amended soils for
TCS were large (>4), and reasonably constant for all solid matrices (Agyin-Birikorang et
al., 2010). The large values suggest a propensity of TCS to partition onto organic

166
carbon (OC) associated with biosolids, soil and sediment in the environment. Hysteresis
coefficients for TCS determined in soils, biosolids, and biosolids-amended soils
matrices were <<1 (0.002 to 0.005 for biosolids, 0.25 to 0.30 for biosolids-amended
soils, and 0.41 to 0.42 for un-amended soils) suggesting highly restricted desorption
(Agyin-Birikorang et al., 2010). The small hysteresis coefficients, particularly for the
biosolids, suggest that reincorporation of TCS to the solution during desorption is
practically negligible (Mamy and Barriuso, 2007). Triclocarban (TCC) with soil log Koc
(3.82) similar to log Koc of TCS (4.26) experienced minimal leaching (<1%) in a
biosolids-amended soil, and formation of TCC bound residues (Snyder, 2009). Triclosan
bound residues were also observed in biodegradation study of TCS conducted in
biosolids-amended soil (Chapter 4). Based on the expected behavior of TCS, we
hypothesized that the mobility of biosolids-borne TCS is strongly retarded in amended
soils. Besides TCS, a degradation metabolite of TCS is likely to appear in soils, as the
primary degradation half-life of TCS in amended soil is 100 d (Chapter 4). The objective
of the present study was to determine the mobility of TCS (and possibly Me-TCS) in
biosolids-amended soil. Leachability was assessed in a laboratory column study utilizing
a sand soil with a pH<pKa and a low organic carbon (3 g kg-1) content. The soil was
amended with cake biosolids (solids: 320 g kg-1) as the source of spiked (14C) TCS.
Sandy soils with low organic carbon and clay contents are more prone to chemical
leaching, given the abundance of macropores and low capacity for TCS retention
(Yaron et al., 1996). The 30 cm long columns were packed with 20 cm sand, amended
with biosolids spiked with 14C-TCS and periodically leached with two irrigation regimes
for upto 2 months. Leachates from the columns were collected after each irrigation

167
event, and at study termination, the soils in the columns were sectioned and extracted
to quantify the depth of TCS and Me-TCS movement.
Materials and Methods
Experimental Design
The design consisted of incorporation of TCS spiked biosolids, or soils, into soil
columns and application of two irrigation regimes. The irrigation regimes were based on
the rainfall received in Gainesville, FL area. The 40-year (1970-2009) average annual
rainfall in Gainesville is 132.8 cm (occurring in 126 days). More than half of the rainfall
(74.8 cm) occurs in the summer (June – September, occuring in 49 days). In the
summer, an average of ~1.53 cm rainfall occurs at a frequency of 2.7 days, yielding a
weekly average of 3.97 cm. Irrigation consisted of empirical and stochastic regimes and
soil treatments included controls (no biosolids), and biosolids incorporated with the top
2.5 cm of soil. The treatment combinations were:
Empirical control
Stochastic control
Empirical biosolids treatment
Stochastic biosolids treatment The irrigation regime consisted of the following:
Empirical irrigation: Quantity of water applied to the columns was based on the long-term average weekly summer rainfall amounts in Gainesville: ~3.97 cm ≈ 77.9 mL ≈ 0.5 pore volumes/week.
Stochastic irrigation: Random water applications (quantity and frequency) to mimic actual long-term rainfall patterns, but the total quantity of water applied over the experimental period was the same as the quantity applied in the empirical irrigation regime.
Chloride was utilized as a non-interactive conservative tracer. At each leaching
event, irrigation water was mixed with chloride to assess water movement during the
experiment.

168
Soils, Biosolids and Chemicals
As the study was conducted in Gainesville, we utilized soil (sand; OC: 3 g kg-1)
collected from the E-horizon of an uncoated Myakka fine sand (sandy, siliceous,
hyperthermic Aeric Alaquods). 14C–TCS radiolabeled uniformly on the chlorophenol ring
(specific activity - 48 mCi mmol-1 and 99% purity) was custom synthesized by Tjaden
Biosciences (Burlington, IA). Ecoscint A liquid scintillation cocktail was purchased from
National Diagnostics (Atlanta, GA). Potassium chromate, silver nitrate, methanol
(MeOH), acetone and other solvents were purchased from Fisher Scientific (Atlanta,
GA). An anaerobically digested class A cake biosolids (solids content: 320 g kg-1) was
collected from a domestic WWTP in Illinois. The biosolids contained 5 mg kg-1 of TCS
and non-detectable (<0.7 mg kg-1) Me-TCS (Chapter 2).
Tagging and Application of Biosolids
The biosolids (100 g) were spiked with 0.06 mCi of 14C-TCS (specific activity =
48 mCi mmol -1), resulting in a total TCS biosolids concentration of ~8.6 mg TCS kg-1.
Although the biosolids TCS concentration was below the mean concentration (16 mg kg-
1) found in TNSSS, it was within the range reported in the TNSSS (USEPA, 2009a). The
biosolids (10 g dry weight equivalent/tube) were weighed into 50-mL Teflon tubes (total
of 10 tubes), and spiked with 5 mL of MeOH containing 6 μCi of 14C-TCS. The 14C-TCS
spiked biosolids samples were sealed and equilibrated for 24 h, the MeOH was
evaporated for an additional 24 h in a hood. The biosolids samples from various tubes
were composited and thoroughly mixed. The columns utilized in the study were 30 cm in
length and 5 cm in diameter. Plain sand filled 20 cm of the column and was supported
by porous plate. To encourage uniform water distribution, 10 cm of pea gravel was
placed at the top and a suction of 0.1 bar was applied to the column. Appropriate

169
quantities of the spiked thoroughly mixed biosolids (~6 g) were incorporated to a depth
of 2.5 cm into the soil at equivalent rate of 22 Mg ha-1 (1%, by wt). Control treatments
consisted of spraying 14C directly on the top of the soil (no biosolids) to achieve the
same TCS concentration as in the biosolids-amended treatments. The suction head of
0.1 bar applied to the columns prevented saturation at the column bottom, and
maintained uniform moisture content (10% by weight, roughly field capacity) throughout
the column. The schedule of the leaching events and the amount of irrigation applied is
described in Table 8-1.
Pore Volume Determination
A preliminary experiment was conducted to determine a representative column
pore volume (PV), using the gradual wetting method. Four columns were filled with 600
g of dry soil and weighed. Water was gradually introduced into the columns through the
column bottom using Mariotte bottles, until the soil was saturated. A suction head of
~0.1 bar (similar to the experimental conditions) was then applied to the columns until
the excess water drained out. The columns were then re-weighed and the difference in
weight (~148 g) was assumed to be 1 PV.
Leachate Collection and Analysis
After each leaching event, leachate was collected from each column, and
analyzed for tracer (chloride) concentration, and 14C activity. Chloride concentration was
determined in an aliquot (5 mL) of leachate using the Argentometric titration procedure
(Sheen and Kahler, 1938; Kumar, 2006). The method consisted of titration with silver
nitrate using potassium chromate as indicator. Another aliquot (1 mL) of the leachate
was mixed with 10 mL of scintillation cocktail to determine 14C activity. Measurement
was performed for 5 min on a liquid scintillation counter (LS 6500, Beckman Coulter

170
Inc., Fullerton, CA, USA) with background correction against blank samples (14C-free
cocktail).
Determination of 14C Activity in the Soil
After the study termination, pea gravel on the soil surface was carefully removed
and the soil in each column was gently pushed up from the bottom of the columns with
a plunger. The soils in biosolids-amended treatment and controls were sectioned into
0.5 cm increments up to 2.5 cm, and at 2.5 cm increments from 5 to 20 cm. A
subsample of each soil section was combusted at 900°C in a Harvey Oxidizer Model
OX-500 (Tappan, NY), and analyzed for total 14C activity. Additionally, a subsample
from the zone of biosolids incorporation (0-2.5 cm) from each column was extracted
(twice) with MeOH: acetone (50:50; v/v) solvent as described previously (Chapter 4).
The extract was then subjected to RAD-TLC analyses (for 14C-speciation) as described
previously (Chapter 4).
Results and Discussion
Leachate Recoveries and Tracer Breakthrough
Leachate recoveries were calculated as the ratio of the volume of irrigation water
collected beneath the columns to the volume of irrigation water applied to the columns.
Recoveries in the empirical and stochastic irrigation treatments at each leaching event
were similar and >90% and approximately constant for the entire study period (62 d)
(Figure 8-1). Recoveries in the control and biosolids treatments were also similar. Most
of the applied water was recovered with no indication of soil saturation and biosolids
application did not retard water movement.
Consistent with the constant leachate recoveries, column masses were nearly
constant for the study period, and similar to the masses measured at time zero (data not

171
presented). Constant column masses suggest that the study conditions remained
constant through the study period.
The tracer (chloride) breakthrough curve is represented in Figure 8-2.
Breakthrough of Cl did not differ between the control and biosolids-amended treatments
and was similar for both irrigation treatments. Similar breakthrough indicates similar
water flow despite different frequency of water application. At 1 PV, 50% of Cl appeared
in the leachate suggesting uniform convective transport and lack of preferential flow
(Mamo et al., 2005). However, the breakthrough curve for the empirical treatments
(Figure 8-2a) was more symmetrical than for the stochastic treatments (Figure 8-2b).
After leaching for about 4 PV, the relative concentration of Cl was almost zero
suggesting that all the Cl was recovered from the columns.
14C in Leachates and Recoveries by Combustion
Leachate collected from columns in all the treatments contained no detectable
14C throughout the study period, suggesting that all the applied 14C-TCS remained in the
soil. Addition of up to 4PV of water did not move 14C to the bottom of the columns.
Different irrigation regimes and TCS spiked onto biosolids or directly on to the soil
surface affect the TCS leaching behavior.
The percent 14C recoveries from the soils sectioned at various depths are
presented in Table 8-2. Average recovery of 14C from the top (0-2.5 cm) depth in the
empirical treatment was 97.8 ± 0.83%. The soil segment immediately below
incorporation (2.5-5 cm) contained 2.08 ± 0.84%, but only 0.01% of 14C was detected at
the depth >5 cm. Similarly, for the stochastic treatment, the average recovery was 93.7
± 2.05% at the 0-2.5 cm depth, 6.17 ± 2.04% at 2.5 to 5 cm depth, only 0.01% of 14C
beyond the 5 cm depth. Data for biosolids treatments suggest that the majority of the

172
14C (93-97%) was contained within the depth of incorporation (0-2.5 cm) irrespective of
the irrigation treatments (Table 8-2). Triclosan association with biosolids was likely
greater than in the soils, as the partitioning coefficient of TCS is greater in the biosolids
(log Kd = 3.76) than in the soils alone (log Kd = 2.25) (Agyin-Birikorang et al., 2010).
Appearance of 14C below 2.5 cm likely represents contamination from the top depth
during the soil sectioning process. Minimal 14C detected at depths beyond 5 cm
suggests that biosolids-borne TCS did not move beyond the depth of biosolids
incorporation (0-2.5 cm) except for a little 14C in the 2.5 to 5 cm depth.
Recoveries in the controls were 77 to 82% in the 0 to 1 cm depth and from 17 to
22% in the soils in 1 to 2 cm depth (Table 8-2). As the initial TCS spiking occurred at the
surface of the soil column, significant 14C detected at 1 to 2 cm depth suggest some
TCS movement. Absence of biosolids in the controls likely allowed some movement
with irrigation water, but TCS did not move beyond 2 cm. Triclosan experienced greater
sorption in biosolids amended soils than in the un-amended soils (Agyin-Birikorang et
al., 2009). Lower sorptive capacity of an un-amended soil suggests a greater movement
with soil solution. Cha and Cupples (2010) predicted the leaching of TCS spiked (0.05-2
mg kg-1) in biosolids and amended to sandy and loam soils, using biodegradation and
sorption data in a simple leaching model. Predictions for both soils are similar to our
results, suggesting insignificant TCS leaching in the presence of biosolids.
In contrast, Lapen et al. (2008) reported leaching of TCS into tile drains
(concentration of 3.68 µg L-1) located 80 cm below the soil surface following a liquid
biosolids application. Liquid biosolids (11.9 g solids L-1 biosolids) have greater (relative)
amounts of TCS aqueous phase and could be expected to promote greater TCS

173
mobility. Triclosan in the aqueous phase may move by gravity-based flow through large
pores and worm borrows (preferential flow) (Turpin et al., 2007), and may intersect the
shallow tile drains. Further, movement by facilitated flow may occur when TCS
associates with dissolved organic carbon (DOC). Edwards et al. (2008) conducted a
similar leaching study in soils amended with dried biosolids, and found detetable TCS
concentrations (0.24 µg L-1) in tile drains, but the concentrations were much lower than
in the Lapen et al. (2008) study. Leaching occuring with dried biosolids application was
due to the pH (7.5) of the biosolids that was sufficiently close to the pka (~8) to favor
greater TCS concentrations in aqueous phase. Similarly, Xia et al. (2010) reported TCS
leaching to a depth of 30 to 120 cm in soils annually amended with biosolids for 33
years. Soil was calcareous mine spoil (pH = 7.8) and the high pH likely increased TCS
solubility making it more susceptible to movement. A column study was conducted with
biosolids-borne TCC leached with 0.5 PV at each leaching event resulting in ~4PV of
leachate at the study termination. The amount of water (PV) was similar to our study
and a leaching of <1% was observed in a 3.5 month leaching study conducted in 17 cm
long columns (Snyder, 2009). The study utilized biosolids with varying OC contents. The
authors opined that partitioning coefficient (Kd) influenced the leaching; as a smaller Kd
portends a greater readily leachable (aqueous) fraction and a greater mobility. Gibson
et al. (2010) measured the leaching of TCS (84-1032 ng L-1) applied with irrigation water
to 30 cm long soil columns for 90 days. No TCS was detected in the column leachate;
and soil sectioning confirmed minimal leaching beyond the 10 cm soil depth. Greater
leaching of TCS in the Gibson et al. (2010) study than our study was likely due to
greater TCS concentration in the aqueous phase. The study thus reemphasizes that the

174
relative TCS movement would be greater when TCS is present in the aqueous form as
opposed to TCS occurring bound to biosolids OC.
14C Recoveries by Extraction and Extract Speciation
Extraction was performed on soil samples taken from the zone of biosolids
incorporation (0-2.5 cm), as the combustion data (Table 8-2) indicated that the majority
of 14C added was present at this depth. The average recoveries of 14C in amended
treatments for both irrigation treatments (85-86%) (Table 8-3) were less than the
recoveries obtained through combustion (93-97%) (Table 8-2). Extraction recoveries
were expected to be smaller than recoveries through combustion, as the combustion
procedure measures total (i.e. TCS associated with labile and non-extractable fractions)
concentrations. The recoveries in the controls were 96 to 98% in the both irrigation
treatments (Table 8-3), similar to combustion procedure recoveries. Data suggest that
biosolids application reduces the extractable 14C recoveries.
There are no published reports of the leaching or runoff potential of Me-TCS.
Because >95% of 14C was recovered in the 0-2.5 cm depth; these samples were
subjected to RAD-TLC analysis to determine 14C speciation. The data (Table 8-4)
suggest degradation of TCS and appearance of a metabolite (Me-TCS). Appearance of
Me-TCS was similar to our previous observations (Chapter 4). In the biosolids-amended
treatments, the average 14C identified as TCS was 51 to 62%, and the average 14C
identified as Me-TCS was 37 to 48%, irrespective of the irrigation treatment. The TCS
recoveries were generally greater in the empirical than the stochastic irrigation regime.
The corresponding Me-TCS recoveries were greater in the stochastic treatments. In the
controls, 58 to 62% of 14C was identified as TCS and 38 to 42% as Me-TCS. The TCS
and Me-TCS recoveries were variable among the treatments; but the recoveries were

175
not significantly different suggesting no effect of irrigation or biosolids treatments on
TCS speciation/degradation.
In biosolids treatments, >95% of 14C remained in the zone of biosolids
incorporation (0-2.5 cm). Extraction and speciation data from that depth suggest that
Me-TCS was formed but remained in the top depth segment, suggesting minimal
movement in amended soils. In controls, appearance of TCS and Me-TCS beyond the
initial surface spiking of TCS suggest that either TCS leached to the lower depth and
degraded to Me-TCS or Me-TCS appeared in the top depth and subsequently leached
to the lower depth. The first mechanism is more probable as the reported log Kow (5) of
Me-TCS is greater than the log Kow (4.8) of TCS and, therefore, Me-TCS movement is
likely more retarded than TCS. Thus, Me-TCS mobility/leaching would be equal or
smaller than to the mobility of TCS, and rate of TCS infiltration is sufficiently slow to
allow degradation.
The speciation data allowed the estimation of time for 50% disappearance of
TCS. Data suggest that ~40% of Me-TCS (Table 8-4) was detected after 60 days which
suggests a 50% disappearance time of ~75 days. The disappearance time calculated
herein is within the range measured in our incubation study (Chapter 4), and other
published studies of TCS half-lives (Lozano et al., 2010; Kwon et al., 2010; Wu et al.,
2009).
Comparison with CMLS Model
The Chemical Movement in Layered Soils (CMLS) is a model that can be utilized
to estimate the chemical movement in response to movement of water as well as
chemical degradation. The CMLS has the ability to provide leaching estimates varying
with weather and spatial variability of soils and uncertainties in chemical properties.

176
The model estimates the depth of center of mass of a chemical (non-polar) with
time and assumes that a chemical only moves in the liquid phase in response to soil-
water environment. Water that is already in the profile is pushed by the inflowing water
(piston flow) and water is also lost from the root zone by evapotranspiration and deep
percolation. Chemical movement is assumed to be retarded due to reversible sorption
on the soil solids. The model makes several simplifying and conservative assumptions,
including: complete first order degradation (metabolites not considered), uniform soil
and chemical properties within a soil layer, and linear and reversible chemical sorption.
Preferential flow is not considered. The model estimates the location of the center of
chemical mass rather than chemical concentration profile.
The simplifying assumptions are not true for TCS movement in biosolids-
amended soil, as our study (Chapter 4) suggested that TCS degradation followed zero-
order kinetics, the formation of a metabolite, and strongly hysteretic desorption (Agyin-
Birikorang et al., 2010). Thus, CMLS serves as only a first approximation of biosolids-
borne TCS movement. Figure 8-3 present CMLS model simulation of the movement of
a model-default chemical [Dimethyl Tetrachloroterephthalate (DCPA)] with Kd (log Kd =
3.7) and half-life (100 days) values similar to TCS. Simulations suggest that a chemical
with such characteristics applied to a sand soil (with low organic carbon content), under
the rainfall conditions similar to the average annual rainfall in Gainesville requires many
years to move completely through a soil column of 20 cm. After 1 year of rainfall, the
chemical is predicted to remain in the top 2 cm of the soil profile. Our column study
results were similar to the CMLS model prediction as we observed a TCS movement to
2.5 cm in ~2 months (60 days). Our data are also consistent with the recent modeling

177
results by Cha and Cupples (2010). As the CMLS modeling approach is relatively
simple, future work should include simulations utilizing more sophisticated models that
consider irereversible and non-equilibrium chemical sorption and the fate and transport
of the metabolite as well.
Implications of TCS Movement
Leaching of TCS depends on the equilibrium between TCS in the soil solution and
sorbed phase. As expected, the leaching was slower in a biosolids-amended soil than a
soil without biosolids, as TCS associates with the OC of the biosolids causing
retardation to movement. Similar to TCS, Me-TCS formed in the control and amended
soil remained in the top depth (0-2.5 cm). Mobility of contaminants in a soil can be
assessed using the relative mobility factor (RMF) (USEPA, 2008a). The RMF is defined
as the ratio of leaching distance of test substance (i.e. TCS or Me-TCS) to the leaching
distance of the reference substance (i.e. chloride). The chemical is defined as immobile
if the RMF is ≤0.15 (USEPA, 2008). Triclosan and Me-TCS moved to a maximum depth
of 2.5 cm and the reference chemical moved up to 20 cm depth. The calculated RMF is
0.125, and both TCS and Me-TCS would be regarded as immobile in an un-amended
and a biosolids-amended soil in 2 months of leaching period.
Our column leaching study represents a scenario where biosolids-borne TCS was
amended to a sand soil of low OC content and subjected to extensive (4PV) leaching.
Mobility of TCS depends on the partitioning coefficient (Kd). The Kd in a sandy soil is
5.88× smaller than the Kd in a silty loam soil (Agyin-Birikorang et al., 2010) meaning that
a greater fraction of TCS would be available for leaching in a sandy soil as compared to
a loam or clay soil. Gibson et al. (2010) observed a variable leaching potential of
pharmaceuticals due to difference in Kd values. Thus, the leaching of TCS is expected

178
to be even less under common field conditions characterized by soils with greater
organic carbon contents and vegetative cover.
Previous studies found TCS concentrations (0.24-3.68 µg L-1) in tile drains in soils
amended with liquid and dried biosolids (Edwards et al., 2008; Lapen et al., 2008). It
may be noted that the tile drain TCS concentrations would be diluted upon interception
with the surface water and further reduce TCS concentrations. Implications of TCS
concentrations to aquatic organisms are critical. Langdon et al. (2010) quantified the
risk of biosolids-borne TCS to aquatic organisms from surface runoff and leaching and
suggested that maximum concentration of TCS reported in the leaching and runoff
water did not adversely affect the aquatic ecosystem. Mobility data obtained herein and
other data available in the literature are utilized in our risk discussion (Chapter 9).

179
Table 8-1. Amount and schedule of leaching events for the empirical and stochastic irrigation regimes.
Empirical irrigation regimes Stochastic irrigation regimes Day Amount (mL) Day Amount (mL)
5 79 5 50 12 78 11 30 19 78 15 70 26 78 17 75 33 78 26 70 40 78 31 90 47 78 41 80 54 78 46 65 61 78 55 60 68 78 67 90 75 78 73 80 82 78 79 60 86 65
Total 936 Total 885
Table 8-2. Average percent recoveries ± standard deviation of 14C (by combustion procedure) by depth in the control and biosolids treatment for each irrigation regime.
Depth (cm)
14C Recovery (%) Empirical Stochastic
Treatment Treatment
0-2.5 97.8±0.83 93.7±2.05
2.5-5 2.08±0.84 6.17±2.04
5-20 0.01±0.00 0.01±0.00
Control Control
0-1 77.4±3.31 82.5±3.70
1-2 22.4±3.20 17.4±3.70
2-2.5 0.06±0.00 0.01±0.00 2.5-20 0.00±0.00 0.00±0.00

180
Table 8-3. Average percent extraction recoveries of 14C ± standard deviation in the top depth of the control and biosolids treatment for each irrigation regime.
Depth (cm)
14C Recovery (%) Empirical Stochastic
Treatment Treatment
0-2.5 85.1±10 86.4±10
Control Control
0-2.5 96.2±10 97.9±8.1
Table 8-4. Speciation of 14C extracted ± standard deviation in the top depth of control
and biosolids treatments for each irrigation regime (same letters represent no significant difference among treatments).
Depth (cm) TCS (%) Me-TCS (%)
Empirical treatment 0-2.5 62.5 ± 0.7a 37.5 ± 0.7b
Stochastic treatment 0-2.5 51.9 ± 5.3a 48.1 ± 5.3b
Empirical control
0-2.5 62 ± 2.5a 37.7 ± 2.5b
Stochastic control
0-2.5 58 ± 2.6a 42 ± 2.6b

181
Figure 8-1. Percent recovery of the amount of water that was collected at bottom of the
column at various intervals during the study period in the (a) empirical and (b) stochastic irrigation regimes.
0
20
40
60
80
100
0 10 20 30 40 50 60
Le
acha
te r
eco
ve
ry (
%)
Time (days)
a. Empirical
Control
Treatment
0
20
40
60
80
100
0 10 20 30 40 50 60
Le
acha
te r
eco
ve
ry (
%)
Time (days)
b. Stochastic
Control
Treatment

182
Figure 8-2. Chloride breakthrough curves in control and biosolids-amended soils of the
(a) empirical and (b) stochastic irrigation regimes.
0
0.2
0.4
0.6
0.8
1
0 1 2 3 4 5 6
Rela
tive c
oncentr
ation (
C/C
0)
Pore volume
a. Empirical
Control
Treatment
0
0.2
0.4
0.6
0.8
1
0 1 2 3 4 5 6
Rela
tive c
oncentr
ation (
C/C
0)
Pore volume
b. Stochastic
Control
Treatment
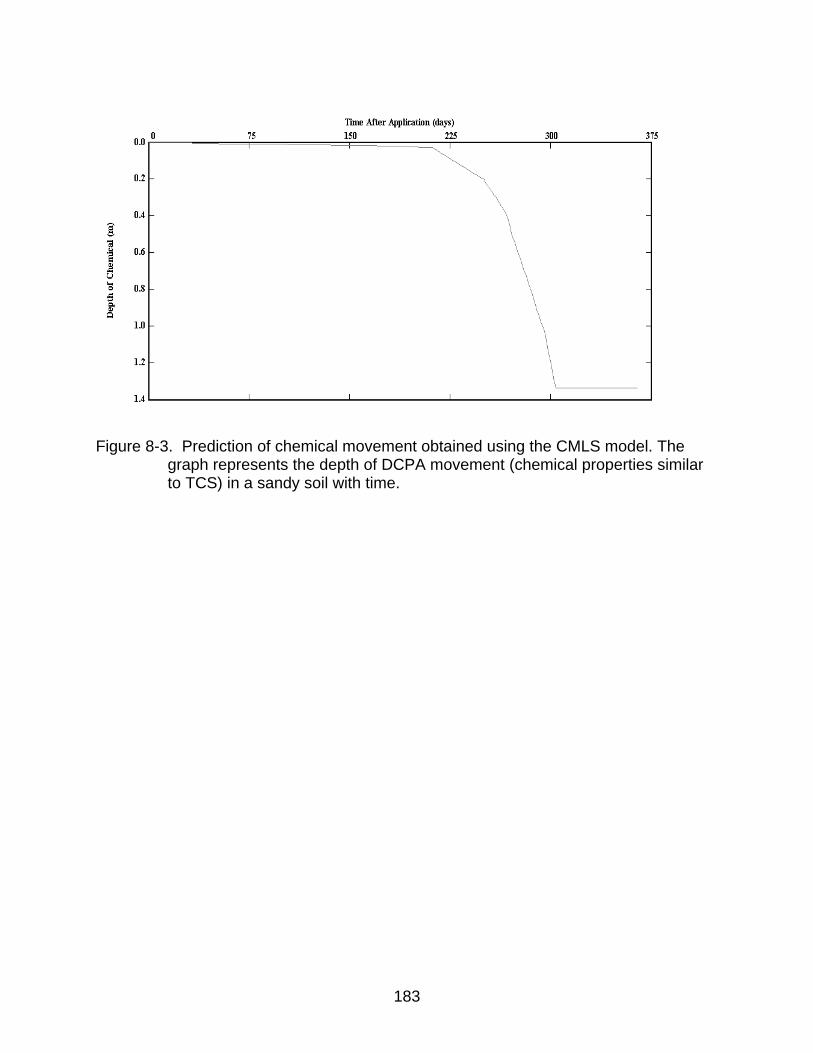
183
Figure 8-3. Prediction of chemical movement obtained using the CMLS model. The
graph represents the depth of DCPA movement (chemical properties similar to TCS) in a sandy soil with time.

184
CHAPTER 9 RISK ASSESSMENT OF BIOSOLIDS-BORNE TCS
Background
Risk assessment is a process of assigning magnitudes and probabilities to the
adverse effects of human activities. The process involves identifying a hazard, and
quantifying the relationship between event and its effect (Suter, 2000). Screening level
risk assessments are often conducted initially by assuming worst-case scenarios to
narrow the scope of subsequent assessments. Specific pathways in which the
screening-level assessments are above critical limits are selected for more detailed risk
evaluations (Suter, 2007).
Human health risk assessments are sometimes considered as alternatives to
ecological assessments. The notion is that protection of humans (typically, the most
sensitive receptors) will automatically protect non-human species. However, non-human
receptors are possibly exposed to greater chemical concentrations, or are more
sensitive than humans. Thus, rather than conducting independent assessments,
ecological and human risk (combined) assessments should complement each other
(Suter, 2007) and be more protective overall.
Several ecological risk assessments were conducted recently (Reiss et al., 2009;
Fuchsman et al., 2010; Langdon et al., 2010) to address the risk of biosolids-borne
triclosan (TCS). Fuchsman et al. (2010) estimated the exposure to terrestrial organisms
(soil microbes, plants, mammals, birds) using a probabilistic fugacity-based model.
Triclosan concentrations in various organisms and their exposures were estimated
assuming either equilibrium or steady state conditions. Toxicity values from the
literature were utilized to establish effect concentrations and to identify sensitive species

185
Results suggested no adverse effects of biosolids-borne TCS (except for nitrogen
cycling disruption) under even worst-case scenarios (considering the most sensitive
toxicity endpoint), and the effects were transient. The study addressed ecological risks
utilizing simple fugacity models and a probabilistic approach, but did not consider TCS
degradation. Further, corresponding data for validation of the probabilistic model are
lacking (MacKay and Barthouse, 2010).
A screening-level assessment (Langdon et al., 2010) quantified the risk of
surface runoff and leaching of biosolids-borne TCS to aquatic organisms using the
hazard quotient (HQ) approach. Runoff concentrations were predicted using literature
values for biosolids TCS concentrations and modeled TCS physico-chemical properties
(Kow, Koc, Kd). The assessment identified some risk (HQ>1) to the most sensitive aquatic
species (green algae) in a worst-case scenario using the greatest predicted runoff
concentrations. Additional assessment that protected 95% of the study population
resulted in lower risk, but HQ values remained >1. Langdon et al. (2010) opined that
hydrophobic chemicals like TCS are expected to have low aqueous phase
concentrations due to higher partitioning coefficients than used in their study and to
hysteretic sorption-desorption behavior. Consistently, Agyin-Birikorang et al. (2010)
reported strong hysteretic desorption behavior of TCS, incomplete desorption, and
lower aqueous phase TCS concentrations than expected.
Reiss et al. (2009) followed the European Union System for the Evaluation of
Substances (EUSES) model and supplemented his approach with United States
regulatory guidance. The margin of safety (MOS) concept was utilized to assess the risk
of biosolids-borne TCS (5 and 15 mg TCS kg-1 biosolids). Soil TCS concentrations were

186
estimated from agronomic biosolids applications (5-10 Mg ha-1) to assess risks to
earthworms, soil organisms and plants. Estimated TCS concentrations in earthworm
tissues were utilized to assess risk to earthworm and fish-eating birds and mammals.
The authors suggested no significant risk (MOS>>100) to the species from the TCS
concentrations typically found in soils, even after applying the biosolids annually for 10
years.
Most of the data (half-lives, Kd, microbial and plant toxicity, earthworm
accumulation) utilized in the Reiss et al. (2009) and Fushman et al. (2010) assessments
were either derived from models or were measurements extracted from unpublished
sources. Reiss et al. (2009) considered a relatively short half-life (35d) for TCS in
amended soils and Fushman et al. (2010) did not consider TCS degradation. Thus, a
characterization of biosolids-borne TCS behavior, and a risk assessment based on
measured data is expected to be more accurate. Our approach for the preliminary risk
estimation was similar to Reiss et al. (2009). We began by identifying the relevant
exposure pathways from the list of pathways used in the Part 503 Biosolids Rule
(USEPA, 1994). We then chose the most relevant measured parameters for the
assessment (half-life, LC50, NOAEL, Koc etc.), and calculated hazard indices (HI) for
each pathway. Hazard indices are the ratio of exposure concentration of a species to
the corresponding species endpoint. Pathways in which HI values exceeded one were
identified and subsequently subjected to detailed evaluation. Our risk estimation utilized
measured data generated herein to build on the previous assessments, and extended
the risk evaluation to humans. Thus, our results provide a more comprehensive
evaluation of risk of biosolids-borne TCS than previously published evaluations.
187
Pathways of Exposure
The biosolids-borne TCS risk assessment included 14 exposure pathways
utilized in the risk assessment supporting the Part 503 Biosolids Rule (Table 9-1).
Similar to the recent triclocarban (TCC) risk assessment (Snyder, 2009), additional
pathways were identified to incorporate terrestrial animal exposure to contaminated fish
(pathway 15), and aquatic organism exposure to contaminated surface water (pathway
16). The receptor for each pathway was a highly exposed individual (HEI), the individual
from a population that has the greatest realistic exposure. The HEI differs from a most
exposed individual (MEI) sometimes used in risk assessment, who has unrealistic
exposures and does not actually exist (Epstein, 2003).
Exclusion of Exposure Pathways
Risk to Humans
Previous assessments examined the human risk to TCS exposure through the
use of personal care products containing TCS (NICNAS, 2009) or through drinking
water contaminated with TCS (USEPA, 2008b). NICNAS (2009) utilized the margins of
exposure (MOE) concept; the MOE is similar to the HI approach of USEPA for
characterizing occupational and domestic risk of chemicals to humans. The MOE is a
measure of the likelihood that a particular adverse health effect occurs in an organism
after an exposure as compared to an unexposed organism. The greater the MOE, the
smaller is the potential of an adverse effect or risk. If MOE >100, an adverse affect is
not expected. The exposure pathways in the assessment included inhalation and
dermal exposure through TCS containing household products (NICNAS, 2009). Results
suggested that even repeat dosages over long-periods of time (~2 year) posed no risk
to humans, as all the MOEs were >100. Risks to children (assumed to be the most

188
sensitive population) through exposure to TCS in toy paints and breast milk were also
calculated. The MOEs for all the exposure pathways for children were >100 and there
was minimal expected risk from inhalation and dermal exposure to TCS from the use of
personal care products (NICNAS, 2009).
The USEPA conducted a screening assessment of TCS human risk through
consumption of TCS-containing drinking water as a part of the Reregistration Eligibility
Decision (RED) for TCS (USEPA, 2008b). The assessment utilized TCS concentrations
of 56 ng L-1 in drinking water found in southern California (Loraine and Pettigrove,
2006). Assuming a water intake rate of 2 L, the calculated TCS intake rate is 1.4 ng kg-
1d-1 for a 70 kg adult. The USEPA suggested a TCS reference dose (RfD) of 300,000 ng
kg-1 d-1 (McMahon, 1998), which was same for the acute and chronic dietary end-points.
The TCS intake rate (1.4 ng kg-1d-1) was many fold smaller than the RfD (300,000 ng kg-
1d-1) and the exposure concentration never reached the RfD. Hazard was deemed
negligible even after a 100 year exposure. Further, TCS degrades in aquatic
environments (Canosa et al., 2005), so the actual exposure concentration would be
even smaller. As the screening assessment of TCS from drinking water did not suggest
a risk, a quantitative risk estimation was not conducted by USEPA. More recently,
Benotti et al. (2009) reported TCS concentrations in source water and finished drinking
water derived from streams impacted by wastewater effluent. The maximum (6.4 ng L-1)
and mean (3 ng L-1) TCS concentrations were nearly 10 fold smaller than the California
concentrations used for the USEPA risk estimation above. Thus, estimated risks using
these concentrations would be even smaller. Realistic TCS concentrations in drinking
water will not represent a risk to humans even over long-term (100 year) exposure.

189
Risk to Aquatic Organisms
Several aquatic risk assessments for TCS have been conducted (Lyndall et al.,
2010; Langdon et al., 2010; Brausch et al., 2010). Abundant TCS toxicity data are
available for aquatic organisms like fishes, amphibians, algae and vascular plants
(Tables 9-2 and 9-3), and include values from both acute and chronic toxicity studies.
Algae and invertebrates are generally more sensitive to TCS exposure than fish and
vascular plants. Brausch et al. (2010) attributed algal sensitivity to the disruption of lipid
biosynthesis through fab 1 (fatty acid synthesis). McMurry et al. (1998) and Lu and
Archer (2005) identified TCS toxicity to FASII (enoyl acyl carrier protein reductase)
pathways. Lyrge et al. (2003) and Franz et al. (2008) identified membrane
destabilization and Newton et al. (2005) identified uncoupling of phosphorylation.
Langdon et al. (2010) focused on the risk assessment of pharmaceuticals and
personal care products entering the aquatic environment through land applied biosolids
using the HQ approach. Land application allows TCS transfer to soils and a potential for
TCS migration to surface waters through leaching or runoff. Estimated runoff water TCS
concentration predicted using an equilibrium partitioning (reversible desorption)
approach was 4.5 µg L-1. Predicted environmental concentrations were compared with
the aquatic toxicity end-points to determine possible adverse effects. Conservative
assumptions included using the greatest runoff TCS concentrations, and toxicity end-
points for the most sensitive aquatic species. A preliminary assessment, utilizing
conservative parameters, suggested some hazard of TCS (HQ>1) and warranted
detailed assessment. Consistently, a preliminary assessment by Braush and Rand
(2010) also suggested some risk of TCS to aquatic species (HQ>1), but the authors
acknowledged that the estimated risk was for a worst-case scenario. Detailed

190
investigation by Langdon et al. (2010) included more realistic aquatic toxicity and runoff
concentrations to protect 95% of the aquatic species. The HQ was still >1 implying that
a runoff TCS concentration (0.59 µg L-1), predicted to protect 95% of the population,
posed some threat to the most sensitive species. However, the runoff TCS
concentration (0.59 µg L-1) used exceeded the range of TCS concentrations (0.025-0.10
µg L-1) previously reported in runoff water and tile drainage from field application of cake
biosolids (Topp et al., 2008; Sabourin et al., 2009; Edwards et al., 2009). Tile drain TCS
concentrations of 3.68 g µL-1 were measured following liquid biosolids application, but
may represent unique conditions. Application of liquid biosolids portends greater TCS
aqueous phase concentrations as the fluidity of liquid biosolids is similar to water.
Langdon et al. (2010) utilized an estimated log Koc of 3.97 that was smaller than the
measured value of 4.26 (Agyin-Birikorang et al., 2010), and hysteretic adsorption was
not considered (Agyin-Birikorang et al., 2010). Additionally, Langdon et al. (2010)
ignored degradation or dilution of TCS despite previous evidence of significant
degradation of TCS in biosolids-amended soil over time (Lozano et al., 2010; Kwon et
al., 2010; Wu et al., 2009). Thus, the risk predicted by Langdon et al. (2010) study was
conservative and the actual risk to the aquatic organisms is likely less.
Lyndall et al. (2010) evaluated TCS risk to aquatic (algae, bacteria, and
invertebrates), sediment-dwelling organisms, and aquatic-feeding wildlife from WWTP
effluent entering the surface waters. Triclosan concentrations in surface water were
either obtained from literature or predicted from a fugacity based model assuming
steady state conditions. Wild life exposures were calculated using standard wildlife
dietary exposure equations (USEPA, 1993c). Toxicty to aquatic organisms was

191
evaluated based on a species sensitivity distribution (SSD) approach, which
Capedevielle et al. (2008) used to assess TCS risk in freshwater environments. The
SSD consisted of a toxicity distribution based on chronic toxicity data for several
species, and is regarded as more realistic than NOEC toxicity values based on the most
sensitive species. The estimated 95th percentile TCS concentrations in surface waters,
sediments, and biota tissues were well below the 5th percentile of the respective species
sensitivity distributions, suggesting no adverse effect of TCS exposure. Triclosan risk
assessments in aquatic species (Langdon et al., 2010, Lyndall et al., 2010) consistently
conclude that TCS risk to aquatic organisms is unlikely. Thus, we did not perform an
independent assessment on aquatic species in our study.
The risk estimations conducted for humans (USEPA, 2008b; NICNAS, 2009) and
aquatic organisms (Langdon et al., 2010; Lyndall et al., 2010) suggested limited TCS
risk. Thus, the aquatic and human exposure pathways initially included for our risk
assessment can be excluded. The pathways were excluded when detailed studies were
either previously conducted (aquatic organisms) or there was minimal predicted risk
through particular pathways (human). The six pathways that were excluded include-
Biosolidssoilairborne dusthuman
Biosolidssoilairhuman
Biosolidssoilgroundwaterhuman
Biosolidssoilsurface waterhuman
Biosolids soil surface water animal
Biosolidssoilsurface wateraquatic organism
The remaining pathways considered in the risk evaluation are presented in Table 9-4.
Further, the ingestion exposure of a non-gardener human is considered similar to the
home gardener and represents the worst-case scenario for the exposure. Pathways 1
and 2 (Table 9-1) were grouped together and considered in pathway 3 (Table 9-4).

192
Reference Dose Calculation
The USEPA (1993c) defines the human reference dose (RfD) as an estimate of
―a daily exposure to the human population (including sensitive subgroups) that is likely
to be without an appreciable risk of deleterious effects during a lifetime‖. The RfD is
typically expressed in units of milligrams per kilogram of bodyweight per day (mg kg-1
bw d-1). Reference doses can be calculated from non-human endpoints as follows:
NOAEL
RfD UF *MF
Where:
UF: uncertainty factors
MF: modifying factor based on professional judgement (default = 1)
NOAEL: no observed adverse effect level
Uncertainty factors for obtaining human RfD for non-cancerous chemicals are
calculated according to the following criteria (USEPA, 1993). Uncertainty factors are
applied when extrapolating toxicity data from:
Animal study data to humans (10a)
Prolonged exposure data to average healthy humans (10b)
Use of a less-than-chronic study exposure (3s to 10s)
Deriving an RfD from a LOAEL rather than a NOAEL (10l)
Modifying factors accounting for scientific uncertainties typically range from 3mf to
10 mf. As discussed earlier, acute toxicity of TCS to humans via oral and dermal routes
is low. Triclosan also did not cause in-vivo genotoxicity, carcinogenicity, reproductive or
developmental toxicity in rodents. Various animal toxicity studies are available (Table 9-
5) that suggest rat and mouse sensitivity to TCS. The majority of the studies were either
derived from unpublished literature or lack sufficient evidence of the credibility. A 13

193
week repeat TCS toxicity study conducted in mice suggested a NOAEL of 25 mg kg-1 d-1
(NICNAS, 2009), and the mice was considered more sensitive to TCS exposure.
However, the adverse effects were peroxisome proliferator type, considered irrelevant
for human risk assessments. So, this end-point (mouse study) was not appropriate for
calculating the RfD for humans.
A chronic study (2 years) tested the sensitivity of rat to mild clinical chemistry and
hematology changes (hypertrophy and hepatocyte vacuolization) in male cells
(NICNAS, 2009). An ingestion NOAEL of 40 mg kg-1 bw d-1 was identified (Table 9-5) in
the study, and was deemed appropriate for our risk calculations. The RfD for humans
was calculated using uncertainty factors for extrapolation of animal to human study
(10a) and prolonged exposure data to average healthy human (10b) as follows:
RfD = (40 mg kg-1 bw d-1) / (10a × 10b) = 0.40 mg kg-1 bw d-1
Similarly, an RfD value for terrestrial animals was calculated from the same rat
study utilizing uncertainty factors specific for ecosystem risk assessment. An uncertainty
factor of 5 is applied if the test species and endpoint species of interest are in the same
class but different order (5a). Differences in species sensitivity, laboratory-field
extrapolation, and intraspecific variability can each be accounted for with uncertainty
factors of two each (2b, 2c, 2d, respectively) (Suter, 2007). The RfD for all terrestrial
animals was calculated as follows:
RfD = (40 mg kg-1 bw d-1) / (5a × 2a × 2b ×2c) = 1 mg kg-1 bw d-1
Predators like American woodcock, herring gull, and short tailed shrew feed on
earthworms, and may consume TCS that has accumulated in the worm bodies. Reiss et
al. (2009) suggested an acute LD50 of 862 mg kg-1 d-1 for avian species. The RfD for

194
predators is estimated by applying appropriate uncertainty factors. An uncertainty factor
of 10 is applied if the toxicity end-point is derived from less than chronic studies (10s), if
endpoint is based on LOAEL (or LD50) rather than NOAEL (10l), and a modifying factor
of 3 to account for scientific uncertainties (3mf).
RfD = (862 mg kg-1 bw d-1) / (10s × 10l× 3 mf) = 2.87 mg kg-1 bw d-1
Parameters for Risk Estimation
Environmental Fate
Although our study (Chapter 4 and 8) and other published studies (Lozano et al.,
2010; Wu et al., 2009; Xu et al., 2009) suggested TCS degradation in biosolids-
amended soils, we assumed no loss of TCS through degradation (worst case scenario)
for the screening level risk estimation.
Effect on Soil Dwelling Organisms
Toxicity to earthworms
The acute toxicity to earthworms was assessed according to OPPTS guidelines
(USEPA, 1996b). Mortality was assessed in a 28 d exposure of earthworms to TCS
spiked in biosolids, and amended to sand (IFS), silty clay loam (ASL) and an artificial
soil (Chapter 5). An unreplicated range-finding test suggested TCS effects on the
earthworm mortality exposed to TCS concentration (≤5 mg kg-1 biosolids) only in the
sand. A replicated definitive test conducted on the sand showed no effects of TCS on
earthworm mortality, and no abnormal symptoms were observed in the live earthworms
up to a TCS concentration of 105 mg kg-1 biosolids (Chapter 5). The estimated 28d LC50
value was >105 mg kg-1 biosolids or >1 mg kg-1 amended sand soil. The estimated 28d
LC50 for ASL and artificial soil was >10,000 mg kg-1 biosolids or >100 mg kg-1 amended

195
soils. For screening level risk assessment, the most sensitive toxicity end-point of 1 mg
kg-1 amended soil was considered.
Bioaccumulation in earthworms
The measured earthworm BAF values were 6.5 ± 0.84 in the IFS soil and 12 ±
3.08 in the ASL soil. The BASL4 model underestimated the bioaccumulation potential of
TCS, with calculated BAF values of 5 ± 0.0 (IFS soil) and 2.2 ± 0.0(ASL soil). The
earthworms collected from field soil (similar in texture to ASL soil) had an average BAF
of 4.3 ± 0.7 (Chapter 5). A conservative estimate of 10 as the earthworm BAF was
utilized to calculate the predicted environmental concentrations in earthworms (Table 9-
6) grown in soils amended with biosolids-borne TCS.
Toxicity and Bioaccmulutaion in Plant Biomass
The average BAF values in a greenhouse study were 0.43 ± 0.38 in radish root,
0.04 ± 0.04 in lettuce, 0.004 ± 0.002 in radish leaves, and the BAF value in bahia grass
was <0.0001. The greatest BAF value (0.93) was obtained in the highest TCS treatment
(10 mg kg-1 amended soil) utilized in our study. The BAF values were also measured in
the field collected samples. The average BAF in field grown soybean grain were 0.06 to
0.16 (Chapter 7). The BASL4 model greatly overestimated the bioaccumulation
potential of TCS in plant tissues. The calculated average BAF values were 6 to 23. A
worst case conservative estimate of 0.93 was used for the screening level risk
estimation.
Avian and Mammalian Toxicity
The risk posed to birds that feed on earthworms was examined using predicted
earthworm concentrations. In a manner similar to Reiss et al. (2009), we selected two
avian species that consume high quantities of earthworms, the American woodcock and

196
the herring gull. The risk posed to mammalian species was also examined in a species
with high earthworm consumption, the short-tailed shrew. As no other reliable data
sources were available, the TCS toxicity data (Table 9-6) for the avian and mammalian
species were obtained from Reiss et al. (2009) and appropriate uncertainty factors were
applied to calculate RfD that applies to all predators.
Screening-Level Assessment
Exposure Concentration Calculation
According to the USEPA Part 503 risk assessment for the biosolids rule (USEPA,
1994), an HI calculation is performed to determine if a particular pollutant/pathway is a
potential problem. The HI is the ratio of the predicted environmental concentration
(PEC) of a chemical to the established terrestrial or human health criteria (values
obtained from toxicity studies). The terrestrial toxicity values are NOAEL, LOAEL, LC50
or LD50, and the human toxicity values are represented by RfDs. A chemical/pathway
with an HI of >1 is considered problematic and requires a tier-2 assessment of hazard
rankings (USEPA, 1995). Reiss et al. (2009) conducted a terrestrial risk assessment
utilizing the European Union‘s rules, and concept of margin of safety. Snyder (2009)
used the USEPA HI approach and conducted an integrated human and environmental
risk assessment of biosolids-borne triclocarban (TCC). We utilized the equations
described in Reiss et al. (2009) and Snyder (2009) for our initial risk estimation.
Triclosan exposures were calculated by multiplying concentrations in relevant
environmental media by the corresponding animal or human intake rates in that media.
Exposure concentrations were calculated using measured or predicted data. Screening
level exposures assumed two biosolids application scenarios: a one time application
rate of 50 Mg ha-1 (―worst case‖ scenario), and an application of 5 Mg ha-1 for 100 years

197
(―100-year‖ scenario). The biosolids application scenarios were similar to the Part 503
Biosolids Rule risk assessment (NRC, 2002). Typical one time biosolids application
rates are 5-10 Mg ha-1 as opposed to 50 Mg ha-1 considered here, and land-application
at a single location is unlikely to occur for 100 consecutive years. The TCS
concentration used was the 95th percentile TCS concentration (62 mg kg-1) from TNSSS
(USEPA, 2009a), using the 95th percentile contaminant concentration was specified in
the Part 503 risk assessment. All other parameters and equations required for the risk
estimation are described in Table 9-6.
Screening-Level Hazard Index Calculation
Hazard indices for each exposure pathway were calculated as the ratio of
exposure concentration to the RfD for the corresponding species endpoint (Table 9-7).
The screening level assessment indicated an HI value of well below one for the majority
of the exposure pathways, under both biosolids application scenarios (worst case and
100-year). The resulting HI values suggest that the HEIs would experience minimal risk
from exposure to biosolids-borne TCS over their life time even when exposed to the 95th
percentile TCS concentration. The critical pathways (pathways 1, 8 and 9) are the only
ones in which the HI value was greater than one, and those were selected for the
second tier assessment.
Tier 2 Assessment
Consideration of TCS Degradation
For the tier-2 assessment, we considered TCS degradation to recalculate the HI
for the pathways that were critical (HI>1) in the screening-level risk assessment. The
time required for 50% disappearance of biosolids-borne TCS estimated from the 14C-
TCS biodegradation study was 77 d for the ASL soil (silty clay loam) and >126 d for the

198
IFS (sand) soil (Chapter 4). The leaching study (Chapter 8) estimated time taken for
50% TCS disappearance in a sandy soil as 75 d. According to the EPA‘s persistence
and bioaccumulation criteria (http://www.Pbt profiler.n et/criteria.asp), a chemical is
termed persistent if the half-life in soil is greater than 60 d. Thus, biosolids-borne TCS is
considered persistent in both soils (USEPA, 1999). For simplicity, we assumed a half-
life of 100 d for risk estimation (Table 9-6). Further, our short-term (18 week) laboratory
incubation study suggested zero order kinetics for TCS disappearance, but other
published studies assumed a first order half-life. Thus, for simplification and
conservatism, we also assumed a first order rate equation, as the zero-order kinetics
result in non-detectable TCS after a year.
Assuming an average half-life of 100 d, the average TCS concentrations in soils (CS)
over time were calculated as follows:
kt
(-kt)] exp[1- * CS CS
(time
) t (time
)0
(9-2)
Where: At t=0, soilsoil
0) (time Rho * DT
BAR * CB CS
(Table 9-6)
k = first order decay rate constant (0.693/t1/2) = 0.693/100 = 0.007 d-1
t = time after biosolids application
Parameters required for the calculation are described in Table 9-6. A comparison
of TCS concentrations estimated using a half-life of 100d, with concentrations assuming
no TCS loss (no degradation) is described in Figure 9-1. The results suggest that,
assuming degradation, ~10% of TCS remains in the soil after 1 year, and the TCS

199
concentration did not change (reached steady state) even when the biosolids containing
TCS are applied for 100 years.
Pathway 1: Biosolidssoilplant (direct phytotoxicity)
Plants grown in amended soils (pathway 1) may experience some risk of TCS
following biosolids application. Biosolids with 95th percentile TCS concentration applied
at worst case application rates (50 Mg ha-1) did not present a risk (HI = 0.159); however,
longer term (100-year) scenario presented a risk (HI = 1.59). The HI in the 100-year
scenario was 10-fold greater than the risk associated with biosolids applied through the
single application (Table 9-7). If the biosolids TCS concentration is adjusted to the mean
concentration from the TNSSS (16 mg TCS kg-1), the HI values for the 100-year
scenario reduces to 0.38, which is well below the critical value of one. Alternatively,
considering a TCS degradation half-life of 100 d, the majority of TCS would disappear in
1 year (Figure 9-1), and the HI for both the worst case and 100-year scenario is less
than one, even when considering the 95th percentile TCS concentration.
Pathway 8: Biosolidssoilsoil organism
An HI of one was exceeded for the acute toxicity to Eisenia Foetida (earthworms)
for the 100-year scenario. The HI values were calculated using a conservative toxicity
end point obtained from our study in sand soil. The end-points in the silty clay loam and
the artificial soils were 10-fold greater, and the HI reduces to 0.16 for the 100-year
scenario in these soils. If we adjust the HI using the more realistic average TCS
concentration from TNSSS (16 mg kg-1), the adjusted HI reduces to 0.04 for the worst-
case and 0.41 for the 100-year scenarios. Further, considering TCS degradation, very
little TCS would be detected at the end of 1 year (Figure 9-1) or 100 years and the
adjusted HI would be much less than one.

200
Pathway 9: Biosolidssoilsoil organismpredator
For the worst case scenario, the HI was less than one for herring gull, but greater
than one for the American woodcock and short- tailed shrew. The 100-year scenario
resulted in HI of 33 for the American woodcock, 14 for the short-tailed shrew and 3.3 for
herring gull (Table 9-7). The different HI values for the predators reflected variable
earthworm diets. The most sensitive species was the American woodcock, whose
earthworm diet was assumed to be 77%. Considering a TCS degradation half-life of
100d, the majority of TCS would disappear in 1 year and the HI for both the worst case
and 100-year scenario would be less than one, even using the 95th percentile biosolids
TCS concentration.
Thus, the adjusted HI values for plants, earthworms and predators were all less
than one when TCS degradation was considered. However, the HI value of greater than
one for various organisms (estimated in the screening risk assessment) under 100-year
scenario suggests that biosolids-borne TCS pollutant limits are needed to guide
sustainable use of long-term biosolids land application practice.
Sources of Uncertainty in Our Risk Estimation
Absence of reliable data on TCS toxicity to predators.
Using the estimated toxicity values for earthworms and plants. The highest concentration values selected in our studies did not cause any adverse effects, and the toxicity end-points were estimated to be greater than the highest concentration tested in each study. So, the actual toxicity to organisms may be much lower (i.e greater toxic end-points).
Exclusion of toxicity and accumulation of major metabolite of TCS i.e. Me-TCS in the risk assessment, as the fate and transport data for Me-TCS is essentially unknown.

201
Calculation of Preliminary Biosolids-Borne TCS Pollutant Limits
The USEPA Part 503 Biosolids Rule (USEPA, 1995) includes pollutant limits to
ensure the sustainable land application of biosolids. The various pollutant limits include:
Cumulative pollutant loading rates (CPLRs), Annual pollutant loading rates, Ceiling
concentration limits, and Pollutant concentration limits. The pollutant limits were
calculated herein based on the most sensitive pathway that had an HI of greater than
one (following the USEPA‘s risk estimation)
Cumulative pollutant loading rates (CPLRs)
A CPLR is the maximum pollutant load (kg ha-1) that can be applied to a soil
through biosolids application. When the pollutant load reaches CPLR at a site, biosolids
application does not have to cease, but only biosolids that meets the pollutant
concentration limits can be applied thereafter. The CPLRs for TCS were obtained from
the risk assessment results and represent the maximum cumulative TCS load in
amended soil that remains protective of human and ecological health. The CPLR can be
calculated by setting the HI for a relevant exposure pathway to one and back calculating
the TCS concentration in the amended soil.
Our screening level assessment suggested that American woodcock under the
―100-year‖ scenario is most sensitive of all the species (greatest HI) and thus the CPLR
should be protective of the bird. The CPLR is the concentration in soils calculated by
setting the HI equation (pathway 9) equal to one as follows:
HI = 1= (FI * WD* CS * BAFworm / BW) / RfD
Where:
FI = food ingestion rate (g d-1 d.w.)
WD = Worm diet (%)

202
CS = Soil concentration (mg TCS amended soil-1)
BAFworm = Bioaccumulation factor in the worm
BW = Body wt. (g)
RfD = Reference dose
The calculated CPLR for the American woodcock is 5.8 kg ha-1 (equivalent to 2.9
mg TCS kg-1 amended soil). The CPLR is thus the amount of TCS that can be land
applied without expectation of adverse effects. The calculated CPLR translates to one
time application of biosolids containing TNSSS 95th percentile TCS concentration (62
mg kg-1 TCS kg-1) at a rate of 93 Mg ha-1.
Annual pollutant loading rate (APLR)
The APLR is the maximum amount of pollutant that can be annually applied from
biosolids or given away in a bag or container for land application (USEPA, 1995).
Estimation is based on a conservative estimate of a 20-year of site life of lawns and
home gardens. The APLR for TCS is calculated by dividing the CPLR by 20, assuming
20 years of land application and no TCS loss. The resulting APLR (0.29 kg TCS ha-1 y-1)
is protective of HEI present in the amended soils.
Ceiling concentration limit
Ceiling concentration limits are the maximum pollutant concentrations allowable in
land applied biosolids. The limits were set to prevent the use of low quality biosolids
containing extremely high pollutant concentrations. A ceiling concentration limit is the
less stringent of the 99th percentile TCS concentration in biosolids and pollutant limit
calculated from risk assessment. The 99th percentile TCS concentration from the
TNSSS (USEPA, 2009a) was 197 mg kg-1 biosolids. Alternatively, the ceiling
concentration was calculated from the CPLR value obtained in the amended soils. The

203
resulting ceiling concentration was 127 mg TCS kg-1 biosolids for the worst-case
scenario and 12.7 mg TCS kg-1 biosolids for the 100-year scenario.
Pollutant concentration limit
Pollutant concentration limits are the most stringent concentration limits for
pollutant land applied in biosolids. Biosolids that meet the pollutant concentration limits
have few regulatory requirements for land application. The pollutant concentration limit
assumes a total biosolids load of 1000 Mg over 100 years or less, and is calculated by
dividing the CPLR by 100 years of application at 10 Mg ha-1 year-1. The resulting risk
based TCS concentration limit based on the most sensitive organism (predator,
pathway 9) for is 6.3 mg TCS kg-1 biosolids. The concentration is much lower than the
representative TCS concentration (10-20 mg kg-1) in the biosolids across U.S. (Chapter
2), and mean concentration (16 mg kg-1) reported in the TNSSS (USEPA, 2009a), but
similar to the TCS concentration of CHCC biosolids (5 mg kg-1) utilized in our study.
We accept our overall hypothesis of minimal risk of biosolids-borne TCS to human
and environmental health. Thus, biosolids containing a 95th percentile TCS
concentration (62 mg kg-1) applied at agronomic rates (5 Mg ha-1) for multiple years (up
to 100 years) did not adversely affect the majority of the organisms (according to tier-2
assessment) included in the exposure pathways described herein.

204
Table 9-1. Human and ecological exposure pathways for land-applied biosolids (US EPA, 1995).
Pathway
Description of HEI
1. Biosolidssoilplanthuman Human (except for home gardener) lifetime ingestion of plants grown in biosolids-amended soil
2. Biosolidssoilplanthuman Human (home gardener) lifetime ingestion of plants grown in biosolids-amended soil
3. Biosolidssoilhuman Human (child) ingesting biosolids
4. Biosolidssoilplantanimalhuman Human lifetime ingestion of animal products (animals raised on forage all of which is grown on biosolids-amended soil)
5. Biosolidssoilanimalhuman Human lifetime ingestion of animal products (animals ingest biosolids directly)
6. Biosolidssoilplantanimal Animal lifetime ingestion of plants grown on biosolids-amended soil
7. Biosolidssoilanimal Animal lifetime ingestion of biosolids
8. Biosolidssoilplant Plant toxicity due to uptake of biosolids-borne TCS when grown in biosolids-amended soils
9. Biosolidssoilsoil organism Soil organism (e.g earthworms, microbes) ingesting biosolids/soil mixture
10. Biosolidssoilsoil organismpredator Predator of soil organisms that exist in biosolids-amended soils
11. Biosolidssoilairborne dusthuman Adult human lifetime inhalation of particles (dust)

205
Table 9-1. Continued
Pathway Description of HEI
12. Biosolidssoilsurface waterhuman Human lifetime drinking surface water and ingesting fish containing TCS from biosolids
13. Biosolidssoilairhuman Adult human lifetime inhalation of volatilized TCS from biosolids-amended soil
14. Biosolidssoilgroundwaterhuman
Human lifetime drinking well water containing TCS from biosolids that leached from soil to ground water
15. Biosolidssoilsurface wateranimal Animal lifetime drinking surface water and ingesting fish containing TCS from biosolids
16. Biosolidssoilsurface wateraquatic organism
Aquatic organism exposed to runoff water containing TCS from biosolids

206
Table 9-2. Acute aquatic toxicity endpoints of TCS from published studies.
Species Trophic group End point Result
(LC50,mg L-1) Source
D.magna Invert. 48 h 0.39 Orvos et al. (2002)
Ceriodaphnia dubia Invert. 24, 48 h (pH= 7) 0.2 Orvos et al. (2002)
Pimephales promelas Fish 24,48, 72, 96 h 0.36, 0.27, 0.27, 0.26
Orvos et al. (2002)
Lepomis macrochirus Fish 24, 48, 96 h 0.44, 0.41, 0.37 Orvos et al. (2002)
Oryzias latipes Fish 96 h 0.602 (larvae) 0.399 (embryos)
Ishibashi et al. (2004)
Xenopus laevis Amphibian 96 h 0.259 Palenske et al. (2010) Acris blanchardii Amphibian 96 h 0.367 Palenske et al. (2010) Bufo woodhousii Amphibian 96 h 0.152 Palenske et al. (2010)
Rana sphenocephala Amphibian 96 h 0.562 Palenske et al. (2010)
Pseudokirch-niriella subcapitata
Algae 72 h growth 0.53 µg L-1 Yang et al. (2008)

207
Table 9-3. Chronic aquatic toxicity endpoints of TCS from published studies.
Species Trophic group End point Result
(LC50,mg L-1) Source
D. magna Invert. 21d survival, reproduction 200 (NOEC) 200 (LOEC)
Kopperman et al. (1974)
C. dubia Invert. 7 d survival, reproduction 50 6
Kopperman et al. (1974)
C. dubia Invert. 7 d survival, reproduction IC 25=170 Carlson and Caple (1977)
Chironomus riparius Invert. 28 d survival, emergence 440 Schultz and Riggin (1985)
Chironomus tentans Invert. 10 d survival, growth LC25= 100 Schultz and Riggin (1985)
Hyalella Azteca Fish 10 d survival, growth LC25=60 Schultz and Riggin (1985)
O. mykiss Fish 96 d Hatching, survival 71 3
Kopperman et al.(1974)
O. latipes Fish 14 d hatchability IC25=290 Carlson and Caple (1977)
Gambusia affinis Fish 35 d sperm count 101.3 Orvos et al. (2002)
Danio rerio Amphibian 9 d hatchability IC25=160 Carlson and Caple (1977)
Xenopus laevis Amphibian 21 d metamorphosis No effect Ishibashi et al.(2004)
Rana catesneiana Amphibian 18 d development 300
Palenske et al.(2010)
Rana pipiens Amphibian 24 d survival, growth 230 2.3
Yang et al.(2008)

208
Table 9-3. Continued.
Species Trophic group
End point Result (LC50,mg L-1)
Source
S. capricornutum Algae 96 h growth EC50 =4.46 EC25=2.44
Kopperman et al. (1974)
S. subspicatus Algae 96 h biomass, growth
EC50=1.2 0.5
Kopperman et al. (1974)
S. costatum Algae 96 h growth EC50>66
Kopperman et al. (1974)
flos-aquae Algae 96 h biomass EC50=0.97
Kopperman et al. (1974)
P. subcapitata Algae 72 h growth EC25=3.4
Ura et al. (2002)
N. pelliculosa Algae 96 h growth EC50=19.1
Kopperman et al.(1974)
Natural algal assemblage Algae 96 h biomass 0.12
Marchini et al.(1992)
Closterium ehrenbergii Algae 96 h growth NOEC=250
Canton et al. (1985)
Dunaliella tetriolecta Algae 96 h growth NOEC=250
Calamari et al. (1982)
L. gibba Plant 7 d growth EC50>62.5
Kopperman et al. (1974)
S. herbacea Plant 28 d seed germination, morphology
100 100
Abernathy et al.(1986)
E. prostrata Plant 28 d seed germination, morphology
No effect 1000
Abernathy et al.(1986)
B.frondosa Plant 28 d seed germination, morphology
100 10
Abernathy et al.(1986)

209
Table 9-4. Redefined human and ecological exposure pathways for land-applied biosolids.
Pathway Description of HEI
1.Biosolidssoilplant Plant toxicity due to uptake of biosolids-borne TCS when grown in biosolids-amended soils
2. Biosolidssoilhuman Human and child ingesting biosolids
3. Biosolidssoilplanthuman Human (home gardener) lifetime ingestion of plants grown in biosolids-amended soil
4. Biosolidssoilplantanimal Animal lifetime ingestion of plants grown on biosolids-amended soil
5. Biosolidssoilplantanimalhuman Human lifetime ingestion of animal products (animals raised on forage grown on biosolids-amended soil)
6. Biosolidssoilanimal Animal lifetime ingestion of biosolids
7. Biosolidssoilanimalhuman Human lifetime ingestion of animal products (animals ingest biosolids directly)
8. Biosolidssoilsoil organism Soil organism ingesting biosolids/soil mixture
9. Biosolidssoilsoil organismpredator Predator of soil organisms that have been exposed to biosolids- amended soils

210
Table 9-5. Data utilized for the calculation of RfD for humans and animals.
Study type Species Endpoint Exposure Result (mg kg-1 day-1) References
Subchronic toxicity Rat Hamster
NOAEL
Dietary feeding exposure for 90 d
Dietary feeding for 13 weeks
100
50
75
SCF (2000) Ciba (2000) Ciba (2000)
Chronic/carcinogenicity
Rat Hamster
NOAEL NOAEL
Dietary feeding for 2 years Dietary feeding for 90-95 weeks
52
75
Borzelleca (1992) Ciba (2000)
Reproductive or developmental
Rat Mouse
NOAEL NOAEL
Exposure by gastric intubations and effects up to 2 generations
150 (reproductive performance) 50 (offspring)
25 (maternal development)
Borzelleca (1992) Ciba (2000) Borzelleca (1992)
Repeat toxicity Mouse NOAEL 13 week Changes in liver weight
25 NICNAS(2009)
Repeat toxicity Rat NOAEL Oral feeding (2 years) Clinical chemistry and liver changes
40 (male) 56 (female)
NICNAS (2009)
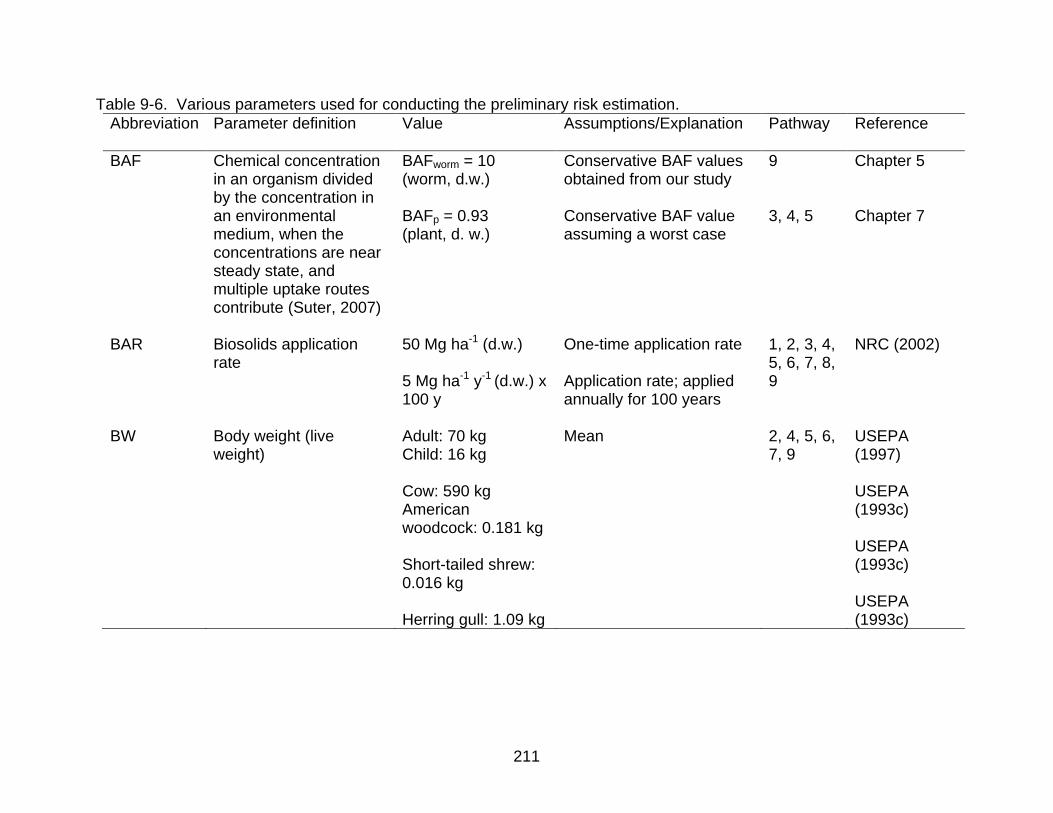
211
Table 9-6. Various parameters used for conducting the preliminary risk estimation.
Abbreviation Parameter definition Value
Assumptions/Explanation Pathway Reference
BAF Chemical concentration in an organism divided by the concentration in an environmental medium, when the concentrations are near steady state, and multiple uptake routes contribute (Suter, 2007)
BAFworm = 10 (worm, d.w.) BAFp = 0.93 (plant, d. w.)
Conservative BAF values obtained from our study Conservative BAF value assuming a worst case
9 3, 4, 5
Chapter 5 Chapter 7
BAR Biosolids application rate
50 Mg ha-1 (d.w.) 5 Mg ha-1 y-1 (d.w.) x 100 y
One-time application rate Application rate; applied annually for 100 years
1, 2, 3, 4, 5, 6, 7, 8, 9
NRC (2002)
BW Body weight (live weight)
Adult: 70 kg Child: 16 kg Cow: 590 kg American woodcock: 0.181 kg Short-tailed shrew: 0.016 kg Herring gull: 1.09 kg
Mean
2, 4, 5, 6, 7, 9
USEPA (1997) USEPA (1993c) USEPA (1993c) USEPA (1993c)
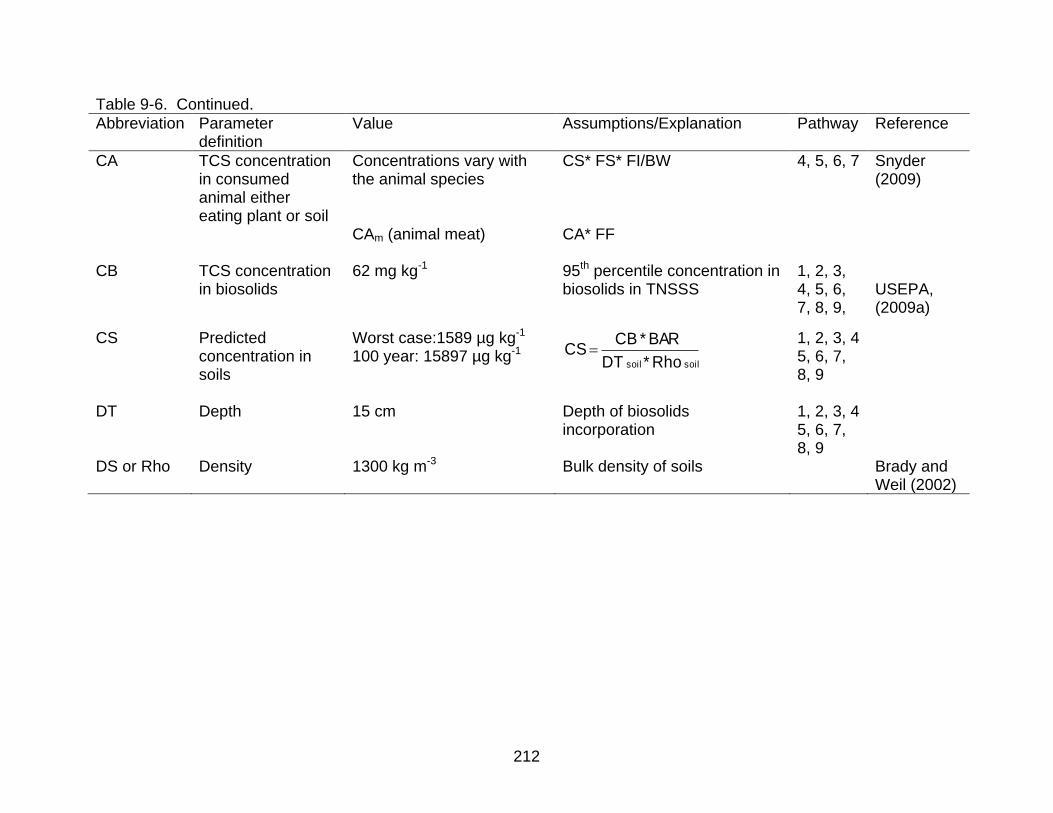
212
Table 9-6. Continued.
Abbreviation Parameter definition
Value Assumptions/Explanation Pathway Reference
CA TCS concentration in consumed animal either eating plant or soil
Concentrations vary with the animal species CAm (animal meat)
CS* FS* FI/BW CA* FF
4, 5, 6, 7
Snyder (2009)
CB TCS concentration in biosolids
62 mg kg-1 95th percentile concentration in biosolids in TNSSS
1, 2, 3, 4, 5, 6, 7, 8, 9,
USEPA, (2009a)
CS Predicted concentration in soils
Worst case:1589 µg kg-1 100 year: 15897 µg kg-1
soilsoil Rho * DT
BAR * CB CS
1, 2, 3, 4 5, 6, 7, 8, 9
DT Depth 15 cm Depth of biosolids incorporation
1, 2, 3, 4 5, 6, 7, 8, 9
DS or Rho Density 1300 kg m-3 Bulk density of soils Brady and Weil (2002)

213
Table 9-6. Continued.
Abbreviation Parameter definition Value Assumptions/ Explanation
Pathway Reference
CW TCS concentration in earthworms
Worst case: 15897 µgkg-1 100-year: 158974 µg kg-1
PEC soil * BAFworm
Earthworms acquire chemical via ingestion of the soil
8, 9
Chapter 5
FF Fat fraction in meat Beef: 0.10 Pork: 0.090 Poultry: 0.060
Mean
5, 7 USEPA, 1997
FI Food ingestion rate Cow: 9100 g d-1 (d.w.) American woodcock: 139 g d-1 (d.w.) Short tailed shrew: 13 g d-1
Herring gull : 213 g d-1
4, 5, 6, 7, 9
Nagy (1987) in Suter (2007) In Reiss et al. (2009)
FS Soil fraction of diet Cow: 0.025 Value used in Part 503 biosolids risk assessment
6
USEPA (1995)
FVC Combined fruit and vegetable consumption
7.7 g kg-1 d-1 (w.w.) Mean 3 USEPA (1997)
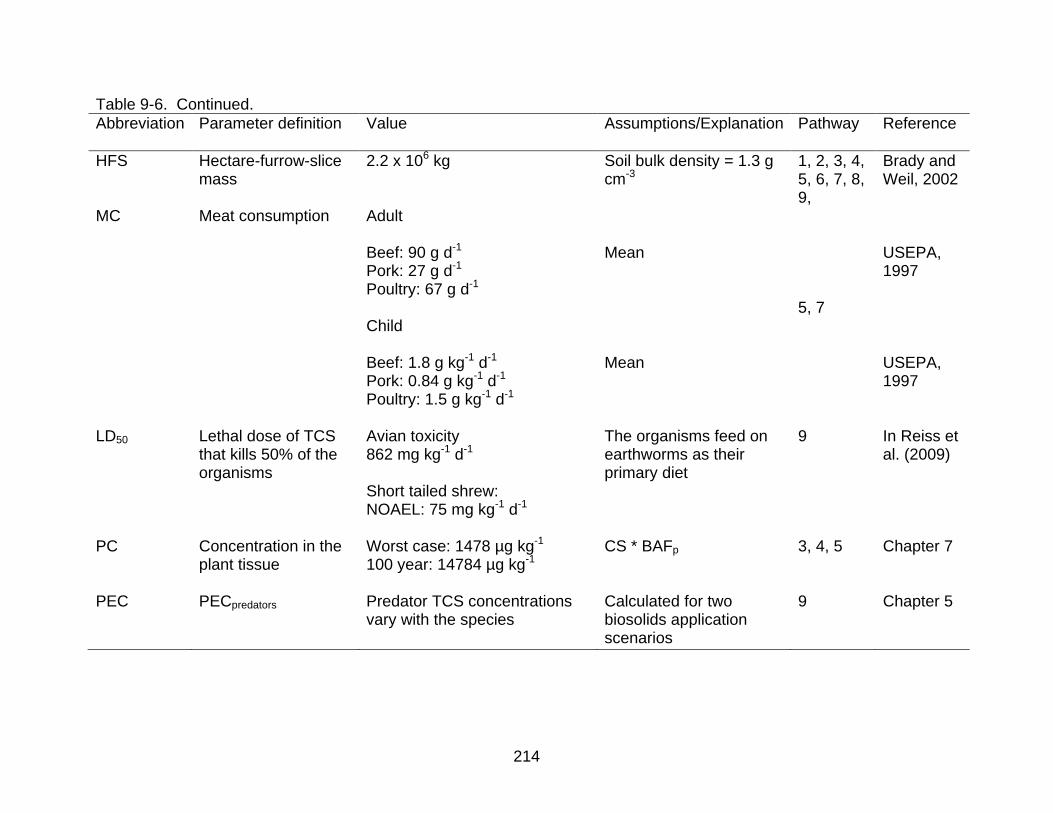
214
Table 9-6. Continued.
Abbreviation Parameter definition Value Assumptions/Explanation Pathway
Reference
HFS Hectare-furrow-slice mass
2.2 x 10⁶ kg Soil bulk density = 1.3 g cm-3
1, 2, 3, 4, 5, 6, 7, 8, 9,
Brady and Weil, 2002
MC Meat consumption Adult Beef: 90 g d-1 Pork: 27 g d-1 Poultry: 67 g d-1 Child Beef: 1.8 g kg-1 d-1 Pork: 0.84 g kg-1 d-1 Poultry: 1.5 g kg-1 d-1
Mean Mean
5, 7
USEPA, 1997 USEPA, 1997
LD50 Lethal dose of TCS that kills 50% of the organisms
Avian toxicity 862 mg kg-1 d-1 Short tailed shrew: NOAEL: 75 mg kg-1 d-1
The organisms feed on earthworms as their primary diet
9 In Reiss et al. (2009)
PC Concentration in the plant tissue
Worst case: 1478 µg kg-1 100 year: 14784 µg kg-1
CS * BAFp 3, 4, 5 Chapter 7
PEC PECpredators
Predator TCS concentrations vary with the species
Calculated for two biosolids application scenarios
9 Chapter 5

215
Table 9-6. Continued.
Abbreviation Parameter definition Value Assumptions/Explanation Pathway
Reference
RfD Reference dose: daily dose of chemical that appears to be without appreciable risk during an entire life time.
Human: 0.40 mg kg-1 bw d-1 Animal: 1 mg kg-1 bw d-1
Predators: 2.87 mg kg-1 bw d-1
Calculated using toxicity end-points obtained from literature
1, 2, 3, 4, 5, 6, 7, 8, 9
Chapter 9
SI Soil ingestion Adult: 0.05 g d-1 Child: 0.2 g d-1 Pica child: 10 g d-1
Mean 2 USEPA (1997)
WD Percent of worm diet Hearing gull : 7.7 American woodcock: 78 Short tailed shrew: 31.4
9 Reiss et al. (2009)

216
Table 9-7. Equations used to calculate screening level hazard indices (HI) (considering no TCS degradation).
Pathway Hazard Index
Equations Worst case Hazard
Index 100-year Hazard Index
Comments/ Assumptions
1. Biosolidssoilplant
CS / RfD *CF 0.159 1.59
Direct TCS effects on plant growth
2. Biosolidssoilhuman
(CS * SI / BW) / RfD *CF
Adult: 2.6*10-6 Child: 4.5*10-5
Pica child: 2.2*10-3
Adult: 2.6*10-5 Child: 4.5*10-4
Pica child: 2.2*10-2
3. Biosolidssoilplanthuman
(PC * FVC) / RfD * CF
Adult: 0.026
Adult: 0.26
All produce consumed grown
in biosolids-amended soil
4. Biosolidssoilplantanimal
(PC*FI/BW)/RfD*CF Cow: 0.023
Cow: 0.23
100% of diet consists of plants growing biosolids-amended soil
5. Biosolidssoilplantanimalhuman
(CAm * MC / BW) / RfD * CF
Beef: 6.7*10-6 Pork: 1.8*10-6
Poultry: 2.9*10-6
Beef: 6.7*10-5 Pork: 1.8*10-5
Poultry: 2.9*10-5
Individual HI values calculated for each meat product consumed 100% of diet consists of plants grown in biosolids-amended soil

217
Table 9-7. Continued.
Pathway Hazard Index
Equations Worst case 100 years
Comments/ Assumptions
6. Biosolidssoilanimal
(CS * FS * FI / BW) / RfD * CF
Cow: 6.1*10-4 Cow: 6.1*10-3
7. Biosolidssoilanimal human
(CAm
* MC / BW) / RfD * CF
Beef: 1.8*10-7 Pork: 4.8*10-8 Poultry: 8*10-8
Beef: 1.8*10-6 Pork: 4.8*10-7 Poultry: 8*10-7
HI values calculated assuming consumption of each meat product
8. Biosolidssoilsoil organism
SC / RfD * CF
Eisenia foetida: 0.16
Eisenia foetida: 1.59
Based on the most sensitive LC50 Lifetime spent in biosolids-amended soil
9. Biosolidssoilsoil organismpredator
(FI* WD *CS* BAFworm/BW) / (RfD * CF)
Herring gull: 0.08
American woodcock:
3.3
Short-tailed shrew: 1.4
Herring gull: 0.83
American woodcock:
33
Short-tailed shrew: 14
Earthwom diet by the birds is variable among species

218
Figure 9-1. Log of predicted TCS concentrations (mg kg-1) assuming no TCS loss, and
expected TCS concentrations (considering degradation) varying with time (years) of annual biosolids applications.
0
0
1
10
100
0 20 40 60 80 100 120
log o
f am
ended s
oil
TC
S
concentr
ation (
mg k
g-1
)
Years of biosolids application
Expected considering degradation No degradation
219
SUMMARY AND CONCLUSIONS
Summary of Intermediate Objective Results
Objective 1: Quantify TCS Concentration in Biosolids
The measured TCS concentrations in 15 biosolids were 0.40 to 40 mg kg-1 with an
average of 18 ± 12 mg kg-1 and a median concentration of 21 mg kg-1. The average and
median concentrations were consistent with the mean value (16 ± 65 mg kg-1) reported
in TNSSS (USEPA, 2009a) and majority of recently published studies. Biosolids utilized
in our study were anaerobically digested, but differences in TCS concentrations occured
likely due to differences in digestion periods (time), inputs, or dewatering methods (air-
dried vs cake). Triclosan concentrations may also differ between WWTPs serving
residential and industrial communities. A typical representative range of biosolids TCS
concentration appears to be ~10 to 20 mg kg-1.
Objective 2: Determine/Verify Basic Physico-Chemical Properties of TCS
Water solubility of a chemical influences a chemical‘s transport, bioavailability and
degradation rate in soils. Measured TCS water solubilities were 9 mg L-1 (pH = 6.14), 27
mg L-1 (pH = pKa = 8.14) and 800 mg L-1 (pH = 10.14). The overall 90-fold increase in
solubility when pH exceeded the pKa resulted from the dissociation of the neutral acid to
anionic species. Increased solubility at higher pH portends greater concentration in the
aqueous phase during sewage treatment processes utilizing lime stabilization and in
high pH soils. High pH levels are not common in most sewage treatment systems or in
most soils, except in some sodic soils. Solubility of TCS measured at pH 6.14 (i.e., 9 mg
L-1) appears reasonable for predicting the fate and transport of TCS in many soils.
Partitioning coefficient (Kow) values determined by using models and published
measurements were in close agreement, and the value (log Kow = 4.8) changed

220
negligibly when pH exceeded the pKa. A log Kow of 4.8 was considered representative at
pH values typically found in most sewage treatment systems and in amended soils.
Mobility of TCS in biosolids-amended soil determines the potential for soil and
groundwater contamination. The low water solubility (9 mg L-1) and relatively high log
Kow (4.8) of TCS suggests extensive retention in (or on) biosolids and limited transport
in soil systems. The mean (n=7) inherent log Kd values for biosolids was 4.15 ± 0.03
and log Koc was 4.68 ± 0.07. The mean (n=18) spiked log Kd value for biosolids was
3.76 ± 0.04 and log Koc value was 4.30 ± 0.03. Based on the limited number of biosolids
(n=7) analyzed for inherent Kd and Koc , the differences between inherent and spiked
coefficients were not statistically significant, but the inherent log Kd and Koc values tend
to be greater than the spiked values. The log Kd values determined for biosolids, soils
and biosolids-amended soils were variable. Following normalization to organic carbon,
the coefficients (Koc) determined in all matrices were not significantly different and
averaged 4.26 ± 0.31 (Agyin-Birikorang et al., 2010). Thus, a specific or narrow range of
TCS partitioning coefficients (Koc) can serve as a first approximation to describe the
behavior of TCS in soils or other matrices. The high log Koc suggests preferential
partitioning of TCS into organic material and thus, the mobility of biosolids-borne TCS is
expected to be low, with minimal risk of leaching.
Objective 3: Determine the Degradation (Persistence) of Biosolids-Borne TCS
Biodegradation of TCS was studied in biosolids-amended sand (IFS) and silty
clay loam (ASL) soils. Mineralization of 14C-TCS to 14CO2 was minimal (<0.5%) in both
soils through 18 week in both biotic and inhibited biotic treatments. Biosolids-amended
soil TCS concentrations (up to 0.40 mg kg-1) did not adversely affect CO2 evolution at
any time. Methyl-TCS was a major metabolite of TCS in the biotic treatment in both

221
soils. Absence of Me-TCS in inhibited treatment suggested that Me-TCS is formed by a
biomethylation reaction. Biosolids-borne TCS is persistent with a time for 50%
disappearance of 77 to >126 d depending on soil texture. Triclosan formed bound (non-
extractable) residues of expected limited lability with time. Degradation data were
inconsistent with the TCS lability expectations according to our operationally-defined
extraction scheme. Triclosan degraded faster in silty clay loam soil (than the sand soil),
but the silty clay loam has a smaller labile pool. So, the operationally-defined scheme
imperfectly distinguishes the labile and bound pools, and/or some of the compound in
bound fraction may also be bioavailable/biodegradable. Further investigation is needed
of the lability-inferred extraction schemes and the relationship to other measures of
lability (degradation and bioaccumulation data). Triclosan degradation is typically slower
in biosolids-amended soils (laboratory study) than in un-amended soils, but faster than
in field soils. We accept our hypothesis that biosolids-borne TCS is persistent in the
environment and forms bound residues; however, the fate of metabolite (Me-TCS) is not
known.
Objective 4: Determine the Impacts of Biosolids-Borne TCS to Soil Organisms
Earthworm survival in the silty clay loam (ASL) soil and the artificial soil was not
adversely affected at TCS concentration ≤10,005 mg kg-1 biosolids (equivalent to a
maximum amended soil concentration of 100 mg kg-1), suggesting an LC50 of ~10,005
mg kg-1 biosolids. The estimated LC50 value in the IFS soil is ~105 mg TCS kg-1
biosolids. The application of biosolids at 22 Mg ha-1 followed by incorporation at 15 cm
depth (~100 fold dilution of the TCS concentration), results in LC50 of ~1 mg TCS kg-1
soil in the IFS soil and 100 mg TCS kg-1 soil in the ASL and artificial soils.

222
Earthworms grown in the silty clay loam soil (ASL) accumulated more TCS than in
the sand (IFS) soil. The average BAF values in the two soils, irrespective of the spiked
TCS concentration, were 6.5 ± 0.84 for the IFS soil and 12 ± 3.08 for the ASL soil. The
average values were significantly different (p<0.05) from each other and likely reflected
variable physico-chemical soil properties. The soils differed in native soil organic carbon
(OC) contents (11 g kg-1 for IFS soil and ~34 g kg-1 for ASL soil), suggesting more
accumulation in soil with greater OC content. The average TCS concentration
measured in the earthworms collected in a field equilibrated soil was 4.3 ± 1.9 mg kg-1,
corresponding to a BAF value of 4.35 ± 0.7. Greater BAF values occurred where TCS
was spiked into biosolids (laboratory conditions) as opposed to inherent TCS in field
soils. The spiked log Kd values are less than the inherent log Kd values suggesting more
availability in a spiked system. Biosolids-borne TCS accumulated in, but was not toxic
to, earthworms. We accept the hypothesis that biosolids-borme TCS is not toxic to
earthworms but acknowledge that earthworms may accumulate TCS. Earthworm
accumulation of TCS varied significantly between laboratory and field conditions, but the
accumulation did not vary with TCS concentration in biosolids. Earthworm TCS
bioaccumulation would be similar irrespective of the TCS concentration in soils where
the worm is grown.
Objective 5: Determine the Toxicity of Biosolids-Borne TCS on Microbial Reactions
The TCS concentration of 505 mg kg-1 biosolids (5.05 mg kg-1 soils) was regarded
as NOAEL for the microbial community toxicity test in both soils. Biolog plate analyses
suggested that micro-organism exposed to TCS do not differ in substrate utilization and,
thus, community structure effects were not anticipated. Biosolids-borne TCS has no

223
adverse effect on soil micro-organisms, using microbially-mediated processes,
community structure, and bacterial counts as indicators, and our hypothesis of no
adverse TCS effects was accepted. Assuming a representative biosolids TCS
concentration of 16 mg kg-1, biosolids applied at 22 Mg ha-1 year-1 would have to be
applied for at least 30 years (assuming no loss of compound and no decrease in
bioavailability) to expect possible adverse effects on the processes of ammonification,
nitrification, or microbial respiration.
Objective 6 and 7: Quantify the Phytoavailability and Leaching Potential of Biosolids-Borne TCS
Plant toxicity and bioaccumulation tests were performed using three plant species
including radish, lettuce, and bahia grass. Using fresh biomass yields as the criteria, an
amended soil concentration of 9150 ng g-1 was regarded as the LOEC for radish root
growth. For lettuce, 4570 ng g-1 was the LOEC, and for bahia grass the NOEC is at
least 9150 ng g-1. Based on dry biomass yields, NOEC for all the plants is at least 9150
ng g-1. Food chain bioaccumulation begins with chemical uptake by plants. Plant
bioaccumulation tests suggested minimal accumulation in radish (BAF = 0.004) and
bahia grass leaves (BAF = <0.001), but some accumulation in lettuce leaves (BAF =
0.04) and more in radish roots (BAF = 0.43). Dicots (radish, lettuce) accumulated more
TCS than the monots (bahia grass). The BAF values obtained in our study suggest
some accumulation in the below-ground biomass (roots), and translocation to the
above-ground biomass (leaves), but accumulation was greater in the root than in the
leaves. Thus, a diet of tuber (root) plants is likely to pose greater risk of TCS to animals
and humans than a diet of leafy plants (lettuce).

224
As expected from the measured Kd and Koc values, the mobility of TCS was
minimal in leached soil columns amended with 14C-TCS spiked biosolids. The leaching
was less in a biosolids-amended soil than a soil without biosolids, as TCS association
with the OC of the biosolids retards movement. In amended soil, both TCS and Me-TCS
remained within the depth of biosolids incorporation (0-2.5 cm), but in controls, surface
applied TCS (and Me-TCS) moved to a depth of 2.5 cm. Thus, a relatively long time will
be required for both chemicals to move through a soil profile and reach groundwater.
Estimated time for 50% TCS degradation in the leaching study was 76 d, consistent with
50% disappearance time in the incubation study (77 to >126d). We accept our
hypothesis that biosolids-borne TCS has minimal mobility and phytoavailability.
Ultimate Objective: Risk Assessment of Biosolids-Borne TCS
A screening level risk assessment suggested minimal risk to human, terrestrial or
aquatic populations (HI<1) in most of pathways, except in pathways 1, 8 and 9 (HI>1). A
tier-2 assessment considering TCS loss through degradation reduced the HI value for
all critical pathways to less than one, suggesting minimal risk to even sensitive
organisms like American woodcock, herring gull, short tailed shrew, earthworms and
plants. We accept our overall hypothesis of minimal risk of biosolids-borne TCS to
human and environmental health. Biosolids containing a 95th percentile TCS
concentration (62 mg kg-1) applied at agronomic rates (5 Mg ha-1) for multiple years (up
to 100 years) did not adversely affect the majority of the organisms (according to tier-2
assessment) included in the exposure pathways described herein.
American woodcock was identified as the most sensitive species to TCS exposure
and, thus, pathway 9 was utilized for the calculation of preliminary pollutant limits. The
estimated CPLR was 5.8 kg TCS ha-1. The resulting pollutant concentration limit was 6.3

225
mg TCS kg-1 biosolids, which portends that if biosolids contain a TCS concentration
<6.3 mg kg-1, biosolids land application may not have restrictions regarding TCS risk.
However, our pollutant limits are preliminary estimates not intended to make changes to
the biosolids land application regulations. Rather, we calculated the limits to guide
future TCS work. We utilized the measured data (collected from our study) wherever
possible for risk estimation, but the assessment for some organisms (e.g. predators)
was limited by the lack of reliable data sources. Snyder (2009) identified the predator
pathway (pathway 9) as the most critical pathway in the TCC risk assessment, and
same pathway was critical for TCS. Our estimates are preliminary, as the toxicity end
point in the most critical exposure pathway (pathway 9) was derived from unpublished
sources and the risk was assessed based on our best scientific judgement (use of
uncertainty factors). The critical exposure pathways (HI>1) identified herein needs re-
assessment based on reliable toxicity endpoints. Additionally, the TCS pollutant limits
were established assuming no loss of TCS through degradation, but TCS disappears
with a relatively short half-life (100d) and should be considered when estimating the
pollutant limits. As Me-TCS was deemed as a major metabolite, risk assessment of
biosolids-borne TCS should consider the contribution of Me-TCS.
Future Studies
Appearance of metabolite (Me-TCS) raises some concern, as limited information
is available about Me-TCS. Leaching behavior of Me-TCS addressed in our leaching
study was similar to TCS. However, basic physicochemical properties of Me-TCS
(solubility, Kow, Kd), biodegradation, toxicity, plant accumulation are essentially
unknown. A recent study detected Me-TCS in soils amended with biosolids-borne TCS
(Lozano, personal communication, 2011), and future studies should address the fate

226
and transport of Me-TCS in biosolids-amended soils. Further, the behavior of bound
fraction of TCS is still not certain. Our short-term (18 week) incubation study suggested
formation of bound resiues but long-term studies are needed to explore possible
changes in bioavailability of TCS bound fraction with time. Data gaps also remain
regarding the potential development of antibiotic resistance and endocrine disruption
effects of TCS. Conflicting data reports the ability of TCS to cause endocrine disruption
(Veldhoen et al., 2006; Fort et al., 2010) in aquatic environments. Veldhoen et al. (2006)
suggested endocrine disruption effects at TCS concentrations (0.15-1.4 µg L-1), as
opposed to no adverse effects observed in Fort et al. (2010) study. Improved risk
assessments also require more reliable toxicity end points for terrestrial species.
Other research might include TCS leachability studies to explore the effect of soils,
biosolids, application methods and ground cover on the TCS movement. Aquatic risk
assessments only consider TCS concentrations in the aqueous phase but given the
high partitioning coefficients of TCS, it is expected to sorb to dissolved organic carbon
(DOC) and reduce the TCS availability to aquatic organisms. Characterization of
bioavailability of DOC-associated TCS could improve the risk assessments of runoff and
tile drianage waters entering the surface waters and affecting aquatic environments.

227
APPENDIX A EXPLANATION OF THE SEQUENTIAL EXTRACTION SCHEME
Labile is defined as the fraction of the chemical that is readily transformed by
micro-organisms or readily available to plants (https://www.soils.org /publications/soils-
glossary#). Mild extraction methods are commonly used to mimic the chemical uptake
by soil organisms and plants and, thereby, estimate the labile fraction of the chemical.
Common extraction agents used to characterize lability of compounds similar to TCS
(chlorophenols) are a mixture of water and MeOH (Yu et al., 2005; Hu et al., 2005).
Water extractions alone do not always correlate well with bioavailability (Hickman and
Reid, 2005). In particular, the bioavailability of hydrophobic chemicals can be
underestimated by water extractions because low water solubility limits the amount of
chemical extracted (Semple et al., 2003). Combining the amount of chemical extracted
by water and MeOH is one approach to circumvent the problem with chemicals
characterized by low water solubility. The humic fractions with expected low lability can
be successfully extracted by a strong base like NaOH (Shirshova et al., 2006). The
residual activity left in the dried soil after the sequential extractions is expected to
represent the bound or non-labile fraction. However, chemicals considered bound are
sometimes sorbed to the OM, Fe and Al oxides by either weak electrostatic forces or
covalent bonds. The TCS sorbed by weak electrostatic forces is expected to be
extracted by a mixture of MeOH+acetone (50:50 v/v), as the two solvents differ in
polarity and should extract the loosely sorbed TCS. Indeed, the solvent mixture is
utilized to determine total TCS and triclocarban concentrations in biosolids (Snyder et
al., 2010; Heidler et al., 2006) and is expected to be a more rigorous extractant than
MeOH alone. The 14C bound by covalent bonds was considered bound to the soil. The
228
sequential extraction scheme is proposed to extract labile (water, MeOH) and the non-
labile TCS in the soils. The non-labile fractions will include: humic-associated, (NaOH)
loosely sorbed (MeOH+acetone), and bound (combustible) fractions of TCS.

229
APPENDIX B SUPPLEMENATAL DATA FOR CHAPTER 7
Table B-1. Average bioaccumulation factors (BAF) in the radish and lettuce leaves after excluding the highest treatment (Trt 3).
Plant Average BAF including all treatments
BAF excluding Trt 3
Radish roots 0.43 0.26 Lettuce leaves 0.04 0.02
Figure B-1. Comparison of bioaccumulation factors in radish root (below-ground) and
lettuce leaves (above-ground) grown in a biosolids-amended soil with a range of TCS concentrations (same letters represent no statistical difference among treatments).
0
0.2
0.4
0.6
0.8
1
Radish
Lettuce
BA
F (
dry
wt.)
Crops
Control
990 ng/g (Trt 1)
5990 ng/g (Trt 2)
10,900 ng/g (Trt 3)
a
a
b
a b c
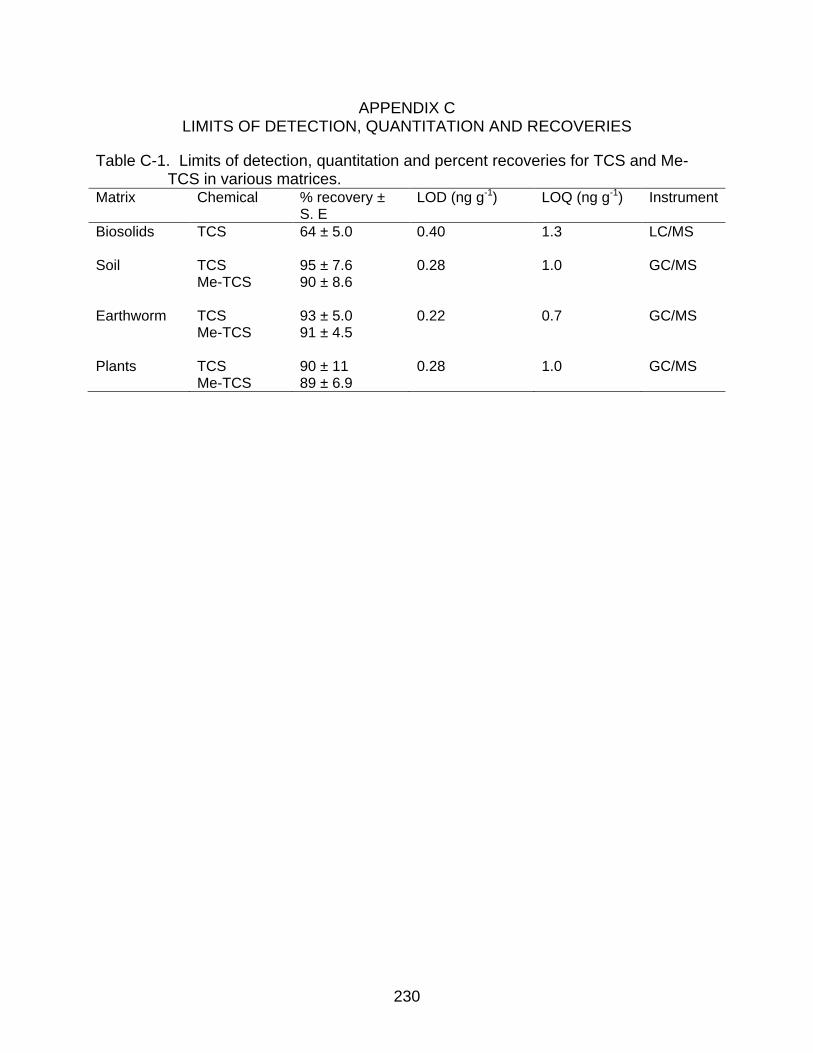
230
APPENDIX C LIMITS OF DETECTION, QUANTITATION AND RECOVERIES
Table C-1. Limits of detection, quantitation and percent recoveries for TCS and Me-TCS in various matrices.
Matrix Chemical % recovery ± S. E
LOD (ng g-1) LOQ (ng g-1) Instrument
Biosolids TCS 64 ± 5.0
0.40 1.3 LC/MS
Soil TCS Me-TCS
95 ± 7.6 90 ± 8.6
0.28 1.0 GC/MS
Earthworm TCS Me-TCS
93 ± 5.0 91 ± 4.5
0.22 0.7 GC/MS
Plants TCS Me-TCS
90 ± 11 89 ± 6.9
0.28 1.0 GC/MS

231
WORKS CITED
Abernathy, S., A. M. Bobra, W.Y. Shiu, P.G. Well and D. Mackay. 1986. Acute lethal toxicity of hydrocarbons and chlorinated hydrocarbons to two planktonic crustaceans: the key role of organism–water partitioning. Aquat. Toxicol. 8:163-174.
Adolfsson-Erici, M., M. Pettersson, J. Parkkonen, and J. Sturve. 2002. Triclosan, a commonly used bactericide found in human milk and in the aquatic environment in Sweden. Chemosphere 46:1485-1489.
Aga, D. 2009. Fate of pharmaceuticals in the environment and in water treatment systems. CRC press. Boca Raton, FL.
Agyin-Birikorang, S., M. Miller., and G. A. O‘Connor. 2010. Retention and release of TCC and TCS in soils and sediments. Environ. Toxicol. Chem. 29:1925-1933.
Alexander, M. 1995. How toxic are toxic chemicals in soil? Environ. Sci. Technol. 29: 2713-2717.
Alexander, M. 1999. Biodegradation and Bioremediation. Academic Press, San Diego, California.
Alexander, M. 2000. Aging, bioavailability, and overestimation of risk from environmental pollutants. Environ. Sci. Technol. 34:4259-4265.
Allmyr, M., M. Adolfsson-Erici, M. S. McLachlan, and G. Sandborgh-Englund. 2006. Triclosan in plasma and milk from Swedish nursing mothers and their exposure via personal care products. Sci. Total Environ. 372:87-93.
Al-Rajab, A. J., L. Sabourin, A. Scott, D. R. Lapen, and E. Topp. 2009. Impact of biosolids on the persistence and dissipation pathways of triclosan and triclocarban in an agricultural soil. Sci. Total Environ. 407:5978-5985.
Anderson, J. P. 1982. Soil respiration, in Page, A.L., Miller, and R.H., Keeney, D.R. (Eds.), Methods of Soil Analysis, Part 2–Chemical and Microbiological Properties, Second Edition :842-842.
Armitage, J.M. 2004. Development and evaluation of a terrestrial food web bioaccumulation model. Masters Thesis, Simon Fraser University, Burnaby, BC.
Balmer, M. E., T. Poiger, C. Droz, K. Romanin, P. Bergqvist, M.D. Muller, and H. Buser. 2004. Occurrence of methyl triclosan, a transformation product of the bactericide triclosan, in fish from various lakes in Switzerland. Environ. Sci. Technol. 38:390-395.

232
Banks, M. K., A. P. Schwab, N. Cofield, J. E. Alleman, M. Switzenbaum, J. Shalabi, and P. Williams. 2006. Biosolids-amended soils: Part I. Effect of biosolids application on soil quality and ecotoxicity. Water Environ. Res. 78:2217-2230.
Barbarick, K. A., K. G. Doxtader, E. F. Redente, and R. B. Brobst. 2004. Biosolids effects on microbial activity in shrub land and grassland soils. Soil Sci. 169:176-187.
Barbolt, T. A. 2002. Chemistry and safety of triclosan, and its use as an antimicrobial coating on VICRYL plus bacterial suture (Coated polyglactan 910 suture with triclosan). Surg. Infect. 3:S45–S53.
Benotti, M. J., R. A. Trenholm, B. J. Vanderford, J. E. Holady, B. D. Stanford, and S. A. Snyder. 2009. Phamaceuticals and endocrine disrupting compounds in US drinking water. Environ. Sci. Technol. 43:597-603.
Bester, K. 2003. Triclosan in a sewage treatment process—balances and monitoring data. Water Res. 37:3891–3896.
Bester, K. 2005. Fate of triclosan and triclosan-methyl in sewage treatment plants and surface waters Arch. Environ. Contam. Toxicol. 49:9-18
Binelli, A., D. Cogni, M. Parolini, C. Riva, and A. Provini. 2009. Cytotoxic and genotoxic effects of in vitro exposure to triclosan and trimethoprim on zebra mussel (Dreissena polymorpha) hemocytes. Comp. Biochem. Physiol. C. Toxicol. Pharmacol. 50:50-56.
Birosova, L., and M. Mikulasova. 2009. Development of triclosan and antibiotic resistance in Salmonella enterica serovar typhimurium. J. Med. Microbiol. 58:436-441.
Boehmer, W., H. Ruedel, A. Wenzel and C. Schroeter-Kermani. 2004. Retrospective monitoring of triclosan and methyl-triclosan in fish: results from the German environmental specimen bank. Organohalogen Compd. 66:1516-1521.
Bouche, M. B., and R. H. Gardner. 1984. Earthworm functions VIII, Population estimation techniques. Revue d‘Ecologie et Biologie du Sol 21:37-63.
Boxall, A.B., P. Johnson, E. J. Smith, C. J. Sinclair, E. Stutt, and L. S. Levy. 2006. Uptake of veterinary medicines from soils into plants. J. Agric. Food Chem. 54:2288-2297.
Brady, N. C., and R. R. Weil. 2002. The nature and properties of soils. Prentice hall, NJ. Brausch, J. M., and G. M. Rand. 2010. A review of peronal care products in the aquatic
environment: Environmental concentrations and toxicity. Chemosphere 82:1518-1532.

233
Bremner, J. M. 1996. Nitrogen-total. P. 1238-1255. In C. A. Black et al. (ed.) Methods of soil analysis. Part 2. Agron. Monogr. 9. ASA and SSSA, Madison, WI.
Butler, E., M. J. Whelan, K. Ritz, R. Sakrabani, and R. van Egmond. 2011. Effects of triclosan on soil microbial respiration. Environ. Toxicol. Chem. 30:360-366.
Calafat, A. M., X. Ye, L. Wong, J. A. Reidy, and L. L. Needham. 2008. Urinary concentrations of triclosan in the U.S. population: 2003-2004. Environ. Health Persp. 116:303-307.
Calamari, D., S. Galassi, F. Setti and M. Vighi. 1983. Toxicity of selected chloro benzenes to aquatic organisms, Chemosphere 12:253–262.
Canosa, P., S. Morales, I. Rodriquez, E. Rubi, R. Cela, and M. Gomez. 2005. Aquatic degradation of triclosan and formation of toxic chlorophenols in presence of low concentrations of free chlorine. Anal. Bioanal Chem. 383:1119-26.
Canton, J.H, W. Sloof, H.J. Kool, J. Struys, T.J.M. Pouw, R.C.C. Wegman and G.J. Piet 1985. Toxicity, biodegradability, and accumulation of a number of chlorine/nitrogen containing compounds for classification and establishing water quality criteria. Regul. Toxicol. Pharm. 5:123–131.
Capdevielle, M., R. Van Egmond , M. Whelan, D. Versteeg , M. Hofmann-Kamensky , J. Inauen, V. Cunningham , and D Woltering . 2008. Consideration of exposure and species sensitivity of triclosan in the freshwater environment. Integr. Environ. Assess. Manag. 4:15-23.
Carballa, M., F. Guido, O. Francisco, J. M. Lema, and T. Ternes. 2008. Determination of the solid–water distribution coefficient (Kd) for pharmaceuticals, estrogens and musk fragrances in digested sludge. Water Res. 42:287-295.
Carlson, R.M., and R. Caple. 1977. Chemical/Biological Implications of using Chlorine and Ozone for Disinfection. EPA-600/3-77-066, Duluth, MN, 88p.
Cha, J., and A.M. Cupples. 2009. Detection of the antimicrobials triclocarban and triclosan in agricultural soils following land application of municipal biosolids. Water Res. 43:2522-2530.
Cha, J., and A. M. Cupples. 2010. Triclocarban and triclosan biodegradation at field concentrations and the resulting leaching potentials in three agricultural soils. Chemosphere 81:494-499.
Christensen, K. P. Triclosan - Determination of aerobic biodegradation in soils. Springborn Laboratories, Inc., Wareham (MA): 1994; Prepared for Colgate-Palmolive Company, Piscataway (NJ). SLI Report 93-5-4770. Available at-http://www.fda.gov/ohrms/dockets/dockets/75n0183h/75n-0183h-sup0013-11-Attachment-04-01-vol202.pdf, Accessed on Jan, 20 2011.

234
Chu, S., and C.D. Metcalfe. 2007. Simultaneous determination of triclocarban and triclosan in municipal biosolids by liquid chromatography tandem mass spectrometry. J Chromatogr A 1164:212–218.
Ciba Specialty Chemicals. 2001a. General information on chemical,physical and microbiological properties of Irgasan DP300, Igracare MP and Irgacide LP10. Brochure 2520. Publication AgB2520e.02.2001. Basel Switzerland.
Ciba Specialty Chemicals. 2001b. Irgasan DP 300, Irgacare MP.Toxicological and ecolological data. Official registrations. Technical Brochure#2521, Basel, Switzerland.
Comfort, S. D., P. J. Shea, F. W. Roeth. 1994. Understanding pesticides and water quality in Nebraska. Nebraska Cooperative Extension EC 94-135. University of Nebraska, Lincoln, NE 68583, p 16.
Coogan, M. A., R. E. Edziyie, T. W. La Point, and B. J. Venables. 2007. Algal bioaccumulation of triclocarban, triclosan, and methyl-triclosan in a North Texas wastewater treatment plant receiving stream. Chemosphere 10:1911-1918.
Coogan, M. A., and T. W. La Point. 2008. Snail bioaccumulation of triclocarban, triclosan, and methyltriclosan in a North Texas, USA, stream affected by wastewater treatment plant runoff. Environ. Toxicol. Chem. 27:1788-1793.
Cory, A. H., T. C. Owen, J. A. Barltrop, and J. G. Cory. 1991. Use of an aqueous soluble tetrazolium/formazan assay for cell growth assays in culture. Cancer Commun. 3:207-212.
Dayan, A. D. 2007. Risk assessment of triclosan [Irgasan®] in human breast milk. Food Chem. Toxicol. 45:125-129.
Delgado, E.J. 2002. Predicting aqueous solubility of chlorinated hydrocarbons from molecular structure. Fluid Phase Equilibria 199:101-107.
Dennis, G. L., and P. R. Fresquez. 1989. The soil microbial community in sewage-sludge-amended semi-arid grassland. Biol. Fertil. Soil. 7:310-317.
Dimitrov, S. D., N. C. Dimitrova, J. D. Walker, G. D. Veith, and O.G. Mekenyan. 2003. Bioconcentration potential predictions based on molecular attributes- An early warning approach for chemicals found in humans, birds, fish and wildlife. QSAR Comb. Sci. 22:58-68.
Dolliver, H., K. Kumar, and S. Gupta. 2007. Sulfamethazine uptake by plants from manure-amended soil. J. Environ. Qual. 36:1224-1230.
Duarte-Davidson, R. and K.C. Jones. 1996. Screening of the environmental fate of organic contaminants in sewage sludge applied to agricultural soils: II. The potential for transfers to plants and grazing animals. Sci. Total Environ. 185:59-70.

235
Edwards, M., E. Topp, C. D. Metcalfe, H. Li, N. Gottschall, P. Bolton, W. Curnoe ,M. Payne, A. Beck, S. Kleywegt, and D. R. Lapen. 2009. Pharmaceutical and personal care products in tile drainage following surface spreading and injection of dewatered municipal biosolids to an agricultural field. Sci. Total Environ. 407:4220-4230.
Environmental Protection and Heritage Council (EPHC). 2008. Australian Guidelines for Water Recycling: Managing Health and Environmental Risks (Phase 2): Augmentation of Drinking Water Supplies. Adelaide, South Australia, Australian Health Ministers' Conference, Natural Resource Management Ministerial Council.
Epstein, E., 2003. Land Application of Sewage Sludge and Biosolids. CRC Press, Boca Raton, Florida.
Fair, P. A., H. B. Lee, J. Adams, C. Darling, G. Pacepavicius, M. Alaee, G. D. Bossart, N. Henry, and D. Muir. 2009. Occurrence of triclosan in plasma of wild Atlantic bottlenose dolphin (Tursiops truncates) and in their environment. Environ. Pollut. 157:2248-2254.
Farkas, M. H., E. R. Mojica, M.Patel, D. S. Aga, J. O. Berry. 2009. Development of a rapid biolistic assay to determine changes in relative levels of intracellular calcium in leaves following tetracycline uptake by pinto bean plants. Analyst 134:1594-1600.
Fischer, A., C. Oehm, M. Selle, and P. Werner. 2005. Biotic and abiotic transformations of Methyl tertiary Butyl Ether (MTBE). Environ. Sci. Pollut. Res. Int. 12:381-386.
Fort, D. J, R. L. Rogers, J. W. Gorsuch, L. T. Navarro, R. Peter, and J. R. Plautz. 2010. Triclosan and anuran metamorphosis: no effect on thyroid-mediated metamorphosis in Xenopus laevis. Toxicol Sci. 113:392-400.
Franz, S., R. Altenburger, H. Heilmaeir and M. Schmidtt-Jansen. 2008. What contributes to the sensitivity of microalgae to triclosan? Aquat. Toxicol. 90:102–108.
Fuchsman, P., J. Lyndall, M. Bock, D. Lauren, T. Barber, K. Leigh, E. Perruchon, and M. Capdevielle. 2010. Terrestrial ecological risk evaluation for triclosan in land-applied biosolids. Int. Environ. Assess. Manag. 6:405-418.
Garbeva, P., J. A. van Veen, and J. D. van Elsas. 2004. Microbial diversity in soil: selection of microbial populations by plant and soil type and implications for disease suppressiveness. Ann. Rev. Phytopathol. 42:243-270.
Garcia-Gil, J. C., C. Plaza, N. Senesi, and G. Brunetti. 2004. Effects of sewage sludge amendment on humic acids and microbiological properties of a semi-arid Mediterranean soil. Biol. Fertil. Soil. 39:320-328.

236
Garland, J.L. 1997. Analysis and interpretation of community-level physiological profiles in microbial ecology. FEMS Microbiol. Ecol. 24:289-300.
Garland, J.L., and A. L. Mills. 1991. Classification and characterization of heterotrophic microbial communities on the basis of patterns of community-level sole-carbon-source utilization. Appl. Environ. Microbiol. 57:2351–2359.
Gibson, R., J. C. Duran-Alvarez, K. L. Estrada, A. Chavez, and B. J. Cisneros. 2010. Accumulation and leaching potential of some pharmaceuticals and potential endocrine disruptors in soils irrigated with wastewater in the Tula Valley, Mexico. Chemosphere 81:1437-1445.
Gilbert, P., and A.J. McBain. 2002. Literature-based evaluation of the potential risks of impregnation of medical devices and implants with triclosan. Surg. Infect. 3:S55-S63.
Gustafson, D. I. 1989. Groundwater ubiquity score - a simple method for assessing pesticide leachability. Environ. Toxicol. Chem. 8:339–357.
Haggblom, M. M., J. H. A. Apajalahti, and M. S. Salkinoja-Salonen. 1988. O-Methylation of chlorinated para-Hydroquinones by Rhodococcus chlorophenolicus. Applied Environ. Micro. 54:1818-1824.
Halden, R. U., and D. H. Paull. 2005. Co-Occurrence of triclocarban and triclosan in U.S. water resources. Environ. Sci. Technol. 39:1420-1426.
Hansen, L. H., B. Ferrari, A. H. Sørensen, D. Veal, and S. J. Søsen. 2001. Detection of oxytetracyline production by Streptomyces rimosus in soil microcosoms by combining whole cell biosensors and flow cytometry. Appl. Environ. Microbiol. 67: 239-244.
Hartnik, T., L. E. Sverdrup., and J. Jensen. 2008. Toxicity of the pesticide alpha-cypermethrin to four soil nontarget invertebrates and implications for risk assessment. Environ. Toxicol. Chem. 27:1408-1415.
Heath, R. J., and C. O. Rock. 2000. A triclosan-resistant bacterial enzyme. Nature (Lond). 406:145-146.
Heidler, J., A. Sapkota, and R. Halden. 2006. Partitioning, persistence, and accumulation in digested sludge of the topical antiseptic Triclocarban during wastewater treatment. Environ. Sci. Technol. 40:3634-3639.
Heidler, J., and R. U. Halden. 2007. Mass balance of triclosan removal during conventional sewage treatment. Chemosphere 66:362-369.
Heidler, J., and R. U. Halden. 2009. Fate of organohalogens in US wastewater treatment plants and estimated chemical releases to soils nationwide from biosolids recycling. J. Environ Monitor. 11:2207-2215.

237
Heim, LG. 1997. Adsorption of 14C-triclosan to suspended solids. Report 43356. Ciba Specialty Chemical, Basel, Switzerland.
Hendriks, A. J., W. C. Ma, J. J. Brouns, E. M. de Ruiter-Dijkman, and R. Gast. 1995. Modelling and monitoring organochlorine and heavy metal accumulation in soils, earthworms, and shrews in Rhine-Delta floodplains. Archives Environ. Contam. Toxicol. 29:115-127.
Herklotz, P. A., P. Gurung, H. Vanden Heuvel, and C. A. Kinney. 2010. Uptake of human pharmaceuticals by plants grown under hydroponic conditions. Chemosphere 78:1416-1421.
Hickman, Z. A., and B. J. Reid. 2005. Towards a more appropriate water based extraction for the assessment of organic contaminant availability. Environ. Pollut. 138:299-306.
Higgins, C. P., Z. J. Paesani, T. E. Abbott Chalew, R. U. Halden, and L. S. Hundal. 2011. Persistence of triclocarban and triclosan in soils after land application of biosolids and bioaccumulation in Eisenia foetida. Environ. Toxicol. Chem. 30:556-563.
Hoberg, J. R. 1992. Determination of effects on seedling growth of six plant species. Springborn laboratories, Inc., Wareham (MA). Submitted to The Procter & Gamble Company, Cincinnati (OH). SLI report 90-12-3574.
Holt, L M., A. E. Laursen., L.H. McCarthy, I. Vadim Bostan, and A. L. Spongberg. 2010. Effects of land application of municipal biosolids on nitrogen-fixing bacteria in agricultural soil. Biol. Fertil. Soil. 46:407-41.
Hu, X.Y., B. Wen, X. Q. Shan, and S. Z. Zhang. 2005. Bioavailability of pentachloro phenol to earthworms (Eisenia foetida) in artificially contaminated soils. J. Environ. Sci. Health A. 40:1905–1916.
Hulster, A., J. F. Muller, and H. Marschner. 1994. Soil-plant transfer of polychlorinated dibenzo-p-dioxins and dibenzofurans to vegetables of the cucumber family (Cucurbitacea). Environ. Sci. Technol. 28:1110-1115.
Hundt, K., D. Martin, E. Hammer, U. Jonas, M. K. Kindermann, and F. Schauer. 2000. Transformation of Triclosan by Trametes versicolor and Pycnoporus cinnabarinus. Applied Environ. Micro. 66:4157-4160.
Ingerslev, F., and B. Halling-Sørensen. 2001. Biodegradability of metronidazole, olaqiondox, and tylosin, and formation of tylosin degradation products in aerobic soil/manure slurries. Environ. Saf. 48:311−320.

238
Ishibashi, H., N. Matsumura, M. Hirano, M. Matsuoka, H. Shiratsuchi, Y. Ishibashi, Y. Takao, and K. Arizono. 2004. Effects of triclosan on the early life stages and reproduction of medaka Oryzias Latipes and induction of hepatic vitellogenin. Aquat. Toxicol. 67:167-179.
Jacobs, M. N., G. T. Nolan, and S. R. Hood. 2005. Lignan, bacteriocides and organochlorine compounds activate the human pregnane X receptor (PXR). Toxicol. Appl. Pharmacol. 209:123-133.
Jager, T. 1998. Mechanistic approach for estimating bioconcentration of organic chemicals in earthworms (Oligochaeta). Environ. Toxicol. Chem. 17:2080-2090.
Jakel, K. 1990. Irgasan DP 300: Report on dissociation constant in water. Ciba Speciality Chemical, Basel, Switzerland.
James, M. O., W. Li, D. P. Summerlot, L. Rowland-Faux, and C. E. Wood. 2010. Triclosan is a potent inhibitor of estradiol and estrone sulfonation in sheep placenta. Environ. Int. 36:942-949.
Karnjanapiboonwong, A., C. Qingsong, A.N. Morse, and T.A. Anderson. 2008. Sorption of estrogens, caffeine and triclosan to a sandy loam and a silt loam soil. SETAC North America 29th Annual Meeting. Tampa, FL. Nov. 16-20.
Kinney, C. A., E. T. Furlong, D. W. Kolpin, M. R. Burkhardt, S. D. Zaugg, S. L. Werner, J. P. Bossio, and M. J. Benotti. 2008. Bioaccumulation of pharmaceuticals and other anthropogenic waste indicators in earthworms from agricultural soil amended with biosolids or swine manure. Environ. Sci. Technol. 42:1863–1870.
Kolpin, D.W., E.T. Furlong, M.T. Meyer, E.M. Thurman, S.D. Zaugg, L.B. Barber, and H.T. Buxton. 2002. Pharmaceuticals, hormones, and other organic wastewater contaminants in U.S. streams, 1999-2000: A national reconnaissance. Environ. Sci. Technol. 36:1202-1211.
Kopperman, H. L., R. M. Carlson, and R. Caple. 1974. Aqueous chlorination and ozonation studies. I. Structure-toxicity corelations of phenolic compounds to Daphnia magna. Chem. Biol. Interact. 9:245-251.
Kourtev, P. S., J. G. Ehrenfeld, and M. Haggblom. 2003. Experimental analysis of the effect of exotic and native plant species on the structure and function of soil microbial communities. Soil Biol. Biochem. 35:895-905.
Kumar, K., S. C. Gupta, S. K. Baidoo, Y. Chander, and C. J. Rosen. 2005. Antibiotic uptake by plants from soil fertilized with animal manure. J. Environ. Qual. 34:2082-2085.
Kumar, P.R. 2006. An experimental methodology for monitoring contaminant transport through geotechnical centrifuge models. Environ. Monit. Assess. 117:215-233.

239
Kumar, K. 2010. A framework to predict uptake of pharmaceuticals and personal care products (PPCPs) by plants. SSSA International meetings, Long Beach, CA.
Kwon, J. W., K. L. Armbrust, and K. Xia. 2010. Transformation of triclosan and triclocarban in soils and biosolids-applied soils. J. Environ. Qual. 39:1139-1144.
Langdon, K. A., M. S. Warne, and R. S. Kookana. 2010. Aquatic hazard assessment for pharmaceuticals, personal care products, and endocrine-disrupting compounds from biosolids-amended land. Int. Environ. Assess. Manag. 6:663-676.
Langdon, K. A., M. S. Warne, R. J. Smernik, A. Shareef, and R. S. Kookana. 2011. Selected personal care products and endocrine disruptors in biosolids: An Australia-wide survey. Sci. Total Environ. 409:1075-1081.
Lapen, D.R., E. Topp, C. D. Metcalfe, H. X. Li, M. J. Edwards, N. Gottschall, P. Bolton, W. E. Curnoe, M. Payne, and A. Beck. 2008. Pharmaceutical and personal care products in tile drainage following land application of municipal biosolids. Sci. Total Environ. 399:50-65.
Latch, D. E., J. Packer, B. Stender, J. Van Overbeke, W. Arnold, and K. McNeill. 2005. Aqueous photochemistry of triclosan: formation of 2,4-Dichlorophenol, 2,8-Dichlorodibenzo-p-Dioxin, and oligomerization products. Environ. Toxicol. Chem. 24:517-525.
Lawlora, K., B. P. Knighta, V. L. Barbosa-Jeffersona , P. W. Laneb , A. K. Lilleyc , G. I. Patond, S. P. McGratha , S. M. O'Flahertya , and P. R. Hirscha. 2000. Comparison of methods to investigate microbial populations in soils under different agricultural management. FEMS Microbiol. Ecol. 33:129-137.
Lawrence, A. P., and M. A. Bowers. 2002. A test of the hot mustard extraction method of sampling earthworms. Soil Biol. Biochem. 34:549-552.
Leewen, C. J. van., and T. G. Vermeire. 2007. Risk assessment of chemicals: An introduction. 2nd edition, Springer, Netherlands.
Lei, H., and S. A. Snyder. 2007. 3D QSPR models for the removal of trace organic contaminants by ozone and free chlorine. Water Res. 41:4051-4060.
Leininger, S., T. Urich, M. Schloter, L. Schwark, J. Qi, G. W. Nicol, J. I. Prosser, S. C. Schuster and C. Schleper. 2006. Archaea predominates among ammonia-oxidizing prokaryotes in soils. Nature 442:806-809.
Levy, C. W., A. Roujeinikova, S. Sedelnikova, P. J. Baker, A. R. Stuitje, A. R. Slabas, D. W. Rice, and J. B. Rafferty. 1999. Molecular basis of triclosan activity. Nature (Lond) 398:383-384.

240
Lin, D., Q. Zhou, X. Xie, and Y. Liu. 2010. Potential biochemical and genetic toxicity of triclosan as an emerging pollutant on earthworms (Eisenia fetida). Chemosphere 81:1328-1333.
Lindstrom, A., I. J. Buerge, T. Poiger, P. Bergqvist. M. D. Muller, and H. Buser. 2002. Occurrence and environmental behavior of the bactericide triclosan and its methyl derivative in surface waters and in wastewater. Environ. Sci. Technol. 36:2322-2329.
Liu, F., G. G. Ying , L. H. Yang , and Q. X. Zhou. 2009. Terrestrial ecotoxicological effects of the antimicrobial agent triclosan. Ecotoxicol. Environ. Saf. 72:86-92.
Loraine, G.A., and M.E. Pettigrove. 2006. Seasonal variations in concentrations of pharmaceuticals and personal care products in drinking water and reclaimed wastewater in Southern California. Environ. Sci. Technol. 40:687-95.
Lozano, N., C. P. Rice, M. Ramirez, and A. Torrents. 2010. Fate of triclosan in agricultural soils after biosolid applications. Chemosphere 78:760-766.
Lu, S., and M. Archer. 2005. Fatty acid synthesis is a potential target for the chemoprevention of breast cancer. Carcinogenesis 26:153-157.
Lyman, W. 1990. Adsorption coefficient for soils and sediments. Pages 4-1-4-31 in W. J. Lyman, W. F. Reehl, and D. H. Rosenblatt (eds.), Handbook of chemical property estimation methods. American Chemical Society, Washington DC.
Lyndall, J., P. Fuchsman, M. Bock, T. Barber, D. Lauren, K. Leigh, E. Perruchon, and M. Capdevielle. 2010. Probabilistic risk evaluation for triclosan in surface water, sediments and aquatic biota tissues. Int. Environ. Assess. Manag. 6:419-440.
Lyrge, H., G. Moe, R. Skalevik and H. Holmsen. 2003. Interaction of triclosan with eukaryotic membrane lipids. Eur. J. Oral. Sci. 111:216-222.
Mackay, D., and L. Barnthouse. 2010. Integrated risk assessment of household chemicals and consumer products: addressing concerns about triclosan. Int. Environ. Assess. Manag. 6:290-392.
Mamo, M., S. C. Gupta, C. J. Rosen, and U. B. Singh. 2005. Phosphorus leaching at cold temperatures as affected by wastewater application and soil phosphorous levels. J. Environ. Qual. 34: 1243-1250.
Mamy, L., and E. Barriuso E. 2007. Desorption and time-dependent sorption of herbicides in soils. Eur. J Soil Sci. 58:174-187.
Marchini, S., M. L. Tosato, T. J. Norberg-King, D. E. Hammermeister and M. D. Hoglund. 1992. Lethal and sublethal toxicity of benzene derivatives to the fathead minnow, using a short-term test. Environ. Toxicol. Chem. 11:187-195.

241
Matsunaga, T., M. Okochi, and N. Satoshi. 1995. Direct count of bacteria using fluorescent dyes: application to assessment of electrochemical disinfection Anal. Chem. 67:4487-4490.
McAvoy, D. C., B. Schatowitz, M. Jacob, A. Hauk, and W. S. Eckhoff. 2002. Measurement of triclosan in wastewater treatment systems. Environ. Toxicol. Chem. 21:1323-1329.
McBain, A., R. Ledder, P. Sreenivasan, and P. Gilbert. 2004. Selection for high-level resistance by chronic triclosan exposure is not universal. J. Antimicr. Chem. 53: 772-777.
McClellan, K., and R. U. Halden. 2010. Pharmaceuticals and personal care products in archived U.S. biosolids from the 2001 EPA national sewage sludge survey. Water Res. 44:626-636.
McMahon, T. 1998. An AD Memo by Tim McMahon to Jess Rowland, Executive Secretary for Agency‘s HIARC Committee.
McMurry, L. M., M. Oethinger and S. B. Levy. 1998. Triclosan targets lipid biosynthesis. Nature 394:531-532.
Meylan, W.M., and P.H. Howard. 1991. HENRYWIN software available from syracuse research Corp., Environmental science center, Syracuse, NY 13210. Environ. Toxicol. Chem. 10:1283-1293.
Miller, T. R., J. Heidler, S. N. Chillrud, A. DeLaquil, J. C. Ritchie, J. N. Milalic, R. Boop, and R. U. Halden. 2008. Fate of triclosan and evidence for reductive dechlorination of triclocarban in estuarine sediment. Environ. Sci. Technol. 42:4570-4576.
MITI. 1992. Biodegradation and bioaccumulation data of existing chemicals based on the CSCL Japan. Japan chemical industry ecology-toxicology & information center.
Miyazaki, T., T. Yamagishi, and M. Matsumoto. 1984. Residues of 4-chloro-1-(2,4 dichlorophenoxy)-2-methoxybenzene (triclosan methyl) in aquatic biota. Bull. Environ. Contam. Toxicol. 32:227-232.
Morales, S., P. Canosa, I. Rodriguez, E. Rubi, and R. Cela. 2005. Microwave assisted extraction followed by gas chromatography with tandem mass spectrometry for the determination of triclosan and two related chlorophenols in sludge and sediments. J. Chromatogr. A. 1082:128-135.
Morrison, H. A., F. A. P. C. Gobas, R. Lazar, and G. D. Haffner. 1996. Development and verification of a bioaccumulation model for organic contaminants in benthic invertebrates. Environ. Sci. Technol. 30:3377-3384.

242
Moss, T., D. Howes, and F.Mm. Williams. 2000. Percutaneous penetration and dermal metabolism of triclosan (2,4,4‘-trichloro-2‘-hydroxydiphenylether). Food Chem. Toxicol. 38:361-370.
Nagy, K. A. 1987. Field metabolic rate and food requirement scaling in mammals and birds. Ecolog. Monographs 57:111-128.
National industrial chemicals notification and assessment scheme (NICNAS). 2009. Priority existing chemicals assessment report no. 30. Australian Government Department of Health and Ageing.
National Research Council (NRC). 2002. Biosolids applied to land:advancing standards and practices, National Academy Press. Washington, DC.
Neil, O. 2006. The Merck Index, 14th ed. Merck & Co., Inc., USA.
Neilson, A. H., A. Allard, P. Hynning, M. Remberger, and L. Landner. 1983. Bacterial methylation of chlorinated phenols and guaiacols; Formation of veratroles from guaiacols and high-molecular weight chlorinated lignin. Applied Environ. Micro. 774-783.
Newman, Y., J. Vendramini, and A. Blout. 2010. Bahiagrass (Paspalum notatum): Overview and management. University of Florida, IFAS extension publication # SS-AGR-332.
Newton, P., S. Cadena, M. Rocha, E. Carnieri and M. Oliveira. 2005. Effect of triclosan (TRN) on energy-linked functions of rat liver mitochondria. Toxicol. Lett. 160:49-59.
Nghiem, L. D., and P.J. Coleman. 2008. NF/RO filtration of the hydrophobic ionogenic compound triclosan: transport mechanisms and the influence of membrane fouling. Separat. Purif. Technol. 62:709-716.
Nowosielski, B. E., and J. B. Fein. 1998. Experimental study of octanol-water partition coefficients for 2,4,6-trichlorophenol and pentachlorophenol: Derivation of an empirical model of chlorophenol partitioning behavior. Appl. Geochem. 13:893-904.
O‘Connor, G. A. 1996. Organic compounds in sludge-amended soils and their potential for uptake by crop plants. Sci. Total Environ. 185:71-81.
Orvos, D. R., D. J. Versteeg, J. Inauen, M. Capdevielle, A. Rothenstein, and V. Cunningham. 2002. Aquatic toxicity of triclosan. Environ. Toxicol. Chem. 21:1338–49.
Palenske, N. M., G. Nallani, and E. M. Dzialowski. 2010. Physiological effects and bioconcentration of triclosan on amphibian larvae. Comp. Biochem. Physiol. C. 152:232-240.
243
Paterson, S., D. Mackay, and C. McFarlane. 1994. A Model of organic chemical uptake by plants from soil and the atmosphere. Environ. Sci. Technol. 28:2259-2266.
Petersen, S. O., K. Henriksen, G. K. Mortensen, P. H. Krogh, K. K. Brandt, J. Sorensen, T. Madsen, J. Petersen, and C. Gron. 2003. Recycling of sewage sludge and household compost to arable land: fate and effects of organic contaminants, and impact on soil fertility. Soil Tillage Res. 72:139-152.
Poulsen, T. G., and K. Bester. 2010. Organic micropollutant degradation in sewage sludge during compositing under thermophilic conditions. Environ. Sci. Technol. 44:5086-5091.
Pycke, B. F. G., A. Crabbe, W. Verstraete, and N. Leys. 2010. Characterization of triclosan-resistant mutants reveals multiple antimicrobial-resistance mechanisms Rhodospirillium Rubium S1H. Amer. Soc. Microbiol. 76:3116-3123.
Reiss, R., G. Lewis, and J. Griffin. 2009. An ecological risk assessment for triclosan in the terrestrial environment. Environ. Toxicol. Chem. 28:1546-1556.
Rodricks, J. V., J. A. Swenberg, J. F. Borzelleca, R. R. Maronpot, and A. M. Shipp. 2010. Triclosan: A critical review of the experimental data and development of margins of safety for consumer products. Critical Rev. Toxicol. 40:422-484.
Rojas-Oropeza, M., L. Dendooven, L. Garza-Avendaño, V. Souza, L. Philippot and N. Cabirol. 2010. Effects of biosolids application on nitrogen dynamics and microbial structure in a saline–sodic soil of the former Lake Texcoco (Mexico). Biores. Technol. 101:2491-2498.
Rooklidge, S. J. 2004. Environmental antimicrobial contamination from terraccumulation and diffuse pollution pathways. Sci. Total Environ. 325:1-13.
Rotthauwe, J.H., K.P. Witzel, and W. Liesack. 1997. The ammonia monooxygenase structural gene amoA as a functional marker: molecular fine-scale analysis of natural ammonia-oxidizing populations. Appl. Environ. Microbiol. 63:4704-4712.
Rutgers, M., I. M. van't Verlaat, B. Wind, L. Posthuma, and A. M. Breure. 1998. Rapid method for assessing pollution-induced community tolerance in contaminated soil Environ. Toxicol. Chem.17:2210−2213.
Sabaliunas, D., S. F. Webb, A. Hauk, M. Jacob, and W.S. Eckhoff. 2003. Environmental fate of triclosan in the river Aire basin, UK. Water Res. 37:3145-3154.
Sabourin, L., A. Beck, P. W. Duenk, S. Kleywegt, D. R. Lapen, H. X. Li, C. D. Metcalfe, M. Payne, and E. Topp. 2009. Runoff of pharmaceuticals and personal care products following application of dewatered municipal biosolids to an agricultural field. Sci. Total Environ. 407:4596-4604.

244
Samsoe-Petersen, L., M. Winther-Nielsen, and T. Madsen. 2003. Fate and effects of triclosan. Project 861. Danish Environmental Protection Agency, Copenhagen, Denmark (www2.mst.dk/Udgiv/ publications/2003/87-7972-984-3/pdf/87-7972-985-1.pdf).
SAS institute. 2002. Online doc. Version 9.1.3. SAS Inst., Cary, NC.
Schmitt, H., P. van Beelen, J. Tolls and C.L. van Leeuwen. 2004. Pollution-induced community tolerance of soil microbial communities caused by the antibiotic sulfachloropyridazine. Environ. Sci. Technol. 38:1148-1153.
Schroll, R., B. Bierling, G. Cao, U. Dörfler, M. Lahaniati, T. Langenbach, I. Scheunert, and R. Winkler. 1994. Uptake pathways of organic chemicals from soil by agricultural plants. Chemosphere 28:297-30.
Schroll, R., and I. Scheunert. 1992. A laboratory system to determine separately the uptake of organic chemicals from soil by plants and by leaves after vaporization. Chemosphere 24:97-108.
Schultz, T.W., and G.W. Riggin. 1985. Predictive correlations for the toxicity of alkyl- and halogen-substituted phenols. Toxicol. Lett. 25:47-54.
Schwab, D., and L. G. Heim. 1997. Seedling growth phytotoxicity test. Prepared for Colgate-Palmolive Company. Piscatway, New Jersey, and Ciba-Geigy Corporation, Greensboro (NC). Prepared by ABC laboratories, InC., Columbia (MO). Study 95-005.
Semple, K., A. Morris, and G. Paton. 2003. Bioavailability of hydrophobic organic contaminants in soils: Fundamental concepts and techniques for analysis. Eur. J. Soil Sci. 54:809-818.
Shareef, A., M. J. Angove, and J. D. Wells. 2006. Optimization of silyation of using N-methyl-N-(trimethylsilyl)-trifluoroacetamide, N,O-bis (trimethylsilyl)-trifluoro acetamide and N-(tert-butyldemethylsilyl)-N-methyltrifluoroacetamide for the determination of the estrogens, estrone and 17 alpha-ethinylestradiol by gas chromatography-mass spectrometry. J. Chromatogr. A 1108:121-128.
Sheen, R.T., and H.L. Kahler. 1938. Effects of ions on Mohr method for chloride determination. Ind. Eng. Chem. Anal. 10:628-629.
Shirshova, L.T., E. A. Ghabbour, and G. Davies. 2006. Spectroscopic characterization of humic acid fractions isolated from soil using different extraction procedures. Geoderma 133:204-16.
Simonich, S. L., and R.A. Hites. 1995. Organic pollutant accumulation in vegetation. Environ. Sci. Technol. 29:2905-2914.

245
Singer, H., S. Muller, C. Tixier, and L. Pillonel. 2002. Triclosan: Occurrence and fate of a widely used biocide in the aquatic environment: Field measurements in wastewater treatment plants, surface waters, and lake sediments. Environ. Sci. Technol. 36:4998-5004.
Singh, A., and O.P. Ward. 2004. Biodegradation and Bioremediation. Springer, Berlin, Germany.
Snyder, E. H. 2009. Fate, transport, and risk assessment of biosolids-borne triclocarban (TCC). Ph.D. dissertation. Uni. of Florida, Gainesville, FL. 237 pages.
Snyder, E. H., G. A. O‘Connor, and D. McAvoy. 2010. Fate of 14C-triclocarban in biosolids-amended soils. Sci. Total Environ. 408:2726-2732.
Snyder, E. H., G. A. O‘Connor, and D. McAvoy. 2011 Toxicity and bioaccumulation of biosolids-borne triclocarban (TCC) in terrestrial organisms. Chemosphere 82:460-467.
Stasinakis, A., A. Petalas, D. Mamais, N. Thomaidis, G. Gatidou, and T. Lekkas. 2007. Investigation of triclosan fate and toxicity in continuous-flow activated sludge systems. Chemosphere 68:375-381.
Stephens, J. M. 2009. Mini gardening (Growing vegetables in containers). University of Florida, IFAS extension publication. HS708. Available at http://edis.ifas.ufl.edu/pdffiles/VH/VH03200.pdf, Accessed on Feb, 7, 2011
Stevens, K.J., S. Y. Kim, S. Adhikari, V. Vadapalli , and B. J. Venables. 2009. Effects of triclosan on seed germination and seedling development of three wetland plants: Sesbania herbacea, Eclipta prostrate, and Bidens frondosa. Environ. Toxicol. Chem. 28:2598-2609.
Sullivan, T. S., M. E. Stromberger, M. W. Paschke, and J. A. Ippolito. 2006a. Long-term impacts of in frequent biosolids applications on chemical and microbial properties of a semi-arid rangeland soil. Biol. Fertil. Soil. 42:258-266.
Sullivan, T. S., M. E. Stromberge, and M. W. Paschke. 2006b. Parallel shifts in plant and soil microbial communities in response to biosolids in a semi-arid grassland. Soil Biol. Biochem. 38:449-459.
Suter, G.W. 2007. Ecological Risk Assessment. CRC Press, Boca Raton, Florida.
Suter, G.W., R.A. Efroymson, B.E. Sample, and D.S. Jones. 2000. Ecological risk assessment for contaminated sites. CRC Press, Boca Raton, Florida.
Svenningsen, H., T. Henriksen, A. Prieme, and A. R. Johnsen. 2011. Triclosan affects the microbial community in simulated sewage-drain-field soil and slows down xenobiotic degradation. Environ. Pollut. Available at 10.1016/j.envpol.2011.02.052.

246
Topp, E., S. C. Monteiro, A. Beck, B. Ball-Coelho, A. B. Boxall, and P. W. Duenk. 2008. Runoff of pharmaceuticals and personal care products following application of biosolids to an agricultural field. Sci. Total Environ. 396:52-59.
Trapp, S., and J. C. McFarlane. 1995. Plant Contamination. Modeling and simulation of organic chemical processes. CRC Press, Inc.
Travis, C. C., and A. D. Arms, 1988. Bioconcentration of organics in beef, milk and vegetation. Environ. Sci. Technol. 22:271-292.
Tulp, M. T. M., G. Sundstrom, L. B. J. M. Martron, and O. Hutzinger. 1979. Metabolism of chlorodiphenyl ethers and Irgasan DP 300. Xenobiotica 9:65-77.
Turpin, K. M., D. R. Lapen, M. J. Robin, E. Topp, M. Edwards, W. E. Curnoe, G. C. Topp, N. B. McLaughlin, B. Ball Coelho, and M. Payne. 2007. Slurry-application implement time modification of soil hydraulic properties under different soil water content conditions for silt-clay loam soils. Soil Tillage Res. 95:120-32.
United State Geological Survey (USGS). 2008. Household chemicals and drugs found in biosolids from wastewater treatment plants toxic substances hydrology program. Available from http://toxics.usgs.gov/highlights/biosolids.html, Accessed on February 14, 2009.
United States Environmental Protection Agency (USEPA). 1984. Calculation of precision, bias, and method detection limit for chemical and physical measurements. Office of research and development, USEPA, Washington, D.C. 20460.
United States Environmental Protection Agency (USEPA). 1991. Interagency policy on beneficial use of municipal sewage sludge on federal land; notice. Fed Regist 56:30448-30450.
United States Environmental Protection Agency (USEPA). 1993a. Determination of nitrate-nitrite by automated colorimetry, EPA Method 353.2 (Revision 2.0). Methods for the determination of inorganic substances in environmental samples. EPA/600/R-93/100. USEPA, Cincinnati, Ohio.
United States Environmental Protection Agency (USEPA). 1993b. Determination of ammonia nitrogen by semi-automated colorimetry, EPA Method 350.1 (Revision 2.0). Methods for the determination of inorganic substances in environmental samples. EPA/600/R-93/100. USEPA, Cincinnati, Ohio.
United States Environmental Protection Agency (USEPA). 1993c. Wildlife Exposure Factors Handbook. EPA/600/R-93/187. USEPA, Washington, DC.
United States Environmental Protection Agency (USEPA). 1995. A Guide to the Biosolids Risk Assessments for the EPA Part 503 Rule. EPA/832-B-93-005. USEPA, Washington, DC.
247
United States Environmental Protection Agency (USEPA). 1996a. Product properties test guidelines, OPPTS 830.7840, Water solubility: column elution method; shake flask. OPPTS, Washington, D.C.
United States Environmental Protection Agency (USEPA). 1996b. Product properties test Guidelines, OPPTS 850.6200, earthworm sub-chronic toxicity test. OPPTS, Washington, D.C.
United States Environmental Protection Agency (USEPA). 1996c. Product properties test guidelines, OPPTS 850.5100, Soil microbial community toxicity test. OPPTS, Washington, D.C.
United States Environmental Protection Agency (USEPA). 1997. Exposure factors handbook. National Center for Environmental Assessment, Office of Research and Development, Washington, DC.
United States Environmental Protection Agency (USEPA). 1998. Fate, transport and transformation test guidelines, OPPTS 835.3300. Soil biodeg. OPPTS, Washington, D.C.
United States Environmental Protection Agency (USEPA). 1999. Category for persistent, bioaccumulative, and toxic new chemical substances. http://www.epa.gov/fedrgstr/EPA-TOX/1999/November/Day-04/t28888.htm ,Accessed on Jan 20, 2010.
United States Environmental Protection Agency (USEPA). 2008a. Fate, transport and transformation test guidelines, OPPTS 835.1240. Leaching studies. OPPTS, Washington, D.C.
United States Environmental Protection Agency (USEPA). 2008b. Reregistration eligibility decision (RED) for triclosan. Office of Prevention, Pesticides, and Toxic Substances (OPPTS). USEPA, Cincinnati, Ohio.
United States Environmental Protection Agency (USEPA), 2009a. Targeted National Sewage Sludge Survey Sampling and Analysis Technical Report ("Technical Report", EPA-822-R-08-016). USEPA, Washington, D.C.
United States Environmental Protection Agency (USEPA), 2009b. Estimation Programs Interface Suite™ for Microsoft® Windows, v 3.20. United States Environmental Protection Agency, Washington, DC, USA.
Ura, K., T. Kai, S. Sakata, T. Iguchi, and K. Arizono. 2002. Aquatic acute toxicity testing using the nematode Caenorhabditis elagans, J. Health Sci. 48:583-586.
Valo, R., and M. Salkinoja-Salonen. 1986. Microbial transformation of polychlorinated phenoxy phenols. J. Gen. Appl. Microbiol. 32:505-517.

248
Veldhoen, N., R. C. Skirrow, H. Osachoff, H. Wigmore, D.J. Clapson, M.P. Gunderson, G. Van Aggelen, and C.C. Helbing. 2006. The bactericidal agent triclosan modulates thyroid hormone-associated gene expression and disrupts postembryonic anuran development. Aquatic Toxicol. 80:217-227.
Waller, N. J., and R. S. Kookana. 2009. Effect of triclosan on microbial activity in Australian soils. Environ. Toxicol. Chem. 28:65-70.
Walters, E., K. McClellan and R. U. Halden. 2010. Occurrence and loss over three years of 72 pharmaceuticals and personal care products from biosolids-soil mixtures in outdoor mesocosms. Water Res. 44:6011-6020.
Wang, L.-Q., C.N. Falany, and M.O. James. 2004. Triclosan as a substrate and inhibitor of 3'-phosphoadenosine 5'-phosphosulfate-sulfotransferase and udp-glucuronosyl transferase in human liver fractions. Drug Metab. Dispos. 32:1162-1169.
Webster, E., and D. Mackay. 2007. Modeling the fate of contaminants introduced into agricultural soils from biosolids: BASL4 model: users' manual report to environment Canada. CEMC Report No. 200702 Trent University, Peterborough, Ontario.
Wezel, A. P., and T. Jager. 2002. Comparison of two screening level risk assessment approaches for six disinfectants and pharmaceuticals. Chemosphere 47:1113-1128.
Wild, S. R. and K. C. Jones. 1991. Organic Contaminants in Wastewaters and Sewage Sludges: Transfer to the Environment Following Disposal. In: K.C. Jones (Ed.), Organic Contaminants in the Environment, Environmental Pathways and Effects, Elsevier, 1991.
Wild, S. R., and K. C. Jones. 1992. Organic chemicals entering agricultural soils in sewage sludges: screening for their potential to transfer to crop plants and livestock. Sci. Total Environ. 199:85-119.
Wu, C., A. L. Spongberg, and J. D. Witter. 2009. Adsorption and degradation of triclosan and triclocarban in soils and biosolids-amended soils. J. Agric. Food Chem. 57:4900-4905.
Wu, C., A. L. Spongberg, J. D. Witter, M. Fang, and K. P. Czakowski. 2010. Uptake of pharmaceutical and personal care products by soybean plants from soils amended with biosolids and irrigated with contaminated water. Environ. Sci. Technol. 44:6157-6161.
Xia, K. 2010. Organic compounds of emerging concern in biosolids and biosolids-applied soils: occurrence, accumulation, and transformation. W2170 presentation, June 2010.
249
Xia, K., L. S. Hundal, K. Kumar, K. Armbrust, A. E. Cox, and T. C. Granato. 2010. Triclocarban, triclosan, polybrominated diphenyls ethers, and 4-nonylphenol in biosolids and in soil receiving 33-year biosolids application. Environ. Toxicol. Chem. 29:597-605.
Xu, J., L. S. Wu, and A. C. Chang. 2009. Degradation and adsorption of selected pharmaceuticals and personal care products (PPCPs) in agricultural soils. Chemosphere 77:1299-1305.
Yang, L.-H., G.-G. Ying, H.-C. Su, J. L. Stauber, M. S. Adams, and M. T. Binet. 2008. Growth-inhibting effects of 12 antibacterial agents and their mixtures on the freshwater microalga Pseudokirchneriella subcapitata. Environ.Toxicol. Chem. 27:1201-1208.
Yaron, B., R. Calvet, and R. Prost. 1996. Soil pollution, processes and dynamics. Springer, Heidelberg, Germany.
Ye, X., Z. Kuklenyik, L. L. Needham, and A. M. Calafat. 2005. Automated on-line column-switching HPLC-MS/MS method with peak focusing for the determination of nine environmental phenols in urine. Anal. Chem. 77:5407-5413.
Ying, G.-G., and R.S. Kookana. 2007. Triclosan in wastewaters and biosolids from Australian wastewater treatment plants. Environ. Int. 33:199-205.
Ying, G.-G., X.-Y. Yu, and R. S. Kookana. 2007. Biological degradation of triclocarban and triclosan in a soil under aerobic and anaerobic conditions and comparison with environmental fate modeling. Environ. Pollut. 150:300-305.
Young, T. 2011. Triclosan, triclocarban (and other trace organics) in biosolids. CWEA Biosolids Workshop Jan 2011.
Yu, Y. L., X. M. Wu, S. N. Li, H. Fang, Y. J. Tan, J. Q. Yu. 2005. Bioavailability of butachlor and myclobutanil residues in soil to earthworms. Chemosphere 59:961-967.
Zerzghi, H., C. P. Gerba, and I. L. Pepper. 2010a. Long-term effects of land application of class B biosolids on soil chemical properties. J. Res. Sci. Technol. 7:51–61.
Zerzghi, H., J. P. Brooks, C. P. Gergba, and I. L. Pepper. 2010b. Influence of long-term land application of class B biosolids on soil bacterial diversity. J. Applied Microbol. 109:698-706.
Zhao, F. 2006. Biodegradation of triclosan by a triclosan-degrading isolate and an ammonia-oxidizing bacterium. Master of Science Thesis, Texas A&M University.

250
BIOGRAPHICAL SKETCH
Manmeet Waria was born in the beautiful state of Punjab (India), and is the
youngest of the 3 three sisters with a younger brother. She received a Bachelor of
Science (Hons.) in agriculture from Punjab Agricultural University in India and moved to
U.S. in 2005. She obtained a Master of Science in environmental soil science from
University of Nebraska, Lincoln in 2007. In the spring of 2008, she moved to sunny
Florida and joined Ph.D. in the Soil and Water Science Department and graduated in
spring 2011. She is a married woman and along with her Veterinarian husband, she
dreams to travel the world.