Embed Size (px)
Citation preview
International Journal of Pure and Applied Science
Published by Cambridge Research and Publications
IJPAS ISSN-2743-6264 (Print) 185
Vol. 21 No.9
June, 2021.
FATIGUE ANALYSIS OF MARINE ELECTRICAL
SIGNAL CARRYING CYLINDRICAL TUBE
(UMBILICAL): A CASE STUDY OF DEEP-OFFSHORE
WEST AFRICA
*CHIEGBOKA JOSEPH EZEILO; **NDUBUISI OLUCHUKWU
NWOSU, *Department of Electrical Electronics Engineering, Federal Polytechnic Oko.
**Department of Electrical Electronics Engineering, Federal Polytechnic Oko.
ABSTRACT
The Subsea umbilical is being used increasingly in turbulent harsh
environments that requires its mechanical features to be subjected to the axial
symmetrical loads that will be discussed. To ascertain the mechanical behavior
of umbilical with multiple layers, a theoretical model is presented in this
conference paper. The feature of the umbilical cross section in the model is a
large-diameter central tube. The contact problem between two adjacent layers
contains deformation compatibility of the contact surface. The principle of
virtual work is applied in the theoretical model to formulate the governing
nonlinear equations and the contact conditions are introduced into the principle
of virtual work. The analysis shows greater highest maxima Force ‘F’ values
for Ochi-Hubble as against JONSWAP. From the foregoing, this work shows
that using a JONSWAP based umbilical design on an Ochi-Hubble environment
like Offshore West Africa shows higher ocean current at the near surfaces
which consequently leads a higher tendency for fatigue damage in the future
and hence it should be properly taken into consideration in umbilical design for
Deep-Offshore West Africa. In addition, the theoretical model is used for the
assessment of other important parameters, such as the effects of internal
pressure, lay angle and diameter-to-thickness ratio on mechanical behavior of
umbilical, which are helpful for the design process of umbilical.
INTRODUCTION
The Subsea umbilical is defined as a device that provides a communication and
control link between the subsea system and surface vessel in subsea oil and gas
International Journal of Pure and Applied Science
Published by Cambridge Research and Publications
IJPAS ISSN-2743-6264 (Print) 186
Vol. 21 No.9
June, 2021.
exploitation field developments. It normally consists of various functional lines
for hydraulic, electrical power and signal transmission such as hydraulic tubes,
electric cables, optical fibers, etc. Each field development demands a unique
umbilical design. In offshore application, the umbilical is always subjected to
axisymmetric loads such as tension, torsion and internal pressure, etc., no matter
under the installation or operation conditions. The prediction of the mechanical
behavior of the umbilical in deep water under the axisymmetric loads with an
acceptable accuracy is very important for the installation and operation design.
Several assumptions were made in the theoretical methods developed up to date
for predicting the behavior of umbilical under axisymmetric loads. In the initial
model developed by Hruska (1951, 1953, 1952), the wires in the model were
assumed to be subjected to pure tensile forces (no moments). Later, a model of
multi-strand wire ropes was developed for obtaining wire stress, and the
interlayer pressure under tension and torsion. In a 7 x 1 single strand model
(Machida and Durelli, 1973) accounted for the moments in helices and gave
explicit expressions of axial force, bending and twisting moments for the helical
wires. Knapp (1979, 1975) used the well-known energy method to derive a new
stiffness matrix and considered the compressibility and material nonlinearity of
the core element in helical armored cable under coupled tension and torsion.
(Costello and Phillips (1976)) treated the cables as groups of separate curved
rods based on Love’s theory (Love, 1944) and gave a rigorous derivation. Fere
and Bournazel (1987) gave simple formulas to calculate the stress and the
contact pressure between layers due to axisymmetric load. Witz and Tan (1992)
considered the umbilical or flexible pipe as two basic components: cylindrical
elements and helical elements. The continuity of interface pressure and helical
radius was considered to assemble all equilibrium equations. Kumar and Botsis
(2001) tried to experimentally test the validity of the deformation derivation
results earlier obtained for multilayered wire rope strands with metallic core.
Sævik and Li (2013) investigated the validity range of formulation of theoretical
models for torsion and curvature due to both axisymmetric loads and bending.
Numerical method can avoid the restrictions of theoretical method such as
uniform distribution of contact pressure between layers and ignoring the
friction. Custódio and Vaz (2002) presented a finite element formulation and
applied the principle of virtual work, as well as solving the Jacobi matrix by
International Journal of Pure and Applied Science
Published by Cambridge Research and Publications
IJPAS ISSN-2743-6264 (Print) 187
Vol. 21 No.9
June, 2021.
Newton’s method for the umbilical model. The model considers a number of
features, such as material nonlinearity, gap formation and interface contact.
ISO 13628-5 ‘Subsea umbilicals’ /1/ is the main reference for design and load
effect analysis of umbilicals. This design code states that umbilicals exposed to
ocean currents shall be designed to withstand fatigue loading from Vortex
Induced Vibrations (VIV). VIV response analysis shall be conducted for the
following scenarios /1/:
Fatigue analyses of umbilicals in dynamic service
Fatigue analyses of umbilicals during installation operations
Assessment of need for VIV suppression devices
Assessment of effect of VIV on drag coefficients to be applied in global
analyses and interference analyses
• Fatigue analyses of free spans of umbilicals in static service.
The following requirements are given to the VIV load effect analysis
methodology /1/:
• VIV analysis software for risers and pipelines may be applied
• Due regard shall be given to the structural properties of umbilicals
• Umbilical specific stiffness and structural damping shall be accounted
for.
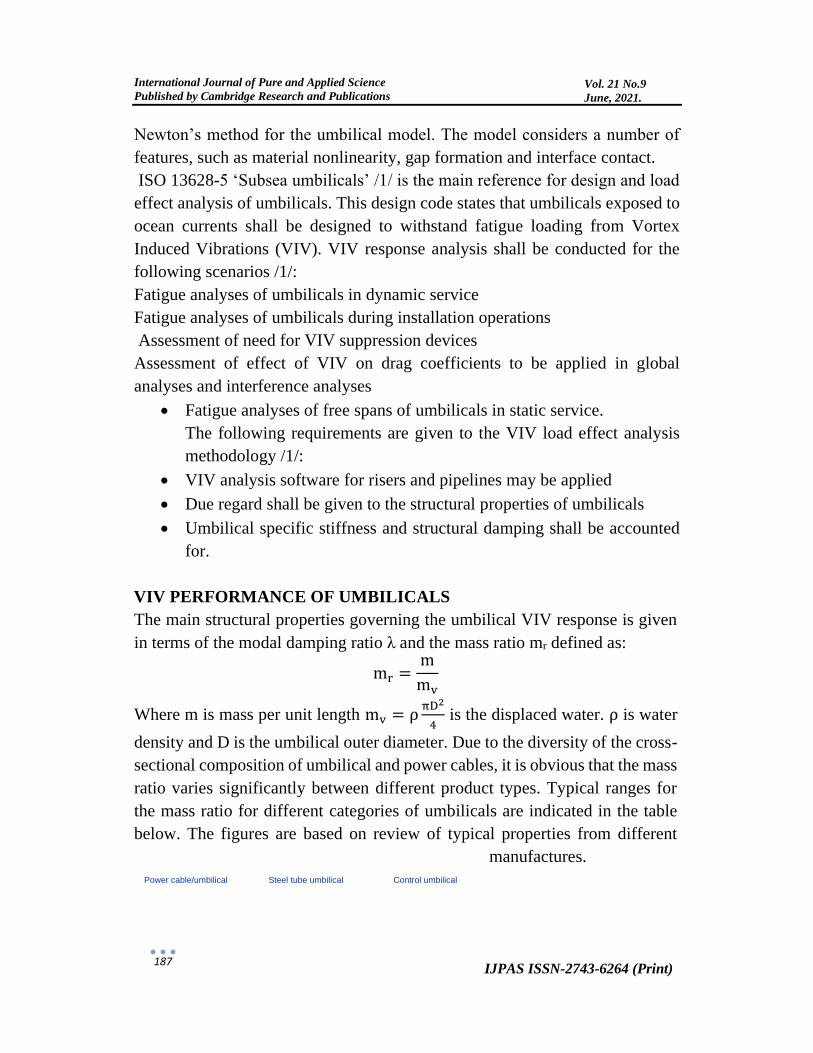
VIV PERFORMANCE OF UMBILICALS
The main structural properties governing the umbilical VIV response is given
in terms of the modal damping ratio λ and the mass ratio mr defined as:
mr =m
mv
Where m is mass per unit length mv = ρπD2
4 is the displaced water. ρ is water
density and D is the umbilical outer diameter. Due to the diversity of the cross-
sectional composition of umbilical and power cables, it is obvious that the mass
ratio varies significantly between different product types. Typical ranges for
the mass ratio for different categories of umbilicals are indicated in the table
below. The figures are based on review of typical properties from different
manufactures.
Power cable/umbilical Steel tube umbilical Control umbilical
International Journal of Pure and Applied Science
Published by Cambridge Research and Publications
IJPAS ISSN-2743-6264 (Print) 188
Vol. 21 No.9
June, 2021.
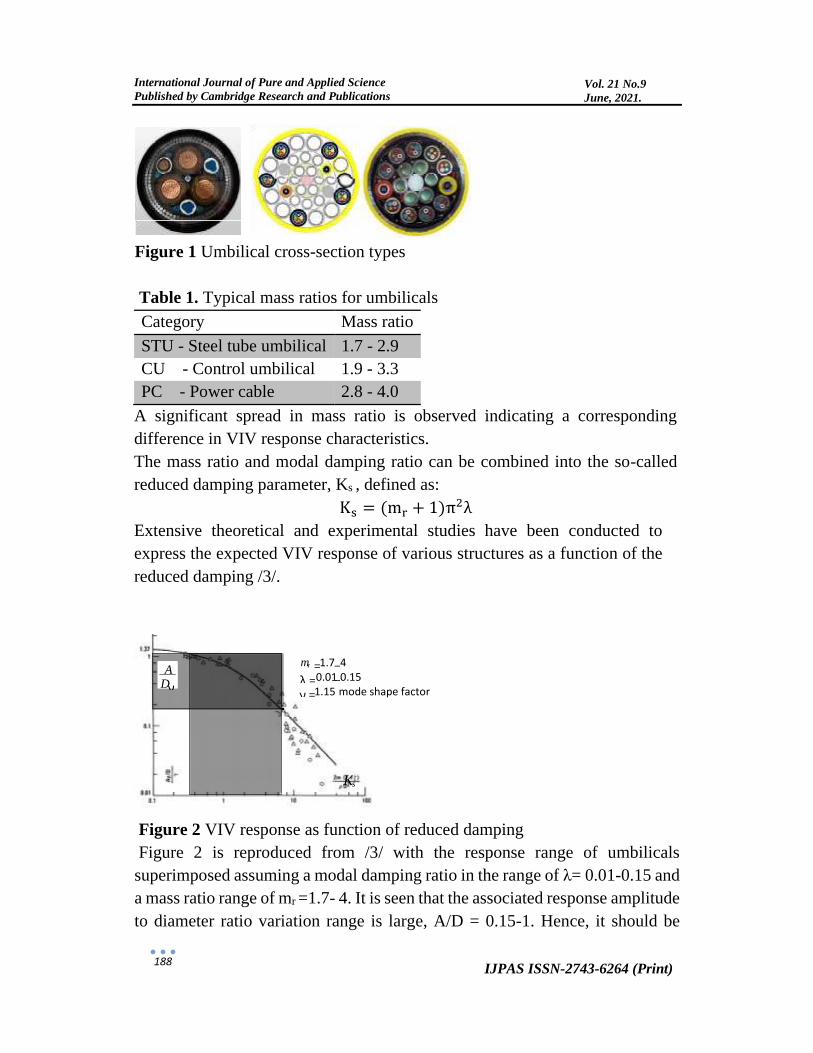
Figure 1 Umbilical cross-section types
Table 1. Typical mass ratios for umbilicals
Category Mass ratio
STU - Steel tube umbilical 1.7 - 2.9
CU - Control umbilical 1.9 - 3.3
PC - Power cable 2.8 - 4.0
A significant spread in mass ratio is observed indicating a corresponding
difference in VIV response characteristics.
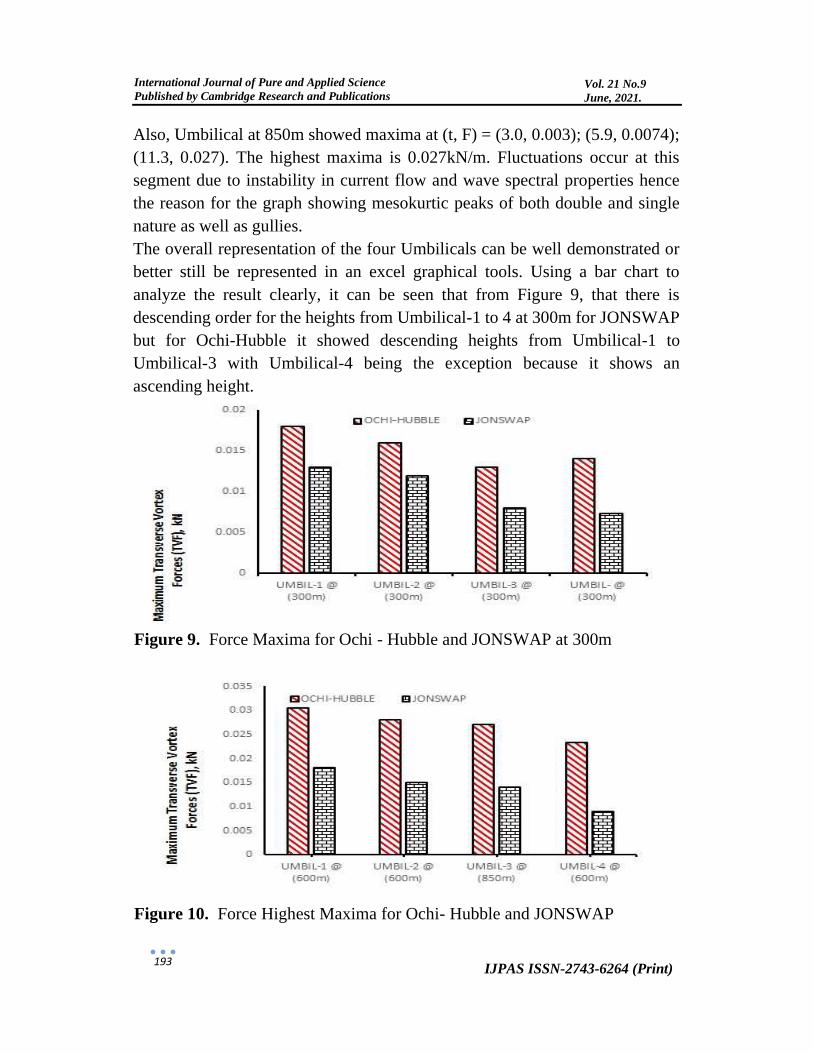
The mass ratio and modal damping ratio can be combined into the so-called
reduced damping parameter, Ks , defined as:
Ks = (mr + 1)π2λ
Extensive theoretical and experimental studies have been conducted to
express the expected VIV response of various structures as a function of the
reduced damping /3/.
Figure 2 VIV response as function of reduced damping
Figure 2 is reproduced from /3/ with the response range of umbilicals
superimposed assuming a modal damping ratio in the range of λ= 0.01-0.15 and
a mass ratio range of mr =1.7- 4. It is seen that the associated response amplitude
to diameter ratio variation range is large, A/D = 0.15-1. Hence, it should be
γ D A
1.15 mode shape factor 0.01 0.15 1.7 4
= = −
− =
γ λ
r m
s K

International Journal of Pure and Applied Science
Published by Cambridge Research and Publications
IJPAS ISSN-2743-6264 (Print) 189
Vol. 21 No.9
June, 2021.
expected that the VIV response of umbilicals will vary significantly depending
on the cross-sectional mechanical properties. Consistent analysis methodology
accounting for the cross-sectional mechanical properties is therefore essential
for prediction of the VIV response of umbilicals.
MATERIALS AND METHODS
Umbilical Material Properties
An Umbilical design data with a design life of 30years for an FPSO in Offshore
West Africa was collated. The data below were entered into OrcaFlex software
interface include: Outer diameter nominal – 200mm, Umbilical Minimum
Bending Radius (MBR Operational) – 12m, Bending Stiffness- 2.68 x 10⁴ Nm2,
Axial Stiffness- 4.62 x 10⁸ N, Torsional Stiffness - 2.06 x 10⁴ Nm2.
The general design criteria considered were the following environmental data:
Design water depth- 2000m, Seabed Temperature +5oC, Sea surface
Temperature + 40oC.
The lengths of the four (4) Umbilicals are: Umbilical-1 - 3044m, Umbilical-2 -
3215m, Umbilical-3 - 4481m and Umbilical-4 - 2873m.
From design data, buoyancy modules were applied from section length 1379.7m
to 1479.7m for each umbilical. Relevant material data were imputed on the
OrcaFlex software as shown in the Figure 3.
MetOcean Data
MetOcean data for Offshore West Africa including water depth, current factor,
rotation, near-surfaces and near-bottom current speed and direction were
imputed into the OrcaFlex platform for both JONSWAP and Ochi-Hubble wave
spectra.
Another metOcean data involving the near-bottom surface current velocity
versus simulation time variation showed 0, 0.103, 0.206, 0.309, 0.412, and
0.514m/s velocity for 0, 2, 4, 6, 8, and 10s simulation time, respectively
Methods
The Umbilical material characteristics and metOcean data were inputted into
the OrcaFlex 8.4a7 [12] software platform and simulated using the Milan wake
oscillator model for Force. Results were obtained for the Transverse Vortex
Force (F) at different sections for both Ochi-Hubble and JONSWAP wave
spectra.

International Journal of Pure and Applied Science
Published by Cambridge Research and Publications
IJPAS ISSN-2743-6264 (Print) 190
Vol. 21 No.9
June, 2021.
Figure 3. Typical Umbilical Material Description on OrcaFlex Interface
Discussion
Jonswap Wave Spectra
Data extracted from Figure 4, Figure 5 and the other metOcean data involving
the near-bottom surface current velocity versus simulation time variation were
inputted into the environment and variable data section of the OrcaFlex
platform.
Depth, m
0
0.2
0.4
0.6
0.8
1
0
50
100
150
200
250
300
0 2 4 8 10 13 16 18.288
Rotation(deg) Factor

International Journal of Pure and Applied Science
Published by Cambridge Research and Publications
IJPAS ISSN-2743-6264 (Print) 191
Vol. 21 No.9
June, 2021.
Figure 4. Current Factor and Angle of rotation for various water depths as
simulated on OrcaFlex
Figure 5. Near Surface Current velocity and Direction versus simulation time
For JONSWAP wave spectra the following result was obtained for F;
Figure 6. TVF- time graph of Umbilical at 300m (Near Surface Current)
At Umbilical length 300m, 600m, the Force - time plot showed maxima at (t, F)
= (8.0, 0.0115); (14.1; 0.013) and (8.0, 0.018); (14.6, 0.0175). The highest
maximum is 0.013kN/m and 0.018kN/m. No values exist for the minimum since
it is negative. Fluctuations occur at this segment due to instability in current
flow and wave spectral properties hence the reason for the graph showing
0
50
100
150
200
250
300
350
0 2 4 6 8 10 12 14 16
Simulation time, s
Direction(deg) Velocity(m/s)
0.015
0.01
0.005
0
-0.005
-0.01
-0.015 -5 0 5 10
Time (s) 15

International Journal of Pure and Applied Science
Published by Cambridge Research and Publications
IJPAS ISSN-2743-6264 (Print) 192
Vol. 21 No.9
June, 2021.
mesokurtic peaks of both double and single nature as well as flat sags and
gullies.
For the JONSWAP spectra analysis, the results of Figure 6, at 300m showed
double-peak while at 600m and 850m, showed single peak. But significantly as
we go down in depth for the four umbilicals at 600m and 850m, there is shown
a return to single peak which is the normal JONSWAP model. This shows that
as we go deeper the adjustment of the peakedness parameter to suit Offshore
West Africa Ochi-Hubble environment loses its applicability and tends to revert
back to the natural wave spectra of this region.
Ochi-Hubble Wave Spectra
Raw data from Figure 4, Figure 5 and the other metOcean data involving the
near-bottom surface current velocity versus simulation time variation were
imputed into the environment and variable data section of the OrcaFlex
platform. For Ochi-Hubble wave spectra the following results were obtained for
Force;
Figure 7. Force time graph of Umbilical-1 at 300m (Near Surface Current)
Umbilical at length 300m and 600m showed maxima at (t, F) = (4.0, 0.006);
(11.1, 0.018) and (3.8, 0.004); (5.6, 0.0075); (11.2, 0.0305). The highest
maximum is 0.018kN and 0.0305kN/m. No minimum value exists. Fluctuations
occur at this segment due to instability in current flow and wave spectral
properties hence the reason for the graph showing mesokurtic peaks of both
double and single nature as well as flat sags and gullies.
0.02
0.01
0
-0.005
-5 0 5 10 Time (s)
15
0.015
0.005
-0.01
-0.015
International Journal of Pure and Applied Science
Published by Cambridge Research and Publications
IJPAS ISSN-2743-6264 (Print) 193
Vol. 21 No.9
June, 2021.
Also, Umbilical at 850m showed maxima at (t, F) = (3.0, 0.003); (5.9, 0.0074);
(11.3, 0.027). The highest maxima is 0.027kN/m. Fluctuations occur at this
segment due to instability in current flow and wave spectral properties hence
the reason for the graph showing mesokurtic peaks of both double and single
nature as well as gullies.
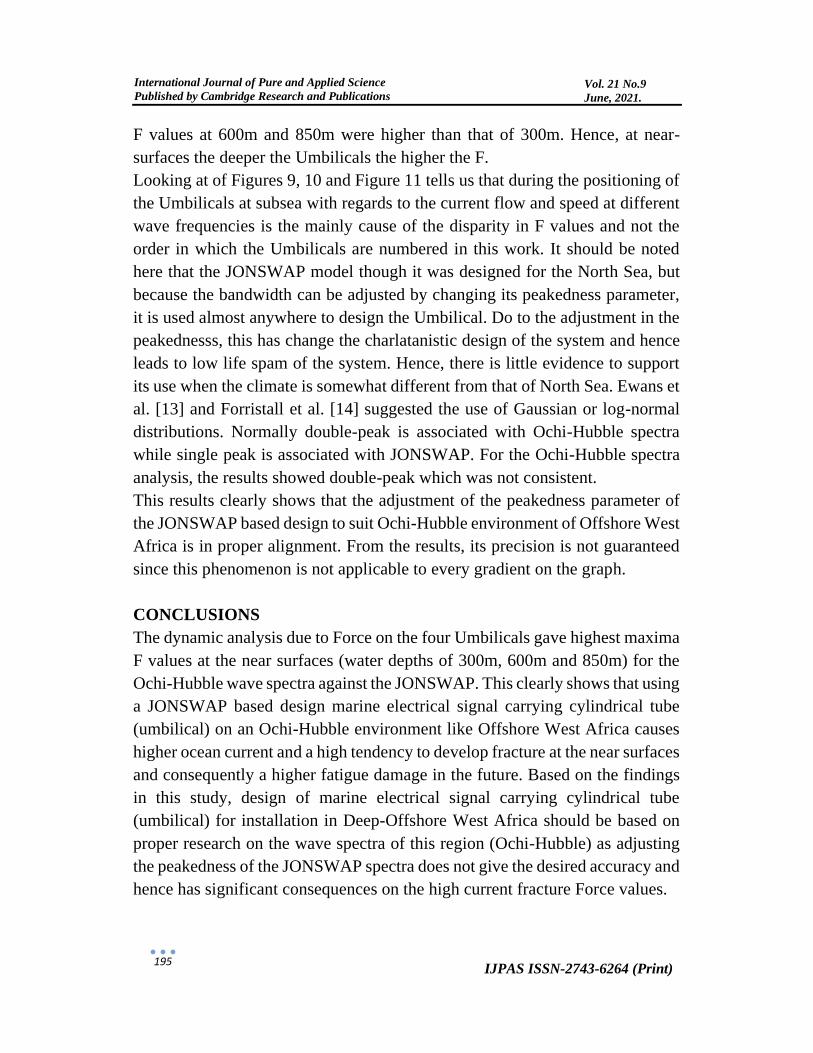
The overall representation of the four Umbilicals can be well demonstrated or
better still be represented in an excel graphical tools. Using a bar chart to
analyze the result clearly, it can be seen that from Figure 9, that there is
descending order for the heights from Umbilical-1 to 4 at 300m for JONSWAP
but for Ochi-Hubble it showed descending heights from Umbilical-1 to
Umbilical-3 with Umbilical-4 being the exception because it shows an
ascending height.
Figure 9. Force Maxima for Ochi - Hubble and JONSWAP at 300m
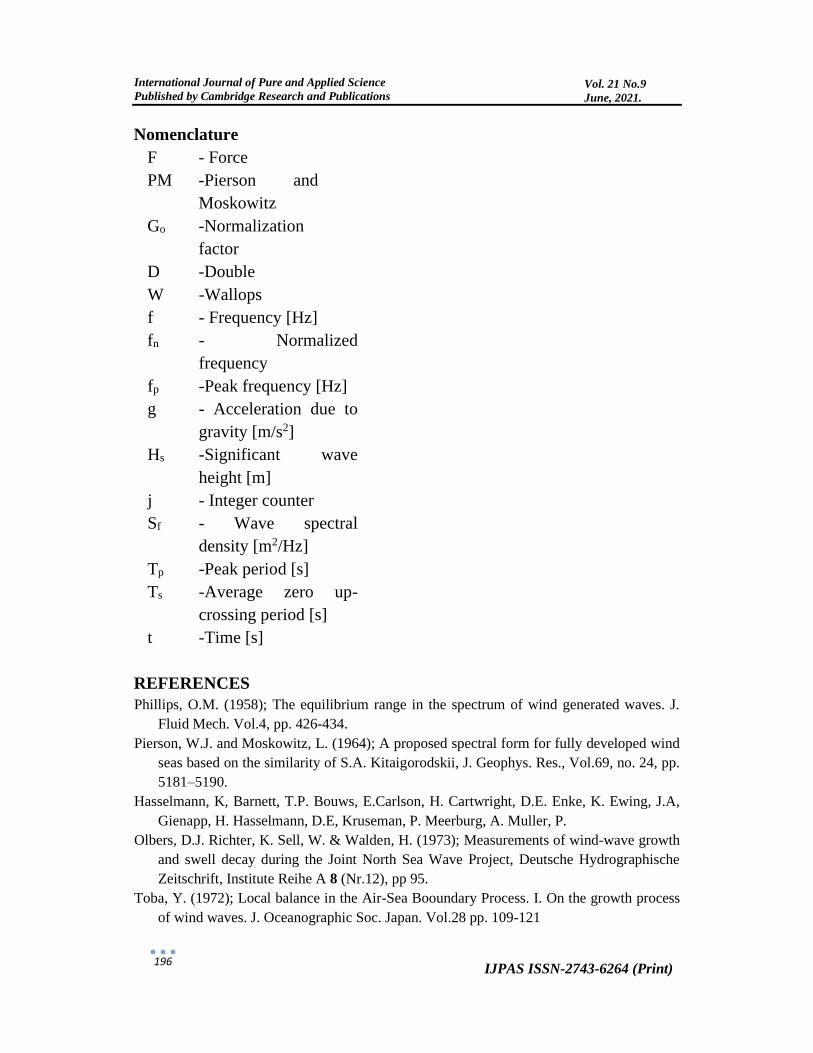
Figure 10. Force Highest Maxima for Ochi- Hubble and JONSWAP

International Journal of Pure and Applied Science
Published by Cambridge Research and Publications
IJPAS ISSN-2743-6264 (Print) 194
Vol. 21 No.9
June, 2021.
Also, Figure 10 equally shows the highest maxima Force values for Umbilical-
1 (600m), Umbilical-2 (600m), Umbilical- 3 (850m), and Umbilical-4 (600m)
for both wave spectra. It can be clearly seen that the bar chart shows heights in
descending order for Ochi Hubble and JONSWAP. Hence, the Force values
decrease steadily from Umbilical-1 through Umbilical-4. From this Figure 10
Umbilical-1 showed the maximum Force while Umbilical-4 showed the
minimum.
Figure 11. Force Maxima for Ochi- Hubble and JONSWAP
From the Orcaflex result conducted, from the wave spectra analysis of
Umbilicals 1 to 4, the results for JONSWAP and Ochi-Hubble were shown.
Umbilical-1, Umbilical-2 and Umbilical-4 at arc length 300m and 600m gave
highest maxima F values for 0.013kN and 0.018kN; 0.012kN and 0.0149kN;
0.0074kN and 0.0086kN, respectively. Umbilical-3 at 300m and 850m gave
0.008kN and 0.014kN. It can be seen that the F values at 600m and 850m were
higher than that of 300m. Hence, at near- surfaces the deeper the Umbilicals are
from the FPSO the higher the F. Similarly, for the Ochi-Hubble spectra results,
Umbilical-1, Umbilical-2 and Umbilical-4 at arc length 300m and 600m gave
highest maxima F values for 0.018kN and 0.0305kN; 0.016kN and 0.028kN;
0.0141kN and 0.0232kN, respectively. Umbilical-3 at 300m and 850m gave
0.013kN and 0.027kN. Also, as the case of JONSWAP, it can be seen that the
International Journal of Pure and Applied Science
Published by Cambridge Research and Publications
IJPAS ISSN-2743-6264 (Print) 195
Vol. 21 No.9
June, 2021.
F values at 600m and 850m were higher than that of 300m. Hence, at near-
surfaces the deeper the Umbilicals the higher the F.
Looking at of Figures 9, 10 and Figure 11 tells us that during the positioning of
the Umbilicals at subsea with regards to the current flow and speed at different
wave frequencies is the mainly cause of the disparity in F values and not the
order in which the Umbilicals are numbered in this work. It should be noted
here that the JONSWAP model though it was designed for the North Sea, but
because the bandwidth can be adjusted by changing its peakedness parameter,
it is used almost anywhere to design the Umbilical. Do to the adjustment in the
peakednesss, this has change the charlatanistic design of the system and hence
leads to low life spam of the system. Hence, there is little evidence to support
its use when the climate is somewhat different from that of North Sea. Ewans et
al. [13] and Forristall et al. [14] suggested the use of Gaussian or log-normal
distributions. Normally double-peak is associated with Ochi-Hubble spectra
while single peak is associated with JONSWAP. For the Ochi-Hubble spectra
analysis, the results showed double-peak which was not consistent.
This results clearly shows that the adjustment of the peakedness parameter of
the JONSWAP based design to suit Ochi-Hubble environment of Offshore West
Africa is in proper alignment. From the results, its precision is not guaranteed
since this phenomenon is not applicable to every gradient on the graph.
CONCLUSIONS
The dynamic analysis due to Force on the four Umbilicals gave highest maxima
F values at the near surfaces (water depths of 300m, 600m and 850m) for the
Ochi-Hubble wave spectra against the JONSWAP. This clearly shows that using
a JONSWAP based design marine electrical signal carrying cylindrical tube
(umbilical) on an Ochi-Hubble environment like Offshore West Africa causes
higher ocean current and a high tendency to develop fracture at the near surfaces
and consequently a higher fatigue damage in the future. Based on the findings
in this study, design of marine electrical signal carrying cylindrical tube
(umbilical) for installation in Deep-Offshore West Africa should be based on
proper research on the wave spectra of this region (Ochi-Hubble) as adjusting
the peakedness of the JONSWAP spectra does not give the desired accuracy and
hence has significant consequences on the high current fracture Force values.
International Journal of Pure and Applied Science
Published by Cambridge Research and Publications
IJPAS ISSN-2743-6264 (Print) 196
Vol. 21 No.9
June, 2021.
Nomenclature
F - Force
PM -Pierson and
Moskowitz
Go -Normalization
factor
D -Double
W -Wallops
f - Frequency [Hz]
fn - Normalized
frequency
fp -Peak frequency [Hz]
g - Acceleration due to
gravity [m/s2]
Hs -Significant wave
height [m]
j - Integer counter
Sf - Wave spectral
density [m2/Hz]
Tp -Peak period [s]
Ts -Average zero up-
crossing period [s]
t -Time [s]
REFERENCES
Phillips, O.M. (1958); The equilibrium range in the spectrum of wind generated waves. J.
Fluid Mech. Vol.4, pp. 426-434.
Pierson, W.J. and Moskowitz, L. (1964); A proposed spectral form for fully developed wind
seas based on the similarity of S.A. Kitaigorodskii, J. Geophys. Res., Vol.69, no. 24, pp.
5181–5190.
Hasselmann, K, Barnett, T.P. Bouws, E.Carlson, H. Cartwright, D.E. Enke, K. Ewing, J.A,
Gienapp, H. Hasselmann, D.E, Kruseman, P. Meerburg, A. Muller, P.
Olbers, D.J. Richter, K. Sell, W. & Walden, H. (1973); Measurements of wind-wave growth
and swell decay during the Joint North Sea Wave Project, Deutsche Hydrographische
Zeitschrift, Institute Reihe A 8 (Nr.12), pp 95.
Toba, Y. (1972); Local balance in the Air-Sea Booundary Process. I. On the growth process
of wind waves. J. Oceanographic Soc. Japan. Vol.28 pp. 109-121

International Journal of Pure and Applied Science
Published by Cambridge Research and Publications
IJPAS ISSN-2743-6264 (Print) 197
Vol. 21 No.9
June, 2021.
Phillips, O., M. (1984); Spectral and statistical properties of the equilibrium range in wind
generated gravity waves. J. Fluid Mech Vol.156 pp 505-531.
Bretschneider, (1958); Revision in forecasting: Deep and shallow water proc. Int. conf. coastal
Eng. ASCE 6th pp. 30-67.
Ochi, M.K., Hubble, E.N. (1976); On six-parameters wave Spectra, Proc. 15th Coastal Eng.
Conf. Vol. 1, pp. 301-328.
Massel, S.R. (1996); Ocean Surface Waves, their Physics and Prediction, World Scientific.
Advance Series of Ocean Eng. Conf. Vol. 11, pp 491-508
Hasselmann, K., Ross, D.B., M¨uller, P. and Sell, W. (1976); A parametric wave prediction
model, J. Phys. Oceanogr., Vol. 6, no. 2, pp. 200–228.
Quiniou-Ramus, V., Hoche, M.A., Francois, M., Nerzic, R., Ledoux, A., Orsero, M.
(2003); Recent Breakthroughs in the Analysis of Total E&P Angola Block 17
wind/wave/current records and their impact on floating structures design, Proc. XVth
Deep Offshore Technology Conf., DOT, Marseilles.
OrcaFlex 8.4a7 (2003); Orcina Ltd, Daltongate, Ulverston, Cumbria UK.
Ewans, K., Forristall, G.Z., Olagnon, M. and Prevosto, M. (2013); Response sensitivity to
swell spectra off West Africa, Proc. 32nd Int. Ocean, Offshore and Arctic Eng. Conf.,
OMAE pp.2013-11252.
Forristall, G.Z., Ewans, K., Olagnon, M. and Prevosto, M. (2013); The West Africa Swell
Project (WASP), Proc. 32nd Int. Ocean, Offshore and Arctic Eng. Conf., OMAE. pp.
2013-11264.
ISO 13628-5 ‘Subsea umbilicals’ , 2009
Shear 7 Version 4.5
Blevins, R D ‘Flow Induced Vibration’,2nd edition, Krieger Publishing Company, 2001
Sødahl, N, Skeie G, Steinkjer, O, Kalleklev A J, ‘Efficient Fatigue analysis of helix elements
in umbilicals and flexible risers’, OMAE 2010, Shanghai
Skeie, G Sødahl, N (2009) ‘Helica Theory Manual’, DNV report.
Sødahl, N, Steinkjer, O (2009) ‘Helica User’s Manual’, DNV report
Riflex user’s manual, Marintek (2009)
Lie H Bråten H, Kritiansen T, Nilsen F G ‘Free-Span VIV Testing of Full-scale Umbilical’,
ISOPE 2007
Clough R W, Penzien J “Dynamics of Structures” McGraw-Hill 1975
Bech A, Skallerud B, Sødahl N “Structural Damping in Design Analyses of Flexible Risers”
Marinflex’92, London, November 1992
Fang J, Lyons G J ’Structural Damping of Tensioned Pipes with Reference to Cables’ Journal
of Sound and Vibration 193(4) pp 891-907 1996
Yamaguchi H, Adhikari R ‘Energy Based Evaluation of Modal Damping in Structural Cables
with and without Damping Treatment’ Journal of Sound and Vibration 181(1) pp 71-83
1995
Fang J, Lyons G J (1992) “Structural Damping Behaviour of Unbonded ¨Flexible Risers”
Marine Structures, Vol 5, No 2&3 1992
International Journal of Pure and Applied Science
Published by Cambridge Research and Publications
IJPAS ISSN-2743-6264 (Print) 198
Vol. 21 No.9
June, 2021.
Hanson T D, Otteren A, Sødahl N “Response Calculation using an Enhanced Model for
Structural Damping in Flexible Risers Compared with Full scale Measurements
“Proceedings of the International Conference on Hydroelasticity in Marine Technology,
Trondheim 1994
Sødahl N, Hanson T D, Otteren A, Fylling I J “Influence from Nonelastic Material Modelling
in Computer Simulation of Flexible Risers Verified by full scale Measurements”
Proceedings of Offshore Technology Conference (OTC), Houston 1992
Steinkjer, O, Sødahl, N, Grytøyr, G ‘Methodology for Time Domain Fatigue Life Assessment
of Risers and Umbilical’s OMAE 2010, Shanghai