Embed Size (px)
Citation preview
HAL Id: hal-02465106https://hal.archives-ouvertes.fr/hal-02465106
Submitted on 3 Feb 2020
HAL is a multi-disciplinary open accessarchive for the deposit and dissemination of sci-entific research documents, whether they are pub-lished or not. The documents may come fromteaching and research institutions in France orabroad, or from public or private research centers.
L’archive ouverte pluridisciplinaire HAL, estdestinée au dépôt et à la diffusion de documentsscientifiques de niveau recherche, publiés ou non,émanant des établissements d’enseignement et derecherche français ou étrangers, des laboratoirespublics ou privés.
Fatigue assessment of Normandy bridge under trafficloading
Bernard Jacob, Franziska Schmidt, Moisés Arroyo Contreras
To cite this version:Bernard Jacob, Franziska Schmidt, Moisés Arroyo Contreras. Fatigue assessment of Normandybridge under traffic loading. ICWIM8, 8th International Conference on Weigh-In-Motion, May 2019,PRAGUE, Czech Republic. 10 p. �hal-02465106�
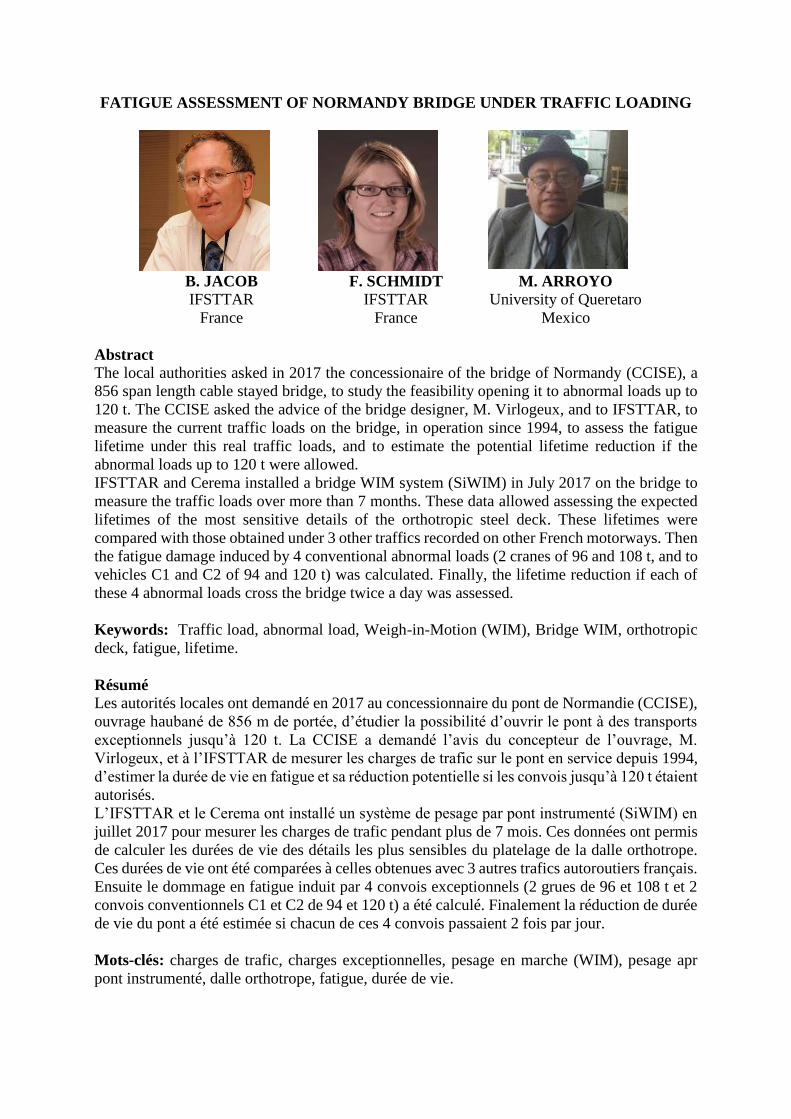
FATIGUE ASSESSMENT OF NORMANDY BRIDGE UNDER TRAFFIC LOADING
B. JACOB
IFSTTAR
France
F. SCHMIDT
IFSTTAR
France
M. ARROYO
University of Queretaro
Mexico
Abstract
The local authorities asked in 2017 the concessionaire of the bridge of Normandy (CCISE), a
856 span length cable stayed bridge, to study the feasibility opening it to abnormal loads up to
120 t. The CCISE asked the advice of the bridge designer, M. Virlogeux, and to IFSTTAR, to
measure the current traffic loads on the bridge, in operation since 1994, to assess the fatigue
lifetime under this real traffic loads, and to estimate the potential lifetime reduction if the
abnormal loads up to 120 t were allowed.
IFSTTAR and Cerema installed a bridge WIM system (SiWIM) in July 2017 on the bridge to
measure the traffic loads over more than 7 months. These data allowed assessing the expected
lifetimes of the most sensitive details of the orthotropic steel deck. These lifetimes were
compared with those obtained under 3 other traffics recorded on other French motorways. Then
the fatigue damage induced by 4 conventional abnormal loads (2 cranes of 96 and 108 t, and to
vehicles C1 and C2 of 94 and 120 t) was calculated. Finally, the lifetime reduction if each of
these 4 abnormal loads cross the bridge twice a day was assessed.
Keywords: Traffic load, abnormal load, Weigh-in-Motion (WIM), Bridge WIM, orthotropic
deck, fatigue, lifetime.
Résumé
Les autorités locales ont demandé en 2017 au concessionnaire du pont de Normandie (CCISE),
ouvrage haubané de 856 m de portée, d’étudier la possibilité d’ouvrir le pont à des transports
exceptionnels jusqu’à 120 t. La CCISE a demandé l’avis du concepteur de l’ouvrage, M.
Virlogeux, et à l’IFSTTAR de mesurer les charges de trafic sur le pont en service depuis 1994,
d’estimer la durée de vie en fatigue et sa réduction potentielle si les convois jusqu’à 120 t étaient
autorisés.
L’IFSTTAR et le Cerema ont installé un système de pesage par pont instrumenté (SiWIM) en
juillet 2017 pour mesurer les charges de trafic pendant plus de 7 mois. Ces données ont permis
de calculer les durées de vie des détails les plus sensibles du platelage de la dalle orthotrope.
Ces durées de vie ont été comparées à celles obtenues avec 3 autres trafics autoroutiers français.
Ensuite le dommage en fatigue induit par 4 convois exceptionnels (2 grues de 96 et 108 t et 2
convois conventionnels C1 et C2 de 94 et 120 t) a été calculé. Finalement la réduction de durée
de vie du pont a été estimée si chacun de ces 4 convois passaient 2 fois par jour.
Mots-clés: charges de trafic, charges exceptionnelles, pesage en marche (WIM), pesage apr
pont instrumenté, dalle orthotrope, fatigue, durée de vie.
1. Bridge Description and Context
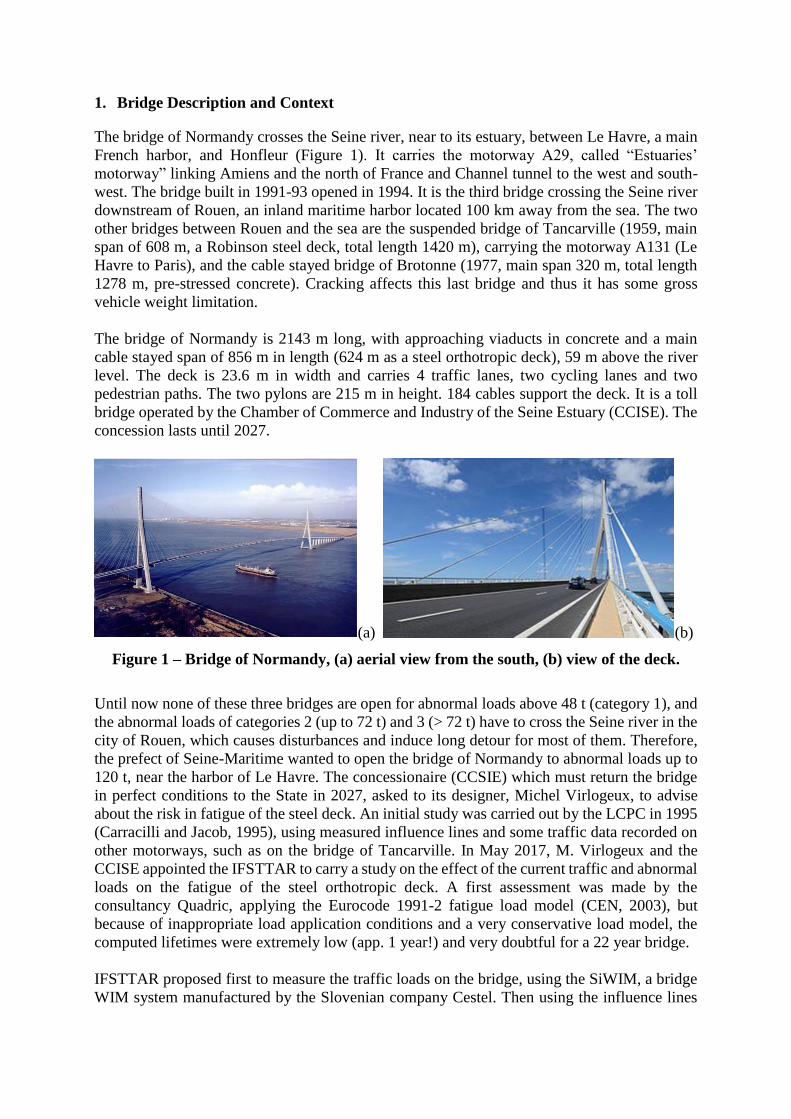
The bridge of Normandy crosses the Seine river, near to its estuary, between Le Havre, a main
French harbor, and Honfleur (Figure 1). It carries the motorway A29, called “Estuaries’
motorway” linking Amiens and the north of France and Channel tunnel to the west and south-
west. The bridge built in 1991-93 opened in 1994. It is the third bridge crossing the Seine river
downstream of Rouen, an inland maritime harbor located 100 km away from the sea. The two
other bridges between Rouen and the sea are the suspended bridge of Tancarville (1959, main
span of 608 m, a Robinson steel deck, total length 1420 m), carrying the motorway A131 (Le
Havre to Paris), and the cable stayed bridge of Brotonne (1977, main span 320 m, total length
1278 m, pre-stressed concrete). Cracking affects this last bridge and thus it has some gross
vehicle weight limitation.
The bridge of Normandy is 2143 m long, with approaching viaducts in concrete and a main
cable stayed span of 856 m in length (624 m as a steel orthotropic deck), 59 m above the river
level. The deck is 23.6 m in width and carries 4 traffic lanes, two cycling lanes and two
pedestrian paths. The two pylons are 215 m in height. 184 cables support the deck. It is a toll
bridge operated by the Chamber of Commerce and Industry of the Seine Estuary (CCISE). The
concession lasts until 2027.
(a) (b)
Figure 1 – Bridge of Normandy, (a) aerial view from the south, (b) view of the deck.
Until now none of these three bridges are open for abnormal loads above 48 t (category 1), and
the abnormal loads of categories 2 (up to 72 t) and 3 (> 72 t) have to cross the Seine river in the
city of Rouen, which causes disturbances and induce long detour for most of them. Therefore,
the prefect of Seine-Maritime wanted to open the bridge of Normandy to abnormal loads up to
120 t, near the harbor of Le Havre. The concessionaire (CCSIE) which must return the bridge
in perfect conditions to the State in 2027, asked to its designer, Michel Virlogeux, to advise
about the risk in fatigue of the steel deck. An initial study was carried out by the LCPC in 1995
(Carracilli and Jacob, 1995), using measured influence lines and some traffic data recorded on
other motorways, such as on the bridge of Tancarville. In May 2017, M. Virlogeux and the
CCISE appointed the IFSTTAR to carry a study on the effect of the current traffic and abnormal
loads on the fatigue of the steel orthotropic deck. A first assessment was made by the
consultancy Quadric, applying the Eurocode 1991-2 fatigue load model (CEN, 2003), but
because of inappropriate load application conditions and a very conservative load model, the
computed lifetimes were extremely low (app. 1 year!) and very doubtful for a 22 year bridge.
IFSTTAR proposed first to measure the traffic loads on the bridge, using the SiWIM, a bridge
WIM system manufactured by the Slovenian company Cestel. Then using the influence lines
measured in 1995 the fatigue lifetimes were calculated for the most sensitive details, and
compared to the results of the initial study in 1995 for one detail. Finally, the effect of 4
abnormal loads were calculated, and the lifetime reduction estimated with a quite conservative
scenario of abnormal load crossings.
2. Details sensitive to Fatigue and Influence Lines
2.1 Details sensitive to fatigue and deck instrumentation
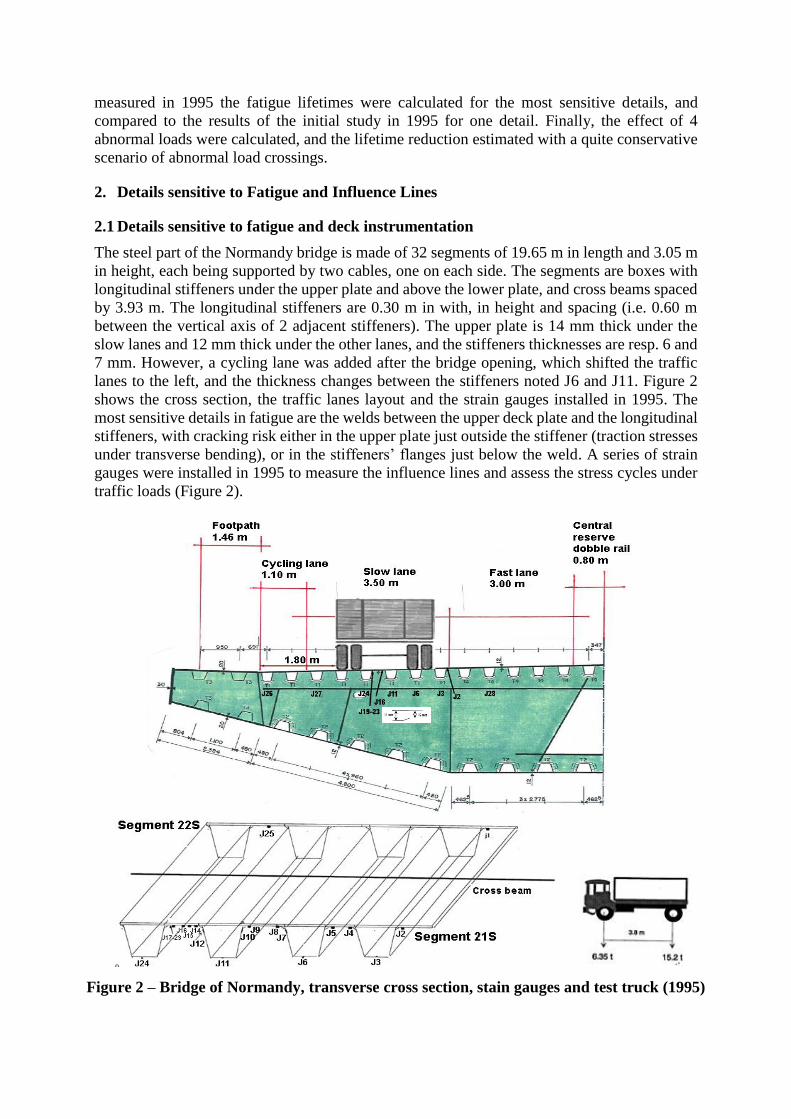
The steel part of the Normandy bridge is made of 32 segments of 19.65 m in length and 3.05 m
in height, each being supported by two cables, one on each side. The segments are boxes with
longitudinal stiffeners under the upper plate and above the lower plate, and cross beams spaced
by 3.93 m. The longitudinal stiffeners are 0.30 m in with, in height and spacing (i.e. 0.60 m
between the vertical axis of 2 adjacent stiffeners). The upper plate is 14 mm thick under the
slow lanes and 12 mm thick under the other lanes, and the stiffeners thicknesses are resp. 6 and
7 mm. However, a cycling lane was added after the bridge opening, which shifted the traffic
lanes to the left, and the thickness changes between the stiffeners noted J6 and J11. Figure 2
shows the cross section, the traffic lanes layout and the strain gauges installed in 1995. The
most sensitive details in fatigue are the welds between the upper deck plate and the longitudinal
stiffeners, with cracking risk either in the upper plate just outside the stiffener (traction stresses
under transverse bending), or in the stiffeners’ flanges just below the weld. A series of strain
gauges were installed in 1995 to measure the influence lines and assess the stress cycles under
traffic loads (Figure 2).
Figure 2 – Bridge of Normandy, transverse cross section, stain gauges and test truck (1995)
Three sets of strain gauges (J) were mounted mainly under the slow traffic lane:
under the stiffeners bottom face at mid-span between two cross beams, to measure the
longitudinal bending moment stresses (no fatigue effects): J3, 6, 11, 24, 25, 26, 27 and 28;
under the upper deck plate to measure the transverse bending stresses: J2, 4, 5, 8, 9, 14, 15,
16 and a chain J17-23;
outside the stiffeners’ flanges just below the longitudinal welding: J7, 10 and 12.
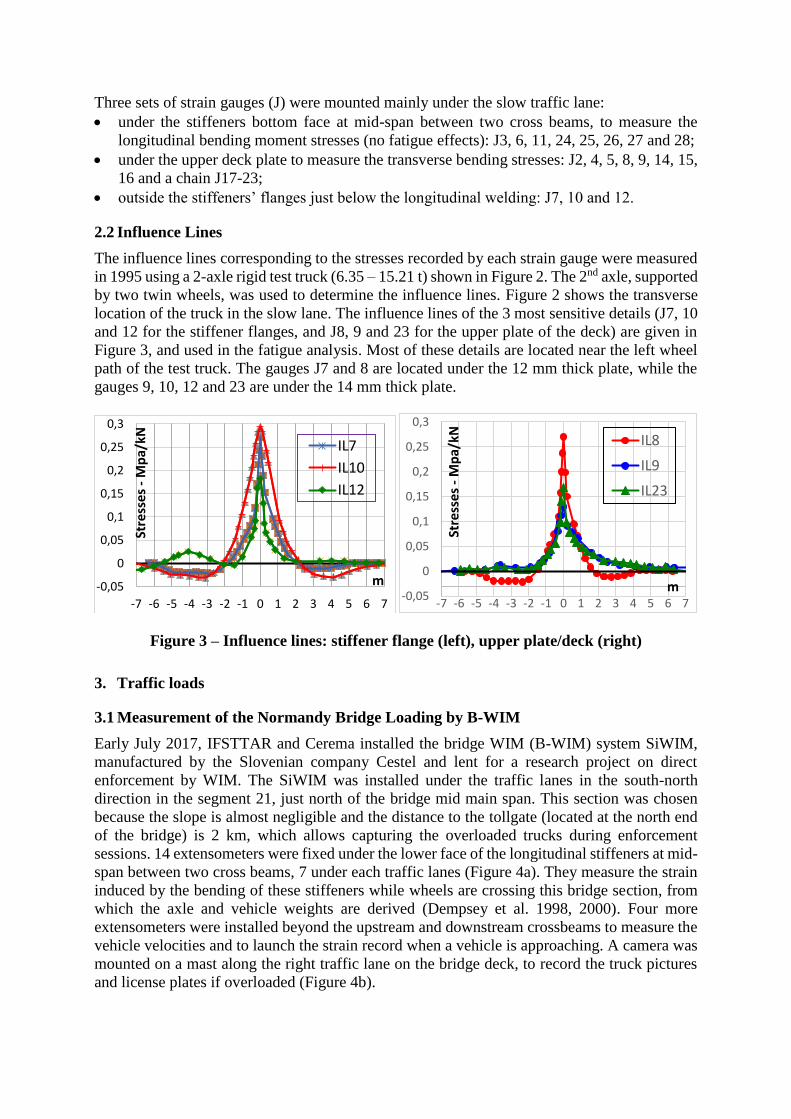
2.2 Influence Lines
The influence lines corresponding to the stresses recorded by each strain gauge were measured
in 1995 using a 2-axle rigid test truck (6.35 – 15.21 t) shown in Figure 2. The 2nd axle, supported
by two twin wheels, was used to determine the influence lines. Figure 2 shows the transverse
location of the truck in the slow lane. The influence lines of the 3 most sensitive details (J7, 10
and 12 for the stiffener flanges, and J8, 9 and 23 for the upper plate of the deck) are given in
Figure 3, and used in the fatigue analysis. Most of these details are located near the left wheel
path of the test truck. The gauges J7 and 8 are located under the 12 mm thick plate, while the
gauges 9, 10, 12 and 23 are under the 14 mm thick plate.
Figure 3 – Influence lines: stiffener flange (left), upper plate/deck (right)
3. Traffic loads
3.1 Measurement of the Normandy Bridge Loading by B-WIM
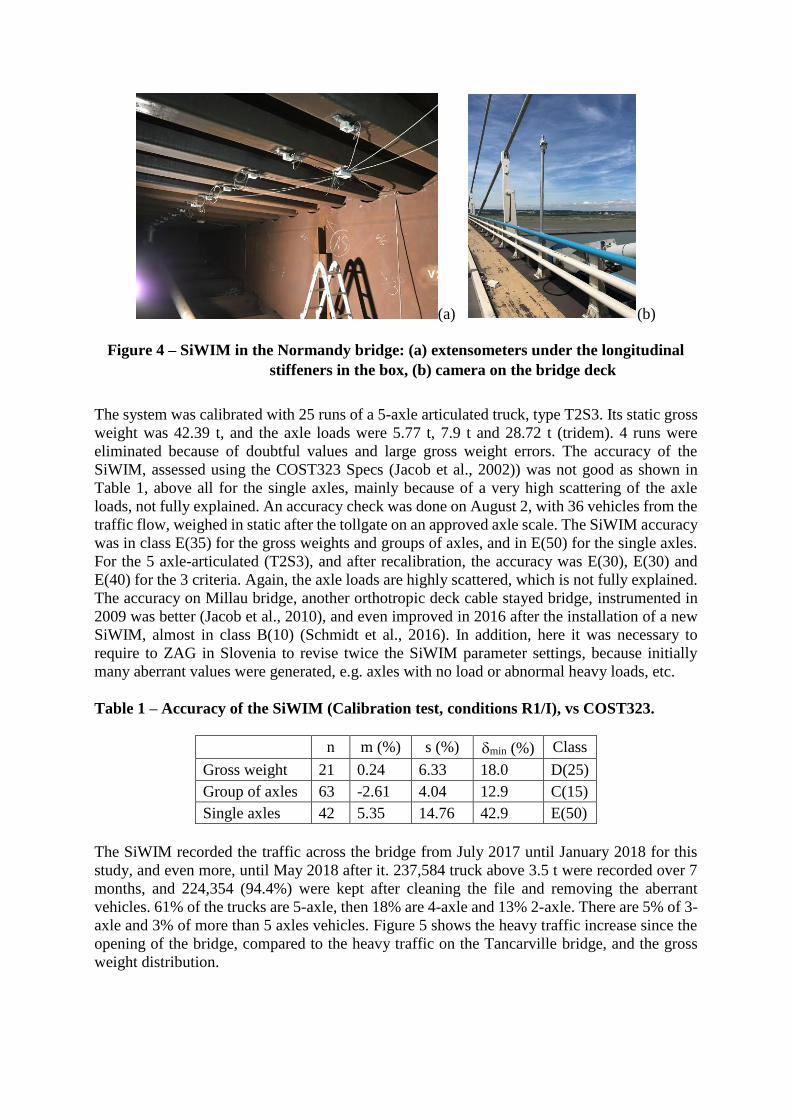
Early July 2017, IFSTTAR and Cerema installed the bridge WIM (B-WIM) system SiWIM,
manufactured by the Slovenian company Cestel and lent for a research project on direct
enforcement by WIM. The SiWIM was installed under the traffic lanes in the south-north
direction in the segment 21, just north of the bridge mid main span. This section was chosen
because the slope is almost negligible and the distance to the tollgate (located at the north end
of the bridge) is 2 km, which allows capturing the overloaded trucks during enforcement
sessions. 14 extensometers were fixed under the lower face of the longitudinal stiffeners at mid-
span between two cross beams, 7 under each traffic lanes (Figure 4a). They measure the strain
induced by the bending of these stiffeners while wheels are crossing this bridge section, from
which the axle and vehicle weights are derived (Dempsey et al. 1998, 2000). Four more
extensometers were installed beyond the upstream and downstream crossbeams to measure the
vehicle velocities and to launch the strain record when a vehicle is approaching. A camera was
mounted on a mast along the right traffic lane on the bridge deck, to record the truck pictures
and license plates if overloaded (Figure 4b).
-0,05
0
0,05
0,1
0,15
0,2
0,25
0,3
-7 -6 -5 -4 -3 -2 -1 0 1 2 3 4 5 6 7
Stre
sse
s -
Mp
a/kN
m
IL7
IL10
IL12
-0,05
0
0,05
0,1
0,15
0,2
0,25
0,3
-7 -6 -5 -4 -3 -2 -1 0 1 2 3 4 5 6 7
Stre
sse
s -
Mp
a/kN
m
IL8
IL9
IL23
(a) (b)
Figure 4 – SiWIM in the Normandy bridge: (a) extensometers under the longitudinal
stiffeners in the box, (b) camera on the bridge deck
The system was calibrated with 25 runs of a 5-axle articulated truck, type T2S3. Its static gross
weight was 42.39 t, and the axle loads were 5.77 t, 7.9 t and 28.72 t (tridem). 4 runs were
eliminated because of doubtful values and large gross weight errors. The accuracy of the
SiWIM, assessed using the COST323 Specs (Jacob et al., 2002)) was not good as shown in
Table 1, above all for the single axles, mainly because of a very high scattering of the axle
loads, not fully explained. An accuracy check was done on August 2, with 36 vehicles from the
traffic flow, weighed in static after the tollgate on an approved axle scale. The SiWIM accuracy
was in class E(35) for the gross weights and groups of axles, and in E(50) for the single axles.
For the 5 axle-articulated (T2S3), and after recalibration, the accuracy was E(30), E(30) and
E(40) for the 3 criteria. Again, the axle loads are highly scattered, which is not fully explained.
The accuracy on Millau bridge, another orthotropic deck cable stayed bridge, instrumented in
2009 was better (Jacob et al., 2010), and even improved in 2016 after the installation of a new
SiWIM, almost in class B(10) (Schmidt et al., 2016). In addition, here it was necessary to
require to ZAG in Slovenia to revise twice the SiWIM parameter settings, because initially
many aberrant values were generated, e.g. axles with no load or abnormal heavy loads, etc.
Table 1 – Accuracy of the SiWIM (Calibration test, conditions R1/I), vs COST323.
n m (%) s (%) min (%) Class
Gross weight 21 0.24 6.33 18.0 D(25)
Group of axles 63 -2.61 4.04 12.9 C(15)
Single axles 42 5.35 14.76 42.9 E(50)
The SiWIM recorded the traffic across the bridge from July 2017 until January 2018 for this
study, and even more, until May 2018 after it. 237,584 truck above 3.5 t were recorded over 7
months, and 224,354 (94.4%) were kept after cleaning the file and removing the aberrant
vehicles. 61% of the trucks are 5-axle, then 18% are 4-axle and 13% 2-axle. There are 5% of 3-
axle and 3% of more than 5 axles vehicles. Figure 5 shows the heavy traffic increase since the
opening of the bridge, compared to the heavy traffic on the Tancarville bridge, and the gross
weight distribution.

Figure 5 – Heavy traffic on the Normandy bridge: (left) truck flow evolution 1994-2016,
(right) gross weight distribution (> 3.5 t)
3.2 Traffic applied for the Fatigue Assessment of Normandy Bridge
The traffic measured on the Normandy over 189 days is conservative to assess the fatigue of
the bridge details over the past 24 years of operation, because of the continuous increase of the
traffic flow (Figure 5). However, in the future the traffic may still increase, in both volume and
loads. Therefore, it is useful to calculate the lifetimes of the most critical details if exposed to
other traffics. We used 3 other traffics recorded by the National WIM network on two other
motorways (A20 and A9) and a main highway (RN4). Table 2 reports the relevant statistics of
these traffics.
Table 2 – Traffics of French motorways and highways for fatigue assessment.
Site Dates Nb
days
Nb
trucks
Mean flow
trucks/day
Proportion
. 2nd mode
Median 2nd
mode (kN)
St. Dev. 2nd
mode (kN)
Normandy (A29) 7/17-1/18 189 224354 1187 40% 350 50
Massay (A20) 2015 362 498269 1376 20% 384 27
Maulan (RN4) 2015 353 755757 2141 28% 383 30
Fabrègues (A9) 1-6/2015 189 901231 4768 40% 371 26
The traffic measured on the A20 in the center of France (Vierzon to Limoges) has the closest
statistics to the A29 traffic on the Normandy bridge, with slightly higher loads in the 2nd mode
of the gross vehicle weights, but a lower proportion of trucks in it. The traffic on the RN4
(highway Paris-Nancy) is the second closest one, but with a 80% higher volume of trucks. The
traffic of the A9 motorway near Montpellier (Lyon to Barcelona) is one of the heaviest in France
and much ore aggressive than the A29. It gives an upper bound of the fatigue damage, but much
too conservative. All these traffic were measured over 6 to 12 months in 2015, with several
hundreds of thousends of trucks.
3.3 Abnormal Loads
The four abnormal loads considered for the fatigue study, are representative of the potential
abnormal loads, which could cross the bridge of Normandy if allowed in the future. Two cranes
(G1 and G2) and two standard abnormal loads (C1 and C2) are used (Figure 6). All the crane
axles have a 12 t load, i.e. G1 weighs 8 x 12 = 96 t, and G2 weighs 9 x 12 = 108 t. The axle
spacings are for each crane:
G1: 1.50 - 1.55 - 2.00 – 1.50 – 2.39 – 1.50 – 2.49 m;
G2 : 1.65 - 1.65 - 2.00 – 1.50 – 2.485 – 1.50 – 2.615 – 1.50 m ;
and all the tires are 14-R25, 0.356 m in width (2 tires per axle).
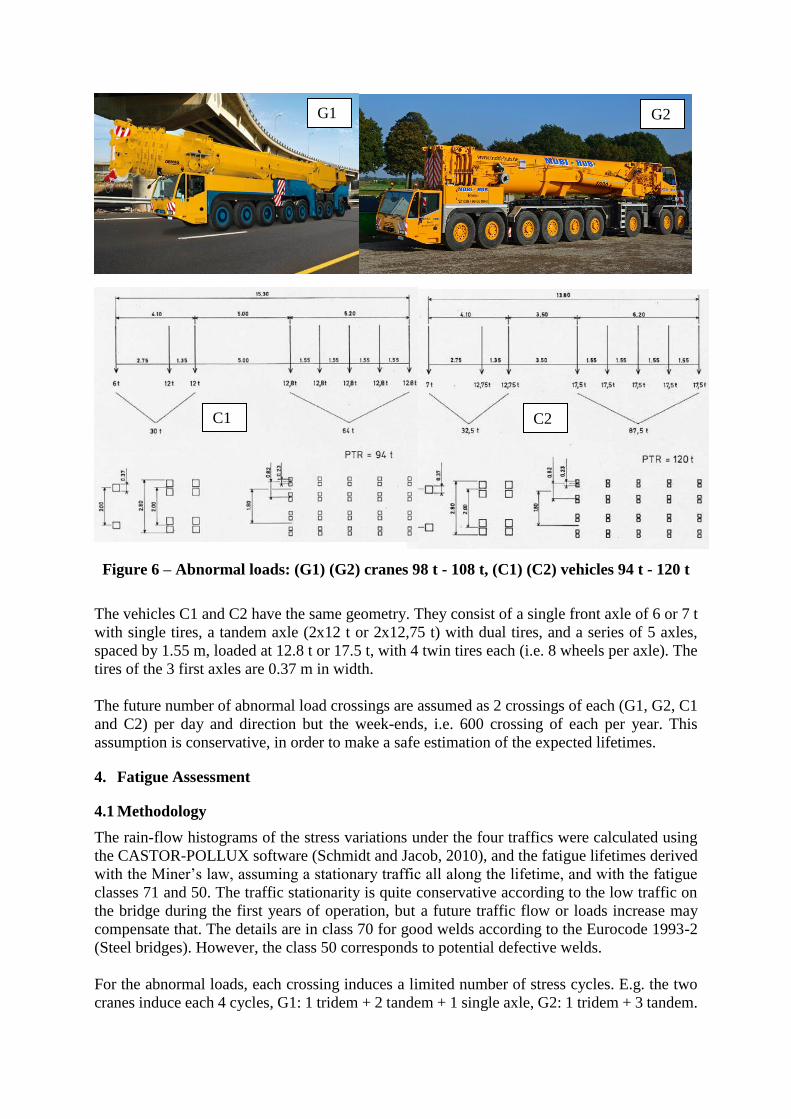
Figure 6 – Abnormal loads: (G1) (G2) cranes 98 t - 108 t, (C1) (C2) vehicles 94 t - 120 t
The vehicles C1 and C2 have the same geometry. They consist of a single front axle of 6 or 7 t
with single tires, a tandem axle (2x12 t or 2x12,75 t) with dual tires, and a series of 5 axles,
spaced by 1.55 m, loaded at 12.8 t or 17.5 t, with 4 twin tires each (i.e. 8 wheels per axle). The
tires of the 3 first axles are 0.37 m in width.
The future number of abnormal load crossings are assumed as 2 crossings of each (G1, G2, C1
and C2) per day and direction but the week-ends, i.e. 600 crossing of each per year. This
assumption is conservative, in order to make a safe estimation of the expected lifetimes.
4. Fatigue Assessment
4.1 Methodology
The rain-flow histograms of the stress variations under the four traffics were calculated using
the CASTOR-POLLUX software (Schmidt and Jacob, 2010), and the fatigue lifetimes derived
with the Miner’s law, assuming a stationary traffic all along the lifetime, and with the fatigue
classes 71 and 50. The traffic stationarity is quite conservative according to the low traffic on
the bridge during the first years of operation, but a future traffic flow or loads increase may
compensate that. The details are in class 70 for good welds according to the Eurocode 1993-2
(Steel bridges). However, the class 50 corresponds to potential defective welds.
For the abnormal loads, each crossing induces a limited number of stress cycles. E.g. the two
cranes induce each 4 cycles, G1: 1 tridem + 2 tandem + 1 single axle, G2: 1 tridem + 3 tandem.
G1 G2
C2 C1
Because of the short lengths of the influence lines (local effects), when the spacing between
two axles exceeds 2 m, two independent cycles may be considered. Reversely, according to the
influence line shape, each group of axles (internal spacing below 1.65 m) induces a single stress
cycle. Similarly, the C1 and C2 vehicles induce each 3 cycles, for the single axle, the tandem
and the group of 5 axles. However, the cycle due to the front axle never exceed the truncation
threshold of the fatigue S-N curves in the classes 50 and 71, resp. 20.2 and 28.7 MPa, and thus
are ignored. Table 3 gives all the stress cycles induced by these abnormal vehicles.
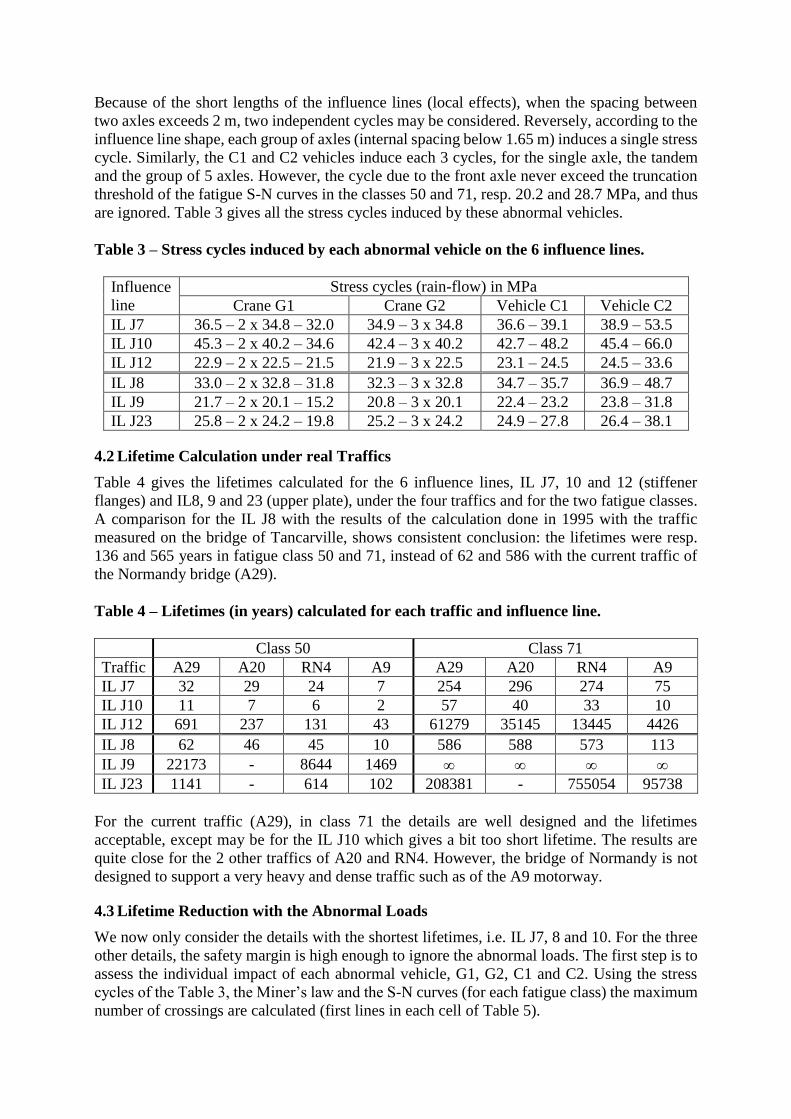
Table 3 – Stress cycles induced by each abnormal vehicle on the 6 influence lines.
Influence
line
Stress cycles (rain-flow) in MPa
Crane G1 Crane G2 Vehicle C1 Vehicle C2
IL J7 36.5 – 2 x 34.8 – 32.0 34.9 – 3 x 34.8 36.6 – 39.1 38.9 – 53.5
IL J10 45.3 – 2 x 40.2 – 34.6 42.4 – 3 x 40.2 42.7 – 48.2 45.4 – 66.0
IL J12 22.9 – 2 x 22.5 – 21.5 21.9 – 3 x 22.5 23.1 – 24.5 24.5 – 33.6
IL J8 33.0 – 2 x 32.8 – 31.8 32.3 – 3 x 32.8 34.7 – 35.7 36.9 – 48.7
IL J9 21.7 – 2 x 20.1 – 15.2 20.8 – 3 x 20.1 22.4 – 23.2 23.8 – 31.8
IL J23 25.8 – 2 x 24.2 – 19.8 25.2 – 3 x 24.2 24.9 – 27.8 26.4 – 38.1
4.2 Lifetime Calculation under real Traffics
Table 4 gives the lifetimes calculated for the 6 influence lines, IL J7, 10 and 12 (stiffener
flanges) and IL8, 9 and 23 (upper plate), under the four traffics and for the two fatigue classes.
A comparison for the IL J8 with the results of the calculation done in 1995 with the traffic
measured on the bridge of Tancarville, shows consistent conclusion: the lifetimes were resp.
136 and 565 years in fatigue class 50 and 71, instead of 62 and 586 with the current traffic of
the Normandy bridge (A29).
Table 4 – Lifetimes (in years) calculated for each traffic and influence line.
Class 50 Class 71
Traffic A29 A20 RN4 A9 A29 A20 RN4 A9
IL J7 32 29 24 7 254 296 274 75
IL J10 11 7 6 2 57 40 33 10
IL J12 691 237 131 43 61279 35145 13445 4426
IL J8 62 46 45 10 586 588 573 113
IL J9 22173 - 8644 1469
IL J23 1141 - 614 102 208381 - 755054 95738
For the current traffic (A29), in class 71 the details are well designed and the lifetimes
acceptable, except may be for the IL J10 which gives a bit too short lifetime. The results are
quite close for the 2 other traffics of A20 and RN4. However, the bridge of Normandy is not
designed to support a very heavy and dense traffic such as of the A9 motorway.
4.3 Lifetime Reduction with the Abnormal Loads
We now only consider the details with the shortest lifetimes, i.e. IL J7, 8 and 10. For the three
other details, the safety margin is high enough to ignore the abnormal loads. The first step is to
assess the individual impact of each abnormal vehicle, G1, G2, C1 and C2. Using the stress
cycles of the Table 3, the Miner’s law and the S-N curves (for each fatigue class) the maximum
number of crossings are calculated (first lines in each cell of Table 5).

Then dividing these numbers by 600 (number of crossings assumed per year), the lifetime under
each abnormal vehicle alone are calculated (2nd line of each cell in Table 5). The relative
lifetime reduction r due to one abnormal vehicle, crossing the bridge 600 per year is calculated
as follow: 1
𝑇=
1
𝑇1+
1
𝑇2 (1)
𝑟 = 𝑇1−𝑇
𝑇1=
𝑇1
𝑇1+𝑇2 (2)
where T1 and T2 are the lifetimes under the A29 traffic loads (Table 4) and under the abnormal
vehicle alone (Table 5, 2nd line of each cell), T is the resulting lifetime. The values of r (in %)
are given in Table 5 (3rd line of each cell). The lifetimes T1 and T2 are both slightly under-
estimated, because the traffic increased quickly since the bridge opening and no abnormal loads
crossed the bridge since that time. Therefore, the ratio r should be quite realistic.
Table 5 – Effect in fatigue of the abnormal vehicles (one by one).
Influence
line
Crane G1 Crane G2 Vehicle C1 Vehicle C2
Class 50 Class 71 Class 50 Class 71 Class 50 Class 71 Class 50 Class 71
IL J7
1.693
2 823
1.12%
9.778
16 296
1.53%
1.650
2 751
1.15%
9.530
15 883
1.57%
2.495
4 158
0.76%
13.754
22 923
1.10%
1.253
2 088
1.51%
4.124
6 873
3.56%
IL J10
0.963
1 606
0.68%
4.349
7 248
0.78%
0.924
1 540
0.71%
4.348
7 247
0.78%
1.394
2 323
0.47%
5.354
8 923
0.63%
0.697
1 161
0.94%
2.140
3 567
1.57%
IL J8
2.293
3 821
1.60%
13.238
22 063
2.59%
2.276
3 793
1.61%
13.140
21 900
2.61%
3.460
5 766
1.06%
19.976
33 293
1.73%
1.561
2 689
2.25%
6.280
10 467
5.30% In each cell: first line = number of crossings allowed (in millions), second line = lifetime under the
single abnormal vehicle (600 runs per year), third line = percentage of the lifetime under the A29 traffic.
The contributions of each abnormal vehicle G1, G2 and C1 to the total damage in fatigue and
thus to the lifetime reduction remain below 2.6%, but for the vehicle C2 for which this rate
reaches 5.3% (for the longest lifetime). These values are very limited with respect to the
uncertainties of the Miner’s law and fatigue calculation. Moreover, the effects of the abnormal
vehicles C1 and C2 are overestimated, because they have wide twin tires on the tandem axles
(2 x 0.37 m instead of 2 x 0,24 m for common dual tires), and above all 8 wheels on the 5-axle
group. Thus, a much more transversally spread of the loads significantly reduces the stress
intensity in the stiffeners and upper plate. The influence lines used where measured for standard
twin tire axle. The influence lines adapted to such wide tires or multiple wheel axle would be
flatter, and thus would reduce the calculate fatigue damage. Table 6 recapitulates the global
lifetime reduction under the 4 abnormal loads cumulated to the A29 traffic.
Table 6 – Global effects and lifetime reductions under the four abnormal vehicles.
Class 50 Class 71
A29 4 abn. veh. Final r A29 4 abn. veh. Final r
IL J7 32 696 31 4.40% 254 3190 235 7.37%
IL J10 11 390 10.7 2.74% 57 1496 55 3.67%
IL J8 62 934 58 6.22% 586 4618 520 11.3%
5. Conclusions
The study carried out for the concessionaire of the Normandy bridge, over the Seine river,
allowed to assess the real traffic loads on the bridge, in the south-north direction. These traffic
data, recorded by a bridge WIM system over more than 7 months, combined with the influence
lines measured in 1995 provided an estimation of the lifetime of the most sensitive details in
fatigue, the welds between the longitudinal stiffeners and the upper deck plate. These lifetimes
were in good agreement with the initial estimation made in 1995 with the traffic of the
Tancarville bridge. The lifetimes obtained with some similar traffic data recorded on other
highways and motorways are consistent.
An estimate of the fatigue damage induced by four abnormal vehicles, two cranes of 96 and
108 t, and 2 standard vehicles of 94 and 120 t, was calculated with some conservative
assumptions on their potential frequencies. It was shown that these abnormal loads would not
reduce the lifetimes by more than 5 to 10%, which provide some guarantee that allowing
abnormal loads up to 120 t on the Normandy bridge is feasible without too much risk of cracking
in fatigue. It would be interesting to calculate the influence lines adapted to very wide tires and
multiple wheel axles, to assess more accurately the stress cycles induced by these abnormal
vehicles. That would surely reduce the impact of these loads. The transverse scattering of the
wheel (path) location would also reduce the fatigue damage if properly measured and taken into
account.
6. References
Carracilli, J., and Jacob, B. (1995), Etude en fatigue du Pont de Normandie, Contrat 325023
LCPC-CCIH-DDE 76, October.
CEN (2003), EN 1991-2 - Eurocode 1: Actions on Structures - Part 2: Traffic Loads on
Road Bridges, European Committee for Standardization, Brussels, September.
Dempsey, A.T., Jacob, B., Carracilli, J. (1998), Orthotropic Bridge Weigh-in-motion for
determining Axle and Gross Vehicle Weights, Proceedings of the 2nd European Conference
on Weigh-in-motion of Road Vehicles, eds. O'Brien & Jacob, Lisbon, pp. 435-444.
Dempsey, A.T., Keogh, D.L., Jacob, B., Carracilli, J. (2000), The Response of Orthotropic
Steel Decks to Traffic Loads, Engineering Transactions, Polish Academy of Sciences,
Institut of Fundamental Technological Research, 48, n°3, pp. 309-327.
Jacob, B., OBrien, E.J. & Jehaes, S. (eds.) (2002), Weigh-in-Motion of Road Vehicles: Final
Report of the COST 323 Action, LCPC Publications, Paris, 535 pp.
Jacob, B., Hannachi, M., Ieng, S.S. (2010), Bridge Weigh-in-motion on Steel Orthotropic
Decks – Millau Viaduct and Autreville Bridge, IABMAS2010, Proc. 5th International
Conference on Bridge Maintenance, Safety and Management, July 11-15, CRC Press.
Schmidt, F., and Jacob B. (2010), WIM data to assess Consequences of new Traffic
Regulations, IABMAS2010, Proc. 5th International Conference on Bridge Maintenance,
Safety and Management, July 11-15, CRC Press.
Schmidt, F., Mavric, M., Znidaric, A., Jacob, B. (2016), Use of B-WIM for monitoring
Traffic on a specific Route in France, 7th International Conference for Weigh-In-Motion,
ICWIM7, November.