Embed Size (px)
Citation preview

Fatigue assessment of riveted bridges
Tobias Larsson
Luleå University of Technology Department of Civil and Environmental Engineering
Division of Structural Engineering Luleå, February 2009

Fatigue assessment of riveted bridges

I
Preface
First of all I would like to thank the companies and organisations for their financial contribution to my research, the Swedish Road Administration, SBUF (Development Fund of the Swedish Construction Industry), and the companies in the project and the project Sustainable Bridges, in which most of the work in this thesis have been conducted. I would like to recognise and thank my supervisor Professor Ove Lagerqvist, for offering me the opportunity to begin the Ph. D. studies, and for the support and many wise advices he has given me during theses years. It has been a journey during which I have both grown in knowledge and as person, for this I am grateful. Also my co-supervisors must be recognised for their time and useful insight, Professor Bernt Johansson, Professor Mats Emborg and last but not least Associate professor Kjell Eriksson. Big thanks go to the people working at Complab for their laboratory work contributing to the finalisation of this thesis. And a special acknowledgement goes to Ola Enochsson for the field measurements of the Keräsjokk Bridge.

Fatigue assessment of riveted bridges
II
To my fellow colleagues at the Division of structural engineering, carry on with the stiff working conditions on Fridays. I have enjoyed many interesting stories during the coffee breaks over the years, keep up the good work. A special thought goes to the friends I have learned to know here in Luleå, thanks to you the time here has been filled with many happy memories. Final I would like to thank my family for the support I have received throughout the years, this would not have been possible otherwise, thank you. Now new adventures awaits, first stop Gothenburg! Luleå, February 2009
Tobias Larsson

III
Summary
The majority of the railways used today were built in the beginning of the 20th century. Most of the bridges constructed at that time are still in service. This was achieved by designing the bridges with an over capacity, this extra reserve in the design of the bridges was done since the axle load of trains and locomotives were changed during this period. To ensure that the bridge stock could manage future axle load alterations a buffer was assigned to their resistance. The situation with an increasing number of old bridges still in service that are reaching their design service life is similar in all of Europe, and because of their quantity it is impossible to replace all bridges at the same time. To be able to make old bridges stay in service longer enhancement of the existing assessment methods has to be made. To do this the procedure of an assessment must be known to be able to recognize where improvements can be made and areas that are critical in a bridge must be identified. This thesis has focused on the material properties of steel bridges constructed before the 1940’s and how to estimate the remaining fatigue life of riveted bridges.

Fatigue assessment of riveted bridges
IV
By gathering information from bridges where the material properties have been determined a data base was created. From the information in the data base a better prediction concerning the properties to expect in steel bridges constructed before the 1940’s is obtained. By using information from the data base a more accurate calculation of the resistance can be achieved which opens for the possibilities for higher loads to be allowed. Concerning the fatigue life of riveted bridges this thesis has focused on two areas. The first area is the girders of the secondary structure, stringers and cross girders, transferring loads from trains or cars to the main girders of the bridge. These girders are often in focus in assessments, due to their length and position in the bridge that makes them more exposed to fatigue damage than other parts. The work has focused on determining which detail category that should be used in calculations of the fatigue life for riveted structures. A survey was performed containing information of large scale fatigue tests performed on riveted bridge girders taken out from service and tests on small scale specimens to investigate influencing factors of the fatigue life. The second area concerning fatigue and how to estimate remaining time in service is the connections between the stringers and cross girders. The connections between these girders are often exposed to unintended load exposure causing cracking in these joints. A fracture mechanic approach was used to estimate the degradation of stiffness in these connections and the propagation rates of cracks. Also investigations were carried out concerning the best way of modelling these connections by comparing the results from the FE-analyses to field measurements.

V
Sammanfattning
Många av dagens järnvägar byggdes i början av 1900-talet, de flesta av broarna som uppfördes är fortfarande i drift. Anledningen till detta är att vid 1900-talets början ändrades axellaster på lok och vagnar. För att försäkra sig om att de broar som konstruerades skulle kunna fortsätta att vara i drift trots liknande ändringar dimensionerades dessa broar med en extra bärförmåga. Situationen med en ökande andel av äldre broar som börjar närma sig sin dimensionerande livslängd är liknande i många av de Europeiska länderna. På grund av det stora antalet är det omöjligt att ersätta dessa broar. För att kunna utföra noggrannare beräkningar som bättre avspelar dessa broars verkliga kapacitet och livslängd, måste förbättringar av nuvarande bärighetsberäkningar genomföras. Dessa ändringar måste utföras där de får störst inverkan, områden som är kritiska och behöver extra tillsyn måste urskiljas. De områden som har identifierats i denna avhandling är, materialegenskaper hos stålbroar uppförda innan år 1940 och den kvarvarande utmattningskapaciteten av nitade broar.

Fatigue assessment of riveted bridges
VI
Genom att förena information om materialegenskaper hos broar uppförda innan år 1940 och sammanställa dessa till en databas, har en bättre bild av de parametrar som påverkar bärförmågan hos broar blivit fastställda. Genom att använda denna information vid beräkningar av broars bärförmåga kan ett bättre utnyttjande uppnås, vilket öppnar för möjligheten till en lasthöjning hos dessa. Arbete har bedrivits för att utvärdera vilken detaljkategori som bäst beskriver utmattningen hos nitade balkar. Genom att undersöka utmattningsförsök från tidigare forskningsprojekt och att sammanställa dessa, har en bild av den detaljkategori som bäst representerar dessa balkar erhållits, även parametrar som påverkar deras livslängd har undersökts. Ytterligare arbete som har utförts beträffande utmattning har varit att fastställa kvarvarande livslängd hos förband mellan lång- och tvärbalkar. Brottmekanik har varit basen för denna undersökning av hur styvheten hos förband mellan balkar avtar med längden på en spricka. Undersökningar utfördes även om hur dessa förband ska modelleras för att avspegla de spänningarna som uppträder i långbalkarna hos en bro vid tågpassage. Modellerna validerades mot mätningar.

VII
Notations
Notations used in this thesis are described within this chapter. Concerning notations describing other researcher’s work they have not been included herein. The notations are listed in alphabetical order, Roman and Greek respectively. Roman notations a is the crack length
A is the elongation at failure
ac is the critical crack length
Ag is the elongation before reduction of area at fu
C is an experimentally determined parameter in Paris equation
da/dN is the crack propagation
E is the Young’s modulus
f(a/W) is the ratio between the crack and the height of the cracked body

Fatigue assessment of riveted bridges
VIII
Fci is the is the initial contact force between the plates
Fcl is the is the contact force between the plates when an external force
is applied
Fclamp is the size of the clamping force
Fp is the change in contact force between the plates
Fr is the change in rivet force
fu is the ultimate strength
fy is the yield strength
G is strain energy release rate
Gc is the critical strain energy release rate
I is the moment of inertia
Is is the moment of inertia of the un-cracked segment
Jc is the critical toughness value obtained with non linear fracture
mechanics
Kc is the critical toughness value obtained with linear fracture
mechanics
KI is the stress intensity factor toughness value
KIc is the critical stress intensity factor toughness value mode I
deformation
KImax is the maximum value of KI
KImin is the minimum value of KI
Kinitial is the initial rotational stiffness of a semi rigid connection
kp is the stiffness of the assembled plates
kr is the stiffness of the rivet
Krot is the rotational stiffness of a connection
Kth is the threshold of the stress intensity factor
Kv is the Charpy-V value
L is the length
Ls is the length of the segment

IX
m is the inclination of the detail categories, 3 or 5
M is the moment acting on the connection
n is an experimentally determined parameter in Paris equation
N is the number of cycles
ni is the applied number of cycles at a specific stress range
Ni is available number of cycles at a specific stress range
r is an length in polar coordinates with their origin at the crack tip
Reh is the upper elastic limit (current standard for measuring the yield
strength fy)
Rel is the lower elastic limit (old standard for measuring the yield
strength fy)
Rm is the ultimate strength (fu)
Rp0.2 is the yield strength at 0.2 % elongation
t is the thickness
T is a factor adjusting the stiffness
U is the elastic energy
U0 is the elastic energy in the plate without a crack
Ua is the elastic energy for a crack length in the segment
Uno is the elastic energy needed to deform the segment continues girder
UnoT is the elastic energy needed to deform segment when transformed to
a semi rigid connection
w is the height of the cracked beam or segment
Greek notations α is the degree of continuity
ΔσD is the constant amplitude fatigue limit
ΔΚ is the stress intensity factor range

Fatigue assessment of riveted bridges
X
ΔΚth is the threshold value of the stress intensity factor range
Δσs is the stress range
ΔσR is the fatigue resistance for 2 x 10⁶ cycles
Δσe is the equivalent stress range
ΔσL is the cut off limit
ΔσCD is the detail category
ε is the change in elongation of the rivet due to an external load,
equal in both the rivet and the plate unless the plates are separated
φs rotation of stringer connection
θ is an angle in polar coordinate with their origin at the crack tip
σs is the stress
σc is the critical stress in the plate without a crack
σmin is the maximum value of the stress
σmax is the minimum value of the stress
τ is the shear stress

XI
Contents
PREFACE............................................................................................................. I
SUMMARY ........................................................................................................ III
SAMMANFATTNING........................................................................................ V
NOTATION ...................................................................................................... VII
1 INTRODUCTION ........................................................................................ 1
1.1 GENERAL BACKGROUND .............................................................................................. 1 1.2 OBJECTIVES AND LIMITATIONS..................................................................................... 6 1.3 OUTLINE AND CONTENT ............................................................................................... 7
2 BACKGROUND AND THEORY OF MATERIAL AND FATIGUE........ 9
2.1 INTRODUCTION ............................................................................................................ 9 2.2 MECHANICAL PROPERTIES AND DEFINITIONS................................................................ 9 2.2.1 Toughness ........................................................................................................ 10 2.2.2 Metal characteristics ....................................................................................... 13 2.2.3 Chemical compounds ....................................................................................... 15

Fatigue assessment of riveted bridges
XII
2.2.4 Swedish evaluation codes................................................................................. 15 2.3 RIVETED CONNECTIONS ............................................................................................. 18 2.3.1 Clamping force ................................................................................................ 19 2.3.2 Tension connections......................................................................................... 22 2.3.3 Shear connections ............................................................................................ 23
2.4 INTRODUCTION TO FATIGUE ....................................................................................... 25 2.5 CALCULATING THE AVAILABLE FATIGUE LIFE ............................................................ 29 2.5.1 The use of Wöhler diagrams ............................................................................ 29 2.5.2 Fracture mechanics ......................................................................................... 33
3 LITERATURE SURVEY OF FATIGUE TESTS.....................................41
3.1 INTRODUCTION .......................................................................................................... 41 3.2 FATIGUE TESTS PERFORMED ON GIRDERS AND SMALL SCALE SPECIMENS.................... 41 3.3 CONNECTIONS BETWEEN GIRDERS.............................................................................. 46 3.3.1 Initial stiffness of semi rigid connections ......................................................... 48 3.3.2 Parameters influencing the initial stiffness ...................................................... 56 3.3.3 Tests conducted on the degradation of semi rigid connections........................ 58 3.3.4 Evaluation of the initial stiffness models.......................................................... 64
3.4 FRACTURE MECHANICS .............................................................................................. 65 3.5 SUMMARY ................................................................................................................. 68
4 MATERIAL PROPERTIES OF OLD STEEL BRIDGES ......................71
4.1 INTRODUCTION .......................................................................................................... 71 4.2 GATHERING OF DATA ................................................................................................. 72 4.2.1 Structure of the data base ................................................................................ 72
4.3 EVALUATION OF THE DATA BASE ............................................................................... 74 4.3.1 Material properties for steel in bridges constructed before 1901 .................... 75 4.3.2 Material properties for steel in bridges constructed 1901 to 1919 .................. 75 4.3.3 Material properties produced in the years 1919 to 1940................................. 77
4.4 MATERIAL PROPERTIES OF RIVETS ............................................................................. 81 4.4.1 Tensile tests on rivet material at LTU.............................................................. 82 4.4.2 Material properties for rivets........................................................................... 85
4.5 SUMMARY ................................................................................................................. 86 5 FATIGUE LIFE OF RIVETED GIRDERS.............................................89
5.1 INTRODUCTION .......................................................................................................... 89 5.2 EVALUATION OF FATIGUE ENDURANCE ...................................................................... 89 5.3 PLATE GIRDERS.......................................................................................................... 90 5.4 TRUSS GIRDERS.......................................................................................................... 94 5.5 CONSTANT AMPLITUDE AND CUT OF LIMIT ................................................................. 95 5.6 CLAMPING FORCE ...................................................................................................... 97
XIII
5.7 HOLE PREPARING TECHNIQUE .................................................................................. 100 5.8 CORROSION ............................................................................................................. 101 5.9 MATERIAL ............................................................................................................... 102 5.10 SUMMARY ............................................................................................................... 105
6 FIELD MEASUREMENTS ON THE KERÄSJOKK BRIDGE............107
6.1 INTRODUCTION ........................................................................................................ 107 6.2 MEASUREMENTS...................................................................................................... 109 6.2.1 Deflection measurement................................................................................. 110 6.2.2 Strain measurements...................................................................................... 110 6.2.3 Laser measurement ........................................................................................ 111 6.2.4 Trains used in the measurements ................................................................... 111
6.3 RESULTS .................................................................................................................. 112 6.3.1 Deflection results ........................................................................................... 112 6.3.2 Strain results .................................................................................................. 116
6.4 SUMMARY ............................................................................................................... 118 7 FEM ANALYSES OF THE KERÄSJOKK BRIDGE ............................119
7.1 INTRODUCTION ........................................................................................................ 119 7.2 MODEL INFORMATION.............................................................................................. 120 7.3 RESULTS .................................................................................................................. 123 7.3.1 Strains ............................................................................................................ 123 7.3.2 Deflections ..................................................................................................... 127
7.4 SUMMARY ............................................................................................................... 130 8 STIFFNESS DEGRADATION AND CRACK PROPAGATION IN CONNECTIONS ..............................................................................................131
8.1 INTRODUCTION ........................................................................................................ 131 8.2 FRACTURE MECHANICS TO EVALUATE THE STIFFNESS DEGRADATION....................... 132 8.2.1 Evaluation of the fracture mechanic model ................................................... 139 8.2.2 Fatigue life calculation .................................................................................. 145 8.2.3 Summary ........................................................................................................ 149
9 SUMMARY AND CONCLUSIONS ........................................................151
9.1 SUMMARY ............................................................................................................... 151 9.1.1 Assessment of riveted bridges - Introduction ................................................. 151 9.1.2 Increase of the allowable axel load ............................................................... 151 9.1.3 Cracks discovered in a bridge........................................................................ 154
9.2 CONCLUSIONS.......................................................................................................... 157 9.3 FUTURE RESEARCH .................................................................................................. 158

Fatigue assessment of riveted bridges
XIV
REFERENCES.................................................................................................159
APPENDIX A THE DATA BASE APPENDIX B FATIGUE TESTS APPENDIX C MOMENT AND STIFFNESS CALCULATIONS

XV

Fatigue assessment of riveted bridges
XVI

Introduction
1
1 Introduction
1.1 General background The majority of the railways of today were built in the beginning of the 20th century. A histogram of the amount of Swedish steel railway bridges from the end of 21st century can be seen in Figure 1.1, Åkesson (1994). At that time around 1100 steel bridges were in service, and 800 of them were erected before the 1940’s. Most of the bridges built before the 1940’s are still in service today. This was achieved by designing the bridges with an overcapacity, this extra reserve in the design of the bridges was done because the axle loads of trains and locomotives were changed quite frequently during this period, Åkesson (1994). To ensure that the bridge stock could manage future alterations in axle load and remain in service, a buffer was assigned to their resistance. The small amount of road bridges from this era is because they became too narrow and have been replaced, Figure 1.2, whereas the train width has stayed the same during the years, another contributing factor to the large amount of old railway bridges still in service.

Fatigue assessment of riveted bridges
2
Figure 1.1 The Swedish railway bridge stock in the beginning of the 1990 with respect to their construction year, Åkesson (1994) In 2003 the European research project Sustainable Bridges (2003) was initiated because of the situation with an increasing number of old bridges still in service in Europe. Depending on the large number of bridges reaching their design service life it is impossible to replace them all at the same time. The objectives for the Sustainable Bridges project were to increase the transport capacity of existing bridges by increasing the allowable axle weights, and increasing the residual life time of existing bridges with up to 25 %. Part of the work in this thesis has been conducted within the project Sustainable Bridges (2003).
Figure 1.2 A narrow road bridge situated at Torres del Paine Chile, Rich et al (2004) To be able to predict how bridges can stay in service longer or the possibility of a load increase, enhancement of the existing assessment methods has to be made and critical areas in the design of bridges identified. An outline of an assessment of a bridge and regions where damages are recurrent are presented to identify and to provide improvements to assessments of bridges and the objectives of this thesis.

Introduction
3
The Swedish code for assessment of railway bridges, Bärighetsberäkningar av järnvägsbroar, BVS 583.11 (2005) have been used to compare and identify areas where improvements can be made in an assessment of a bridge. The reason for an assessment of a bridge can differ but often it origins from a scheduled inspection that discovers damages, or a desire to increase the allowable axle load of the line. The main steps in an assessment of a bridge to investigate the possibility of a load increase can be seen in Figure 1.3, and are described below. First an inspection of the bridge is performed. If no damages are detected, a control of the load resistance of the bridge is carried out by calculating load effects and comparing them to the design resistance of the bridge. If the material properties of the bridge are unknown the Swedish code, BVS 583.11 (2005), provides recommendations for which properties to use in a resistance calculation. Can the bridge stand the increase of the axle load when comparing the load effects and the resistance? If the resistance of the bridge is insufficient special investigations have to be performed to ensure the resistance, as stress measurements, or statistical calculations of loads and resistance parameters, otherwise measures as strengthening or replacement must be decided. If the resistance of the bridge is sufficient the assessment continues with the determination of the remaining service life. This is often done by establishing the load history of the bridge by using the concept of equivalent freight trains, for which information can be found in BVS 583.11 (2005) or in Sustainable Bridges (2007). Estimations of the remaining service life is carried out by determining the amount of freights that has passed the bridge during its years in service, and the use of information concerning bogie configurations, speeds and axel loads for different time periods of the equivalent freight trains. With this information the stress range and the number of load cycles the bridge has been exposed to can be revealed. By comparing the number of load cycles and the stress range from the time in service to the available, an answer to the question about the remaining fatigue life is obtained. The available number of load cycles at a specific stress range is often determined by detail category C 71 for riveted girders. If the remaining fatigue life is sufficient the bridge has passed the assessment and can thereby be trafficked with the higher axle load. However if the design fatigue life has been used up according to calculations, special investigations as measurements or a statistical approach can be employed to get a better picture of the fatigue damages experienced by the bridge. Examples of these procedures can be found in Andersson (2009).

Fatigue assessment of riveted bridges
4
Another cause for an assessment of a bridge is when damages have been discovered, and to determine their influence on the load capacity. Damages such as cracks are mapped during inspections and calculations of the design resistance of the damage cross section are carried out. Although estimations are done in practice of how and when the cracks can affect the capacity of the bridge, how this should bee carried out is not stated in the code BVS 583.11 (2005).
Inspection
No cracks
Determine loads effects
Determine design resistance
Yes No
Determine load history
Sufficient remaining fatigue life
Yes No
Ok
Special investigations
Special investigations
Ok?
Figure 1.3 A rough flowchart of an assessment of a bridge to investigate the possibility to increase the available axle load To identify weak areas in the design of bridges which can need an extra attention in an assessment, reports of inspections and repairs of bridges is a good source of information. A summary of reported fatigue damages and reparation was investigated by Al-Emrani (2006) and Fisher et al (1987). In the reports concerning riveted bridges, it was found that fatigue damages was recurrent in connections between the girders in the secondary structure, girders parallel and perpendicular to the bridge, transferring loads from trains or cars to the main girders of the bridge.

Introduction
5
The girders of the secondary structure, stringers and cross girders are often in focus in assessments due to their length and position in the bridge makes them more exposed to fatigue damage than other parts in a bridge. Another cause of damages in bridges comes from collisions either from freight that comes loose and smashes in to the bridges as the traffic passes, or when trucks or busses collide with the underside of a bridge, Boström (1992). Collision damages can lead to the up come of fatigue cracks in steel bridges and are often of interest in an assessment. From the brief description of an assessment and the critical areas of bridges where damages are most likely to occur, the following areas have been identified either as an area where more research is needed or where a better understanding of the real behaviour can lead to a better approximation of the resistance or provide better predictions of the remaining service life.
⎯ Material properties provide by the code BVS 583.11 (2005) for the calculations of the resistance are very low for early produced bridges. If the properties used in the assessment calculations better reflected the properties of the investigated bridge an increase of the design resistance could be obtained.
⎯ Does the detail category used in the evaluation of the remaining fatigue
life of riveted girders provide a lower bound estimation. Also how does the corrosion or methods of production of riveted girders influence the fatigue life, information that is vital in the prediction of remaining service life.
⎯ The assumption made in the design of connections between the stringers
and cross girders in through truss bridges where that they can be treated as pinned. How those this influence the load effects of stringers and can prediction of crack propagations in the connections be made. More information concerning these areas could also improve the possibility to make better predictions of the remaining service life of riveted bridges.

Fatigue assessment of riveted bridges
6
1.2 Objectives and limitations To extend the service life of old riveted bridges, this thesis has focused on the material properties of steel bridges constructed before the 1940’s and the predictions of remaining fatigue life of riveted structures. The objectives are:
⎯ Improve the knowledge of material properties in existing steel bridges
⎯ Determine the detail category that best represents the fatigue life of riveted assembled girders
⎯ Increase the understanding for how the influence that corrosion, material
properties, hole preparation methods and clamping forces has on the fatigue life of riveted girders
⎯ Determine how connections between stringer and cross girders should be
modelled with FE-programs to determine the stress in the stringers
⎯ Develop a model for estimation of the stiffness degradation and cracking propagation in connections between stringer and cross girders after a crack has been initiated
The limitations are:
⎯ Investigations concerning material properties only contain information from Swedish and German bridges constructed before the 1940’s
⎯ Results from fatigue tests have either been provided directly from
researchers or obtained by gathering information from presented findings in literature. No own fatigue tests have been conducted
⎯ Measurements were only available from one bridge, the Keräsjokk Bridge
in the evaluation of how to model connections between stringers and cross girders
⎯ The fracture mechanical model has only been evaluated to one connection
type, the tests conducted by Al-Emrani (2002)

Introduction
7
1.3 Outline and content In Chapter 2 a short introduction is given concerning properties of steel material. Also the up come of fatigue and approaches for determining the fatigue life is introduced. The information is provided to give an understanding of the research carried out in continuing chapters. A survey of full scale fatigue tests and tests on specimens retrieved from riveted bridges can be found in Chapter 3. The study aims to determine the fatigue life of riveted girders and influencing factors. Models to determine the initial stiffness of semi rigid connections is also examined and how fatigue loading of these connections provides cracking and loss of stiffness. How fatigue cracking has been evaluated by fracture mechanics by other researchers has also been studied. In Chapter 4 the work of creating a data base to improve the knowledge about material properties for steel bridges built before the 1940’s is described. The information in the data base for different time periods are presented together with recommendations of what properties that can be used in an assessment of a steel bridge. Based on the literature survey in Chapter 3 an evaluation is performed concerning the fatigue life for riveted girders. Parameters that influence the fatigue endurance as clamping forces, hole preparation methods, corrosion and material properties are also evaluated in Chapter 5. Chapter 6 describes field measurements that were carried out on The Keräsjokk Bridge, a through truss bridge erected in 1911. Results from the measurements were used to determine the best way of modelling the connections between stringer and cross girders, this information is presented in Chapter 7. In Chapter 8 a fracture mechanic approach is used to estimate the degradation of the stiffness in connections between stringer and cross girders when a crack has initiated. The fracture mechanic model is an analytical approach used to describe the behaviour of the tested connections in Chapter 3. In Chapter 9 it is illustrated how the work in this thesis can be used to improve assessment of bridges. In Appendix A the part of the data base containing information concerning the yield strength and the ultimate limit as information concerning toughness can be found.

Fatigue assessment of riveted bridges
8
The results used in the evaluation of the detail category representing riveted girders fatigue life as well as small scale tests used to investigate influencing factors of the fatigue life of riveted structures can be found in Appendix B. Calculations used to define the decrease of stiffness in the connections between stringer and cross girders as they crack, and how this affects the bending moment in the stringers can be studied in Appendix C.

Background and theory of material and fatigue
9
2 Background and theory of material and fatigue
2.1 Introduction A general view of the theory employed in this thesis will be presented in this chapter to provide background to the research carried out in following chapters.
2.2 Mechanical properties and definitions Strength properties for steel are usually described by the yield and the ultimate strength. These properties are determined by tensile tests and displayed in stress strain plots. In Figure 2.1 two plots of tensile tests are shown, representing two different types of steel behaviour. The first plot has a characteristic plateau where the steel yields, called the yield limit. The yield limit can be measured in two different ways, depending on standard. In the old standards, the lower yield limit of the steel was measured, marked in Figure 2.1 as Rel. In the present standards the higher yield limit, Reh, is the referred yielding characteristic of steel, also named fy.

Fatigue assessment of riveted bridges
10
After the steel yields, it plasticizes and hardens with continuing deformation until it reaches its ultimate strength, Rm, also named fu. The second plot in Figure 2.1 does not have a characteristic yield plateau. In these cases an elongation of 0.2 % is used to define an equivalent yielding strength, called Rp0.2, this behaviour is most common for old and stainless steel. The ultimate strength Rm has the same characteristics as the first plot.
Rm
Reh Rel
Ag
A
Elongation ε
Stress σ
Elongation ε
Stress σ
0.2 %
Rm
Rp0,2
Figure 2.1 Stress strain plot of steel tensile tests Rel is the lower elastic limit (old standard for measuring the yield
strength fy) [N/m2] Reh is the upper elastic limit (current standard for measuring the yield
strength fy) [N/m2] Rp0.2 is the yield strength at 0.2 % elongation [N/m2] Rm is the ultimate strength (fu) [N/m2] Ag is the elongation before reduction of area at fu [m] A is the elongation at failure [m] E is the Young’s modulus (fy/ε) [N/m2]
2.2.1 Toughness Toughness is the key factor to determine the type of failure that will follow due to cracking in steel and other materials. A low toughness will lead to a brittle failure, while a high toughness will provide a ductile failure, with yielding and big deformation. An important factor to which kind of failure that will occur is the temperature. A method to determine toughness properties of material was developed by Charpy in 1901. The method of Charpy includes a specimen with a sharp notch. The samples are then placed in the bottom of a stand equipped with a pendulum. The pendulum is released and strikes the sample. Due to that a certain amount of

Background and theory of material and fatigue
11
energy is needed to break the notched specimen the pendulum will not reach the same height as it had at the starting point. The difference in height of the pendulum is equal to the energy needed to break the sample, which is the notch value for the material called Kv, Eriksson (2006a). Today the method of Charpy have been standardised and the test specimens have the dimension 10 x 10 x 55 mm with a sharp V shaped notch at the middle of the specimen, giving the name for the testing procedure Charpy-V tests.
h
Notch
Figure 2.2 Charpy test used to determine the notch value of structural steel The toughness is highly dependent on the temperature. A test performed at a low temperature does not absorb the same amount of energy as an identical sample tested at room temperature. The temperature where the shift from a brittle to ductile fracture occurs is called the transition temperature, Figure 2.3. Due to this an international agreement the Bonhomme recommendation, was established concerning test temperatures and minimum notch values for structural steel. The minimum notch value was decided to be 27 J and it shall be obtained for the temperatures 0, -20 and -40 °C, for the toughness grades C, D and E. In structures the loading rate differs from the Charpy-V test, as do the geometry, the notches, and the thickness of the material, all these factors contribute to the shift in transition temperature. Thus Charpy-V test and structures will not have the same transition temperature. This makes the Charpy-V tests best suited to validate newly produced steel, if the steel fulfils the requirements of the Bonhomme recommendation, and less appropriate in the evaluation of structures transition temperature.

Fatigue assessment of riveted bridges
12
Kv
Temperature
Figure 2.3 The relationship between notch energy and temperature The code, Brottseghet hos konstruktionsstål i järnvägsbroar, BVS 583.12 (2003) provides recommendations for how to retrieve and evaluate toughness tests. It also regulates the remaining time in service of a bridge depending on its toughness properties. The fracture mechanic tests recommended in BVS 583.12 (2003) to determine the toughness of metals in old bridges is the compact tension test (CT-test) and the three point bending test. A typical CT-test can be seen in Figure 2.4. A notch is machined and the sample is then exposed to a fatigue loading to originate a crack in the notch. The test is then torn in two halves to determine its toughness. The toughness of a tests is either evaluated with non linear fracture mechanics, the Jc value [N/mm], or with linear fracture mechanics, the Kc value [N/mm3/2].
If the toughness of a linear elastic material is evaluated by a non linear elastic approach (Jc value) the Kc value can be derived by Equation (2.1).
c cK J E= ⋅ (2.1)
F
F Notch Three point bending test CT-test
F
Figure 2.4Three point bending and tension test, CT-test

Background and theory of material and fatigue
13
2.2.2 Metal characteristics Cast iron Cast iron is characterised by having carbon content over 2 %. Due to the high carbon content forming of the metal can only be achieved by casting the iron in forms having the shape of the final product. The characteristics of the material are good in compression but poor in tension. Thus, the structural parts where often designed to be in compression as arches and columns, an example of an arch bridge built with cast iron is the Iron Bridge finished in 1781, Figure 2.5.
Figure 2.5 The Iron Bridge opened in 1781 Grey cast iron with lamellar graphite was the most used quality. The name originates from the grey fracture surface of the material. The laminar shape of the graphite in the cast iron occurs due to the relative slow cooling process of the cast. The graphite flakes caused a significant brittleness of the material. Internal cracks can easily occur and propagate along the flakes when the iron is subjected to tensile stresses. Additional properties of cast iron are good wear resistance and damping abilities, absorbing vibrations and noise. Negative features are brittle material and poor resistance to impact. Cast iron is not suitable for welding due to its high carbon contents, which can lead to brittle cracks in and around welded joints Cremona et al (2007).

Fatigue assessment of riveted bridges
14
Wrought iron Wrought iron and puddle steel are two names on the same product. It was replaced by (mild) steel, in the end of the 19th century. Characteristics of the wrought iron are low carbon content with high amounts of phosphor and nitrogen making the material brittle and escalating the ageing process. The microstructure is non homogenous due to the manufacturing process producing inclusions of sulphides and oxides. This led to anisotropy of the material which is especially bad in the thickness direction due to the arrangement of the inclusions and the influence of the rolling Cremona et al (2007). Mild steel or steel The mass production of steel started with the Bessemer process 1856, followed by the Martin-Siemens process 1867 and the Thomas-Gilchrist process 1878. Most of the old metal bridges still used today consist of steel produced with one of these processes. Production of steel in the end of the 19th and the beginning of the 20th century were conducted with a technique called chill module casting. The chill module casting was performed by pouring the steel from the furnace in to a chill module, a big bowl, to cool down before rolling of the steel. The cooling process in the module started from the borders, with high temperatures in the middle. During the cooling process almost pure steel formed at the borders and unwanted alloys and impurities increased towards the centre of the melt. When the temperature in the chill module decreased to ~1500 °C, also the soluble ability of oxygen in the steel is decreased. Oxygen was then released in to the steel fusion and blisters formed. To decrease the blisters alloys as manganese, silicon or aluminium were added. Another partition also took place in the centre of the cooling steel. Lighter particles rose while heavier sunk. Due to this manufacturing process impurities and blisters increased in the middle of the steel. Concentrations of unwanted particles in the top of the chill module were removed before the rolling, but the concentration in the middle was not affected by these measures. Steel produced during these circumstances are not considered good or appropriate as construction steel today. What makes these steels less appropriate is not only the fact that blisters formed. It is also the high concentrations of unwanted compounds formed in the middle of the steel that drastically lower the quality. A plate manufactured with this technique will have steel with very good qualities at the surface while the centre of the plate will have more brittle properties.

Background and theory of material and fatigue
15
Generally early produced steel is not suitable for welding, due to the big variation in toughness. Cracks can originate due to the residual stresses from the heat affected zone of the weld Cremona et al (2007).
2.2.3 Chemical compounds Depending on what alloys that are used in the manufacturing process different characteristics of the final product can be obtained. In Table 2.1 some of the most common alloys used in the manufacturing process of steel and their influence on the final product can be found. Chemical analysis of steel can reveal essential information concerning the manufacturing process, weldability, toughness and the process of embrittlement, Stenbacka (1980). The amount and of alloys in common structural steel can be seen in Table 2.2 Bergh (1980). Table 2.1 Influence on the material properties of steel from different alloys, Höhler (2005)
Properties C Si Mn P S Cr Ni Mo Al N Ultimate strength + + + + - + + + + + Elastic limit + + + + + + + Ultimate elongation - - - - + - - - - Hardness + + + + + + + + Hardenability + + + + + + Toughness (Charpy V impact energy)
- - + - - - + - -
Arc weldability - - + - - - + - - Thermal resistance + + + - + + + Corrosion resistance + + - + + + + Material properties is increased, - Material properties is decreased
Table 2.2 Chemical compounds of common structural steel, Bergh (1980)
C [%]
Si [%]
Mn [%]
P [%]
S [%]
Cr [%]
N [%]
Cu [%]
Ni [%]
0.10-0.20
0.0-0.50
0.6 0.010-0.080
0.010-0.060
<0.3 0.002-0.015
≤0.4 ≤0.1
2.2.4 Swedish evaluation codes The Swedish Rail Administrations code Bärighetsberäkningar av järnvägsbroar BVS 583.11 (2005) provides values to be used in assessment of bridges if the actual properties are unknown. The reference values of old steel characteristics, yield strength, fy, and ultimate strength, fu, are divided in four periods depending on when the bridge where constructed. If the referred steel grade of the bridge is not accounted for in the time period the lowest value of the yield strength, fy, of that period is chosen. The time periods and the characteristics of the mechanical properties of old steels are determined accordingly.

Fatigue assessment of riveted bridges
16
Steel in bridges built after 1955 Values of, fy, and, fu, can be determined by using the Swedish design code for steel structures, BSK 99 (1999). The referred values can be seen in Table A1 in Appendix A. Steel in bridges built between the years 1919 to 1955 Values of, fy, and, fu, should be determined accordingly for steel grade St 00 properties are equal to SS 1300 St 37 properties are equal to SS 1311 St 44 properties are equal to SS 1412 St 48 properties are equal to SS 2110 St 52 properties are equal to SS 2114 The characteristics for steel SS1300 to SS 2114 can be found in Table A1 in Appendix A Steel in bridges built between the years 1901 to 1919 Steel except soft steel has mechanical properties corresponding to St 37. The mechanical properties for St 37 can be taken as the corresponding values for SS 1311, multiplied with a factor 0.8. Soft steel class A has mechanical properties corresponding to SS 1412, multiplied with a factor 0.8. Steel in bridges built before 1901 The mechanical properties can be taken as the corresponding values for SS 1311 (see Table A1 in Appendix A), multiplied with a factor 0.55. Test to determine the mechanical properties If the mechanical properties of a bridge are determined by material testing, samples shall be made according to SS-EN 10002-1, where the five percent fractile determines the characteristic value. If material tests are used to determine the values of fy and fu a fracture mechanic and a chemical analyse must be performed to determine the ductility and chemical compound of the steel. Chemical test of bridge material The numbers of test specimens in a chemical analysis shall be at least three samples in primary structures in every span. From the retrieved samples shall at least two analyses be made, the mean values are used in evaluation of the properties. The size of the retrieved specimen shall be at least 25 mm in diameter. It can either be drilled or cut from a section. Samples shall be retrieved in sections with low utilization. The chemical compound of the steel must be in the intervals specified according to, Table 2.3. Information from a chemical

Background and theory of material and fatigue
17
analysis can reveal information concerning the toughness properties and the effect of corrosion. Table 2.3 Chemical compounds of steel
Steel C [%]
Mn [%]
Si [%]
P [%]
N [%]
Residual elements [%]
Carbon steel 0,05 – 0,20
0,2 – 1,0 0,00 – 0,50
0,01 – 0,06
0,002 – 0,015
0,5
Carbon manganese steel
0,05 – 0,20
1,0 – 1,7 0,00 – 0,50
0,01 – 0,05
0,002 – 0,015
0,5
Toughness test and requirements for bridges Due to cold climate conditions especially in the northern part of Sweden, requirements concerning the ductility of steel have been worked out, this to prevent brittle failures due to low temperatures. In the evaluation code BVS 583.11 (2005) it is stated that the toughness of steel has to be determined by a fracture mechanic evaluation according to the code Brottseghet hos konstruktionsstål i järnvägsbroar, BVS 583.12 (2003). Exceptions can be made if the steel fulfil the requirements of steel with a toughness class D according to the Bonhomme recommendations. The recommendations given in BVS 583.12 (2003) are valid for primary and secondary construction elements, hot rolled and riveted. The code does not cover the following components, conditions, steels, dimensions or stresses:
⎯ Wind, break and sway bracings ⎯ Steel with a yield limit greater than 350 MPa ⎯ Dimensions thicker than 50 mm ⎯ Stresses greater than 100 MPa
To determine the ductility at least three compact tension tests or three point bending tests have to be performed on the investigated component. If the result of a test series is not conclusive, additional test of three samples should be performed. The result should be evaluated according to:
⎯ The lowest fracture toughness of three to five samples ⎯ The second lowest fracture toughness of six to eight samples ⎯ The third lowest fracture toughness of nine or more samples
No action has to be made if the fracture toughness Jc is greater than 50 kN/m. If not actions depending on results from the fracture toughness analysis shall be determined according to Table 2.4.

Fatigue assessment of riveted bridges
18
Table 2.4 Actions depending on the ductility of the material
X X X Replace immediately. Actions according to investigation.
X X X
X X X
Replace within 5 years. Actions according to investigation.
X X X X X X
X X X
Inspection intervals according to the Swedish Rail Administration directions.
X X X No actions necessary. 20 50 Fracture toughness Jc [kN/m]
The nominal stress range should never exceed 70 MPa in a critical section. If the toughness of a load carrying element exceeds 50 kN/m it satisfies the structural integrity required in BSK 07 (2007). The toughness limit 20 kN/m is the lowest allowed and defined so that a failure of a structure will be ductile. With the above definition of the toughness requirement a crack of 50 mm can form in a component with a kept structural integrity. A crack of 50 mm is expected to be discovered in an inspection of a bridge.
2.3 Riveted connections Riveting today is mostly found in the field of aviation, however before the 1940’s the method of riveting was used to assemble all kind of metal structures and especially civil structures. The method of riveting two plates together was carried out by producing a hole in the plates that where to be assembled. Methods used for producing rivet holes where drilling, punching, sub-drilling and reaming, sub-punching and reaming. The plates where assembled by driving a hot rivet ~1000 °C through the hole of the two plates and by hammering the shank to form a second rivet head, see Figure 2.6. With the procedure of forming the second rivet head an increase of the diameter of the rivet was attained making the initial clearance between the rivet and the hole to decrease. When the rivet cooled, it contracted both longitudinal and radial, thereby provided a joining of the plates.

Background and theory of material and fatigue
19
Figure 2.6 On-site riveting
2.3.1 Clamping force Due to the cooling and the subsequent decrease in length of the rivet, a so called clamping force originates. The joining force acting on the assembled plates have been illustrated in Figure 2.7. The theory concerning the effect of clamping force is retrieved from the worked conducted by Fisher (1974). The decrease in length of the rivet cause a tension force to originate, Fclamp, which cause a contact pressure between the two joined plates. Assuming elastic conditions for both the plates and the rivet the force in the assembled parts is proportional to its change in length according to Equation (2.2) and (2.3).
p pF k ε= − ⋅ (2.2)
r rF k ε= ⋅ (2.3) Where Fp is the change in contact force between the plates ε is the change in elongation of the rivet due to an external load,
equal in both the rivet and the plate unless the plates are separated Fr is the change in rivet force kp is the stiffness of the assembled plates kr is the stiffness of the rivet The relation between the stiffness of the plates and the rivet, kp and kr, is that the stiffness of the plates is greater than that of the rivet. This depends on that the plates can distribute the force over a larger area than the forces in the rivet shank. The size of the clamping force, Fclamp, and the contact force Fci is equal if no external force is applied, see Figure 2.7.

Fatigue assessment of riveted bridges
20
When an external tension load, F, see Figure 2.7, is applied the rivet will elongate and the compressed plates expands. The total force in the rivet can be expressed as in Equation (2.4). During these conditions the increase in the external force provides an elongation of the rivet and the plates, ε. The addition of the an external force, F, results in a greater change in the compression of the plates (Fci- Fcl) than the tension in the rivet, this difference in change is called Fr in Figure 2.7.
( )rivet ci clF F F F= − +∑ (2.4) Where Fci is the is the initial contact force between the plates, see Figure 2.7 Fcl is the is the contact force between the plates when an external force
is applied, see Figure 2.7 A further increase of the external load, F, decreases the contact pressure until the plates separates. An elastic condition for when separation of plates occurs can be seen in Equation (2.5). The factor (kr/kp) depends on the dimensions of the connection, for most cases the ratio is in the range 0.005 to 0.10. This means when separation of the plates takes place the maximum increase in the rivet due to the external force is 5 to 10 % of the initial clamping.
1 rclamp
p
kF Fk
⎛ ⎞= +⎜ ⎟⎜ ⎟
⎝ ⎠ (2.5)
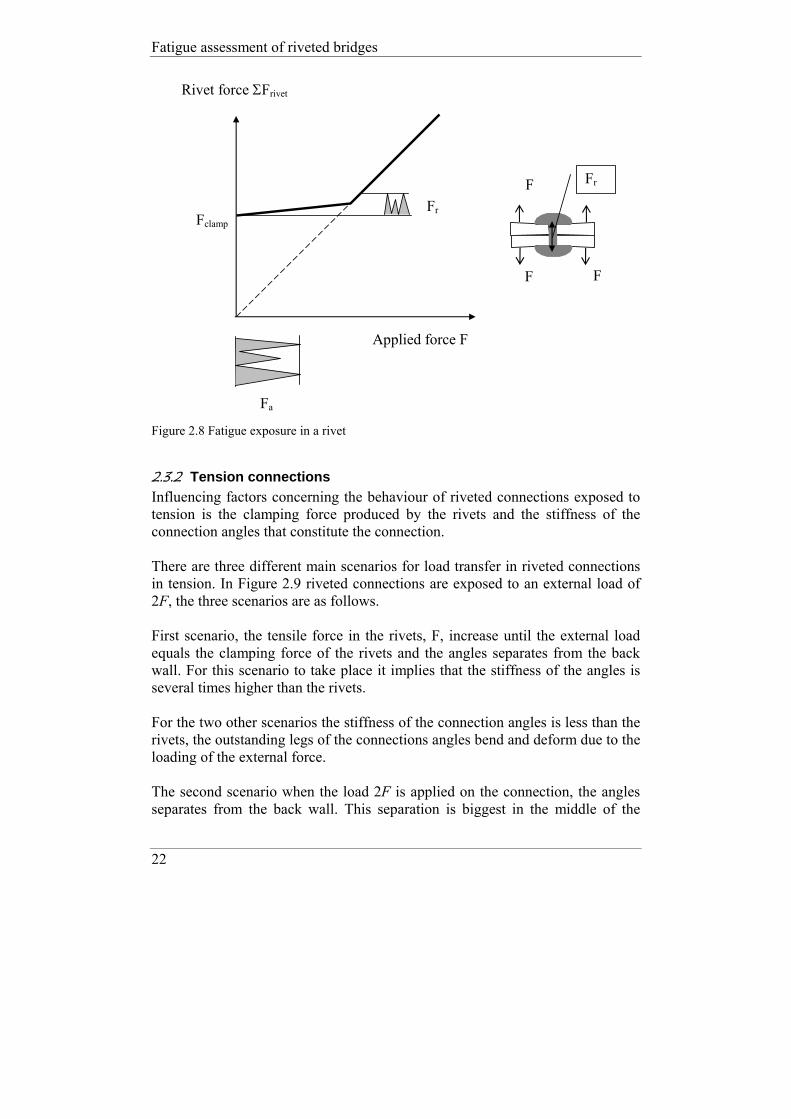
The presence of a clamping force decreases the stress range in rivets. The effect of the clamping force in a rivet is illustrated in Figure 2.8, where only the part of the applied load that exceeds the clamping force of the rivets give a contribution to a stress range that affect the fatigue life.

Background and theory of material and fatigue
21
F
ε
ε ε
F
Fr
Fclamp
Fci
Fcl
Σ F rivet Fp
Fclamp
Fclamp
Contact pressure
Σ Frivet
Contact force Fci
F F
Rivet Plate
Figure 2.7 Clamping force in rivet
Fatigue assessment of riveted bridges
22
F F
Fclamp
Fa
Fr
F
Applied force F
Rivet force ΣFrivet
Fr
Figure 2.8 Fatigue exposure in a rivet
2.3.2 Tension connections Influencing factors concerning the behaviour of riveted connections exposed to tension is the clamping force produced by the rivets and the stiffness of the connection angles that constitute the connection. There are three different main scenarios for load transfer in riveted connections in tension. In Figure 2.9 riveted connections are exposed to an external load of 2F, the three scenarios are as follows. First scenario, the tensile force in the rivets, F, increase until the external load equals the clamping force of the rivets and the angles separates from the back wall. For this scenario to take place it implies that the stiffness of the angles is several times higher than the rivets. For the two other scenarios the stiffness of the connection angles is less than the rivets, the outstanding legs of the connections angles bend and deform due to the loading of the external force. The second scenario when the load 2F is applied on the connection, the angles separates from the back wall. This separation is biggest in the middle of the

Background and theory of material and fatigue
23
connection. The separation arises due to deformation of the angles, causing them to flex towards the direction of the external force, minimal force is built up in the rivets due to this deformation. The third scenario is when the angles separate from the back wall as a combination of deformation of the angles and the rivets. The bending of the outer parts of the angles towards the back wall is causing prying forces to accrue. Additional axial and bending stresses originates in the rivet due to this prying action, the increase of force in the rivet is directly related to the bending and axial stiffness of the rivet and the angles, Al-Emrani (2002). The two last deformation scenarios are the most common in riveted bridges. The deformations of the connections are the cause of fatigue cracking in angles and rivets. The prying forces in the angles can cause plastic deformations of the rivets. A plastic deformation of a rivet will lead to a release or in a worse case a total loss of clamping force, which drastically lowers the fatigue endurance, Imam (2006).
M M M M M M M M
2F
F F
2F
FF
2F
P P F+P F+P
Back wall
Figure 2.9 Deformation scenarios one to three, depending on the stiffness between rivets and connections angles
2.3.3 Shear connections The size of the clamping force produced by rivets varies but can still be enough to transfer some shear by friction. In most joints subjected to normal service loads, shear forces is transferred as a mix of friction and shear of rivets. Initially the forces are transferred by friction at the ends of the joints, but as the load increases the friction zone extends towards the centre of the connection until the friction resistance is exceeded, Figure 2.10. As the joint starts to slip, the rivets at the end of a connection first come in contact with the surface of the rivet hole, and bearing stress arises. As the load increases the end rivets and the holes deform until all rivets are in bearing. Since the deformations of the rivets are greater at the ends of the connection the end rivets are carrying the greater load,
Fatigue assessment of riveted bridges
24
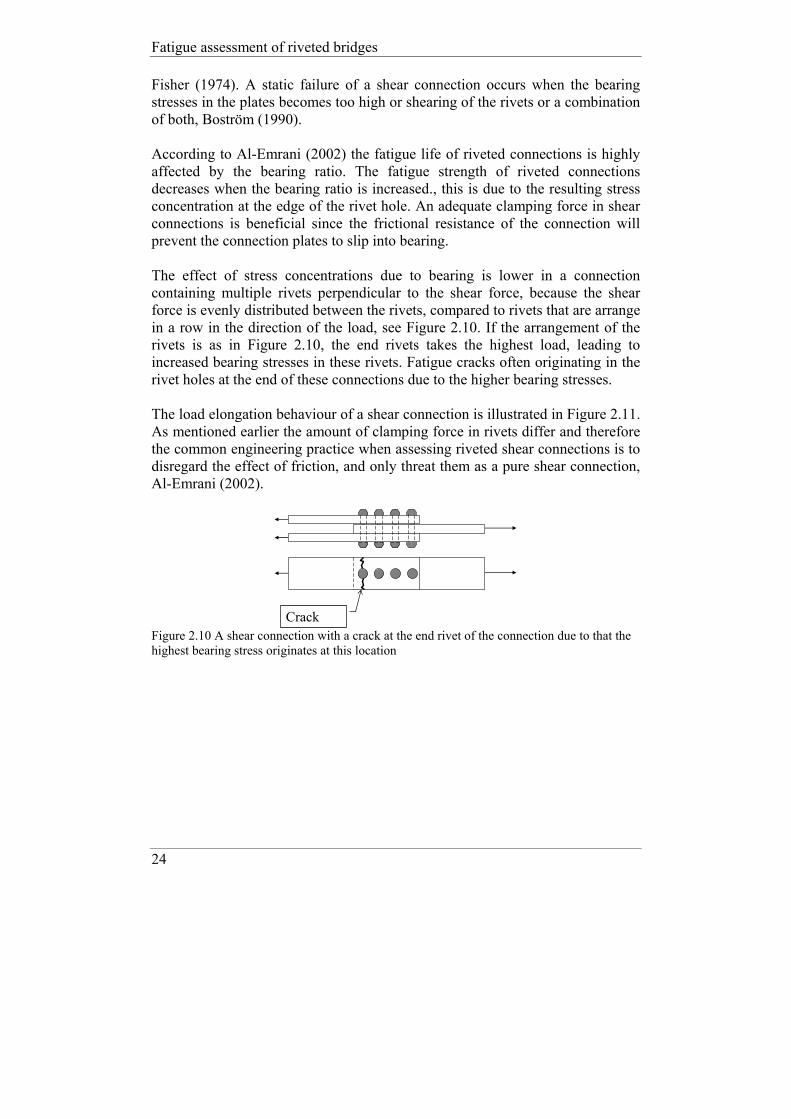
Fisher (1974). A static failure of a shear connection occurs when the bearing stresses in the plates becomes too high or shearing of the rivets or a combination of both, Boström (1990). According to Al-Emrani (2002) the fatigue life of riveted connections is highly affected by the bearing ratio. The fatigue strength of riveted connections decreases when the bearing ratio is increased., this is due to the resulting stress concentration at the edge of the rivet hole. An adequate clamping force in shear connections is beneficial since the frictional resistance of the connection will prevent the connection plates to slip into bearing. The effect of stress concentrations due to bearing is lower in a connection containing multiple rivets perpendicular to the shear force, because the shear force is evenly distributed between the rivets, compared to rivets that are arrange in a row in the direction of the load, see Figure 2.10. If the arrangement of the rivets is as in Figure 2.10, the end rivets takes the highest load, leading to increased bearing stresses in these rivets. Fatigue cracks often originating in the rivet holes at the end of these connections due to the higher bearing stresses. The load elongation behaviour of a shear connection is illustrated in Figure 2.11. As mentioned earlier the amount of clamping force in rivets differ and therefore the common engineering practice when assessing riveted shear connections is to disregard the effect of friction, and only threat them as a pure shear connection, Al-Emrani (2002).
Crack Figure 2.10 A shear connection with a crack at the end rivet of the connection due to that the highest bearing stress originates at this location

Background and theory of material and fatigue
25
Elongation
Load
Stage 1: Friction in the connection counteracting slip
Stage 2: Slip due to greater load than the available friction of the connection
Stage 3: Elastic deformation of rivets and holes
Stage 4: Yielding of the material in the rivets or the plates or both
Figure 2.11 Load elongation behaviour of a connection subjected to shear forces
2.4 Introduction to fatigue Fatigue is the most common cause of failure in steel structures, Eriksson (2006a). When conducting an assessment of a bridge, it is of great importance to understand the process of how fatigue develops in the material and as well as in the structure. Fatigue is not a new phenomenon, it has puzzled researcher for over 200 years. The problem with fatigue attracted attention with the use of metal in structures. One of the first to investigate the fatigue phenomenon was Wöhler 1819-1914. He conducted systematic investigations on train axles and why they broke during repeated loads lower than the static design load. Tests from fatigue investigations were plotted in diagrams with the stress range on the vertical axis and the number of cycles on the horizontal axis. To get a better overview of the results, the diagram was log scaled. A linearly result of the components fatigue life was thereby possible to detect. The diagrams developed to a standard for predicting fatigue life of details and structures, still used today and known as Wöhler diagrams or S-N diagrams, where S stands for the stress range and N for the number of cycles. Fatigue failures occur in details or whole structures due to repeated loading, the load levels leading to a fatigue failure are lower than the static resistance. The most important factor concerning fatigue is the stress range Δσ, but the exact form of the stress range has a marginal influence. Generally fatigue only develops through tension stresses, hence compressive loading will not contribute
Fatigue assessment of riveted bridges
26
to fatigue. The definition is only valid if the material is free from residual stresses, which seldom is the case due to processes such as rolling and welding. This makes it possible for compressive loading to contribute to fatigue. Stress range is defined accordingly to Equation (2.6) to (2.8)
minmax σσσ −=Δ σmin ≥ 0 (2.6)
maxσσ =Δ σmin < 0 (2.7) 0=Δσ σmax < 0 (2.8)
The processes leading to a fatigue failure are often explained in three stages, each stage with its own characteristics. The number of cycles for the different stages can vary significantly from hundred to millions of cycles depending on stress range, stress initiation factors, material properties etc. Stage 1 The first stage of the fatigue process is crack initiation. Cracks initiate through plastic deformations due to tension in grains situated in the steel structure. This occurs when the stresses in a crystal reach its yield point and the crystal begins to deform plastic. Plastic deformations in the crystals often have its origin at a notch or stress raisers such as dislocations, blisters, and inclusions of impurities etc. Deformations of crystals are caused by dislocation movement along the slip planes in the crystal structure. If a continued deformation and tension takes place, the dislocations will arrange them self after density, which is called persistent slip bands (PSB). The persistent slip bands are arranged along the primary slip plane in the vein structure, see Figure 2.12. The vein is the matrix between the PSB in the crystal, Eriksson (2006a).

Background and theory of material and fatigue
27
VEIN
PSB
High dislocation densityLow dislocation
density
Slip plane
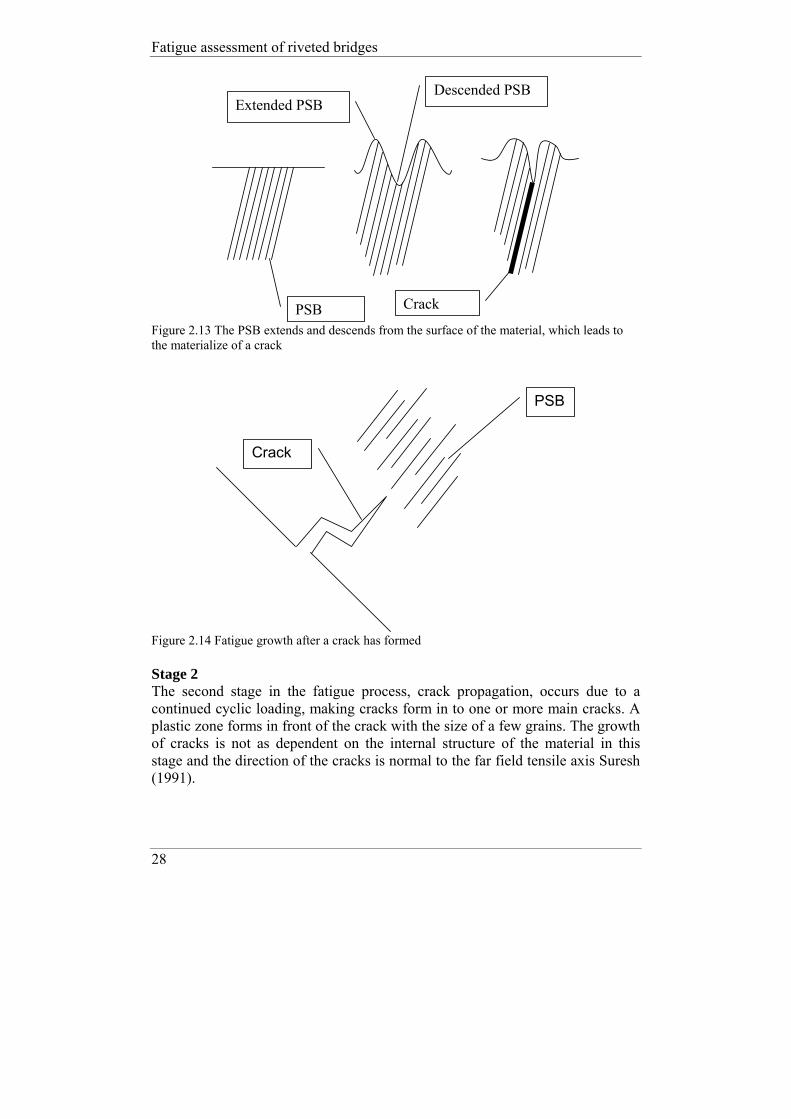
Figure 2.12 Forming of PSB and arrangement of dislocations in a crystal When the PSB reach a free surface, the plastic deformations increases with the numbers of load cycles. Some PSB will extend out from the material while others will descend. This mechanism forms early in the fatigue process and takes the form of a beginning crack. Exactly when the plastic movement and the formation of PSB becomes a crack are not fully known. At load levels near the fatigue threshold, approximately 90 % of the fatigue life will be the initiation stage of cracks. Slip bands can form at load levels lower than the fatigue threshold, which display that the forming of slip bands does not alone lead to fatigue cracking. The behaviour of the PSB and forming of the cracks are illustrated in Figure 2.13. After a crack has formed, the growth is influenced by the internal structure of the metal and grows in a staggering manner, see Figure 2.14.
Fatigue assessment of riveted bridges
28
PSB
Extended PSB Descended PSB
Crack
Figure 2.13 The PSB extends and descends from the surface of the material, which leads to the materialize of a crack
Crack
PSB
Figure 2.14 Fatigue growth after a crack has formed Stage 2 The second stage in the fatigue process, crack propagation, occurs due to a continued cyclic loading, making cracks form in to one or more main cracks. A plastic zone forms in front of the crack with the size of a few grains. The growth of cracks is not as dependent on the internal structure of the material in this stage and the direction of the cracks is normal to the far field tensile axis Suresh (1991).

Background and theory of material and fatigue
29
A phenomenon associated with the second stage is the formation of beach marks. In Figure 2.15 the crack propagation can be seen to move from the bottom to the top of the bolt leaving marks due to the growth of the crack.
Figure 2.15 Fatigue failure of a bolt, with clear beach marks Stage 3 The last stage in the fatigue process is rapid crack growth leading to failure when the remaining area of a section no longer withstand the load
2.5 Calculating the available fatigue life To determine the remaining fatigue life of structures due to fatigue exposure there are two main approaches, the use of Wöhler diagrams, and the use of fracture mechanics. These two separate methods of calculating the remaining fatigue life will be presented separately. In Section 2.5.1 the recommendations of Eurocode and the Wöhler curve concept with detail categories are presented. In Section 2.5.2 the background of fracture mechanics is presented and how cracks propagations are calculated.
2.5.1 The use of Wöhler diagrams Most codes used to calculate fatigue life employs the concept of Wöhler curves, however the shapes of the curves or detail categories as they also are called can differ between codes. The united design code with reference to fatigue in Europe is the EN 1993-1-9 (2003). In the code the fatigue life of details are evaluated by 14 detail categories, defined as the stress range after 2 x 10⁶
cycles i.e. the number of cycles a detail can endure before failure, marked as (1) in Figure 2.16. The notation (2) in Figure 2.16 indicates the constant amplitude limit. For a detail only affected by a constant stress range, the design of the predicted fatigue life can follow the horizontal design curve. A constant cyclic loading is quite
Crack initiation
Beach marks
Final failure

Fatigue assessment of riveted bridges
30
rare in structural engineering. The constant amplitude fatigue limit starts after N = 5 x 10⁶
cycles. If the stress range instead is varying the curve with the inclination m = 5 should be used. The cut of limit corresponds to N = 1 x 10⁸
cycles, number (3) in Figure 2.16. A varying stress range below this limit does not contribute to accumulated fatigue damage. Stresses that do exceed the cut of limit contribute to a damage accumulation.
Figure 2.16 Fatigue endurance curves according to EN 1993-1-9 (2003) The fatigue life of a structure can be derived when the detail category representing it is known. This is done according to Equations (2.9) to (2.13). Where Equation (2.9) is valid to 5 x 10⁶ cycles for both constant and varying stress range.
m m 6R CD 2 10Nσ σΔ ⋅ = Δ ⋅ ⋅ where m = 3 for N ≤ 5 x 10⁶ (2.9)
If the stress range is constant, the fatigue life beyond 5 x 10 6 cycles, should be based on Equation (2.10).
1/ 32 = 0.7375D CD CDσ σ σ⎛ ⎞Δ = ⋅ Δ ⋅Δ⎜ ⎟
⎝ ⎠ (2.11)

Background and theory of material and fatigue
31
However if the stress range is varied, it should be determined accordingly
6105 ⋅⋅Δ=⋅Δ mD
mR N σσ where m = 5 for 5 x 10⁶ ≤ N ≤ 1 x 10⁸ (2.12)
1
55 0,549100L D Dσ σ σ⎛ ⎞Δ = Δ = Δ⎜ ⎟
⎝ ⎠ the cut off limit N > 1 x 10⁸ (2.13)
Where ΔσR is the fatigue resistance for 2 x 10⁶ cycles N is the number of cycles m is the inclination of the detail categories ΔσCD is the detail category ΔσD is the constant amplitude fatigue limit ΔσL is the cut off limit
Estimation of remaining life The most common approach to determine the remaining life of existing structures is the Miners rule, stating that the damage at a certain stress range is proportional to the number of cycles. The fatigue endurance iN at a constant stress rang iσΔ indicates the available number cycles. The effect the number of cycles at a certain stress range has on a detail is compared to the allowable number of cycles and the fatigue life is reached when the accumulated damage equals one, see Equation (2.14) and Figure 2.17. The values of iN are determined by Wöhler curves for the corresponding value of iσΔ , Eriksson (2006a).
12
2
1
1
1=+++=∑
= n
nn
i i
i
Nn
Nn
Nn
Nn (2.14)
Where ni is the applied number of cycles at a specific stress range Ni is available number of cycles at a specific stress range

Fatigue assessment of riveted bridges
32
n1
n2
n3
Δσ1
Δσ2
Δσ3
N1 N2 N3
Figure 2.17 Accumulated fatigue damage during different stress range The Miners rule is not exact, but for the majority of stress spectra it will provide a safe estimation. A drawback is that the order of how stresses influence a detail will not be taken in to consideration which can affect the outcome of the fatigue endurance. Miners rule can overestimate the fatigue life, when there is an even stress spectrum with high mean stress and recurrent stress relieves. Another example is when the stress range contains a large amount of cycles under the cut off limit, the stress level under which no fatigue accumulation occurs Eriksson (2006a). Based on the Miners rule and Wöhler curves an equivalent stress range can be derived for varying stress spectra according to Equation (2.15), Imam (2006). With an equivalent stress range a more direct approach can be applied to determine the remaining fatigue life.
1/
1m
mme i i
iii
nn
σ σ⎛ ⎞⎜ ⎟Δ = ⋅ ⋅ Δ⎜ ⎟⎜ ⎟⎝ ⎠
∑∑ for N ≤ 5x 10⁶ (2.15)
Where Δσ e is the equivalent stress range m is equal to 3 Δσi is the stress range ni is the applied number of cycles at a specific stress range

Background and theory of material and fatigue
33
2.5.2 Fracture mechanics
Introduction With the introduction of welding in the 1930’s a large number of failures followed, especially ships and bridges where subjected to these events. Some of the most “famous” failures are the Liberty ships in the US. To increase the production pace in the US shipyards during the Second World War, the traditional technique of riveting was replaced by welding. The Ships built with this technique were intended to bring supplies to the allied forces, overseas hence the name the Liberty ships. A large number of these ships were lost at sea. At first they were believed to been sank by military forces. It was first when damaged ships managed to come in to port the reason for the big loss was discovered. Approximately 5000 ships were produced. Among them 1000 where damaged severely from brittle failures and 250 of these ships cracked so severely that they practically where divided in to two halves with cracks ranging from the deck to the keel. The Liberty ship Schenectady did not reach the seas at all, she fractured after being launched and tied up at the dock. Investigations of the failures showed that they originated from defects or notches such as sharp corners or welds. Methods to determine the ability of steel to withstand these effects were now needed to ensure that the material used had suitable properties to be used in the ships. The up come of these (brittle) failures can be seen as the starting point of the development of today’s ductile steel. Theories and methods on how to consider the effect of notches and crack like effects was developed in the field of mechanics, this special branch became known as “fracture mechanics”. The difference between Wöhler’s approach to evaluate fatigue and fracture mechanics is that fracture mechanics describes the situation when a crack has originated and gives an estimation of the rate of crack propagation and the remaining life. Previous load history does not have to be known as for evaluations of remaining fatigue life with Wöhler diagrams and detail categories.
Linear fracture mechanics In fracture mechanics one often differentiate between linear fracture mechanics and nonlinear. The linear fracture mechanics is used on brittle material with limited yielding at the crack tip. Modern construction steel is usually too ductile to be calculated with linear (elastic) fracture mechanics, but for the early metals produced in the late 19th century and the beginning of the 20th the theory of

Fatigue assessment of riveted bridges
34
linear elastic fracture mechanics do apply due to the brittle properties of the material. This thesis is focusing on early produced steel and therefore the theory of linear (elastic) fracture mechanics is applied. Linear fracture mechanics us the relationship of Griffith, that states that there must be a balance between potential energy and surface energy resulting from the presence of a crack, Hertzberg (1983). Griffith derived the relationship for the elastic energy of an elliptic crack in a wide plate, U(a), and how it changes with the growth of the crack, see Equation (2.16) and Figure 2.18.
2 2
0( ) a tU a UE
π σ⋅ ⋅ ⋅= − (2.16)
Where U0 is the elastic energy in the plate without a crack σ is the stress in the plate without a crack E is the Young’s modulus a is the crack length t is the thickness
2a
t
σ
Figure 2.18 Griffith plate

Background and theory of material and fatigue
35
An increase in crack length decreases the stiffness of the plate and less energy can be stored in the plate. When the crack grows the surface nearest the new crack is relived and energy is released. The energy per unit length of a crack tip (only half of the crack considered) or the strain energy release rate G can be written as Equation (2.17).
2( )dU a a tGda E
π σ⋅ ⋅ ⋅= − = (2.17)
U(a) decreases with the length of the crack, a minus sign (-) is therefore introduced to make the strain energy release rate a positive quantity. A fracture criterion can be formed, when G = Gc, Equation (2.18), a fracture will occur when the strain energy release rate G reaches a critical value.
2c c
ca tG
Eπ σ⋅ ⋅ ⋅
= (2.18)
Where σc is the critical stress in the plate without a crack ac is the critical crack length E is the Young’s modulus t is the thickness If the critical value of the strain energy release rate Gc is constant and do not depend on the critical stress σc or the critical crack length ac, one can see that the critical stress σc decreases with 1
a for different crack lengths. The magnitude
of the critical stress decreases with the length of the crack making large cracks more dangerous than short, Eriksson (2006b). Stress at tip of a crack The loading scenarios for a cracked body and the stress distribution at the crack tip can be described by three modes, see Figure 2.19. The most common mode for engineering structures is mode I, therefore most experimental and analytical methods has focused on that, Hertzberg (1983). The stress at the crack tip for mode I is given by Equations (2.19) to (2.21).

Fatigue assessment of riveted bridges
36
I II III
Z
X Y
Figure 2.19 Deformation modes I to III
3cos (1 sin sin )2 2 22
Ix
Kr
θ θ θσπ
= ⋅ ⋅ − ⋅⋅
(2.19)
3cos (1 sin sin )
2 2 22I
yK
rθ θ θσ
π= ⋅ ⋅ + ⋅
⋅ (2.20)
3cos sin cos
2 2 22I
xyK
rθ θ θτ
π= ⋅ ⋅ ⋅
⋅ (2.21)
Where r and θ is polar coordinates with their origin at the crack tip. A simpler expression is derived when r = x and θ = 0, that is when the crack propagates along the X axis, Equations (2.22) and (2.23).
2I
x yK
xσ σ
π= =
⋅ (2.22)
0xyτ = (2.23)
Where KI is the stress intensity factor An important fact from the above equations are that the stress distribution around any crack in a geometry is similar and depends on r and θ. The difference between two cracked geometries lies in the stress intensity factor KI that can be seen as a scale factor of the stress field around the crack tip. Beside of deriving the relation for the stress intensity factor to obtain the stress field surrounding a crack tip Irwin in 1975 also described the energy released

Background and theory of material and fatigue
37
per unit length of a crack, Equation (2.24). A relation between the stress intensity factor and the strain energy rate G, Equation (2.17), could thereby be established, Equation (2.25).
2IKdU t
da E− = ⋅ (2.24)
2IKG t
E= ⋅ (2.25)
Where U is the elastic energy E is the Young’s modulus a is the crack length t is the thickness The stress intensity factor can be written as in Equation (2.26), where f (a/W) is a dimensionless expression that depends on the geometry of the cracked body (can be found in fracture mechanic handbooks).
( )IaK a f wσ π= ⋅ ⋅ ⋅ (2.26)
Where σ is the stress a is the crack length f(a/w) is the ratio between the crack and the height of the cracked body As mentioned earlier the most crucial factor contributing to crack growth is the stress range. By making the assumption that for a cyclic stress range there is a corresponding cyclic stress intensity factor a relation between the crack propagation da/dN and the stress intensity factor range ΔK can be established as shown in Equation (2.27) and (2.28), Eriksson (2006b). In Figure 2.20 it is shown how the stress intensity factor range changes during the three phases of fatigue cracking, initiation of a crack, stable crack growth and the phase of fast crack propagation and failure.
( )( )
max max
min min
I
I
aK a f waK a f w
σ π
σ π
= ⋅ ⋅
= ⋅ ⋅ (2.27)

Fatigue assessment of riveted bridges
38
max min min
max min
max
0 0
0 0
K K K KK K KK K
Δ = − ≥Δ = <Δ = <
(2.28)
Log da/dN
Log ΔK
ΔKth
ΔKmax → KC
1
2
3
Figure 2.20 Crack propagation as a function of the stress intensity factor ΔK Region 1 The first region is the threshold value of the stress intensity factor range ΔK. At values less than the threshold, ΔKth, the crack propagation rate da/dN equals zero and no cracking occurs. The magnitude of the threshold depends on the stress ratio R, Equation (2.29).
min
max
R σσ
= (2.29)
When the R ratio is zero a higher value of the ΔKth is obtained than for a stress ratio R equal to one. In Figure 2.21 Christensen (1986) shows the shift of the threshold value due to the stress ratio.

Background and theory of material and fatigue
39
Figure 2.21 Relation between stress ratio and the threshold value, Christensen (1986) Region 2 The relationship between crack propagation and the stress intensity factor in region 2 is linear. In 1963 Paris (1963) found a relationship according to Equation (2.30) from which they where able to calculate the crack propagation in a body. By differentiating the equation the number of cycles required before the geometry failed could be determined.
( )nda C KdN
= Δ (2.30)
C is an empirical value determined from diagrams where the crack length and the stress intensity factor range are plotted for a material exposed to fatigue loading, see Figure 2.22. The value of C is the intersection of the Y axis obtained by extending the straight line of the test to the Y axis. n is in the range of 2 ~ 8 for metal material, and is also an empirical value. The value of n is determined as the inclination of the straight line of the material exposed to fatigue, see Figure 2.22. The crack propagation rate in region 2 is solely influenced by ΔK, each cycle will give a contribution to the crack length. Region 3 When the crack has reached a certain length the crack grows at an accelerated pace until ΔK reaches the value ΔKC and the material fails, Eriksson (2006b).

Fatigue assessment of riveted bridges
40
2 ~8
Figure 2.22 Fatigue crack propagation of A 36 steel, Ramsamooj et al (2001)

Literature survey of fatigue tests
41
3 Literature survey of fatigue tests
3.1 Introduction A survey of full scale fatigue tests and specimens retrieved from riveted bridges are studied to determine the fatigue life of riveted girders and influencing factors. Models to determine the initial stiffness of semi rigid connections is also examined and how fatigue loading of these connections provides cracking and loss of stiffness. How fatigue cracking in bridge girders and connections has been evaluated by fracture mechanics has also been studied. Information from this chapter is used as input in Chapters 5 and 8.
3.2 Fatigue tests performed on girders and small scale specimens
The first investigations on full scale tests on riveted structures taken out of service were initiated in the 1970’s. In the following section a literature survey of fatigue tests performed on riveted girders and details are presented.

Fatigue assessment of riveted bridges
42
The survey has been conducted to investigate what detail category that is best suited for evaluating a riveted bridge and how material, production methods for rivet holes, corrosion and clamping forces can influence the fatigue performance. The evaluation of the survey can be found in Chapter 4. Baker et al (1985) investigated the fatigue life of 11 riveted girders retrieved from a bridge. Field measurements were performed on the bridge to determine the fatigue damage. The measured stress range was between 47 and 52 MPa. The result of the measurements indicated that the accumulated damage from service was negligible. The tested riveted girders had a fatigue life greater than predicted by detail category C 71. Tests were also performed to investigate the influence of clamping force, six rolled beams were included in the tests. Holes where made in the flanges of the rolled beams and high strength bolts were placed in the holes to create a pre-stressing. Results from the tests showed 16 times longer fatigue life with high strength bolts placed in the holes compared to empty holes. The beams with empty holes in the flanges showed fatigue endurance lower than the design curve D in the American Association of State Highway and Transportation Officials, AASHTO, equal to detail category C 71, EN 1993-1-9 (2003). Mang et al (1993) investigated methods to determine the remaining life of riveted structures. This was done by conducting fatigue tests on both full scale riveted structures and on plates with pre-loaded bolts. The full scale tests ranged from a complete bridge to 13 full scale tests on main girders from bridges. Tests with pre-loaded bolts were conducted on plates from the tested girders. 15 tests were conducted with different amounts of pre stressing and 121 tests were conducted on plates with holes. The previous load history of the tested specimens did not seem to affect the fatigue life. Tests with high strength bolts provided positive response of the fatigue performance. Results from full and small scale specimens corresponded well. An evaluation of 15 railway bridges and fatigue tests on girders from a bridge built in the beginning of the 20th
century were carried out by Åkesson (1994). The test program consisted of nine stringers tested at a stress range between 40 – 100 MPa. Low stress range, 40 – 60 MPa, provided results indicating on an infinite fatigue life. The investigated girders showed redundancy, stresses redistribute to nearby components when cracks originated. An extended literature survey with results from over 1200 fatigue tests was conducted by Fisher et al (1990). Tests were also performed on 14 riveted girders retrieved from a railway bridge, to investigate the fatigue life. The fatigue tests were executed with varying temperatures, ranging from room temperature to -73 °C. In spite of the low test temperatures, the crack growth did

Literature survey of fatigue test
43
not seem to be affected. The literature survey showed that tests performed at a high stress range provided lower fatigue life, this was believed to be an effect of local yielding in the material. Further results from the survey performed by Fisher et al (1990) reviled that different hole preparations methods such as drilling, punching etc. did not have any influence on the fatigue performance. Plates with open holes had a better ability to endure fatigue than riveted joints. The investigation on full scale tests showed that girders without severe corrosion, developed cracks at a rivet holes. Sever corrosion made girders to develop fatigue cracks at the gross cross section. Cracks were formed at rivet holes unless more than 20 % of the gross cross section was lost due to corrosion. Forsberg (1993) investigated the fatigue life of corroded steel plates with open holes. Six specimens were included in the investigation, retrieved from the tension flanges of corroded INP 55 beams with varying states of corrosion. During service the beams had been subjected to approximately 1 x 10⁷ cycles at a stress ranged between 20 to 30 MPa. Fatigue tests were carried out at varied and constant stress range. The effect of light corrosion did not seem to affect the fatigue life, but a more sever state of corrosion made the fatigue performance drop drastically. The fatigue performance of plates and stringers with varying state of corrosion was investigated by Abe (1989). The fatigue investigations of the plates were conducted with stress range fro, 12 MPa to the yield strength of the material. Nine riveted girders fatigue life was investigated by applying a stress range between 74 to 137 MPa. The result from the investigation showed that light corrosion did not affect the fatigue life but sever corrosion shortened it. This was believed to be a result of reduced net area contributing to stress concentrations at rivet holes. Also the rough surface due to corrosion was believed to influence the results. Al-Emrani (2000) investigated the fatigue endurance of stringers, and how stop hole drilling could prevent or delay fatigue cracking. The fatigue threshold was investigated at a stress range of 60 MPa. The detail category C 71 was found to provide a lower bound estimation for the fatigue life of the tested stringers. A redundancy was observed for the tested girders, with slow and steady crack propagation and rather “ductile” fracture scenario. Six stringers were used in the investigation of the fatigue threshold. Zainudin (1997) continued the testing of three stringers which had been aborted in previous fatigue investigation at Chalmers. The number of cycles the girders had endured before the investigation started varied between 10 x 106
and 20 x 106 cycles, at a stress range from 40 to 60 MPa. The previous investigation had been aborted due to that the fatigue life was believed to be infinite. The stress

Fatigue assessment of riveted bridges
44
range in the continued tests was increased to 100 MPa. Results from the investigation showed that the fatigue endurance was well above the detail category C 71. The detail category was believed to give conservative estimation of the remaining life of riveted structures. Fatigue investigations was performed by Brühwiler et al (1990), comprising of full scale tests on three different girder types, four rolled girders with an extra cover plate riveted to the lower flange and six built up girders and three lattice girders made of wrought iron. The rolled girders where tested in cooperation with Rabemanantso et al (1984). Brühwiler et al (1990) concluded that corrosion of riveted girders did not provide lower fatigue life than none corroded. Factors contributing to this result were tight rivets and no corrosion in rivet holes. A corrosion loss of ~10 % of the cross section did not give a combined effect worse than the conditions of rivet holes. Wrought iron elements showed fatigue strength similar to steel. The failures in the lattice girders were always in the rivets due to shear stresses. Detail category C 71 provided a reasonable estimation of the fatigue life. The constant amplitude fatigue limit of riveted wrought iron girders was estimated to be 70 MPa. For mild steel as well as for girders with punched holes the level was believed to be lower. The shear resistance of rivets may be the governing failure mode for connections. Out et al (1984) investigated the fatigue resistance of four riveted stringers. The tests focused on corroded girders. Measurements conducted on the girders while still in service showed that 1 % of the stress cycles exceeded 48 MPa thus the cumulative fatigue damage from service was believed to be negligible. The resistances of the corroded sections were between AASHTO detail category E and C (detail category C 56 and C 80, EN 1993-1-9 (2003)) depending on loss of cross section. The riveted beams showed redundancy when stresses redistributed to nearby parts when cracks formed. Tests performed at reduced temperatures did not result in unstable crack growth. Reemsnyder (1975) investigated connections from an ore “bridge” for the loading and unloading of ore in a harbour. The “bridge” was selected because of good documentation of operations and maintenance. The investigation focused on the effectiveness of structural rehabilitation by replacing rivets in critical regions with high strength bolts. The program for testing consisted of two phases: Phase 1 included 12 constant amplitude fatigue tests and two service simulations. This was done to determine the effectiveness of rehabilitation with high strength bolts. Phase 2 included two constant amplitude fatigue tests on specimens taken out of service. The results showed that tests on full scale specimen which had rivets replaced with high strength bolts at locations of observed or anticipated cracking, increased the fatigue life with up to two to six times.

Literature survey of fatigue test
45
Helmerich et al (1997) investigated the fatigue life of girders from three bridges. The results from the tests were used to develop a Non Destructive Technique, NDT, for identification of cracks in bridges. Nine full scale tests were performed, the result indicated that the detail category C 71 could be used to assess the fatigue life of riveted bridges. The influence of corroded impact damages and structural defects were covered by the detail category. The fatigue endurance of wrought iron was not worse than that of mild steel. Considering appropriate values of Young’s modulus and the yield strength, wrought iron bridges can be assessed as steel bridges accordingly to Helmerich et al (1997). A summary of full scale tests performed at BAM was conducted by Helmerich (2005) in 2005, which revealed information of 14 additional tests from truss girders. Adamson et al (1995) investigated the fatigue behaviour of stringers retrieved from a bridge built in 1911. From load history and strain measurements, it was concluded that the accumulated fatigue damage was negligible. Presence of corrosion on the stringers was also believed to have a negligible effect on the fatigue performance. The investigation included five full scale tests on stringers. Non bearing riveted details showed a tendency of having fatigue resistance higher than bearing details. The results of the fatigue endurance of the stringers were covered by the detail category D in AASHTO, corresponding to detail category C 71, EN 1993-1-9 (2003). Fatigue tests of seven full scale tension members were investigated by DiBattista et al (1995). The tension members were retrieved from the same bridge as the tests of Adamson et al (1995). A uniform corrosion existed on all tension members. Stress ranges in the tests were from 58 to 73 MPa. No accumulated fatigue damage was present due to previous load history, based on measured strains while in service and from inspections. The tests showed that the fatigue resistance of the diagonals and their connections to the bottom chord could be evaluated by detail category D in American Railway Engineering Association, corresponding to detail category C 71, EN 1993-1-9 (2003), depending on definition of net section area. Non bearing riveted details showed a tendency of having fatigue resistance higher than bearing details. Repair of cracked connections of tension members to the gusset plate with preloaded bolts extended the life of the connections significantly. Xiulin et al (1996) conducted fatigue tests on plates with removed rivets. The plates were retrieved from the tension chord of a bridge. The investigation included tests of 28 small scale samples, the tests were carried out at stress ranges from 120 to 155 MPa. Results from the investigation were comparable

Fatigue assessment of riveted bridges
46
with results available in literature. The initiation phase of the fatigue cracking occupied the major part of the fatigue life of the material investigated. Zhou et al investigated the effect of hole preparation methods has on the fatigue life of riveted structures. Investigations concerning the fatigue limit were also performed, these tests were carried out at stress ranges between 44 MPa to 54 MPa. A total of 20 tests were performed, 12 at constant amplitude and eight with a varied stress range. The result showed that rivet holes were the most frequent origin for crack initiation and was believed to be an effect of the surface condition of the holes. Girders with punched holes provided lower fatigue endurance than drilled or sub punched and reamed. Five tests reached 1 x 10⁸
cycles, after which the tests where terminated and examination of the girders showed that no fatigue cracking had occurred. The fatigue limit was determined to be 41 MPa. The detail category D AREA, corresponding to detail category C 71 in EN 1993-1-9 (2003), was believed to provide a lower bound for riveted girders in general. The investigations also showed that wrought iron girders exhibited lower fatigue endurance than steel.
3.3 Connections between girders Riveted or bolted connections have generally been divided in to three groups, flexible, semi rigid or rigid depending on the degree of restraint they provide. The typical behaviors of the three connection groups are: ⎯ Flexible connections are only capable to carry the shear load and allow
relatively free rotation. Flexible connections are often treated as a pinned connection in the design
⎯ Semi rigid connections are in-between a pinned and a rigid connection
and can transfer bending moment, but still some rotation takes place. Many of the connections treated as flexible are in fact semi rigid, and the moment carried by these is not taken in to consideration in the design
⎯ Rigid connections are those where the rotation of the connection is
reduced to a minimum and they therefore transfer full moment, obtained by a stiff design
In the continuous sections the focus will be on semi rigid connections as its characteristics best describes the true behaviour of the joints between stringers and cross girders in riveted bridges. The primary function for connections in a bridge is to transfer the vertical force from the stringer in to the cross girder web. However additional loading affects as tension arises in the connection angles when trains passes due to the deformation of the whole bridge it self and the individual elements, the flexural deformation of the connections can be seen

Literature survey of fatigue test
47
in Section 2.3.2. According to Wilson et al (1938) the main reason contributing to the flexural deformation is: ⎯ The bottom chord of the truss changes in length due to a change in the
chord stress resulting from a train passing. There is not a corresponding change in the length of the stringers and since the cross girder is connected to the chord and the stringers, the cross girders are subjected to a transverse horizontal flexure which produces in each stringer an axial force that pulsates and is transmitted through the connection angles. The magnitude of the force depends on the magnitude of changes in the chord stress, on the stiffness of the cross girders and on the distance between the stringers.
⎯ The stringers deflect vertically because of the wheel loads, and this
deflection cause a rotation in the end of the stringer and subjects the connection angles to a bending moment in the plane of the stringer web.
Concerning the elongation of the secondary structure (stringer and cross girders) the angles of the connection mounted to the cross girder web will be “pulled out” by a tensile force. The tensile force is applied over the entire depth of the connection. This effect occurs once in every passing of a train. The other effect of a train passing is that a portion of the bending moment in the stringers is transferred by the semi rigid connections. The top of the connection will deflect as illustrated in Figure 3.1, the amount of deflection of the angles is reduced in magnitude towards the bottom of the connection. This deformation of the connection occurs every time a bogie passes the stringer. The amount of moment transferred by the connections is linked to the stiffness of the connection. The unintended load scenario in the connections is the reason for the up come of fatigue in the connection angles, Fisher et al (1987), Al-Emrani (2002).

Fatigue assessment of riveted bridges
48
Figure 3.1 Connection between stringer and cross girder, Wang (1990)
3.3.1 Initial stiffness of semi rigid connections An investigation of models that anticipate the initial stiffness of semi rigid connections has been performed. The investigation showed that most researchers have focused on beam to column connections but also stringer to cross girder connections is included in the investigation. Lothers (1951) developed an analytic model to predict the initial stiffness of semi rigid beam to column connections consisting of riveted angles. The model was derived from the deformation characteristics of tested angles. The deformation shape observed from the tests and the theoretical model used to interpret them can be seen in Figure 3.2. The global deflection of the connection angles is largest at the top of the connection and zero at the neutral bending axis, y. The initial stiffness model developed by Lothers (1951) was derived by:
⎯ Determine an expression for the critical moment developing due to that the angles are pulled outwards in the top of the connection assuming that there is no give in the rivets
⎯ Find an expression for the deflection of the angle heel facing the column flange in the upper end of the connection
⎯ Locate the neutral bending axis of the connection, and find an expression for the distance, which should be based on the elastic behaviour of the legs of the angles
⎯ Define a correlation between the rotation of the connection (the angle of strain) φ and the deflection Δb of the angle heel b
yφ Δ= where y is the
distance from the top of the connection to the neutral bending axis of the connection
⎯ Find a safe resisting moment M of the connection based on the elastic restraint of the angle legs
Stringer Cross girder
Connection angle

Literature survey of fatigue test
49
Figure 3.2 Angle model and resulting bending moment diagrams, Lothers (1951) The initial stiffness of Lothers (1951) is defined as 1K Z= can be derived by using Equation (3.1) to (3.3).
31
3 21
64g ggZ
E h t y g g+
= ⋅⋅ ⋅ ⋅ +
(3.1)
( )h n b n b t
yn b t
⋅ ⋅ − ⋅ ⋅=
⋅ − (3.2)
( )
( )1
1
6 24
g g gn
t g g+
=+
(3.3)
Where E is the Young’s modulus h is the height of angle t is the thickness of angle g is the length of the column connected leg of the angle, measured
from the center of the rivet to the near face of the web connected leg g1 is the length of the web connected leg of the angle, measured from
the center of the rivet to the near face of the column connected leg y is the position of the neutral axis from the top of the angle b is the width of the angle n is the ratio of the intensity of the compressive stress below the center
of rotation to the tensile stress due the bending of the outstanding leg of the angle above the center of rotation
Kish et al (1990) derived the initial stiffness of semi rigid beam to column connections from the results of experimental deformation patterns from Purdue University’s data bank. The model derived to estimate the initial stiffness was

Fatigue assessment of riveted bridges
50
based on theories of bending and torsion. Assumption made in the development of the rotational stiffness model was:
⎯ The effect of shear force on connection deformation is ignored ⎯ The part of the angle connected to the column behaves linearly elastic,
while the part of the angle connected to the beam behaves as a rigid body. ⎯ Deformation in the connection is small ⎯ The part of the angle fastened to the column flange act as a moderately
thick plate in which the fixed support is assumed to be at the fastener nut edge close to the beam web and
⎯ The concentrated torsional moment is in equilibrium with the connection moment acting at the free edge, see Figure 3.3
Figure 3.3 Parameters in the initial stiffness model by Kish et al (1990) According to Kish et al (1990) the initial stiffness of a double angle connection is given by Equation (3.4).
( )( ) ( ) ( )
1 1
1 1 1
cosh2
3 cosh sinhatK G
α α βα β α β α β
⋅ ⋅= ⋅ ⋅
⋅ ⋅ ⋅ − ⋅ (3.4)
Where ta is the thickness of the web angle α1 is 4.2967 for a Poisson’s ratio value of 0.3
1
p
gl
β =
g1 is the gauge distance from the rigid support line to the free edge line 1 2a a
wg g k= − − ga is the distance from the angle heel to the center of fastener hole near
the beam web in the leg adjacent to the column face w is the width of the fastener nut lp is the length of the web angle G is the shear modulus
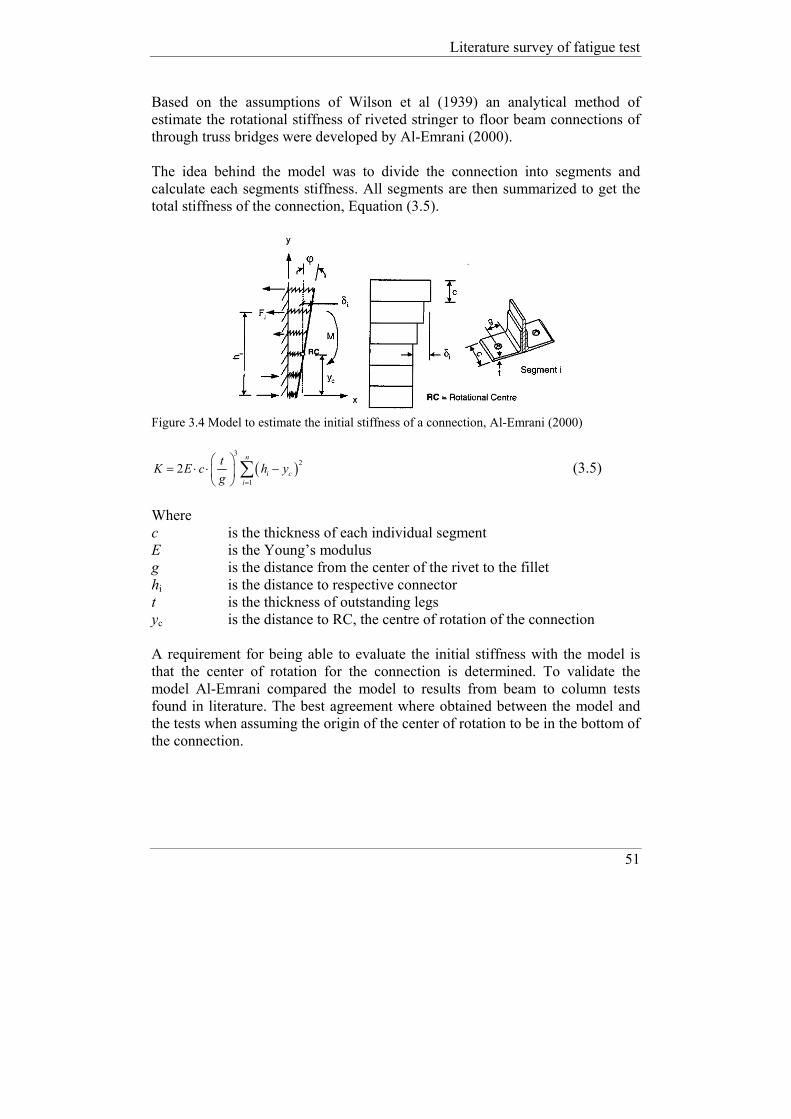
Literature survey of fatigue test
51
Based on the assumptions of Wilson et al (1939) an analytical method of estimate the rotational stiffness of riveted stringer to floor beam connections of through truss bridges were developed by Al-Emrani (2000). The idea behind the model was to divide the connection into segments and calculate each segments stiffness. All segments are then summarized to get the total stiffness of the connection, Equation (3.5).
Figure 3.4 Model to estimate the initial stiffness of a connection, Al-Emrani (2000)
( )3
2
12
n
i ci
tK E c h yg =
⎛ ⎞= ⋅ ⋅ −⎜ ⎟
⎝ ⎠∑ (3.5)
Where c is the thickness of each individual segment E is the Young’s modulus g is the distance from the center of the rivet to the fillet hi is the distance to respective connector t is the thickness of outstanding legs yc is the distance to RC, the centre of rotation of the connection A requirement for being able to evaluate the initial stiffness with the model is that the center of rotation for the connection is determined. To validate the model Al-Emrani compared the model to results from beam to column tests found in literature. The best agreement where obtained between the model and the tests when assuming the origin of the center of rotation to be in the bottom of the connection.

Fatigue assessment of riveted bridges
52
Shen et al (2000) derived an analytic model for the elastic response of bolted semi rigid beam to column connections. The model was evaluated against results from tested connections. The geometry of the studied connection and the model developed to describe its behaviour can bee seen in Figure 3.5. Two springs located at the fastener line representing the effect of bolt and angle interaction and the prying action of the outstanding leg. The springs are assigned a stiffness represents the translation and rotation of the bolt and angle, Kx (translation) and Kθ (rotation). In the model it was assumed that the roller support near the fillet restrained the lateral displacement towards the beam web at the toe.
Figure 3.5 Model to calculate the stiffness of double L-angle developed by Shen et al (2000) By assuming rigid spring constants Kx and Kθ, the initial rotational stiffness of the connection can be expressed as in Equation (3.6).
231 1 2
312 14( )rot
gE IKg g g
⎛ ⎞⋅= ⋅ −⎜ ⎟+⎝ ⎠
(3.6)
Where E is the Young’s modulus I is the moment of inertia of the angle, equal to
3
12Lw t⋅
g1 is the gauge distance from the back angle to the center line of the bolts on the column

Literature survey of fatigue test
53
g2 is the gauge distance from the back angle to the center line of the bolts on the beam
w is the angle width per bolt tL is the angle thickness Lee et al (2002) derived an analytical expression to determine the initial stiffness of a beam to column connection. The basic assumptions made were that:
⎯ The deformation in the connection is small ⎯ The deformation of beam and column is negligible compared with the
deformation of the connection ⎯ The slip deformation is negligible
In the model, see Figure 3.6, it is assumed that the fastener keep the angles fixed at the position A and C. When a load is applied, point C moves in the direction of the load and a rotation occurs at position B. When the angles are pulled out it is assumed that the fastener at position A act as a rigid support. The center of rotation is assumed to be located close to the mid depth of the connection.
Figure 3.6 Investigated connection and analytic model derived by Lee et al (2002) The model for initial stiffness suggested by Lee et al (2002) is expressed in Equation (3.7).
1 231 1 2
24 a
g gE IK lg g g
⎛ ⎞+⋅= ⋅ ⋅⎜ ⎟+⎝ ⎠
(3.7)

Fatigue assessment of riveted bridges
54
Where g1 is the distance from the center line of the leg to the first fastener in
the leg adjacent to the column g2 is the distance from the centre line of the leg to the center line of the
fastener holes in the leg adjacent to the beam I is the moment of inertia of the angle segment per unit length E is the Young’s modulus la is the height of the angle A two dimensional model was derived by Lemonis et al (2005) to predict the displacement of bolted T-stubs in tension. In Figure 3.7 the T-stub connection and the analytical model used to describe the deformation in the connection is presented. Only a part of the angle length from the fastener to the toe contributes to the stiffness of the model, Lx. The length of Lx is obtained by solving Equation (3.10). By substituting Equation (3.8) and (3.9) the initial stiffness of the connection can be estimated by calculating the ratio F/w. The performance of the model was evaluated by finite element analysis and on the basis of experimental data. The load F and displacement w defined for a half T-stub is according to Equations (3.8) to (3.10):
( )3 2 2 31 1 1
3 2 3x x x x
b
L L L L L L Lw F FE I E I E I E I+ ⎛ ⎞⋅ ⋅
= ⋅ − + + ⋅⎜ ⎟⋅ ⋅ ⋅ ⋅⎝ ⎠ (3.8)
( )2 21 1
2 31
3 6 22 3 3
b x x xb
x x b
c L L L L LF FL L L c E I
⋅ + ⋅ += ⋅ ⋅
⋅ + ⋅ + ⋅ (3.9)
( ) ( ) ( ) ( )2 3 2 2
1 1 16 12 6 0b x x xL c L E I L E I L L E I L⋅ ⋅ − ⋅ ⋅ − ⋅ ⋅ ⋅ − ⋅ ⋅ = (3.10) Where E is the Young’s modulus I is the moment of inertia of the flange L1 is the distance from the center of the T-stub to the middle of the
fastener Lx is the distance from the fastener to the end of the T-stub that is in
contact during the flexural bending of the connection cb is the stiffness provided by the fastener

Literature survey of fatigue test
55
Figure 3.7 Investigated T- stub connection and the analytical model used by Lemonis et al (2005) Three different types of connections and a total of nine tests representing the riveted connections between stringer and cross girders were investigated by Wilson et al (1939). Six specimens were designed to fail in the rivets and the remaining in the angles. A model was derived to calculate the deflection and the stress in the connection. The model assumes that the outstanding legs are fixed both at the angle fillet and at the rivet center line, see Figure 3.8. In the evaluation of the tests the flexural stress in the angles was overestimated by the model, but a good agreement was found concerning the deflection of the connections. The model developed by Wilson et al (1939), in 1939 later became known as “the fixed end beam model”.
Figure 3.8 Connection tested by Wilson et al (1939)

Fatigue assessment of riveted bridges
56
3.3.2 Parameters influencing the initial stiffness From the models described in Section 3.3.1, developed to anticipate the initial stiffness of a connection some geometrical properties are recurrent. The common features are that the outstanding leg, the leg facing the cross girder web or the column, is treated as a beam with different boundary conditions depending on the deformation scenario. And how much of the outstanding leg that is taken in to consideration and how clamping force and prying is included differs. A parameter that has a major influence in the models is the position of the centre of rotation. In studies conducted in the 1930’s concerning the fatigue endurance of riveted stringer to cross girder connections the opinion whether the centre of rotation of a connection where situated at the mid depth of the connection or closer to the lower flange differed, Wilson et al (1938). In a study performed by Lewit et al (1969) to determine the position of the centre of rotation it was found that a number of parameters influenced on the position:
1. the depth and the length of the beam with which the angles are combined 2. the gauge or gauges of the connection angles 3. the type and size of fastener 4. whether the connection is to a column flange, a column web, or a girder
web 5. the angle thickness 6. the physical properties of the angle material
In the tests performed by Lewit et al (1969) the position of the centre of rotation were around the mid depth of the connections at low load levels. However when the loads increased the position shifted towards 0.8 times the depth of the connection, measured from the tension side of the connection, see Figure 3.9. Connections can show non linear behaviour, concerning the relationship of moment and rotation, even though the strains in the angles are still elastic. This is believed to be a result of a shift of the centre of rotation in the connections. An explanation to this is that the heel of the connection angle in the compressed part is not initially in firm contact with back plate. The existence of initial gaps in connections has been pointed out by Fisher (1974). Due to these initial gaps the back of the angle moves to come in to contact with the cross girder web in the beginning of the loading. The initial clearance is believed to allow the compressive and tension side of the connection angles to resist the initial moment by flexure. High amount of moment acting on the connection causes a

Literature survey of fatigue test
57
movement of the centre of rotation from the middle of the connection to the compressed part, Lewit et al (1969).
Figure 3.9 Shift of the rotation centre depending on applied load, Lewit et al (1969)

Fatigue assessment of riveted bridges
58
3.3.3 Tests conducted on the degradation of semi rigid connections Al-Emrani (2002) performed static and fatigue tests on connections from the Vindelälven Bridge in Sweden. The bridge was a riveted railway bridge constructed in 1896 and consisted of three simply supported arch shaped truss spans, each span stretched 71.2 meter. In 1993 the Swedish Rail Administration believed that the bridge had reached its service life and it was decided that the bridge should be demolished. Three sections were taken from the bridge to investigate the fatigue performance of the connections. Each test specimen that was used in the investigation consisted of three cross girders and four stringers connected to each other with riveted double angles, see Figure 3.10.
Figure 3.10 Specimen from the bridge consisting of four stringers and three cross girders, Al-Emrani (2002) In the investigation of the fatigue exposed connections, the specimens were arranged so the ends of the cross girders rested on supports at the position where they had been attached to the main truss. The loading was made as authentic as possible, resulting in a four point bending of the stringers with a spacing of the loads consistent with the bogie spacing of trains. In the fatigue investigation a load range of 100 kN was applied on the specimens with a minimum load of 80 kN and a maximum load of 180 kN. The number of cycles the specimens endure before the tests were terminated can be seen in Table 3.1. Table 3.1 Fatigue investigation of the Vindelälven Bridge, Al-Emrani (2002)
Specimen Load range [kN] Number of cycles
I 100 5 x 10⁶
II 100 8 x 10⁶ III 100 10 x 106
Stringer
Cross girder

Literature survey of fatigue test
59
Static tests were performed in the beginning of each test and during the fatigue investigation to measure the degradation of the connections, Table 3.2. During the static tests, strain measurements were performed on the tension flange at the middle of the stringers for specimen I and II. Another test setup was chosen for specimen III with strain measurement at the tension flange closer to the middle cross girder. Table 3.2 Static tests performed on the tested specimens during the fatigue investigation, Al-Emrani (2002)
Aimed load level [kN]
50 100 150 200 300 400 500 600
Specimen I n = 0 50 99 148 193 - - - - n = 1.25 x 10⁶ 46 93 142 189 - - - - n = 2.95 x 10⁶ 50 100 150 200 - - - - n = 5 x 10⁶ 50 - 147 196 294 391 490 589
Specimen II n = 0 53 102 150 - - - - - n = 3 x 10⁶ 53 101 150 - - - - - n = 8 x 10⁶ 50 98 147 194 292 388 488 576
Specimen III n = 0 63 120 178 183 - - - - n = 1.32 x 10⁶ 58 115 178 - - - - - n = 8 x 10⁶ 51 99 148 246 - - - -
Before the fatigue test was initiated Al-Emrani conducted a visual inspection. Slight corrosion was found, but no cracking of the angles could be observed, but for specimen I the paint around the top rivets of the connections situated towards the cross girder web was cracked. Similar cracking in the paint could not be observed for the other test specimens. The cracking of the paint in specimen I was believed to originate from the fact that specimen I was retrieved from the most stressed part of the bridge, the midspan. After specimen I had experienced a fatigue loading of 200 000 cycles, the paint was removed. Under the paint layers of one connection it was discovered that a crack had propagated to a length of 60 mm at the top of a an angle. An example of the cracking in the paint is shown in Figure 3.11. Specimens II and III had the paint removed before the fatigue loading started and it was discovered that cracks already had initiated in some of these connections with crack lengths between 10 to 20 mm.

Fatigue assessment of riveted bridges
60
Figure 3.11 Cracks in the paint of the angle before the initiating of the tests, Al-Emrani (2002) Crack initiations started at the highly stressed area around the fillet at the position of the top rivet in the connections, situated towards the cross girder web. Several small cracks were initiated and after they hade reached a certain length they merged in to one crack along the fillet, see Figure 3.12. The typical crack propagation followed the fillet, but after a certain length the crack started to propagate in a slightly curved line following the direction of the principal stress. The crack either stopped at the position of the centre line of the rivets or merged with the crack originating from the second rivet at the top of the connection see Figure 3.12, Al-Emrani (2002).
The fillet
Cracks in the paint
Rivets situated at the cross girder web

Literature survey of fatigue test
61
Figure 3.12 Crack propagation in the top of a connection, Al-Emrani (2002) This crack scenario occupied 40 % of the total depth of the connection and the crack had at this point propagated through the entire thickness of the L-angle along its path. For the adjacent connection angles the same crack propagation characteristics and rates were observed. In the evaluation of the tests, Al-Emrani (2002) observed a reduction of the stiffness when a crack started to propagate. When the crack propagated past the second rivet from the top of the connection the propagation slowed down considerably or stopped. Before the testing of a specimen was aborted due to the crack arrest, 0.7 to 5 million additional load cycles were employed. Rivet failures also occurred in some of the tested connections. The rivets that cracked and failed were situated at the cross girder web. In specimen I a combination of rivet failure and fatigue cracking occurred in one connection, with failure of the top rivet after 0.9 million cycles. After additional 0.3 million cycles a 5 mm long crack originated at the filet of the second rivet. When the fatigue investigation was terminated after 5 million cycles no further cracking in the connection or of the rivets could be observed. In the test of specimen II a different behaviour where found than in specimen I. In one of the angles attached to the cross girder continues rivet failure occurred.
Fatigue crack

Fatigue assessment of riveted bridges
62
At the end of the test eight of the ten rivets had failed due to fatigue cracking, but the connection was still able to carry the vertical load due to that the rivet fitting was so tight that the rivets could not be removed from the holes. After examination of the damaged rivets, old cracks were found indicating a fatigue accumulation from the time in service. Strain measurement of two rivets showed that the clamping force was low, around 30 MPa, resulting in a lower fatigue performance, Al-Emrani (2002). In specimen III two of the rivets in the top of one connection cracked after 0.15 and 0.5 million cycles. No further cracking of the rivets in the test was however observed when it was terminated after 10 million cycles. Static test performed after the fatigue tests were ended, for specimen I and II, showed that in spite of the cracked angles and rivets the specimens were capable to carry the load of 600 kN per jack, corresponding to a stringer mid span stress of 140 MPa, roughly 100 MPa higher than the exposure during the fatigue tests.
Determination of the rotational stiffness in the tests Strain measurements were used to determine the bending moment in the middle of the stringers. By comparing the bending moment from the tests with the theoretical of a simply supported beam, the bending moment transferred by the connections, Ma, could be determined and the rotational stiffness, Krot, of the tested connections was determined with Equation (3.11) to (3.16).
MKφ
= (3.11)
3E IK L
⋅= (3.12) Where K is the stiffness of a simply supported beam M is the moment φ is the angle of rotation I is the moment of inertia of the beam L is the length of the beam E is the Young’s modulus A ratio between the rotational stiffness developed by a semi rigid connection , Krot, compared to a simply supported beam can be expressed as in Equation (3.13). The ratio between the two was largest when the tests started and decreased as the crack propagated in the connections.

Literature survey of fatigue test
63
3
rot
E ILR
K
⋅= (3.13)
A value of R = 0 equals a rigid connection and higher ratios means the connection is in between pinned and rigid. The ratio between, Ma and the moment of a continuous girder (rigid connection) Mc can be expressed as in Equation (3.14).
a
c
MM
α = (3.14)
The degree of continuity represented by α can also be written as in Equation (3.15).
11
a
c
MM R
α = =+
(3.15)
From Equation (3.15) the rotational stiffness of the connections was evaluated by inserting the expression of R according to Equation (3.16).
31rot
E IKL
αα
⋅ ⋅= ⋅
− (3.16)
Al-Emrani (2002) concluded that, the effect of the stringer end stiffness will not influence the capacity in the ultimate limit state, but it will create high local stresses in the serviceability state causing fatigue cracks to develop in the connections. The tested connections were capable of developing up to 67 % of the corresponding moment of a fully continues beam before the tests were initiated. Further observation made by Al-Emrani (2002) was that cracks were initiated in the fillet at the upper rivets in the connections, or in rivets connecting the outstanding legs of the angles to the cross girder web. Cracks in the outstanding legs of the connection angles were primarily driven by the tensile bending stress, caused by distortion of the angles. Following the propagation of cracks in the connections a gradual reduction of the rotational stiffness of the connections was observed, providing a reduction of the moment capacity in the joint. This behaviour had a considerable effect on the crack propagation rate which was decreased following an increase of the bending stress in the stringers. This continued until the cracks in the outstanding leg of the angles arrested.

Fatigue assessment of riveted bridges
64
Another contributing factor to the relaxation of rotational stiffness of the connections was the failure of rivets, depending on the prying forces in the connections. The prying force provides fatigue cracks to propagate between the shank and the rivets head causing the head to pop off, Al-Emrani (2002).
3.3.4 Evaluation of the initial stiffness models The models described in Section 3.3.1 have been evaluated by comparing the result they provide to the tests performed by Al-Emrani (2002). Not all models have been used in the evaluation of the stiffness since some only focused on the performance of the top of the connection and the behaviour of a whole connection is of interest. The results can be seen in Table 3.3. The raw data from the tests performed by Al-Emrani (2002) was made available to the author of this thesis. The stiffness of Al-Emrani (2002) tests was therefore evaluated using the raw data and Equations (3.12) to (3.16). The values obtained by Al-Emrani are however slightly higher than the ones found in Table 3.3 for specimen I and II, ~ 0.3 x 10⁵ kNm/rad. A probable reason for the difference in the calculation is that the author of this thesis assumes that the strains are measured in theoretical mid section of the stringers in the specimens, while the actual position can have been offset. Concerning specimen III the test setup was altered and strains where no longer monitored at the middle of the stringer. Due to the uncertainty of the exact position of the strain measurement the results from specimen III was not included. A good prediction of the stiffness of the tested connections was obtained by the models of Lothers (1951) and Shen et al (2000). An additional model was presented in the thesis of Al-Emrani (2002) that predicted the stiffness of the tested connections quite well, but to be able to use this model, the stresses at the connection has to be known and therefore it has not been included herein.

Literature survey of fatigue test
65
Table 3.3 The initial stiffness of the connections investigated by Al-Emrani (2002) and the models from section 3.3.1 for estimating the initial stiffness of semi rigid connections
Tests Al-Emrani (2002)
Rotational stiffness kNm/rad
Comments
Specimen I 2.89 x 10⁵ Mean value from loading range 0 – 200 kN
Specimen II 3.27 x 10⁵ Mean value from loading range 0 – 200 kN
Models for prediction of initial rotational stiffness
Rotational stiffness kNm/rad
Comments
Lothers (1951) 3.47 x 10⁵ Kish et al (1990) 0.82 x 10⁵ Al-Emrani (2000) 10.5 x 10⁵ Calculated with the centre
of rotation at the bottom of the connection
Lee et al (2002) 0.12 x 10⁵ Shen et al (2000) 2.26 x 10 5
3.4 Fracture mechanics In the following section a survey of fracture mechanics used to evaluate the fatigue life of connections and girders is given. The aim was to collect the knowledge from prior work conducted in the field, and to investigate how it could be applied to bridges and the investigation of the degradation of connections between stringer and cross girders presented in Chapter 8. Eriksson (1991) investigated fracture behaviour of four girders retrieved from a bridge and one newly produced girder. In the investigation cracks were initiated in the tension flanges by producing a notch and than exposing the girders to a cyclic loading. The result from the tested girders was compared to small scale tests retrieved from the flanges. The comparison was made to investigate if the toughness behaviour of a girder could be determined by small scale tests and the results showed that this was the case. A comparison was also made between the results of steel toughness using Charpy-V and fracture mechanic tests. The investigation showed that Charpy-V tests were not suitable for evaluating the toughness of steel, in particular not inhomogeneous steel. For determination of the toughness on large structures consisting of inhomogeneous steel, test samples must consist of the entire thickness of the structural component according to Eriksson (1991).

Fatigue assessment of riveted bridges
66
Roeder et al (2001) conducted fatigue tests on coped stringer to cross girder connections. The investigation aimed to evaluate the fatigue performance and rehabilitation of connections. Three different types of geometries of the cope were investigated. The fracture mechanical model, “beam with an edge crack exposed to moment”, see Figure 3.13, was used to describe the crack propagation in the cope. The model of Paris et al (1963) was used to determine the crack propagation rate and the coefficients C and n of the model was determined from the tests. The evaluation of these parameters was not successful, as a result the evaluation with the fracture mechanical approach was fruitless. The reason for the bad agreement was believed to be the complex stress state of the crack at the cope, which was not correctly described by the chosen fracture mechanical model. From the tests it was noted that the stiffness of the connection decreased with the length of the crack. To stop crack growth it was concluded that the stiffness of the connection had to be lowered. An effective measure used to achieve this was the removing of bolts in the connections providing the effective bending stress to become zero in the coped region.
w a
M M
Figure 3.13 Beam with an edge crack exposed to moment Sedlacek et al (1993), developed a simplified method for evaluating riveted bridges with a fracture mechanical approach. Three fracture mechanical models where used to describe the different crack scenarios for components in riveted bridges, Figure 3.14. A guidance of what cross section the different fracture mechanic models applies to can be found in Stötzel et al (1997) and in Stötzel (1998). For each of the fracture mechanic models there are figures from where the critical crack length can be determined depending on the yield strength and fracture toughness of the investigated girder, see Figure 3.15. In the work conducted by Sedlacek et al (1997) 400 chemical test samples of metal was tested as well as 500 tensile tests of old metal material. This was done to improve the reliability of the developed method for anticipating the service life of old bridges.

Literature survey of fatigue test
67
Figure 3.14 The three fracture mechanic models used to determine the crack propagation of various girders geometries in bridges, Stötzel et al (1997)
Figure 3.15 Figures worked out to determine the critical crack length of a crack depending on load ratio, toughness, and the width of the plate and the crack length, Stötzel et al (1997)

Fatigue assessment of riveted bridges
68
Wang (1990) conducted fatigue investigations on 14 connections extracted from the flanges and the web of girders, Figure 3.16. The loading of the extracted connections where tested in tension representing the condition of the top of a connection between the stringer and cross girder. Analytic studies where conducted using a finite element approach which included fracture mechanics to anticipate crack propagation of connections. From the analytic simulation it was discovered that depending on the geometry of the connections the fatigue cracking either initiated at the leg angle situated towards the cross girder web or at the angle attached to the stringer. This result was confirmed by the tests retrieved from the girders. Fatigue cracking initiated from several locations along the fillet and emerged to a continuous surface crack. The results from the fatigue investigation of the connections were that their endurance corresponded to detail category A of AASHTO.
Figure 3.16 Tested connection specimens was cut from the girder web and flanges of riveted girders, marked with grey in the figure, Wang (1990)
3.5 Summary A numerous fatigue investigations have been performed on full scale structures and small scale specimens. The conclusions made by different researchers are not always in agreement though there seems to be a big scatter regarding the fatigue life of the tested specimens. A more detailed evaluation of the gathered material will be presented in Chapter 5. Concerning the initial stiffness of semi rigid connections, the common features are that the outstanding leg of the angle, the leg facing the cross girder web or the column, is treated as a beam with different boundary conditions depending on the deformation scenario. The part of the outstanding leg that is taken in to consideration and how clamping forces and prying is included in stiffness calculation differs. A parameter which has large influence on the stiffness is the position of the centre of rotation of connections. Results from Lewit et al (1969) shows that the position of the centre of rotation changes due to the load applied to the connection.

Literature survey of fatigue test
69
In the tests concerning the degradation of connections it was shown that considerable amount of moment was transferred by the semi rigid connection. When cracks started to propagate in the tested connections a gradual reduction of the rotational stiffness was observed, providing a reduced moment transfer and crack arrest. A good agreement was achieved between the tests of Al-Emrani (2002) and the initial stiffness models of Lothers (1951) and Shen (2000). Moreover a practical method was developed by Sedlacek et al (1993) for evaluating critical crack lengths in girders. The most practical approach seems to be when applying a fracture mechanic model for a certain crack scenario. It will be a simplification of the actual crack behaviour. If one instead use the concept of FE-calculations these also requires simplifications of the geometry, deformation behaviour, clamping forces, prying effects and how the contact of the connection angles should be modelled. In summary, one can conclude that it is hard to describe the exact behaviour of a riveted connection.

Fatigue assessment of riveted bridges
70

Material properties of old steel bridges
71
4 Material properties of old steel bridges
4.1 Introduction When designing structures, there are many choices to make concerning geometry of the structure and which kind of material to use. As a help and also as a restriction there are codes to guide the designer in these choices. When assessing an existing structure the geometry is already there and the possibility to choose material is no longer available. But what material parameters should be used to represent the material in the investigated structure? If one turns to Eurocode for answers, not much will be found concerning material properties of old steel. Information or suggestions of values to use are more likely to be found in national codes. The recommendations in these codes are often to use steel with yield strength in the range of 220 MPa. To the characteristics of this recommended steel a reduction factor is applied, the older the material the bigger the reduction factor, and the use of reduction factors is due to the uncertainty of the real properties of early produced metals.

Fatigue assessment of riveted bridges
72
To improve the knowledge of early produced steel in bridges, a data base has been put together. Information concerning material properties are retrieved from bridges produced until the 1940’s, mainly built in Germany and Sweden. The time frame was chosen because there is an uncertainty concerning the material properties of the bridges from this period. The available information in the data base comes from bridges that have had their characteristics verified. Information concerning the German bridges comes from literature surveys and tests performed at the university RWTH in Aachen. Concerning the Swedish bridges information comes from tests performed by certified institutions or by Swedish universities. The work with the creation of the data base was partly carried out with the help of Höhler (2005), who worked at University RWTH in Aachen. The cooperation was possible due to the European research project Sustainable Bridge (2003). The information in the data base comes mainly from Swedish and German bridges but some data from other European countries can be found as well.
4.2 Gathering of data Information regarding Swedish bridges was retrieved from the archives of the Swedish Road and Rail Administration. Values in the data base are the results from certified test by institutions or universities on the behalf of the Swedish Road or Rail Administration. The information in the data base covers bridges built from the late 19th century to the 1940’s. The amounts of data retrieved from each bridge differ depending on the extent of the investigation performed. The main part of the German data can not be linked to a specific bridge, however most of the data were retrieved from bridges situated in and around Berlin built in the beginning of the 20th century. The bridges in question served as railway and subway bridges. Tested components consist mainly of flange material.
4.2.1 Structure of the data base The content of the data base was chosen so the most common material properties used in an assessment could be found. The values evaluated in this thesis are limited to the yield strength, ultimate strength and the toughness properties, because these are the most commonly tested and most important parameters. Only the evaluated parameters of the data base are presented in the thesis, see Appendix A.

Material properties of old steel bridges
73
The structure of the data base is as follows: ⎯ Name of the bridge or specimen identification ⎯ Country ⎯ Metal (notation of origin or classification of grade) ⎯ Year of construction ⎯ Steel mill / Producer ⎯ Source of information (who made the analysis or where data were
collected) ⎯ Profile thickness (dimension of test samples) ⎯ Chemical analysis, percentages of the compounds:
o C Carbon [%] o S Sulphur [%] o Mn Manganese [%] o P Phosphors [%] o Si Silicon [%] o Cu Copper [%] o Ni Nickel [%] o N Nitrogen [%] o Al Aluminium [%] o Cr Chromium [%]
⎯ Mechanical properties: o fy (Rel) lower yield strength [MPa] o fy (Reh) higher yield strength [MPa] o fu (Rm) ultimate strength [MPa] o A elongation at failure [%] o Z contraction at failure [%] o Temperature [°C]
⎯ Charpy-V-energy: o Kv energy required for a failure or deformation of a bar [J] o Temperature [°C]
⎯ Fracture toughness: o Jc is the toughness value, non linear fracture mechanics [N/mm] o Temperature [°C]
⎯ Comments of where samples are retrieved or other observation made ⎯ Bridge type ⎯ Length of bridge

Fatigue assessment of riveted bridges
74
4.3 Evaluation of the data base To be able to compare the material properties in the data base to a code, the Swedish code BVS 583.11 (2005) was chosen, along with its time periods for material properties. The time periods in BVS 583.11 (2005) are divided in to three different ranges, steels produced before 1901, 1901 to 1919 and 1919 to 1955. The last interval stretches further than the information in the data base, which only include steel produced to the 1940’s. Material analysed in the data base includes yield and ultimate strength, Charpy-V, Kv, and fracture mechanic properties, Jc. Regarding the yield strength the standard for evaluating the property have changed from measuring the lower yield limit, Rel, to measure the higher yield strength, Reh. When evaluating data for the yield strength, fy, no difference has been made between the values of Rel and Reh. Evaluating the yield strength in this manner provides characteristic values on the safe side for Reh. A total of 39 bridges are included in the evaluation of the Swedish data base. The number of bridges and available data for each time period can be found in the following sections. The data from Germany only covers two of the three periods, namely metal produced before 1901 and metal produced between the years 1901 to 1919. There are some values concerning the yield strength in the German data base that was tested at 0 ° C and -30 ° C. Values from the different temperatures were evaluated together, though only a small difference in strength between the two temperatures where found. The mechanical properties in the data base are determined as the 5 % fractile of a lognormal distribution. The mean values and standard deviations are accounted for in each time period. Concerning toughness properties, only the mean value and standard deviation of a lognormal distribution have been presented, due to a big scatter in these tests. The reason for the big scatter of the toughness properties were due to that the toughness was not a controlled parameter in the production of metals before the 1940’s. The results of the tests are shown to illustrate differences in toughness of these early produced metals. It is very important that these mean values are not used as input in an assessment of a bridge, because of the large variation.

Material properties of old steel bridges
75
4.3.1 Material properties for steel in bridges constructed before 1901 Sweden Only one bridge was found in the time period before 1901, it was constructed in 1896. 32 samples were retrieved from the bridge, making the material properties of the bridge well defined, Table 4.1. Since all samples origin from the same bridge some precautions should be taken before using these values for all bridges in this time period. Table 4.1 Material properties for steel in Swedish bridges constructed before 1901 Property Mean Stdv 5 % frac No. of
bridges No. of
samples Steel
fy [MPa] 295 32 243 1 32 fu [MPa] 455 31 404 1 32 Germany One bridges constructed with steel was found in the time period before 1901 in the German data base, however seven iron bridges where found in the time period, see Table 4.2. Table 4.2 Material properties for German bridges constructed before 1901 Property Mean Stdv 5 % frac No. of
bridges No. of
samples Iron
fy [MPa] 259 20 218 7 7 fu [MPa] 333 45 249 7 7
Steel fy [MPa] 279 - - 1 1 fu [MPa] 415 - - 1 1
4.3.2 Material properties for steel in bridges constructed 1901 to 1919 Sweden Data from Swedish bridges constructed in the time period 1901 to 1919 are sufficient to give a good basis for a statistical evaluation of the mechanical properties. Tests from 11 bridges where found for this time period, Table 4.3. Data regarding Charpy-V tests, Kv, are available, however they were conducted at different temperatures. In spite of this the mean value and the standard deviation is presented, the tested samples come from the same bridge.

Fatigue assessment of riveted bridges
76
The scatter for the fracture toughness property, Jc, is not as extensive as for Kv, but still large. In Figure 4.1 the distribution of the toughness in the tested bridges are presented graphically. The spread of toughness is fairly restricted in some of the investigations but there are also those where the results diverge. Table 4.3 Material properties for steel in Swedish bridges constructed 1901 to 1919 Property Mean Stdv 5 % frac No. of
bridges No. of
samples Steel
fy [MPa] 278 25 239 11 84 fu [MPa] 424 32 373 11 66 Kv 1 [J] 32 64 - 1 16
Jc 2 [N/mm] 34 25 - 8 30
1 Tested at temperatures ranging from -1°C to -50 °C 2 Tested at -30°C
Figure 4.1 The fracture toughness properties Jc of the steel retrieved from the Swedish bridges, tested at -30 °C
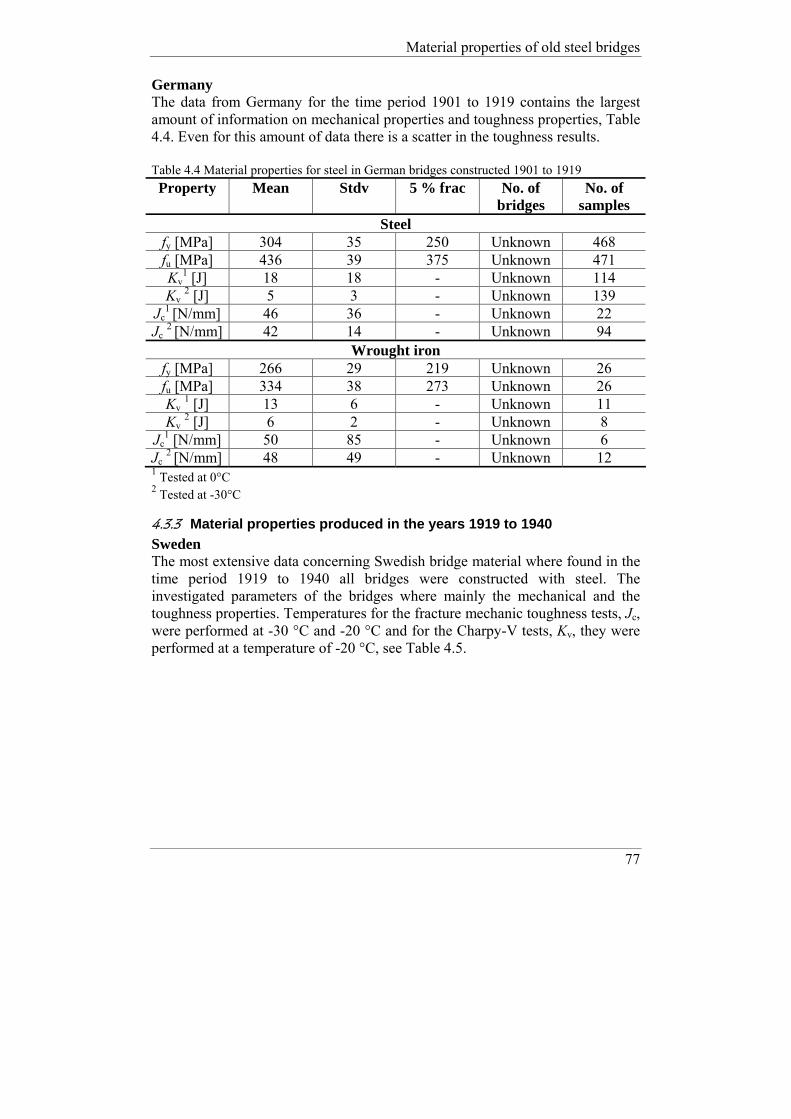
Material properties of old steel bridges
77
Germany The data from Germany for the time period 1901 to 1919 contains the largest amount of information on mechanical properties and toughness properties, Table 4.4. Even for this amount of data there is a scatter in the toughness results. Table 4.4 Material properties for steel in German bridges constructed 1901 to 1919 Property Mean Stdv 5 % frac No. of
bridges No. of
samples Steel
fy [MPa] 304 35 250 Unknown 468 fu [MPa] 436 39 375 Unknown 471 Kv
1 [J] 18 18 - Unknown 114 Kv 2 [J] 5 3 - Unknown 139
Jc1 [N/mm] 46 36 - Unknown 22
Jc 2 [N/mm] 42 14 - Unknown 94 Wrought iron
fy [MPa] 266 29 219 Unknown 26 fu [MPa] 334 38 273 Unknown 26 Kv 1 [J] 13 6 - Unknown 11 Kv 2 [J] 6 2 - Unknown 8
Jc1 [N/mm] 50 85 - Unknown 6
Jc 2 [N/mm] 48 49 - Unknown 12 1 Tested at 0°C 2 Tested at -30°C
4.3.3 Material properties produced in the years 1919 to 1940 Sweden The most extensive data concerning Swedish bridge material where found in the time period 1919 to 1940 all bridges were constructed with steel. The investigated parameters of the bridges where mainly the mechanical and the toughness properties. Temperatures for the fracture mechanic toughness tests, Jc, were performed at -30 °C and -20 °C and for the Charpy-V tests, Kv, they were performed at a temperature of -20 °C, see Table 4.5.

Fatigue assessment of riveted bridges
78
Table 4.5 Material properties for steel in Swedish bridges constructed 1919 to 1940
Property Mean Stdv 5 % frac No. of bridges
No. of samples
Steel fy [MPa] 297 32 248 12 92 fu [MPa] 444 64 347 10 63 Kv 1 [J] 135 289 2 17
Jc 1 [N/mm] 293 499 - 1 37 Jc 2 N/mm] 272 687 - 12 67 1 Tested at -20°C 2 Tested at -30°C A graphical presentation of the toughness values in the bridges from the data base can be seen in Figure 4.2 to Figure 4.4. The big scatter of the results in Figure 4.3 are depending on that different structural components where investigated, also two different contractors had delivered the steel. When these components where produced different types of steel qualities where obviously used. The big scatter of the toughness properties is most evident for tests in this time period, see Figure 4.4, with standard deviation of the results 2.5 times bigger than the mean value.

Material properties of old steel bridges
79
Figure 4.2 The Charpy-V toughness, Kv, for the two Swedish bridges in the data base for the period 1919 to 1940

Fatigue assessment of riveted bridges
80
Figure 4.3 Fracture toughness, Jc, for one bridge with varying values of the toughness, this is due to that different steels were used for the construction of the bridge and its components

Material properties of old steel bridges
81
Figure 4.4 Fracture toughness tests, Jc, performed at – 30 °C showing big differences in toughness between the 12 bridges
4.4 Material properties of rivets Material properties for rivet material were found from two bridges, one in the time period before 1901, and one from the years 1901 to 1919. The first bridge was the Vindelälven Bridge built in 1896, eight tests were conducted on the rivet material at Chalmers University of Technology by Åkesson (1994). The second bridge where the properties of rivets were investigated was the Forsmo Bridge built in 1912, five tests were performed at the Royal Institute of Technology. To extend the content of the data base concerning rivet material, tests were performed at Complab at Luleå University of Technology (LTU). Due to that parts of the Vindelälven bridge investigated by Åkesson (1994) and Al-Emrani (2002) had been transported to LTU, 11 rivets were extracted from a girder and their mechanical properties where determined.

Fatigue assessment of riveted bridges
82
4.4.1 Tensile tests on rivet material at LTU To be able to extract rivets from a girder of the Vindelälven Bridge, the web nearest to the flanges was cut out. The head of the rivets was then machined so they could be thread through the rivet holes, Figure 4.5. Due to the tight rivet fitting the plates had to be cracked open before the extraction was possible. Before performing the tensile tests, the rivets had to be machined to make it possible to perform the tensile tests. The rivets were threaded in the ends, see Figure 4.6. The threads at the ends where done because the rivets were too small to fit in the grip of the testing machine used to perform the tensile tests. Instead the rivets were screwed into two metal cylinders so a firm grip could be obtained by the testing machine. Execution of the tests where done by placing the rivets and the metal cylinders in a testing machine with a capacity of 50 kN, see Figure 4.7. During the tests the force applied was continuously registered by the jack and the elongation was measured by a Crack Tip Opening Device, CTOD. Results from the tests are presented in Figure 4.8 where the graphs of the two rivets that differed the most are plotted. Numerical values of all rivets can be found in Table 4.6.
Figure 4.5 The part of the web connected to the “flanges” cut out to be able to extract the rivets for tensile testing

Material properties of old steel bridges
83
Figure 4.6 On the left a machined rivet in the form of a tensile test specimen. To the right the shape of the rivet when extracted from the girder, one of the rivet heads have been removed
Figure 4.7 Testing machine used in the tensile tests of the rivets. The rivets were screwed in to two metal cylinders since their geometry was too small to fit in the grip of the machine. A CTOD was measuring the elongation of the rivets during the tests
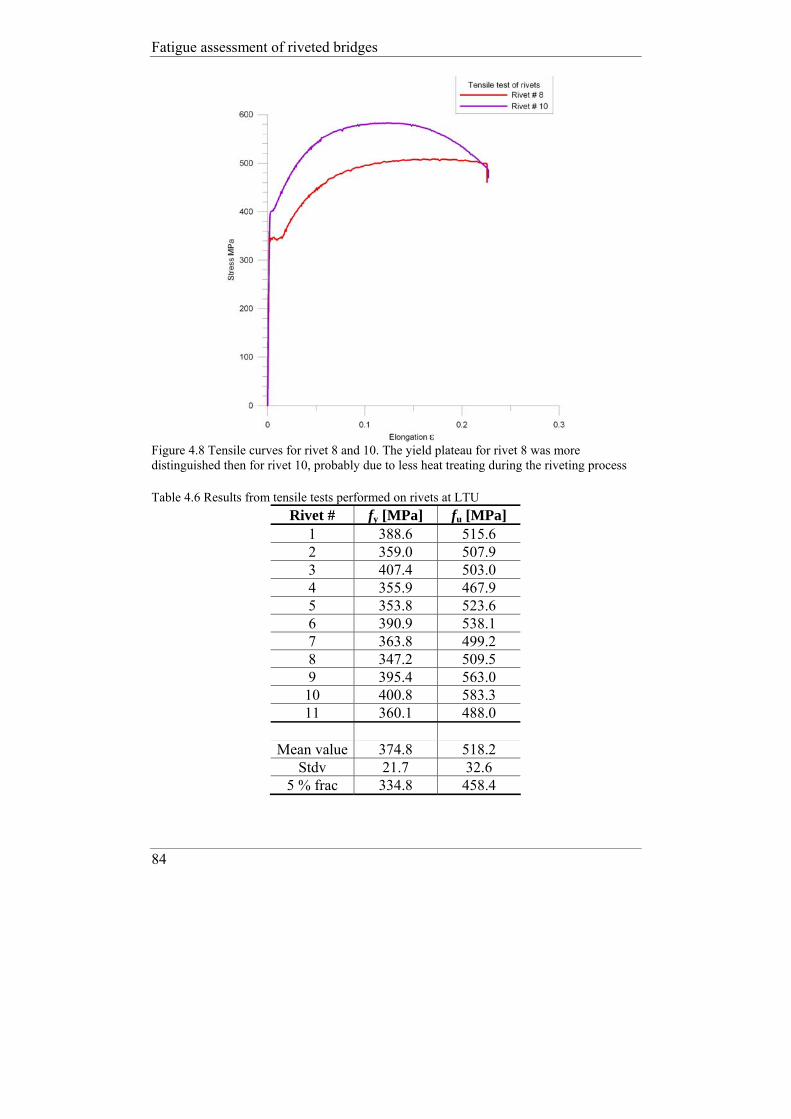
Fatigue assessment of riveted bridges
84
Figure 4.8 Tensile curves for rivet 8 and 10. The yield plateau for rivet 8 was more distinguished then for rivet 10, probably due to less heat treating during the riveting process
Table 4.6 Results from tensile tests performed on rivets at LTU
Rivet # fy [MPa] fu [MPa] 1 388.6 515.6 2 359.0 507.9 3 407.4 503.0 4 355.9 467.9 5 353.8 523.6 6 390.9 538.1 7 363.8 499.2 8 347.2 509.5 9 395.4 563.0 10 400.8 583.3 11 360.1 488.0
Mean value 374.8 518.2
Stdv 21.7 32.6 5 % frac 334.8 458.4

Material properties of old steel bridges
85
To investigate if there were any difference between the tests performed at Chalmers University of Technology, Åkesson (1994), and the test performed at LTU the data from rivets tested at Chalmers University of Technology was evaluated separately, see Table 4.7. A comparison between the two tests shows that there is a difference in the results. The reason to the deviation between the two investigations can depend on laboratory equipment and how it is calibrated and test setup etc. Table 4.7 Tensile tests of rivets from the bridge Vindelälven performed at Chalmers University of Technology, Åkesson (1994)
Rivet # fy [MPa] fu [MPa] 1 311 464 2 322 472 3 377 458 4 328 425 5 373 509 6 353 509 7 324 454 8 376 442
Mean value 345.6 466.7 Stdv 21.4 29.6
5 % frac 294 410.4
4.4.2 Material properties for rivets A total of 24 tests were found concerning rivet material from the period -1901 and 1901 to 1919, presented in Table 4.8. The result of the material properties of rivets in the time period of material produced before 1901 and the period of 1901 to 1919 show on similar characteristics. The rather high yield and ultimate strength for the rivet material in Table 4.8 is most likely caused by the riveting process where the rivets got hardened due to the forming of the rivet heads. Values of the ultimate limit are considerably higher than the recommended values in BVS 583.11 (2005). Where the recommend value for the ultimate strength of rivets are 330 MPa, but if the rivets are situated at a joint the value is reduced to 247.5 MPa.

Fatigue assessment of riveted bridges
86
Table 4.8 Material properties for rivets from two steel bridges Property Mean Stdv 5 % frac No. of
bridges No. of
samples Period -1901
fy [MPa] 362 28 315 1 19 fu [MPa] 496 40 429 1 19
Period 1901-1919 fy [MPa] 348 13 319 1 5 fu [MPa] 477 10 454 1 5
4.5 Summary Data from the Swedish and German bridges have been combined to give as good basis as possible to define the material characteristics of old bridges, see Table 4.9. To compare the information in the data base the Swedish code BVS 583.11 (2005) was chosen. In BVS 583.11 (2005) there are different types of tabulated steels and characteristics to choose from if the metal type in the assessed bridge is known and if the bridges are constructed in the period of 1919 to 1950. For the remaining two periods the characteristics of old steel is referred to as the properties of steel SS 1311. When comparing characteristics between the data base and the Swedish code, the referred steel grade will be SS 1311 for all three time periods. According to BVS 583.11 (2005) the mechanical properties for old steel in old bridges shall be determined by assigning the characteristic values of SS 1311 with a factor. The size of the factor differs for the three different time periods. The reference values provided by the code are summarised in Table 4.9. The compared values in the continuous discussion regarding the differences between BVS 583.11 (2005) and the data base are the 5 % fractile of the properties in the data base.

Material properties of old steel bridges
87
Table 4.9 Mechanical properties for German and Swedish bridges in the data base
Property Mean Stdv 5 % frac
No. of samples
Time period
BVS 583.11 (2005)
Recommended char. values
Steel Steel fy [MPa] 295 31 243 33 220 x 0.55 = 121 fu [MPa] 454 31 402 33 360 x 0.55 = 198
Iron Iron fy [MPa] 259 20 218 7 No
recommendation fu [MPa] 333 45 249 7
-1901
No recommendation
Steel Steel fy [MPa] 300 35 246 552 220 x 0.8 = 176 fu [MPa] 435 38 375 537 360 x 0.8 = 288
Wrought iron Wrought iron fy [MPa] 266 29 219 26 No
recommendation fu [MPa] 334 38 273 26
1901 - 1919
No recommendation
Steel Steel fy [MPa] 297 32 248 92 220 fu [MPa] 444 64 347 63
1919 -1940 360
Steel material in bridges constructed before 1901 have the biggest difference in yield strength, fy , and ultimate strength, fu, compared to the Swedish code BVS 583.11 (2005). The values from the data base originates from one bridge, therefore it can not be seen as representative for all bridges constructed before 1901. However it shows that bridges from this time frame can have considerably higher material characteristics than specified in codes. The two remaining time periods, 1901 to 1919 and 1919 to 1940 have almost identical yield strengths, fy, but the ultimate strength, fu, is higher for the time period 1901 to 1919.

Fatigue assessment of riveted bridges
88
A comparison between properties in BVS 583.11 (2005), and from the data base for the time interval 1901 to 1919, shows a 40 % higher yield strength, fy, and 30 % higher ultimate strength, fu, in the data base. The statistics for the time period 1919 to 1940 shows a 13 % higher yield strength, fy, for steel in the data base than recommended in the BVS 583.11 (2005). Concerning the ultimate strength, fu, a 4 % lower value was obtained from the data base compared to the value in the code. Information concerning rivets properties can also be found in BVS 583.11 (2005). Recommendations for the ultimate strength for rivet material is, fu = 330 MPa, but if the rivets are used in a connections between girders the characteristic value of the ultimate strength is reduced to fu = 247.5 MPa, see Table 4.10. There is a big reduction concerning the capacity of the rivets in BVS 583.11 (2005). The reduced value of the ultimate strength in the code has almost the same value as the yield strength of the rivets in the data base. Table 4.10 Material properties for rivets in the data base
Property Mean Stdv 5 % frac
No. of samples
BVS 583.11 (2005)
Recommended char. values
Period -1901 fu [MPa] 496 40 429 19 330 / 247.5
Period 1901-1919 fu [MPa] 477 10 454 5 330 / 247.5
As mentioned before the toughness properties vary considerably. A reason for this is that toughness was not controlled in the production process of early produced metals. In the results from the evaluation of the data base there is a big spread in the toughness results as indicated by the standard deviation, some times even bigger than the mean value. Therefore there no recommendation will be provided concerning toughness of old bridges, it is recommended that the toughness is controlled for each bridge that is going to be investigated. Recommendations concerning material properties of old steel, as a rule of thumb when encountering steel bridges erected before the 1940’s with unknown material properties use the yield strength fy = 220 MPa and concerning the ultimate strength fu = 350 MPa. Concerning rivet properties the value of the ultimate strength fu = 330 MPa can be used in both connections joints as for rivets in girders.

Fatigue life of riveted girders
89
5 Fatigue life of riveted girders
5.1 Introduction Fatigue endurance is one of the major factors influencing the service life for steel bridges. The technique of riveting bridges is obsolete and not practised for infrastructures today. Due to this, there is a lack of knowledge concerning riveted girders ability to withstand fatigue. In the following sections an evaluation of the results found in the literature survey, Section 2.5.2, is presented. The evaluation concerns the fatigue resistance of riveted girders and what influence clamping force, corrosion, hole preparation and material properties have on the fatigue performance.
5.2 Evaluation of fatigue endurance In the literature survey in Section 2.5.2, specimens from bridges that had been in service for as long as 100 years or more were tested. The bridges in question were taken out of service due to that their service life was believed to have reached its end or that they were believed to have insufficient load capacity.

Fatigue assessment of riveted bridges
90
Generally the numbers of cycles the components had been exposed to before taken out of service were not known. Information concerning the number of cycles and stress ranges for the tests has been read from diagrams if the information has not been reported numerically by the researchers. Data concerning the fatigue endurance used in the following chapter can be found in Appendix B. The following thermology used in the evaluation of the fatigue tests, full scale tests (girders from bridges), and small scale tests (parts from girders). To narrow down influencing factors for the full scale tests, an additional subdivision was done by separating tests on plate girders (girders with a web consisting of a plate) and tests on truss girders (a web consisting of bars). The fatigue tests are plotted in log scale diagrams with the number of cycles on the horizontal axis and the stress range on the vertical axis. All tests have the detail category C 71, plotted in the diagrams. The reason to compare the fatigue tests to detail category C 71 is that the detail category C 71 is the referred category in BVS 583.11 (2003) used in Sweden for determine the fatigue life of riveted girders.
5.3 Plate girders Plate girders were often used as primary or secondary girders (stringers and cross girders) in bridges, Figure 5.1. The fatigue investigations found concerning plate girders have been conducted as four point bending tests, Figure 5.2. The results found in the literature comprises of 86 tests, as can be seen in Figure 5.3. The referred stress range is the net section stress range.

Fatigue life of riveted girders
91
Figure 5.1 Typical view from underneath a riveted railway bridge
F F
Figure 5.2 Four point bending test on simply supported beams
Cross girder
Stringer
Primary girder

Fatigue assessment of riveted bridges
92
Figure 5.3 Fatigue life of plate girders exposed to a net stress range in the interval of 40 to 240 MPa, inserted in the plot is also the detail category C 71 The endurance for many of the tests in Figure 5.3 is lower than predicted by detail category C 71. The state of corrosion for the tests that are lower than the detail category was classified by the researchers as heavy Fisher et al (1990), Abe (1989) and Out et al (1984) in some cases with a reduction of the cross section in the range of 20 % or more. Tests with heavy corrosion were removed to separate its influence. In the continuous evaluation of the detail category representing plate girders, test samples classed as heavy corroded as well as tests performed under unrealistic high stress ranges over 130 MPa (compared to service loads) have been removed. In Figure 5.4, the remaining 63 girders are plotted, the blue dotted line represent mean value of the fatigue life of the girders, derived with the least square method. The mean value fatigue life expectancy of the tests is clearly

Fatigue life of riveted girders
93
higher than the detail category C 71, and it is almost in complete agreement with detail category C 90. The tests in Figure 5.4 shows that detail category C 71 provides a good estimation of the lowest fatigue expectance of plate girders.
Figure 5.4 Remaining fatigue life of plate girders after tests on corroded girders and tests performed at stress range over 130 MPa was removed

Fatigue assessment of riveted bridges
94
5.4 Truss girders Truss girders are also very common as main girders in old bridges. In Figure 5.5 a truss girder is tested, Helmerich (2005), the investigations of truss girders includes four point bending tests, cantilever testing, and tension tests. In Figure 5.6 the net section stress ranges of the truss girders found in the literature survey, Section 2.4 can be seen.
Figure 5.5 A truss girder tested by Helmerich (2005) as a cantilever test Similar to above only tests with a stress range lower than 130 MPa have been plotted since higher stress levels can not be seen as representative for bridges service conditions. The number of tests conducted on truss girders is 25. The mean value of the fatigue life of the girders has been derived with the least square method and is represented by the dotted blue line in Figure 5.6. The endurance of the truss girders are gathered in to two main areas in Figure 5.6. This probably affects the inclination of the line representing the mean fatigue life since it is steeper than 3, which is the characteristic inclination of the S-N curves for N ≤ 5 x 10⁶ cycles, EN 1993-1-9 (2003). The fatigue performance of truss girders showed that five tests had endurance lower than detail category C 71 and one of the tests had a result distinctly lower than detail category C 63. This specimen had however been exposed to 30 x 106 cycles at lower stress range before it failed. Results of the endurance for truss girders seem to be lower than for plate girders, which probably is a result of high bearing stresses of the rivets. From the result in Figure 5.6, the recommendation for truss girders is to use the detail category C 71 but if the conceptual design provides high bearing ratio, these girders is better estimated by the detail category C 63.

Fatigue life of riveted girders
95
A bearing ratio is defined as the bearing stress of the rivet shank on the plate to the average net section tensile stress in the plane, high bearing ratio influence the fatigue life in the negative way, Al-Emrani (2002).
Figure 5.6 Fatigue tests performed on truss girders fatigue expectancy. 1 Four point bending tests, 2 cantilever tests and 3 tension tests
5.5 Constant amplitude and cut of limit Investigations concerning the constant amplitude limit, N > 5 x 10⁶ cycles, and the cut of limit N > 1 x 10⁸ cycles, are time consuming and expensive. Thus only a few investigations have been conducted at low stress ranges 40 to 60 MPa. In Figure 5.7 all full scale tests found in the literature survey are presented and tests that were aborted due to no failure occurred have been marked as aborted. The constant amplitude limit 52.3 MPa and the cut off limit 28.7 MPa for detail category C 71 have been plotted as dashed lines, Figure 5.7. Investigation conducted by Zhou et al (1995) concerning the cut of limit were performed with stress ranges from 44,1 MPa to 54,4 MPa. The tests were

Fatigue assessment of riveted bridges
96
exposed to 1 x 10⁸ cycles before they where aborted and no cracks were detected when the girders were inspected after the tests.
Figure 5.7 All full scale tests with aborted tests high lighted. The constant amplitude limit 52,3 MPa and the cut of limit 28,7 MPa for detail category C 71represented by the dashed lines From Figure 5.7 it is clear that tests performed with constant stress range below the constant amplitude limit 52,3 MPa do not provide any failures. Concerning the results from Zhou et al (1995) it could not be determined which tests that where performed during constant and varied stress range. Therefore it is harder to draw conclusions concerning the cut of limit. But one should keep in mind that most of the tests are parts from bridges that have been in service and daily been exposed to different stress ranges meaning that all tests should be evaluated according to the cut of limit. Also tests by Brühwiler (1990), Åkesson (1994), Adamson (1995) and Al-Emrani (2002) at stress ranges around 60 MPa were aborted because no cracking was initiated in the tested girders. The conclusion by Zhou et al (1995) was that the fatigue limit for steel girders was ~ 40 MPa if no corrosion or damages were present. This seems to be a reasonable conclusion taken the results of Figure 5.7 in to consideration.
52.3 MPa
28.7 MPa

Fatigue life of riveted girders
97
The question regarding the cut of limit and if there can exist an infinite life for structures exposed to fatigue loads is a topic that do not have any clear answer. Due to that expensive and time consuming tests are required to investigate or determine the cut of limit, not many full scale tests have focused on this issue. With the possibility of using the concept of ultrasonic fatigue testing more investigations has been able to focus on the cut of limit. Ultrasonic testing use frequencies ranging from 15 kHz to 30 kHz. A fatigue test with 109 cycles can therfore be performed in 14 hours, whereas a ordinary fatigue tests performed at 100 Hz requires three years to reach the same amount of cycles, Bathias (1999). The drawback with the method of ultrasonic fatigue testing is that it can provide results that do not match conventional fatigue testing, depending on the high frequencies. Results from Bathias et al (2005), indicates that there is a continued decrease of the fatigue life, but it can not be established if the decrease reaches a lower limit, Bathias (1999). In Eurocode the design philosophy is that there exists a stress range for both constant and varying loading underneath which no fatigue accumulation will occur. From the results of the fatigue endurance of the riveted girders, Figure 5.7, it seems that there exist a cut of limit for varying load and that it can be raised to 40 MPa for riveted plate girders. For truss girders more testing is needed and therefore they can not be evaluated with the higher cut of limit.
5.6 Clamping force The process of riveting as mentioned in Section 2.3.1 was carried out by driving a hot rivet through the parts that were to be connected. The rivet was then formed by hammering the shank to form a head. When the rivet cooled the material contracted, creating a compressive force on the assembled parts, called clamping force. The magnitude of the force differed significantly between rivets depending on the persons conducting the riveting. When replacing damaged or missing rivets in structures, high strength bolts are normally used. A big advantage with high strength bolts compared to rivets is that a defined clamping force can be obtained due to pre loading of the bolts. When using high strength bolts as a replacement for missing rivets, the fit of the bolts can be hard to achieve unless the holes are reamed. The effect of clamping force on the fatigue life of full and small scale tests are presented in Figure 5.8 to Figure 5.9. The investigations in Figure 5.8 contains information from Baker et al (1985) who compared rolled beams with high strength bolts in the flanges to beams

Fatigue assessment of riveted bridges
98
with empty holes. The tests were performed as bending tests. Also in Figure 5.8 the tests of Reemsnyder (1975) can be found, comparing riveted connections to connections with bolt and high strength bolts. The tests were performed as tensile tests. Small scale tests conducted to investigate the influence of clamping force can be seen in Figure 5.9, the tests where performed as tensile tests. Comparing the results of the tests in Figure 5.8 with the ones in Figure 5.9 it can be seen that the effect of the clamping force is similar for small scale and for full scale tests. From the tests it can be seen that by applying a clamping force the fatigue life of full scale tests and small scale specimen can be prolonged. Generally, cracks in girders originate from rivet holes unless they are corroded or damaged in other ways. This is explained by the fact that the hole act as a stress raiser. Large clamping forces extend the fatigue life for full and small scale tests. High strength bolts used to replace rivets provide a good substitute. The amount of clamping force obtained by rivets is much smaller than that of bolts but still it seems to be sufficient to improve the fatigue endurance, as can be seen in the tests of Reemsnyder (1975), Figure 5.8.

Fatigue life of riveted girders
99
Figure 5.8 Full scale fatigue tests with pre-loaded high strength bolts and rivets as connecters and girders with holes in the flanges compared to detail category C 71. Filled symbols represent fatigue tests with high strength bolts and unfilled symbols represent same type of tests but with empty holes or no pre-loading of the bolts

Fatigue assessment of riveted bridges
100
Figure 5.9 Small scale fatigue tests conducted with different extent of clamping force, rivets and pre loaded high strength bolts, compared to detail category C 71
5.7 Hole preparing technique Methods for producing rivet holes in old bridge structures were drilling, punching, sub drilling and reaming, as well as punching and reaming. The surface conditions of rivet holes are believed to be a factor influencing the fatigue life of riveted structures. Opinions concerning the best method for producing rivet holes are not unanimous. Tests concerning fatigue endurances depending on different hole preparation methods conducted on small scale tests can be seen in Figure 5.10. There is a large scatter in the test result, therefore it is hard to determine if one hole preparation method should be preferred before another. Investigations conducted by Fisher (1990) and Wilson et al (1939) also showed that the effect of hole preparation technique is of little influence concerning the fatigue life of riveted structures.

Fatigue life of riveted girders
101
Figure 5.10 Fatigue tests on small scale specimen consisting of plates with different hole preparation techniques compared to detail category C 71
5.8 Corrosion Corrosion is a big problem for steel structures, Figure 5.11. Unless treated with some kind of protection, the resistance for structural details will decrease due to corrosion. Concerning old metal bridges some degree of corrosion will always be present due to the assembling technique with layered parts making corrosion protection hard to perform and maintain.

Fatigue assessment of riveted bridges
102
Figure 5.11 Example of corrosion on a plate girder bridge The amount or the severity of corrosion is hard to compare based on the evaluated tests in the literature. What researchers classify as slight and sever is often not well defined. This is probably the reason why investigations show different results concerning the effect of corrosion. Some researchers Adamson (1995) and DiBattista (1998) had slight corrosion present in their tests and their conclusion was that corrosion did not influence the fatigue life. In Fisher et al (1974) it was concluded that corrosion did not alter the crack initiation from rivet holes unless the corrosion had reduced the cross section with more than 20 %. If the corrosion damage is not too severe and if the rivet heads protects the hole from corrosion, the conclusions from Åkesson (1994) and Brühwiler (1990) were that the influence was marginal. Some researchers Mang et al (1993), Abe (1989), Brühwiler (1990) agrees on that the effect of corrosion is of negative influence and Mang et al (1993) states that corrosion gives faster crack propagation. The conclusion in Forsberg (1993) was that corrosion and notches substantially reduce the fatigue life. A clear indication is given in Figure 5.4 in which the fatigue life improved when the plate girders that had been classified as heavily corroded were removed. The amount of corrosion that is needed before it becomes a bigger stress raiser than the rivet holes is not clear, but rough surfaces due to corrosion acts as stress raisers which can cause the growth of cracks. It should be kept in mind that the ductile parts of old steel are located at the surface of plates and angles. A corroded structure will have a reduced cross section consisting of brittle material, which increases the risk of a brittle fracture especially in low working temperatures.
5.9 Material The majority of the bridges produced before 1940 that are operational consists of steel, however there are some made from wrought iron still in service. The number of fatigue tests performed on wrought iron bridges is not as extensive as

Fatigue life of riveted girders
103
for steel bridges. To investigate if the fatigue life of steel and wrought iron girders possible differs, the tests from the investigation of the detail category representing plate and truss girders have been used, see Section 5.3 and 5.4. Specimens consisting of steel and wrought iron have been assigned separate symbols in Figure 5.12 and Figure 5.13 representing the endurance of plate and truss girders. Evaluating the results of the tests in Figure 5.12 and Figure 5.13 no major difference can be seen in the performance of steel or wrought iron tests. The detail category C 71 can be used in the determination of the fatigue life of wrought iron girders since the performance is consistent with steel girders.
Figure 5.12 Fatigue tests of plate girders with wrought iron tests highlighted
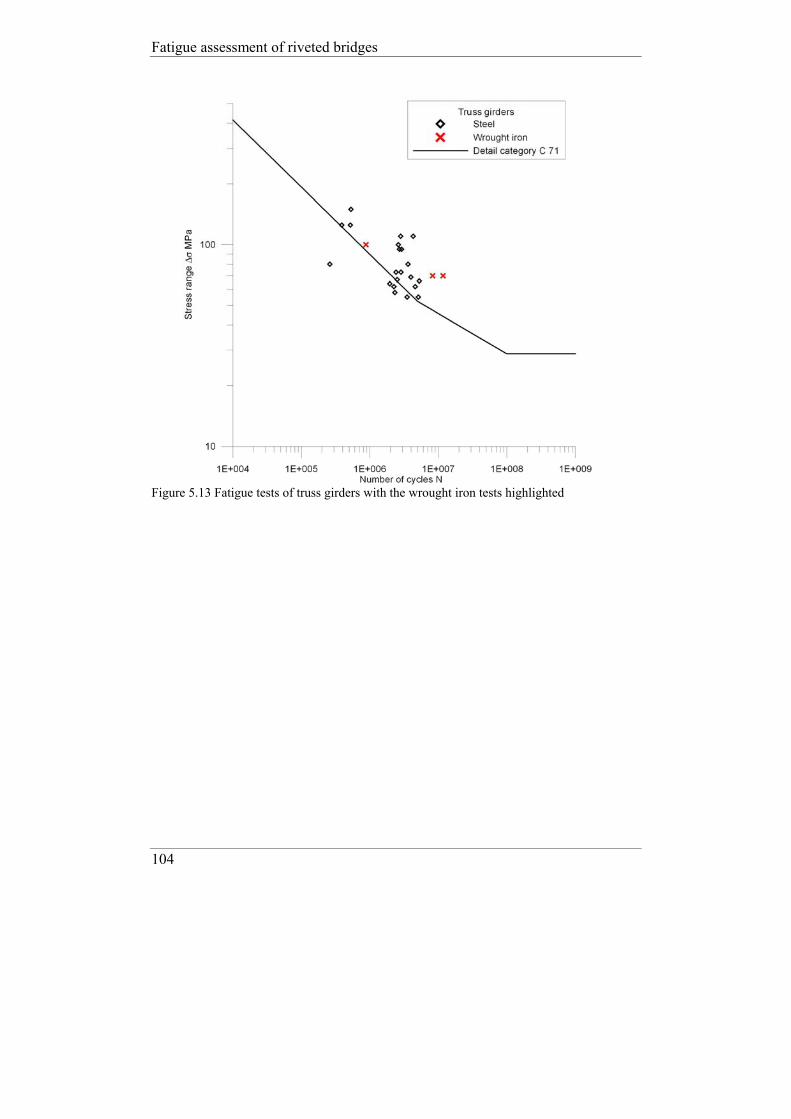
Fatigue assessment of riveted bridges
104
Figure 5.13 Fatigue tests of truss girders with the wrought iron tests highlighted
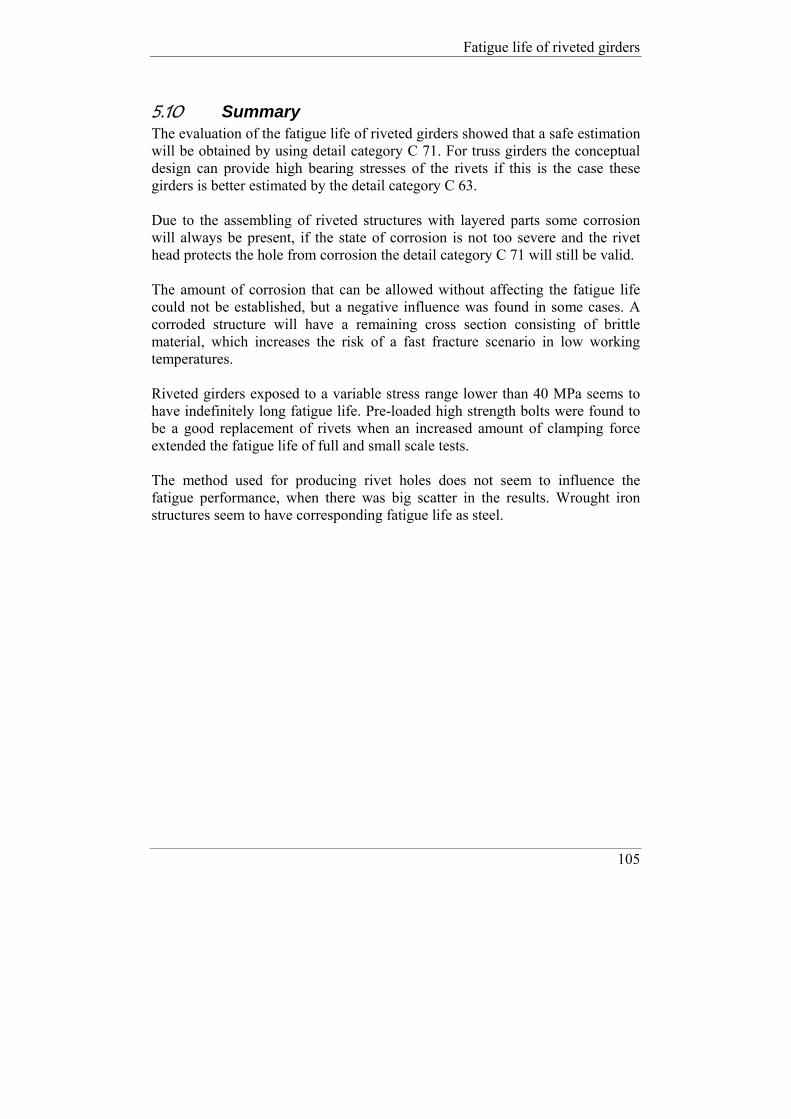
Fatigue life of riveted girders
105
5.10 Summary The evaluation of the fatigue life of riveted girders showed that a safe estimation will be obtained by using detail category C 71. For truss girders the conceptual design can provide high bearing stresses of the rivets if this is the case these girders is better estimated by the detail category C 63. Due to the assembling of riveted structures with layered parts some corrosion will always be present, if the state of corrosion is not too severe and the rivet head protects the hole from corrosion the detail category C 71 will still be valid. The amount of corrosion that can be allowed without affecting the fatigue life could not be established, but a negative influence was found in some cases. A corroded structure will have a remaining cross section consisting of brittle material, which increases the risk of a fast fracture scenario in low working temperatures. Riveted girders exposed to a variable stress range lower than 40 MPa seems to have indefinitely long fatigue life. Pre-loaded high strength bolts were found to be a good replacement of rivets when an increased amount of clamping force extended the fatigue life of full and small scale tests. The method used for producing rivet holes does not seem to influence the fatigue performance, when there was big scatter in the results. Wrought iron structures seem to have corresponding fatigue life as steel.

Fatigue assessment of riveted bridges
106

Field measurements on the Keräsjokk Bridge
107
6 Field measurements on the Keräsjokk Bridge
6.1 Introduction To investigate the best way to model connections between stringers and cross girders in through truss bridges, measurements of the actual behaviour is crucial. In this chapter the field measurement used to evaluate the FE- models in Chapter 7 is presented. Measurements performed on the bridge were carried out by Complab at Luleå University of Technology, Sweden. A more detailed report of the measurements and the results can be found in Enochsson (2006) and Enochsson (2007). The investigated bridge, the Keräsjokk Bridge is a through truss bridge manufactured by Kockums mekaniska verkstad, Sweden, erected in the year 1911. The bridge has a total length of 31.6 m and a width of 4.85 m and is a one span bridge, see Figure 6.1. The bridge is situated on the railway line

Fatigue assessment of riveted bridges
108
“Haparandabanan”, mainly used for freight transportation between Sweden and Finland, see Figure 6.2.
8 x 3950
4850
Figure 6.1 The Keräsjokk Bridge
Finland Sweden The Keräsjokk Bridge
Haparandabanan
Boden
Haparanda
Luleå
Piteå
Figure 6.2 Location of the Haparandabanan and the Keräsjokk Bridge in the northern part of Sweden The Swedish Rail Administration, owner of the line, wants to increase the allowable axle load on the Haparandabanan, from 22.5 ton per axle to 25 ton per axle. A new railway is built parallel to Haparandabanan to meet the higher

Field measurements on the Keräsjokk Bridge
109
demands concerning loads and speeds. To ensure freight transportation until the new line stands ready, field measurements were performed on five of the bridges along the Haparandabanan to investigate their utilization and the possibility to increase the axle load on the existing bridges. One of these bridges was the Keräsjokk Bridge. A visual inspection was performed before the field measurements were initiated. The inspection of the bridge did not reveal any damages due to its years in service.
6.2 Measurements The main concern of the measurement was to determine the dynamic response of the bridges. The dynamic load factor in the BVS 583.11 (2005) used to assess the bridge was believed to be too high, raising questions concerning the possibility to increase the axle load on the actual bridges. To determine the dynamic response of The Keräsjokk Bridge, measurements were performed on one stringer and one cross girder as well as on the primary structure of the bridge. Positions for registrations during train passage are marked as A, B and C in Figure 6.3. Deflections in the cross girder (A) and the stringer (B) were performed with a Linear Variable Differential Transformer (LVDT), while the deflection of the whole bridge (C) was measured by a laser. Strain measurement where performed with welded gauges, in the cross girder (A) and the stringer (B).
CA BSouth North
Figure 6.3 High lighted members A and B are the cross girder and the stringer where strain and deflection measurements were performed. In point C the total deflection of the bridge where measured Measurements of interest to this thesis were the static response of the bridge, that is to measure the loads without any or minimal influence of dynamic amplification. Presented results from the measurements are thus for speeds of the trains as low as ~5 km/h. The speed was chosen since it was the lowest speed the trains could be operational at, and was believed to provide results without dynamic response.

Fatigue assessment of riveted bridges
110
6.2.1 Deflection measurement The deflection measurements were performed with LVDT’s placed on the lower flange in the middle of the spans of the cross girder and the stringer. To provide a reference point for the measurement of deflections a cable rack was arranged underneath each beam. The cable rack were mounted in the primary truss for the cross girder deflection measurements, and for measuring the stringer deflection, the cable rack were fastened between two cross girders, see Figure 6.4.
Figure 6.4 Arrangement of the cable rack underneath the bridge to provide a reference point to perform deflection measurement with a LVDT
6.2.2 Strain measurements Strain measurements were performed with welded strain gauges. To provide a clean and smooth surface to weld the gauges the girders were grinded. In Figure 6.5 the gauges of the cross girder placed on the lower part of the web and angle are presented. Four strain gauges were mounted on the cross girder placed on the lower flange, the angle of the lower flange, the lower part of web, and the upper part of the web, see Figure 6.5. Strains in the stringer where only measured with two gauges, at the upper and lower part of the web.

Field measurements on the Keräsjokk Bridge
111
Figure 6.5 Welded gauges on the cross girder used to measure the strain during train passing
6.2.3 Laser measurement To be able to get a reference point of the total deflection of the bridge a laser was placed in a right angle to the bridge. A prism was placed on the main truss in the middle of the bridge, reflecting the laser beam back to the instrument, see Figure 6.6.
Figure 6.6 Position of the laser targeting the prism placed on the truss in the middle of the bridge
6.2.4 Trains used in the measurements Trains passing the bridge during the measurements were allowed to have an maximal axle load of 22.5 tons per axle. Measurements were performed at two occasions, the 30th of May 2006 and on 2nd of August 2006. The same type of locomotives type T44 was used at the two measuring occasions. Two joined T44 locomotives where used to pull the trains, see Figure 6.7. Data of the T44 locomotives are presented in Table 6.1.

Fatigue assessment of riveted bridges
112
Figure 6.7 The T44 locomotives used at the measurements Table 6.1 Data of the T44 locomotive, for L, L2 and A see Figure 6.7
T44 locomotive L 15.4 meter L2 7.0 meter A 2.4 meter
Axle load 19.0 ton Total weight 4 x 19 = 76 ton
6.3 Results Results from the field measurements are presented in Figure 6.8 to Figure 6.12 to grasp the response of the measured girders and the bridge when the locomotives pass. In the figures the measured deflection and strain have the unit millimetre and micro strain on the Y-axis, while the unit on the X-axis is Load steps. The measured unit on the X-axis is actually time in seconds but to be able to compare the results between the measurements and the FE–calculations in Chapter 7, they have been transferred into so called load steps. A load step is a unique position of the passing locomotives making it easier to identify and compare the positions between the two investigations.
6.3.1 Deflection results The deflection of the whole bridge, the stringer and the cross girder were small, ranging from less than 1 to ~10 mm. The results of the measurements are presented in Figure 6.8 to Figure 6.10. The total deflection of the bridge performed by the laser from the entering of the first T44 locomotive to the position where both locomotives were situated at the middle of the bridge resulting in a maximum deflection of 10 mm is shown in Figure 6.8.

Field measurements on the Keräsjokk Bridge
113
CSouth North
Figure 6.8 Measured deflection in the middle of the bridge, position C

Fatigue assessment of riveted bridges
114
The deflections in the cross girder due to the passing of the T44 locomotives measured with an LVDT had a maximum deflection of ~1 millimetre, see Figure 6.9. From the measured deflection the bogies of the T44 locomotives can be identified when they pass the cross girder.
ASouth North
Figure 6.9 Deflection in the cross girder during the passing of the T44 locomotives, position A
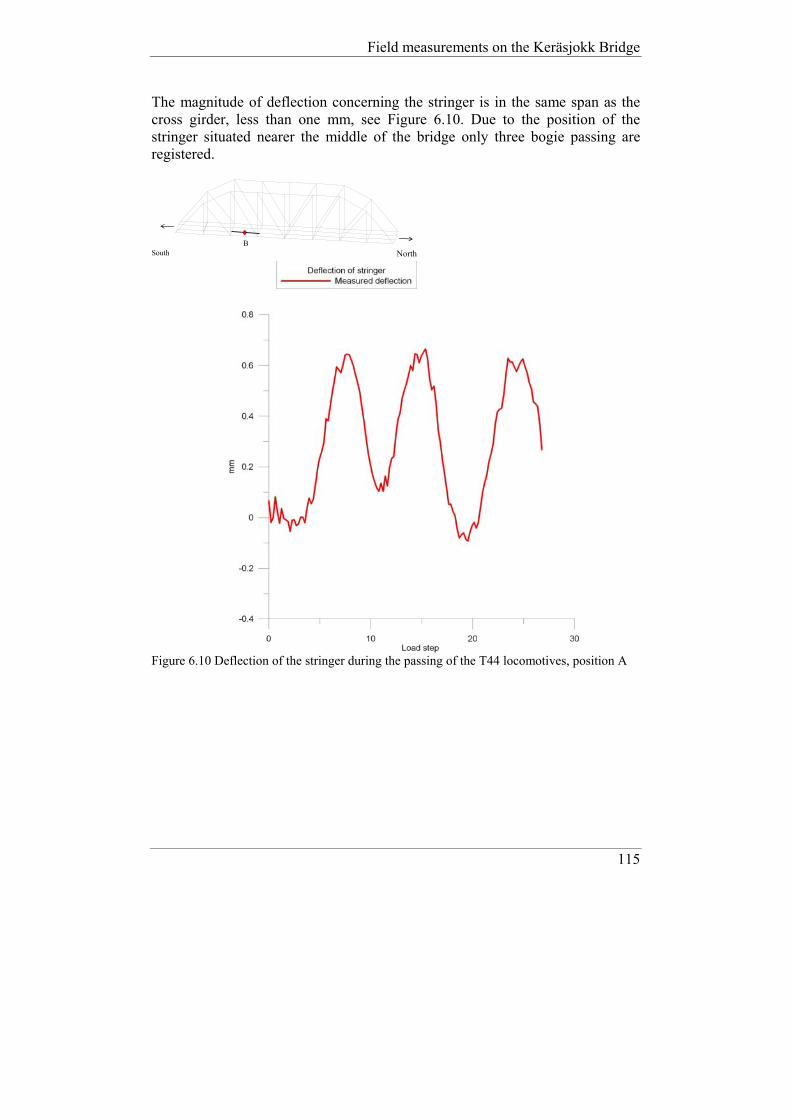
Field measurements on the Keräsjokk Bridge
115
The magnitude of deflection concerning the stringer is in the same span as the cross girder, less than one mm, see Figure 6.10. Due to the position of the stringer situated nearer the middle of the bridge only three bogie passing are registered.
B South North
Figure 6.10 Deflection of the stringer during the passing of the T44 locomotives, position A

Fatigue assessment of riveted bridges
116
6.3.2 Strain results As mentioned in 6.2.2 strain measurements where performed with welded strain gauges, the number and the position of the gauges differed between the cross girder and the stringer. The showed results of the strain measurement in the cross girder are the gauges positioned at the top bottom flange and the top of the web during the passing of the T44 locomotives, see Figure 6.11. Data from these two gages were chosen to obtain the highest strains from the measurements.
ASouth North
Figure 6.11 Strain measurement at position A, in the bottom flange and at the top of the web for the cross girder during the passing of the T44 locomotives
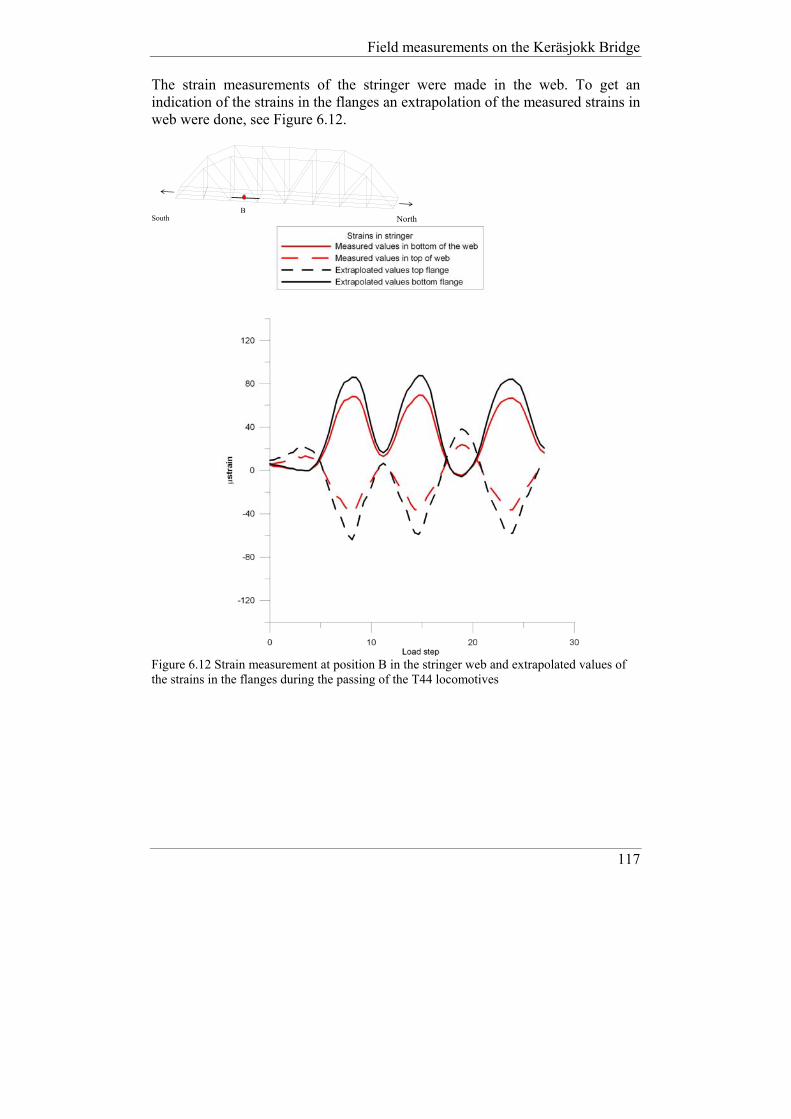
Field measurements on the Keräsjokk Bridge
117
The strain measurements of the stringer were made in the web. To get an indication of the strains in the flanges an extrapolation of the measured strains in web were done, see Figure 6.12.
BSouth North
Figure 6.12 Strain measurement at position B in the stringer web and extrapolated values of the strains in the flanges during the passing of the T44 locomotives

Fatigue assessment of riveted bridges
118
6.4 Summary Performing measurements on a bridge is a difficult task, i.e. the simplest things in a laboratory environment can be hard to accomplish in the field. One of these things is that bridges often stretch over water or other obstacles making the underside difficult to access in an easy manner. Due to the long distance to the ground, reference points for measuring deflections is hard to achieve in the field compared to a laboratory test. Concerning deflection measurement of the stringer and the cross girder, their movements were very small, magnitudes of less than one millimetre, especial in relation to the span of the girders that range roughly four meters. The strain measurements performed by the welded gauges provides a reliable result of the utilisation of the girders in the bridge. The maximum stress from the loading of the T44 locomotives in the cross girder was 23 MPa and in the stringer 19 MPa. In the work of Enochsson (2006) and Enochsson (2007) it is shown that the loads from the freight trains and higher speeds provides higher utilisation of the bridge but still the stress levels are quite low. As for the optical deflection measurement, the method of using laser to determine the dynamic response of the bridge, it was concluded that the method was not suitable, though the movement of the bridge where almost too small to be in the range of the measurement equipment. The laser measurement were better suited for determining the maximum deflection of the bridge where the magnitude of displacement better agreed with the measuring range of the device, Enochsson (2006).

FEM analyses of the Keräsjokk Bridge
119
7 FEM analyses of the Keräsjokk Bridge
7.1 Introduction When conducting an evaluation of a truss bridge, a frame model with beam element is usually used, the choice of the type of model is often a balance between time, money and accuracy. Due to the somewhat complex geometry of the girders in truss bridges, built up with angles and plates, simplifications has to be made concerning the girders and how structural elements connect to each other. The most economical and time saving way of modelling truss bridges therefore often becomes a frame model consisting of beam elements. The design of girders in truss bridges were performed with the assumption that the connections between the stringer and the cross girders where pinned or simply supported. This assumption is on the safe side concerning the ultimate limit, since it provides larger bending moments in the girders. However, for a more modest loading of day to day traffic, service loads, this assumption is not completely correct since some bending moments are taken by the connections.

Fatigue assessment of riveted bridges
120
Terrence et al (1995) performed measurements on two open deck plate girder bridges built 1904 and 1917. Speeds of the trains range from ~5 km/h to ~90 km/h during the measurements, modelling of the bridges was performed to determine the best way of representing the connections between the stringers and cross girders when assessing the remaining fatigue. DiBattista et al (1998) performed in situ measurements on a through truss bridge built 1911, measurements were also performed on moving trains ~50 km/h. The bridge was modelled with both rigid and pinned connections to investigate the best way of representing the stresses originating in the stringers. To investigate the best way of modelling a through truss bridge with beam elements, FE-models were compared to the measurements of the Keräsjokk Bridge, see Chapter 6. To determine the best way of representing the connection behaviour in riveted bridges the investigations performed by Terrence et al (1995) and DiBattista et al (1998) focused on pinned and rigid connections. But can behaviour of a semi rigid connection better represent the in situ measurements of the Keräsjokk Bridge? To investigate this, the behaviours of a pinned and rigid connection was first examined, this to get the extreme behaviours that a girder can experience concerning deflections and strains. The train speed in the evaluated measurement was ~5 km/h to minimise the influence of dynamic response of the bridge.
7.2 Model information The Keräsjokk Bridge, Figure 7.1, was modelled using the program Abacus 6.7.1 and the pre-processor CAE. Euler Bernoulli beam element (B33 elements with a 2-node cubic formulation) was used for all girders.
Figure 7.1 A rendered beam model of the Keräsjokk Bridge
Z
X
Y

FEM analyses of the Keräsjokk Bridge
121
Abacus gives the possibility to assign cross sections to the beam elements. Due to the different types of geometries a truss bridge contains, with girders consisting of angles and plates, simplifications to the geometry were done in the modelling. Girders in the main truss and in the secondary system (stringers and cross girder) were modelled as I-girders. To get a response as similar as possible to the riveted girders in the bridge, height, and moment of inertia of the girders in the model were set to the actual values. Break and wind bracings where modelled with angles and thereby consisting of the same geometry as the ones in the bridge. Connections between girders in the main truss were modelled with a connection called “beam”, the “beam” connection creates a rigid connection between elements. The cross girders were mounted to the main truss with “beam” connections. The connection type was chosen due to the conceptual design of the bridge with the cross girders integrated in to the main truss with plates, see Figure 7.2. Connections between stringers and cross girders were modelled with a connection called “join + rotation”. The connection provides the opportunity to control the rotation properties of the connection, rotation can be set to be rigid or pinned, also stiffening behaviour is possible. Bracing systems were also modelled whit the “join + rotation”.
Figure 7.2 Connection between cross girder and the main truss, Enochsson (2007)

Fatigue assessment of riveted bridges
122
The load on the bridge was modelled to be in agreement with the axle spacing and the load of the T44 locomotives, Figure 6.7. The T44 locomotives had an axle weight of 19 ton providing a concentrated load of 93.2 kN per wheel. Loads from the wheels where introduced directly on to the stringers. The model was calibrated against the T44 locomotive due to the exact weight of the freight wagons could not be established. The locomotives where moved in increments over the bridge, the length of each increment where 2 meters. If a boogie configuration missed the stringer or the cross girder where measurements were performed in the field measurement, an extra load step was introduced. The movement of the T44 locomotives was stopped when the maximum displacement of the bridge was obtained, with the locomotives positioned at the middle of the bridge. No further calculations where performed, since these only would provide a repetition of previous calculations. 14 positions of the T44 locomotives where calculated, from the entering of the first axle of the locomotive, to the end of the calculation with both locomotives standing at the middle of the bridge. The loads where ramped linearly over the steps, providing the condition that the bridge newer becomes unloaded between steps. In figures presenting results of measured strains and deflections of the FE-calculations, the X-axis has the unit “load steps” representing the different positions of the locomotives. But instead of 14 load steps as the number of positions for the calculations of the locomotive, there are 28 load steps. The double amount of load steps is due to a calculation of T44 locomotives movement over the bridge contains two parts, movement of the axles to the new position and the applying of the axle load. In the figures measurements from the Keräsjokk Bridge has been inserted to make comparisons easier. The boundary conditions (supports) on the left side of the bridge were modelled as rigid in all directions X, Y, Z except for the rotation in the Z- direction (the depth of the bridge). On the opposite side of the bridge displacement was allowed in the X-direction, but Y- and Z-displacement were locked. Rotation on the right side of the bridge were allowed in the Z-direction (along the depth of the bridge) but locked in the rest.

FEM analyses of the Keräsjokk Bridge
123
7.3 Results Validation of the models of the Keräsjokk Bridge was performed by comparing strains and displacements from the FE-calculations with the in situ measurement from two T44 locomotives. To evaluate the response of the bridge, information from the two measuring occasions where used since the global deflection of the bridges was only available for 30th of May. As mentioned earlier deflections were measured at cross girder (A), stringer (B) and midspan (C). Also strains where recorded in positions (A) and (B), see Figure 7.3.
CA BSouth North
Figure 7.3 Positions where deflections and strains were registered in the bridge and where data from the FE-model was monitored
7.3.1 Strains Results concerning strains in the stringer and cross girder due to modelling of the connections as pinned or rigid can be seen in Figure 7.4 to Figure 7.6. The phase of the measured and calculated curves are not in complete agreement, this is due to the measured values has the time in seconds on the X-axis and the calculated has load steps. To be able to compare the results, the time from the in situ measurements have been scaled into load steps. In the process of scaling seconds into load steps the measured results from the Keräsjokk Bridge become slightly out of phase. Strains in stringer The FE-model can only provide strains in the flanges of the stringers. Therefore, the evaluated values of the strains from the measurements are the extrapolated values, see Figure 7.4. The pinned connection provided strains larger than the measured. A better fit is obtained when the connections where modelled as rigid, see Figure 7.5, however the response from the bridge provides lower strains than obtained by a rigid connection as well. In the two figures the bogie configurations of the T44 locomotives can be distinguished as they move across the bridge.

Fatigue assessment of riveted bridges
124
BSouth North
Figure 7.4 Calculated strains in stringer modelled with a pinned connection compared to measured values

FEM analyses of the Keräsjokk Bridge
125
BSouth North
Figure 7.5 Calculated strains in stringer modelled with a rigid connection compared to measured values

Fatigue assessment of riveted bridges
126
Strains in gross girder Strains in the cross girder where as mentioned above measured at the bottom flange and in the top of the web. A comparison of the measured strains and the calculated provided by the FE-model has a good agreement, see Figure 7.6. No major differences where found in the results depending on connection type.
ASouth North
Figure 7.6 Measured strains in cross girder compared to measured values, modelled with rigid connections
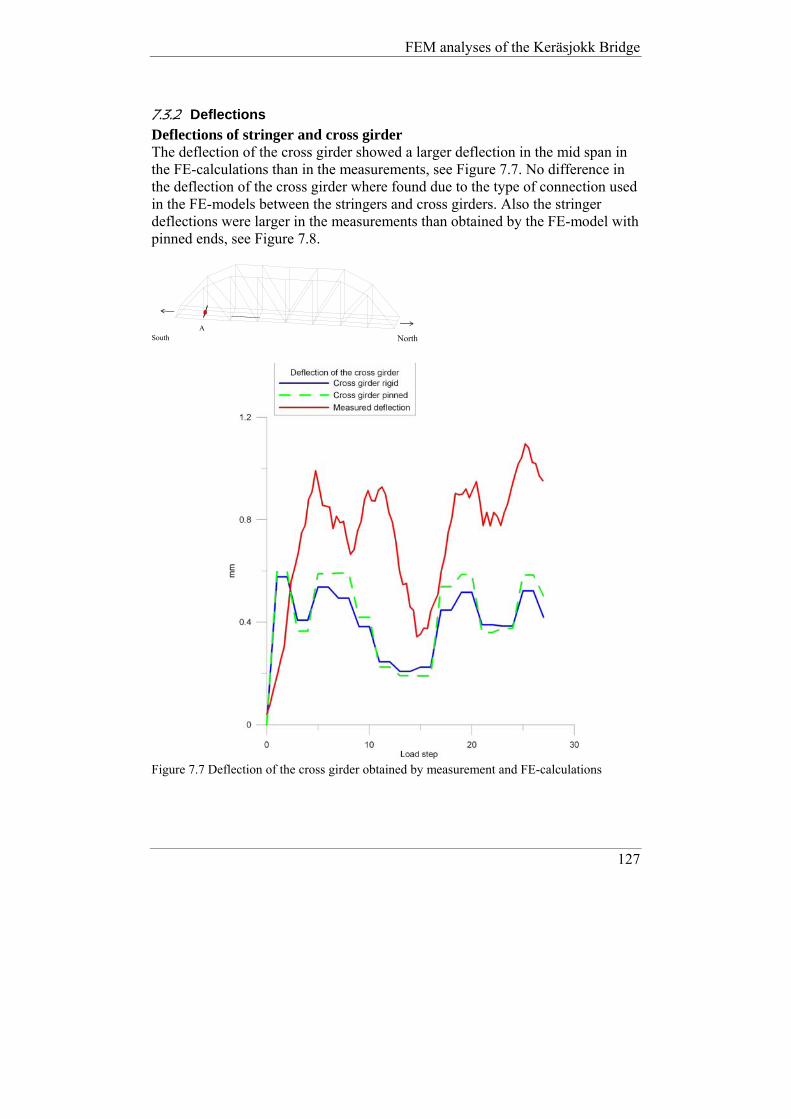
FEM analyses of the Keräsjokk Bridge
127
7.3.2 Deflections Deflections of stringer and cross girder The deflection of the cross girder showed a larger deflection in the mid span in the FE-calculations than in the measurements, see Figure 7.7. No difference in the deflection of the cross girder where found due to the type of connection used in the FE-models between the stringers and cross girders. Also the stringer deflections were larger in the measurements than obtained by the FE-model with pinned ends, see Figure 7.8.
ASouth North
Figure 7.7 Deflection of the cross girder obtained by measurement and FE-calculations

Fatigue assessment of riveted bridges
128
South NorthB
Figure 7.8 Deflection of stringer in FE-calculation modelled with a pinned and rigid connection compared to the measured performance of the bridge. Measuring position B

FEM analyses of the Keräsjokk Bridge
129
Deflection of the whole bridge The vertical responses of the whole bridge where as mentioned earlier measured by a laser positioned normal to the bridge. The maximum deflection when the locomotives are at the centre of the bridge agrees well with the measured values and the FE-calculation, see Figure 7.9. There is a difference between the measured and calculated deflection when the first T44 locomotive enters the bridge, but the overall behaviour shows similar results between measured deflections and calculated. The global behaviour of the bridge was not affected by the connections types used to model the stringers and cross girders connection.
CSouth North
Figure 7.9 Measured deflection in the middle of the bridge compared to FE-calculations

Fatigue assessment of riveted bridges
130
7.4 Summary The purpose of the FE-models where to investigate the response of the connections between stringers and cross girders, and to determine which behaviour that provides the best agreement compared to the in situ measurements of the Keräsjokk Bridge. When comparing the results provided by the two connection types pinned and rigid to the measurements it was demonstrated that the best way of modelling the joint between the stringers and the cross girders were with a rigid connection. Measured and calculated deflections did not match each other very well however they where in the same range. The most reliable results from the measurements in Chapter 6 were obtained by the strain gauges. Due to this the strain results have been used in the evaluation of how to model the behaviour of the Keräsjokk Bridge best. Concerning the mid deflection of the bridge a good agreement was obtained concerning the total deformation of the bridge when both T44 locomotives were situated at the bridge. A difference of the inclination in the beginning of the deflection curve could be observed between the measured and the calculated. If an evaluation of the fatigue exposure of the stringers and cross girders where to be done the best prediction of the real exposure of a bridge would be obtained by modelling a rigid connection between the stringers and cross girders. This recommendation assumes that there are no cracks in the connections. The result of modelling connections as rigid is in agreement with the investigations conducted by Terrence et al (1995), and DiBattista et al (1998). Similar results were obtained for DiBattista (1998), a stiffer response of the strain measurements of the bridge was obtained compared to the model with a rigid connection. A reason that the stringers have a stiffer response than obtained by modelling the connections as rigid, can be that the loads are distributed in the rails and the sleepers. This provides a more distributed load than assigning the loads directly on the stringers, which will reduce the bending stress.

Stiffness degradation and crack propagation in connections
131
8 Stiffness degradation and crack propagation in connections
8.1 Introduction When stringers carry the load from traffic they deflect, due to this a rotation will occur at the stringer end connections. The traditional approach for designing riveted connections between stringers and cross girders were to treat them as pinned, allowing for rotations to occur without any moments taken by the connections. In Section 3.3.1 the behaviour of semi rigid connections and their characteristics were presented, somewhere in-between a pinned and a rigid connection. Due to the fact that these riveted connections can both rotate and give rise to a certain amount of rotational stiffness they provides both beneficial and negative effects. For the stringers a beneficial effect arises, when a certain amount of bending moment is taken by the connections due to their rotational stiffness. This decreases the magnitude of the stress in the midspan of the stringers. The negative effect is that the connections were not designed for this bending moment.

Fatigue assessment of riveted bridges
132
The bending moment that arises in the connections, makes the top part of the connection situated at the cross girder web to be pulled out towards the stringer while the bottom part of the connection is pushed in to the cross girder web. The compression (bottom) and tension (top) side of the connection give rise to a force couple equal to the bending moment transferred by the connection. But what happens to the stiffness of the connections when it starts to crack and how can the remaining fatigue life be evaluated? In order to investigate the degradation of riveted connections the results from the tested connections performed by Al-Emrani (2002) have been used. A summary of the tests performed can be found in Section 3.2 or in Al-Emrani (2002). To be able to describe the degradation of the stiffness in the connections as they crack, a fracture mechanic approach was chosen. The fracture mechanic model is an analytical approach used to describe the behaviour of the tested connections. To make the analytic approach possible, simplifications of the geometry and the loading of the connections had to be done.
8.2 Fracture mechanics to evaluate the stiffness degradation
A mention in Section 2.5.2 there are three types of crack propagation modes in fracture mechanics, see Section 2.5.2. Where mode I is the most common mode representing the normal stress that opens a crack, see Figure 8.1. Due to that most engineering problem concerning fatigue has cracks growing perpendicular to the principal stresses, researchers in fracture mechanics have focused on this crack propagation mode.
Mode I
σ
σ
Figure 8.1 Mode I which am the most common mode used in engineering where the normal stress opens the crack

Stiffness degradation and crack propagation in connections
133
To be able to determine stiffness degradation due to crack propagation in the connections, a mode I model was chosen. By using the elementary case of a beam with an edge crack exposed to moment, see Figure 8.2, it was believed that the response of connections could be described as they where exposed to fatigue. The idea was that the fracture mechanic model in Figure 8.2 should represent a rigid connection containing a crack at the top of the connection. As the crack grows the connection goes from rigid to a pinned. This approach was also believed to catch the behaviour of a semi rigid connection between stringers and cross girders.
w a
M M
Beam with an edge crack exposed to moment
Figure 8.2 Elementary case used to describe the stress intensity factor of the connections From the fatigue tests of Al-Emrani (2002) it was observed that the bending moment transferred by the connections decreased with the length of the crack. The slow down of crack propagation was believed to be a cause of the lower moment transferred by the connections. It was therefore assumed that the moment exposure was the governing factor to the crack propagation in the connections. This was the main reason to choose the elementary case of a beam with an edge crack exposed to a bending moment, because it is the moment in the model that propagates the crack. To be able to use this model, simplifications of the load exposure and the geometry of the connections had to be done. The simplification of the load exposure was that only global moment acts on the connections, see Figure 8.3. Furthermore modifications were also made on the geometry, the stringer web was taken away, and the angles positioned at the stringer web were joined in to one plate with a crack, see Figure 8.4 and Figure 8.5. When applying this approach on a connection, crack propagation starts at the top of an angle and grows along the fillet as one crack towards the bottom. This is a simplification of the real behaviour, but it is necessary if a mode I model is to be used. Most models developed in the field of fracture mechanics focuses on mode I concerning approaches to determine crack propagation rates. To evaluate the fatigue process of the connections of Al-Emrani (2002) tests the equations of
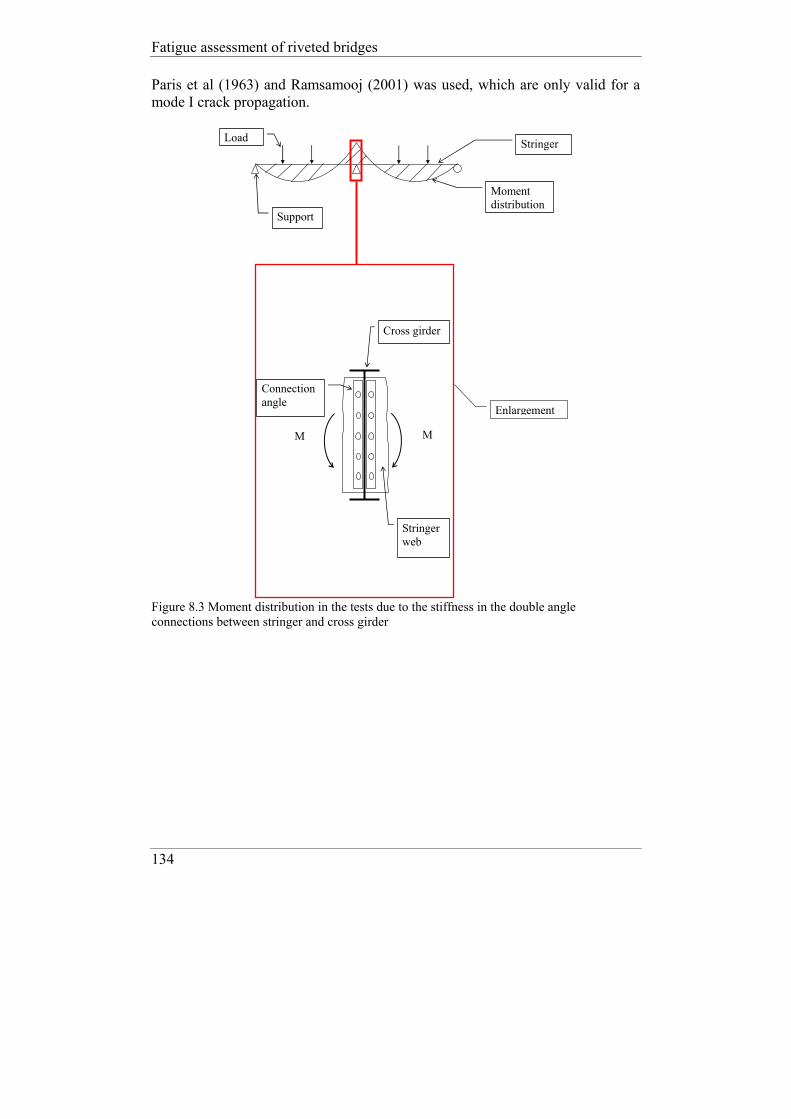
Fatigue assessment of riveted bridges
134
Paris et al (1963) and Ramsamooj (2001) was used, which are only valid for a mode I crack propagation.
Connection angle
Stringer
Enlargement
Support
Cross girder
Stringer web
M M
Load
Moment distribution
Figure 8.3 Moment distribution in the tests due to the stiffness in the double angle connections between stringer and cross girder

Stiffness degradation and crack propagation in connections
135
Cross girder
Crack
Rivets L-angels
Stringer
Stringer
Cross girder
Figure 8.4 An overview of a connection with the girder webs and the angles in a connection magnified

Fatigue assessment of riveted bridges
136
M M w
a
Top view
Top view
Side view
Crack
Crack
L
Figure 8.5 Simplifications made to the geometry of a connection with a crack. The stringer web is taken away, and the remaining parts of the angles positioned at the stringer web are joined in to one plate with a crack

Stiffness degradation and crack propagation in connections
137
The fracture mechanic model is based on the expression derived by Irwin, Equation (8.1).
2It KdU
da E⋅
− = (8.1)
Where U is the elastic energy a is the crack length E is the Young’s modulus KI is the stress intensity factor t is the thickness of the material The stress intensity factor KI for a beam with an edge crack exposed to a moment, M, is according to Equation (8.2).
0 ( / )IK a f a Wσ π= ⋅ ⋅ ⋅ (8.2)
0 2
6Mt w
σ =⋅
(8.3)
1/ 2
32 tan( )
2( / ) 0.923 0.199 1 sin( )2cos( )
2
w aaa wf a w
a ww
πππ
π
⋅⎛ ⎞⋅⎜ ⎟ ⎛ ⎞⋅⋅ ⎛ ⎞⎝ ⎠= ⋅ + −⎜ ⎟⎜ ⎟⎜ ⎟⋅⎛ ⎞ ⎝ ⎠⎝ ⎠⎜ ⎟⎝ ⎠
(8.4)
Where
w is the height of the cracked beam or in this case the segment of the connection
The energy to propagate a crack a certain length can be calculated by integrating Equation (8.1).
2 a
a Io
tU K daE
= ∫ (8.5)
To describe the degradation behaviour of a connection, the additional work or energy that is needed to bend the studied segment has to be determined, Equation (8.6).
2
2s
nos
M LUE I
⋅=
⋅ (8.6)

Fatigue assessment of riveted bridges
138
Where M is the moment acting on the connection Ls is the length of the segment Is is the moment of inertia of the un-cracked segment The total energy applied on the connection when fatigue cracking occurs is given by Equation (8.7) and Figure 8.6.
a noU U U= + (8.7)
M M
Ua
M M
Uno+
Figure 8.6 The total energy needed to bend a beam with a crack, or in this case the segment representing the connection By differentiation with respect to the moment in the expression of the energy, Equation (8.7), the rotation due to a specific crack length can be obtained, Equation (8.8). But since this gives the total rotation of the whole segment the expression must be divided by two to get the rotation of one stringer connection.
12s
dUdM
φ = ⋅ (8.8)
From Equation (8.9) the stiffness degradation in a connection due to a specific crack length can be calculated.
rots
MK φ= (8.9)
Due to the fact that Equation (8.1) to (8.9) are derived for a beam with an edge crack, the stiffness when the crack just has materialized are as a continuous beam. The tested connections were characterized by a semi rigid behaviour somewhere in between rigid and pinned. To be able to catch this behaviour a factor T is applied to the un-cracked part of the fracture mechanic model, Equation (8.6). With a factor T the initial rotational stiffness can be adjusted to fit the studied connection, Equation (8.10).

Stiffness degradation and crack propagation in connections
139
An estimation of the initial rotational stiffness of a connection can be determined by the models in Section 3.3.1. The T factor are calculated by the expression in Equation (8.11).
2
2s
noTs
M LUE I T
⋅=
⋅ ⋅ (8.10)
2initial s
s
K LTE I
⋅=
⋅ (8.11)
Where Kinitial is the initial rotational stiffness of a semi rigid connection Ls is the length of the segment Is is the moment of inertia of the un-cracked segment E is the Young’s modulus
8.2.1 Evaluation of the fracture mechanic model To evaluate the fracture mechanic model developed herein, the same tests were used as those in Section 3.3.3. That is, specimen I and II from Al-Emrani (2002). To clarify the meaning of specimens and connections, see Figure 8.7. A specimen is a part from a bridge containing four stringers and three cross girders. The investigated connections are situated in the middle of the specimens.
Figure 8.7 Test set up of Al-Emrani (2002), position of the investigated connections in a specimen are highlighted with the circles To validate the fracture mechanic model the rotational stiffness were compared to the measured in Al-Emrani (2002) tests, an additional control was made directly with the strain measurements performed on the stringers. The tested connection angles had the dimensions 100 x 75 x 9 mm (width x width x thickness) and a height of 740 mm, see Figure 8.8.
Stringer
Cross girder

Fatigue assessment of riveted bridges
140
In Figure 8.9 the values of the rotational stiffness of the fracture mechanic model and the tests are presented.
100 mm
Cross girder web
Stringer web
~140 mm
~140 mm
~140 mm
~140 mm
740 mm
75 mm
Figure 8.8 Dimension of angle in the connection between the stringer and cross girder, Al-Emrani (2002) Plotted values for the rotational stiffness of specimen I and II are the static loading of 100 kN applied in the tests. Concerning the fracture mechanic model two curves have been presented, the dotted black curve is the rotational stiffness of a “rigid” connection (T = 1) and the dotted red curve (T = 2.4 x 10⁻³) represents the stiffness corresponding to a semi rigid connection. Calculated values of the rotational stiffness of the connections has been determined by using Equation (8.9). A value in between the initial stiffness of the two tested specimens where chosen for the initial stiffness of the dotted red curve (T = 2.4 x 10⁻³) in the evaluation of the fracture mechanic model. A value provided by the models in Section 3.3, can also be used to obtain the initial stiffness of a semi rigid connection. In the calculation of the tested connections the following parameters have been used in Equations for (8.1) to (8.11): E = 210 GPa t = 0.018 m w = 0.74 m I = 6.08 x 10 -5 m4

Stiffness degradation and crack propagation in connections
141
T = 2.4 x 10⁻³
L = 0.002 m, the model has been calibrated with the length of the segment set to two millimetres to minimise the difference in moment on opposite sides of the crack, see Figure 8.3.
Figure 8.9 Stiffness degradation of specimen I and II from tests and the fracture mechanic model with one rigid connection and a connection where the initial stiffness has been adjusted to fit the properties of a semi rigid with the coefficient T = 2.4 x 10⁻³ The moment in the middle of the stringer due to the loading of the test setup is given by Equation (8.12) with the notations according to Figure 8.10. The origin of the derived Equation (8.12), can be studied in Appendix C , where also the case for a distributed load is presented. From the strain measurement on the stringers provided by Al-Emrani (2002) a comparison of the increase in bending moment due to cracking of the connections were obtained, see Figure 8.11.

Fatigue assessment of riveted bridges
142
( ) ( )22
2 21 16
13
M
rot
c dP L c c c dE I L L
ML
E I K
⎛ ⎞⎛ ⎞+⎛ ⎞⋅ ⎜ ⎟⎜ ⎟− ⋅ + − ⋅ +⎜ ⎟ ⎜ ⎟⎜ ⎟⋅ ⎝ ⎠ ⎝ ⎠⎝ ⎠=+
⋅
(8.12)
Where E is the Young’s modulus I is the moment of inertia of the stringer L is the length of the stringer Krot is the rotational stiffness of the connection, varying due to crack
propagation
P P
c c
d
L
Ma
MM
Figure 8.10 Notations used to calculate the moment in the middle of the stringer. Ma represents the moment originating from the rotational stiffness of the connection

Stiffness degradation and crack propagation in connections
143
Figure 8.11 Moment in the middle of the stringer both from tests and predicted by the fracture model. The dashed lines represent the magnitude of the moment for a beam with rigid and pinned connection A similar response can be seen in, Figure 8.11, between the tests and the fracture mechanic model concerning the increase of moment in the stringers due to the lower stiffness in the connections. As the initial stiffness was chosen to a value between specimen I and II the model provides a moment between specimen I and II until ~ 40 % of the connection has cracked. The model goes from a semi rigid connection when an infinitesimal crack has been initiated to a pinned connection when the crack has propagated through the whole connection. Crack arrest occurred in the tests after the crack had propagated a distance of ~ 35 % of the connection height for specimen I, however the static load was not registered for the load 100 kN at this crack distance. For Specimen II crack arrest occurred after the crack had propagated ~ 60 % of the connection height.
Mpinned
Mrigid

Fatigue assessment of riveted bridges
144
When plotting the stress intensity factor for the fracture mechanic model on the Y-axis and the crack length on the X-axis, an explanation to this crack arrest can possibly be found in Figure 8.12. Due to the cracking in the angles a lower stiffness is obtained for the connection, the lower value of the stiffness makes the stress intensity factor to decrease to a value lower or equal to the threshold, Kth, and thereby the crack propagation arrests. Crack arrest in the tests was obtained for shorter crack lengths than predicted by the model. In the model the value of the threshold for the stress intensity factor occurred when almost the whole connection was cracked and more or less behaved as a pinned connection. The reason for this will be addressed in the summary of this chapter.
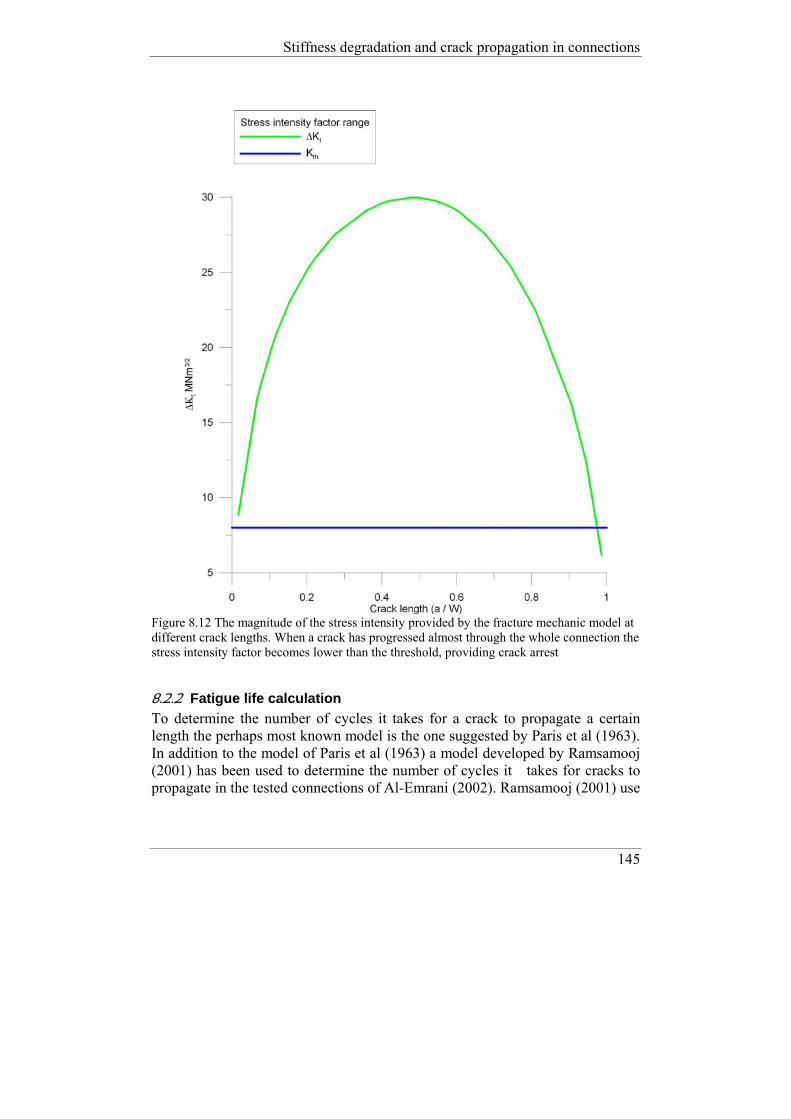
Stiffness degradation and crack propagation in connections
145
Figure 8.12 The magnitude of the stress intensity provided by the fracture mechanic model at different crack lengths. When a crack has progressed almost through the whole connection the stress intensity factor becomes lower than the threshold, providing crack arrest
8.2.2 Fatigue life calculation To determine the number of cycles it takes for a crack to propagate a certain length the perhaps most known model is the one suggested by Paris et al (1963). In addition to the model of Paris et al (1963) a model developed by Ramsamooj (2001) has been used to determine the number of cycles it takes for cracks to propagate in the tested connections of Al-Emrani (2002). Ramsamooj (2001) use

Fatigue assessment of riveted bridges
146
different input parameters in the calculations than Paris et al (1963), making his model a good complement. Crack growth calculations according to Paris et al (1963) are carried out by using Equation (8.13)
( )nI
da C KdN
= Δ (8.13)
Where C is an experimentally determined parameter ΔKI is the stress intensity factor range n is an experimentally determined parameter The model for crack growth calculations according to Ramsamooj (2001) is given by Equation (8.14).
( )2
20.041
1
I th
y Imax
IC
K KdadN E f K
K
Δ −= ⋅
⋅ ⎛ ⎞− ⎜ ⎟
⎝ ⎠
(8.14)
Where E is the Young’ s modulus fy is mean yield strength ΔKI is the stress intensity factor range Kth is the threshold of the stress intensity factor KImax is the maximum value of KI KIc is the fracture toughness Calculation of the crack propagation The results from the equations of Paris et al (1963) and Ramsamooj (2001) used to calculate the crack propagation (da/dN) compared to the tests performed by Al-Emrani (2002) can be seen in Figure 8.13. Crack growth parameters used in the calculations of Paris et al (1963) are retrieved from Barsom et al (1999), and the stress intensity factor is taken from the fracture mechanic model: C = 9.14 x 10⁻¹²
n = 3

Stiffness degradation and crack propagation in connections
147
For the parameters used in Ramsamooj (2001) calculations, the yield strength was taken from the data base, see chapter 4. Value of the threshold of the stress intensity factor was retrieved from Figure 2.21 and the value of KIC was chosen in agreement with Eriksson (2008). Values of the stress intensity factor for different crack lengths were provided by the fracture mechanic model. Values used in the crack propagation calculation of Ramsamooj (2001): E = 210 GPa fy = 278 MPa Kth = 8 MPa / √m KIC = 120 MPa / √m In Figure 8.13 the measured crack lengths and the number of cycles obtained in the tests performed by Al-Emrani (2002) has been converted into crack propagation rates da/dN, [m/cycle] for different crack lengths.
Figure 8.13 Crack propagation rates for specimen I and II and for the prediction models of Paris et a (1963) and Ramsamooj (2001)

Fatigue assessment of riveted bridges
148
These are compared to the crack propagation values obtained by Paris et al (1963) and Ramsamooj (2001). For cracks less than ~15 % of the angle height the crack propagation rate is moderately in agreement with the tests. However when a crack has extended beyond ~15 % of the height of the connection the equations of Paris et al (1963) and Ramsamooj (2001) provides higher crack propagation rates than the observed. By integrating the expressions for the crack propagation in Equation (8.13) and (8.14) the number of cycles that a crack needs to grow a certain length is obtained. The measured results of the crack growth in specimen I and II and the number of cycles anticipated by the models of Paris et al (1963) and Ramsamooj (2001) can be seen graphically in Figure 8.14. The calculated values of the number of cycles by Paris et al (1963) and Ramsamooj (2001) equations for specimen II agrees quite well to a length of the crack corresponding to 20 % of the angle depth. The initial length of the calculated cracks differs between specimen I and II. In specimen I the first discovered crack in the tests was too small (five millimetres) to be used in the calculation of the number of cycles, since this crack length provided a stress intensity factor under the threshold value. Therefore the next measured crack length was used in the calculation corresponding to ~15 % of the angle height. To be able to evaluate the crack propagation in the connections the length of a crack had to be in the range of ~7 % (corresponding to a 0.05 m long crack) of the angle height to obtain a value of the stress intensity factor larger than the threshold value. For shorter cracks than 0.05 m the model will give an overestimation of the available number of cycles.

Stiffness degradation and crack propagation in connections
149
Figure 8.14 Number of cycles required to propagate the crack in Specimen I and II compared to the two propagation models of Paris et al (1963) and Ramsamooj (2001)
8.2.3 Summary The used fracture mechanic model is an analytical approach to determine the degradation of connections exposed to fatigue loading and to make an estimation of the remaining life when a crack has originated. From the fatigue tests performed by Al-Emrani (2002) it is clear that the destructive fatigue process is not the same in all connections. The fracture mechanic model proposed herein is derived for a case where the clamping force in the rivets is sufficient to introduce the fatigue accumulation in the connection angles instead of in the rivet shank. With the possibility to adjust the initial rotational stiffness of the model, it can be used to describe the behaviour of a semi rigid connection and its degradation of the stiffness at a given crack length. The use of the fracture mechanic model to determine crack length shorter than 7 % of the angle height will give an overestimation of the available number of cycles.

Fatigue assessment of riveted bridges
150
A fair estimation was obtained concerning the number of cycles it took for a crack to propagate from 7 % to 20 % of the angle height in specimen II. For specimen I where the calculation starts with a crack length ~15 % of the angle height the correspondence is not as good. The fracture mechanic model is better used to determine the stiffness degradation of the connections rather than predicting the number of cycles it will take to propagate a crack. However if cracks corresponding to ~7 % of the angle height is found in a connection a prediction on the safe side will be obtained by the fracture mechanic model. The fact that the cracks stopped propagating in spite the loading of the specimens continued with 0.7 to 5 million cycles is explained by a decrease of the stress intensity factor to a value lower or equal to the threshold, Kth, arresting the crack propagation. Crack arrest in the tests was obtained for shorter crack lengths than predicted by the model. In the model the value of the threshold was obtained after cracking of almost the whole connection. The difference between the tests and the fracture model concerning the propagation rates and the number of cycles is due to that the model is a simplification of an actual connection and do not correctly describes the true stress state at the crack tip. It is assumed in the model that when a crack has originated it will grow at an increasing pace until half of the connection has cracked, thereafter it will decrease and eventually stop (assuming no other forces than moment acting on the connection). In the tests performed by Al-Emrani (2002) the crack propagation rate was varying, see Figure 8.13. The cause of this can be that the cracks do not always grow in a straight line along the fillet but deviates. Also in the tests crack started to grow from both the top rivets and finally merge in to one crack, this is not covered by the model. Another cause for the varying crack propagation rate in the tests can be that the stresses are redistributed in the angles that constitute the connections between the stringers and cross girders. When a crack has propagated a distance in an angle it experiences a release of built up stress, which causes the crack to slow down. Adjacent angles will then experience a higher stress which can influence the crack propagation rates.

Summary and conclusions
151
9 Summary and conclusions
9.1 Summary
9.1.1 Assessment of riveted bridges - Introduction The two main reasons for an assessment of a bridge are to investigate the possibility to increase the allowable axel load, or if discovered cracks have any negative influence on the load capacity of the bridge. In this chapter the work conducted in this thesis is distillated and it is shown in which areas of bridge assessment improvements have been made, and how they can be used to enhance the capacity of existing bridges. Also a procedure for how to deal with cracks in riveted bridges is discussed.
9.1.2 Increase of the allowable axel load As in Chapter 1, a flow chart of the assessment procedure is presented to provide an overview, see Figure 9.1. Some parts of the assessment can contain several sublevels of calculations and choices. In this section only the improvements or the confirmations of existing approaches have been commented and in which chapter more information can be found. These areas represents the dashed boxes in the flow chart, see Figure 9.1.

Fatigue assessment of riveted bridges
152
Inspection
No cracks
Determine load effects Chapter 7
Determine resistance Chapter 4
Yes No
Determine load history Chapter 7
Remaining fatigue life Chapter 5
Special investigations
Ok ?
Yes No
Special investigations
Ok ?
Cracks
See Section 9.1.3
Figure 9.1 Flowchart of an assessment of bridge to increase the allowable axle load The assessment of the bridge starts with an inspection to establish the condition of the bridge so that there are no cracks present. Thereafter the load effects of the new axle load are determined. In Chapter 7 it is thus investigated how connections between stringers and cross girders of a through truss bridge should be modelled to give the best accuracy of the stresses in the stringers with the ones from field tests. The examined model was a truss model with beam elements. This model type was chosen because it is often used

Summary and conclusions
153
by bridge engineers since it compared to shell or solid model saves time and computer power. The result from the investigation showed that the measured stresses in the stringers were best estimated when modelling the connections between stringers and cross girders as rigid. Modelling connections in this manner is valid as long as there are no cracks or rivet failures in the connections. Work concerning the resistance of bridges can be found in Chapter 4. Here the creation of the data base is described and the mechanical properties that can be expected to find in bridges constructed before the 1940’s. This information is divided into three time periods as in BVS 583.11 (2005). As a rule of thumb the properties of old steel are fy = 220 MPa and fu = 350 MPa. The result concerning bridges produced before 1901 is however not determined with the same certainty as the remaining two periods due to the available data was not of the same extent. Using material properties from the data base which are more likely to be found in an actual bridge compared to the recommended values in BVS 583.11 (2005), an increased capacity is always achieved. The work in Chapter 4 also showed that the toughness differed vastly between structural elements of a bridge and also between bridges. Therefore it is crucial to determine the toughness properties, the type of tests and the amount that has to be retrieved should preferably be performed according to BVS 583.12 (2003). Concerning the determination of the load history, the same procedure for modelling the connections between the stringer and cross girders should be used in a through truss bridge as in the load effect calculation. The connections ought to be modelled as rigid unless there are damages or loss of stiffness in the connections. By modelling the stringer connections in this manner the assessed damage from the time in service will not be as severe as for a pinned connection. Concerning how to determine the accumulated damages from the years in service a short summary is given in Chapter 1. The remaining fatigue life for riveted girders should be evaluated by detail category C 71. Depending on the conceptual design with high bearing stresses of the rivets, some truss girders experience a lower fatigue life, these girders are better estimated by detail category C 63. When corrosion is present stresses in an assessment should be based on the reduced cross section of girders. Beware of corrosion in rivet holes, it lowers the expected fatigue life by becoming a bigger stress raiser than the rivet hole.

Fatigue assessment of riveted bridges
154
9.1.3 Cracks discovered in a bridge The suggested approach for the assessment when cracks are present in a bridge can bee seen in the flow chart in Figure 9.2. As for the previous section the dashed boxes indicates where work have been conducted herein or suggestions are made. If an inspection discover a crack or cracks, mapping of the cracks should be performed and it should be determined if the cracks are new or old. Information from previous inspections can be a good way to determine this. Another way of determining the state of the crack is to control the cracked surfaces. If they contain corrosion or have been painted over one can assume that they are old cracks. An old crack that has arrested is not as alarming as a new. A mark should always be made at the tip of the crack together with the date when it was discovered to be able to monitor any future change in length and propagation rate. The use of fracture mechanics has to be applied, to make predictions of the remaining fatigue life when a crack has started to grow. The concept of Wöhler curves cannot predict the propagation of a cracked section. If it is determined by inspections that the crack is propagating, yes in Figure 9.2, the load effect from the trains operating the bridge should be determined. If the crack is situated in the connections, the loss of rotational stiffness due to the presence of the crack can be anticipated by the fracture mechanic approach in Chapter 8. This could be used in the modelling of the connections between stringers and cross girders to obtain the moment experienced by the stringer for different crack lengths. If the crack instead is in the girders the connections should be modelled as pinned so the maximal stress that can occur is used. The resistance must be determined for the damaged cross section. Material samples must be retrieved. These should be taken from the less stressed parts of the cracked member. This is essential to be able to identify if the bridge fulfils the toughness requirement of BVS 583.12 (2003). If strengthening measures are discussed in a later stage, it must be determined how long the bridge is probable to stay in service, regarding to the toughness requirements in BVS 583.12 (2003). The toughness properties are also vital for conducting a fracture mechanic calculation. The type of tests and the number that have to be retrieved should preferably be performed according to BVS 583.12 (2003).

Summary and conclusions
155
Inspection
Cracks
Propagating
Yes No
Ok ?
Yes No
Determine remaining fatigue life Figure 8.14, Connections Sedlacek et al (1993), Girders
Yes No
Strengthening / replacement
Ok ? Strengthening / replacement
Determine load effects Chapter 8, Figure 8.11
Determine resistance of damaged cross section Chapter 4
Determine resistance of damaged cross section Chapter 4
No racks
Section 9.1.2
Determine load effects Chapter 8, Figure 8.11
Figure 9.2 Flowchart of an assessment for cracked section

Fatigue assessment of riveted bridges
156
Calculations for determining the remaining fatigue life can either be conducted by FE-models or by using standardised fracture mechanic models. Both methods often demand some simplifications to be made, concerning the modelling of the studied geometry or to find a fracture mechanic model that fits the actual crack and loading condition. For cracked girders Sedlacek et al (1993) derived a fracture mechanic approach where the critical length and the number of cycles fairly easily can be determined. Concerning cracks in connections between stringers and cross girders an approach was presented in Chapter 8. The accuracy to predict the available number of cycles gives room for improvement concerning short cracks, but it provides a method to estimate the remaining number of cycles on the safe side for a connection when the crack has reached a length of ~7 % of the angle height. If the remaining fatigue life is acceptable no further action is needed. Otherwise measures for delaying crack propagations has to be employed such as stop hole drilling, placing pre-loaded high strength bolts in stop drilled holes, peening, or strengthen the cracked areas with plates mounted with pre-loaded high strength bolts. These methods have been used for cracked girders, however with varying results. Replacing missing or fatigue damaged rivets with pre-loaded high strength bolts is a method that extends the fatigue life for riveted girders, Chapter 5, as well as connections with cracks growing from the rivet holes. If this is not sufficient the cracked parts must be repaired or replaced. When there is no crack propagation the load effect should be based on the trains operating the bridge. Connections between stringer and cross girders should be modelled as pinned in a through truss bridge so the maximal bending stress that can occur is used if a crack is discovered in a stringer. The resistance of the cracked cross section has to be determined. Material tests should be taken from the less stressed parts of the cracked member, to determine if the bridge fulfils the toughness requirements of BVS 583.12 (2003). The type of tests and the amount that has to be retrieved should preferably be performed according to BVS 583.12 (2003). If the resistance concerning load and toughness is sufficient there is no need for further action to be taken, otherwise strengthening or replacement should be decided upon.
Summary and conclusions
157
9.2 Conclusions Main conclusions from the work in this thesis are as follows: With the creation of the data base an increased knowledge concerning material properties of steel bridges constructed before the 1940’s have been attained. As a rule of thumb the following properties can be used for old steel in an assessment of a bridge fy = 220 MPa and fu = 350 MPa. The detail category that best represents the fatigue life of riveted bridges is C 71. For truss girders the conceptual design can provide high bearing stresses of the rivets, if this is the case these girders are better estimated by the detail category C 63. Due to the assembling of riveted structures with layered parts some corrosion will always be present. If the state of corrosion is not too severe and the rivet head protects the hole from corrosion the detail category C 71 will still be valid. Riveted plate girders exposed to a variable stress range lower than 40 MPa seems to have indefinitely long fatigue life. Pre-loaded high strength bolts were found to be a good replacement of rivets, when they prolong the fatigue life of full and small scale tests. The method used for producing rivet holes does not seem to influence the fatigue performance. However there was big scatter of the results. Wrought iron structures seem to have corresponding fatigue life as steel. By modelling the connections between stringers and cross girders as rigid the best compliance will be obtained to the actual behaviour of stringers in truss girder bridges. The proposed fracture mechanical model provides a reliable method which can estimate the degradation of stiffness in connections between stringer and cross girders. The model can also give predictions of crack propagation on the safe side if the crack length corresponds to ~7 % of the angle height or more.

Fatigue assessment of riveted bridges
158
9.3 Future research During the work of this thesis the following areas have been found where more research is needed. The first area concerns fatigue tests. More tests are needed on truss girders to get a better understanding of their fatigue life. Also there is a big need to increase the knowledge concerning varied stress range. Further tests with riveted girders should thus be performed at a varied stress range between 40 to 60 MPa, similar to the levels experienced by the girders in a bridge. Few tests have been carried out concerning full scale tests on connections, additional tests are needed in order to obtain a better picture of these connections and to confirm the results obtained in this study. The second area is how to estimate crack propagations by fracture mechanics. Generally, there is more work to be done concerning cracks and their propagations in riveted structures. The proposed method in this thesis concerning crack propagations in connections leaves room for improvement. Models that better estimate the course of cracking propagation from the initiating of a crack to the arrest or failure is needed. The last area concerns full scale measurements on bridges in service. Further investigations are needed to confirm the results of the best way of modelling connections between stringers and cross girders. From field measurements and a calibrated fracture mechanics model, inspection criteria’s for monitored bridges can be developed.

References
159
References
Abe, H. (1989). Fatigue Strength of Corroded Steel Plates from Old Railway Bridges. IABSE Symposium, Lisbon, pp 205-210.
Adamson, D. E. & Kulak, G. L. (1995). Fatigue Test of Riveted Bridge Girders.
Structural Engineering Report No. 210. Department of Civil Engineering University of Alberta.
Al-Emrani, Mohammad. (2000). Two Fatigue-related Problems in Riveted
Railway Bridges. Licentiate Thesis. Department of structural Engineering, Steel and Timber Structures, Chalmers University of Technology, Publ. S 00:1, Sweden.
Al-Emrani, Mohammad. (2002). Fatigue in riveted railway bridges. Doctoral
Thesis Department of structural Engineering Steel and Timber Structures, Chalmers University of Technology, Publ. 02:7, Sweden.
Al-Emrani, Mohammad. (2006). Utmattningskritiska brodetaljer i stål, en
sammanställning av skadefall i stålbroar. No. 2006:7. Chalmers University of Technology.
Andersson, Andreas. (2009). Fatigue assessment of railway bridges: A case
study of the steel bridges between Stockholm Central station and Söder Mälarstrand, based on theoretical analysis and field measurements. Structural Design and Bridges, Royal Institute of Technology (KTH), Stockholm Sweden

Fatigue assessment of riveted bridges
160
Azizinamini, A., Bradburn, J. H. & Radziminski, J. B. (1987). Initial stiffness of
semirigid steel beam-to-column connections. Journal of constructional steel research, 8:71-90.
Baker, K. A. & Kulak, G. L. (1985). Fatigue of Riveted Connections. Canadian
Journals of Civil Engineering, Vol. 12, pp 184-191aker et al. Barsom, J. M. & Rolfe, S. T. (1999). Fracture and fatigue control in structures:
Application of fracture mechanics. Third edition. USA. Butterworth-Heinemann.
Bathias, C. (1999). There is no infinite fatigue life in metallic materials. Fatigue
& fracture of engineering materials & structures, 22: 559-565. Bathias, C. & Paris, C. P. (2005). Gigacycle fatigue in mechanical practice.
New York. Marcel Dekker. ISBN 0-8247-2313-9. Bergh.S. (1980). Stål och Svetsning. Fjärde upplagan.Avdelningen för
stålbyggnad, Kungl. Tekniska Högskolan Stockholm Boström, Staffan. (1990). Förspända skruvar i skjuvförband,
förspänningsmetoder och utmattningshållfasthet. 1990:19 L.. Division of steel structures, Luleå University of Technology, Sweden.
Boström, Staffan. (1992). Urtima besiktning stålbalkbroar vägportar.
Borlängen. Swedish Rail Administration. Brühwiler, E., Smith, I. F. C. & Hirt, M. A. (1990). Fatigue and fracture of
riveted bridge members. Journal of Structural Engineering, Vol.116, No. 1 January, 1990. ISSN 0733-9445/90/0001-0198.
BSK 99. (1999). Boverkets handbok om stålkonstruktioner (The Swedish design
code for steel structures). Boverket, Byggavdelningen, Sweden.
BSK 07. (2007). Boverkets handbok om stålkonstruktioner (The Swedish design code for steel structures). Boverket, Byggavdelningen, Sweden.
BVS 583.11. (2005). Bärighetsberäkningar av järnvägsbroar. Swedish Rail
Administration BVS 583.12. (2003). Brottseghet hos konstruktionsstål i järnvägsbroar.
Swedish Rail Administration. Christensen, C. & Hill, R. T. (1986). Applied fracture mechanics for assessing
defect significance in a crude oil pipeline. Case histories involving fatigue and fracture mechanics. ASTM STP 918, C. M. Hudson, and T. P. Rich. Eds., American society for testing and materials. Philadelphia. pp. 125-135.

References
161
Cremona, C., Patron, A., Johansson, B., Larsson, T., Eichler, B. & Höhler, S. (2007). Improved Assessment Methods of Old Steel Railway Bridges. D4.3.6, Background document. Sustainable Bridges.
DiBattista, J. D, Adamson, D. E. J, & Kulak, G. L. (1998). Evaluation of
remaining life for riveted truss bridges. Canadian journal of civil engineering. Vol. 25. pp 678-691.
DiBattista, J. D. & Kulak, G. L. (1995). Fatigue of Riveted Tension Members.
Structural Engineering report No211. University of Alberta Department of Civil Engineering.
EN 1993-1-9. (2003). EN 1993-1-9:2003. Eurocode 3: Design of steel structures
- part 1-9: Fatigue. Enochsson, Ola. (2006). Broar längs Haparandabanan. Mätning och utredning
av dynamisk faktor. Samhällsbyggnad, Luleå University of Technology. ISSN 1402-1536 / ISRN LTU-TR-06/23-SE / NR 2006:23, to be published.
Enochsson, Ola. et al (2007). Dynamic amplification factors for a riveted steel
bridges, Assessment by monitoring of the Keräsjokk Bridge in northern Sweden. In proceeding Sustainable Bridges, assessment for further traffic demands and longer lives. Wroclaw.
Eriksson, K. Fullskaleprov med anvisade bredflänsbalk i böjning. Del I. En
nytillverkad och fyra äldre balkar. (1991). Hållfasthetlära. Luleå Tekniska Högskola.
Eriksson, K. (2006a).Att konstruera med stål, läromedel för konstruktörer,
modul 8 utmattning. Luleå tekniska universitet, Sweden. Eriksson, K. (2006b).Att konstruera med stål, läromedel för konstruktörer,
modul 9 brottmekanik. Luleå tekniska universitet, Sweden. Eriksson, K. (2008). Universitetslektor, Tillämpad fysik, maskin- och
materialteknik, sammanhang, talks concerning material properties of old metals, 2008-12-03.
Fisher, J. W. & Struik, J. H. A. (1974). Guide to design for bolted and riveted
joints. 1. ISBN 0-471-26140-8. Fisher, J., Yen, B. T., & Wang, D. (1987). NCHRP Report 302. Fatigue and
fracture evaluation for rating riveted bridges. Technical report, Transportaition Research Board, National Research Council. Washington D.C.
Fisher, J. W, Yen, B. T, Wang, D. (1990). Fatigue strength of riveted bridge members. Journal of Structural Engineering, Vol. 116, No. 11.

Fatigue assessment of riveted bridges
162
Fisher, J. W., Yen, B, T. & Wang, D.(1990): Fatigue Strength of Riveted Bridges Members. Journal of structural Engineering. Vol. 116, No. 11, pp 2986-2981.
Forsberg, B. (1993). Utmattningshållfasthet hos äldre konstruktionsstål med
korrosionsskador. Master thesis 1993:064E. Division of Steel Structures Luleå University of Technology. ISSN 0349-6023.
Helmerich, R., Brandes, K. and Herter, J. (1997). Full scale Laboratory Fatigue Tests on Riveted Railway Bridges. Evaluation of Existing Steel and Composite Bridges, IABSE Workshop, Lausanne, 191-200. Helmerich, R. (2005). Alte Stähle und Stahlkonstruktionen, Materialuntersuchunungen, Ermüdungsversuche an originalen Brükenträern und Messungen von 1990 bis 2003. Berlin. BAM Bundesanstalt für Materialforschung und -prüfung. Forschungsbericht 271. ISBN 3-86509-362-0 ISSN 0938-5533.
Hertzberg, R. W. (1983). Deformation and fracture mechanics of engineering
materials. Second edition. John Wiley & sons. ISBN 0-471-08609-6. Rich & Dean. (2004). http://ourlives-at-
windandsea.info/mediac/400_0/media/DIR_24201/Narrow-Bridge.jpg. 20090209.
Höhler, S. (2005). Material properties of Metal Railway Bridges. Technical
Report: Draft. Sustainable Bridges. WP4-S-R-001 Draft. Imam, Boulent. (2006). Fatigue Analysis of Riveted Railway Bridges. School of
Engineering. Civil Engineering University of Surrey. Janing, H. (1980). Äldre järn och stål- hållfasthet och tillåtna spänningar.
Stålbyggnadsinstitutet (SBI), Sweden. Publ 68. Kishi, N. Chen, W, F. 1990 Moment-rotation relations of semi rigid connections
with angles. Journal of structural Engineering (ASCE), 116 (7), 1813-1834. Lee, S. S. Moon, T. S. (2002). Moment-rotation model of semi-rigid
connections with angles. Engineering Structures, 24 (2), 227-237. Lemonis, M. and Gantes, C. (2005). An analytical elastic-plastic model for T-
stub steel connections. Proccedings of the 4th European conference on steel and composite structures, Eurosteel 2005, volume C, pages 41-48. Maastricht, The Netherlands.
Lewitt, C. W., Chesson, E. Jr. and Munse, W. H. (1969). Restraint
characteristics of flexible riveted and bolted beam -to-column connections. Engineering experimental station bulletin 500, University of Illinois

References
163
Lothers, J. E. (1951). Elastic resistance equations for semi-rigid connections. Transactionof the ASCE, 116489-494.
Mang, F. & Bucak, Ö. (1993). Application of the S-N line concept for the assessment of the remaining fatigue life of old bridge structures. Bridge Management 2. Inspection, maintenance assessment and repair. ISBN: 0 7277 1926 2.
Out, J. M. M., Fisher, J. W. & Yen, B. T. (1984). Fatigue Strength of Weathered and Deteriorated Riveted Members. Transportation Research Record 950, Vol. 2, pp 10-20.
Paris, P. C. & Erdogan, F. (1963). A critical analysis of crack propagation laws. Journal of Basic Engineering, Vol. 85, pp. 528-534.
prEN 1993-1-8 (2002). Eurocode 3: Design of steel structures – part 1-8: Design
of joints. Rabemanantso, H. & Hirt, M. A. (1984). Comportement a la fatigue de profiles
lamines avec semelles de renfort rivetees. Lusanne : ICOM Report 133, Swiss Federal Institute of Technology, Lusanne, Switserland.
Ramsamooj, D. N. & Shugar, T. A. (2001). Model prediction of fatigue crack
propagation in metal alloys in laboratory air. International journal of fatigue. 23 (2001) S287-S300.
Reemsnyder, H. S. (1975). Fatigue Life Extension of Riveted Connections.
Journal of the Structural Division. Proceedings of the American Society of Civil Engineers, Vol. 101,No. ST12, 1975, pp 2591-2608.
Roeder, C. W. et al. (2001). Fatigue cracking of riveted, coped, stringer.to-
floorbeam connections .Research report, Research project T9903, Task 98 bridge fatigue repair. Washington State Department of Transportation.
Sedlacek, G. et al. (1993). New assessment methods for the residual safety of
old steel bridges. Steel research. 8(9). PP 478-483. Sedlacek, G., & Stötzel, G. (1997). Standardized procedure for the safety
assessment of old riveted steel bridges. Working paper. RWTH Aachen, Germany.
Shen, J., Astaneh, A. (2000). Hysteresis model of bolted-angel connection.
Journal of constructional steel research, 54, 317-343 Stenbacka, Nils. (1980). Äldre konstruktionsstål, en översikt av deras
svetsbarhet.. Vattenfall. Sweden. KI.-nr 37421. T-62. Stötzel, G., & Sedlacek, G. et al. (1997). Material identification and verification
method for the residual safety of old steel bridges. IABSE 1997. Lausanne.

Fatigue assessment of riveted bridges
164
Stötzel, Gero. (1998).Verfahren zur beurteilung der sicherheit bei weiterverwendung alter stahlbrüken. RWTH Aachen, Germany.
Suresh, S. (1991). Fatigue of materials. Cambridge. ISBN 0 52136510 4.
Sustainable Bridges. (2003). Assessment for Future Traffic Demands and
Longer Lives. An Integrated Research Project during 2003-2007 supported by the European Commission in the 6th Framework Program, with 32 partners from 12 countries, Contract No TIP-CT-2003-001653. Many reports and papers are listed on the homepage www.sustainablebridges.net.
Sustainable Bridges. (2007). Guideline for load and resistance assessment of
existing European railway bridges. Work Package 4. SB4.2_Guideline_LRA www.sustainablebridges.net. 2009-01-28.
Tall, L. & Alpsten, G. (1969). On the Scatter in Yield Strength and Residual Stresses In Steel Members. Swedish Institute of Steel Construction.
Terrence, W., Philbrick, Jr. George, Zodo. & Schiff, S. D. (1995). Fatigue of
through plate girder railway bridges. Journal of structural engineering. Vol 121, No 11. ISSN 0733-9945/95/0011-1613-1619.
Wang, Dayi. (1990). Fatigue behaviour of mechanically fastened double angle
shear connections in steel bridges. Dissertation, Lehigh University Bethlem, Pennsylvania.
Wilson, M. W. & Coombe, .J. V. (1939). Fatigue tests of connection angles.
University of Illinois bulletin, engineering experiment station bulletin series. No. 317, Vol. XXXVII.
Wilson, M. W. & Thomas, F. P. (1938). Fatigue tests of riveted joints.
University of Illinois bulletin, engineering experiment station bulletin series. No. 79,. Vol. XXXV.
Wilson, W. M. (1940). Design of connection angles for stringers of railway
bridges. In proceedings of the Forth-First Annual Convention. American Railway Engineering Association, Chicago, Illinois.
Xiulin. et al. (1996). Fatigue performance of old bridge steel and the procedures
for life prediction with given survivability. Engineering Fracture Mechanics, Vol 53, No 2. pp251-262. Elsevier Science.
Zainudin, A. K. (1997). Riveted joints-full-scale Tests. Department of structural
Engineering Steel and Timber Structures, Chalmers University of Technology, Int.skr. S97:7, Göteborg, Sweden.
Zhou et al. (1995). Examination of fatigue strength (Sr-N) curves for riveted
bridge members. 12th International bridge conference, engineer's society of western Pennsylvania. Pittsburgh.

References
165
Åkesson, B. (1994). Fatigue Life of Riveted Railway Bridges. Doctoral Thesis Division of Steel and Timber Structures, Chalmers University of Technology, Publ. S94:6, Göteborg, Sweden.

Fatigue assessment of riveted truss girders


Appendix A
A1
Appendix A The data base
Referred steel grades in, BVS 583.11 (2005), and their material properties are presented. As the part of the data base containing information regarding mechanical and toughness properties of bridges constructed before the 1940’s. Information in the data base was obtained by gathering test protocols from bridges where the material properties had been determined. The available data comes mainly from bridges that where built in Germany and Sweden.

Fatigue assessment of riveted bridges
A2
Steel grades referred to by the Swedish Rail Administration Table A1 Steel grades referred to in BVS 583.11 (2005) the Swedish Rail Administration
SS-steel Thickness [mm]
fy [MPa]
fu [MPa]

Appendix A
A3
Material properties taken from Swedish bridges Table A2 Swedish bridge properties for metals produced before 1901
Bridge Metal year fy (MPa)
fu (Rm) (MPa)
Charpy-V (J)
Test temp (C°)
Jc (N/mm)
Test temp (C°)
Kalixälv 1907 20 -30 Stråkan 1908 246
Keräsjok 1911 8 -30 Edänge 1915 273 Hjuksån 1922 225 10 -30
Mörtbäcken 1923 225 12,3 -30 Husträskbäcken 1923 225
Vindelälven 1923 225 27 -30 Arvån 1923 225 21 -30 Maltån 1923 225 23 -30
Nottjärnsbäcken 1924 225 17,6 -30 Umeå älv öster 1924 225 -30
Umeå älv Lycksele
1924 22 -30
Umeå älv västra 1924 225 22 -30 Rusbäcken 1926 225 17 -30 Tåskbäcken 1927 225 25 -30 Paubäcken 1927 225 31 -30
Umeå älv vid åskilje
1927 225 22 -30
Barseleavan 1929 225 Nyholmsundet 1929 225
Elakbäcken 1929 225 6,3 -30 Rödån
(kvarnsvedjan)
Stee
l
1932 345

Fatigue assessment of riveted bridges
A4
Table A3 Swedish bridge properties for metals produced before 1901 Bridge Metal year fy
(MPa)fu (Rm) (MPa)
Test temp (C°)
Charpy-V (J)
Test temp (C°)
Jc (N/mm)
Test temp (C°)
Vindelälven (Vännäs)
1896 311 464
Vindelälven (Vännäs)
1896 322 472
Vindelälven (Vännäs)
1896 377 458
Vindelälven (Vännäs)
1896 328 425
Vindelälven (Vännäs)
1896 373 509
Vindelälven (Vännäs)
1896 353 509
Vindelälven (Vännäs)
1896 324 454
Vindelälven (Vännäs)
1896 376 442
Vindelälven (Vännäs)
1896 279,1 438,9
Vindelälven (Vännäs)
1896 290,5 490,8
Vindelälven (Vännäs)
1896 266,6 422
Vindelälven (Vännäs)
1896 296,3 481,2
Vindelälven (Vännäs)
1896 266,1 421,1
Vindelälven (Vännäs)
1896 280,4 476,3
Vindelälven (Vännäs)
1896 284,6 441,1
Vindelälven (Vännäs)
1896 273,6 464,6
Vindelälven (Vännäs)
1896 274,2 443,3
Vindelälven (Vännäs)
1896 302,7 492,1
Vindelälven (Vännäs)
1896 260,6 424,5
Vindelälven (Vännäs)
1896 276,6 479,8
Vindelälven (Vännäs)
Stee
l
1896 250,4 382,4

Appendix A
A5
Table A4 Swedish bridge properties for metals produced before 1901 Brdge Metal year fy
(MPa)fu (Rm) (MPa)
Test temp (C°)
Charpy-V (J)
Test temp (C°)
Jc (N/mm)
Test temp (C°)
Vindelälven (Vännäs)
1896 276,6 450,6
Vindelälven (Vännäs)
1896 274 417,2
Vindelälven (Vännäs)
1896 277,2 487
Vindelälven (Vännäs)
1896 281,6 434,1
Vindelälven (Vännäs)
1896 289,3 492,7
Vindelälven (Vännäs)
1896 281,8 431
Vindelälven (Vännäs)
1896 281,5 470,4
Vindelälven (Vännäs)
1896 270,4 419,3
Vindelälven (Vännäs)
1896 287,9 481,3
Vindelälven (Vännäs)
1896 279,4 430,8
Vindelälven (Vännäs)
Stee
l
1896 277,6 450,4
Table A5 Swedish bridge properties for metals in the interval 1901-1919
Bridge Metal year fy (MPa)
fu (Rm) (MPa)
Test temp (C°)
Charpy-V (J)
Test temp (C°)
Jc (N/mm)
Test temp (C°)
Bjurån 1910 270 395 15,8 -30 Bjurån 1910 273 425 17,7 -30 Bjurån 1910 240 380 20,1 -30 Bjurån 1910 252 401 29,6 -30
Skellefteå älv 1911 266 382 11 -30 Skellefteå älv 1911 270 447 14,3 -30 Skellefteå älv 1911 258 384 17,8 -30 Skellefteå älv 1911 264 396 20,7 -30
Forsmo 1912 264 415 Forsmo 1912 295 439 Forsmo 1912 268 418 Forsmo 1912 369 485 Forsmo 1912 267 445 Forsmo 1912 282 437 Forsmo 1912 280 442 Forsmo 1912 297 468 Forsmo
Stee
l
1912 315 485

Fatigue assessment of riveted bridges
A6
Table A6 Swedish bridge properties for metals in the period 1901-1919
Bridges Metal year fy (MPa)
fu (Rm) (MPa)
Test temp (C°)
Charpy-V (J)
Test temp (C°)
Jc (N/mm)
Test temp (C°)
Forsmo 1912 53 -1 Forsmo 1912 5,5 -20 Forsmo 1912 45 22 Forsmo 1912 29 -2 Forsmo 1912 43,5 23 Forsmo 1912 5 -32 Forsmo 1912 2,5 -70 Forsmo 1912 5 -22 Forsmo 1912 3,8 -38 Forsmo 1912 3,3 -37 Forsmo 1912 49 44 Forsmo 1912 67 22 Forsmo 1912 24 -19 Forsmo 1912 2,3 -50 Forsmo 1912 23 -2 Forsmo 1912 53 22 Forsmo 1912 Forsmo 1912 Forsmo 1912 Forsmo 1912 247 Forsmo 1912 266,8 Forsmo 1912 261,4 Forsmo 1912 266,8 Forsmo 1912 250 Forsmo 1912 270 Forsmo 1912 274,4 Forsmo 1912 231 Forsmo 1912 250 Forsmo 1912 275,6 Forsmo 1912 299,4 Forsmo 1912 264,1 Forsmo 1912 273,5 Forsmo 1912 294,6 Forsmo 1912 270 Forsmo 1912 281,6 Forsmo 1912 301,8 Forsmo 1912 273,3
Gideälvsbron (Björna)
1913 (433) (465,6)
Gideälvsbron (Björna)
1913 (385,8) (428)
Gideälvsbron (Björna)
Stee
l
1913 268,7 398,4

Appendix A
A7
Table A7 Swedish bridge properties for metals in the period 1901-1919 Bridge Metal Year fy
(MPa) fu (Rm) (MPa)
Test temp (C°)
Charpy-V (J)
Test temp (C°)
Jc (N/mm)
Test temp (C°)
Gideälvsbron (Björna)
1913 338,7 410,8
Gideälvsbron (Björna)
1913 265,5 376,9
Gideälvsbron (Björna)
1913 280,8 383,2
Gideälvsbron (Björna)
1913 247,4 389,7
Gideälvsbron (Björna)
1913 (410,4) (413,9)
Gideälvsbron (Björna)
1913 299,9 435,4
Testeboån 1913 273 420 Testeboån 1913 257 425 Testeboån 1913 255 400 Testeboån 1913 257 400
Sikfors 1914 288 433 55,7 -30 Sikfors 1914 279 419 51,7 -30 Sikfors 1914 299 439 64,5 -30 Sikfors 1914 311 442 61,3 -30 Sikfors 1914 308 433 121,5 -30 Sikfors 1914 297 431
Dingelsundsådran 1914 29 -30 Dingelsundsådran 1914 24 -30 Dingelsundsådran 1914 41 -30 Dingelsundsådran 1914 70 -30 Dingelsundsådran 1914 40 -30 Dingelsundsådran 1914 27 -30 Dingelsundsådran 1914 302 443 Dingelsundsådran 1914 303 456 Dingelsundsådran 1914 256 387 Dingelsundsådran 1914 281 383 Dingelsundsådran 1914 330 427 Dingelsundsådran 1914 338 448 Dingelsundsådran 1914 253 417 Dingelsundsådran 1914 227 359 Dingelsundsådran 1914 307 414 Dingelsundsådran 1914 Dingelsundsådran 1914 Dingelsundsådran 1914
Landafors 1915 275 428 20 Landafors 1915 258 422 20 Landafors 1915 270 417 20 Landafors
Stee
l
1915 290 454 20

Fatigue assessment of riveted bridges
A8
Table A8 Swedish bridge properties for metal in the period 1901-1919 Bridge Metal year fy
(MPa) fu
(Rm) (MPa)
Test temp (C°)
Charpy-V (J)
Test temp (C°)
Jc (N/mm)
Test temp (C°)
Landafors 1915 277,4 -30 Landafors 1915 288 440 20 Landafors 1915 271 427 20 Landafors 1915 292 457 20 Landafors 1915 258 416 20 Landafors 1915 271 408 20 Landafors 1915 16,1 -30 Landafors 1915 634,4 -30 Landafors 1915 14 -30 Landafors 1915 10,5 -30
Östfors-Faluån 1917 280 366 Östfors-Faluån 1917 304 477 Östfors-Faluån 1917 263 399 Östfors-Faluån 1917 45 -30 Östfors-Faluån 1917 10,7 -30 Östfors-Faluån 1917 325 -30 Östfors-Faluån 1917 Östfors-Faluån 1917 Östfors-Faluån 1917 Östfors-Faluån 1917 282 430 Östfors-Faluån 1917 243 405 Östfors-Faluån 1917 253 449 Bergsgårdsån 1917 292 425 Bergsgårdsån 1917 267 402 Bergsgårdsån 1917 261 405 Bergsgårdsån 1917 36,5 -30 Bergsgårdsån 1917 30,1 -30 Bergsgårdsån 1917 56 -30 Bergsgårdsån 1917 245 371 Bergsgårdsån 1917 311 483 Bergsgårdsån 1917 250 440 Bergsgårdsån 1917 Bergsgårdsån 1917 Bergsgårdsån 1917 Bergsgårdsån 1917
Banforsån 1919 306 452 10,6 -30 Banforsån 1919 315 487 28,2 -30 Banforsån 1919 335 522 31,3 -30
Torneå älv/Torne älv
Stee
l
1919 300 20 -27

Appendix A
A9
Table A9 Swedish bridge properties for metal in the period 1919-1940 Bridge Metal year fy
(MPa) fu (Rm) (MPa)
Test temp (C°)
Charpy-V (J)
Test temp (C°)
Jc (N/mm)
Test temp (C°)
Nissan 1920 Nissan 1920 Nissan 1920 Nissan 1920 Nissan 1920
Lagan/Knäred 1920 345 433 Lagan/Knäred 1920 305 436 Lagan/Knäred 1920 320 433 Lagan/Knäred 1920 309 418 Lagan/Knäred 1920 327 435 Lagan/Knäred 1920 309 438 Lagan/Knäred 1920 386 -30 Lagan/Knäred 1920 407 -30 Lagan/Knäred 1920 447 -30 Lagan/Knäred 1920 432 -30 Lagan/Knäred 1920 373 -30 Lagan/Knäred 1920 398 -30
Segeå 1920 282 433 Segeå 1920 271 415 Segeå 1920 276 436 Segeå 1920 269 416 Segeå 1920 280 433 Segeå 1920 280 418 Segeå 1920 519 -30 Segeå 1920 550 -30 Segeå 1920 233 -30 Segeå 1920 534 -30 Segeå 1920 219 -30 Segeå 1920 350 -30 Mora 1921 271 452 Mora 1921 286 450 Mora 1921 270 415 Mora 1921 264 426 Mora 1921 265 430 Mora 1921 275 436 Mora 1921 270 417 Mora 1921 276 418 Mora 1921 273 452 Mora 1921 302 442 Mora 1921 300 442 Mora 1921 305 447 Mora 1921 273 416 Mora 1921 270 419 Mora
Stee
l
1921 268 414

Fatigue assessment of riveted bridges
A10
Table A10 Swedish bridge properties for metal in the period 1919-1940 Bridge Metal year fy
(MPa) fu (Rm) (MPa)
Test temp (C°)
Charpy-V (J)
Test temp (C°)
Jc (N/mm)
Test temp (C°)
Mora 1921 279 430 Mora 1921 276 427 Mora 1921 389 -20 Mora 1921 473 -20 Mora 1921 124 -20 Mora 1921 111 -20 Mora 1921 23 -20 Mora 1921 483 -20 Mora 1921 433 -20 Mora 1921 469 -20 Mora 1921 70 -20 Mora 1921 57 -20 Mora 1921 40 -20 Mora 1921 66 -20 Mora 1921 83 -20 Mora 1921 80 -20 Mora 1921 18 -20 Mora 1921 41 -20 Mora 1921 65 -20 Mora 1921 468 -20 Mora 1921 490 -20 Mora 1921 470 -20 Mora 1921 491 -20 Mora 1921 460 -20 Mora 1921 395 -20 Mora 1921 366 -20 Mora 1921 87 -20 Mora 1921 361 -20 Mora 1921 98 -20 Mora 1921 430 -20 Mora 1921 94 -20 Mora 1921 21 -20 Mora 1921 20 -20 Mora 1921 18 -20 Mora 1921 445 -20 Mora 1921 341 -20 Mora 1921 401 -20 Mora 1921 287 -20 Mora 1921 349 -20 Mora 1921 468 -20 Mora 1921 470 -20 Mora 1921 490 -20 Mora 1921 395 -20 Mora
Stee
l
1921 460 -20

Appendix A
A11
Table A11 Swedish bridge properties for metal in the period 1919-1940 Bridge Metal year fy
(MPa) fu (Rm) (MPa)
Test temp (C°)
Charpy-V (J)
Test temp (C°)
Jc (N/mm)
Test temp (C°)
Mora 1921 361 -20 Mora 1921 491 -20 Mora 1921 87 -20 Mora 1921 366 -20 Mora 1921 94 -20 Mora 1921 98 -20 Mora 1921 430 -20 Mora 1921 18 -20 Mora 1921 20 -20 Mora 1921 21 -20 Mora 1921 341 -20 Mora 1921 401 -20 Mora 1921 445 -20 Mora 1921 287 -20 Mora 1921 349 -20 Mora 1921 276 389 -20 Mora 1921 276 473 -20 Mora 1921 268 23 -20 Mora 1921 268 111 -20 Mora 1921 268 124 -20 Mora 1921 273 433 -20 Mora 1921 273 469 -20 Mora 1921 273 483 -20 Mora 1921 302 40 -20 Mora 1921 302 57 -20 Mora 1921 302 70 -20 Mora 1921 270 66 -20 Mora 1921 270 80 -20 Mora 1921 270 83 -20 Mora 1921 278 18 -20 Mora 1921 278 41 -20 Mora 1921 278 65 -20 Mora 1921 234 Mora 1921 13 -20 Mora 1921 27 -20 Mora 1921 280 Mora 1921 4 -20 Mora 1921 281 Mora 1921 336 Mora 1921 330 Mora 1921 11 -20 Mora 1921 68 -20 Mora
Stee
l
1921 277

Fatigue assessment of riveted bridges
A12
Table A12 Swedish bridge properties for metal in the period 1919-1940 Bridge Metal year fy
(MPa) fu (Rm) (MPa)
Test temp (C°)
Charpy-V (J)
Test temp (C°)
Jc (N/mm)
Test temp (C°)
Mora 1921 51 -20 Mora 1921 258 Mora 1921 31 -20 Mora 1921 265 Mora 1921 299 Mora 1921 287 Mora 1921 5 -20
Vindelälven (Stora spannet)
1923
Vindelälven (Lilla spannet)
1923
Umeå älv, öst (Stora spannet)
1924
Umeå älv, öst (Lilla spannet)
1924
Umeå älv, kanal (Stora spannet)
1924
Umeå älv, kanal (Lilla spannet)
1924
Umeå älv, väst (Stora spannet)
1924
Umeå älv, väst (Lilla spannet)
1924
Bergforsen 1924 322 469 54 -30 Bergforsen 1924 368 522 Bergforsen 1924 308 474 Bergforsen 1924 331 498 Bergforsen 1924 327 510 Bergforsen 1924 331 470 Bergforsen 1924 282 469 29 -30 Bergforsen 1924 356 506 70 -30 Bergforsen 1924 376 517 Bergforsen 1924 320 436 52 -30 Bergforsen 1924 329 488 Erikslund 1924 219 289 Erikslund 1924 218 295 Erikslund 1924 306 432 Erikslund 1924 304 437 Erikslund 1924 501 -30 Erikslund 1924 532 -30 Erikslund 1924 327 -30 Erikslund 1924 45 -30 Erikslund 1924 127 -30 Erikslund
Stee
l
1924 112 -30

Appendix A
A13
Table A13 Swedish bridge properties for metal in the period 1919-1940 Bridge Metal year fy
(MPa) fu (Rm) (MPa)
Test temp (C°)
Charpy-V (J)
Test temp (C°)
Jc (N/mm)
Test temp (C°)
Kyrkviken 1925 12,7 -30 Myskjeån 1925 335 437 20 Kyrkviken 1925 314 411 20 Kyrkviken 1925 315 412 20 Kyrkviken 1925 323 423 20 Kyrkviken 1925 11,1 -30 Kyrkviken 1925 16,5 -30 Kyrkviken 1925 614,2 -30 Kyrkviken 1925 17,1 -30
Myskjeån 1925 366 503 20 Myskjeån 1925 363 523 20 Myskjeån 1925 16,1 -30 Myskjeån 1925 14,7 -30 Myskjeån 1925 22,9 -30 Myskjeån 1925 6,1 -30
Gimån 1925 Gimån 1925 Ålsån 1926 337 36,4 -30 Ålsån 1926 337 39 -30 Ålsån 1926 47,1 -30
Tåskbäcken (Över) 1927 Tåskbäcken
(Under) 1927
Krokom 1927 245 375 Krokom 1927 295 418 Krokom 1927 332 -30 Krokom 1927 197 -30 Krokom 1927 469 -30 Krokom 1927 343 -30 Krokom 1927 603 -30 Krokom 1927 717 -30 Krokom 1927 783 -30 Krokom 1927 776 -30
Kilörsundet 1928 30,7 -30 Kilörsundet
Stee
l
1928 28 -30

Fatigue assessment of riveted bridges
A14
Table A14 Swedish bridge properties for metal in the period 1919-1940 Bridge Metal year fy
(MPa) fu (Rm) (MPa)
Test temp (C°)
Charpy-V (J)
Test temp (C°)
Jc (N/mm)
Test temp (C°)
Långträskån 1934 301 477,5 17,6 -30 Långträskån 1934 305 478 31,4 -30 Långträskån 1934 297 477 11,3 -30
Önnerupsbäcken 1936 390 -30 Parteboda 1930 245 320 Parteboda 1930 227 313 Parteboda 1930 362 Parteboda 1930 304 415 Parteboda 1930 54 -30 Parteboda 1930 74 -30 Parteboda 1930 21 -30 Parteboda 1930 30 -30 Parteboda 1930 92 -30 Parteboda 1930 45 -30
Skidträskån 1934 16,8 -30 Skidträskån 1934 35,3 -30
Önnerupsbäcken 1936 436 -30 Önnerupsbäcken 1936 329 -30 Önnerupsbäcken 1936 87,6 -30 Önnerupsbäcken 1936 104 -30 Önnerupsbäcken 1936 84 -30 Önnerupsbäcken 1936 Önnerupsbäcken 1936 Önnerupsbäcken 1936 Önnerupsbäcken 1936 Önnerupsbäcken 1936 Önnerupsbäcken 1936 Korsträskbäcken 1938 28,5 Korsträskbäcken 1938 32,4 Korsträskbäcken 1938 33
Nodre älv 1938 359 650 Nodre älv 1938 348 687 Nodre älv 1938 655 749 Nodre älv 1938 794 917 Nodre älv 1938 530 640 Nodre älv 1938 -20 190 Nodre älv 1938 -20 191 Nodre älv 1938 -20 181 Nodre älv 1938 353 507 Nodre älv 1938 347 498 Nodre älv 1938 -20 102 Nodre älv 1938 -20 116 Nodre älv
Stee
l
1938 -20 122

Appendix A
A15
Table A15 Swedish bridge properties for metal in the period 1919-1940 Bridge Metal year fy
(MPa) fu
(Rm) (MPa)
Test temp (C°)
Charpy-V (J)
Test temp (C°)
Jc (N/mm)
Test temp (C°)
Nodre älv 1938 -20 224 Nodre älv 1938 -20 210 Nodre älv 1938 -20 203
Södra Kannickeån 1939 390 -30 Södra Kannickeån 1939 436 -30 Södra Kannickeån 1939 329 -30 Södra Kannickeån 1939 87,6 -30 Södra Kannickeån 1939 104 -30 Södra Kannickeån 1939 84 -30 Södra Kannickeån 1939 Södra Kannickeån 1939 Södra Kannickeån 1939 Södra Kannickeån 1939 Södra Kannickeån 1939 Södra Kannickeån
Stee
l 1939

Fatigue assessment of riveted bridges
A16
Material properties taken from German bridges Table A16 German bridge properties for metals produced in the beginning of 20th century
ID-Nr. Metal year fy (MPa)
fu (Rm) (MPa)
Test temp (C°)
Charpy-V (J)
Test temp (C°)
Jc (N/mm)
Test temp (C°)
1 269 351 -30 21 0 2 19 0 142 -30 3 259 353 -30 58 -30 4 276 373 -30 14 0 26 -30 5 270 307 -30 19 0 24 -30 6 267 373 -30 16 0 32 -30 7 8 288 308 -30 5 -30 34 -30 9 243 332 0 17 0 33 0 10 318 324 -30 5 -30 10 -30 11 267 303 -30 8 -30 12 9,5 0 11 0 13 277 289 -30 8 -30 21 -30 14 240 304 0 9,5 0 10 0 15 296 328 -30 4 -30 13 -30 16 299 336 0 11,5 0 25 0 17 301 338 -30 10,5 -30 17 -30 18 252 252 0 7 0 13 0 19 216 336 0 20 267 373 0 21 227 343 0 22 224 289 0 23 278 392 0 24 260 381 0 25 244 364 0 26 302 389 0 27 256 274 -30 5 -30 22 -30 28 308 348 -30 4,5 -30 10 -30 29
pudd
le st
eel
~190
0
218 342 0 8 0 223 0 30 278 453 0 27 0 31 345 456 0 8 0 32 323 490 -30 6 -30 33 354 523 -30 5 -30 34 286 406 -30 32 -30 35 306 467 0 42 0 36 329 454 -30 4 -30 37 265 393 0 6 0 38 297 441 -30 4 -30 21 -30 39 240 389 0 6 0 0 40 400 541 -30 4 -30 16 -30 41
mild
stee
l
~190
0
323 442 0 10 0 28 0

Appendix A
A17
Table A17 German bridge properties for metals produced in the beginning of 20th century ID-Nr. Metal year fy
(MPa)fu (Rm) (MPa)
Test temp (C°)
Charpy-V (J)
Test temp (C°)
Jc (N/mm)
Test temp (C°)
42 336 449 -30 4 -30 43 295 395 -30 8 -30 44 320 446 0 5 0 45 379 496 -30 6 -30 16 -30 46 297 485 0 22 0 71 0 47 267 415 0 6 0 29 0 48 316 413 -30 5 -30 49 251 402 0 4 0 50 289 435 -30 4 -30 28 -30 51 -30 8 -30 52 263 388 -30 7 -30 113 -30 53 309 451 0 4 0 12 0 54 326 517 -30 7 -30 55 328 440 0 22 0 56 302 424 -30 4 -30 34 -30 57 256 385 0 6 0 58 320 439 0 7 0 59 329 420 -30 10 -30 60 306 426 -30 9 -30 61 0 56 0 62 294 456 -30 7 -30 63 346 467 0 34 0 64 313 491 0 20 0 65 320 460 0 5,5 0 66 362 513 -30 2 -30 14 -30 67 300 427 0 4,5 0 68 357 499 -30 2,5 -30 29 -30 69 309 430 0 3,5 0 20 0 70 335 433 -30 3,5 -30 71 311 399 0 5,5 0 72 328 444 0 39,5 0 73 327 431 -30 6 -30 74 305 419 0 51,5 0 75 348 462 -30 2,50 -30 76 318 450 0 4 0 77 297 415 -30 3 -30 78 330 447 0 3 0 79 309 414 -30 3 -30 80 276 396 0 5 0 81 282 409 -30 4,5 -30 82 313 414 0 10,5 0 83 309 415 -30 3 -30 84 279 422 -30 4 -30 85 -30 85
mild
stee
l
~190
0
314 405 0 54 0

Fatigue assessment of riveted bridges
A18
Table A18 German bridge properties for metals produced in the beginning of 20th century ID-Nr. Metal year fy
(MPa)fu (Rm) (MPa)
Test temp (C°)
Charpy-V (J)
Test temp (C°)
Jc (N/mm)
Test temp (C°)
86 329 436 -30 6,5 -30 87 312 437 0 4,5 0 88 308 399 0 5,5 0 89 300 416 -30 4 -30 90 292 378 0 11 0 91 288 425 -30 6 -30 92 262 397 0 6 0 93 368 485 -30 3 -30 33 -30 94 266 412 0 7 0 95 353 470 -30 3 -30 51 -30 96 306 430 0 97 293 397 0 98 42 -30 99 319 445 0
100 292 410 0 101 331 490 0 102 285 390 0 103 7 -30 104 291 405 0 105 287 407 0 106 347 452 0 107 285 419 0 108 83 -30 109 278 405 0 110 320 421 0 111 297 408 0 112 285 390 0 113 290 414 0 114 250 387 0 115 61 -30 116 337 481 0 117 361 453 0 118 19 -30 119 83 -30 120 297 453 0 121 257 393 0 122 262 392 0 123 343 416 0 124 289 393 0 125 34 -30 126 283 459 0 127 81 -30 128
mild
stee
l
~190
0
321 456 0

Appendix A
A19
Table A19 German bridge properties for metals produced in the beginning of 20th centuryj ID-Nr. Metal year fy
(MPa)fu (Rm) (MPa)
Test temp (C°)
Charpy-V (J)
Test temp (C°)
Jc (N/mm)
Test temp (C°)
129 46 -30 130 326 453 0 146 290 446 0 81 0 147 291 376 -30 8 -30 148 271 461 0 5 0 27 0 149 240 392 -30 8 -30 150 0 4 0 151 238 397 -30 4 -30 152 250 403 0 13 0 153 277 455 -30 3 -30 10 -30 154 420 553 -30 17,5 -30 155 278 453 0 8,5 0 156 295 427 0 67 0 157 308 495 0 37 0 158 306 407 -30 5 -30 159 359 484 0 6 0 160 315 426 -30 5,5 -30 161 224 359 0 5 0 162 299 416 -30 5 -30 163 338 528 -30 164 326 483 -30 165 341 536 -30 166 321 532 -30 167 330 510 -30 168 288 417 0 169 344 493 -30 170 291 439 0 171 280 457 -30 172 351 486 0 173 364 500 -30 174 275 425 0 175 282 451 -30 176 360 469 0 177 313 420 -30 178 351 452 0 179 331 449 -30 180 333 442 0 181 359 453 -30 182 320 451 0 183 295 443 -30 184 320 398 0 185 342 439 -30 186
mild
stee
l
~190
0
276 429 0

Fatigue assessment of riveted bridges
A20
Table A20 German bridge properties for metals produced in the beginning of 20th century ID-Nr. Metal year fy
(MPa)fu (Rm) (MPa)
Test temp (C°)
Charpy-V (J)
Test temp (C°)
Jc (N/mm)
Test temp (C°)
187 292 442 -30 188 279 406 0 189 300 433 -30 190 261 409 0 191 287 413 -30 192 256 421 0 193 253 408 -30 194 253 405 0 195 262 399 -30 196 342 462 -30 10 -30 197 285 431 -30 4 -30 198 283 429 -30 5 -30 199 347 475 -30 10 -30 200 331 482 -30 8 -30 201 298 466 -30 10 -30 108 -30 202 302 470 -30 6 -30 71 -30 203 349 509 -30 6 -30 204 299 439 -30 4 -30 70 -30 205 296 430 -30 3 -30 7 -30 206 320 467 -30 3 -30 29 -30 207 291 413 -30 3 -30 208 294 434 -30 3 -30 68,35 -30 209 294 407 -30 4 -30 210 293 439 -30 4 -30 211 271 387 -30 6 -30 212 283 415 -30 5 -30 213 302 453 -30 5 -30 93 -30 214 311 433 -30 215 302 407 -30 216 256 381 -30 14 -30 217 314 463 -30 49 -30 218 308 434 -30 219 258 415 -30 220 287 442 -30 18 -30 221 317 436 -30 222 323 429 -30 223 308 436 -30 224 273 415 -30 225 277 392 -30 226 296 426 -30 227 345 433 -30 228 262 392 0 229
mild
stee
l
~190
0
282 378 0

Appendix A
A21
Table A21 German bridge properties for metals produced in the beginning of 20th century ID-Nr. Metal year fy
(MPa)fu (Rm) (MPa)
Test temp (C°)
Charpy-V (J)
Test temp (C°)
Jc (N/mm)
Test temp (C°)
230 281 423 0 231 288 449 0 7 0 146 0 232 333 495 -30 3 -30 22 -30 233 261 417 0 6 0 234 304 457 -30 4 -30 136 -30 235 310 420 0 7 0 236 323 476 -30 4 -30 50 -30 237 355 460 0 5 0 238 320 485 -30 4 -30 15 -30 239 302 442 0 4 0 48,00 0 240 284 429 -30 4 -30 30 -30 241 341 481 0 8 0 242 321 451 -30 4 -30 243 317 433 0 46 0 244 332 470 -30 5 -30 88 -30 245 304 428 0 10 0 246 305 420 -30 5 -30 247 296 402 0 248 309 447 -30 12 -30 249 268 409 0 24 0 250 251 396 -30 9 -30 251 251 393 0 40 0 252 343 459 -30 4 -30 253 0 28 0 254 331 424 -30 4 -30 101 -30 255 339 422 0 10 0 256 351 427 -30 4 -30 96 -30 257 306 425 0 5 0 96 0 258 290 485 -30 6 -30 259 227 390 0 17 0 260 351 421 -30 3 -30 26 -30 261 334 480 0 4 0 42 0 262 338 463 -30 4 -30 33 -30 263 301 427 0 13 0 33 0 264 334 457 -30 4 -30 88 -30 265 299 404 0 13 0 266 329 395 -30 6 -30 267 283 366 0 22 0 268 314 379 -30 6 -30 269
Mild
stee
l
~190
0
333 424 0

Fatigue assessment of riveted bridges
A22
Table A22 German bridge properties for metals produced in the beginning of 20th century ID-Nr. Metal year fy
(MPa)fu (Rm) (MPa)
Test temp (C°)
Charpy-V (J)
Test temp (C°)
Jc (N/mm)
Test temp (C°)
270 330 459 -30 5 -30 271 286 414 0 18 0 72 0 272 393 550 -30 3 -30 10 -30 273 310 440 0 16 0 274 375 533 -30 4 -30 111 -30 275 0 4 0 32 0 276 331 465 -30 2 -30 59 -30 277 313 449 0 4 0 7 0 278 339 498 -30 5 -30 67 -30 279 283 406 0 6 0 280 319 475 -30 10 -30 281 337 489 0 6 0 282 419 556 -30 3 -30 25 -30 283 308 462 0 284 293 416 -30 4 -30 -30 285 294 453 0 286 376 507 -30 4 -30 14 -30 287 251 304 0 16 0 288 392 484 -30 4 -30 289 329 512 0 4 0 38 0 290 302 463 -30 3 -30 82 -30 291 340 443 -30 22 0 57 -30 292 304 436 0 28 0 293 323 532 0 35 0 294 308 402 0 24 0 295 292 433 0 13 0 296 266 410 0 15 0 297 264 403 0 34 0 298 348 480 0 70 0 299 291 313 0 26 0 300 0 8 0 58 0 301 259 393 0 25 0 302 322 425 0 20 0 303 260 412 0 10 0 304 276 393 0 6 0 305 321 447 0 40 0 306 274 392 0 10 0 307 318 415 0 92 0 308 286 436 0 7 0 309 311 450 0 7 0 310 -30 2 -30 311 -30 4 -30 312
mild
stee
l
~190
0
-30 2 -30 7 -30

Appendix A
A23
Table A23 German bridge properties for metals produced in the beginning of 20th century ID-Nr. Metal year fy
(MPa)fu (Rm) (MPa)
Test temp (C°)
Charpy-V (J)
Test temp (C°)
Jc (N/mm)
Test temp (C°)
313 -30 2 -30 314 -30 2 -30 315 -30 2 -30 316 -30 2 -30 317 -30 2 -30 318 -30 2 -30 319 -30 14 -30 320 -30 2 -30 7 -30 321 -30 2 -30 30 -30 322 -30 3 -30 323 -30 2 -30 11 -30 324 -30 2 -30 62 -30 325 -30 6 -30 326 -30 5 -30 327 -30 29 -30 328 356 501 -30 10 0 12 -30 329 328 442 -30 30 0 330 298 439 -30 25 0 38 -30 331 348 489 -30 24 0 12 -30 332 314 460 -30 14 0 24 -30 333 299 464 -30 6 -30 334 268 459 -30 6 -30 335 248 432 -30 4 -30 84 -30 336 245 427 -30 4 -30 128 -30 337 304 458 -30 34 -30 338 323 484 -30 79 -30 339 333 513 -30 340 262 447 -30 75 -30 341 241 439 -30 48 -30 342 291 455 -30 343 351 497 -30 344 299 447 -30 345 309 476 -30 346 275 523 -30 43 -30 347 256 463 -30 59 -30 348 267 480 -30 4 -30 118 -30 349 345 590 -30 7 -30 38 -30 350 258 421 -30 4 -30 120 -30 351 250 417 -30 5 -30 100 -30 352 293 482 -30 353 294 472 -30 354 240 453 -30 78 -30 355 254 460 -30 81 -30 356
mild
stee
l
~190
0
330 442 -30

Fatigue assessment of riveted bridges
A24
Table A24 German bridge properties for metals produced in the beginning of 20th century ID-Nr. Metal year fy
(MPa)fu (Rm) (MPa)
Test temp (C°)
Charpy-V (J)
Test temp (C°)
Jc (N/mm)
Test temp (C°)
357 340 451 -30 358 268 491 -30 32 -30 359 253 473 -30 41 -30 360 352 508 -30 14 -30 361 301 438 -30 362 361 506 -30 363 381 483 -30 364 289 387 -30 29 -30 365 267 421 -30 4 -30 74 -30 368 319 441 -30 369 303 398 0 370 302 420 -30 371 318 458 0 24 372 246 405 -30 373 238 435 0 374 266 445 -30 375 250 433 0 376 284 408 -30 45 -30 377 299 440 0 378 287 436 -30 379 253 423 0 380 308 451 -30 31 -30 381 303 415 0 382 317 382 -30 384 245 424 -30 106 -30 385 245 456 0 77 386 313 419 -30 387 283 393 0 389 270 382 -30 110 -30 390 249 396 -30 95 -30 391 274 424 -30 392 297 441 0 393 263 442 -30 88 -30 394 263 429 -30 395 296 416 0 396 308 438 -30 397 271 409 0 398 297 438 -30 399 336 430 0 400 320 466 -30 99 -30 401 309 449 -30 35 -30 402
mild
stee
l
~190
0
263 421 -30

Appendix A
A25
Table A25 German bridge properties for metals produced in the beginning of 20th century ID-Nr. Metal year fy
(MPa)fu (Rm) (MPa)
Test temp (C°)
Charpy-V (J)
Test temp (C°)
Jc (N/mm)
Test temp (C°)
403 272 417 0 404 289 402 0 405 342 476 -30 406 277 403 0 407 306 433 -30 408 308 416 0 409 295 435 -30 63 -30 410 277 403 0 411 296 452 -30 31 -30 412 242 393 0 413 350 535 -30 10 -30 414 260 409 0 415 280 412 -30 416 280 390 0 417 316 436 -30 418 283 393 0 419 290 430 -30 420 311 410 0 421 326 452 -30 422 290 417 0 423 290 394 -30 424 274 376 0 425 272 436 -30 426 280 406 0 427 370 450 -30 428 268 396 -30 429 234 390 0 430 299 406 -30 431 250 416 0 432 257 411 -30 433 294 400 0 434 340 447 -30 435 303 450 0 436 308 457 -30 28 -30 437 297 436 0 438 275 438 -30 439 289 410 0 440 276 409 0 441 335 493 -30 442 272 392 0 443 264 406 0 444 445 288 419 -30 446
mild
stee
l
~190
0
281 409 0

Fatigue assessment of riveted bridges
A26
Table A26 German bridge properties for metals produced in the beginning of 20th century ID-Nr. Metal year fy
(MPa)fu (Rm) (MPa)
Test temp (C°)
Charpy-V (J)
Test temp (C°)
Jc (N/mm)
Test temp (C°)
447 293 444 -30 448 291 443 0 449 332 517 -30 450 286 444 0 451 376 523 -30 452 318 460 0 453 361 513 -30 454 258 402 0 455 332 454 -30 456 264 408 0 26 0 457 302 429 -30 8 -30 458 262 396 0 50 0 459 296 396 -30 10 -30 460 235 381 0 17 0 461 301 397 -30 7 -30 462 337 407 0 7 0 463 306 425 -30 4 -30 464 240 388 0 23 0 465 375 475 -30 4 -30 466 281 444 0 17 0 467 376 477 -30 5 -30 468 317 426 0 54 0 469 306 450 -30 5 -30 60 -30 470 313 462 0 14 0 75 0 471 255 399 -30 6 -30 472 307 430 0 30 0 473 289 428 -30 8 -30 474 277 430 0 16 0 475 353 463 -30 3 -30 33 -30 476 309 382 0 11 0 477 321 424 -30 3 -30 478 277 419 0 37 0 479 328 407 -30 4 -30 480 294 453 0 14 0 481 295 482 -30 8 -30 482 311 414 0 13 0 483 329 420 -30 8 -30 484 261 441 0 15 0 485 331 443 -30 7 -30 486 277 403 -30 487 297 448 0 36 0 488 336 470 -30 15 -30 489
mild
stee
l
~190
0
313 443 0 30 0

Appendix A
A27
Table A27 German bridge properties for metals produced in the beginning of 20th century ID-Nr. Metal year fy
(MPa)fu (Rm) (MPa)
Test temp (C°)
Charpy-V (J)
Test temp (C°)
Jc (N/mm)
Test temp (C°)
490 262 383 -30 491 255 390 0 37 0 492 329 476 -30 493 274 427 0 34 0 494 330 401 -30 495 282 390 0 496 326 418 -30 497 285 399 0 498 284 382 -30 499 294 451 0 500 285 380 -30 501 337 469 0 502 275 370 -30 503 270 440 0 504 271 373 -30 505 326 447 0 14 0 506 281 471 -30 507 282 378 0 508 285 457 -30 509 263 395 0 510 306 477 -30 511 266 365 0 512 303 430 0 513 296 411 0 514 342 427 0 9,5 0 515 338 416 -30 3,5 -30 516 290 414 0 7 0 517 302 414 -30 4 -30 518 355 454 0 6,5 0 519 343 463 -30 3,5 -30 51 -30 520 5 0 521 312 431 -30 4,5 -30 522 303 431 0 9 0 523 330 452 -30 3 -30 27 -30 524 313 462 0 8 0 525 303 475 -30 4 -30 526 293 441 0 14,5 0 527
mild
stee
l
~190
0
301 414 -30 4 -30

Fatigue assessment of riveted bridges
A28
Table A28 German bridge properties for metals produced in the beginning of 20th century from literature Höhler (2005)
Bridge Country Metal Year fy (Mpa)
fu (Rm) (Mpa)
Test temp (°C)
Charpy-V (J)
Test temp(°C)
JC (N/mm)
Test temp (°C)
1913-1919 278 366
1913-1919 341 400
1913-1919 326 382 10 -70
1913-1919 368 472 4 -80
1913-1919 284 361
1913-1919 325 377 13 -70 1913-1919 235 343 33 -70 1913-1919 366 449 5 -70 1913-1919 337 400 5 -70 1913-1919 300 377 17 -70 1913-1919 313 373 62 -60 1913-1919 324 414 6 -50 1913-1919 263 407
1913-1919 360 520
1913-1919 386 499
1913-1919 350 443 31 -30
1913-1919 292 432
1913-1919 410 460 68 -30
1913-1919 329 459
1913-1919 346 478
1913-1919 454 578 -30 3 -30 2,7 -30
Hoc
hbrü
cke
Hoc
hdon
n
Ger
man
y
mild
stee
l
1913-1919 415 531 0 3 0 7,3 0

Appendix A
A29
Table A29 German bridge properties for metals produced in the beginning of 20th century from literature Höhler (2005)
Bridge Country Metal Year fy (Mpa)
fu (Rm) (Mpa)
Test temp (°C)
Charpy-V (J)
Test temp(°C)
JC (N/mm)
Test temp (°C)
Hochbrücke Hochdonn
Ger
man
y m
ild st
eel
1913-1919
387 500
20 5 20 19,4 20
234 336 18 20
14 0 St Denis
Fr
ance
iron 1897
10 -20
St Denis
Fran
ce
iron 1897 231 276
1909 217 381 21 0 Les Fades
Fran
ce
stee
l
10 -20
1906 217 381 1,7 0 Les Fades
Fran
ce
stee
l
8 -20
280 306 15 20 Passerelle de Bd Fr
ance
iron 1860
17 0
285 403 27 20
8 0 Pont Suchard
Fr
ance
stee
l 1906
5 -20
272 286 6,7 20
5,3 0 St André de
Cubzac Fr
ance
iron
1870
4,6 -20
Adour à Bayonne Fr
ance
iron 1862 252 360 6 20
279 415 34 20
7 0 Ponts des Termes Fr
ance
stee
l 1890
4 -20

Fatigue assessment of riveted bridges


Appendix B
B1
Appendix B Fatigue tests
This appendix contains the values found in literature concerning fatigue endurance of riveted structures. The number of cycles in the tables is the values used in the figures concerning the fatigue performance of girders and small scale specimens. However some investigations had repairs done at cracked sections, the additional loading after these repairs is not accounted for, instead the numbers of cycles until the repair has been taken as the number of cycles to failure. Baker et al (1985) Fatigue test on rolled beams with and without high-strength bolts Specimen Δσ [MPa] N cycles
(failure) N cycles to observed cracks
Crack initiation
BKh1 216,1 5,860E+04 5,64E+04 E BKh2 216,1 4,590E+04 E BKh3 216,1 5,000E+04 4,55E+04 E BKb1 216,1 9,073E+05 8,87E+05 E BKb2 216,1 8,456E+05 8,40E+05 E BKb3 216,1 6,870E+05 M BKh = Baker and Kulak beams with holes BKb = Baker and Kulak beams with hgh strength bolts E = extremity of end hole M = extremity of middle hole

Fatigue assessment of riveted bridges
B2
Baker et al (1985) Fatigue test on riveted girders Specimen Δσ [MPa] N cycles (failure) BKc-1s 188 4,185E+05 BKc-1b 188 4,185E+05 BKc-1c 188 9,583E+05 BKc-2a 188 7,823E+05 BKc-2b 188 7,936E+05 BKc-2c 188 9,118E+05 BKd-3a 166 2,631E+05 BKd-3b 166 4,963E+05 BKd-4a 166 2,491E+05 BKd-4b 166 3,528E+05 BKd-4c 166 4,852E+05 Δσmin = 31 MPa type BKC specimen, Δσmin = 23 MPa type BKd. All fatigue cracks started at rivet holes. Mang et al (1993) Full scale test Specimen Δσ [MPa] N cycles Test
Bridge Blumberg
87 1,20E+05 The whole bridge
130 1,50E+06 Main girder 130 2,00E+06 Main girder
Bridge Blumberg
110 1,00E+07 Main girder 180 2,80E+05 Main girder 140 7,80E+05 Main girder 140 1,30E+06 Main girder
Bridge Stahringen
140 2,10E+06 Main girder Bridge Bruchsal
195 6,50E+05 Main girder
150 5,00E+05 Main girder 180 3,20E+04 Girder
Bridge Westkreuz Berlin 180 6,00E+04 Girder
125 3,90E+05 Transverse girder Bridge Berlin-Knesebeck 95 2,90E+06 Transverse girder

Appendix B
B3
Mang et al (1993) Small scale tests with high-strength bolts Specimen Δσ [MPa] N cycles (failure) Test
200 7,60E+04 Preload 200 Nm Bridge Calw 200 9,50E+04 Preload 400 Nm
200 6,60E+05 Preload 125 Nm 180 8,60E+06 200 1,10E+06 180 1,60E+06 200 1,80E+06 Preload 250Nm 200 2,80E+06 200 3,20E+06 180 3,60E+06 200 6,40E+06 180 1,00E+07 200 2,20E+05 Preload 125 Nm 200 3,10E+05
Bridge Stahringen
200 3,50E+05 Mang et al (1993) Small-scale test Specimen Δσ [MPa] N cycles (failure) Tests
Bridge Blumberg
80 2,40E+06 Part of main girder
65 1,00E+07 Part of main girder 50 4,00E+07 Part of main girder 150 9,20E+05 Part of longitudinal girder 120 1,20E+06 Part of longitudinal girder 150 1,60E+06 Part of longitudinal girder 120 9,20E+06 Part of longitudinal girder 220 1,70E+05 Specimens with original rivets 220 3,30E+05 Specimens with original rivets 180 3,50E+05 Specimens with original rivets 180 3,70E+06 Specimens with original rivets 220 3,30E+04 Specimens with newly drilled holes 220 9,40E+04 Specimens with newly drilled holes 200 1,10E+05 Specimens with newly drilled holes 200 1,40E+05 Specimens with newly drilled holes

Fatigue assessment of riveted bridges
B4
Mang et al (1993) Specimen Δσ [MPa] N cycles (failure) Test Bridge Blumberg
180 2,70E+05 Specimens with newly drilled holes
180 4,00E+05 Specimens with newly drilled holes 140 9,20E+05 Specimens with newly drilled holes 150 1,00E+06 Specimens with newly drilled holes 160 4,00E+05 Punched holes 160 3,60E+05 Punched holes 160 3,90E+05 punched holes 145 3,00E+06 punched holes Bridge Calw 180 1,50E+04 Wide plate tests 465,5 x 2000 d=25
t=12,3 [mm] 180 2,30E+04 Wide plate tests 465,5 x 2000 d=25
t=12,3 [mm] 200 2,60E+04 Wide plate tests 465,5 x 2000 d=25
t=12,3 [mm] 160 4,40E+04 Wide plate tests 465,5 x 2000 d=25
t=12,3 [mm] 160 6,10E+04 Wide plate tests 465,5 x 2000 d=25
t=12,3 [mm] 145 8,60E+04 Wide plate tests 465,5 x 2000 d=25
t=12,3 [mm] 145 9,60E+04 Wide plate tests 465,5 x 2000 d=25
t=12,3 [mm] 160 1,70E+05 Wide plate tests 465,5 x 2000 d=25
t=12,3 [mm] 180 1,80E+05 Wide plate tests 465,5 x 2000 d=25
t=12,3 [mm] 180 2,30E+05 Wide plate tests 465,5 x 2000 d=25
t=12,3 [mm] 160 3,40E+05 Wide plate tests 465,5 x 2000 d=25
t=12,3 [mm] 145 4,30E+05 Wide plate tests 465,5 x 2000 d=25
t=12,3 [mm] 230 1,00E+05 Small size specimen 210 1,10E+05 Small size specimen

Appendix B
B5
Mang et al (1993) Specimen Δσ [MPa] N cycles (failure) Test Bridge Calw 210 1,20E+05 Small size specimen 200 1,30E+05 Small size specimen 180 1,40E+05 Small size specimen 200 2,70E+05 Small size specimen 200 2,70E+05 Small size specimen 200 2,80E+05 Small size specimen 130 4,60E+05 Small size specimen 175 4,90E+05 Small size specimen 160 5,60E+05 Small size specimen 175 5,60E+05 Small size specimen 145 5,60E+05 Small size specimen 160 6,20E+05 Small size specimen 160 6,20E+05 Small size specimen 160 6,30E+05 Small size specimen 145 6,30E+05 Small size specimen 145 8,00E+05 Small size specimen 145 9,30E+05 Small size specimen 160 9,30E+05 Small size specimen 115 1,00E+06 Small size specimen 135 1,10E+06 Small size specimen 125 1,20E+06 Small size specimen 115 1,40E+05 Small size specimen 105 1,40E+05 Small size specimen 145 1,50E+05 Small size specimen 135 1,70E+05 Small size specimen 125 1,70E+05 Small size specimen 115 2,10E+05 Small size specimen 145 2,10E+05 Small size specimen 145 2,10E+05 Small size specimen 145 2,10E+05 Small size specimen 135 2,10E+05 Small size specimen 135 2,10E+05 Small size specimen 125 2,10E+05 Small size specimen 115 2,10E+05 Small size specimen 90 2,10E+05 Small size specimen 145 2,10E+05 Small size specimen 160 1,50E+05 Small size specimen 160 1,90E+05 Small size specimen

Fatigue assessment of riveted bridges
B6
Mang et al (1993) Specimen Δσ [MPa] N cycles (failure) Test Bridge Stahringen
220 3,80E+04 Plates with punched holes
Bridge Stahringen
190 7,00E+04 Plates with newly drilled holes
145 2,50E+05 Plates with newly drilled holes 220 5,00E+04 Plates with punched holes 180 1,10E+05 Plates with punched holes 180 1,30E+05 Plates with punched holes 180 1,40E+05 Plates with punched holes 145 2,50E+05 Plates with punched holes 145 3,60E+05 Plates with punched holes 145 4,70E+05 Plates with punched holes 145 1,20E+06 Plates with punched holes 225 3,90E+04 Plates with holes 225 4,80E+04 Plates with holes 180 1,10E+05 Plates with holes 190 1,20E+05 Plates with holes 180 1,40E+05 Plates with holes 180 1,50E+05 Plates with holes 190 1,50E+05 Plates with holes 180 2,00E+05 Plates with holes 180 2,60E+05 Plates with holes 190 2,60E+05 Plates with holes 180 2,90E+05 Plates with holes 180 3,20E+05 Plates with holes 145 4,00E+05 Plates with holes 145 4,80E+05 Plates with holes 145 5,20E+05 Plates with holes 148 5,40E+05 Plates with holes 145 6,40E+05 Plates with holes 125 7,60E+05 Plates with holes 125 8,00E+05 Plates with holes 145 8,80E+05 Plates with holes 148 9,40E+05 Plates with holes 125 1,10E+06 Plates with holes 145 1,20E+06 Plates with holes

Appendix B
B7
Mang et al (1993) Specimen Δσ [MPa] N cycles (failure) Test Bridge Stahringen
125 1,20E+06 Plates with holes
127 1,30E+06 Plates with holes 123 1,30E+06 Plates with holes 125 1,40E+06 Plates with holes 125 1,50E+06 Plates with holes 123 1,60E+06 Plates with holes 123 1,80E+06 Plates with holes 125 2,00E+06 Plates with holes 122 2,00E+06 Plates with holes 105 2,90E+06 Plates with holes 105 3,40E+06 Plates with holes 105 5,50E+06 Plates with holes 170 1,20E+05 Plates with holes 105 1,20E+07 Plates with holes Åkesson (1994) Full scale test on stringers Specimen σ min
[MPa] σ max [MPa]
Δσ [MPa]
N cycles (failure)
Nc (cycles to cracks)
Å1 12,8 52,8 40 2,0000E+07 Å2 12,8 52,8 40 2,0000E+07 Å3 12,8 72,8 60 1,0000E+07 Å4 12,8 92,8 80 5,9959E+06 5,8934E+06 Å5 12,8 92,8 80 2,3755E+06 2,3755E+06 Å6 12,8 92,8 80 6,4853E+06 6,3704E+06 Å7 38,4 138,4 100 1,6379E+06 1,4889E+06 Å8 38,4 138,4 100 2,1849E+06 2,0387E+06 Å9 38,4 138,4 100 2,0273E+06 2,0273E+06 The stress is calculated at the net section and excludes the contribution from dead weight. The forces and stresses are calculated at the edge of a beam.

Fatigue assessment of riveted bridges
B8
Fisher (1990) Full scale tests on riveted girders Specimen σ max
[MPa] σ min [MPa]
Δσ [MPa]
N cycles (failure)
Temp [°C]
Cracked part and its condition
1 Sfe 97 14 83 1623000 -57 W-F, hole 2 Sfe 97 14 83 2838000 room
temp W-F, hole
3 OC 97 14 83 4,15E+05 room temp
C-T, hole
4 Sfe 138 55 83 2728000 -73 W-F, hole 5 Sfe 138 55 83 3005000 -51 W-F, hole 6 MTB 138 55 83 3613000 -40 W-F, hole 7 OC 179 97 83 657000 room
temp W-F, corrosion
8 Sfe 117 14 103 916000 room temp
C-T, hole
9 Sfe 117 14 103 1237000 room temp
W-F, hole
10 Sfe 159 55 103 1316000 -46 W-F, hole 11 OC 159 55 103 511000 room
temp C-T, corrosion
MTB 159 55 103 1563000 -51 C-T, hole 13 Sfe 138 14 124 773000 -51 W-F, hole 14 OC 138 14 124 827000 room
temp W-F, corrosion
W-F:cracking at web-flange angle connection with continous coverplate(s). C-T:cracking at coverplate termination. Hole: cracking initiation at rivet hole. Corrosion: crack initiation at corrosion reduced section. Bridges were the girders originates Sfe = Santa Fe Railway bridge OC = Ocean County MTB = Minis Trail Bethlehem

Appendix B
B9
Forsberg (1993) Small scale tests Specimen Δσ [MPa] n cycles (failure) F1 81 2,53E+07 F1a 89 3,30E+07 F4 100 605504 F4a 117 995248 F5 71 495335 F5a 73 1207134 F6 100 237820 Abe (1989) Riveted plates Specimen Δσ [MPa] N cycles (failure) 1 170 300 000 2 225 340 000 3 200 470 000 4 220 900 000 5 172 2 200 000 σ min = 12 MPa Abe (1989) Riveted beams Specimen Δσ [MPa] N cycles (failure) 1 130 9,00E+04 2 100 1,00E+05 3 120 1,70E+05 4 100 4,50E+05 5 79 8,00E+05 6 100 1,00E+06 7 74 1,10E+06 8 77 1,30E+06 9 81 2,00E+06 * Measured values from the test σ min = 12 MPa

Fatigue assessment of riveted bridges
B10
Al-Ermani (2002) Full scale tests of riveted beams Specimen Δσ [MPa] N cycles
(failure) Nc cycles to observed crack
Al-1 100 5571150 5571150 62467501
Al-2 100 2002000 1840000 Al-3 97 5959340 5799020 Al-4 97 704 090 586 700 Al-5 100 1134280 872 600 Al-6 93 3692050 3639050 1The number of cycles to failure but due to the fact that the stress ratio was lowered to 60 MPa after crack initiating, this will be the load used to determine the length of the test. Al-Ermani (2002) Aborted full scale tests of riveted beams
Specimen Δσ [MPa] n cycles
Al-3 60 1,00E+07 Al-4 60 1,00E+07 Al-5 60 1,00E+07 Al-6 60 2,00E+07 Zainudin (1997) Full scale tests of riveted beams
Specimen Δσ [MPa] N cycles (failure)
Stress ratio Test
Kad-1 100 3712020 0,28 6B Kad-2 100 1587110 0,28 7A Kad-3 97 5959340 0,17 12B Rabemanantso (1984) Full scale test on rolled girder with riveted cover plate Specimen Δσ [Mpa] σmin[MPa] N cycles (failure)
R H-1 79,2 6,7 7,27E+07 R H-2 90,9 5,4 1,84E+06 R H-3 85,8 5,1 3,59E+06 R H-4 79,6 6,4 4,84E+06

Appendix B
B11
Brühwiler (1990) Riveted girder Specimen Δσ [MPa] N cycles Crack location Comment
1rg 60 7,79E+06 No crack load increased 120 9,20E+05 At rivet hole repair 120 1,20E+06 At rivet hole End of test 2 120 7,20E+05 At rivet hole Repair 120 9,00E+05 At rivet hole End of test 3 120 9,70E+05 At rivet hole End of test 4 90 3,24E+06 At rivet hole End of test 5 90 3,04E+06 At hole in flange repair 90 6,33E+06 No crack End of test 6rg 60 1,00E+07 No crack Load increased 90 1,90E+06 At rivet hole End of test Brühwiler (1990) Lattice girder Specimen Δσ [MPa] N cycles Crack location Comment 1lg 50 2,00E+07 No crack Load increased 70 1,70E+06 Rivet failures Repair 70 1,00E+07 No crack Load increased 100 6,60E+05 Crack in diagonal Repair 100 8,00E+05 Crack in diagonal Repair 100 1,06E+06 Crack in diagonal End of test 2,1lg 50 2,00E+07 No crack Load increased 2,2lg 70 1,00E+07 No crack Load increased 100 8,80E+05 Rivet failures Repair 100 1,32E+06 At rivet hole Repair 100 1,39E+06 Crack in diagonal End of test 3 70 8,20E+06 Rivet failures End 70 1,00E+07 No crack Load increased 100 3,50E+05 Rivet failure Repair 100 5,30E+05 Rivet failure Repair 100 9,50E+05 Crack in diagonal Repair 100 1,08E+06 Crack in diagonal End

Fatigue assessment of riveted bridges
B12
Brühwiler (1990) Full scale tests riveted girders Specimen Δσ [MPa] N cycles (failure) Crack location Comment
1 120 9,20E+05 At rivet hole Repair 2 120 7,20E+05 At rivet hole Repair 3 120 9,70E+05 At rivet hole End of test 4 90 3,24E+06 At rivet hole End of test 5 90 3,04E+06 At rivet hole in
flange Repair
6 90 1,90E+06 At rivet hole End of test Brühwiler (1990) Full scale tests lattice girder Specimen Δσ [MPa] n cycles (failure) Crack location Comment
1 70 1,70E+06 Rivet failure Repair 2 100 8,80E+05 Rivet failure Repair 3 70 8,20E+06 Rivet failure End Out (1984) Full scale tests Observed cracking corroded area Specimen Δσ [MPa]
(gross) a Δσ [MPa] (net) b N cycles Comments
1 73,4 75,2 3770000 Crack found > 104 mm
4400000 Angle severed 4990000 Section failed 2 62,1 64,8 850000 Angle severed 1450000 Section failed 3c 62,1 63,4 39710000 No failure 4 55,2 57,2 1190000 Crack found > 76
mm 53700000 First hole drilled D 7610000 Section spliced Ratio R σmin/σmax =0,1 a = Stress range full section b = Stress range reduced section c = Test discontinued d = Test stoped because of change in condition

Appendix B
B13
Out (1984) Plotted values full scale tests riveted girders Test Δσ [MPa]
(gross) a Δσ [MPa] (net) b
N cycles (failure)
Comment
1 73,4 75,2 4,99E+06 Section failed 2 62,1 64,8 1,45E+06 Section failed 3c 62,1 63,4 3,97E+07 No failure 4d 55,2 57,2 7,61E+06 Section spliced Reemsnyder (1975) Full scale tests on connections Specimen Δσ [MPa] N cycles (failure) Comments 1 157 2,50E+05 Without prestressing 2 157 3,24E+05 Without prestressing 5 125 8,15E+05 Without prestressing 6 125 7,78E+05 Without prestressing 7 125 5,93E+05 Without prestressing 15 125 2,36E+06 Without prestressing Reemsnyder (1975) Full scale tests on connections Specimen Δσ [MPa] N cycles (failure) Comments 3 157 2,01E+07 With prestressed bolts 4 125 1,25E+06 With prestressed bolts 8 125 2,08E+06 With prestressed bolts 9 125 1,67E+06 With prestressed bolts 10 125 3,60E+06 With prestressed bolts 11 125 2,43E+06 With prestressed bolts 12 125 4,77E+06 With prestressed bolts 13 125 2,03E+06 With prestressed bolts 14 125 1,26E+06 With prestressed bolts 16 125 7,77E+06 With prestressed bolts

Fatigue assessment of riveted bridges
B14
Helmerich et al (1997) Full scale tests Specimen Δσ [MPa]
(net) N cycles (failure)
Comments Test
1 80 3,60E+06 Test continued after failure in a newly drilled hole
Truss girder
2 140 2,50E+05 Crack in gusset plate Truss girder 3 101 2,62E+06 Cover plate at rivet hole Plate girder,
mild steel 4 123 3,61E+05 Cover plate at rivet hole Plate girder,
mild steel 5 115 5,62E+05 Cover plate at rivet hole Plate girder,
mild steel 6 130 5,86E+05 Crack at rivet hole Plate girder,
wrought iron 7 108 2,83E+06 Crack at rivet hole,at L-profile Plate girder,
wrought iron 8 97 2,69E+06 Crack at rivet hole,at L-profile Plate girder,
wrought iron 9 104 4,28E+06 Crack at rivet hole Plate girder,
wrought iron Adamson (1995) Full scale tests Specimen Δσ [MPa] (net) N cycles
(failure) Comments Test
1 69 3336700 Stringer 2 73 1874730 Stringer 3 69 2168570 Stringer 4 66 3240180 Stringer 5 66 12017640 Test aborted Stringer 6 63 12178930 Test aborted Stringer 4s 61 3213710 5s 61 10850670 5i 73 8073460 s = shear crack i = inverted, the girder was turned up-side down and tested one more time.

Appendix B
B15
DiBabtista (1998) Full scale tests tension girders Specimen Δσ [MPa] (net) N cycles (failure) Comments Test 1 73 2401580 Bottom part Diagonal 2 69 3958270 Bottom part Diagonal 3 73 2849000 Test was aborted.
Bottom part Diagonal
4 66 5250610 Bottom part Diagonal 5 64 1944670 Topp part Diagonal 6 62 2248060 Topp part Diagonal 7 58 2314250 Topp part Diagonal Xiulin (1996) Small scale tests on plates with holes Specimen Δσ [MPa] N cycles (failure) 1 155 120000 2 145 170000 3 145 180000 4 155 190000 5 155 210000 6 134 230000 7 160 230000 8 160 240000 9 150 240000 10 155 250000 11 155 270000 12 140 360000 13 130 360000 14 140 420000 15 140 450000 16 140 480000 17 140 540000 18 130 560000 19 140 590000 20 130 610000 21 120 630000 22 140 730000 23 140 780000 24 120 920000 25 120 1000000 26 120 1100000 27 120 1200000 28 120 1500000

Fatigue assessment of riveted bridges
B16
Helmerich et al (2005) Full scale tests Specimen Δσ [MPa] (net) N cycles (failure) Test New tests 10 170 2,40E+05 Truss girder 11 80 2,60E+05 Truss girder 12 140 3,30E+05 Truss girder 13 125 5,20E+05 Truss girder 14 150 5,30E+05 Truss girder 15 67 2,50E+06 Truss girder 16 100 2,60E+06 Truss girder 17 95 2,70E+06 Truss girder 18 110 2,80E+06 Truss girder 19 80 3,60E+06 Truss girder 20 55 3,50E+06 Truss girder 21 110 4,30E+06 Truss girder 22 62 4,60E+06 Truss girder 23 55 5,10E+06 Truss girder Zhou et al (1995) Full scale tests Specimen Δσ [MPa] (net) N cycles 1 44 1,0E+08 2 44 1,0E+08 3 44 1,0E+08 4 54 1,0E+08 5 54 1,0E+08 The stress is estimated from diagram


Appendix C
C1
Appendix C Moment and stiffness calculations
Distributed load Calculations of the mid moment of a beam with a degradation of the connection stiffness with a distributed load see Figure C1.
L
Ma = Krot ⋅ θ
MM
q
x
Figure C1 Notation for calculations of mid moment, distributed load From the elastic deflection curve one can derive the following expression for a uniformed load on a simply supported beam

Fatigue assessment of riveted bridges
C2
2
3 2
4 2 2
2
6 2
24 6 2
IV
III
II
I
q EIv q
V EIv qx A
qxM EIv Ax
qx AxEIv Bx C
qx Ax Bxv EIv Cx D
θ
=
= +
= +
= + + +
= + + + +
Boundary conditions
(0) 0
( ) 0
(0) (0)
( ) 0
II Irot
II
EIv
EIv L
EIv Ma K v
EIv L
=
=
= = ⋅
=
The 4 constants A to D derived from the boundary conditions
2 1243 rot
q L q LAE I
K L
⋅ ⋅= − −
⎛ ⎞⋅⋅ +⎜ ⎟⋅⎝ ⎠
4
2
243rot
q LBE I L L
K
⋅=
⎛ ⎞⋅ ⋅⋅ +⎜ ⎟⎝ ⎠
2
1243
rot
rot
E Iq LK
CE I
K L
⎛ ⎞⋅⋅ ⋅⎜ ⎟
⎝ ⎠=⎛ ⎞⋅⋅ +⎜ ⎟⋅⎝ ⎠
0D =

Appendix C
C3
The moment in the middle of beam will be obtained by inserting the value of L/2 at x:
2
( ) 2 2 124
3
II
rot
q x q L q LM x EIvE I
K L
⎛ ⎞⎜ ⎟
⋅ ⋅ ⋅⎜ ⎟= = − +⎜ ⎟⎛ ⎞⋅⋅ +⎜ ⎟⎜ ⎟⎜ ⎟⋅⎝ ⎠⎝ ⎠
Krot is the rotational stiffness of the connection q is a distributed load L is the length of the beam E is the Young’s modulus I is the moment of inertia of the beam Two point loads Calculations of the mid moment of a beam with a degradation of connection stiffness with two concentrated loads see Figure C2, have been done with superposition. P P
c c
d
L
Ma = Krot ⋅ θ MM
A B
Figure C2 Notation for calculations of mid moment, two point loads From equilibrium
( ) ( )
( )
2 0
2
a a
aa
R c d P c d P c MMR Pc d
+ − + − ⋅ + =
= −+
Moment in middle of beam:

Fatigue assessment of riveted bridges
C4
2 2M ad P dM R c ⋅⎛ ⎞= ⋅ + −⎜ ⎟
⎝ ⎠
The rotation of a simply supported beam with point loads and a moment can be expressed by elementary cases. The rotation at position B for a point load
2
216P c L c
E I Lθ
⎛ ⎞⋅ ⋅= ⋅ −⎜ ⎟⋅ ⎝ ⎠
The rotation at position B due to a moment (counter clockwise)
3M LE I
θ ⋅=
⋅
The rotation at the B position can been derived as
( ) ( )22
2 21 16 6 3
a aB
rot
P c d L c d M L MP c L cE I L E I L E I K
θ⎛ ⎞⋅ + ⋅ +⎛ ⎞ ⋅⋅ ⋅
= ⋅ − + ⋅ − − =⎜ ⎟⎜ ⎟ ⎜ ⎟⋅ ⋅ ⋅⎝ ⎠ ⎝ ⎠
From the above relation the moment due to the stiffness of the connection can be obtained
( ) ( )22
2 21 16
13
a
rot
c dP L c c c dE I L L
M LE I K
⎛ ⎞⎛ ⎞+⎛ ⎞⋅ ⎜ ⎟⋅ − ⋅ + − ⋅ +⎜ ⎟⎜ ⎟ ⎜ ⎟⎜ ⎟⋅ ⎝ ⎠ ⎝ ⎠⎝ ⎠=+
⋅
When the expression for the moment in the connection due to the rotational stiffness is known the moment in the middle of the beam can be derived
( ) ( )
( )
22
2 21 16
13
2 2 2
rot
M
c dP L c c c dE I L L
LE I K
d P dM P cc d
⎛ ⎞⎛ ⎞⎛ ⎞+⎛ ⎞⋅⎜ ⎟⎜ ⎟⋅ − ⋅ + − ⋅ +⎜ ⎟⎜ ⎟ ⎜ ⎟⎜ ⎟⋅⎜ ⎟⎝ ⎠ ⎝ ⎠⎝ ⎠⎜ ⎟⎜ ⎟+⎜ ⎟⋅⎜ ⎟ ⋅⎛ ⎞⎝ ⎠= − ⋅ + −⎜ ⎟+ ⎝ ⎠


Doctoral and Licentiate Theses
i
Doctoral and Licentiate Theses Division of Structural Engineering Luleå University of Technology
Doctoral Theses (Some are downloadable from: http://epubl.ltu.se/1402-1544/index.shtml)
1980 Ulf Arne Girhammar: Dynamic Fail-Safe Behaviour of Steel Structures. Doctoral Thesis 1980:060D. pp. 309.
1983 Kent Gylltoft: Fracture Mechanics Models for Fatigue in concrete Structures. Doctoral Thesis 1983:25D. pp. 210.
1985 Thomas Olofsson: Mathematical Modelling of Jointed Rock Masses. In collaboration with the Division of Rock Mechanics. Doctoral Thesis 1985:42D. pp. 143.
1988 Lennart Fransson: Thermal ice pressure on structures in ice covers. Doctoral Thesis 1988:67D. pp. 161.
1989 Mats Emborg: Thermal stresses in concrete structures at early ages. Doctoral Thesis 1989:73D. pp. 285.
1993 Lars Stehn: Tensile fracture of ice. Test methods and fracture mechanics analysis. Doctoral Thesis 1993:129D, September 1993. pp. 136.
1994 Björn Täljsten: Plate Bonding. Strengthening of existing concrete structures with epoxy bonded plates of steel or fibre reinforced plastics. Doctoral Thesis 1994:152D, August 1994. pp. 283.
1994 Jan-Erik Jonasson: Modelling of temperature, moisture and stresses in young concrete. Doctoral Thesis 1994:153D, August 1994. pp. 227.
1995 Ulf Ohlsson: Fracture Mechanics Analysis of Concrete Structures. Doctoral Thesis 1995:179D, December 1995. pp. 98.
1998 Keivan Noghabai: Effect of Tension Softening on the Performance of Concrete Structures. Doctoral Thesis 1998:21, August 1998. pp. 150.

Fatigue assessment of riveted bridges
ii
1999 Gustaf Westman: Concrete Creep and Thermal Stresses. New creep
models and their effects on stress development. Doctoral Thesis 1999:10, May 1999. pp. 301.
1999 Henrik Gabrielsson: Ductility in High Performance Concrete Structures. An experimental investigation and a theoretical study of prestressed hollow core slabs and prestressed cylindrical pole elements. Doctoral Thesis 1999:15, May 1999. pp. 283.
2000 Patrik Groth: Fibre Reinforced Concrete - Fracture Mechanics Methods Applied on Self-Compacting Concrete and Energetically Modified Binders. Doctoral Thesis 2000:04, January 2000. pp. 214. ISBN 978-91-85685-00-4.
2000 Hans Hedlund: Hardening concrete. Measurements and evaluation of non- elastic deformation and associated restraint stresses. Doctoral Thesis 2000:25, December 2000. pp. 394. ISBN 91-89580-00-1.
2003 Anders Carolin: Carbon Fibre Reinforced Polymers for Strengthening of Structural Members. Doctoral Thesis 2003:18, June 2003. pp. 190. ISBN 91-89580-04-4.
2003 Martin Nilsson: Restraint Factors and Partial Coefficients for Crack Risk Analyses of Early Age Concrete Structures. Doctoral Thesis 2003:19, June 2003. pp. 170. ISBN: 91-89580-05-2.
2003 Mårten Larson: Thermal Crack Estimation in Early Age Concrete – Models and Methods for Practical Application. Doctoral Thesis 2003:20, June 2003. pp. 190. ISBN 91-86580-06-0.
2005 Erik Nordström: Durability of Sprayed Concrete. Steel fibre corrosion in cracks. Doctoral Thesis 2005:02, January 2005. pp. 151. ISBN 978-91-85685-01-1.
2006 Rogier Jongeling: A Process Model for Work-Flow Management in Construction. Combined use of Location-Based Scheduling and 4D CAD. Doctoral Thesis 2006:47, October 2006. pp. 191. ISBN 978-91-85685-02-8.
2006 Jonas Carlswärd: Shrinkage cracking of steel fibre reinforced self compacting concrete overlays - Test methods and theoretical modelling. Doctoral Thesis 2006:55, December 2006. pp. 250. ISBN 978-91-85685-04-2.
2006 Håkan Thun: Assessment of Fatigue Resistance and Strength in Existing Concrete Structures. Doctoral thesis 2006:65, December 2006. pp. 169. ISBN 978-91-85685-03-5.
Doctoral and Licentiate Theses
iii
2007 Lundqvist Joakim: Numerical Analysis of Concrete Elements
Strengthened with Carbon Fiber Reinforced Polymers. Doctoral thesis 2007:07, March 2007. pp. 50+58. ISBN 978-91-85685-06-6.
2007 Arvid Hejll: Civil Structural Health Monitoring - Strategies, Methods and Applications. Doctoral Thesis 2007:10, March 2007. pp. 189. ISBN 978-91-85685-08-0.
2007 Stefan Woksepp: Virtual reality in construction: tools, methods and processes. Doctoral thesis 2007:49, November 2007. pp. 191. ISBN 978-91-85685-09- 7.
2007 Romuald Rwamamara: Planning the Healty Construction Workplace through Risk assessment and Design Methods. Doctoral thesis 2007:74, November 2007. pp. 179. ISBN 978-91-85685-11-0.
2008 Bjørnar Sand: Nonlinear finite element simulations of ice forces on offshore structure. Doctoral thesis 2008:39, September 2008. pp. 241.
2008 Sofia Utsi: Performance based concrete mix-design: aggregate and micro mortar optimization applied on self-compacting concrete containing fly ash. Doctoral thesis 2008:49, November 2008. pp. 190. ISSN 1402-1544.
2009 Markus Bergström: Assessment of Existing Concrete Bridges – Bending Stiffness as a Performance Indicator. Doctoral thesis, March 2009. pp. 221. ISBN 978-91-86233-11-2.
Licentiate Theses (Some are downloadable from: http://epubl.ltu.se/1402-1757/index.shtml)
1984 Lennart Fransson: Bärförmåga hos ett flytande istäcke. Beräkningsmodeller och experimentella studier av naturlig is och av is förstärkt med armering. Licentiate Thesis 1984:012L. pp. 137.
1985 Mats Emborg: Temperature stresses in massive concrete structures. Viscoelastic models and laboratory tests. Licentiate Thesis 1985:011L, May 1985, rev. November 1985. pp. 163.
1987 Christer Hjalmarsson: Effektbehov i bostadshus. Experimentell bestämning av effektbehov i små- och flerbostadshus. Licentiate Thesis 1987:009L, October 1987. pp. 72.
1990 Björn Täljsten: Förstärkning av betongkonstruktioner genom pålimning av stålplåtar. Licentiate Thesis 1990:06L, May 1990. pp. 205.

Fatigue assessment of riveted bridges
iv
1990 Ulf Ohlsson: Fracture Mechanics Studies of Concrete Structures.
Licentiate Thesis 1990:07L, May 1990. pp. 66.
1990 Lars Stehn: Fracture Toughness of sea ice. Development of a test system based on chevron notched specimens. Licentiate Thesis 1990:11L, September 1990. pp. 88.
1992 Per Anders Daerga: Some experimental fracture mechanics studies in mode I of concrete and wood. Licentiate Thesis 1992:12L, 1ed April 1992, 2ed June 1992. pp. 81.
1993 Henrik Gabrielsson: Shear capacity of beams of reinforced high performance concrete. Licentiate Thesis 1993:21L, May 1993. pp. 109.
1995 Keivan Noghabai: Splitting of concrete in the anchoring zone of deformed bars. A fracture mechanics approach to bond. Licentiate Thesis 1995:26L, May 1995. pp. 123.
1995 Gustaf Westman: Thermal cracking in high performance concrete. Viscoelastic models and laboratory tests. Licentiate Thesis 1995:27L, May 1995. pp. 125.
1995 Katarina Ekerfors: Mognadsutveckling i ung betong. Temperaturkänslighet, hållfasthet och värmeutveckling. Licentiate Thesis 1995:34L, October 1995. pp. 137.
1996 Patrik Groth: Cracking in concrete. Crack prevention with air-cooling and crack distribution with steel fibre reinforcement. Licentiate Thesis 1996:37L, October 1996. pp. 128.
1996 Hans Hedlund: Stresses in High Performance Concrete due to Temperature and Moisture Variations at Early Ages. Licentiate Thesis 1996:38L, October 1996. pp. 240.
2000 Mårten Larson: Estimation of Crack Risk in Early Age Concrete. Simplified methods for practical use. Licentiate Thesis 2000:10, April 2000. pp. 170.
2000 Stig Bernander: Progressive Landslides in Long Natural Slopes. Formation, potential extension and configuration of finished slides in strain- softening soils. Licentiate Thesis 2000:16, May 2000. pp. 137.
2000 Martin Nilsson: Thermal Cracking of young concrete. Partial coefficients, restraint effects and influences of casting joints. Licentiate Thesis 2000:27, October 2000. pp. 267.

Doctoral and Licentiate Theses
v
2000 Erik Nordström: Steel Fibre Corrosion in Cracks. Durability of
sprayed concrete. Licentiate Thesis 2000:49, December 2000. pp. 103.
2001 Anders Carolin: Strengthening of concrete structures with CFRP – Shear strengthening and full-scale applications. Licentiate thesis 2001:01, June 2001. pp. 120. ISBN 91-89580-01-X.
2001 Håkan Thun: Evaluation of concrete structures. Strength development and fatigue capacity. Licentiate thesis 2001:25, June 2001. pp. 164. ISBN 91-89580-08-2.
2002 Patrice Godonue: Preliminary Design and Analysis of Pedestrian FRP Bridge Deck. Licentiate thesis 2002:18. pp. 203.
2002 Jonas Carlswärd: Steel fibre reinforced concrete toppings exposed to shrinkage and temperature deformations. Licentiate thesis 2002:33, August 2002. pp. 112.
2003 Sofia Utsi: Self-Compacting Concrete - Properties of fresh and hardening concrete for civil engineering applications. Licentiate thesis 2003:19, June 2003. pp. 185.
2003 Anders Rönneblad: Product Models for Concrete Structures - Standards, Applications and Implementations. Licentiate thesis 2003:22, June 2003. pp. 104.
2003 Håkan Nordin: Strengthening of Concrete Structures with Pre-Stressed CFRP. Licentiate Thesis 2003:25, June 2003. pp. 125.
2004 Arto Puurula: Assessment of Prestressed Concrete Bridges Loaded in Combined Shear, Torsion and Bending. Licentiate Thesis 2004:43, November 2004. pp. 212.
2004 Arvid Hejll: Structural Health Monitoring of Bridges. Monitor, Assess and Retrofit. Licentiate Thesis 2004:46, November 2004. pp. 128.
2005 Ola Enochsson: CFRP Strengthening of Concrete Slabs, with and without Openings. Experiment, Analysis, Design and Field Application. Licentiate Thesis 2005:87, November 2005. pp. 154.
2006 Markus Bergström: Life Cycle Behaviour of Concrete Structures – Laboratory test and probabilistic evaluation. Licentiate Thesis 2006:59, December 2006. pp. 173. ISBN 978-91-85685-05-9.
2007 Thomas Blanksvärd: Strengthening of Concrete Structures by Mineral Based Composites. Licentiate Thesis 2007:15, March 2007. pp. 300. ISBN 978-91-85685-07-3.

Fatigue assessment of riveted bridges
vi
2007 Alann André: Strengthening of Timber Structures with Flax Fibres.
Licentiate Thesis 2007:61, November 2007. pp. 154. ISBN 978-91-85685-10-3.
2008 Peter Simonsson: Industrial bridge construction with cast in place concrete: New production methods and lean construction philosophies. Licentiate Thesis 2008:17, May 2008. pp. 164. ISBN 978-91-85685-12-7.
2008 Anders Stenlund: Load carrying capacity of bridges: three case studies of bridges in northern Sweden where probabilistic methods have been used to study effects of monitoring and strengthening. Licentiate Thesis 2008:18, May 2008. pp. 306. ISBN 978-91-85685-13-4.
2008 Anders Bennitz: Mechanical Anchorage of Prestressed CFRP Tendons. Licentiate Thesis 2008:32, September 2008. pp. 293. ISSN 1402-1757.
2008 Gabriel Sas: Shear strengthening of RC beams and walls. Licentiate Thesis 2008:39, December 2008. pp. 202. ISSN 1402-1757.