Embed Size (px)
Citation preview
Haroon Ashfaq et al Int. Journal of Engineering Research and Applications www.ijera.com
ISSN : 2248-9622, Vol. 3, Issue 5, Sep-Oct 2013, pp.1444-1454
www.ijera.com 1444 | P a g e
Fault Current Detection of Three Phase Power Transformer
Using Wavelet Transform
Haroon Ashfaq1
and Mohammad. Noorullah Quadri2
Assistant Professor, Department of Electrical Engineering, Jamia Millia Islamia , New Delhi, India1
Design Engineer, Electrical Department, N_ Arc Consulting, New Delhi, India2
Abstract The disturbances of power systems are nonperiodic, nonstationary, short duration and impulse super-imposed
nature.The wavelet transform is one of the most suitable tool for the analysis of power system disturbances. In
this paper, the application of wavelet transforms to determine the type of fault and accurate classification for the
change in the wave shape due to fault occurrence is investigated. The maximum detail coefficient and energy
level of each type of fault are characteristic in nature and are used for distinguishing the fault types. Keywords-Transformer faults, differential protection, frequency analysis, wavelet transforms, Matlab simpower
power system disturbance.
I. INTRODUCTION Power transformer protection has always been
a challenging problem for protection engineers. The
main concern in protecting this particular element of
power systems lies in the accurate and rapid
discrimination between magnetizing inrush and
different internal faults currents [1] and [2]. Since the
magnetizing branch appears as the shunt element in the
transformer equivalent circuit, the magnetizing current upsets the balance between the currents at the
transformer terminal and is therefore experienced by
differential relay as fault current. Magnetizing inrush
currents sometimes have high magnitudes that cause
traditional differential relays to initiate trip actions
disconnecting the protected transformer from the
system. Such mal-operation of differential relays can
affect both the reliability and stability of the whole
power system. In addition, magnetizing inrush current
contains a high amount of the second and sometimes
the fifth harmonics [1]-[2] Most of the conventional transformer protection relays employ the harmonic
analysis approach to identify the type of the current
that flows in the protected transformer. The main idea
of the harmonic restraint differential relays is to extract
the fundamental (1st), the second (2nd) and sometimes
the fifth (5th) harmonics and to compare the ratios of
the 2nd and 5th harmonics with 1st to a predefined
threshold value. There have been different algorithms
to carry out the harmonic analysis. Among these
algorithms, sine cosine correlations, rectangular
transform, discrete Fourier transform (DFT), Least-square method, Walsh functions, Haar functions and
Kalman filtering technique, etc. are significant [1] and
[3]. The main drawbacks of the 2nd harmonic restraint
approach that the 2nd harmonic may also exist in some
internal faults of the transformer windings. In addition,
the new low-loss amorphous core materials in modern
power transformers are capable of producing
magnetizing inrush currents with low 2nd and 5th
harmonic contents [1]-[3]. These traditional signal
processing tools used for frequency analysis are based
on the conditions of stationarity and periodicity.
However, disturbance power systems are of a
nonperiodic, nonstationary, short duration and impulse
super-imposed natures [4]. Efficient frequency analysis
should be able to overcome the limitations of the
traditional signal processing tools. The wavelet
analysis is one of the newly applied frequency tools for
processing signal with complex characteristics.Transients in power systems result from
a variety of disturbances of power transformer, such
faults currents, are extremely important. Faults
currents are classified as external and internal faults
currents. Wavelet theory is the mathematics, which
deals with building a model for non- stationary signals,
using a set of components that look like small waves,
called wavelets. It has become a well- known useful
tool since its introduction, especially in signal and
image processing [5].
II. WAVELET TRANSFORM The wavelet analysis and wavelet transforms
have emerged recently as a powerful tool for signal
processing in different applications, particular for
power system applications. The transient
characteristics of wavelets can be employed to carry
out exact and effective analysis of signals with
complex frequency-time plane. Moreover, the wavelet
analysis can accommodate non uniform bandwidths as the bandwidth is higher at higher frequencies, which
make it possible to implement the wavelet analysis
through different levels of decimation in a filter bank
[1]. The applications of wavelet analysis in power
systems include analysis and detection of
electromagnetic transients, power quality assessment,
data compression, and fault detection [4]. The wavelet
RESEARCH ARTICLE OPEN ACCESS
Haroon Ashfaq et al Int. Journal of Engineering Research and Applications www.ijera.com
ISSN : 2248-9622, Vol. 3, Issue 5, Sep-Oct 2013, pp.1444-1454
www.ijera.com 1445 | P a g e
analysis has been recently used in current differential
pilot relay, where current diagnosis is based on
comparing the first level approximation with a
predefined threshold value [4]. Frequency analysis is
not suited for transient analysis, because Fourier based
analysis is based on the sine and cosine functions, which are not transients. These results in very wide
frequency spectrum in the analysis of transients
Fourier techniques cannot simultaneously achieve
good location in both time and frequency for a
transient signal [5]. The main advantage of wavelet
transform over Fourier is that the size of analysis
technique varies in proportion to the frequency. Hence
offer a better compromise in terms of localization [5].
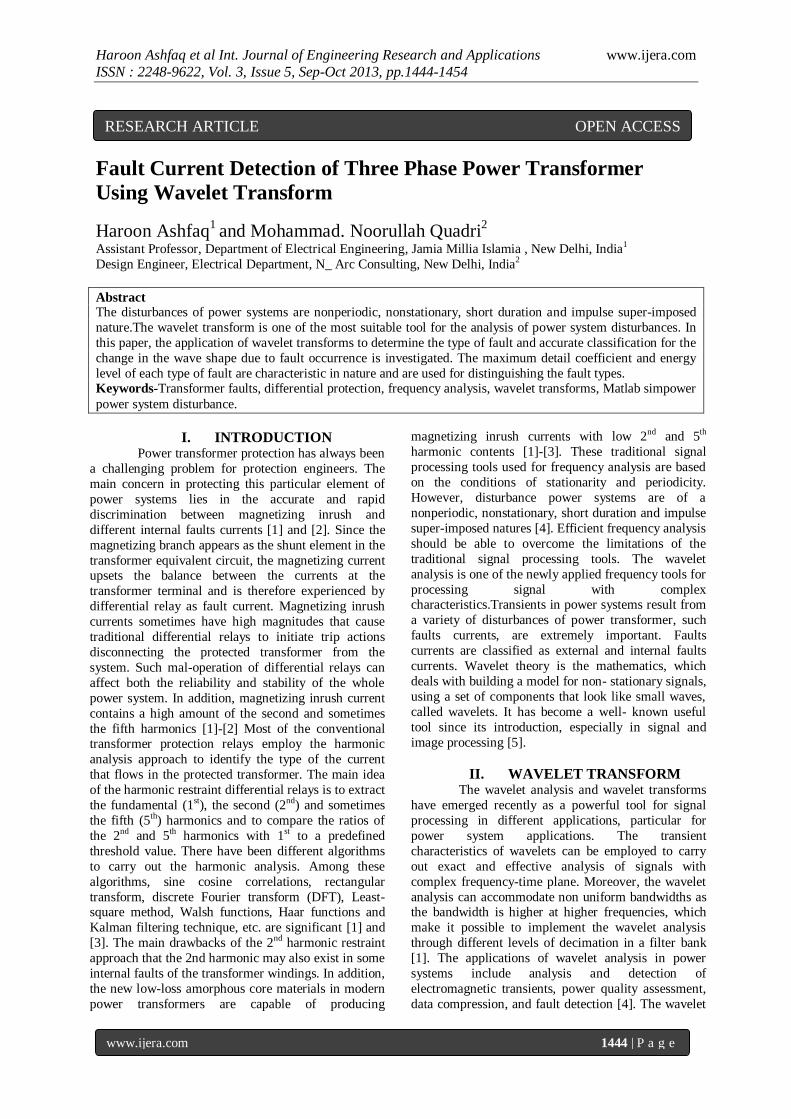
Fig. 1. Analyses of signal using wavelet transform
The wavelet transform decomposes transients
into a series of wavelet components, each of which
corresponds to a time domain signal that covers a specific octave frequency band containing more
detailed information. Such wavelet components used to
detect, localize, and classify the sources of transients.
Hence, the wavelet transform is feasible and practical
for analyzing power system transients [5-9]. The
discrete wavelet transform (DWT) is normally
implemented by Mallat’s algorithm its formulation is
related to filter bank theory.
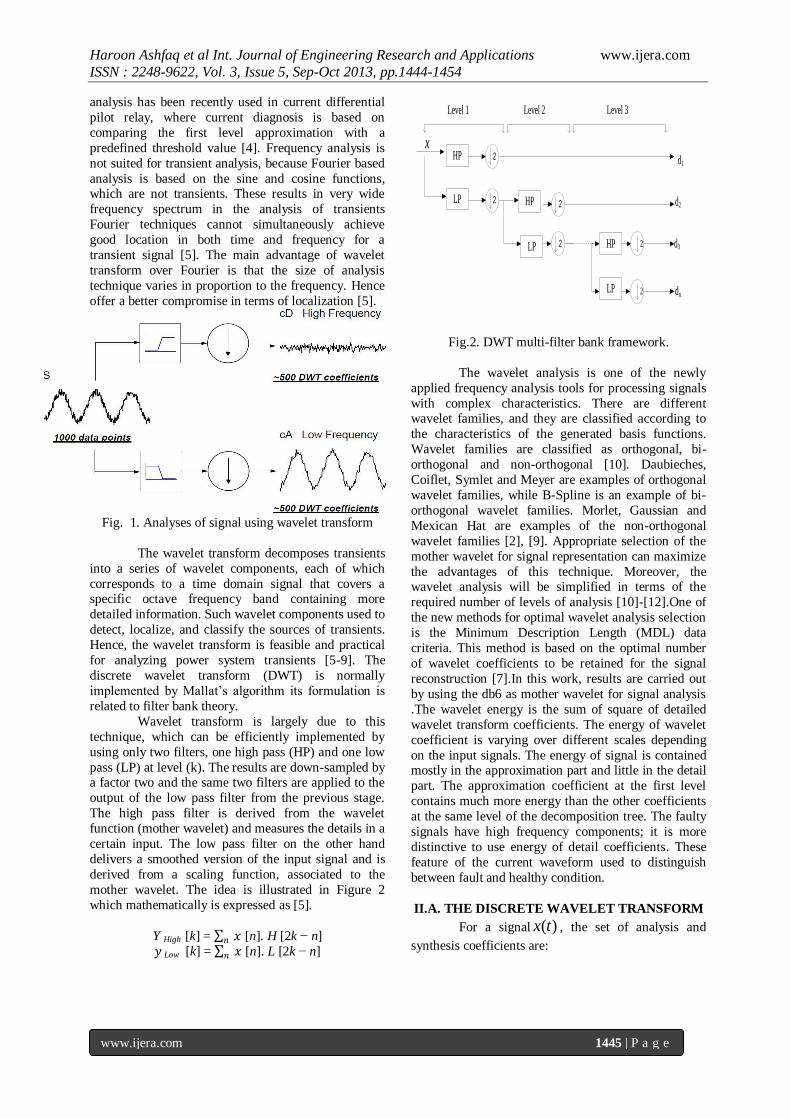
Wavelet transform is largely due to this
technique, which can be efficiently implemented by
using only two filters, one high pass (HP) and one low
pass (LP) at level (k). The results are down-sampled by a factor two and the same two filters are applied to the
output of the low pass filter from the previous stage.
The high pass filter is derived from the wavelet
function (mother wavelet) and measures the details in a
certain input. The low pass filter on the other hand
delivers a smoothed version of the input signal and is
derived from a scaling function, associated to the
mother wavelet. The idea is illustrated in Figure 2
which mathematically is expressed as [5].
Y High [k] = 𝑥𝑛 [n]. H [2k − n]
𝑦 Low [k] = 𝑥𝑛 [n]. L [2k − n]
HP
HP
HP 2
LP
LP
LP
d1
d2
d3
dn
x
Level 1 Level 2 Level 3
2
2
2
2
2
Fig.2. DWT multi-filter bank framework.
The wavelet analysis is one of the newly
applied frequency analysis tools for processing signals
with complex characteristics. There are different wavelet families, and they are classified according to
the characteristics of the generated basis functions.
Wavelet families are classified as orthogonal, bi-
orthogonal and non-orthogonal [10]. Daubieches,
Coiflet, Symlet and Meyer are examples of orthogonal
wavelet families, while B-Spline is an example of bi-
orthogonal wavelet families. Morlet, Gaussian and
Mexican Hat are examples of the non-orthogonal
wavelet families [2], [9]. Appropriate selection of the
mother wavelet for signal representation can maximize
the advantages of this technique. Moreover, the wavelet analysis will be simplified in terms of the
required number of levels of analysis [10]-[12].One of
the new methods for optimal wavelet analysis selection
is the Minimum Description Length (MDL) data
criteria. This method is based on the optimal number
of wavelet coefficients to be retained for the signal
reconstruction [7].In this work, results are carried out
by using the db6 as mother wavelet for signal analysis
.The wavelet energy is the sum of square of detailed
wavelet transform coefficients. The energy of wavelet
coefficient is varying over different scales depending
on the input signals. The energy of signal is contained mostly in the approximation part and little in the detail
part. The approximation coefficient at the first level
contains much more energy than the other coefficients
at the same level of the decomposition tree. The faulty
signals have high frequency components; it is more
distinctive to use energy of detail coefficients. These
feature of the current waveform used to distinguish
between fault and healthy condition.
II.A. THE DISCRETE WAVELET TRANSFORM
For a signal )(tx , the set of analysis and
synthesis coefficients are:
Haroon Ashfaq et al Int. Journal of Engineering Research and Applications www.ijera.com
ISSN : 2248-9622, Vol. 3, Issue 5, Sep-Oct 2013, pp.1444-1454
www.ijera.com 1446 | P a g e
dtttxcAnalysis kjkj )()( ,,
(1)
)()(: ,, tctxSynthesis kj
j k
kj
(2)
Assuming the existence of a scaling function, )(t we
can modify the above definition as follows.
Since the spaces jV are getting larger and larger as j
goes to we can approximate any signal )(tx ,
closely by choosing a large enough value of Jj
and projecting the signal into JV using the basis
)(, tmJ , (all values of m ).
dtttxmcA mJ )()()( ,0
(3)
From these we can approximately recover the signal as:
)()()( ,0 tmcAtx mJ
m
(4)
In effect, we replace the signal )(tx , by the
approximate signal given by the projection
coefficients, )(0 mcA . After this approximation the
signal is now in the space JV and we can be
decomposed it using the subspaces nJV
and nJW
with their bases )(, tknJ and )(, tknJ . It is to
be noted that the scale is 11 JJJ VWV getting
larger and larger as the index nJ gets more
negative [23].If we take 1n we get: Using the basis
)(,1 tkJ in 1JW and )(,1 tkJ in 1JV we
have:
)()(
)()()()(
)()()(
11
,11,11
,0
tDtA
tkcDtkcA
tmcAtx
kJ
k
kj
k
mJ
m
(5)
As before, we call the signals )(1 tA and )(1 tD the
approximation and detail at level 1.We call the
coefficients )(1 kcA and )(1 kcD the approximation
coefficients and the detail coefficients at level 1. We
can further decompose )(1 tA to get [12]:
)()()(
)()()()()()(
)()()(
122
,11,22,22
11
tDtDtA
kkcDtkcDtkcA
tDtAtx
kJ
k
kJ
k
kJ
k
(6)
III. MODELING OF THREE PHASE
POWER TRANSFORMER
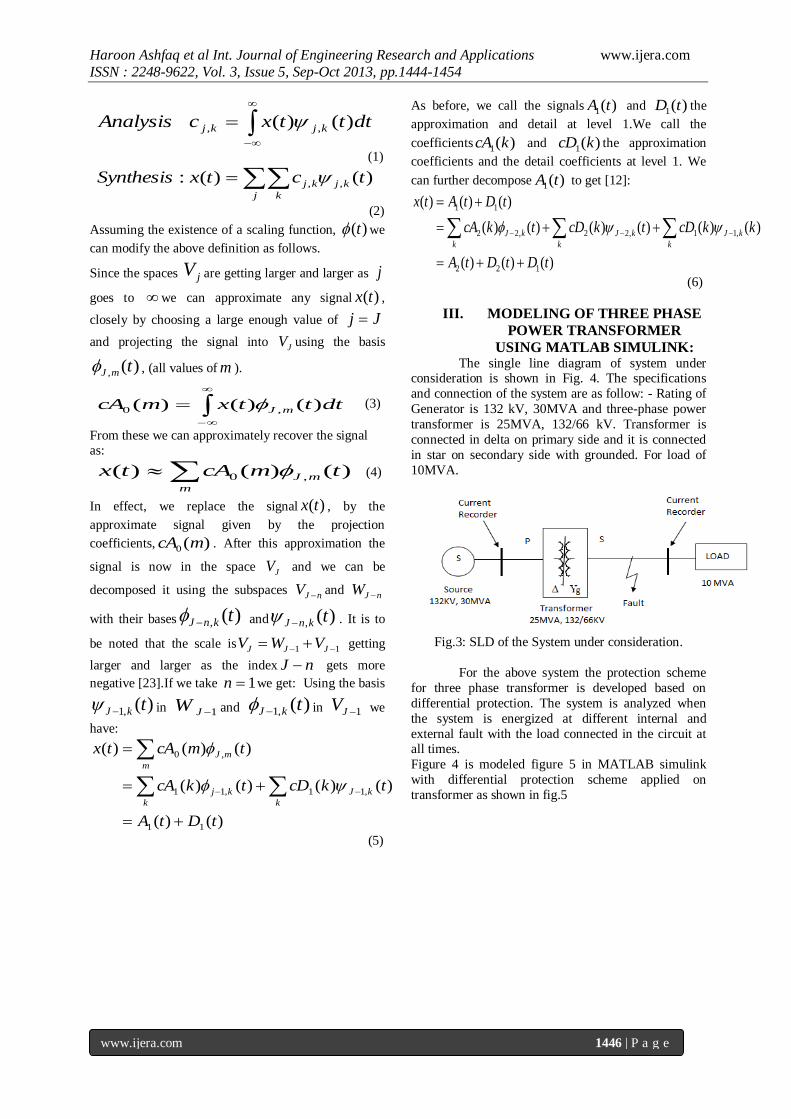
USING MATLAB SIMULINK: The single line diagram of system under
consideration is shown in Fig. 4. The specifications
and connection of the system are as follow: - Rating of
Generator is 132 kV, 30MVA and three-phase power
transformer is 25MVA, 132/66 kV. Transformer is
connected in delta on primary side and it is connected
in star on secondary side with grounded. For load of
10MVA.
Fig.3: SLD of the System under consideration.
For the above system the protection scheme
for three phase transformer is developed based on
differential protection. The system is analyzed when
the system is energized at different internal and
external fault with the load connected in the circuit at all times.
Figure 4 is modeled figure 5 in MATLAB simulink
with differential protection scheme applied on
transformer as shown in fig.5
Haroon Ashfaq et al Int. Journal of Engineering Research and Applications www.ijera.com
ISSN : 2248-9622, Vol. 3, Issue 5, Sep-Oct 2013, pp.1444-1454
www.ijera.com 1447 | P a g e
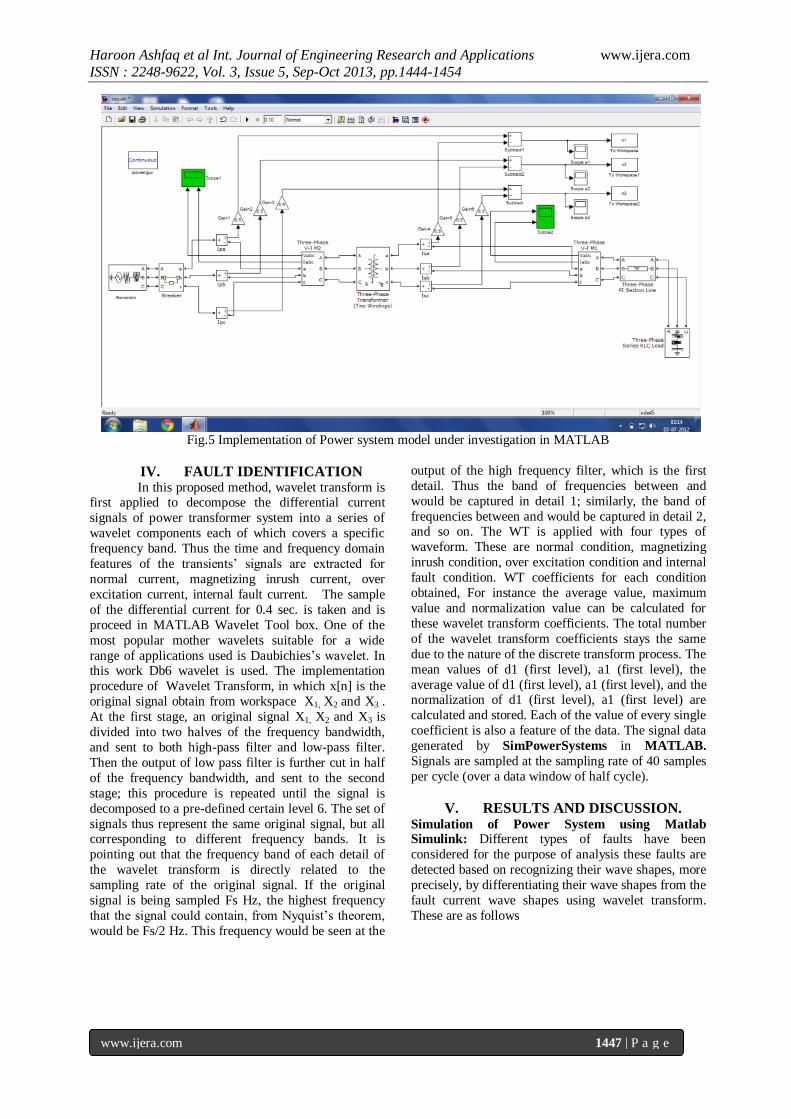
Fig.5 Implementation of Power system model under investigation in MATLAB
IV. FAULT IDENTIFICATION In this proposed method, wavelet transform is
first applied to decompose the differential current
signals of power transformer system into a series of
wavelet components each of which covers a specific
frequency band. Thus the time and frequency domain
features of the transients’ signals are extracted for
normal current, magnetizing inrush current, over
excitation current, internal fault current. The sample
of the differential current for 0.4 sec. is taken and is
proceed in MATLAB Wavelet Tool box. One of the
most popular mother wavelets suitable for a wide
range of applications used is Daubichies’s wavelet. In this work Db6 wavelet is used. The implementation
procedure of Wavelet Transform, in which x[n] is the
original signal obtain from workspace X1, X2 and X3 .
At the first stage, an original signal X1, X2 and X3 is
divided into two halves of the frequency bandwidth,
and sent to both high-pass filter and low-pass filter.
Then the output of low pass filter is further cut in half
of the frequency bandwidth, and sent to the second
stage; this procedure is repeated until the signal is
decomposed to a pre-defined certain level 6. The set of
signals thus represent the same original signal, but all corresponding to different frequency bands. It is
pointing out that the frequency band of each detail of
the wavelet transform is directly related to the
sampling rate of the original signal. If the original
signal is being sampled Fs Hz, the highest frequency
that the signal could contain, from Nyquist’s theorem,
would be Fs/2 Hz. This frequency would be seen at the
output of the high frequency filter, which is the first
detail. Thus the band of frequencies between and
would be captured in detail 1; similarly, the band of
frequencies between and would be captured in detail 2, and so on. The WT is applied with four types of
waveform. These are normal condition, magnetizing
inrush condition, over excitation condition and internal
fault condition. WT coefficients for each condition
obtained, For instance the average value, maximum
value and normalization value can be calculated for
these wavelet transform coefficients. The total number
of the wavelet transform coefficients stays the same
due to the nature of the discrete transform process. The
mean values of d1 (first level), a1 (first level), the
average value of d1 (first level), a1 (first level), and the normalization of d1 (first level), a1 (first level) are
calculated and stored. Each of the value of every single
coefficient is also a feature of the data. The signal data
generated by SimPowerSystems in MATLAB.
Signals are sampled at the sampling rate of 40 samples
per cycle (over a data window of half cycle).
V. RESULTS AND DISCUSSION. Simulation of Power System using Matlab Simulink: Different types of faults have been
considered for the purpose of analysis these faults are
detected based on recognizing their wave shapes, more
precisely, by differentiating their wave shapes from the
fault current wave shapes using wavelet transform.
These are as follows
Haroon Ashfaq et al Int. Journal of Engineering Research and Applications www.ijera.com
ISSN : 2248-9622, Vol. 3, Issue 5, Sep-Oct 2013, pp.1444-1454
www.ijera.com 1448 | P a g e
Normal current Condition
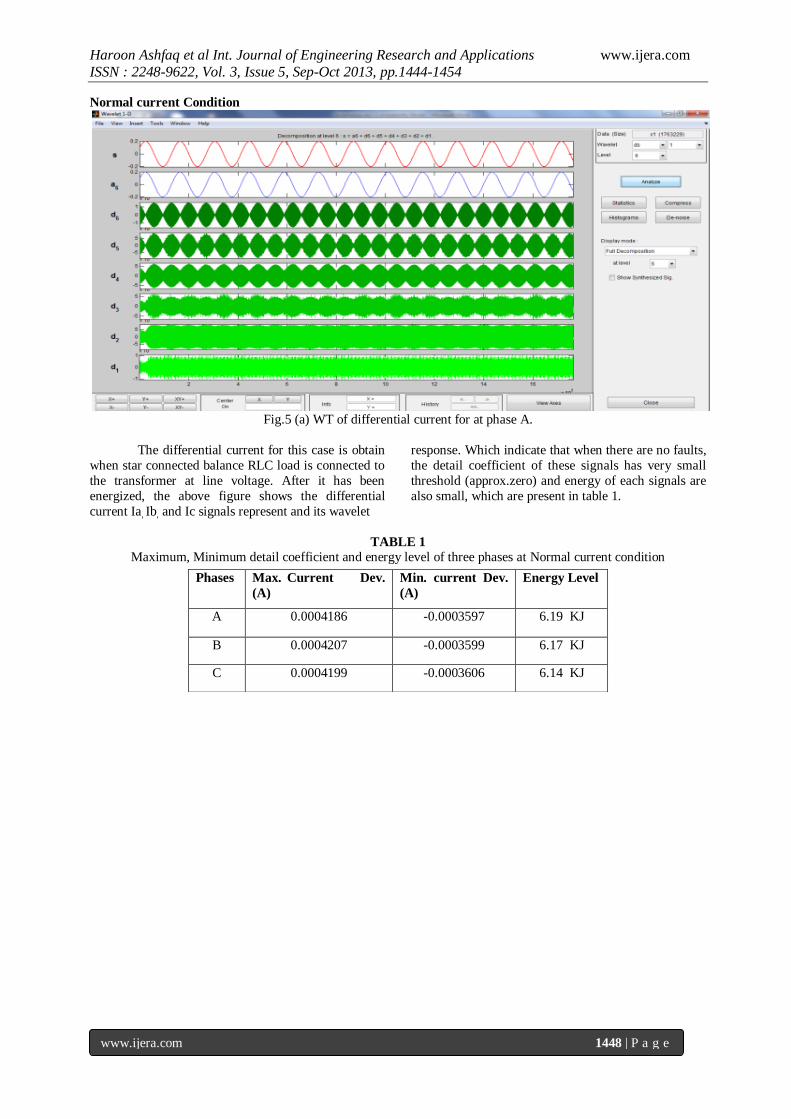
Fig.5 (a) WT of differential current for at phase A.
The differential current for this case is obtain
when star connected balance RLC load is connected to
the transformer at line voltage. After it has been
energized, the above figure shows the differential
current Ia, Ib, and Ic signals represent and its wavelet
response. Which indicate that when there are no faults,
the detail coefficient of these signals has very small
threshold (approx.zero) and energy of each signals are
also small, which are present in table 1.
TABLE 1
Maximum, Minimum detail coefficient and energy level of three phases at Normal current condition
Phases Max. Current Dev.
(A)
Min. current Dev.
(A)
Energy Level
A 0.0004186 -0.0003597 6.19 KJ
B 0.0004207 -0.0003599 6.17 KJ
C 0.0004199 -0.0003606 6.14 KJ
Haroon Ashfaq et al Int. Journal of Engineering Research and Applications www.ijera.com
ISSN : 2248-9622, Vol. 3, Issue 5, Sep-Oct 2013, pp.1444-1454
www.ijera.com 1449 | P a g e
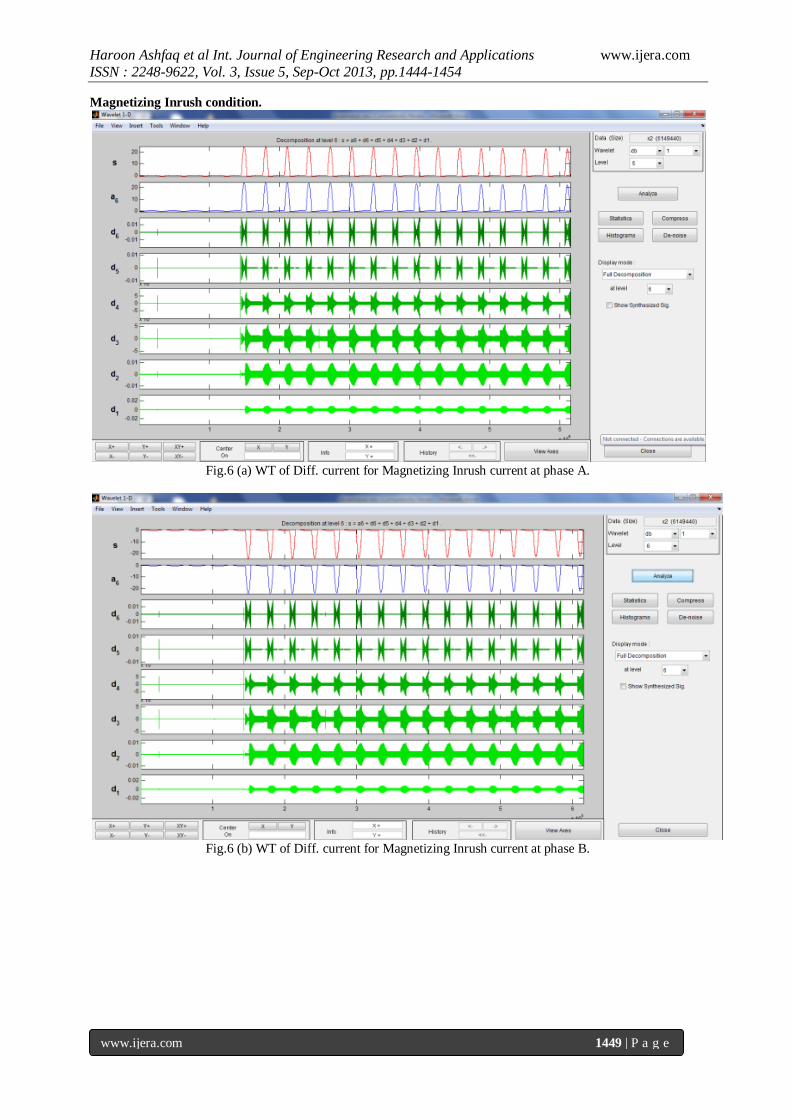
Magnetizing Inrush condition.
Fig.6 (a) WT of Diff. current for Magnetizing Inrush current at phase A.
Fig.6 (b) WT of Diff. current for Magnetizing Inrush current at phase B.
Haroon Ashfaq et al Int. Journal of Engineering Research and Applications www.ijera.com
ISSN : 2248-9622, Vol. 3, Issue 5, Sep-Oct 2013, pp.1444-1454
www.ijera.com 1450 | P a g e
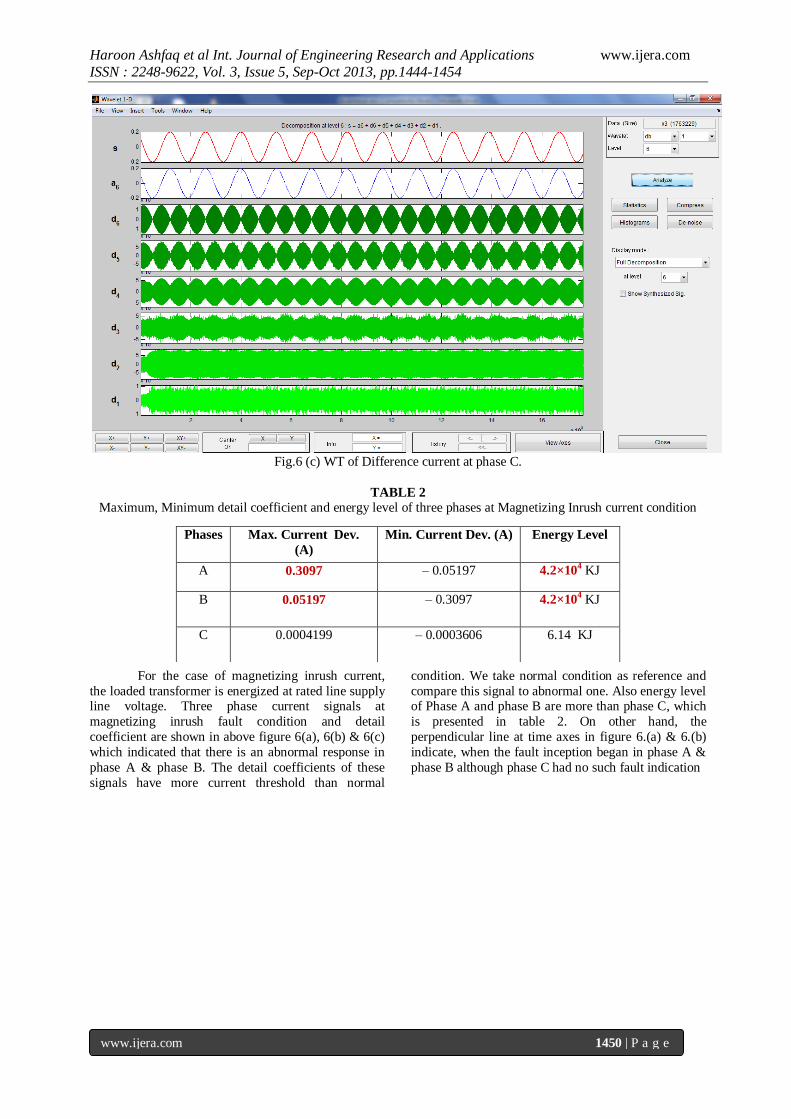
Fig.6 (c) WT of Difference current at phase C.
TABLE 2
Maximum, Minimum detail coefficient and energy level of three phases at Magnetizing Inrush current condition
For the case of magnetizing inrush current,
the loaded transformer is energized at rated line supply line voltage. Three phase current signals at
magnetizing inrush fault condition and detail
coefficient are shown in above figure 6(a), 6(b) & 6(c)
which indicated that there is an abnormal response in
phase A & phase B. The detail coefficients of these
signals have more current threshold than normal
condition. We take normal condition as reference and
compare this signal to abnormal one. Also energy level of Phase A and phase B are more than phase C, which
is presented in table 2. On other hand, the
perpendicular line at time axes in figure 6.(a) & 6.(b)
indicate, when the fault inception began in phase A &
phase B although phase C had no such fault indication
Phases Max. Current Dev.
(A)
Min. Current Dev. (A) Energy Level
A 0.3097 – 0.05197 4.2×10⁴ KJ
B 0.05197 – 0.3097 4.2×10⁴ KJ
C 0.0004199 – 0.0003606 6.14 KJ
Haroon Ashfaq et al Int. Journal of Engineering Research and Applications www.ijera.com
ISSN : 2248-9622, Vol. 3, Issue 5, Sep-Oct 2013, pp.1444-1454
www.ijera.com 1451 | P a g e
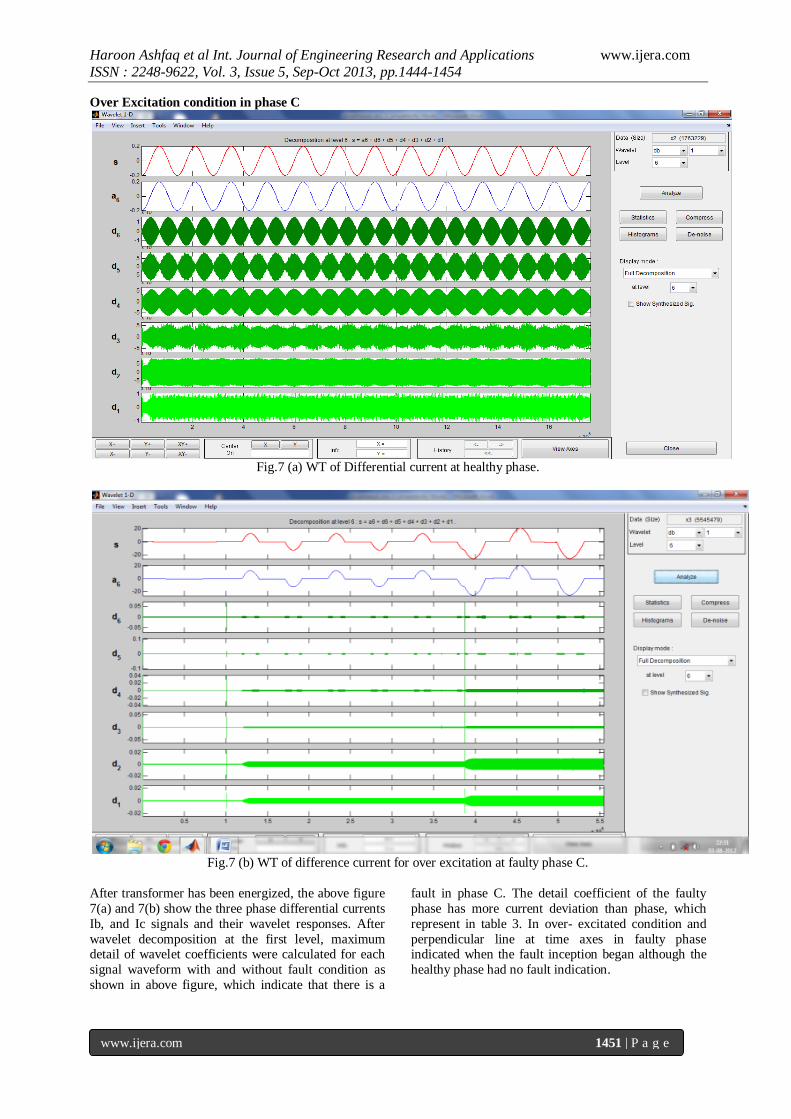
Over Excitation condition in phase C
Fig.7 (a) WT of Differential current at healthy phase.
Fig.7 (b) WT of difference current for over excitation at faulty phase C.
After transformer has been energized, the above figure
7(a) and 7(b) show the three phase differential currents
Ib, and Ic signals and their wavelet responses. After
wavelet decomposition at the first level, maximum detail of wavelet coefficients were calculated for each
signal waveform with and without fault condition as
shown in above figure, which indicate that there is a
fault in phase C. The detail coefficient of the faulty
phase has more current deviation than phase, which
represent in table 3. In over- excitated condition and
perpendicular line at time axes in faulty phase indicated when the fault inception began although the
healthy phase had no fault indication.
Haroon Ashfaq et al Int. Journal of Engineering Research and Applications www.ijera.com
ISSN : 2248-9622, Vol. 3, Issue 5, Sep-Oct 2013, pp.1444-1454
www.ijera.com 1452 | P a g e
TABLE 3
Maximum, minimum detail coefficient and energy level of three phases at over excitation condition.
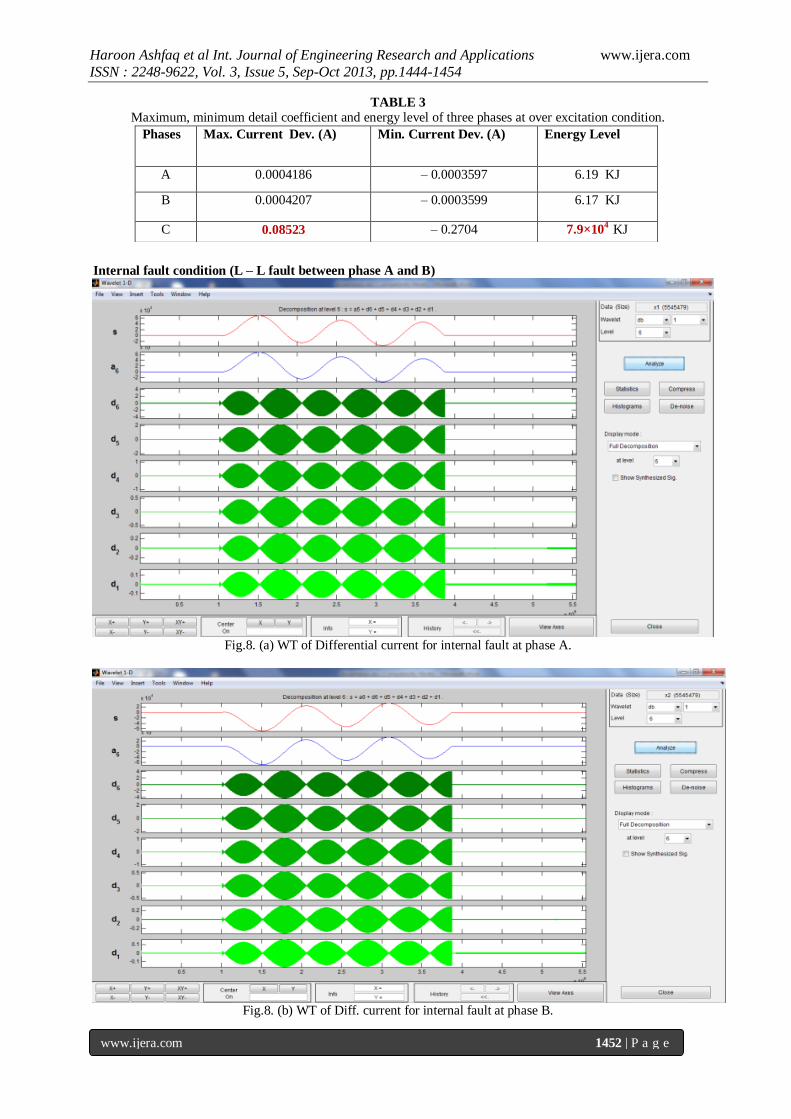
Internal fault condition (L – L fault between phase A and B)
Fig.8. (a) WT of Differential current for internal fault at phase A.
Fig.8. (b) WT of Diff. current for internal fault at phase B.
Phases Max. Current Dev. (A) Min. Current Dev. (A) Energy Level
A 0.0004186 – 0.0003597 6.19 KJ
B 0.0004207 – 0.0003599 6.17 KJ
C 0.08523 – 0.2704 7.9×10⁴ KJ
Haroon Ashfaq et al Int. Journal of Engineering Research and Applications www.ijera.com
ISSN : 2248-9622, Vol. 3, Issue 5, Sep-Oct 2013, pp.1444-1454
www.ijera.com 1453 | P a g e
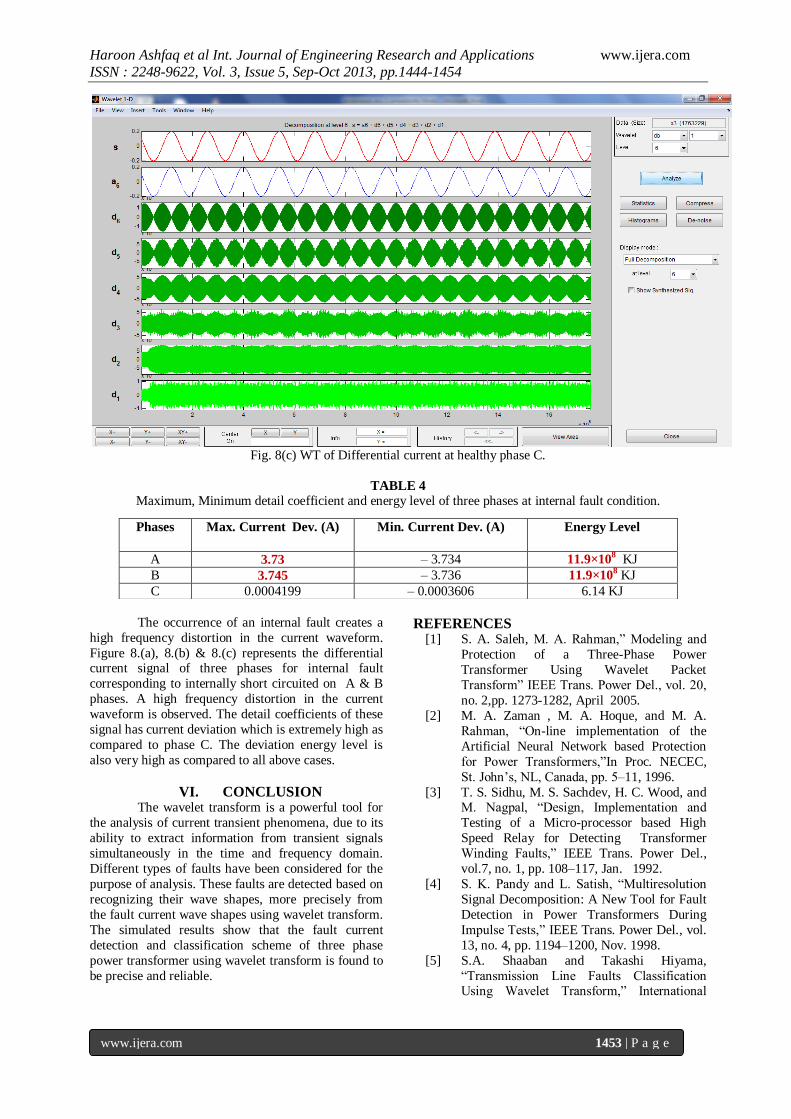
Fig. 8(c) WT of Differential current at healthy phase C.
TABLE 4
Maximum, Minimum detail coefficient and energy level of three phases at internal fault condition.
The occurrence of an internal fault creates a
high frequency distortion in the current waveform.
Figure 8.(a), 8.(b) & 8.(c) represents the differential current signal of three phases for internal fault
corresponding to internally short circuited on A & B
phases. A high frequency distortion in the current
waveform is observed. The detail coefficients of these
signal has current deviation which is extremely high as
compared to phase C. The deviation energy level is
also very high as compared to all above cases.
VI. CONCLUSION The wavelet transform is a powerful tool for
the analysis of current transient phenomena, due to its
ability to extract information from transient signals
simultaneously in the time and frequency domain.
Different types of faults have been considered for the
purpose of analysis. These faults are detected based on
recognizing their wave shapes, more precisely from
the fault current wave shapes using wavelet transform.
The simulated results show that the fault current
detection and classification scheme of three phase
power transformer using wavelet transform is found to
be precise and reliable.
REFERENCES [1] S. A. Saleh, M. A. Rahman,” Modeling and
Protection of a Three-Phase Power
Transformer Using Wavelet Packet
Transform” IEEE Trans. Power Del., vol. 20,
no. 2,pp. 1273-1282, April 2005.
[2] M. A. Zaman , M. A. Hoque, and M. A.
Rahman, “On-line implementation of the
Artificial Neural Network based Protection
for Power Transformers,”In Proc. NECEC,
St. John’s, NL, Canada, pp. 5–11, 1996.
[3] T. S. Sidhu, M. S. Sachdev, H. C. Wood, and M. Nagpal, “Design, Implementation and
Testing of a Micro-processor based High
Speed Relay for Detecting Transformer
Winding Faults,” IEEE Trans. Power Del.,
vol.7, no. 1, pp. 108–117, Jan. 1992.
[4] S. K. Pandy and L. Satish, “Multiresolution
Signal Decomposition: A New Tool for Fault
Detection in Power Transformers During
Impulse Tests,” IEEE Trans. Power Del., vol.
13, no. 4, pp. 1194–1200, Nov. 1998.
[5] S.A. Shaaban and Takashi Hiyama,
“Transmission Line Faults Classification Using Wavelet Transform,” International
Phases Max. Current Dev. (A) Min. Current Dev. (A) Energy Level
A 3.73 – 3.734 11.9×10⁸ KJ
B 3.745 – 3.736 11.9×10⁸ KJ
C 0.0004199 – 0.0003606 6.14 KJ
Haroon Ashfaq et al Int. Journal of Engineering Research and Applications www.ijera.com
ISSN : 2248-9622, Vol. 3, Issue 5, Sep-Oct 2013, pp.1444-1454
www.ijera.com 1454 | P a g e
MEPCON’10, Cairo University, Egypt, paper
ID 225, December 2010.
[6] I. Daubechies, "Ten Lectures on Wavelets",
Society for Industrial and Applied
Mathematics, Philadelphia, Pa, 1992.
[7] A.H. OSMAN, O.P. MALIK, "Protection of Parallel Transmission Lines Using Wavelet
Transform", IEEE Transactions on Power
Delivery .vol. 19, no. 1, pp. 49-55, 2004.
[8] O. A. S. Youssef, "Fault Classification Based
On Wavelet Transforms," IEEE T&D
Conference., Atlanta, GA, Oct. 28- Nov. 2,
2001.
[9] D. Das, N.K. Singh and A.K Singh, "A
Comparison of Fourier Transform and
Wavelet Transform Methods for Detection
and Classification of Faults on Transmission
Lines", IEEE Power India Conference, New Delhi, 10¬12 April 2006.
[10] C. K. Chui, Wavelets: A Mathematical Tool
for signal processing. Philadelphia, PA:
SIAM, 1997.
[11] O. S. Youssef, “A wavelet- based technique
for discrimination between
faults and inrush currents in transformers,”
IEEE Trans.Power Del., vol.18, no. 1, pp.
170-176, jan.2003.
BIOGRAPHY
Haroon Ashfaq was born in in the Aligarh,
India, on January 17, 1978. He received the B.Tech. M.Tech. and Ph.D. degrees in Electrical Engineering
from AMU, Aligarh, India. He is currently working as
Assistant Professor in the Department of Electrical
Engineering, Jamia Millia Islamia, New Delhi. His
research interests include renewable energy, hybrid
systems, electric drives, switch gear and protection.
Mohammad Noorullah Quadri, has completed
his Master of Technology in Electrical Power System Management from Jamia Millia Islamia, New Delhi,
India in 2012 and currently he is Design Engineer in
N_ Arc Consulting, New Delhi, India.


![1935. Fault diagnosis of gearboxes using wavelet support ... · Zeng [30] developed an intelligent fault diagnosis procedure based on wavelet packet transform (WPT) and hybrid SVM](https://img.pdfslide.net/doc/110x75/5ffde5fc9f248533cc39c91d/1935-fault-diagnosis-of-gearboxes-using-wavelet-support-zeng-30-developed.jpg)