Embed Size (px)
Citation preview

Fault Detection of Power Electronic Circuit
using Wavelet Analysis in Modelica
Jianbo Gao*, Yang Ji**, Johann Bals**, Ralph Kennel*
*Technische Universität München
Arcisstr. 21, 80333 Munich, Germany
[email protected], [email protected]
** German Aerospace Center
Muenchner Str. 20, 82234 Wessling, Germany
[email protected], [email protected]
Abstract
In more electric aircrafts (MEA) the electric pow-
er network is important for the reliability. To prevent
severe faults it is the key issue to identify the faults
in the early stage before a complete failure happens.
In this paper an early stage fault detection method
using wavelet multi-resolution analysis (MRA) for a
regulated buck DC-DC converter is studied. Specifi-
cally, the electrolyte input capacitor is diagnosed.
The study was carried out using simulation with
Modelica / Dymola. The fault features that were ex-
tracted from different levels of wavelet decomposi-
tion provided clear information for both fast and
slow occurring faults. This method showed signifi-
cant advantages compared with filter techniques. It is
concluded that wavelet transform is a suitable tool
for early stage fault detection of the power electron-
ics in MEA. In addition, the simulation language
Modelica provides a convenient possibility for the
quick design of fault detection strategy.
Keywords: power electronics; DC-DC converter;
fault detection; wavelet; Modelica; Dymola
1 Introduction
1.1 Motivation
The concept of More Electric Aircraft (MEA) is
attracting increasing interest in the aircraft industry
not only because of its potential in energy optimiza-
tion, but also due to its significant advantages con-
cerning weight, maintenance requirements, liability
and passenger comfort [1]. For this, the electrical
power distribution network is playing a more im-
portant role and facing increasing challenges in the
prognosis and accurate localization of faulty units in
an even more complex power network. In order to
obtain maximum flight reliability and minimum
maintenance efforts, advanced failure analysis tech-
nologies shall be applied to ensure correct and quick
fault detection and isolation. It is well known that an
output voltage regulated DC/DC power converter
supplying constant power loads could de-stabilize
the network stability due to the degraded perfor-
mance of its input filter. The sensitivity study of in-
put filter parameters concerning the network stability
addressed in [2] reveals that the observation of de-
graded degree of the capacitor in the input filter can
significantly increase the network reliability.
1.2 State of the art
Reviewing the considerable development of fault
diagnosis techniques and many successful applica-
tions attached to them in the last time [3] [4] [5],
power systems keep a challenge for fault detection.
For overcoming this challenge intelligent methods
like artificial neural networks have shown their pos-
sibilities in this field [6]. Besides, the analytical
model based technology is also obtaining more atten-
tion [7] [8] [9].
Signal-based methods, e.g. Fourier transform and
wavelet transform, also provide other possibilities to
perform the fault detection and isolation. With the
rash development of the new mathematical tool,
wavelet transform [10], a great amount of studies
have been done in different fields for fault detection.
Some attempts have also been made in power elec-
tronics for fault detection [11] [12]. The implementa-
tion of wavelet transform for the post processing of
Modelica simulation data has been seen, for exam-
ple, in a study of vehicle steering, where wavelet
transform was carried out in the software Matlab for
calculating power spectra [13].
DOI Proceedings of the 9th International Modelica Conference 513 10.3384/ecp12076513 September 3-5, 2012, Munich, Germany

1.3 Main contributions
Modelica was developed as a free, object-oriented
and equation-based modeling language. It has signif-
icant benefits such as easy reusability of models and
multi-domain modeling capability. In combination
with the simulation environment Dymola, a conven-
ient platform is provided to the complete model-
based design and the integration of MEA systems
[14]. In contrast to the excellent performance in
modeling and simulation, Modelica only supports
limited signal analysis features [15], which are actu-
ally crucial for the fault analysis and virtual testing
activities in the verification and validation phase of
the system development.
This work focuses on the fast design of a fault de-
tection strategy of on board power supply units in
MEA with wavelet transform using Modelica simu-
lation. To realize this, a wavelet library for Modelica
is being developed. Multi-Resolution Analysis
(MRA) of wavelet technology is applied to detect the
failure of electrolyte capacitors in a very early stage.
In addition, the design process using Modelica
simulation shows high flexibility and efficiency. It is
possible to identify the most important failure fea-
tures and helps to design a effective fault detection
strategy within only a short time.
2 Wavelet transform
2.1 Definition
Wavelet transform could be considered as a fur-
ther development of Fourier transform, or more pre-
cisely, of short time Fourier transform (STFT) [16].
Using STFT, people try to localize the signal chang-
ing with time by selecting suitable time window.
This transformation, however, is limited in time-
frequency resolution capability due to the uncertainty
principle. Wavelet transform overcomes this prob-
lem. This transform is defined as [10]:
. (1)
It is described as the wavelet transform of the
square-integrable function, f, using wavelet function,
ψ, at dilation (or scale), a, and position (or transla-
tion), b. The bar above function, ψ, stands for conju-
gation. For the given a and b, the transform result is
a single real number, a wavelet coefficient.
Obviously wavelet transform is the integral of the
multiplication of the signal, f, with a wavelet func-
tion, ψ. It has the same form as the STFT. However,
not like STFT, where only sine and cosine functions
are used for the transformation, wavelet transform
uses different wavelet functions, which can be se-
lected according to the specific problems from a
principally unlimited set. Nevertheless, the wavelet
function must fulfill some conditions; namely, it
must be an orthonormal function. The precise math-
ematical description of orthonormality is easily
found in almost every book about wavelet transform,
e.g. [10], and is not repeated here.
Parameter, a, defines the width and height of the
wavelet function, ψ. A smaller scale, a, makes ψ nar-
rower; thus the wavelet represents fast changes and
the transform focuses on the high frequency compo-
nents of the signal. Parameter, b, shifts the wavelet
function along the time axis, so that the transform
represents different locations of the signal. Using
different values of scale, a, and position, b, it is able
to observe the signal at different position and in dif-
ferent frequency range with only one transformation.
Thanks to these special properties, wavelet transform
is especially suitable for analyzing changing pro-
cesses.
Two forms of wavelet transform are available.
They are continuous wavelet transform (CWT) and
discrete wavelet transform (DWT). In CWT both
scale and position parameters are continuous real
values. CWT expresses the signal changes in contin-
uous details. It is more suitable for visual examina-
tion. In this work only DWT is used, which will be
described in more detail in the next section.
2.2 Discrete wavelet transform
In DWT only discrete values of the scale and lo-
cation parameters are used. The values are selected
in a discrete form, namely
, (2)
where and . The transform re-
sults, i.e. the wavelet coefficients, are therefore also
discrete.
In the numeric calculation of DWT, an extra scal-
ing function, in addition to the wavelet function, is
used to carry out a complete and efficient DWT. The
scaling function represents the low frequency com-
ponents of the signal. It is orthogonal to its own dis-
crete translations and to all wavelet functions. The
wavelet and the scaling functions with the discrete
scaling and translation parameters build a complete
orthogonal basis of the Hilbert space. The DWT is
thus another representation of the time signal.
As an example, Figure 1 shows the form of the
third order Daubechies scaling and wavelet functions
and their Fourier transforms [17].
Fault Detection of Power Electronic Circuit using Wavelet Analysis in Modelica
514 Proceedings of the 9th International Modelica Conference DOI September 3-5, 2012, Munich Germany 10.3384/ecp12076513

Figure 1: The third order Daubechies scaling and wavelet func-
tions (a) and their Fourier transforms (b)
From the Fourier transforms it can be seen that
the scaling function covers lower frequency range
while the wavelet function stretches in a higher fre-
quency range. From this point of view, DWT is actu-
ally the division of the time signal into different fre-
quency bands. Thus, it is straightforward to under-
stand that the calculation of DWT is realized using
filter banks. In inverse DWT the calculation is simi-
lar. This process is illustrated in Figure 2.
Figure 2: DWT and inverse DWT calculation using filter banks
DWT transforms the original sequence in two
new series:
(1) the approximation coefficients, cA(k), represent-
ing the low frequency components, obtained us-
ing the low pass filter for decomposition, hd0,
and
(2) the detail coefficients, cD(k), representing the
high frequency components, obtained using the
high pass filter for decomposition, hd1.
The symbol ↓2 means down sampling. The opera-
tion is to delete one from every two adjacent coeffi-
cients, in order to remove the redundant information.
The inverse DWT carries out the reversed operation.
The operator, ↑2, expands a coefficient series by in-
serting a zero between every two adjacent elements.
After that the two series pass through the filter bank,
and added together to get the original signal.
2.3 Multi-resolution analysis
Considering the DWT process shown in Figure 2,
sequence, cA(k), which represents the low frequency
components can be further divided into a lower fre-
quency part and a higher frequency part inside the
frequency range of cA(k). This process is repeated
and a series of coefficient sequences representing
different frequency ranges is obtained, as shown in
Figure 3:
Figure 3: Multi-resolution analysis using DWT
This is the wavelet multi-resolution analysis
(MRA). The output of this operation, cD1, cD2, …,
cDn and cAn, are different levels of DWT coeffi-
cients, representing the signal components from
higher to lower frequencies. Here the original signal
is treated as the lowest level of approximation coef-
ficients. This analysis provides a convenient tool to
observe different frequency components of the signal
depending on time.
2.4 Wavelet analysis for fault detection
Wavelet transform is a powerful tool in signal
processing for the detection of changing events. This
feature is suitable for fault detection since a fault in a
system can be treated as a deviation compared to the
normal state.
When a fault occurs, specific changes will appear
in the sensor signal. Usually, it is known that the
fault signal is located in a certain frequency range,
but the exact frequency is often unknown or not con-
stant. This problem can be handled with wavelet
MRA. For that, the signal containing fault infor-
mation is firstly decomposed in several levels. And
in one or more levels, where the fault signal frequen-
cy is located, faults features will be observed.
3 Wavelet fault detection in a MEA
power network system
Based on the properties of wavelet transform in
signal processing, this new mathematic tool is used
for fault detection in a MEA power network system
in this study. Specifically, the MRA is used here to
detect the capacitance drop of the input capacitor in a
DC-DC buck converter for the early stage failure.
3.1 The problem
The buck converter is described with the diagram
shown in Figure 4.
0 1 2 3 4 f
0
1
0 1 2 3 4 t
-1
0
1
2
Wavelet function
Scaling
function
(a) (b)
Wavelet function
Scaling function
hd0 ↓2
hd1 ↓2
f(k)
cA(k)
cD(k)
cA(k)
cD(k)
↑2
↑2
hr0
hr1
f(k)
DWT Inverse DWT
+
hd0 ↓2
hd1 ↓2
f(k)
cA1(k)
cD1(k)
hd0 ↓2
hd1 ↓2
cA2(k)
cD2(k)
hd0 ↓2
hd1 ↓2
cA3(k)
cD3(k)
. . .
Session 4D: Electromagnetic Systems II
DOI Proceedings of the 9th International Modelica Conference 515 10.3384/ecp12076513 September 3-5, 2012, Munich, Germany

Figure 4: Diagram of the Buck converter under study
The converter operates in constant load power
mode by keeping a constant output voltage, which is
adjusted through the duty cycle of the pulse width
modulation (PWM) switching signal, which operates
with a constant frequency. Based on the converter
property the system is sensible to the value changes
of the components on the input side, where the input
capacitor, Cin, is especially critical because it is usu-
ally an electrolyte type, which has significantly low-
er feasibility and shorter lift time compared with oth-
er components. Base on this reason, the early fault
detection is focused on Cin.
Four parameters of the circuit can be convenient-
ly measured by voltage and current sensors. They
are, referring to Figure 4, Uout, Iout, Iin and Uin,
ordered from higher to lower ease of availability.
Since the load is pure resistive constant load, the
output current signal will contain the same infor-
mation as the output voltage. And Uout will be used
any way for the controller as feedback, the equip-
ment of a sensor for output current is therefore not
necessary, at the least for fault detection.
Since a stable output voltage is the control objec-
tive of the circuit, the influence of Cin would be
compensated by the controller very quickly. As a
consequence only very few fault information would
be propagated to the output side. The fault detection
using Uout is therefore not feasible.
The input voltage is not a good signal for fault
detection, too, since it actually measures the input
power supply voltage, which is normally a voltage
source with very low impedance and thus hardly be
influenced by Cin.
The input current is the last possibility; and it is
actually also a suitable signal for fault detection. The
reason is, for example, if its capacitance drops, it
means the energy capacity of the input circuit is re-
duced. In order to keep a constant energy flow to the
load, which is regulated by the controller, Cin would
have to be charged and discharged more deeply. This
will be reflected in the input current with larger fluc-
tuation. This estimation will be showed later in the
result section.
If an electrolyte capacitor approaches it life end,
its capacity would reduce slowly within a certain
time. However, sharp reduction or changing of ca-
pacitance might also occur. For fault detection, espe-
cially for early stage fault diagnosis, both stepping
type and slow changing of capacitor fault should be
considered.
3.2 Extraction of fault information
The first step is the extraction of the fault infor-
mation from the sensor signals. Supposing the meas-
ured signal is
, (3)
where x(k) is the signal in normal operation state,
and g(k) the additional signal in fault condition.
Using wavelet technology, the sensor signal f(k)
is decomposed with MRA using wavelet function, ψ,
to obtain wavelet coefficients in n levels:
,
,
(4)
where Di{.} represents the detail coefficients, and
Ai{.} stands for approximation coefficients. The term
Di{.} with smaller index, i, represents higher fre-
quency components, namely faster changing signals.
The signal, x, in the normal operation condition is
composed of the average value of the battery current,
which changes very slow, and the ripples caused by
the PWM controlling, which have a constant fre-
quency defined by the controller. The slower com-
ponents are transformed to the approximation coeffi-
cients, An{x}; and the components with PWM fre-
quency, which are higher frequency components, is
transformed to the very low level of Di{x}.
On the other hand, the fault signal, i.e. the infor-
mation of the reduction of Cin, is reflected by the
fluctuation of the input current. As it is known that
the fluctuation frequency is actually the PWM fre-
quency, most of the fault information is contained in
the PWM components, which means the lower levels
of detail coefficients, Di{g}. Depending on the fault
occurrence rate, complex fluctuation could take
place. This information will be carried by the PWM
frequency, too, but its own frequency components
are visible in other levels of Di{g}.
In any circumstance few information will be pre-
sent in very low frequency range, i.e. in An{g}.
Therefore, we can extract the fault information from
the input current signal simply by isolating some
levels of detail coefficients, Di{f}. Of course, the
PWM information will also be involved. It has to be
removed before the faults can be identified. Since
this frequency is known and it always has a very
high value, these components can be easily sup-
pressed with low pass filter or band stop filter.
Controller
Lin
CinCout
Lout
D
Transistor
Rlo
ad
Uout
IoutIin
Uin
Uout FeedbackPWM Switching
Fault Detection of Power Electronic Circuit using Wavelet Analysis in Modelica
516 Proceedings of the 9th International Modelica Conference DOI September 3-5, 2012, Munich Germany 10.3384/ecp12076513

3.3 Fault identification
After all irrelevant information is excluded the fi-
nal fault information is represented with a single val-
ue, changing according to the failure rate. The fault
can be simply identified by comparing it with a
known threshold.
4 Design of a fault detection strategy
using Modelica
Because of the aforementioned superior proper-
ties, Modelica simulation and wavelet transform
were selected for the quick design of a fault detec-
tion strategy for the power system in MEA. Since
wavelet transform is not available in the standard
Modelica libraries, a solution have to be found. A
seemingly direct solution would be the use of a se-
cond software tool, which provides wavelet analysis
capacity, such as Matlab from MathWorks. Some
practical reasons were faced, however. Firstly, the
use of such commercial software requires expensive
licenses. Secondly, a single program both for simula-
tion and data analysis is very desirable during the
work in order to have an integrated working process
and to avoid interfacing between two programs. It is
therefore more favourable to have the wavelet analy-
sis inside Modelica. In addition, this brings further
advantages in that the library can be a common tool
of Modelica, so that higher work efficiency will be
achieved in a long term.
4.1 Model of the power supply
The buck converter shown in Figure 4 is realized
with a Dymola model in Figure 5.
Figure 5: The Dymola model of the Buck converter for MEA
The voltage controller is a proportional-integral
regulator. The output voltage is set as 4.3 V. The
PWM frequency is defined with the trapezoidal
source as 50 kHz. The component fault is simulated
by reducing the value of the input capacitor, Cin,
with a ramp source. By setting the ramp, different
changing rate of the component value can be simu-
lated. The input current is measured by a current sen-
sor, which is explicitly put in the model only for
clarity, since the current values could actually be
read out directly from the corresponding compo-
nents, e.g. Rin or Lin. Other parameters are listed in
Table 1
Table 1: Parameters of the buck converter
Parameter Description Value
E Voltage source 54 V
Uref Reference output voltage 4.3 V
Lout Output inductance 29 μH
Cout Output capacitance 40 μF
Rload Load resistance 1.568 Ω
Lin Input filter inductance 10 μH
Cin Input filter capacitance 10 μF
Rin Input resistance 0.025 Ω
Kp Propotional controller gain 0.06
Ki Integral controller gain 4.9
4.2 Wavelet transform in Modelica
The structure of the wavelet toolbox developed
for Modelica is shown in Figure 6. At the moment of
this report the wavelet library is under development
within the frame of Clean-Sky project organized by
European Union. It is expected to be a general
Modelica library with wavelet transform and some
related functionality for different signal processing
purposes. This library is used for post processing of
the simulation result data and cannot be embedded
into simulation models. So far the core library func-
tions have been realized and wavelet DWT and
MRA can be implemented for the reported work.
Figure 6: Structure of the intended Modelica wavelet library (the
functions with dark background will be designed depending on
the work process)
ground
R=
0.0
25
Rin
L=10e-6
Lin
U0
+-
E
k=54
T
D
trapezoid
period=2e-5
onOffController
refe…
u
Ki
I
k=4.9
k=0.06
Kp
add
+1
+1
add
+
+1
+1
-
fb
Uref
k=4.3
L=29e-6
Lout
C=
40
e-6
Co
ut
R=
1.5
68
Rlo
ad
V
Uo
ut
A
Iin
Cin
ramp
duration=0.1
TransformationsUser‘s Guide
1-D Continuous Wavelets(Functions, Blocks, …)
1-D Discrete Wavelets(Functions, Blocks, …)
Examples(MSA, de-noising, …)
2-D Discrete Wavelets(Functions, Blocks, …)
Wavelet Packets(1-D, 2-D; Functions, Blocks, …)
Basics
General FunctionsWavelet Families(Functions)
Applications
Multi-Resolution Analysis(Functions, Blocks, GUI, …)
Display Wavelets
Interfaces
Session 4D: Electromagnetic Systems II
DOI Proceedings of the 9th International Modelica Conference 517 10.3384/ecp12076513 September 3-5, 2012, Munich, Germany

4.3 Process for simulation and fault detection
As mentioned in the problem description (section
3.1) the input current signal is used for fault detec-
tion. At first the model will be simulated with differ-
ent reduction rates of the Cin capacitance. The re-
duction rates were selected between 1 and 100 ms
with a capacitance drop from 10 to 8 μF, correspond-
ing to 20% capacitance loss. With this fault level the
system can still operate normally. However, a 20%
reduction indicates a high possibility of a complete
failure of the capacitor in the near future. The reduc-
tion is applied at 0.1 s after the startup of the simula-
tion so that the system can achieve a stable state be-
fore the faults could occur.
After simulation, the data segment containing the
fault event will be read out from the simulation result
data file. It is converted to equidistant time series
with a sampling rate of 200 kHz. Equidistant sam-
pling is the requirement of wavelet transform and
most other signal processing methods. The fault de-
tection process is illustrated in Figure 7.
Figure 7: Process for simulation and fault detection using wave-
let transform
To simulate the real world, a white noise signal
with normal distribution is added on the input current
signal. After that, MRA is applied on the data. The
wavelet function used here was the third order
Daubechies function shown in Figure 1. The detail
coefficients in the DWT result are extracted and their
absolute values are calculated since only the magni-
tude of the DWT coefficients contains fault infor-
mation. To remove the high frequency PWM com-
ponent, second order Butterworth low pass filter is
used. The filter cut off frequency is set as 0.5 kHz,
much lower than that of the PWM frequency, in or-
der to suppress a large part of the noise signal, too.
After this step, different fault features can be visually
identified and suitable fault detection methods can be
established.
4.4 Results
The tests with different parameters were carried
out. Figure 8 and Figure 9 give two examples with
slow and fast changing faults, respectively. Since all
fault features mainly present in the first three levels
of the wavelet decomposition, only these coefficients
are shown in the figures.
It was noticed that the fault features differed sig-
nificantly between fast and slow changing rates. For
the changing rates faster than 5 ms, a pulse feature
appeared in almost every level of the wavelet detail
coefficients. This is well seen in Figure 8, where
20% capacitance drop took place within 1 ms. In the
first MRA level the feature magnitude changed from
55 to 70 mA with the fault. In the other two higher
levels the fault event was extra present with pulses.
The magnitude of the pulses increased with the
changing rate. The pulses appeared in other higher
decomposition level, too. However, in level three it
was significantly higher than those in other levels.
For the fault with 1 ms dropping time, as shown in
Figure 8, the pulse peak reached almost 100 mA in
level 3. The simulation showed that for the dropping
time up to 5 ms, the peak height reduced linearly to
about 20 mA.
For the changing rates slower than 5 ms, the fault
features were only significant in the lowest level of
the wavelet MRA coefficients. Figure 9 shows an
example, where the 20% capacitance drop took 100
ms time. Now only the first wavelet decomposition
level contained a fault feature: the feature magnitude
changed from about 55 to 70 mA linearly with the
reduction of the capacitance. This was the same as
the level 1 feature in fast changing faults. For even
lower changing rates this linear relationship was al-
ways present. Not like in the case of fast changing
fault, no significant features were observed in other
decomposition levels.
Based on the simulation study, the following fault
detection strategy can be defined for early stage fault
detection of the input capacitor, Cin:
(1) In wavelet decomposition level one, if the fea-
ture magnitude exceeds 70 mA, a capacitance
reduction of 20% of Cin is detected.
(2) In wavelet decomposition level three, if the
pulse value exceeds 20 mA, the event implies a
fast drop of the Cin capacitance. The pulse peak
value could be used to estimate the capacitance
changing rate.
Sensor dataWhite noise+
D1 D2
…
Dn
An (Ignored)
Fault features
…
…
Simulation
Wavelet MRA
Absolute value
Low pass filter
Fault Detection of Power Electronic Circuit using Wavelet Analysis in Modelica
518 Proceedings of the 9th International Modelica Conference DOI September 3-5, 2012, Munich Germany 10.3384/ecp12076513
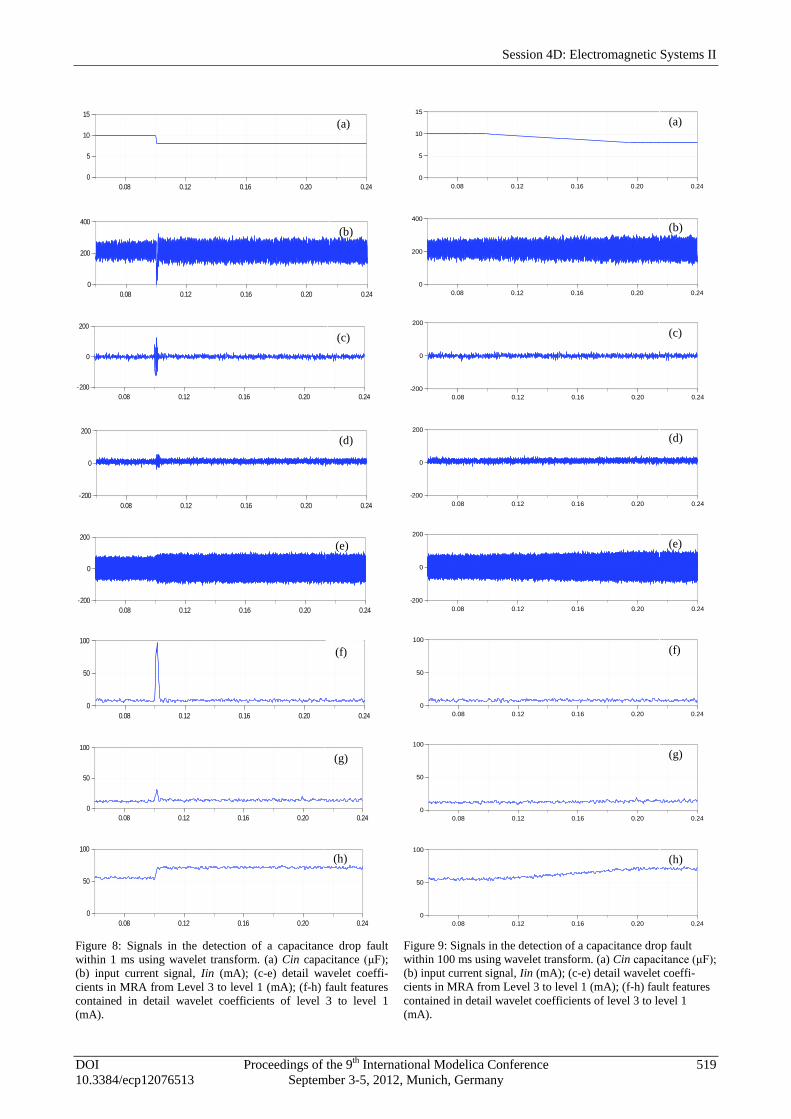
Figure 8: Signals in the detection of a capacitance drop fault
within 1 ms using wavelet transform. (a) Cin capacitance (μF);
(b) input current signal, Iin (mA); (c-e) detail wavelet coeffi-
cients in MRA from Level 3 to level 1 (mA); (f-h) fault features
contained in detail wavelet coefficients of level 3 to level 1
(mA).
Figure 9: Signals in the detection of a capacitance drop fault
within 100 ms using wavelet transform. (a) Cin capacitance (μF);
(b) input current signal, Iin (mA); (c-e) detail wavelet coeffi-
cients in MRA from Level 3 to level 1 (mA); (f-h) fault features
contained in detail wavelet coefficients of level 3 to level 1
(mA).
0.08 0.12 0.16 0.20 0.24
0
5
10
15
0.08 0.12 0.16 0.20 0.24
0
200
400
0.08 0.12 0.16 0.20 0.24
0
5
10
15
0.08 0.12 0.16 0.20 0.24
0
200
400
0.08 0.12 0.16 0.20 0.24
-200
0
200
0.08 0.12 0.16 0.20 0.24
-200
0
200
0.08 0.12 0.16 0.20 0.24
-200
0
200
0.08 0.12 0.16 0.20 0.24
-200
0
200
0.08 0.12 0.16 0.20 0.24
-200
0
200
0.08 0.12 0.16 0.20 0.24
-200
0
200
0.08 0.12 0.16 0.20 0.24
-200
0
200
0.08 0.12 0.16 0.20 0.24
-200
0
200
0.08 0.12 0.16 0.20 0.24
-200
0
200
0.08 0.12 0.16 0.20 0.24
0
50
100
0.08 0.12 0.16 0.20 0.24
0
50
100
0.08 0.12 0.16 0.20 0.24
0
50
100
0.08 0.12 0.16 0.20 0.24
0
50
100
0.08 0.12 0.16 0.20 0.24
0
50
100
0.08 0.12 0.16 0.20 0.24
0
50
100
0.08 0.12 0.16 0.20 0.24
0
50
100
0.08 0.12 0.16 0.20 0.24
0
50
100
0.08 0.12 0.16 0.20 0.24
0
50
100
0.08 0.12 0.16 0.20 0.24
0
5
10
15
0.08 0.12 0.16 0.20 0.24
0
200
400
0.08 0.12 0.16 0.20 0.24
0
5
10
15
0.08 0.12 0.16 0.20 0.24
0
200
400
0.08 0.12 0.16 0.20 0.24
-200
0
200
0.08 0.12 0.16 0.20 0.24
-200
0
200
0.08 0.12 0.16 0.20 0.24
-200
0
200
0.08 0.12 0.16 0.20 0.24
-200
0
200
0.08 0.12 0.16 0.20 0.24
-200
0
200
0.08 0.12 0.16 0.20 0.24
-200
0
200
0.08 0.12 0.16 0.20 0.24
-200
0
200
0.08 0.12 0.16 0.20 0.24
-200
0
200
0.08 0.12 0.16 0.20 0.24
-200
0
200
0.08 0.12 0.16 0.20 0.24
0
50
100
0.08 0.12 0.16 0.20 0.24
0
50
100
0.08 0.12 0.16 0.20 0.24
0
50
100
0.08 0.12 0.16 0.20 0.24
0
50
100
0.08 0.12 0.16 0.20 0.24
0
50
100
0.08 0.12 0.16 0.20 0.24
0
50
100
0.08 0.12 0.16 0.20 0.24
0
50
100
0.08 0.12 0.16 0.20 0.24
0
50
100
0.08 0.12 0.16 0.20 0.24
0
50
100
(g)
(c)
(d)
(e)
(f)
(h)
(b)
(a)
(c)
(b)
(d)
(e)
(f)
(g)
(h)
(a)
Session 4D: Electromagnetic Systems II
DOI Proceedings of the 9th International Modelica Conference 519 10.3384/ecp12076513 September 3-5, 2012, Munich, Germany
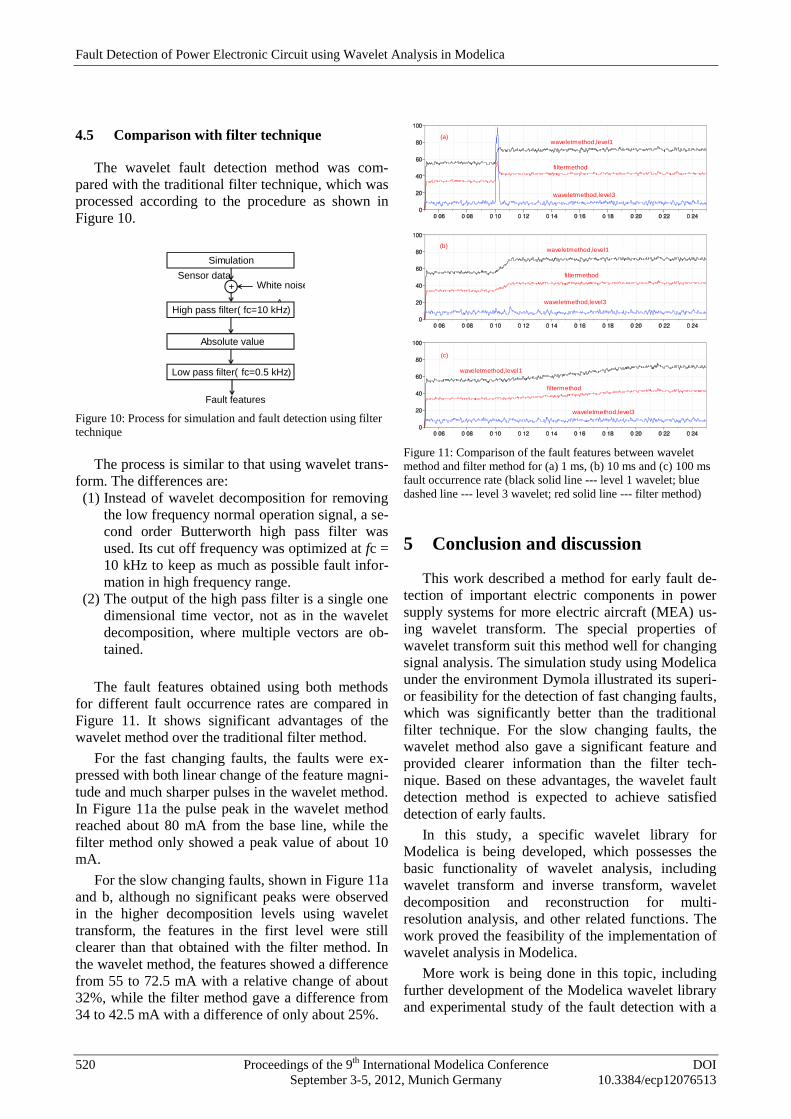
4.5 Comparison with filter technique
The wavelet fault detection method was com-
pared with the traditional filter technique, which was
processed according to the procedure as shown in
Figure 10.
Figure 10: Process for simulation and fault detection using filter
technique
The process is similar to that using wavelet trans-
form. The differences are:
(1) Instead of wavelet decomposition for removing
the low frequency normal operation signal, a se-
cond order Butterworth high pass filter was
used. Its cut off frequency was optimized at fc =
10 kHz to keep as much as possible fault infor-
mation in high frequency range.
(2) The output of the high pass filter is a single one
dimensional time vector, not as in the wavelet
decomposition, where multiple vectors are ob-
tained.
The fault features obtained using both methods
for different fault occurrence rates are compared in
Figure 11. It shows significant advantages of the
wavelet method over the traditional filter method.
For the fast changing faults, the faults were ex-
pressed with both linear change of the feature magni-
tude and much sharper pulses in the wavelet method.
In Figure 11a the pulse peak in the wavelet method
reached about 80 mA from the base line, while the
filter method only showed a peak value of about 10
mA.
For the slow changing faults, shown in Figure 11a
and b, although no significant peaks were observed
in the higher decomposition levels using wavelet
transform, the features in the first level were still
clearer than that obtained with the filter method. In
the wavelet method, the features showed a difference
from 55 to 72.5 mA with a relative change of about
32%, while the filter method gave a difference from
34 to 42.5 mA with a difference of only about 25%.
Figure 11: Comparison of the fault features between wavelet
method and filter method for (a) 1 ms, (b) 10 ms and (c) 100 ms
fault occurrence rate (black solid line --- level 1 wavelet; blue
dashed line --- level 3 wavelet; red solid line --- filter method)
5 Conclusion and discussion
This work described a method for early fault de-
tection of important electric components in power
supply systems for more electric aircraft (MEA) us-
ing wavelet transform. The special properties of
wavelet transform suit this method well for changing
signal analysis. The simulation study using Modelica
under the environment Dymola illustrated its superi-
or feasibility for the detection of fast changing faults,
which was significantly better than the traditional
filter technique. For the slow changing faults, the
wavelet method also gave a significant feature and
provided clearer information than the filter tech-
nique. Based on these advantages, the wavelet fault
detection method is expected to achieve satisfied
detection of early faults.
In this study, a specific wavelet library for
Modelica is being developed, which possesses the
basic functionality of wavelet analysis, including
wavelet transform and inverse transform, wavelet
decomposition and reconstruction for multi-
resolution analysis, and other related functions. The
work proved the feasibility of the implementation of
wavelet analysis in Modelica.
More work is being done in this topic, including
further development of the Modelica wavelet library
and experimental study of the fault detection with a
Sensor dataWhite noise+
An
Fault features
Simulation
High pass filter( fc=10 kHz)
Absolute value
Low pass filter( fc=0.5 kHz)
filtermethod
waveletmethod,level1
waveletmethod,level3
(a)
filtermethod
waveletmethod,level1
waveletmethod,level3
(b)
filtermethod
waveletmethod,level1
waveletmethod,level3
(c)
Fault Detection of Power Electronic Circuit using Wavelet Analysis in Modelica
520 Proceedings of the 9th International Modelica Conference DOI September 3-5, 2012, Munich Germany 10.3384/ecp12076513

real buck inverter. For a real system, detailed optimi-
zation of the fault detection strategy has to be carried
out, such as trying other wavelet functions, observ-
ing more changing rates, studying the detection with
expanded fault ranges, and considering the faults in
more electrical parts.
Acknowledgement
The authors thank the support from the Clean-Sky
Joint Undertaking through the Grant Agreement No.
296369 (Project MoMoLib) within the Seventh
Framework Programme of the European Union.
References
[1] C. Schallert, A. Pfeiffer and J. Bals. Genera-
tor power optimisation for a more-electric
aircraft by use of a virtual iron bird, 25th
Internaltional Congress of the Aeronautical
Sciences, 2006.
[2] M.R. Kuhn, Y. Ji, D. Schröder, Stability
studies of critical DC power system
comonent for More Electric Aircraft using μ
sensitivity. Proc. of the 15th Mediterranean
Conference on Contro & Automation, 2007.
[3] J. Gertler. Fault Detection and Diagnosis in
Engineering Systems. Marcel Dekker, 1998.
[4] J. Chen and P.Patton. Robust Model-based
Fault Diagnosis for Dynamic Systems.
Kluwer Academic Publishers, 1999.
[5] S. X. Ding. Model-based Fault Diagnosis
Techniques: Design Schemes, Algorithms
and Tools. Springer Berlin, 2008.
[6] K. Swarup and H. Chandrasekharaiah. Fault
detection and diagnosis of power systems us-
ing artificial neural networks. 1st internation-
al forum on application of neural networks to
power system, 1991.
[7] M. Aldeen and F. Crusca. Observer-based
fault detection and identification scheme for
power systems: Generation, Transmission
and Distribution. lEE Proceedings, vol. 153,
pp.71-79, 2006.
[8] Y. Ji and J. Bals. Multi-Model Based Fault
Detection for the Power System of More
Electric Aircraft. Proceedings of the 7th
Asian Control Conference, Hong Kong, Chi-
na, Aug. 27-29, 2009.
[9] Y. Ji, J. Bals, Application of model detection
techniques to health monitoring for the elec-
trical network of More Electric Aircraft, In-
ternational Conference on Electrical Engi-
neering and applications, 2009.
[10] S. Mallat (2009): A wavelet tour of signal
processing - the sparse way. Amsterdam:
Elsevier.
[11] H. T. Zhang, Q. An, et al. Fault Detection
Wavelet Fractal Method of Circuit of Three-
Phase Bridge Rectifier. International Confer-
ence on Intelligent System Design and Engi-
neering Application (ISDEA), 2010, S. 725–
729.
[12] V. Prasannamoorthy, N. Devarajan, et al.
Wavelet and Fuzzy Classifier Based Fault
Detection Methodology for Power Electronic
Circuits. International Conference on Process
Automation, Control and Computing
(PACC), 2011, S. 1–6.
[13] T. Buente, A. Sahin, and N. Bajcinca, Naim.
Inversion of Vehicle Steering Dynamics with
Modelica/Dymola. Proceedings of the 4th In-
ternational Modelica Conference 2005, S.
319–328.
[14] J. Bals, Y. Ji, M. R. Kuhn, C. Schallert,
Model based design and integration of More
Electric Aircraft systems using Modelica.
Moet forum at European power electronics
conference and exhibition, 2009.
[15] Y. Ji, J. Bals, A Modelica signal analysis tool
towards design of More Electric Aircraft,
ICIAE, 2010.
[16] E. Jacobsen and R. Lyons. The sliding DFT.
Signal Processing Magazine, vol. 20, issue 2,
pp. 74–80, March 2003.
[17] I. Daubechies. Ten Lectures on Wavelets.
SIAM 1992.
Session 4D: Electromagnetic Systems II
DOI Proceedings of the 9th International Modelica Conference 521 10.3384/ecp12076513 September 3-5, 2012, Munich, Germany

Fault Detection of Power Electronic Circuit using Wavelet Analysis in Modelica
522 Proceedings of the 9th International Modelica Conference DOI September 3-5, 2012, Munich Germany 10.3384/ecp12076513


![1935. Fault diagnosis of gearboxes using wavelet support ... · Zeng [30] developed an intelligent fault diagnosis procedure based on wavelet packet transform (WPT) and hybrid SVM](https://img.pdfslide.net/doc/110x75/5ffde5fc9f248533cc39c91d/1935-fault-diagnosis-of-gearboxes-using-wavelet-support-zeng-30-developed.jpg)