Embed Size (px)
Citation preview

لعلوم الأساسية والتطبيقية ا :مجلة الجامعة الأسمرية
2017يونيو (،1العدد )( 2)جلد الم
69
FAULT DIAGNOSIS, TESTING AND RESPONSES OF
INDUCTION MOTOR SYSTEMS
Moftah M. BinHasan1 and Ibrahim A. Farhat
2
1 Electrical and Computer Engineering Department, Faculty of Engineering, Almergib University
2 Electrical and Computer Engineering Department, Faculty of Engineering, Al-Asmarya University
ABSTRACT
Among the many great features of induction motors are their simplicity, reliability, efficiency
and high robustness. For these, they are extensively employed in various applications and
industrial fields. Nevertheless, motors, as it is the case for other appliances and equipment, are
exposed to various types of faults. Consequently, these faults must be monitored, classified and
diagnosed in order to prevent possible disastrous failures of the machine itself and the whole
system as well. This paper explores the various faults that motors are vulnerable to by performing
the appropriate tests. The results were obtained by collecting the different detected response
signals.
KEY WORDS: Fault Diagnosis, Motor Current Signature Analysis, Tree Phase Induction Motor.
1. INTRODUCTION
Induction motors are electromechanical elements that are widely utilized in various industrial
and operational systems. As a result, they are comprehensively vulnerable to different types of
faults. Therefore, exploring these faults and their consequences as well as proposing solutions for
their problematic issues are getting growing attention [1-4].
لعلوم الأساسية والتطبيقية ا :مجلة الجامعة الأسمرية
2017يونيو (،1العدد )( 2)جلد الم
70
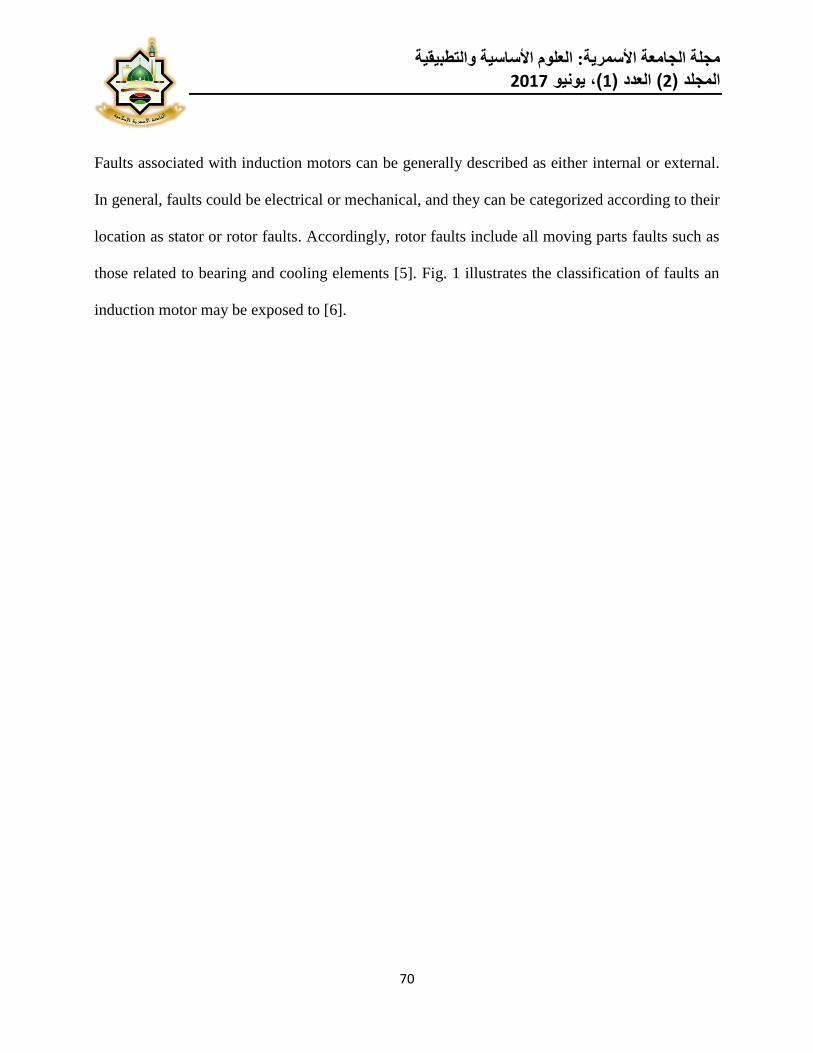
Faults associated with induction motors can be generally described as either internal or external.
In general, faults could be electrical or mechanical, and they can be categorized according to their
location as stator or rotor faults. Accordingly, rotor faults include all moving parts faults such as
those related to bearing and cooling elements [5]. Fig. 1 illustrates the classification of faults an
induction motor may be exposed to [6].
لعلوم الأساسية والتطبيقية ا :مجلة الجامعة الأسمرية
2017يونيو (،1العدد )( 2)جلد الم
71
Motor Faults
Internal
Faults
Electrical Mechanical
External
Faults
Electrical Enviromental Mechanical
Magnetic Faults
Dielectric Failure
Rotor Bars Cracks
Bearing Faults
Parts Movements
Rotor Strikes
Transient Voltage
Unbalanes
Voltage Fluctuations
Magnetic Faults
Dielectric Failure
Dielectric Failure
Temrature Humidety
Cleanliness
Figure 1. Classification of motor faults.
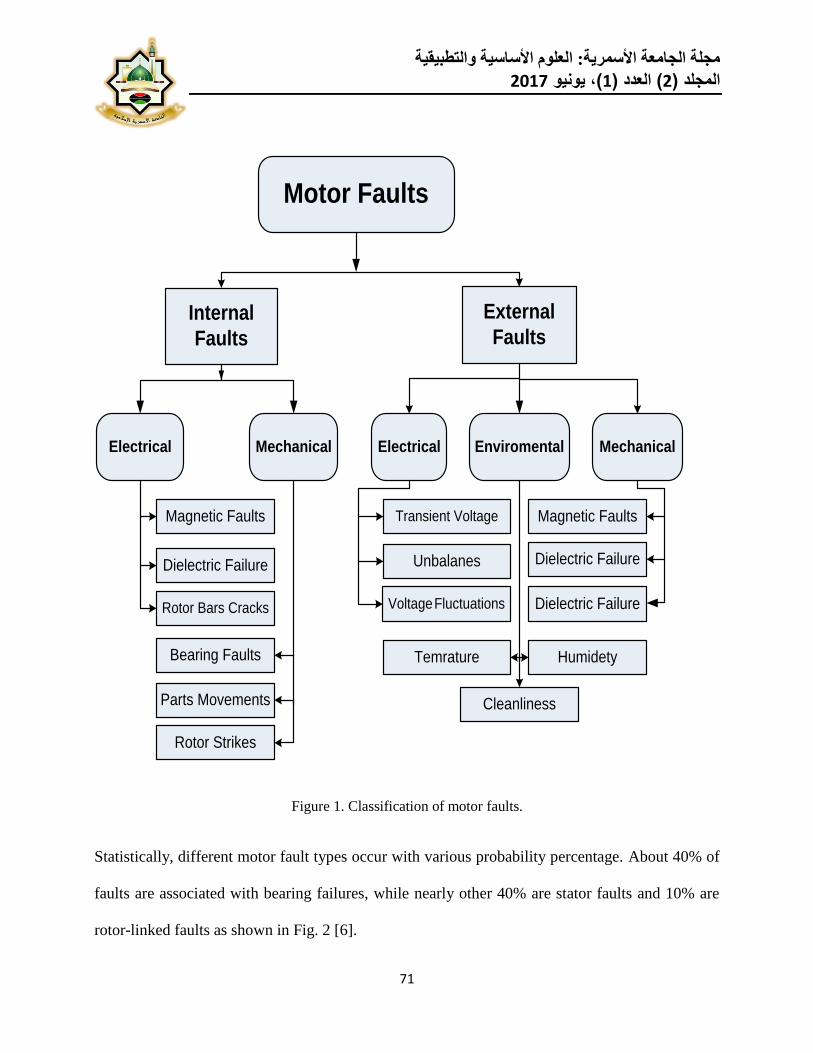
Statistically, different motor fault types occur with various probability percentage. About 40% of
faults are associated with bearing failures, while nearly other 40% are stator faults and 10% are
rotor-linked faults as shown in Fig. 2 [6].
لعلوم الأساسية والتطبيقية ا :مجلة الجامعة الأسمرية
2017يونيو (،1العدد )( 2)جلد الم
72
Figure 2. Motor fault occurrence probabilities.
Numerous research papers and studies have explored the methods implemented for fault
monitoring, detection and diagnosis. Comprehensive review of the methods applied for motor
fault diagnosis could be found in [1]. Typically, faults are diagnosed using expert signal
analyzing systems that analyze the fault signals obtained by various sensor units [1]. However, it
is commonly difficult or even impossible to interpret the information contained in a raw signal to
meaningful information by just looking at it. In addition, raw signals obtained from an instrument
measuring a physical process always contain noise that hampers the useful information contained.
40%
38%
10%
12%
Motor Fault Occurrence percentage
Bearing Faults
Stator Faults
Rotor Faults
Other Faults
لعلوم الأساسية والتطبيقية ا :مجلة الجامعة الأسمرية
2017يونيو (،1العدد )( 2)جلد الم
73
The reminder of the paper is organized as follows: in section 2 the types of induction motor faults
are presented. In Section 3, the fault diagnosis methodology is briefly outlined. Results and
discussion are demonstrated in Section 4. The conclusion is drawn in Section 5.
2. FAULTS IN INDUCTION MOTORS
As mentioned, motor faults are categorized according to their location. In this section the
various types of motor faults are presented and explored.
2.1 Rotor Faults
Electrical and mechanical deficiencies can cause rotor faults. This may take place because of
thermal stress, overheated parts of the rotor. Torque changes and transient operation could also
result in fatigue stress and breaking or damaging the rotor bars. Air gap eccentricity, load
unbalance or shaft misalignment are among the many other fault causes [7, 8].
2.2 Bearing Faults
Faults of bearings are classified into two main groups. They could be local or distributed
deficiencies. Cracks of the rolling surfaces, for instance, are local faults while surface roughness
and off-size rolling elements as well as misalignment of races are considered distributed ones [9].
Bearing faults cause vibrations as a result of the flawed bearings. In order to specify the
characteristic frequencies accompanying the raceways and the balls or rollers, the dimensions of
the bearings and the machine rotational speed are utilized. A range of mechanical vibration
analysis methods is used to inspect these characteristic frequencies in order to determine the
condition of the bearing [1].
لعلوم الأساسية والتطبيقية ا :مجلة الجامعة الأسمرية
2017يونيو (،1العدد )( 2)جلد الم
74
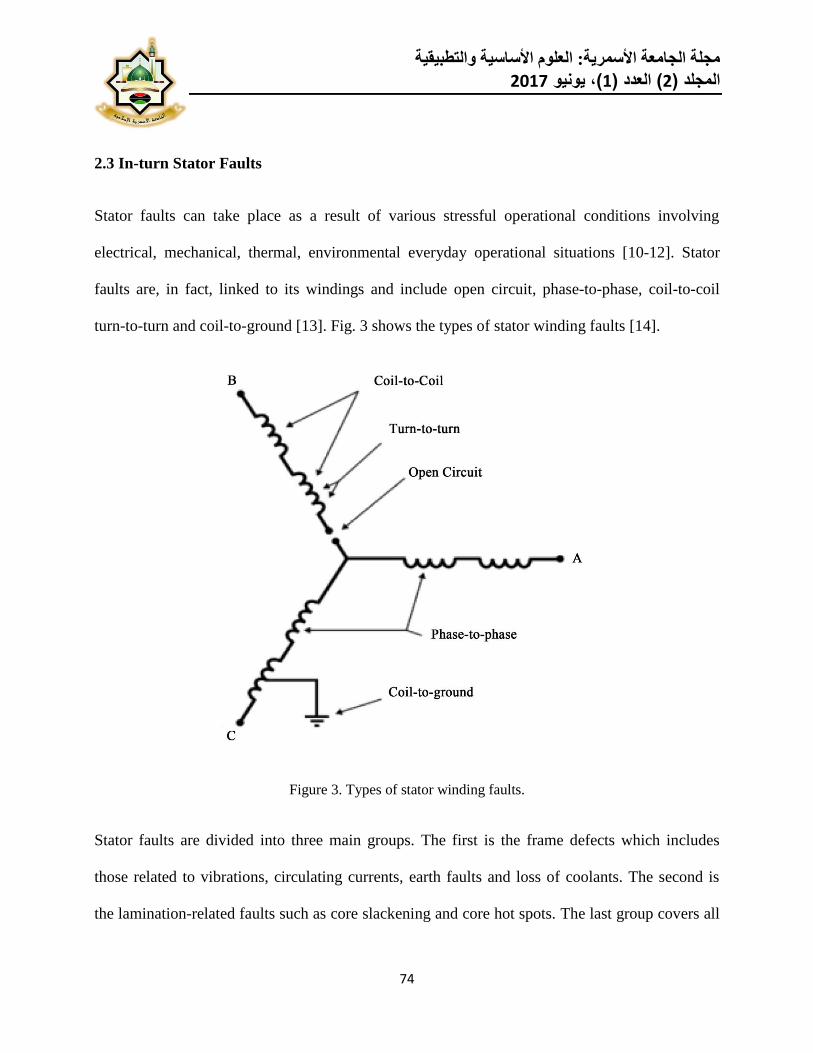
2.3 In-turn Stator Faults
Stator faults can take place as a result of various stressful operational conditions involving
electrical, mechanical, thermal, environmental everyday operational situations [10-12]. Stator
faults are, in fact, linked to its windings and include open circuit, phase-to-phase, coil-to-coil
turn-to-turn and coil-to-ground [13]. Fig. 3 shows the types of stator winding faults [14].
Figure 3. Types of stator winding faults.
Stator faults are divided into three main groups. The first is the frame defects which includes
those related to vibrations, circulating currents, earth faults and loss of coolants. The second is
the lamination-related faults such as core slackening and core hot spots. The last group covers all
لعلوم الأساسية والتطبيقية ا :مجلة الجامعة الأسمرية
2017يونيو (،1العدد )( 2)جلد الم
75
of the stator winding faults including turn-to-turn faults, fretting of insulation, local damage to
insulation, damage to connectors, discharge erosion of insulation, displacement of conductors,
contamination of insulation by moisture, oil or dirt, cracking of insulation and other end winding
portion faults. It also includes all slot portion defects such as insulation fretting and displacement
of conductors [15].
2.4 Eccentricity Faults
Eccentricity faults of induction motors are caused by the uneven and dissimilar air gap between
stator and rotor [16]. Eccentricity of the air gap is commonly known as static, dynamic or mixed
while the inclined eccentricity is associated with the axial non uniformity of air gap [17, 18].
3. FAULT DIAGNOSIS
The data collected from the testing motor system considering different faults was presented
and investigated. The motor system was tested so that different signals were saved. Then the
system was forced to fail and retested. The work was done by collecting different sensed signals
of the motor under test while it has been exposed to different levels of loading. The tested motors
could be in a healthy or faulty condition. The sensed signals are current, voltage, accelerometer
signal, and speed.
Plots of the recorded output signals in time domain were illustrated and discussed. As the test rig
was well equipped, different tests were carried out and different signals were recorded for
different healthy and faulty cases of a set of four similar motors.
لعلوم الأساسية والتطبيقية ا :مجلة الجامعة الأسمرية
2017يونيو (،1العدد )( 2)جلد الم
76
The following section covers the measured signals from the healthy and faulty motors. It includes
current, voltage speed, and accelerometer signal. The tests were carried out at 0, 25, 30, 35, 40,
and 50 Nm which is the rated motor load
4. STUDY RESULTS AND DISCUSSION
4.1 Rotor Fault
In this section, the effects of the fault due to the broken rotor bars on the motor under test’s
signals are illustrated. Figures plotted are for healthy and different degrees of fault severity at the
same level of loadings and for the same degree of fault at different load conditions.
Current Signals
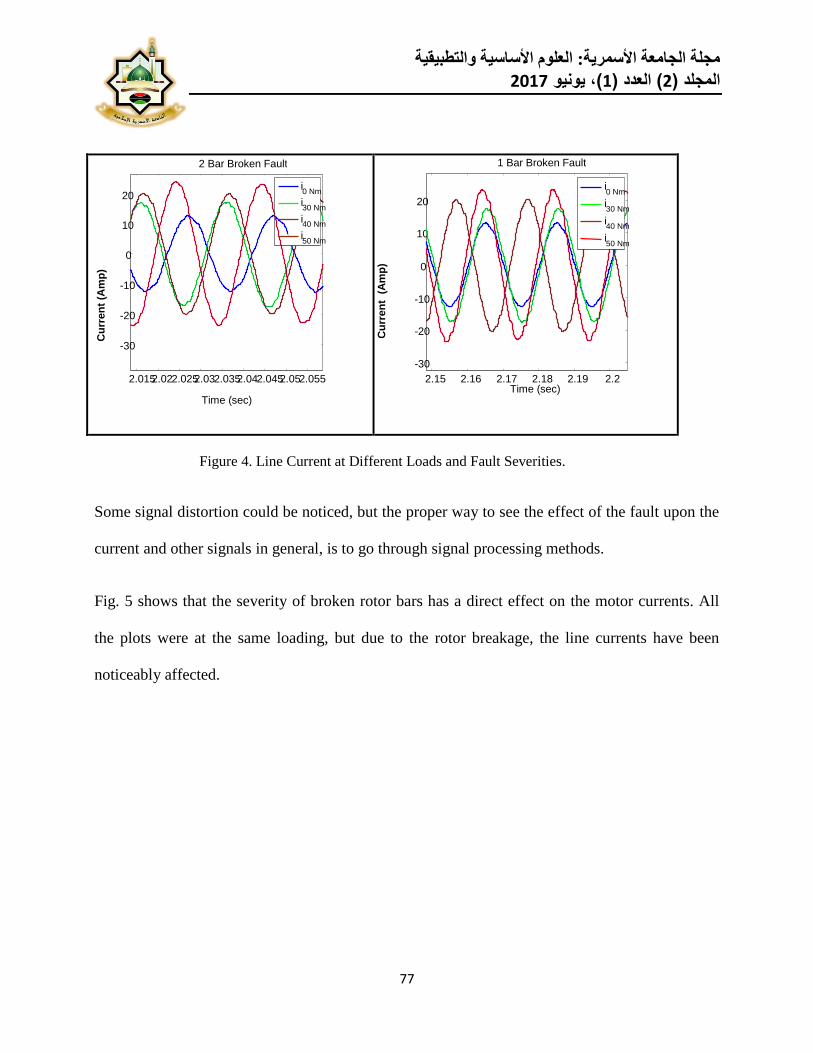
As shown in the figures to come, it has been noticed that the direct effect of loading on the line
current of the motor drastically, the more load applied to the motor, the more current drawn as
shown in Fig. 4. The current is minimally and adversely affected by the severity of the rotor fault.
لعلوم الأساسية والتطبيقية ا :مجلة الجامعة الأسمرية
2017يونيو (،1العدد )( 2)جلد الم
77
Figure 4. Line Current at Different Loads and Fault Severities.
Some signal distortion could be noticed, but the proper way to see the effect of the fault upon the
current and other signals in general, is to go through signal processing methods.
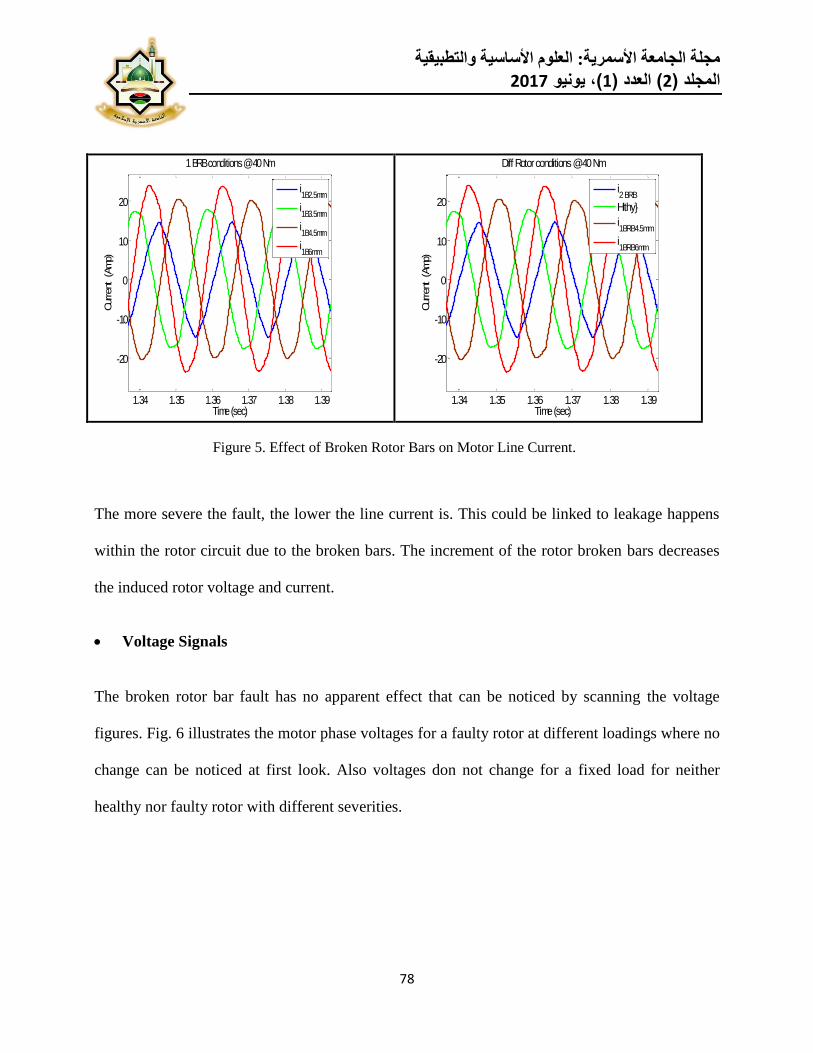
Fig. 5 shows that the severity of broken rotor bars has a direct effect on the motor currents. All
the plots were at the same loading, but due to the rotor breakage, the line currents have been
noticeably affected.
2.15 2.16 2.17 2.18 2.19 2.2 -30
-20
-10
0
10
20
Time (sec) C
urr
en
t (
Am
p)
1 Bar Broken Fault
i 0 Nm i 30 Nm i 40 Nm i 50 Nm
2.015 2.02 2.025 2.03 2.035 2.04 2.045 2.05 2.055
-30
-20
-10
0
10
20
Time (sec)
Cu
rren
t (A
mp
)
2 Bar Broken Fault
i 0 Nm i 30 Nm i 40 Nm i 50 Nm
لعلوم الأساسية والتطبيقية ا :مجلة الجامعة الأسمرية
2017يونيو (،1العدد )( 2)جلد الم
78
Figure 5. Effect of Broken Rotor Bars on Motor Line Current.
The more severe the fault, the lower the line current is. This could be linked to leakage happens
within the rotor circuit due to the broken bars. The increment of the rotor broken bars decreases
the induced rotor voltage and current.
Voltage Signals
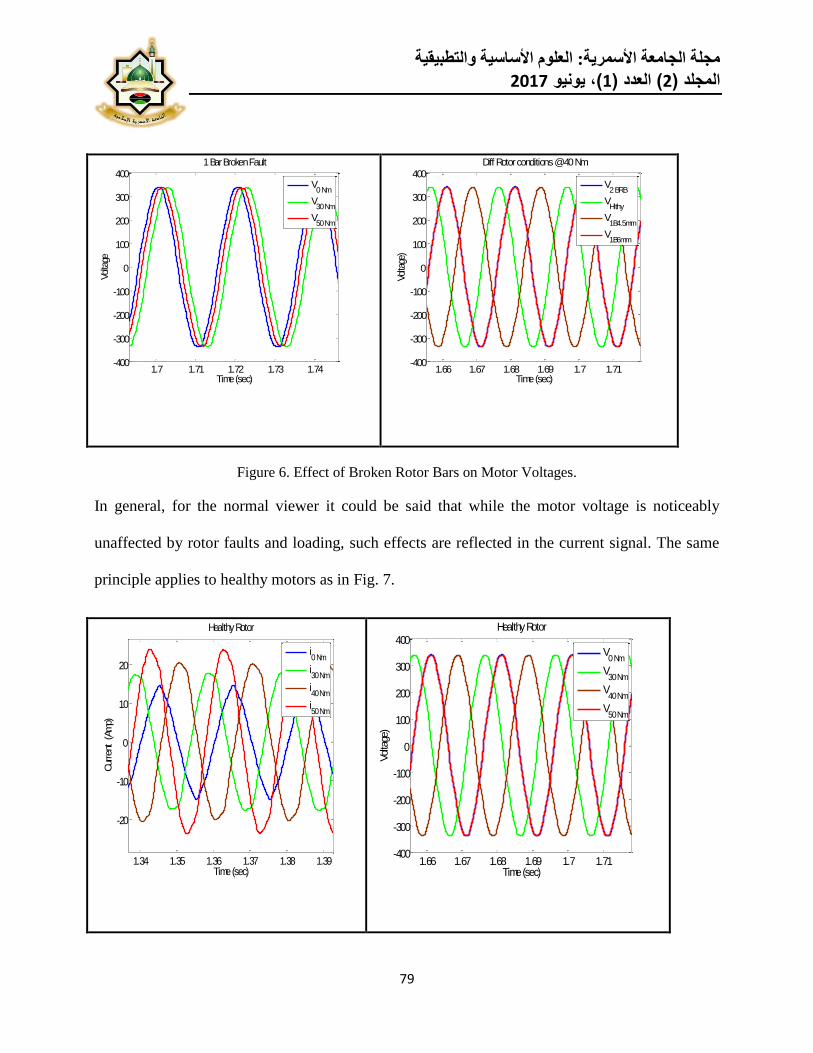
The broken rotor bar fault has no apparent effect that can be noticed by scanning the voltage
figures. Fig. 6 illustrates the motor phase voltages for a faulty rotor at different loadings where no
change can be noticed at first look. Also voltages don not change for a fixed load for neither
healthy nor faulty rotor with different severities.
1.34 1.35 1.36 1.37 1.38 1.39
-20
-10
0
10
20
Time (sec)
Cur
rent
(A
mp)
1 BRB conditions @ 40 Nm
i1B2.5mm
i1B3.5mm
i1B4.5mm
i1B6mm
1.34 1.35 1.36 1.37 1.38 1.39
-20
-10
0
10
20
Time (sec)
Cur
rent
(A
mp)
Diff Rotor conditions @ 40 Nm
i2 BRB
Hlthy}
i1BRB4.5mm
i1BRB6mm
لعلوم الأساسية والتطبيقية ا :مجلة الجامعة الأسمرية
2017يونيو (،1العدد )( 2)جلد الم
79
Figure 6. Effect of Broken Rotor Bars on Motor Voltages.
In general, for the normal viewer it could be said that while the motor voltage is noticeably
unaffected by rotor faults and loading, such effects are reflected in the current signal. The same
principle applies to healthy motors as in Fig. 7.
1.7 1.71 1.72 1.73 1.74-400
-300
-200
-100
0
100
200
300
400
Time (sec)
Vol
tage
1 Bar Broken Fault
V0 Nm
V30 Nm
V50 Nm
1.66 1.67 1.68 1.69 1.7 1.71-400
-300
-200
-100
0
100
200
300
400
Time (sec)
Volta
ge)
Diff Rotor conditions @ 40 Nm
V2 BRB
VHlthy
V1B4.5mm
V1B6mm
1.34 1.35 1.36 1.37 1.38 1.39
-20
-10
0
10
20
Time (sec)
Cur
rent
(A
mp)
Healthy Rotor
i0 Nm
i30 Nm
i40 Nm
i50 Nm
1.66 1.67 1.68 1.69 1.7 1.71-400
-300
-200
-100
0
100
200
300
400
Time (sec)
Vol
tage
)
Healthy Rotor
V0 Nm
V30 Nm
V40 Nm
V50 Nm
لعلوم الأساسية والتطبيقية ا :مجلة الجامعة الأسمرية
2017يونيو (،1العدد )( 2)جلد الم
80
Figure 7. Healthy Motor Currents and Voltages at Different Loadings.
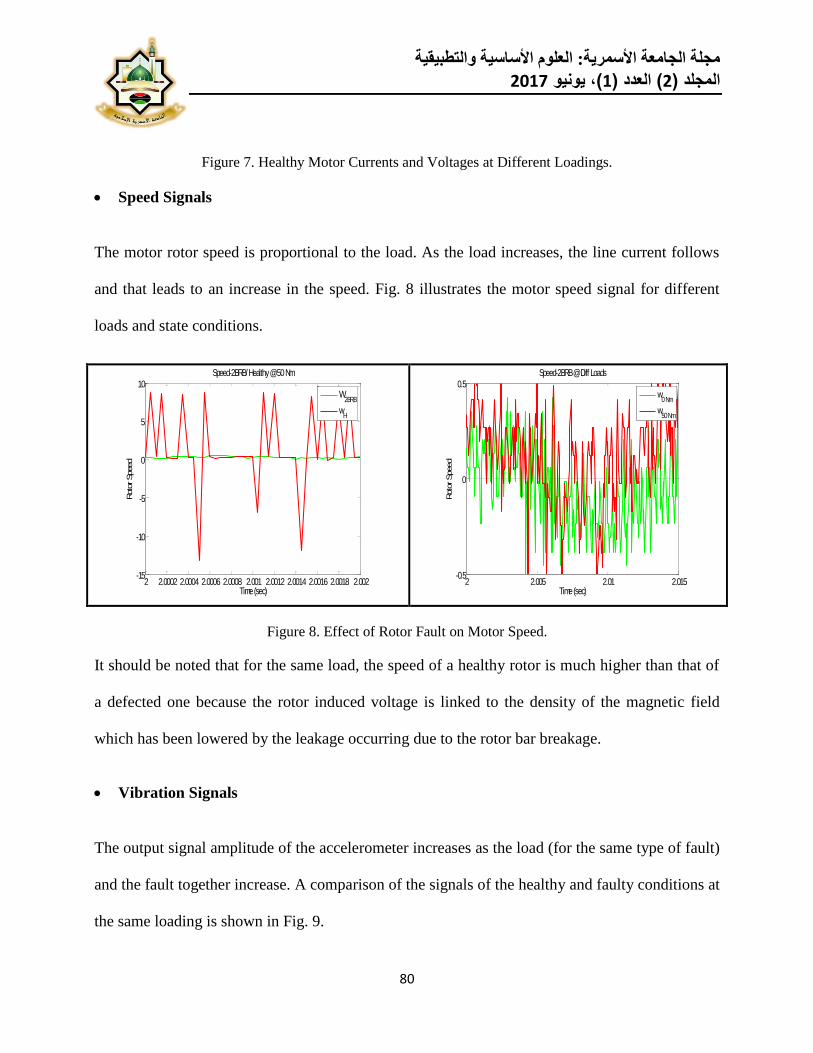
Speed Signals
The motor rotor speed is proportional to the load. As the load increases, the line current follows
and that leads to an increase in the speed. Fig. 8 illustrates the motor speed signal for different
loads and state conditions.
Figure 8. Effect of Rotor Fault on Motor Speed.
It should be noted that for the same load, the speed of a healthy rotor is much higher than that of
a defected one because the rotor induced voltage is linked to the density of the magnetic field
which has been lowered by the leakage occurring due to the rotor bar breakage.
Vibration Signals
The output signal amplitude of the accelerometer increases as the load (for the same type of fault)
and the fault together increase. A comparison of the signals of the healthy and faulty conditions at
the same loading is shown in Fig. 9.
2 2.0002 2.0004 2.0006 2.0008 2.001 2.0012 2.0014 2.0016 2.0018 2.002-15
-10
-5
0
5
10
Time (sec)
Roto
r Speed
Speed-2BRB/ Healthy @ 50 Nm
W2BRB
wH
2 2.005 2.01 2.015-0.5
0
0.5
Time (sec)
Roto
r Speed
Speed-2BRB @ Diff Loads
w0 Nm
w50 Nm
لعلوم الأساسية والتطبيقية ا :مجلة الجامعة الأسمرية
2017يونيو (،1العدد )( 2)جلد الم
81
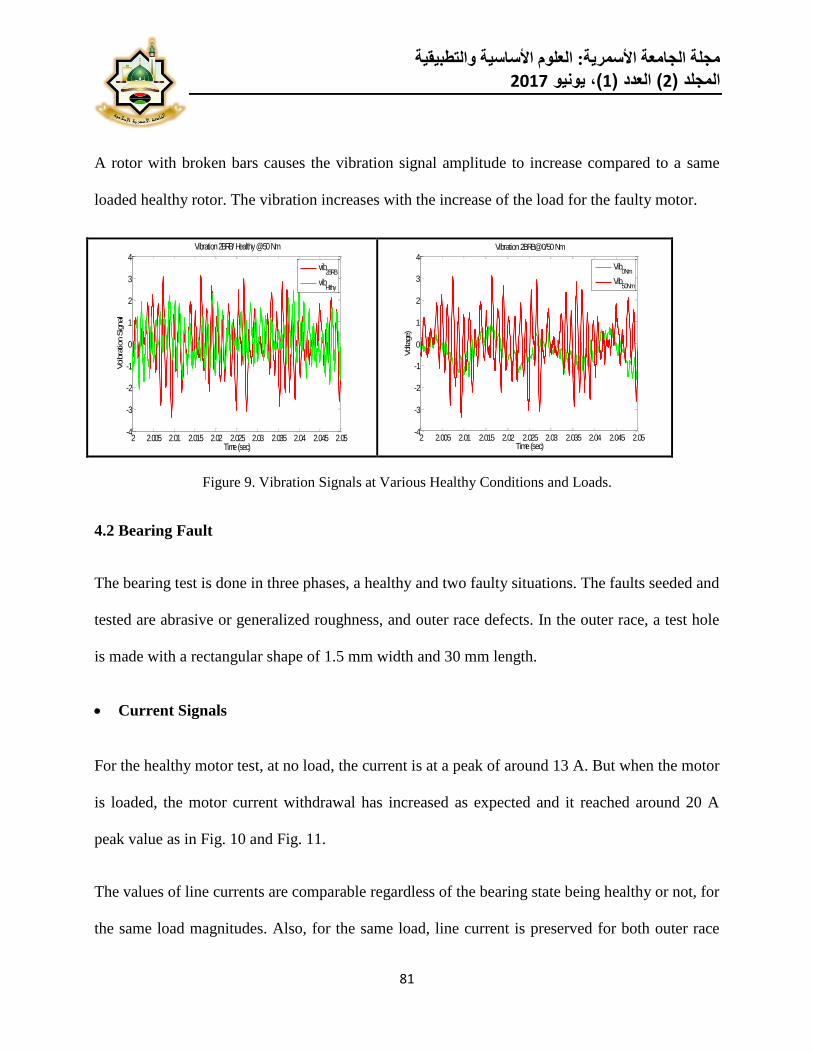
A rotor with broken bars causes the vibration signal amplitude to increase compared to a same
loaded healthy rotor. The vibration increases with the increase of the load for the faulty motor.
Figure 9. Vibration Signals at Various Healthy Conditions and Loads.
4.2 Bearing Fault
The bearing test is done in three phases, a healthy and two faulty situations. The faults seeded and
tested are abrasive or generalized roughness, and outer race defects. In the outer race, a test hole
is made with a rectangular shape of 1.5 mm width and 30 mm length.
Current Signals
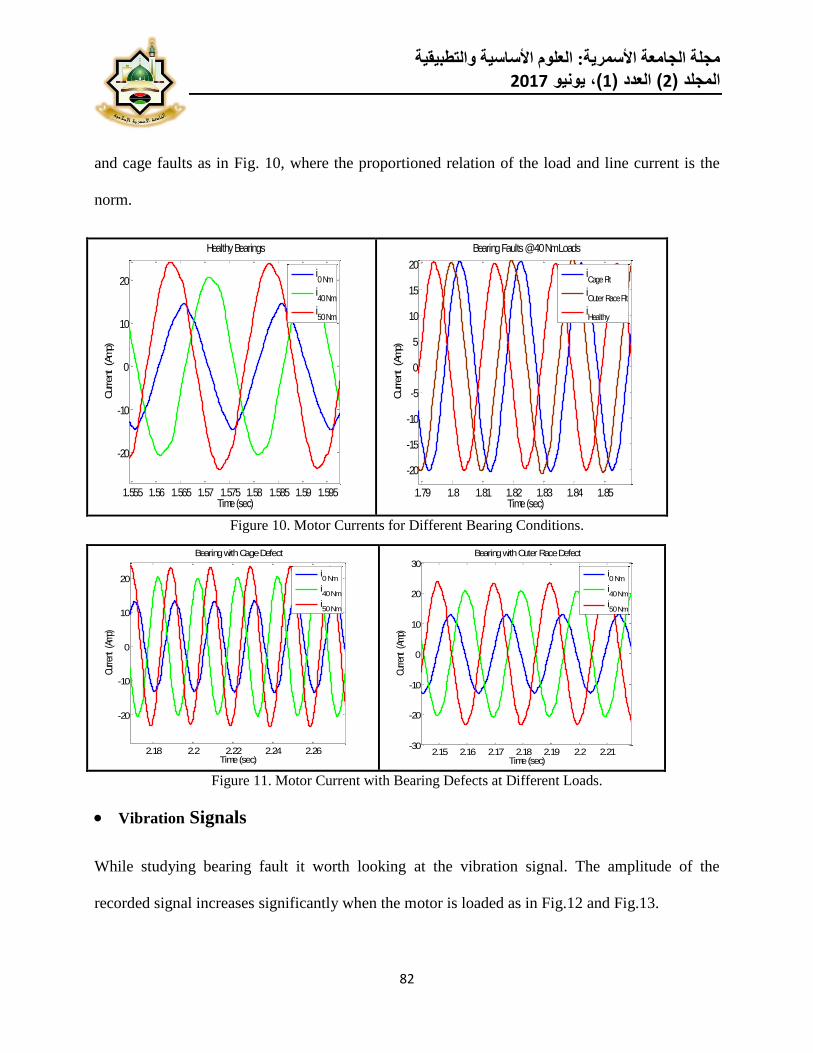
For the healthy motor test, at no load, the current is at a peak of around 13 A. But when the motor
is loaded, the motor current withdrawal has increased as expected and it reached around 20 A
peak value as in Fig. 10 and Fig. 11.
The values of line currents are comparable regardless of the bearing state being healthy or not, for
the same load magnitudes. Also, for the same load, line current is preserved for both outer race
2 2.005 2.01 2.015 2.02 2.025 2.03 2.035 2.04 2.045 2.05-4
-3
-2
-1
0
1
2
3
4
Time (sec)
Voib
ration S
ignal
Vibration 2BRB/ Healthy @ 50 Nm
vib2BRB
vibHlthy
2 2.005 2.01 2.015 2.02 2.025 2.03 2.035 2.04 2.045 2.05-4
-3
-2
-1
0
1
2
3
4
Time (sec)
Vol
tage
)
Vibration 2BRB@ 0/50 Nm
Vib0Nm
Vib50Nm
لعلوم الأساسية والتطبيقية ا :مجلة الجامعة الأسمرية
2017يونيو (،1العدد )( 2)جلد الم
82
and cage faults as in Fig. 10, where the proportioned relation of the load and line current is the
norm.
Figure 10. Motor Currents for Different Bearing Conditions.
Figure 11. Motor Current with Bearing Defects at Different Loads.
Vibration Signals
While studying bearing fault it worth looking at the vibration signal. The amplitude of the
recorded signal increases significantly when the motor is loaded as in Fig.12 and Fig.13.
1.555 1.56 1.565 1.57 1.575 1.58 1.585 1.59 1.595
-20
-10
0
10
20
Time (sec)
Cur
rent
(A
mp)
Healthy Bearings
i0 Nm
i40 Nm
i50 Nm
1.79 1.8 1.81 1.82 1.83 1.84 1.85
-20
-15
-10
-5
0
5
10
15
20
Time (sec)
Cur
rent
(A
mp)
Bearing Faults @ 40 Nm Loads
iCage Flt
iOuter Race Flt
iHealthy
2.18 2.2 2.22 2.24 2.26
-20
-10
0
10
20
Time (sec)
Curre
nt (
Amp)
Bearing with Cage Defect
i0 Nm
i40 Nm
i50 Nm
2.15 2.16 2.17 2.18 2.19 2.2 2.21-30
-20
-10
0
10
20
30
Time (sec)
Cur
rent
(Am
p)
Bearing with Outer Race Defect
i0 Nm
i40 Nm
i50 Nm
لعلوم الأساسية والتطبيقية ا :مجلة الجامعة الأسمرية
2017يونيو (،1العدد )( 2)جلد الم
83
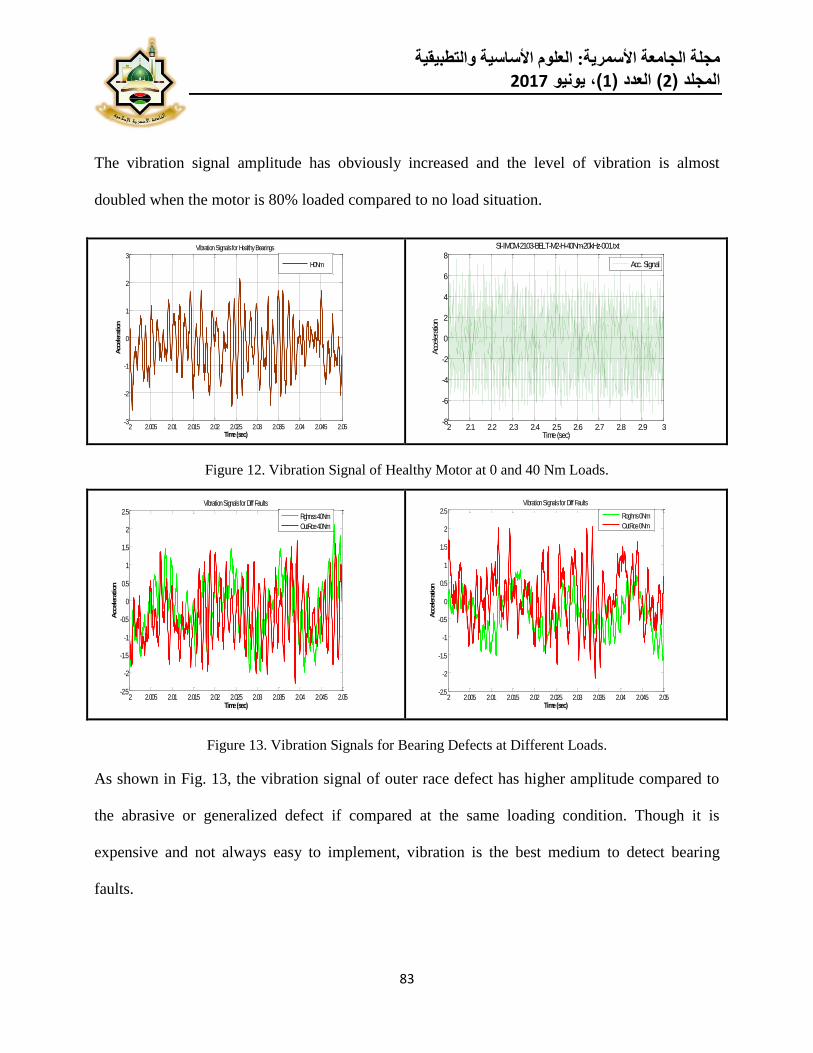
The vibration signal amplitude has obviously increased and the level of vibration is almost
doubled when the motor is 80% loaded compared to no load situation.
Figure 12. Vibration Signal of Healthy Motor at 0 and 40 Nm Loads.
Figure 13. Vibration Signals for Bearing Defects at Different Loads.
As shown in Fig. 13, the vibration signal of outer race defect has higher amplitude compared to
the abrasive or generalized defect if compared at the same loading condition. Though it is
expensive and not always easy to implement, vibration is the best medium to detect bearing
faults.
2 2.005 2.01 2.015 2.02 2.025 2.03 2.035 2.04 2.045 2.05-3
-2
-1
0
1
2
3
Time (sec)
Acc
ele
ration
Vibration Signals for Healthy Bearings
H0Nm
2 2.1 2.2 2.3 2.4 2.5 2.6 2.7 2.8 2.9 3-8
-6
-4
-2
0
2
4
6
8
Time (sec)Acc
ele
ratio
n
SI-IMCM-2103-BELT-M2-H-40Nm-20kHz-001.txt
Acc. Signal
2 2.005 2.01 2.015 2.02 2.025 2.03 2.035 2.04 2.045 2.05-2.5
-2
-1.5
-1
-0.5
0
0.5
1
1.5
2
2.5
Time (sec)
Acc
ele
ration
Vibration Signals for Diff Faults
Rghnss 40Nm
OutRce 40Nm
2 2.005 2.01 2.015 2.02 2.025 2.03 2.035 2.04 2.045 2.05-2.5
-2
-1.5
-1
-0.5
0
0.5
1
1.5
2
2.5
Time (sec)
Acc
ele
ration
Vibration Signals for Diff Faults
Roghns 0Nm
OutRce 0Nm
لعلوم الأساسية والتطبيقية ا :مجلة الجامعة الأسمرية
2017يونيو (،1العدد )( 2)جلد الم
84
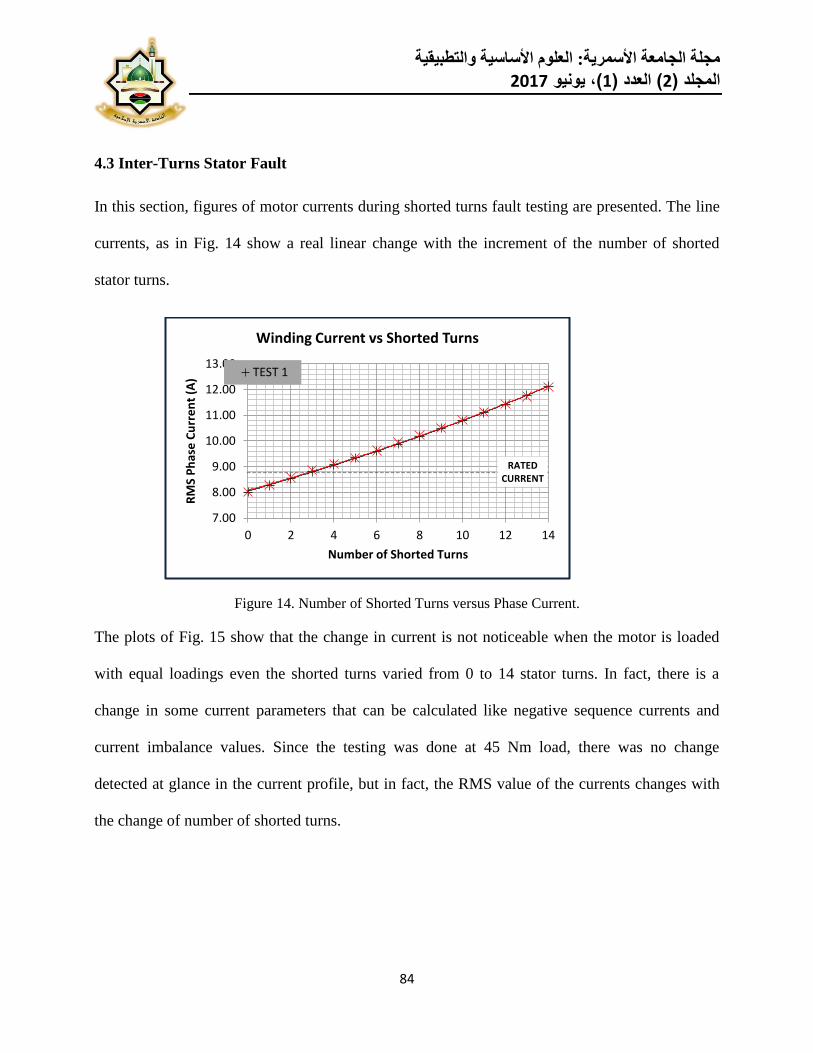
4.3 Inter-Turns Stator Fault
In this section, figures of motor currents during shorted turns fault testing are presented. The line
currents, as in Fig. 14 show a real linear change with the increment of the number of shorted
stator turns.
Figure 14. Number of Shorted Turns versus Phase Current.
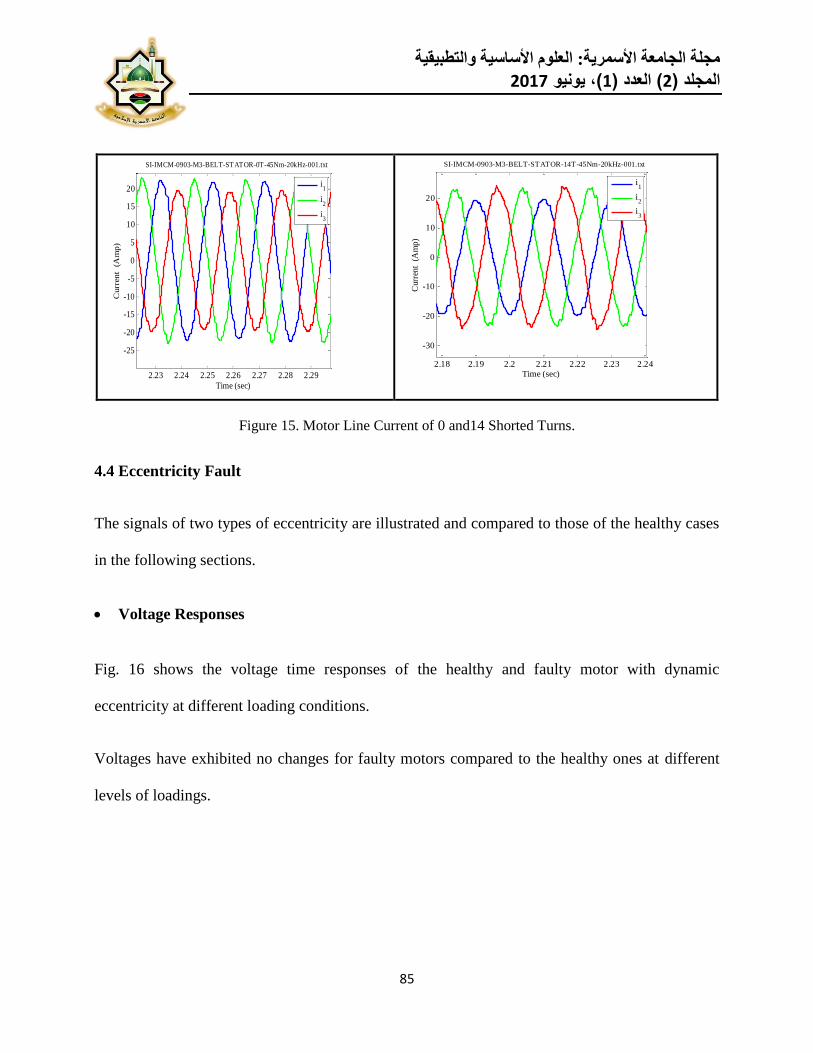
The plots of Fig. 15 show that the change in current is not noticeable when the motor is loaded
with equal loadings even the shorted turns varied from 0 to 14 stator turns. In fact, there is a
change in some current parameters that can be calculated like negative sequence currents and
current imbalance values. Since the testing was done at 45 Nm load, there was no change
detected at glance in the current profile, but in fact, the RMS value of the currents changes with
the change of number of shorted turns.
RATED CURRENT
7.00
8.00
9.00
10.00
11.00
12.00
13.00
0 2 4 6 8 10 12 14
RM
S P
has
e C
urr
en
t (A
)
Number of Shorted Turns
Winding Current vs Shorted Turns
TEST 1
لعلوم الأساسية والتطبيقية ا :مجلة الجامعة الأسمرية
2017يونيو (،1العدد )( 2)جلد الم
85
Figure 15. Motor Line Current of 0 and14 Shorted Turns.
4.4 Eccentricity Fault
The signals of two types of eccentricity are illustrated and compared to those of the healthy cases
in the following sections.
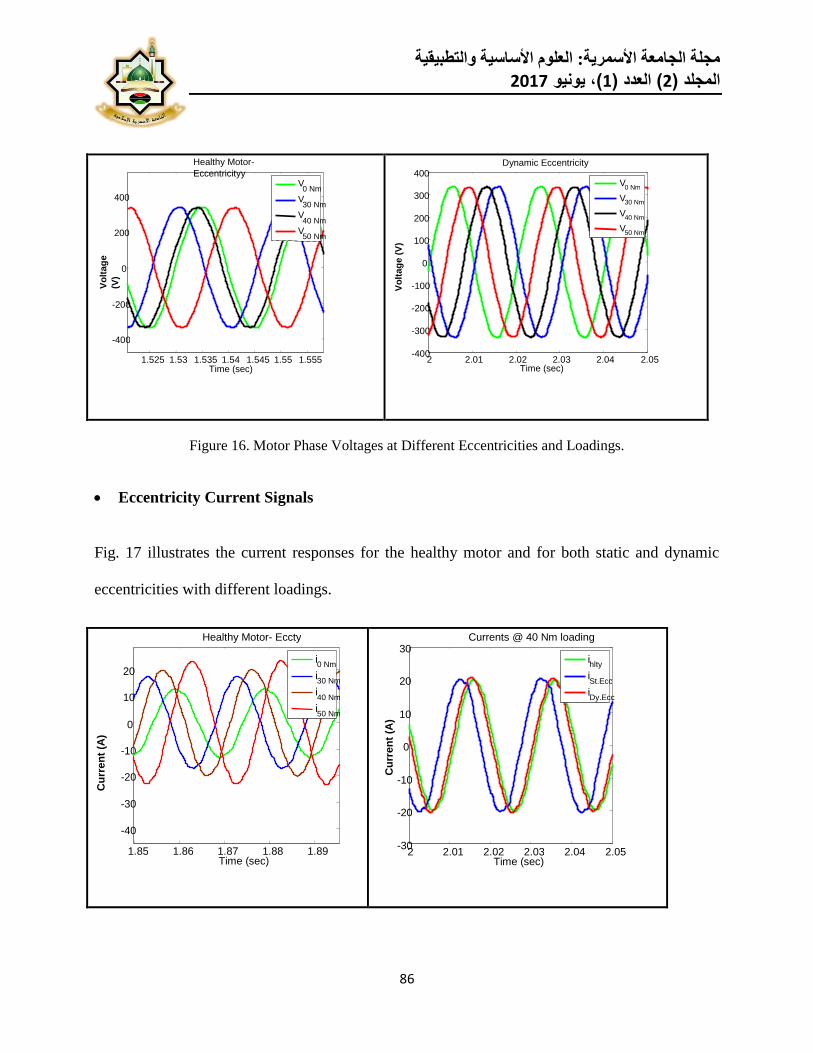
Voltage Responses
Fig. 16 shows the voltage time responses of the healthy and faulty motor with dynamic
eccentricity at different loading conditions.
Voltages have exhibited no changes for faulty motors compared to the healthy ones at different
levels of loadings.
2.23 2.24 2.25 2.26 2.27 2.28 2.29
-25
-20
-15
-10
-5
0
5
10
15
20
Time (sec)
Curr
ent
(A
mp
)
SI-IMCM-0903-M3-BELT-STATOR-0T-45Nm-20kHz-001.txt
i1
i2
i3
2.18 2.19 2.2 2.21 2.22 2.23 2.24
-30
-20
-10
0
10
20
Time (sec)
Cur
ren
t (
Am
p)
SI-IMCM-0903-M3-BELT-STATOR-14T-45Nm-20kHz-001.txt
i1
i2
i3
لعلوم الأساسية والتطبيقية ا :مجلة الجامعة الأسمرية
2017يونيو (،1العدد )( 2)جلد الم
86
Figure 16. Motor Phase Voltages at Different Eccentricities and Loadings.
Eccentricity Current Signals
Fig. 17 illustrates the current responses for the healthy motor and for both static and dynamic
eccentricities with different loadings.
2 2.01 2.02 2.03 2.04 2.05 -30
-20
-10
0
10
20
30
Time (sec)
Cu
rren
t (A
)
Currents @ 40 Nm loading
i hlty i St.Ecc i Dy.Ecc
1.85 1.86 1.87 1.88 1.89
-40
-30
-20
-10
0
10
20
Time (sec)
Cu
rren
t (A
)
Healthy Motor- Eccty
i 0 Nm i 30 Nm i 40 Nm i 50 Nm
2 2.01 2.02 2.03 2.04 2.05 -400
-300
-200
-100
0
100
200
300
400
Time (sec)
Vo
ltag
e (
V)
Dynamic Eccentricity
V 0 Nm
V 30 Nm
V 40 Nm
V 50 Nm
1.525 1.53 1.535 1.54 1.545 1.55 1.555
-400
-200
0
200
400
Time (sec)
Vo
ltag
e
(V)
Healthy Motor-
Eccentricityy
V 0 Nm
V 30 Nm
V 40 Nm
V 50 Nm
لعلوم الأساسية والتطبيقية ا :مجلة الجامعة الأسمرية
2017يونيو (،1العدد )( 2)جلد الم
87
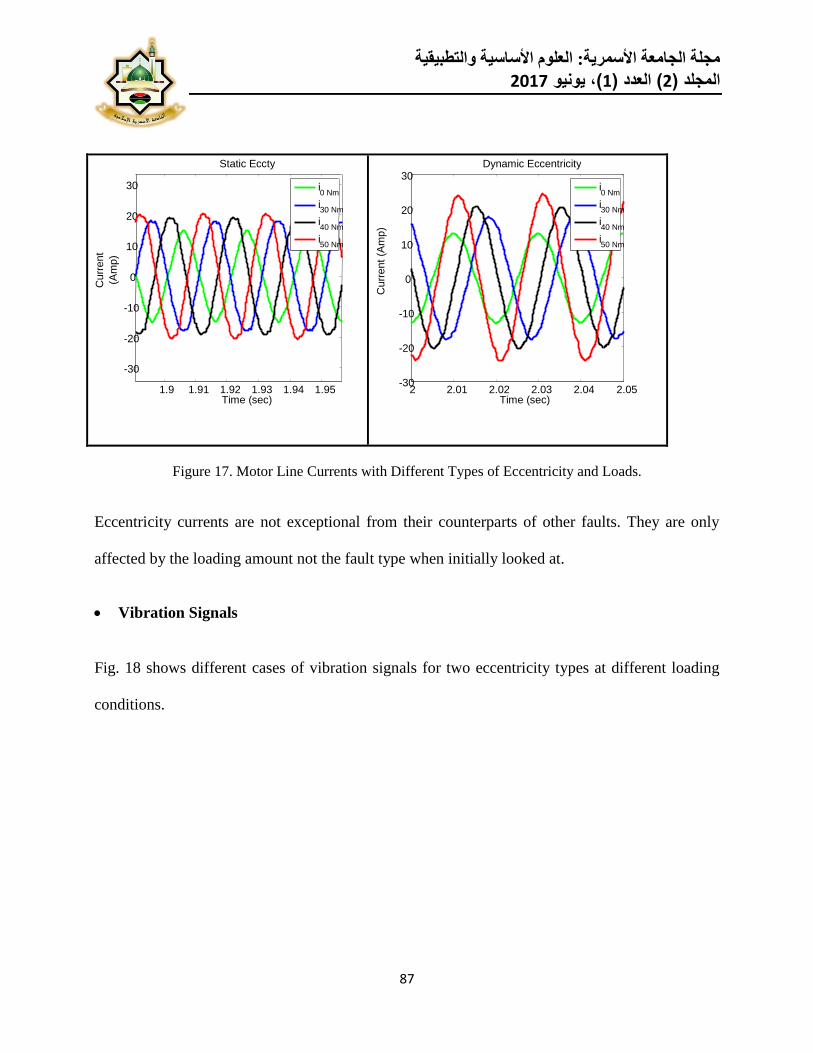
Figure 17. Motor Line Currents with Different Types of Eccentricity and Loads.
Eccentricity currents are not exceptional from their counterparts of other faults. They are only
affected by the loading amount not the fault type when initially looked at.
Vibration Signals
Fig. 18 shows different cases of vibration signals for two eccentricity types at different loading
conditions.
2 2.01 2.02 2.03 2.04 2.05 -30
-20
-10
0
10
20
30
Time (sec)
Dynamic Eccentricity
i 0 Nm i 30 Nm i 40 Nm i 50 Nm
1.9 1.91 1.92 1.93 1.94 1.95
-30
-20
-10
0
10
20
30
Time (sec)
Curr
ent
(Am
p)
Static Eccty
i 0 Nm i 30 Nm i 40 Nm i 50 Nm
Curr
ent
(Am
p)
لعلوم الأساسية والتطبيقية ا :مجلة الجامعة الأسمرية
2017يونيو (،1العدد )( 2)جلد الم
88
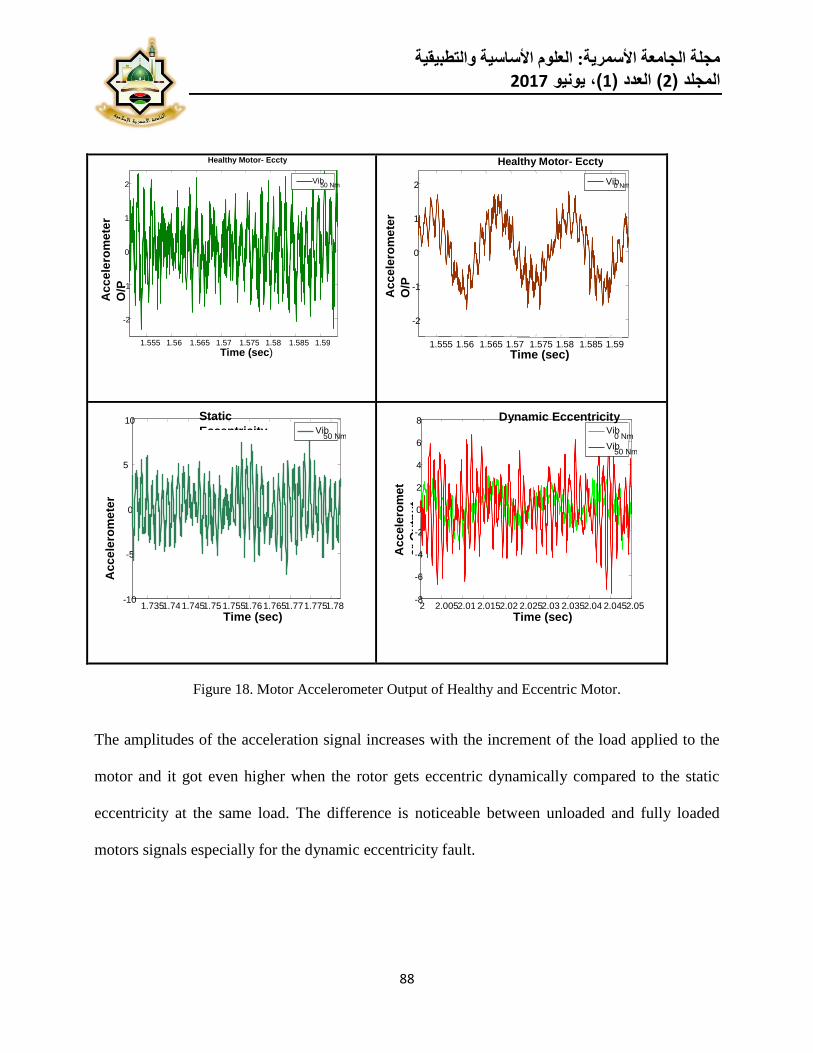
Figure 18. Motor Accelerometer Output of Healthy and Eccentric Motor.
The amplitudes of the acceleration signal increases with the increment of the load applied to the
motor and it got even higher when the rotor gets eccentric dynamically compared to the static
eccentricity at the same load. The difference is noticeable between unloaded and fully loaded
motors signals especially for the dynamic eccentricity fault.
2 2.005 2.01 2.015 2.02 2.025 2.03 2.035 2.04 2.045 2.05 -8
-6
-4
-2
0
2
4
6
8
Time (sec)
Acc
ele
rom
et
er
Ou
tpu
t
Vib 0 Nm
Vib 50 Nm
1.735 1.74 1.745 1.75 1.755 1.76 1.765 1.77 1.775 1.78 -10
-5
0
5
10
Time (sec)
Acc
ele
rom
ete
r
Ou
tpu
t
Vib 50 Nm
1.555 1.56 1.565 1.57 1.575 1.58 1.585 1.59
-2
-1
0
1
2
Time (sec)
Healthy Motor- Eccty
Vib 0 Nm
1.555 1.56 1.565 1.57 1.575 1.58 1.585 1.59
-2
-1
0
1
2
Time (sec)
Ac
ce
lero
me
ter
O/P
(m
/s
Healthy Motor- Eccty
Vib 50 Nm
Ac
ce
lero
me
ter
O/P
Dynamic Eccentricity Static
Eccentricity
لعلوم الأساسية والتطبيقية ا :مجلة الجامعة الأسمرية
2017يونيو (،1العدد )( 2)جلد الم
89
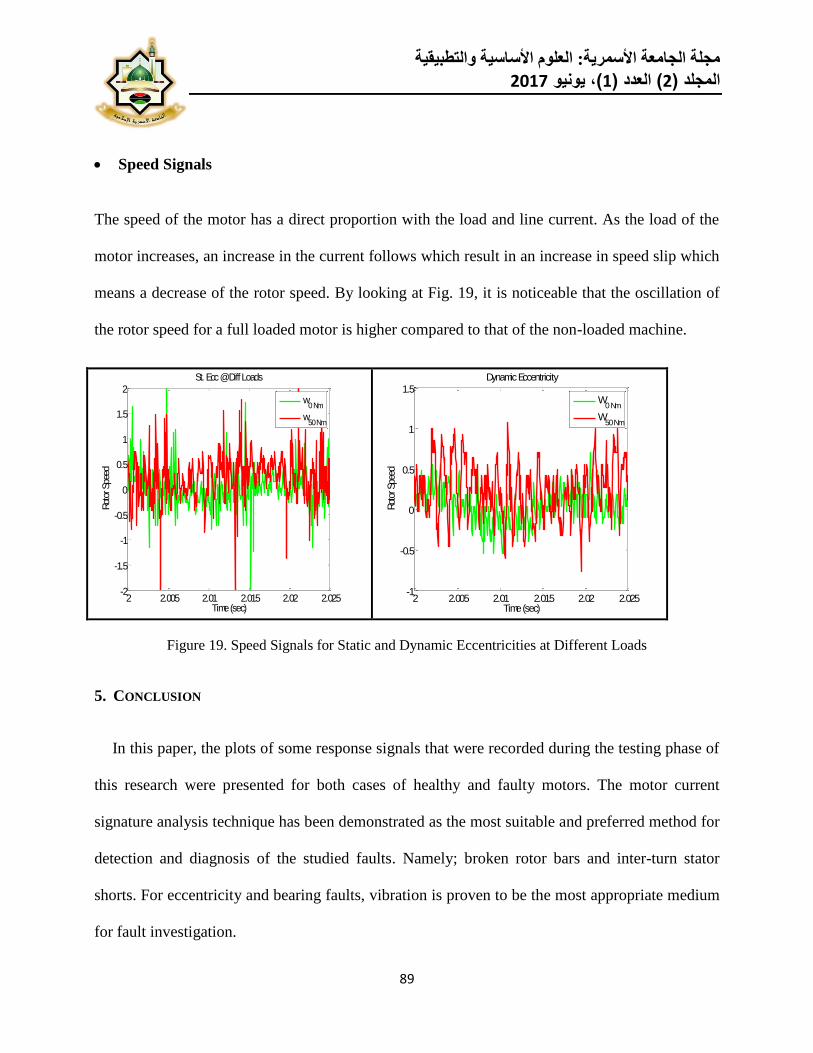
Speed Signals
The speed of the motor has a direct proportion with the load and line current. As the load of the
motor increases, an increase in the current follows which result in an increase in speed slip which
means a decrease of the rotor speed. By looking at Fig. 19, it is noticeable that the oscillation of
the rotor speed for a full loaded motor is higher compared to that of the non-loaded machine.
Figure 19. Speed Signals for Static and Dynamic Eccentricities at Different Loads
5. CONCLUSION
In this paper, the plots of some response signals that were recorded during the testing phase of
this research were presented for both cases of healthy and faulty motors. The motor current
signature analysis technique has been demonstrated as the most suitable and preferred method for
detection and diagnosis of the studied faults. Namely; broken rotor bars and inter-turn stator
shorts. For eccentricity and bearing faults, vibration is proven to be the most appropriate medium
for fault investigation.
2 2.005 2.01 2.015 2.02 2.025-2
-1.5
-1
-0.5
0
0.5
1
1.5
2
Time (sec)
Rot
or S
peed
St. Ecc @ Diff Loads
w0 Nm
w50 Nm
2 2.005 2.01 2.015 2.02 2.025-1
-0.5
0
0.5
1
1.5
Time (sec)
Rot
or S
peed
Dynamic Eccentricity
W0 Nm
W50 Nm
لعلوم الأساسية والتطبيقية ا :مجلة الجامعة الأسمرية
2017يونيو (،1العدد )( 2)جلد الم
90
REFERENCES
[1] P. Bhowmik, S. Pradhan and M. Prakash, “Fault Diagnostic and Monitoring Methods of Induction
Motor: A Review”, International Journal of Applied Control, Electrical and Electronics Engineering
(IJACEEE) Volume 1, Number 1, May 2013.
[2] J. Penman, H.G. Sedding, B.A. Lloyd and W.T. Fink, “Detection and Location of Interturn Short
Circuits in the Stator Windings of Operating Motors”, IEEE Transactions on Energy Conversion, 9,
1994, 652-658.
[3] M. Fenger, M. Susnik, P. Laderoute and W. T. Thomson, “Development of a Tool to Detect Faults in
Induction Motors via Current Signature Analysis”, Proceedings of Cement Industry Technical
Conference, 4-9 May 2003, 37-46.
[4] C. Yeh, A. Sayed, and R. Povinelli, “A Reconfigureurable Motor for Experimental Emulation of
Stator Winding Inter-Turn and Broken Bar Faults in Poly Phase Induction Machines”, IEEE
International Electric Machines & Drives Conference, Antalya, 3-5, Vol. 2, 1413-1419, May 2007.
[5] G.K. Singh and Sa’ad Ahmed Saleh Al Kazzaz, “Induction Machine Drive Condition Monitoring and
Diagnostic Research-A Survey”, Electric Power Systems Research, vol. 64, pp. 145-158, 2003.
[6] M. L. Sin, W. L. Soong and N. Ertugrul, "Induction Machine On-Line Condition Monitoring and
Fault Diagnosis - A Survey", AUPEC2003, Australasian Universities Power Engineering
Conference, Christchurch, New Zealand, pp. 1-6, 2003.
[7] A. H. Bonnett, “Root Cause AC Motor Failure Analysis with a Focus on Shaft Failures”, IEEE
transactions on industry applications, vol. 36, no. 5, September/October 2000.
[8] S. Hamdani, O. Touhami, R. Ibtiouen and M. Fadel, “Neural Network technique for induction motor
rotor faults classification –Dynamic eccentricity and broken bar faults”, Power Electronics & Drives
(SDEMPED), 2011 IEEE International Symposium on Diagnostics for Electric Machines,
10.1109/DEMPED.2011.6063689, 2011, pp. 626-631.
[9] J. Zarei and J. Poshtan, “Bearing Fault Detection in Induction Motor Using Pattern Recognition
Techniques”, 2nd IEEE International Conference on Power and Energy (PECon 08), December 1-3,
2008, Johor Baharu, Malaysia, pp. 749-753.
[10] A. H. Bonnet, “Cause And Analysis of Stator and Rotor Failures in Three phase Squirrel-Cage
Induction Motors,” IEEE Trans. Ind. Appl., vol. 28, no. 4, pp. 921–437, Jul./Aug. 1992.
[11] A. H. Bonnett and G. C. Soukpup, “Rotor Failures in Squirrel Cage Induction Motors,” IEEE Trans.
Ind. Appl., vol. IA-22, no. 6, pp. 1165–1173,Nov./Dec.1986.
لعلوم الأساسية والتطبيقية ا :مجلة الجامعة الأسمرية
2017يونيو (،1العدد )( 2)جلد الم
91
[12] P. J. Tanver and J. Penman, "Condition Monitoring Electrical Machines", Hertfordshire, U.K.:
Research Studies Press, 1987.
[13] M. Arkan, D. K. PeroviC and Punsworth, “Online Stator Fault Diagnosis in Induction Motors”, IEEE
Proc-Electr. Power Appl. vol. 148, no. 6, November 2001.
[14] K. Prakasam and S. Ramesh, “Testing and Analysis of Induction Motor Electrical Faults Using
Current Signature Analysis”, Circuits and Systems, 2016, 7, 2651-2662.
[15] A. Siddhiqui, G. S. Yadava and B. Singh, "A Review of Stator Fault Monitoring Techniques
ofInduction Motors", IEEE Transactions on Energy Conversion, vol.20, no.1, March 2005.
[16] Subhasis Nandi, Thirumarai Chelvan Ilamparithi, Sang Bin Lee and Doosoo Hyun, “Detection of
Eccentricity Faults in Induction Machines Based on Nameplate Parameters”, IEEE Transactions on
Industrial Electronics, vol. 58, no. 5, May 2011.
[17] S. Nandi, R. M. Bharadwaj, and H. A. Toliyat, “Performance analysis of a three phase induction
motor under incipient mixed eccentricity condition,” IEEE Trans. Energy Convers., vol. 17, no. 3,
pp. 392–399, Sep. 2002.
[18] X. Li, Q. Wu, and S. Nandi, “Performance analysis of a three-phase induction machine with inclined
static eccentricity,” IEEE Trans. Ind. Appl., vol. 43, no. 2, pp. 531–541, Mar./Apr. 2007.


![Fault Diagnosis System of Induction Motors Based on Neural ...downloads.hindawi.com/journals/ijrm/2006/061690.pdf · Table 1: Fault occurrence possibility on induction motor [2]](https://img.pdfslide.net/doc/110x75/5ebcc7cd12e2c058e72a65f3/fault-diagnosis-system-of-induction-motors-based-on-neural-table-1-fault-occurrence.jpg)