Embed Size (px)
Citation preview
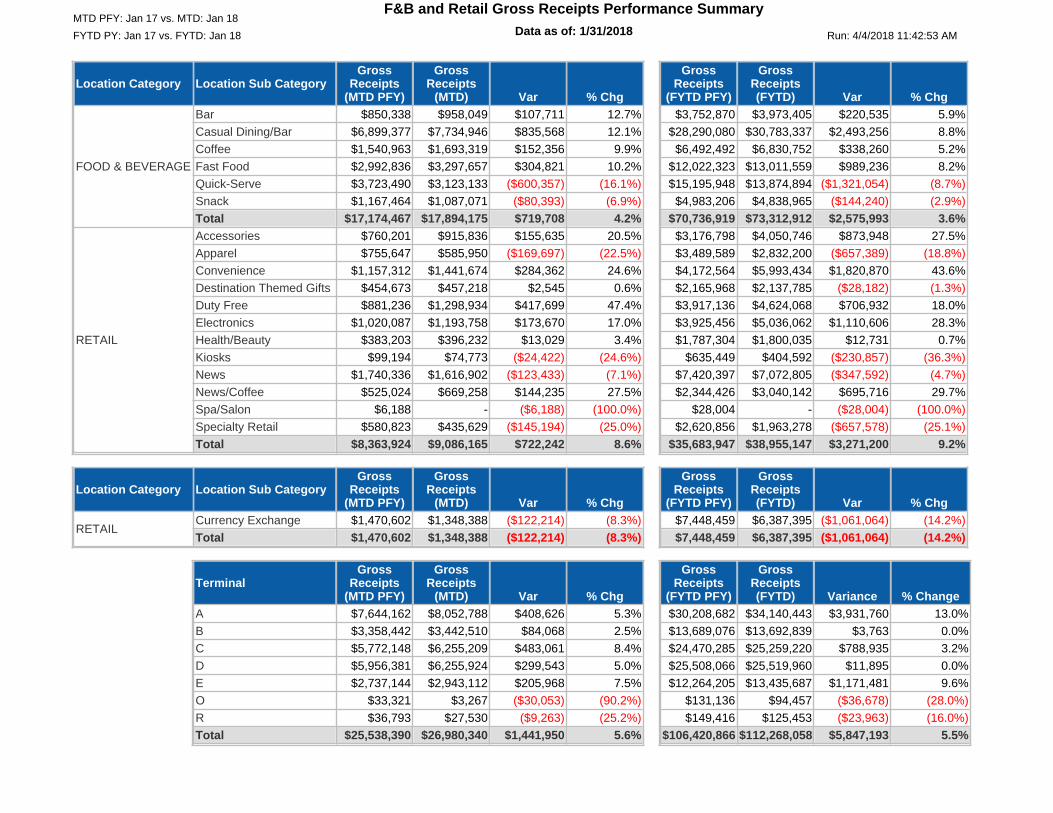
Run: 4/4/2018 11:42:53 AMData as of: 1/31/201812:00:00 AM
F&B and Retail Gross Receipts Performance Summary
FYTD PY: Jan 17 vs. FYTD: Jan 18MTD PFY: Jan 17 vs. MTD: Jan 18
Location Category Location Sub CategoryGross
Receipts(MTD PFY)
GrossReceipts
(MTD) Var % Chg
FOOD & BEVERAGE
RETAIL
BarCasual Dining/BarCoffeeFast FoodQuick-ServeSnackTotalAccessoriesApparelConvenienceDestination Themed GiftsDuty FreeElectronicsHealth/BeautyKiosksNewsNews/CoffeeSpa/SalonSpecialty RetailTotal
$850,338 $958,049 $107,711 12.7%$6,899,377 $7,734,946 $835,568 12.1%$1,540,963 $1,693,319 $152,356 9.9%$2,992,836 $3,297,657 $304,821 10.2%$3,723,490 $3,123,133 ($600,357) (16.1%)$1,167,464 $1,087,071 ($80,393) (6.9%)
$17,174,467 $17,894,175 $719,708 4.2%$760,201 $915,836 $155,635 20.5%$755,647 $585,950 ($169,697) (22.5%)
$1,157,312 $1,441,674 $284,362 24.6%$454,673 $457,218 $2,545 0.6%$881,236 $1,298,934 $417,699 47.4%
$1,020,087 $1,193,758 $173,670 17.0%$383,203 $396,232 $13,029 3.4%$99,194 $74,773 ($24,422) (24.6%)
$1,740,336 $1,616,902 ($123,433) (7.1%)$525,024 $669,258 $144,235 27.5%
$6,188 - ($6,188) (100.0%)$580,823 $435,629 ($145,194) (25.0%)
$8,363,924 $9,086,165 $722,242 8.6%
GrossReceipts
(FYTD PFY)
GrossReceipts(FYTD) Var % Chg
$3,752,870 $3,973,405 $220,535 5.9%$28,290,080 $30,783,337 $2,493,256 8.8%$6,492,492 $6,830,752 $338,260 5.2%
$12,022,323 $13,011,559 $989,236 8.2%$15,195,948 $13,874,894 ($1,321,054) (8.7%)$4,983,206 $4,838,965 ($144,240) (2.9%)
$70,736,919 $73,312,912 $2,575,993 3.6%$3,176,798 $4,050,746 $873,948 27.5%$3,489,589 $2,832,200 ($657,389) (18.8%)$4,172,564 $5,993,434 $1,820,870 43.6%$2,165,968 $2,137,785 ($28,182) (1.3%)$3,917,136 $4,624,068 $706,932 18.0%$3,925,456 $5,036,062 $1,110,606 28.3%$1,787,304 $1,800,035 $12,731 0.7%
$635,449 $404,592 ($230,857) (36.3%)$7,420,397 $7,072,805 ($347,592) (4.7%)$2,344,426 $3,040,142 $695,716 29.7%
$28,004 - ($28,004) (100.0%)$2,620,856 $1,963,278 ($657,578) (25.1%)
$35,683,947 $38,955,147 $3,271,200 9.2%
Location Category Location Sub CategoryGross
Receipts(MTD PFY)
GrossReceipts
(MTD) Var % Chg
RETAILCurrency ExchangeTotal
$1,470,602 $1,348,388 ($122,214) (8.3%)$1,470,602 $1,348,388 ($122,214) (8.3%)
GrossReceipts
(FYTD PFY)
GrossReceipts(FYTD) Var % Chg
$7,448,459 $6,387,395 ($1,061,064) (14.2%)$7,448,459 $6,387,395 ($1,061,064) (14.2%)
TerminalGross
Receipts(MTD PFY)
GrossReceipts
(MTD) Var % ChgABCDEORTotal
$7,644,162 $8,052,788 $408,626 5.3%$3,358,442 $3,442,510 $84,068 2.5%$5,772,148 $6,255,209 $483,061 8.4%$5,956,381 $6,255,924 $299,543 5.0%$2,737,144 $2,943,112 $205,968 7.5%
$33,321 $3,267 ($30,053) (90.2%)$36,793 $27,530 ($9,263) (25.2%)
$25,538,390 $26,980,340 $1,441,950 5.6%
GrossReceipts
(FYTD PFY)
GrossReceipts(FYTD) Variance % Change
$30,208,682 $34,140,443 $3,931,760 13.0%$13,689,076 $13,692,839 $3,763 0.0%$24,470,285 $25,259,220 $788,935 3.2%$25,508,066 $25,519,960 $11,895 0.0%$12,264,205 $13,435,687 $1,171,481 9.6%
$131,136 $94,457 ($36,678) (28.0%)$149,416 $125,453 ($23,963) (16.0%)
$106,420,866 $112,268,058 $5,847,193 5.5%

FOOD & BEVERAGE Summary by MonthRun: 4/4/2018 11:48:59 AM Data as of: 1/31/2018
12:00:00 AM
FiscalYear
Gross Receipts % Chg CFY PFYOctober November December January February March April
2018 2.3% 3.7% 4.5% 4.2% -- -- --
FiscalYear
Gross ReceiptsOctober November December January February March April May June July August September
201820172016
$18,760,220 $17,933,004 $18,725,512 $17,894,175 - - - - - - - -$18,346,513 $17,300,804 $17,915,135 $17,174,467 $16,111,042 $19,413,456 $18,438,231 $19,450,003 $21,188,144 $20,658,269 $19,332,547 $17,651,572$18,777,999 $17,389,400 $18,021,841 $16,856,523 $16,352,727 $18,962,216 $17,657,836 $18,418,501 $20,021,855 $20,347,499 $19,073,471 $18,174,738
FiscalYear
Gross Receipts % Chg CFYTD PFYTDOctober November December January February March April
2018 2.3% 2.9% 3.5% 3.6% -- -- --
FiscalYear
Gross Receipts (FYTD)October November December January February March April May June July August September
201820172016
$18,760,220 $36,693,225 $55,418,737 $73,312,912 - - - - - - - -$18,346,513 $35,647,317 $53,562,452 $70,736,919 $86,847,961 $106,261,417 $124,699,648 $144,149,651 $165,337,796 $185,996,065 $205,328,612 $222,980,184$18,777,999 $36,167,398 $54,189,239 $71,045,762 $87,398,489 $106,360,706 $124,018,541 $142,437,043 $162,458,898 $182,806,397 $201,879,868 $220,054,607
Summary by Month
Year to Date Comparison
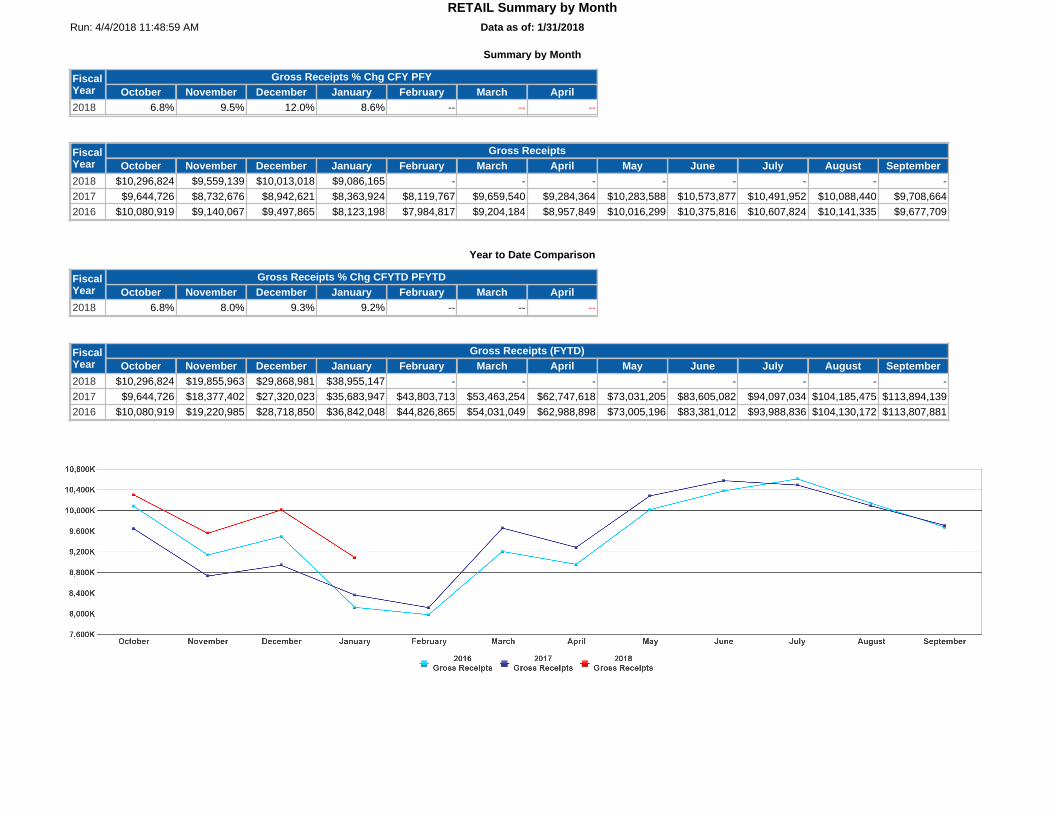
RETAIL Summary by MonthRun: 4/4/2018 11:48:59 AM Data as of: 1/31/2018
12:00:00 AM
FiscalYear
Gross Receipts % Chg CFY PFYOctober November December January February March April
2018 6.8% 9.5% 12.0% 8.6% -- -- --
FiscalYear
Gross ReceiptsOctober November December January February March April May June July August September
201820172016
$10,296,824 $9,559,139 $10,013,018 $9,086,165 - - - - - - - -$9,644,726 $8,732,676 $8,942,621 $8,363,924 $8,119,767 $9,659,540 $9,284,364 $10,283,588 $10,573,877 $10,491,952 $10,088,440 $9,708,664
$10,080,919 $9,140,067 $9,497,865 $8,123,198 $7,984,817 $9,204,184 $8,957,849 $10,016,299 $10,375,816 $10,607,824 $10,141,335 $9,677,709
FiscalYear
Gross Receipts % Chg CFYTD PFYTDOctober November December January February March April
2018 6.8% 8.0% 9.3% 9.2% -- -- --
FiscalYear
Gross Receipts (FYTD)October November December January February March April May June July August September
201820172016
$10,296,824 $19,855,963 $29,868,981 $38,955,147 - - - - - - - -$9,644,726 $18,377,402 $27,320,023 $35,683,947 $43,803,713 $53,463,254 $62,747,618 $73,031,205 $83,605,082 $94,097,034 $104,185,475 $113,894,139
$10,080,919 $19,220,985 $28,718,850 $36,842,048 $44,826,865 $54,031,049 $62,988,898 $73,005,196 $83,381,012 $93,988,836 $104,130,172 $113,807,881
Summary by Month
Year to Date Comparison
Data as of: 1/31/201812:00:00 AM
Run: 4/4/2018 11:55:32 AM
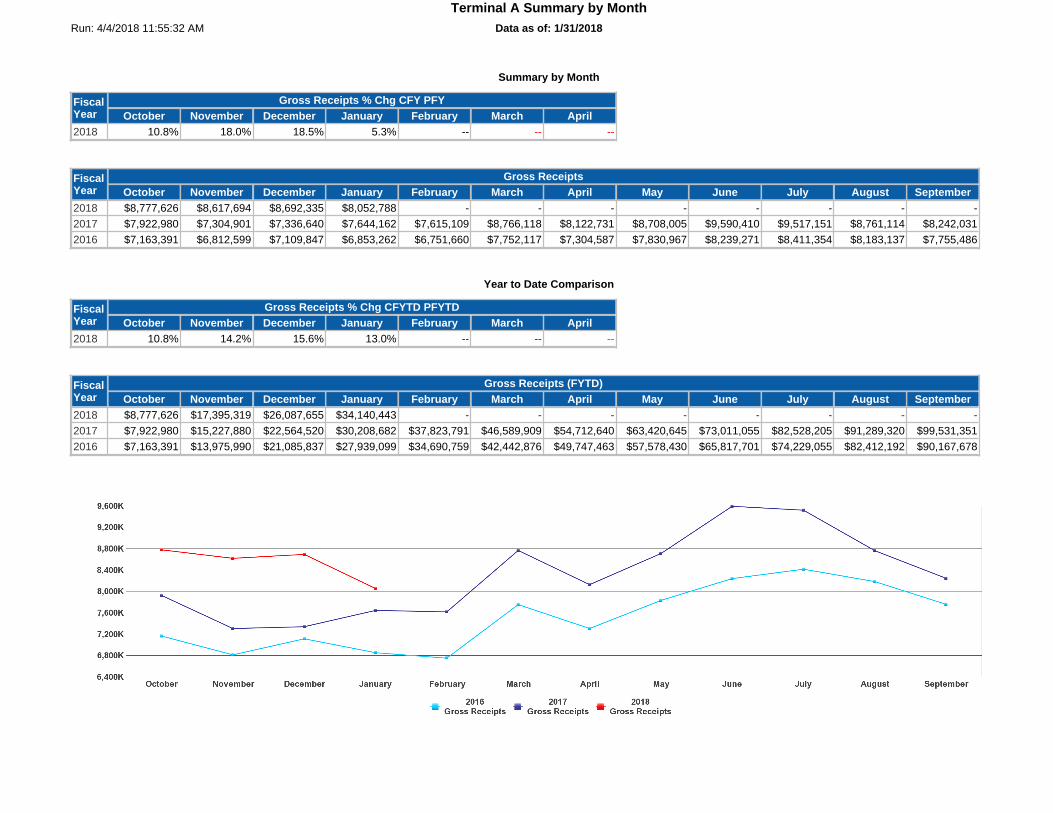
Terminal A Summary by Month
FiscalYear
Gross Receipts % Chg CFY PFYOctober November December January February March April
2018 10.8% 18.0% 18.5% 5.3% -- -- --
FiscalYear
Gross ReceiptsOctober November December January February March April May June July August September
201820172016
$8,777,626 $8,617,694 $8,692,335 $8,052,788 - - - - - - - -$7,922,980 $7,304,901 $7,336,640 $7,644,162 $7,615,109 $8,766,118 $8,122,731 $8,708,005 $9,590,410 $9,517,151 $8,761,114 $8,242,031$7,163,391 $6,812,599 $7,109,847 $6,853,262 $6,751,660 $7,752,117 $7,304,587 $7,830,967 $8,239,271 $8,411,354 $8,183,137 $7,755,486
FiscalYear
Gross Receipts % Chg CFYTD PFYTDOctober November December January February March April
2018 10.8% 14.2% 15.6% 13.0% -- -- --
FiscalYear
Gross Receipts (FYTD)October November December January February March April May June July August September
201820172016
$8,777,626 $17,395,319 $26,087,655 $34,140,443 - - - - - - - -$7,922,980 $15,227,880 $22,564,520 $30,208,682 $37,823,791 $46,589,909 $54,712,640 $63,420,645 $73,011,055 $82,528,205 $91,289,320 $99,531,351$7,163,391 $13,975,990 $21,085,837 $27,939,099 $34,690,759 $42,442,876 $49,747,463 $57,578,430 $65,817,701 $74,229,055 $82,412,192 $90,167,678
Summary by Month
Year to Date Comparison

Data as of: 1/31/201812:00:00 AM
Run: 4/4/2018 11:55:32 AM
Terminal B Summary by Month
FiscalYear
Gross Receipts % Chg CFY PFYOctober November December January February March April
2018 (0.7%) (0.9%) (0.7%) 2.5% -- -- --
FiscalYear
Gross ReceiptsOctober November December January February March April May June July August September
201820172016
$3,411,155 $3,236,245 $3,602,929 $3,442,510 - - - - - - - -$3,434,719 $3,267,122 $3,628,794 $3,358,442 $3,053,490 $3,621,085 $3,437,083 $3,630,672 $4,080,667 $4,043,619 $3,835,022 $3,388,687$3,820,181 $3,543,317 $3,746,638 $3,329,372 $3,291,549 $3,476,135 $3,328,441 $3,606,450 $3,729,118 $3,883,287 $3,618,668 $3,384,598
FiscalYear
Gross Receipts % Chg CFYTD PFYTDOctober November December January February March April
2018 (0.7%) (0.8%) (0.8%) 0.0% -- -- --
FiscalYear
Gross Receipts (FYTD)October November December January February March April May June July August September
201820172016
$3,411,155 $6,647,400 $10,250,329 $13,692,839 - - - - - - - -$3,434,719 $6,701,841 $10,330,635 $13,689,076 $16,742,566 $20,363,651 $23,800,734 $27,431,406 $31,512,073 $35,555,691 $39,390,714 $42,779,400$3,820,181 $7,363,497 $11,110,135 $14,439,508 $17,731,057 $21,207,192 $24,535,633 $28,142,083 $31,871,201 $35,754,488 $39,373,156 $42,757,754
Summary by Month
Year to Date Comparison

Data as of: 1/31/201812:00:00 AM
Run: 4/4/2018 11:55:32 AM
Terminal C Summary by Month
FiscalYear
Gross Receipts % Chg CFY PFYOctober November December January February March April
2018 4.7% 0.2% 0.0% 8.4% -- -- --
FiscalYear
Gross ReceiptsOctober November December January February March April May June July August September
201820172016
$6,596,358 $6,105,566 $6,302,087 $6,255,209 - - - - - - - -$6,302,009 $6,095,974 $6,300,153 $5,772,148 $5,270,679 $6,675,036 $6,559,339 $6,716,583 $6,941,516 $6,553,796 $6,390,964 $6,072,223$6,108,556 $6,095,673 $6,343,375 $5,840,530 $5,932,456 $6,779,877 $6,217,182 $6,272,154 $7,234,934 $6,979,681 $6,470,616 $6,143,551
FiscalYear
Gross Receipts % Chg CFYTD PFYTDOctober November December January February March April
2018 4.7% 2.5% 1.6% 3.2% -- -- --
FiscalYear
Gross Receipts (FYTD)October November December January February March April May June July August September
201820172016
$6,596,358 $12,701,924 $19,004,011 $25,259,220 - - - - - - - -$6,302,009 $12,397,984 $18,698,137 $24,470,285 $29,740,964 $36,416,000 $42,975,339 $49,691,922 $56,633,437 $63,187,233 $69,578,198 $75,650,421$6,108,556 $12,204,229 $18,547,604 $24,388,134 $30,320,590 $37,100,466 $43,317,648 $49,589,802 $56,824,736 $63,804,417 $70,275,033 $76,418,584
Summary by Month
Year to Date Comparison

Data as of: 1/31/201812:00:00 AM
Run: 4/4/2018 11:55:32 AM
Terminal D Summary by Month
FiscalYear
Gross Receipts % Chg CFY PFYOctober November December January February March April
2018 (5.7%) (3.1%) 4.5% 5.0% -- -- --
FiscalYear
Gross ReceiptsOctober November December January February March April May June July August September
201820172016
$6,352,726 $6,060,795 $6,850,515 $6,255,924 - - - - - - - -$6,738,099 $6,257,868 $6,555,717 $5,956,381 $5,588,325 $6,630,852 $6,222,518 $6,856,171 $7,084,456 $7,097,433 $6,560,745 $6,086,301$7,969,799 $7,068,090 $7,688,191 $6,581,866 $5,938,407 $6,962,672 $6,484,733 $7,009,995 $7,272,190 $7,658,258 $7,137,998 $6,776,776
FiscalYear
Gross Receipts % Chg CFYTD PFYTDOctober November December January February March April
2018 (5.7%) (4.5%) (1.5%) 0.0% -- -- --
FiscalYear
Gross Receipts (FYTD)October November December January February March April May June July August September
201820172016
$6,352,726 $12,413,521 $19,264,036 $25,519,960 - - - - - - - -$6,738,099 $12,995,967 $19,551,684 $25,508,066 $31,096,390 $37,727,242 $43,949,760 $50,805,930 $57,890,387 $64,987,819 $71,548,565 $77,634,866$7,969,799 $15,037,889 $22,726,080 $29,307,946 $35,246,353 $42,209,025 $48,693,758 $55,703,753 $62,975,942 $70,634,200 $77,772,198 $84,548,974
Summary by Month
Year to Date Comparison
Data as of: 1/31/201812:00:00 AM
Run: 4/4/2018 11:55:32 AM
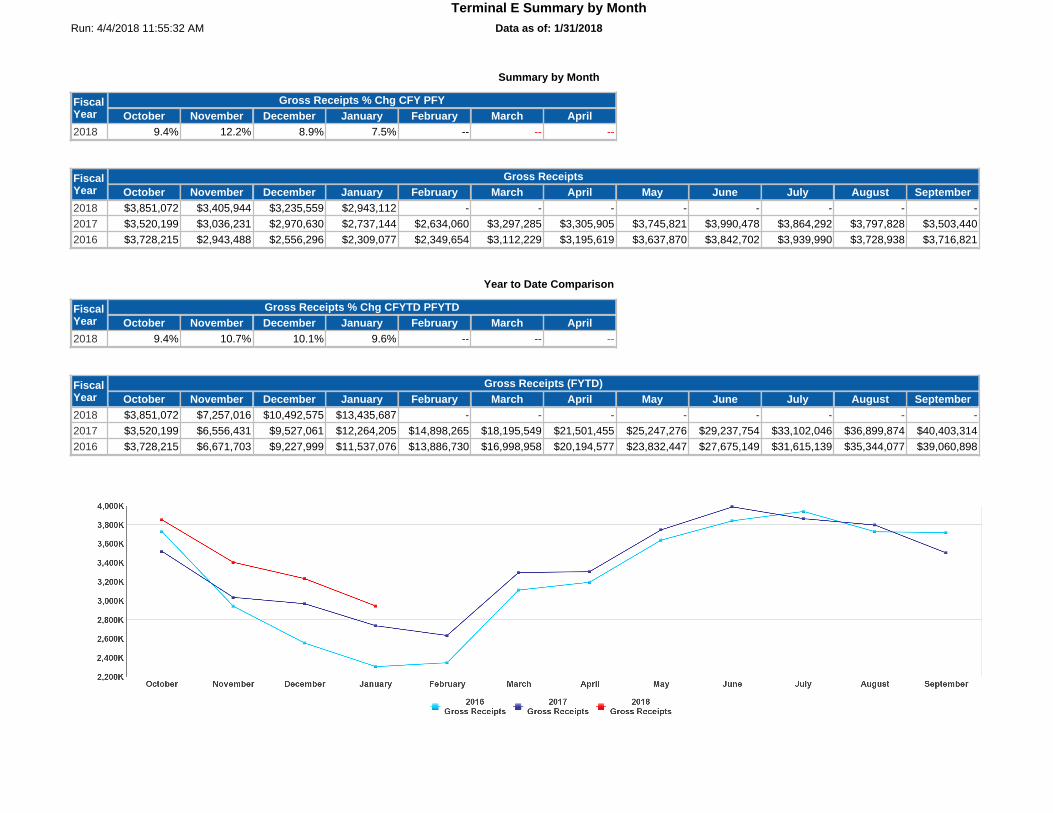
Terminal E Summary by Month
FiscalYear
Gross Receipts % Chg CFY PFYOctober November December January February March April
2018 9.4% 12.2% 8.9% 7.5% -- -- --
FiscalYear
Gross ReceiptsOctober November December January February March April May June July August September
201820172016
$3,851,072 $3,405,944 $3,235,559 $2,943,112 - - - - - - - -$3,520,199 $3,036,231 $2,970,630 $2,737,144 $2,634,060 $3,297,285 $3,305,905 $3,745,821 $3,990,478 $3,864,292 $3,797,828 $3,503,440$3,728,215 $2,943,488 $2,556,296 $2,309,077 $2,349,654 $3,112,229 $3,195,619 $3,637,870 $3,842,702 $3,939,990 $3,728,938 $3,716,821
FiscalYear
Gross Receipts % Chg CFYTD PFYTDOctober November December January February March April
2018 9.4% 10.7% 10.1% 9.6% -- -- --
FiscalYear
Gross Receipts (FYTD)October November December January February March April May June July August September
201820172016
$3,851,072 $7,257,016 $10,492,575 $13,435,687 - - - - - - - -$3,520,199 $6,556,431 $9,527,061 $12,264,205 $14,898,265 $18,195,549 $21,501,455 $25,247,276 $29,237,754 $33,102,046 $36,899,874 $40,403,314$3,728,215 $6,671,703 $9,227,999 $11,537,076 $13,886,730 $16,998,958 $20,194,577 $23,832,447 $27,675,149 $31,615,139 $35,344,077 $39,060,898
Summary by Month
Year to Date Comparison
Data as of: 1/31/201812:00:00 AM
Run: 4/4/2018 12:00:25 PM
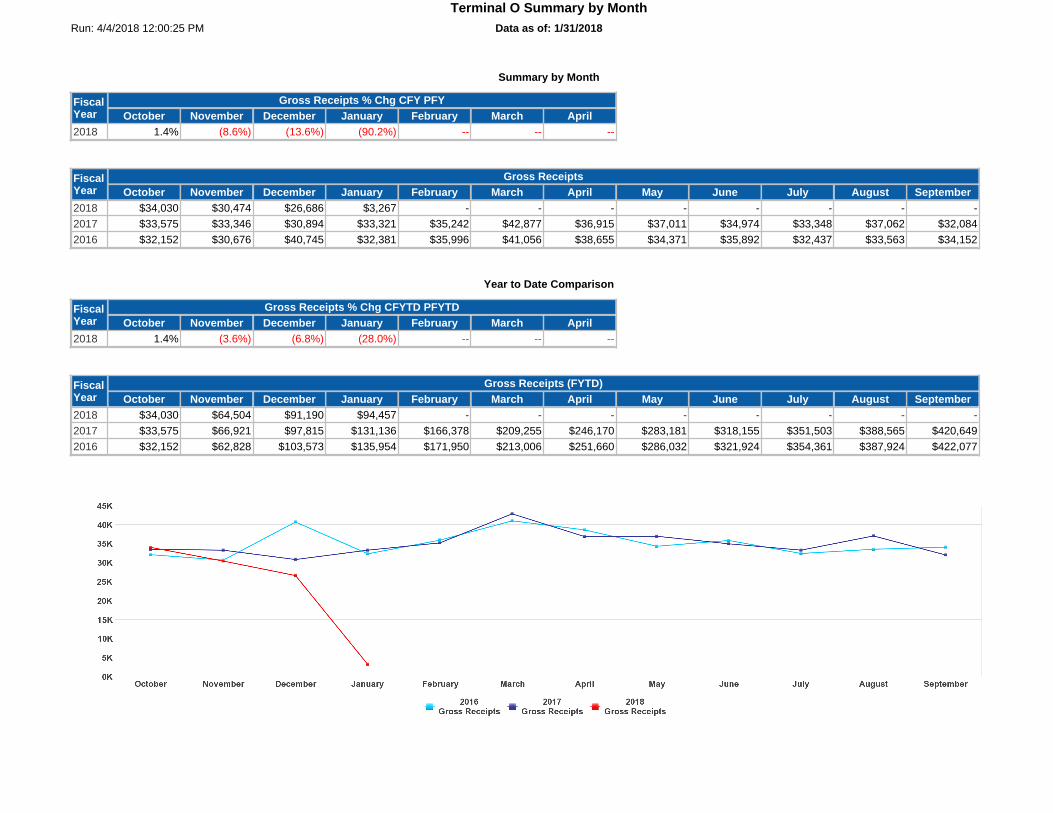
Terminal O Summary by Month
FiscalYear
Gross Receipts % Chg CFY PFYOctober November December January February March April
2018 1.4% (8.6%) (13.6%) (90.2%) -- -- --
FiscalYear
Gross ReceiptsOctober November December January February March April May June July August September
201820172016
$34,030 $30,474 $26,686 $3,267 - - - - - - - -$33,575 $33,346 $30,894 $33,321 $35,242 $42,877 $36,915 $37,011 $34,974 $33,348 $37,062 $32,084$32,152 $30,676 $40,745 $32,381 $35,996 $41,056 $38,655 $34,371 $35,892 $32,437 $33,563 $34,152
FiscalYear
Gross Receipts % Chg CFYTD PFYTDOctober November December January February March April
2018 1.4% (3.6%) (6.8%) (28.0%) -- -- --
FiscalYear
Gross Receipts (FYTD)October November December January February March April May June July August September
201820172016
$34,030 $64,504 $91,190 $94,457 - - - - - - - -$33,575 $66,921 $97,815 $131,136 $166,378 $209,255 $246,170 $283,181 $318,155 $351,503 $388,565 $420,649$32,152 $62,828 $103,573 $135,954 $171,950 $213,006 $251,660 $286,032 $321,924 $354,361 $387,924 $422,077
Summary by Month
Year to Date Comparison
Data as of: 1/31/201812:00:00 AM
Run: 4/4/2018 12:00:25 PM
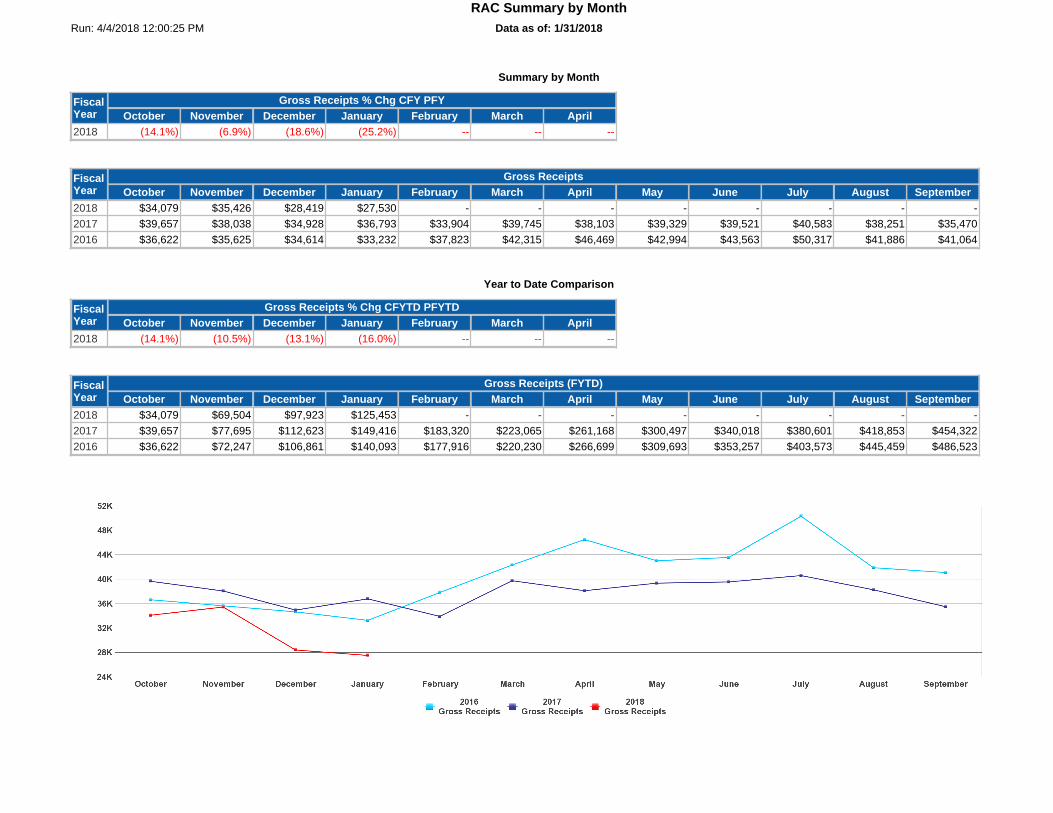
RAC Summary by Month
FiscalYear
Gross Receipts % Chg CFY PFYOctober November December January February March April
2018 (14.1%) (6.9%) (18.6%) (25.2%) -- -- --
FiscalYear
Gross ReceiptsOctober November December January February March April May June July August September
201820172016
$34,079 $35,426 $28,419 $27,530 - - - - - - - -$39,657 $38,038 $34,928 $36,793 $33,904 $39,745 $38,103 $39,329 $39,521 $40,583 $38,251 $35,470$36,622 $35,625 $34,614 $33,232 $37,823 $42,315 $46,469 $42,994 $43,563 $50,317 $41,886 $41,064
FiscalYear
Gross Receipts % Chg CFYTD PFYTDOctober November December January February March April
2018 (14.1%) (10.5%) (13.1%) (16.0%) -- -- --
FiscalYear
Gross Receipts (FYTD)October November December January February March April May June July August September
201820172016
$34,079 $69,504 $97,923 $125,453 - - - - - - - -$39,657 $77,695 $112,623 $149,416 $183,320 $223,065 $261,168 $300,497 $340,018 $380,601 $418,853 $454,322$36,622 $72,247 $106,861 $140,093 $177,916 $220,230 $266,699 $309,693 $353,257 $403,573 $445,459 $486,523
Summary by Month
Year to Date Comparison

Data as of: 1/31/201812:00:00 AM
Run: 4/4/2018 12:02:08 PM
Accessories Summary by Month
FiscalYear
Gross Receipts % Chg CFY PFYOctober November December January February March April
2018 15.9% 32.3% 42.3% 20.5% -- -- --
FiscalYear
Gross ReceiptsOctober November December January February March April May June July August September
201820172016
$1,006,446 $977,303 $1,151,161 $915,836 - - - - - - - -$868,723 $738,877 $808,997 $760,201 $762,620 $856,393 $841,108 $1,051,157 $974,439 $938,099 $907,312 $932,347$677,679 $647,968 $731,426 $697,853 $679,115 $799,038 $725,688 $817,703 $806,226 $872,702 $851,710 $825,578
FiscalYear
Gross Receipts % Chg CFYTD PFYTDOctober November December January February March April
2018 15.9% 23.4% 29.7% 27.5% -- -- --
FiscalYear
Gross Receipts (FYTD)October November December January February March April May June July August September
201820172016
$1,006,446 $1,983,749 $3,134,910 $4,050,746 - - - - - - - -$868,723 $1,607,600 $2,416,597 $3,176,798 $3,939,418 $4,795,811 $5,636,919 $6,688,076 $7,662,515 $8,600,614 $9,507,926 $10,440,274$677,679 $1,325,647 $2,057,073 $2,754,926 $3,434,041 $4,233,079 $4,958,767 $5,776,470 $6,582,697 $7,455,399 $8,307,108 $9,132,686
Summary by Month
Year to Date Comparison
Data as of: 1/31/201812:00:00 AM
Run: 4/4/2018 12:02:08 PM
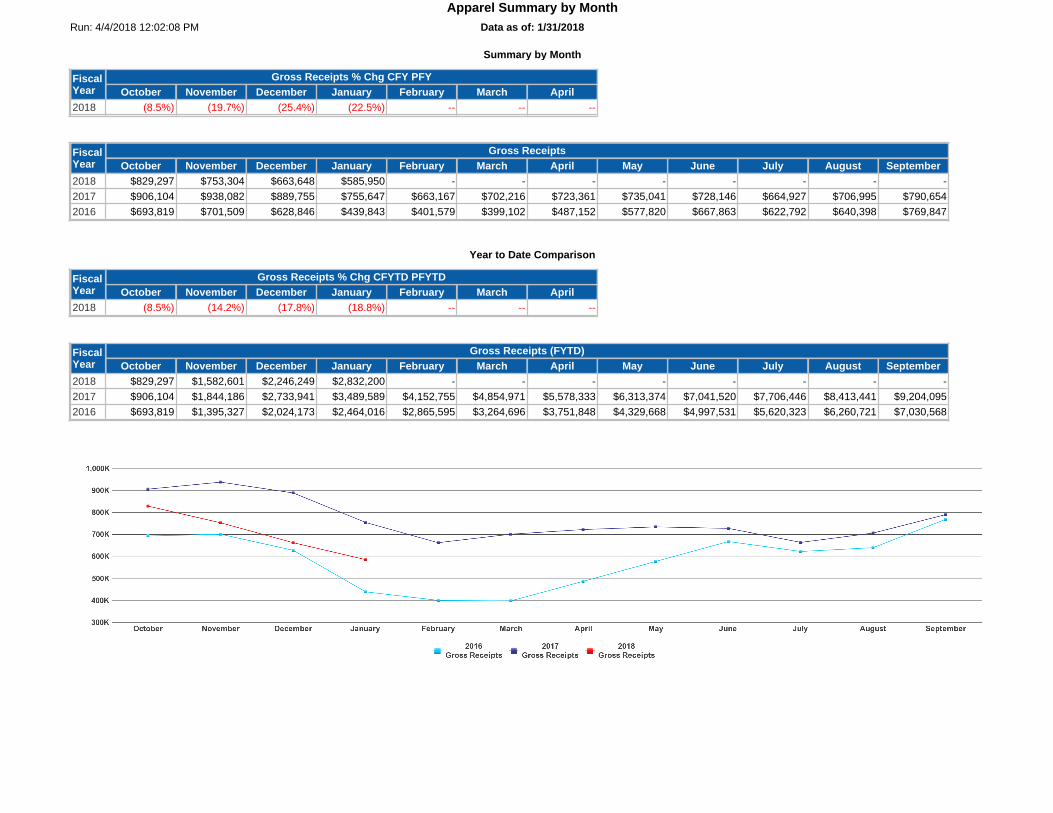
Apparel Summary by Month
FiscalYear
Gross Receipts % Chg CFY PFYOctober November December January February March April
2018 (8.5%) (19.7%) (25.4%) (22.5%) -- -- --
FiscalYear
Gross ReceiptsOctober November December January February March April May June July August September
201820172016
$829,297 $753,304 $663,648 $585,950 - - - - - - - -$906,104 $938,082 $889,755 $755,647 $663,167 $702,216 $723,361 $735,041 $728,146 $664,927 $706,995 $790,654$693,819 $701,509 $628,846 $439,843 $401,579 $399,102 $487,152 $577,820 $667,863 $622,792 $640,398 $769,847
FiscalYear
Gross Receipts % Chg CFYTD PFYTDOctober November December January February March April
2018 (8.5%) (14.2%) (17.8%) (18.8%) -- -- --
FiscalYear
Gross Receipts (FYTD)October November December January February March April May June July August September
201820172016
$829,297 $1,582,601 $2,246,249 $2,832,200 - - - - - - - -$906,104 $1,844,186 $2,733,941 $3,489,589 $4,152,755 $4,854,971 $5,578,333 $6,313,374 $7,041,520 $7,706,446 $8,413,441 $9,204,095$693,819 $1,395,327 $2,024,173 $2,464,016 $2,865,595 $3,264,696 $3,751,848 $4,329,668 $4,997,531 $5,620,323 $6,260,721 $7,030,568
Summary by Month
Year to Date Comparison

Data as of: 1/31/201812:00:00 AM
Run: 4/4/2018 12:02:08 PM
Bar Summary by Month
FiscalYear
Gross Receipts % Chg CFY PFYOctober November December January February March April
2018 0.7% 6.7% 4.5% 12.7% -- -- --
FiscalYear
Gross ReceiptsOctober November December January February March April May June July August September
201820172016
$1,029,113 $1,022,342 $963,901 $958,049 - - - - - - - -$1,022,129 $957,977 $922,426 $850,338 $886,954 $1,107,897 $1,066,971 $1,104,780 $1,178,811 $1,078,651 $1,001,757 $960,874$1,152,769 $1,085,983 $1,065,200 $1,052,163 $1,035,353 $1,200,164 $1,130,965 $1,094,740 $1,279,668 $1,222,495 $1,176,907 $1,063,164
FiscalYear
Gross Receipts % Chg CFYTD PFYTDOctober November December January February March April
2018 0.7% 3.6% 3.9% 5.9% -- -- --
FiscalYear
Gross Receipts (FYTD)October November December January February March April May June July August September
201820172016
$1,029,113 $2,051,455 $3,015,356 $3,973,405 - - - - - - - -$1,022,129 $1,980,106 $2,902,532 $3,752,870 $4,639,824 $5,747,721 $6,814,692 $7,919,472 $9,098,283 $10,176,933 $11,178,690 $12,139,564$1,152,769 $2,238,752 $3,303,952 $4,356,114 $5,391,467 $6,591,630 $7,722,596 $8,817,336 $10,097,005 $11,319,499 $12,496,406 $13,559,570
Summary by Month
Year to Date Comparison
Data as of: 1/31/201812:00:00 AM
Run: 4/4/2018 12:02:08 PM
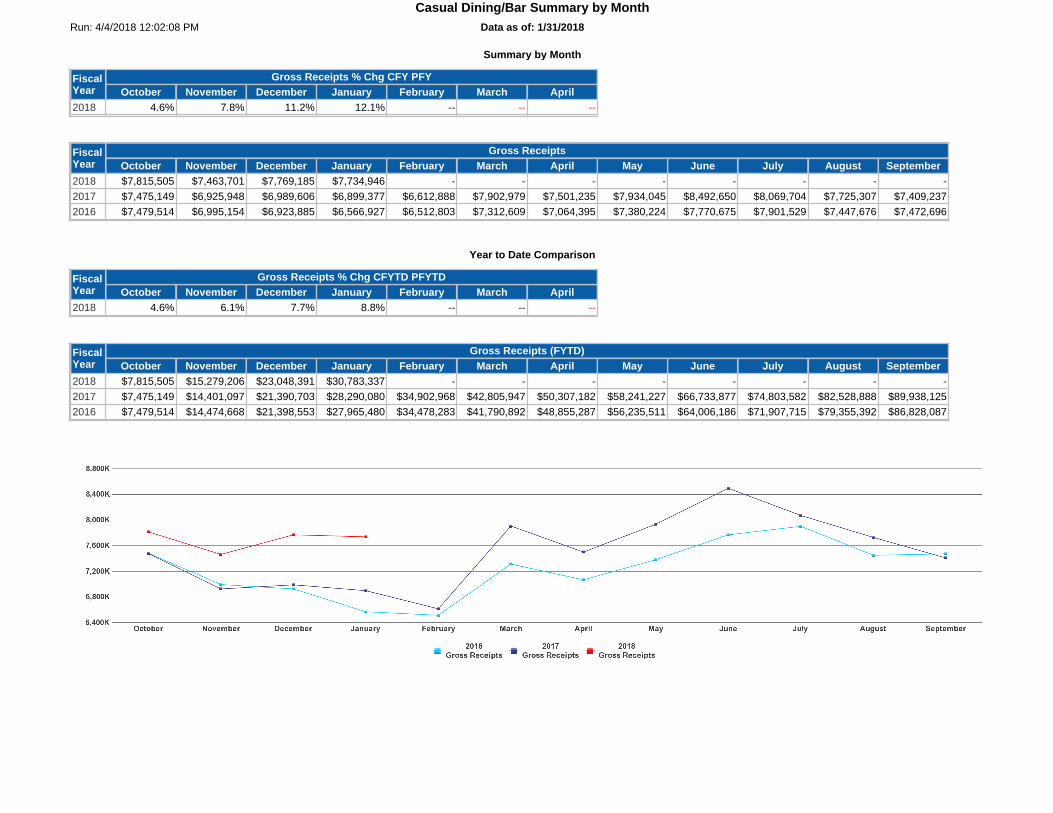
Casual Dining/Bar Summary by Month
FiscalYear
Gross Receipts % Chg CFY PFYOctober November December January February March April
2018 4.6% 7.8% 11.2% 12.1% -- -- --
FiscalYear
Gross ReceiptsOctober November December January February March April May June July August September
201820172016
$7,815,505 $7,463,701 $7,769,185 $7,734,946 - - - - - - - -$7,475,149 $6,925,948 $6,989,606 $6,899,377 $6,612,888 $7,902,979 $7,501,235 $7,934,045 $8,492,650 $8,069,704 $7,725,307 $7,409,237$7,479,514 $6,995,154 $6,923,885 $6,566,927 $6,512,803 $7,312,609 $7,064,395 $7,380,224 $7,770,675 $7,901,529 $7,447,676 $7,472,696
FiscalYear
Gross Receipts % Chg CFYTD PFYTDOctober November December January February March April
2018 4.6% 6.1% 7.7% 8.8% -- -- --
FiscalYear
Gross Receipts (FYTD)October November December January February March April May June July August September
201820172016
$7,815,505 $15,279,206 $23,048,391 $30,783,337 - - - - - - - -$7,475,149 $14,401,097 $21,390,703 $28,290,080 $34,902,968 $42,805,947 $50,307,182 $58,241,227 $66,733,877 $74,803,582 $82,528,888 $89,938,125$7,479,514 $14,474,668 $21,398,553 $27,965,480 $34,478,283 $41,790,892 $48,855,287 $56,235,511 $64,006,186 $71,907,715 $79,355,392 $86,828,087
Summary by Month
Year to Date Comparison

Data as of: 1/31/201812:00:00 AM
Run: 4/4/2018 12:02:08 PM
Coffee Summary by Month
FiscalYear
Gross Receipts % Chg CFY PFYOctober November December January February March April
2018 3.6% 2.8% 4.8% 9.9% -- -- --
FiscalYear
Gross ReceiptsOctober November December January February March April May June July August September
201820172016
$1,702,414 $1,633,211 $1,801,808 $1,693,319 - - - - - - - -$1,643,205 $1,588,349 $1,719,975 $1,540,963 $1,363,000 $1,688,789 $1,646,695 $1,781,253 $1,871,020 $1,861,707 $1,701,991 $1,462,429$1,828,359 $1,728,346 $1,791,153 $1,633,528 $1,589,078 $1,916,552 $1,754,609 $1,766,814 $1,847,594 $1,883,695 $1,763,559 $1,620,456
FiscalYear
Gross Receipts % Chg CFYTD PFYTDOctober November December January February March April
2018 3.6% 3.2% 3.8% 5.2% -- -- --
FiscalYear
Gross Receipts (FYTD)October November December January February March April May June July August September
201820172016
$1,702,414 $3,335,625 $5,137,433 $6,830,752 - - - - - - - -$1,643,205 $3,231,554 $4,951,529 $6,492,492 $7,855,491 $9,544,280 $11,190,976 $12,972,229 $14,843,249 $16,704,957 $18,406,947 $19,869,377$1,828,359 $3,556,705 $5,347,858 $6,981,386 $8,570,464 $10,487,016 $12,241,625 $14,008,439 $15,856,034 $17,739,729 $19,503,289 $21,123,745
Summary by Month
Year to Date Comparison

Data as of: 1/31/201812:00:00 AM
Run: 4/4/2018 12:02:08 PM
Convenience Summary by Month
FiscalYear
Gross Receipts % Chg CFY PFYOctober November December January February March April
2018 50.4% 48.7% 53.7% 24.6% -- -- --
FiscalYear
Gross ReceiptsOctober November December January February March April May June July August September
201820172016
$1,552,848 $1,467,524 $1,531,387 $1,441,674 - - - - - - - -$1,032,358 $986,713 $996,181 $1,157,312 $1,120,241 $1,385,304 $1,441,268 $1,553,774 $1,692,257 $1,725,940 $1,644,679 $1,479,569
$687,401 $839,652 $905,009 $705,531 $717,735 $865,940 $796,086 $1,076,229 $1,402,171 $1,648,046 $1,458,075 $1,341,304
FiscalYear
Gross Receipts % Chg CFYTD PFYTDOctober November December January February March April
2018 50.4% 49.6% 51.0% 43.6% -- -- --
FiscalYear
Gross Receipts (FYTD)October November December January February March April May June July August September
201820172016
$1,552,848 $3,020,373 $4,551,760 $5,993,434 - - - - - - - -$1,032,358 $2,019,071 $3,015,252 $4,172,564 $5,292,805 $6,678,110 $8,119,377 $9,673,151 $11,365,408 $13,091,349 $14,736,028 $16,215,597
$687,401 $1,527,053 $2,432,062 $3,137,593 $3,855,329 $4,721,269 $5,517,355 $6,593,584 $7,995,755 $9,643,801 $11,101,876 $12,443,180
Summary by Month
Year to Date Comparison

Data as of: 1/31/201812:00:00 AM
Run: 4/4/2018 12:02:08 PM
Destination Themed Gifts Summary by Month
FiscalYear
Gross Receipts % Chg CFY PFYOctober November December January February March April
2018 (6.0%) 1.6% 0.1% 0.6% -- -- --
FiscalYear
Gross ReceiptsOctober November December January February March April May June July August September
201820172016
$625,862 $545,030 $509,676 $457,218 - - - - - - - -$665,699 $536,495 $509,101 $454,673 $495,338 $605,344 $539,543 $560,800 $548,479 $551,349 $547,049 $570,467$643,522 $511,931 $469,235 $427,508 $473,403 $540,923 $621,729 $655,367 $616,118 $596,582 $594,481 $633,160
FiscalYear
Gross Receipts % Chg CFYTD PFYTDOctober November December January February March April
2018 (6.0%) (2.6%) (1.8%) (1.3%) -- -- --
FiscalYear
Gross Receipts (FYTD)October November December January February March April May June July August September
201820172016
$625,862 $1,170,891 $1,680,567 $2,137,785 - - - - - - - -$665,699 $1,202,194 $1,711,295 $2,165,968 $2,661,306 $3,266,649 $3,806,192 $4,366,992 $4,915,472 $5,466,821 $6,013,870 $6,584,337$643,522 $1,155,453 $1,624,688 $2,052,196 $2,525,599 $3,066,522 $3,688,251 $4,343,618 $4,959,736 $5,556,318 $6,150,799 $6,783,959
Summary by Month
Year to Date Comparison

Data as of: 1/31/201812:00:00 AM
Run: 4/4/2018 12:02:08 PM
Duty Free Summary by Month
FiscalYear
Gross Receipts % Chg CFY PFYOctober November December January February March April
2018 (3.0%) 9.4% 24.2% 47.4% -- -- --
FiscalYear
Gross ReceiptsOctober November December January February March April May June July August September
201820172016
$1,107,481 $1,000,711 $1,216,941 $1,298,934 - - - - - - - -$1,141,519 $914,774 $979,607 $881,236 $869,316 $1,032,174 $949,070 $1,122,542 $986,165 $988,380 $1,021,699 $997,086$1,391,346 $1,144,891 $1,286,315 $1,144,546 $1,150,009 $1,188,827 $1,263,323 $1,513,778 $1,191,613 $1,152,772 $1,200,319 $1,125,314
FiscalYear
Gross Receipts % Chg CFYTD PFYTDOctober November December January February March April
2018 (3.0%) 2.5% 9.5% 18.0% -- -- --
FiscalYear
Gross Receipts (FYTD)October November December January February March April May June July August September
201820172016
$1,107,481 $2,108,192 $3,325,133 $4,624,068 - - - - - - - -$1,141,519 $2,056,293 $3,035,900 $3,917,136 $4,786,452 $5,818,626 $6,767,696 $7,890,238 $8,876,403 $9,864,782 $10,886,482 $11,883,568$1,391,346 $2,536,237 $3,822,552 $4,967,098 $6,117,107 $7,305,934 $8,569,257 $10,083,035 $11,274,648 $12,427,420 $13,627,739 $14,753,053
Summary by Month
Year to Date Comparison

Data as of: 1/31/201812:00:00 AM
Run: 4/4/2018 12:02:08 PM
Electronics Summary by Month
FiscalYear
Gross Receipts % Chg CFY PFYOctober November December January February March April
2018 28.0% 38.7% 30.8% 17.0% -- -- --
FiscalYear
Gross ReceiptsOctober November December January February March April May June July August September
201820172016
$1,276,862 $1,233,416 $1,332,026 $1,193,758 - - - - - - - -$997,828 $889,135 $1,018,406 $1,020,087 $1,014,955 $1,251,954 $1,158,346 $1,258,285 $1,375,050 $1,393,181 $1,349,345 $1,252,943$964,142 $805,623 $1,001,856 $872,306 $877,250 $1,083,691 $1,051,272 $1,092,537 $1,193,215 $1,184,842 $1,159,583 $1,023,734
FiscalYear
Gross Receipts % Chg CFYTD PFYTDOctober November December January February March April
2018 28.0% 33.0% 32.2% 28.3% -- -- --
FiscalYear
Gross Receipts (FYTD)October November December January February March April May June July August September
201820172016
$1,276,862 $2,510,279 $3,842,304 $5,036,062 - - - - - - - -$997,828 $1,886,963 $2,905,369 $3,925,456 $4,940,412 $6,192,366 $7,350,712 $8,608,997 $9,984,047 $11,377,228 $12,726,573 $13,979,516$964,142 $1,769,765 $2,771,621 $3,643,927 $4,521,177 $5,604,868 $6,656,140 $7,748,677 $8,941,892 $10,126,733 $11,286,316 $12,310,050
Summary by Month
Year to Date Comparison

Data as of: 1/31/201812:00:00 AM
Run: 4/4/2018 12:02:08 PM
Fast Food Summary by Month
FiscalYear
Gross Receipts % Chg CFY PFYOctober November December January February March April
2018 9.8% 7.1% 6.0% 10.2% -- -- --
FiscalYear
Gross ReceiptsOctober November December January February March April May June July August September
201820172016
$3,214,658 $3,070,797 $3,428,447 $3,297,657 - - - - - - - -$2,926,727 $2,866,881 $3,235,879 $2,992,836 $2,729,114 $3,227,835 $3,100,984 $3,453,602 $3,936,839 $3,946,107 $3,655,546 $3,150,595$3,450,071 $3,261,433 $3,555,815 $3,159,329 $2,872,321 $3,461,402 $3,105,152 $3,085,075 $3,084,858 $3,149,767 $2,931,844 $2,653,679
FiscalYear
Gross Receipts % Chg CFYTD PFYTDOctober November December January February March April
2018 9.8% 8.5% 7.6% 8.2% -- -- --
FiscalYear
Gross Receipts (FYTD)October November December January February March April May June July August September
201820172016
$3,214,658 $6,285,456 $9,713,902 $13,011,559 - - - - - - - -$2,926,727 $5,793,608 $9,029,488 $12,022,323 $14,751,437 $17,979,272 $21,080,256 $24,533,858 $28,470,697 $32,416,804 $36,072,350 $39,222,944$3,450,071 $6,711,503 $10,267,318 $13,426,647 $16,298,968 $19,760,371 $22,865,523 $25,950,598 $29,035,456 $32,185,222 $35,117,067 $37,770,746
Summary by Month
Year to Date Comparison

Data as of: 1/31/201812:00:00 AM
Run: 4/4/2018 12:02:08 PM
Health/Beauty Summary by Month
FiscalYear
Gross Receipts % Chg CFY PFYOctober November December January February March April
2018 (3.8%) 2.4% 1.3% 3.4% -- -- --
FiscalYear
Gross ReceiptsOctober November December January February March April May June July August September
201820172016
$442,566 $452,359 $508,878 $396,232 - - - - - - - -$460,062 $441,674 $502,365 $383,203 $394,234 $437,881 $422,212 $470,362 $435,690 $445,623 $424,988 $415,853$230,368 $239,364 $274,078 $163,701 $150,406 $148,159 $160,246 $216,790 $417,694 $495,037 $477,771 $456,500
FiscalYear
Gross Receipts % Chg CFYTD PFYTDOctober November December January February March April
2018 (3.8%) (0.8%) (0.0%) 0.7% -- -- --
FiscalYear
Gross Receipts (FYTD)October November December January February March April May June July August September
201820172016
$442,566 $894,925 $1,403,803 $1,800,035 - - - - - - - -$460,062 $901,736 $1,404,101 $1,787,304 $2,181,538 $2,619,419 $3,041,631 $3,511,993 $3,947,683 $4,393,306 $4,818,294 $5,234,147$230,368 $469,732 $743,810 $907,511 $1,057,916 $1,206,076 $1,366,321 $1,583,111 $2,000,806 $2,495,842 $2,973,614 $3,430,114
Summary by Month
Year to Date Comparison

Data as of: 1/31/201812:00:00 AM
Run: 4/4/2018 12:02:08 PM
Kiosks Summary by Month
FiscalYear
Gross Receipts % Chg CFY PFYOctober November December January February March April
2018 (39.5%) (38.4%) (37.4%) (24.6%) -- -- --
FiscalYear
Gross ReceiptsOctober November December January February March April May June July August September
201820172016
$120,004 $109,693 $100,123 $74,773 - - - - - - - -$198,249 $178,001 $160,005 $99,194 $96,514 $110,485 $111,999 $118,079 $125,384 $126,758 $114,649 $102,909$337,285 $303,639 $358,128 $309,548 $309,647 $336,744 $297,909 $153,409 $136,627 $131,484 $113,638 $130,006
FiscalYear
Gross Receipts % Chg CFYTD PFYTDOctober November December January February March April
2018 (39.5%) (39.0%) (38.5%) (36.3%) -- -- --
FiscalYear
Gross Receipts (FYTD)October November December January February March April May June July August September
201820172016
$120,004 $229,697 $329,820 $404,592 - - - - - - - -$198,249 $376,249 $536,255 $635,449 $731,963 $842,449 $954,448 $1,072,526 $1,197,910 $1,324,668 $1,439,318 $1,542,226$337,285 $640,924 $999,052 $1,308,600 $1,618,247 $1,954,991 $2,252,900 $2,406,309 $2,542,936 $2,674,420 $2,788,058 $2,918,064
Summary by Month
Year to Date Comparison

Data as of: 1/31/201812:00:00 AM
Run: 4/4/2018 12:02:08 PM
News Summary by Month
FiscalYear
Gross Receipts % Chg CFY PFYOctober November December January February March April
2018 (1.1%) (4.7%) (6.3%) (7.1%) -- -- --
FiscalYear
Gross ReceiptsOctober November December January February March April May June July August September
201820172016
$1,961,012 $1,768,666 $1,726,225 $1,616,902 - - - - - - - -$1,982,973 $1,855,730 $1,841,358 $1,740,336 $1,671,594 $2,090,976 $2,046,053 $2,242,705 $2,410,523 $2,346,289 $2,044,174 $1,853,279$2,704,812 $2,385,769 $2,282,245 $1,948,425 $1,858,453 $2,246,195 $2,047,605 $2,174,272 $2,358,760 $2,255,036 $2,194,225 $2,005,573
FiscalYear
Gross Receipts % Chg CFYTD PFYTDOctober November December January February March April
2018 (1.1%) (2.8%) (3.9%) (4.7%) -- -- --
FiscalYear
Gross Receipts (FYTD)October November December January February March April May June July August September
201820172016
$1,961,012 $3,729,678 $5,455,903 $7,072,805 - - - - - - - -$1,982,973 $3,838,703 $5,680,061 $7,420,397 $9,091,991 $11,182,967 $13,229,020 $15,471,724 $17,882,247 $20,228,536 $22,272,710 $24,125,989$2,704,812 $5,090,581 $7,372,826 $9,321,250 $11,179,704 $13,425,898 $15,473,503 $17,647,775 $20,006,535 $22,261,571 $24,455,795 $26,461,368
Summary by Month
Year to Date Comparison

Data as of: 1/31/201812:00:00 AM
Run: 4/4/2018 12:02:08 PM
News/Coffee Summary by Month
FiscalYear
Gross Receipts % Chg CFY PFYOctober November December January February March April
2018 28.7% 28.7% 33.9% 27.5% -- -- --
FiscalYear
Gross ReceiptsOctober November December January February March April May June July August September
201820172016
$854,254 $767,448 $749,183 $669,258 - - - - - - - -$663,715 $596,191 $559,496 $525,024 $497,473 $584,364 $494,989 $561,642 $606,452 $598,820 $706,046 $780,026$879,794 $806,201 $765,265 $674,141 $670,243 $793,701 $762,286 $890,444 $819,890 $865,652 $716,890 $678,050
FiscalYear
Gross Receipts % Chg CFYTD PFYTDOctober November December January February March April
2018 28.7% 28.7% 30.3% 29.7% -- -- --
FiscalYear
Gross Receipts (FYTD)October November December January February March April May June July August September
201820172016
$854,254 $1,621,701 $2,370,884 $3,040,142 - - - - - - - -$663,715 $1,259,906 $1,819,403 $2,344,426 $2,841,899 $3,426,263 $3,921,252 $4,482,894 $5,089,345 $5,688,165 $6,394,211 $7,174,237$879,794 $1,685,995 $2,451,260 $3,125,401 $3,795,644 $4,589,345 $5,351,631 $6,242,074 $7,061,964 $7,927,616 $8,644,506 $9,322,556
Summary by Month
Year to Date Comparison

Data as of: 1/31/201812:00:00 AM
Run: 4/4/2018 12:02:08 PM
Quick-Serve Summary by Month
FiscalYear
Gross Receipts % Chg CFY PFYOctober November December January February March April
2018 (6.4%) (5.5%) (6.9%) (16.1%) -- -- --
FiscalYear
Gross ReceiptsOctober November December January February March April May June July August September
201820172016
$3,714,748 $3,517,299 $3,519,714 $3,123,133 - - - - - - - -$3,967,517 $3,723,873 $3,781,067 $3,723,490 $3,437,594 $4,136,290 $3,892,370 $3,860,691 $4,252,126 $4,255,045 $3,922,780 $3,481,754$3,582,240 $3,109,087 $3,363,883 $3,211,983 $3,138,320 $3,593,323 $3,411,826 $3,807,355 $4,464,896 $4,541,042 $4,281,553 $4,048,054
FiscalYear
Gross Receipts % Chg CFYTD PFYTDOctober November December January February March April
2018 (6.4%) (6.0%) (6.3%) (8.7%) -- -- --
FiscalYear
Gross Receipts (FYTD)October November December January February March April May June July August September
201820172016
$3,714,748 $7,232,047 $10,751,761 $13,874,894 - - - - - - - -$3,967,517 $7,691,391 $11,472,458 $15,195,948 $18,633,542 $22,769,832 $26,662,202 $30,522,893 $34,775,019 $39,030,064 $42,952,844 $46,434,598$3,582,240 $6,691,327 $10,055,210 $13,267,192 $16,405,512 $19,998,835 $23,410,661 $27,218,016 $31,682,912 $36,223,954 $40,505,506 $44,553,560
Summary by Month
Year to Date Comparison

Data as of: 1/31/201812:00:00 AM
Run: 4/4/2018 12:02:08 PM
Snack Summary by Month
FiscalYear
Gross Receipts % Chg CFY PFYOctober November December January February March April
2018 (2.1%) (1.0%) (1.9%) (6.9%) -- -- --
FiscalYear
Gross ReceiptsOctober November December January February March April May June July August September
201820172016
$1,283,782 $1,225,654 $1,242,458 $1,087,071 - - - - - - - -$1,311,785 $1,237,776 $1,266,181 $1,167,464 $1,081,493 $1,349,666 $1,229,977 $1,315,632 $1,456,698 $1,447,054 $1,325,167 $1,186,684$1,285,046 $1,209,398 $1,321,905 $1,232,594 $1,204,853 $1,478,166 $1,190,888 $1,284,292 $1,574,164 $1,648,971 $1,471,931 $1,316,689
FiscalYear
Gross Receipts % Chg CFYTD PFYTDOctober November December January February March April
2018 (2.1%) (1.6%) (1.7%) (2.9%) -- -- --
FiscalYear
Gross Receipts (FYTD)October November December January February March April May June July August September
201820172016
$1,283,782 $2,509,436 $3,751,895 $4,838,965 - - - - - - - -$1,311,785 $2,549,561 $3,815,742 $4,983,206 $6,064,698 $7,414,364 $8,644,341 $9,959,973 $11,416,671 $12,863,726 $14,188,893 $15,375,577$1,285,046 $2,494,444 $3,816,349 $5,048,943 $6,253,796 $7,731,962 $8,922,850 $10,207,142 $11,781,306 $13,430,278 $14,902,209 $16,218,898
Summary by Month
Year to Date Comparison
Data as of: 1/31/201812:00:00 AM
Run: 4/4/2018 12:02:08 PM
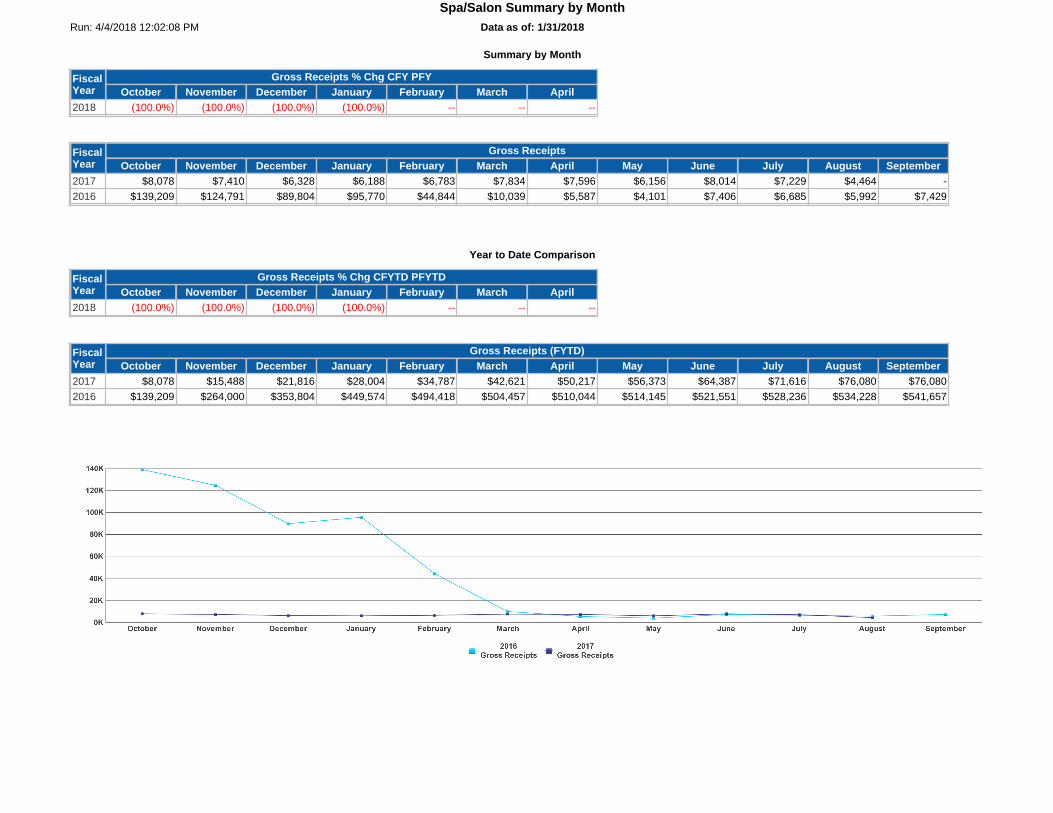
Spa/Salon Summary by Month
FiscalYear
Gross Receipts % Chg CFY PFYOctober November December January February March April
2018 (100.0%) (100.0%) (100.0%) (100.0%) -- -- --
FiscalYear
Gross ReceiptsOctober November December January February March April May June July August September
20172016
$8,078 $7,410 $6,328 $6,188 $6,783 $7,834 $7,596 $6,156 $8,014 $7,229 $4,464 -$139,209 $124,791 $89,804 $95,770 $44,844 $10,039 $5,587 $4,101 $7,406 $6,685 $5,992 $7,429
FiscalYear
Gross Receipts % Chg CFYTD PFYTDOctober November December January February March April
2018 (100.0%) (100.0%) (100.0%) (100.0%) -- -- --
FiscalYear
Gross Receipts (FYTD)October November December January February March April May June July August September
20172016
$8,078 $15,488 $21,816 $28,004 $34,787 $42,621 $50,217 $56,373 $64,387 $71,616 $76,080 $76,080$139,209 $264,000 $353,804 $449,574 $494,418 $504,457 $510,044 $514,145 $521,551 $528,236 $534,228 $541,657
Summary by Month
Year to Date Comparison
Data as of: 1/31/201812:00:00 AM
Run: 4/4/2018 12:02:08 PM
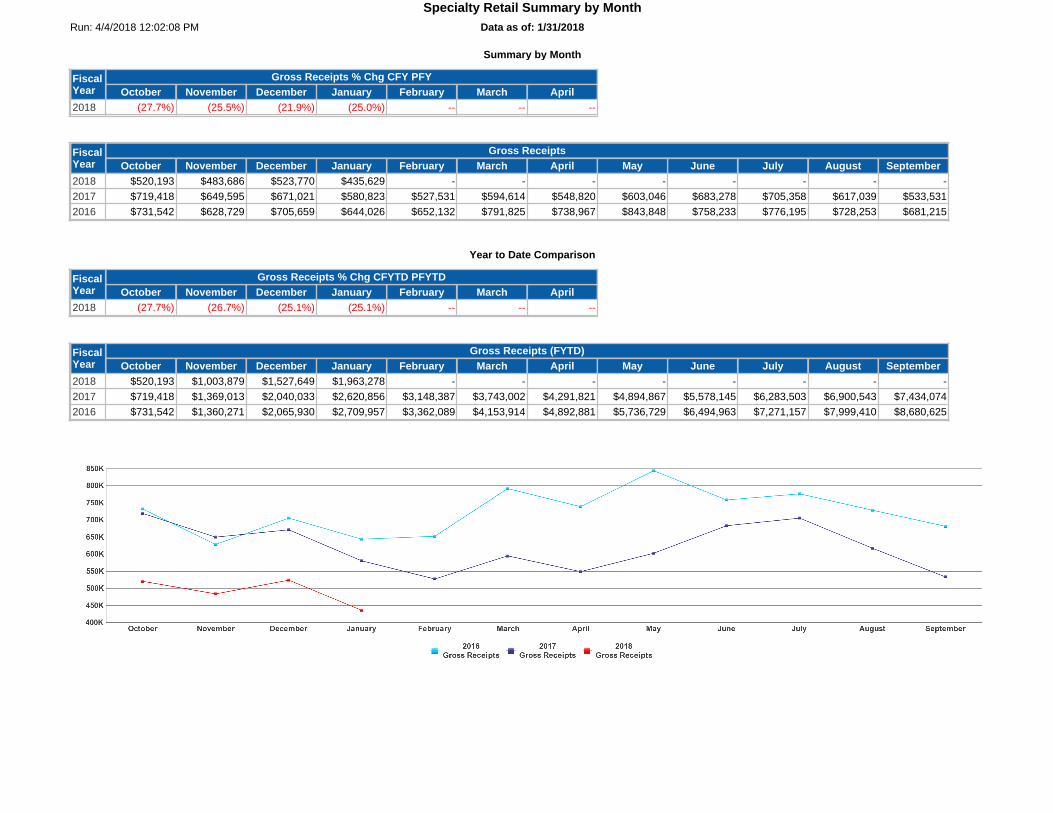
Specialty Retail Summary by Month
FiscalYear
Gross Receipts % Chg CFY PFYOctober November December January February March April
2018 (27.7%) (25.5%) (21.9%) (25.0%) -- -- --
FiscalYear
Gross ReceiptsOctober November December January February March April May June July August September
201820172016
$520,193 $483,686 $523,770 $435,629 - - - - - - - -$719,418 $649,595 $671,021 $580,823 $527,531 $594,614 $548,820 $603,046 $683,278 $705,358 $617,039 $533,531$731,542 $628,729 $705,659 $644,026 $652,132 $791,825 $738,967 $843,848 $758,233 $776,195 $728,253 $681,215
FiscalYear
Gross Receipts % Chg CFYTD PFYTDOctober November December January February March April
2018 (27.7%) (26.7%) (25.1%) (25.1%) -- -- --
FiscalYear
Gross Receipts (FYTD)October November December January February March April May June July August September
201820172016
$520,193 $1,003,879 $1,527,649 $1,963,278 - - - - - - - -$719,418 $1,369,013 $2,040,033 $2,620,856 $3,148,387 $3,743,002 $4,291,821 $4,894,867 $5,578,145 $6,283,503 $6,900,543 $7,434,074$731,542 $1,360,271 $2,065,930 $2,709,957 $3,362,089 $4,153,914 $4,892,881 $5,736,729 $6,494,963 $7,271,157 $7,999,410 $8,680,625
Summary by Month
Year to Date Comparison
Data as of: 1/31/201812:00:00 AM
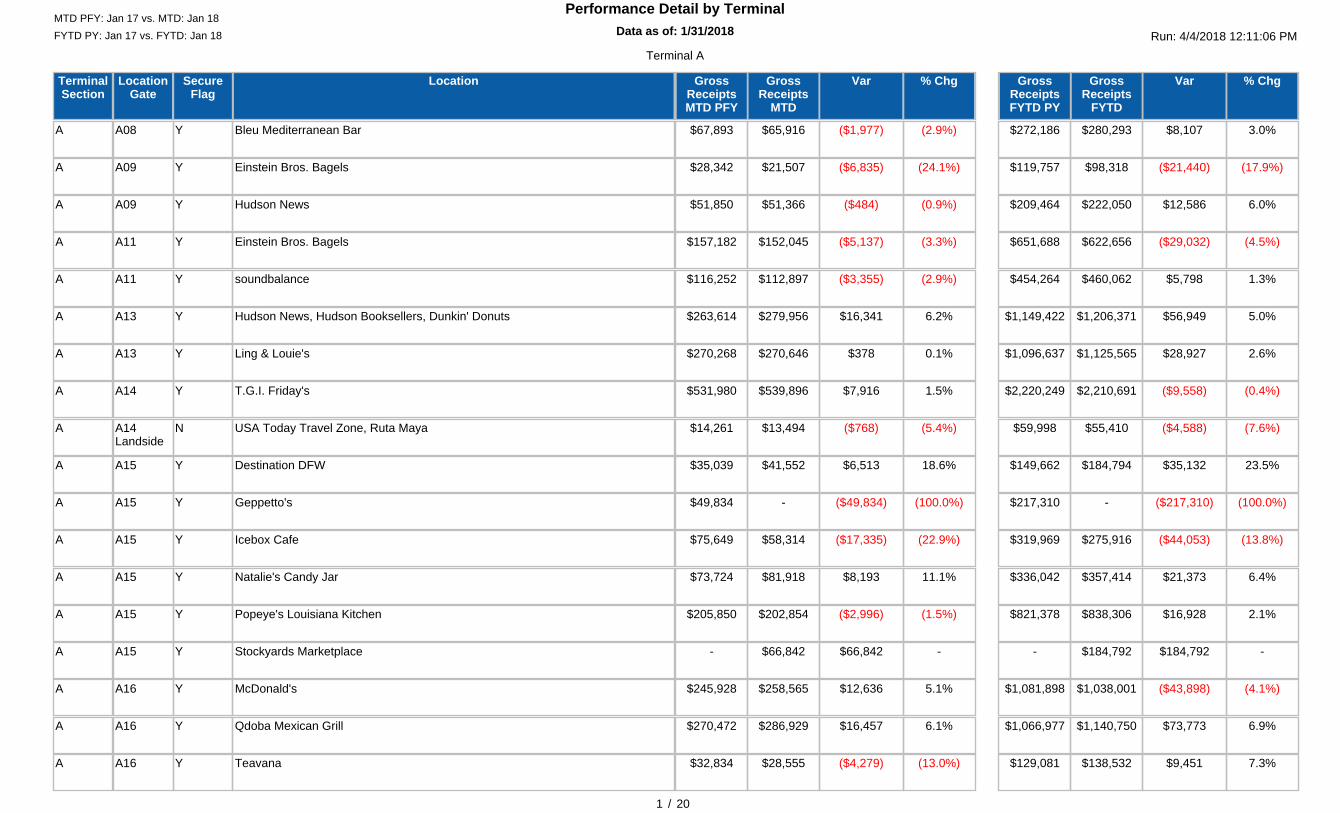
Performance Detail by Terminal
Run: 4/4/2018 12:11:06 PMFYTD PY: Jan 17 vs. FYTD: Jan 18MTD PFY: Jan 17 vs. MTD: Jan 18
1 / 20
Terminal A
LocationLocationGate
TerminalSection
% ChgGrossReceipts
MTD
VarGrossReceiptsMTD PFY
% ChgGrossReceipts
FYTD
VarGrossReceiptsFYTD PY
SecureFlag
Bleu Mediterranean BarA08A (2.9%)$65,916 ($1,977)$67,893 3.0%$280,293 $8,107$272,186Y
Einstein Bros. BagelsA09A (24.1%)$21,507 ($6,835)$28,342 (17.9%)$98,318 ($21,440)$119,757Y
Hudson NewsA09A (0.9%)$51,366 ($484)$51,850 6.0%$222,050 $12,586$209,464Y
Einstein Bros. BagelsA11A (3.3%)$152,045 ($5,137)$157,182 (4.5%)$622,656 ($29,032)$651,688Y
soundbalanceA11A (2.9%)$112,897 ($3,355)$116,252 1.3%$460,062 $5,798$454,264Y
Hudson News, Hudson Booksellers, Dunkin' DonutsA13A 6.2%$279,956 $16,341$263,614 5.0%$1,206,371 $56,949$1,149,422Y
Ling & Louie'sA13A 0.1%$270,646 $378$270,268 2.6%$1,125,565 $28,927$1,096,637Y
T.G.I. Friday'sA14A 1.5%$539,896 $7,916$531,980 (0.4%)$2,210,691 ($9,558)$2,220,249Y
USA Today Travel Zone, Ruta MayaA14Landside
A (5.4%)$13,494 ($768)$14,261 (7.6%)$55,410 ($4,588)$59,998N
Destination DFWA15A 18.6%$41,552 $6,513$35,039 23.5%$184,794 $35,132$149,662Y
Geppetto'sA15A (100.0%)- ($49,834)$49,834 (100.0%)- ($217,310)$217,310Y
Icebox CafeA15A (22.9%)$58,314 ($17,335)$75,649 (13.8%)$275,916 ($44,053)$319,969Y
Natalie's Candy JarA15A 11.1%$81,918 $8,193$73,724 6.4%$357,414 $21,373$336,042Y
Popeye's Louisiana KitchenA15A (1.5%)$202,854 ($2,996)$205,850 2.1%$838,306 $16,928$821,378Y
Stockyards MarketplaceA15A -$66,842 $66,842- -$184,792 $184,792-Y
McDonald'sA16A 5.1%$258,565 $12,636$245,928 (4.1%)$1,038,001 ($43,898)$1,081,898Y
Qdoba Mexican GrillA16A 6.1%$286,929 $16,457$270,472 6.9%$1,140,750 $73,773$1,066,977Y
TeavanaA16A (13.0%)$28,555 ($4,279)$32,834 7.3%$138,532 $9,451$129,081Y
Data as of: 1/31/201812:00:00 AM
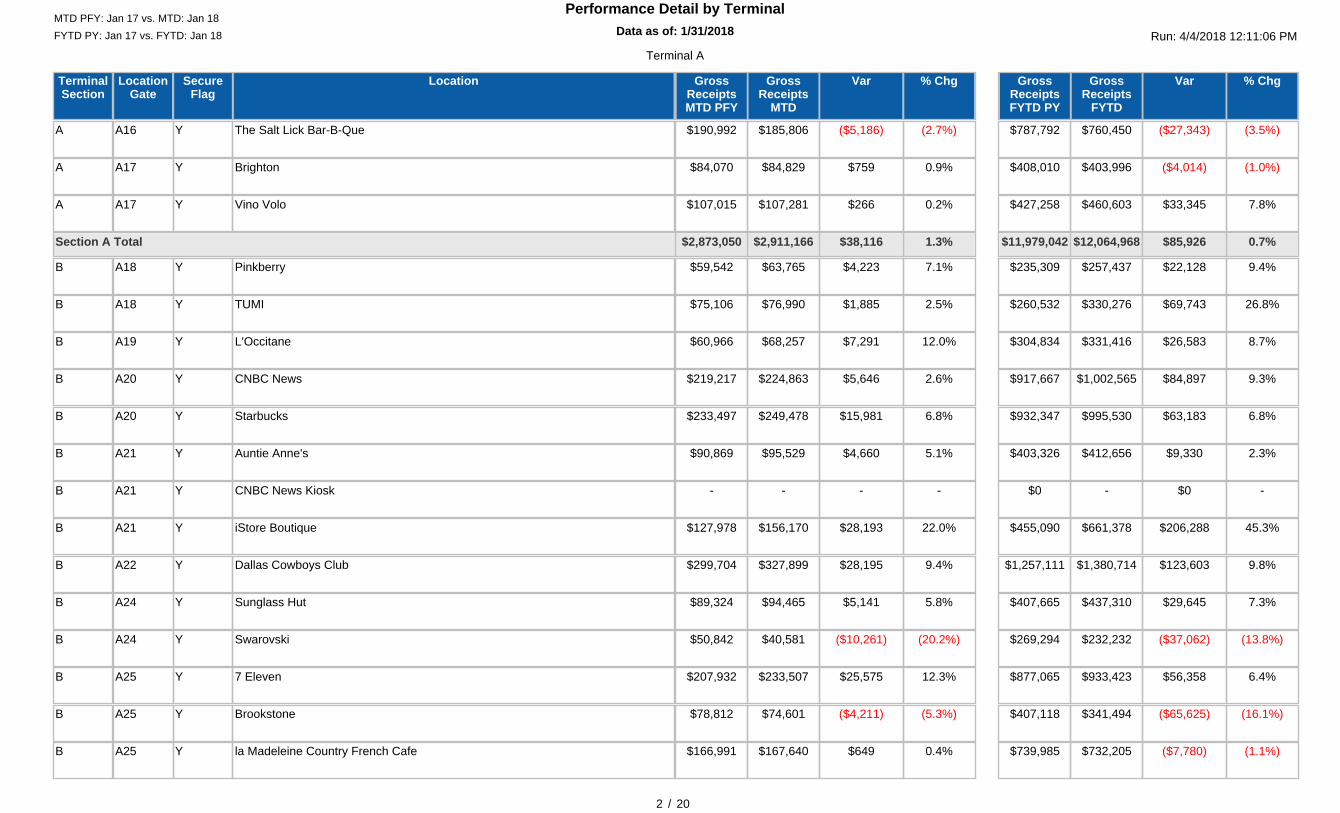
Performance Detail by Terminal
Run: 4/4/2018 12:11:06 PMFYTD PY: Jan 17 vs. FYTD: Jan 18MTD PFY: Jan 17 vs. MTD: Jan 18
2 / 20
Terminal A
LocationLocationGate
TerminalSection
% ChgGrossReceipts
MTD
VarGrossReceiptsMTD PFY
% ChgGrossReceipts
FYTD
VarGrossReceiptsFYTD PY
SecureFlag
The Salt Lick Bar-B-QueA16A (2.7%)$185,806 ($5,186)$190,992 (3.5%)$760,450 ($27,343)$787,792Y
BrightonA17A 0.9%$84,829 $759$84,070 (1.0%)$403,996 ($4,014)$408,010Y
Vino VoloA17A 0.2%$107,281 $266$107,015 7.8%$460,603 $33,345$427,258Y
1.3%$2,911,166 $38,116$2,873,050 0.7%$12,064,968 $85,926$11,979,042Section A Total
PinkberryA18B 7.1%$63,765 $4,223$59,542 9.4%$257,437 $22,128$235,309Y
TUMIA18B 2.5%$76,990 $1,885$75,106 26.8%$330,276 $69,743$260,532Y
L'OccitaneA19B 12.0%$68,257 $7,291$60,966 8.7%$331,416 $26,583$304,834Y
CNBC NewsA20B 2.6%$224,863 $5,646$219,217 9.3%$1,002,565 $84,897$917,667Y
StarbucksA20B 6.8%$249,478 $15,981$233,497 6.8%$995,530 $63,183$932,347Y
Auntie Anne'sA21B 5.1%$95,529 $4,660$90,869 2.3%$412,656 $9,330$403,326Y
CNBC News KioskA21B -- -- -- $0$0Y
iStore BoutiqueA21B 22.0%$156,170 $28,193$127,978 45.3%$661,378 $206,288$455,090Y
Dallas Cowboys ClubA22B 9.4%$327,899 $28,195$299,704 9.8%$1,380,714 $123,603$1,257,111Y
Sunglass HutA24B 5.8%$94,465 $5,141$89,324 7.3%$437,310 $29,645$407,665Y
SwarovskiA24B (20.2%)$40,581 ($10,261)$50,842 (13.8%)$232,232 ($37,062)$269,294Y
7 ElevenA25B 12.3%$233,507 $25,575$207,932 6.4%$933,423 $56,358$877,065Y
BrookstoneA25B (5.3%)$74,601 ($4,211)$78,812 (16.1%)$341,494 ($65,625)$407,118Y
la Madeleine Country French CafeA25B 0.4%$167,640 $649$166,991 (1.1%)$732,205 ($7,780)$739,985Y
Data as of: 1/31/201812:00:00 AM
Performance Detail by Terminal
Run: 4/4/2018 12:11:06 PMFYTD PY: Jan 17 vs. FYTD: Jan 18MTD PFY: Jan 17 vs. MTD: Jan 18
3 / 20
Terminal A
LocationLocationGate
TerminalSection
% ChgGrossReceipts
MTD
VarGrossReceiptsMTD PFY
% ChgGrossReceipts
FYTD
VarGrossReceiptsFYTD PY
SecureFlag
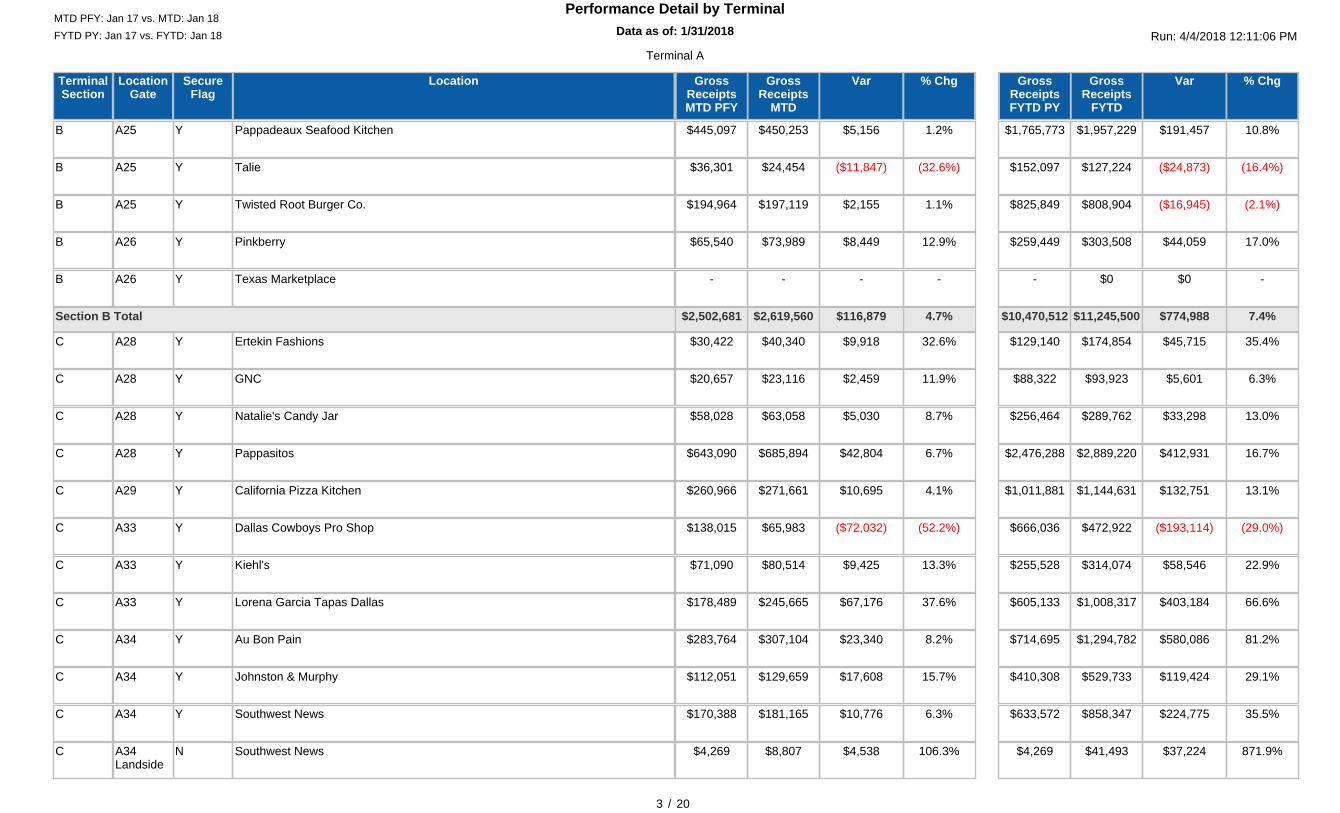
Pappadeaux Seafood KitchenA25B 1.2%$450,253 $5,156$445,097 10.8%$1,957,229 $191,457$1,765,773Y
TalieA25B (32.6%)$24,454 ($11,847)$36,301 (16.4%)$127,224 ($24,873)$152,097Y
Twisted Root Burger Co.A25B 1.1%$197,119 $2,155$194,964 (2.1%)$808,904 ($16,945)$825,849Y
PinkberryA26B 12.9%$73,989 $8,449$65,540 17.0%$303,508 $44,059$259,449Y
Texas MarketplaceA26B -- -- -$0 $0-Y
4.7%$2,619,560 $116,879$2,502,681 7.4%$11,245,500 $774,988$10,470,512Section B Total
Ertekin FashionsA28C 32.6%$40,340 $9,918$30,422 35.4%$174,854 $45,715$129,140Y
GNCA28C 11.9%$23,116 $2,459$20,657 6.3%$93,923 $5,601$88,322Y
Natalie's Candy JarA28C 8.7%$63,058 $5,030$58,028 13.0%$289,762 $33,298$256,464Y
PappasitosA28C 6.7%$685,894 $42,804$643,090 16.7%$2,889,220 $412,931$2,476,288Y
California Pizza KitchenA29C 4.1%$271,661 $10,695$260,966 13.1%$1,144,631 $132,751$1,011,881Y
Dallas Cowboys Pro ShopA33C (52.2%)$65,983 ($72,032)$138,015 (29.0%)$472,922 ($193,114)$666,036Y
Kiehl'sA33C 13.3%$80,514 $9,425$71,090 22.9%$314,074 $58,546$255,528Y
Lorena Garcia Tapas DallasA33C 37.6%$245,665 $67,176$178,489 66.6%$1,008,317 $403,184$605,133Y
Au Bon PainA34C 8.2%$307,104 $23,340$283,764 81.2%$1,294,782 $580,086$714,695Y
Johnston & MurphyA34C 15.7%$129,659 $17,608$112,051 29.1%$529,733 $119,424$410,308Y
Southwest NewsA34C 6.3%$181,165 $10,776$170,388 35.5%$858,347 $224,775$633,572Y
Southwest NewsA34Landside
C 106.3%$8,807 $4,538$4,269 871.9%$41,493 $37,224$4,269N
Data as of: 1/31/201812:00:00 AM
Performance Detail by Terminal
Run: 4/4/2018 12:11:06 PMFYTD PY: Jan 17 vs. FYTD: Jan 18MTD PFY: Jan 17 vs. MTD: Jan 18
4 / 20
Terminal A
LocationLocationGate
TerminalSection
% ChgGrossReceipts
MTD
VarGrossReceiptsMTD PFY
% ChgGrossReceipts
FYTD
VarGrossReceiptsFYTD PY
SecureFlag
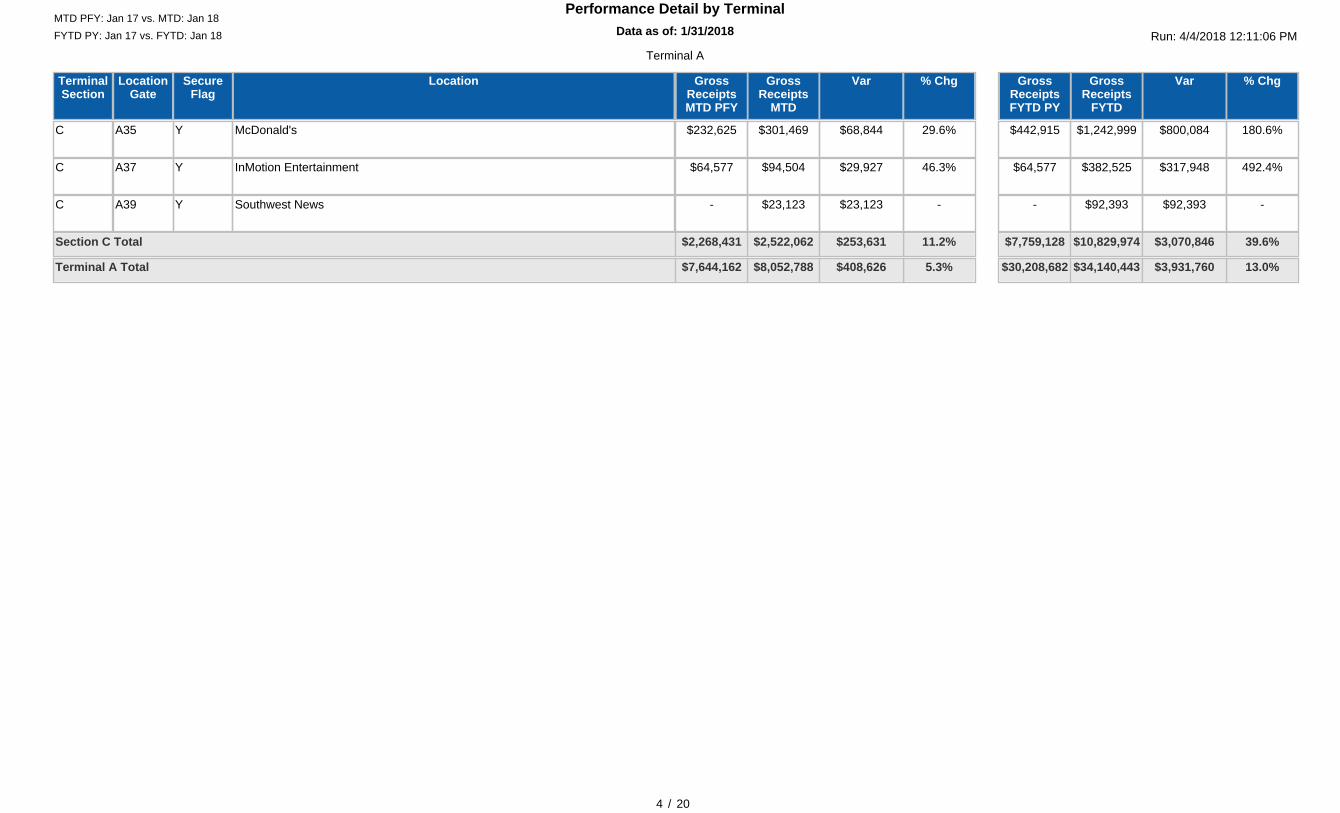
McDonald'sA35C 29.6%$301,469 $68,844$232,625 180.6%$1,242,999 $800,084$442,915Y
InMotion EntertainmentA37C 46.3%$94,504 $29,927$64,577 492.4%$382,525 $317,948$64,577Y
Southwest NewsA39C -$23,123 $23,123- -$92,393 $92,393-Y
11.2%$2,522,062 $253,631$2,268,431 39.6%$10,829,974 $3,070,846$7,759,128Section C Total
5.3%$8,052,788 $408,626$7,644,162 13.0%$34,140,443 $3,931,760$30,208,682Terminal A Total
Data as of: 1/31/201812:00:00 AM
Performance Detail by Terminal
Run: 4/4/2018 12:11:06 PMFYTD PY: Jan 17 vs. FYTD: Jan 18MTD PFY: Jan 17 vs. MTD: Jan 18
5 / 20
Terminal B
LocationLocationGate
TerminalSection
% ChgGrossReceipts
MTD
VarGrossReceiptsMTD PFY
% ChgGrossReceipts
FYTD
VarGrossReceiptsFYTD PY
SecureFlag
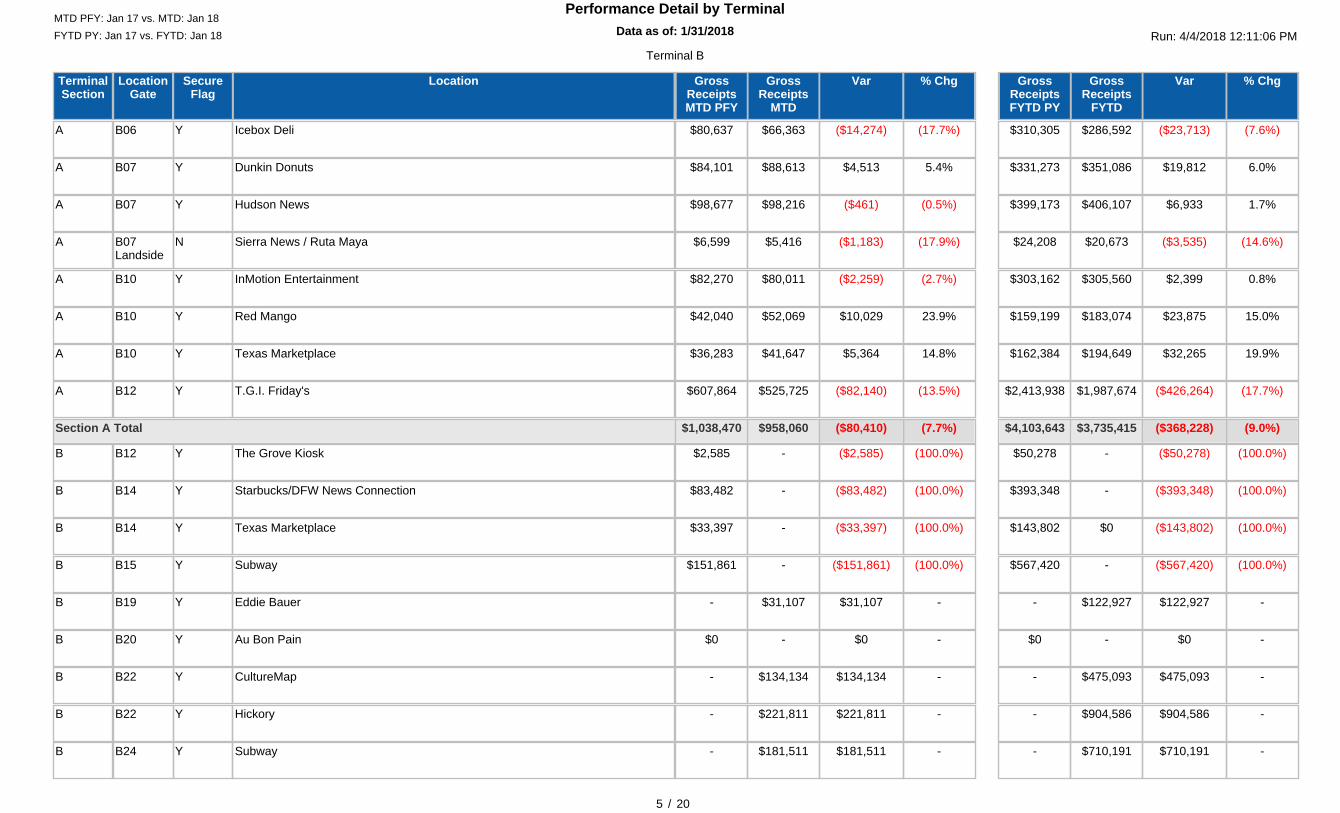
Icebox DeliB06A (17.7%)$66,363 ($14,274)$80,637 (7.6%)$286,592 ($23,713)$310,305Y
Dunkin DonutsB07A 5.4%$88,613 $4,513$84,101 6.0%$351,086 $19,812$331,273Y
Hudson NewsB07A (0.5%)$98,216 ($461)$98,677 1.7%$406,107 $6,933$399,173Y
Sierra News / Ruta MayaB07Landside
A (17.9%)$5,416 ($1,183)$6,599 (14.6%)$20,673 ($3,535)$24,208N
InMotion EntertainmentB10A (2.7%)$80,011 ($2,259)$82,270 0.8%$305,560 $2,399$303,162Y
Red MangoB10A 23.9%$52,069 $10,029$42,040 15.0%$183,074 $23,875$159,199Y
Texas MarketplaceB10A 14.8%$41,647 $5,364$36,283 19.9%$194,649 $32,265$162,384Y
T.G.I. Friday'sB12A (13.5%)$525,725 ($82,140)$607,864 (17.7%)$1,987,674 ($426,264)$2,413,938Y
(7.7%)$958,060 ($80,410)$1,038,470 (9.0%)$3,735,415 ($368,228)$4,103,643Section A Total
The Grove KioskB12B (100.0%)- ($2,585)$2,585 (100.0%)- ($50,278)$50,278Y
Starbucks/DFW News ConnectionB14B (100.0%)- ($83,482)$83,482 (100.0%)- ($393,348)$393,348Y
Texas MarketplaceB14B (100.0%)- ($33,397)$33,397 (100.0%)$0 ($143,802)$143,802Y
SubwayB15B (100.0%)- ($151,861)$151,861 (100.0%)- ($567,420)$567,420Y
Eddie BauerB19B -$31,107 $31,107- -$122,927 $122,927-Y
Au Bon PainB20B -- $0$0 -- $0$0Y
CultureMapB22B -$134,134 $134,134- -$475,093 $475,093-Y
HickoryB22B -$221,811 $221,811- -$904,586 $904,586-Y
SubwayB24B -$181,511 $181,511- -$710,191 $710,191-Y

Data as of: 1/31/201812:00:00 AM
Performance Detail by Terminal
Run: 4/4/2018 12:11:06 PMFYTD PY: Jan 17 vs. FYTD: Jan 18MTD PFY: Jan 17 vs. MTD: Jan 18
6 / 20
Terminal B
LocationLocationGate
TerminalSection
% ChgGrossReceipts
MTD
VarGrossReceiptsMTD PFY
% ChgGrossReceipts
FYTD
VarGrossReceiptsFYTD PY
SecureFlag
Travel + LeisureB27B 5.2%$34,332 $1,688$32,644 3.3%$153,262 $4,825$148,437Y
SoybuB28B (13.5%)$15,975 ($2,493)$18,467 (6.3%)$77,325 ($5,208)$82,533Y
91.9%$618,868 $296,433$322,435 76.3%$2,443,383 $1,057,567$1,385,816Section B Total
Blue Mesa Cafe KioskB01BDConnector
(100.0%)- ($11,702)$11,702 (100.0%)- ($51,972)$51,972Y
(100.0%)$0 ($11,702)$11,702 (100.0%)$0 ($51,972)$51,972Section BD Connector Total
Wing StopB25C 8.0%$226,182 $16,658$209,524 (5.2%)$778,044 ($42,985)$821,029Y
Garrett Popcorn ShopsB27C (7.6%)$56,380 ($4,619)$60,999 2.1%$304,998 $6,191$298,807Y
Starbucks - CyberCafeB28C 13.3%$151,263 $17,698$133,565 11.5%$610,094 $62,965$547,129Y
Hudson News/Daily JavaB28Landside
C (7.3%)$10,705 ($843)$11,548 (9.6%)$43,295 ($4,591)$47,886N
Connections Made EZB30C (16.8%)$26,394 ($5,326)$31,719 (16.8%)$111,713 ($22,524)$134,237Y
ArtizanB33C (100.0%)- ($15,506)$15,506 (100.0%)- ($67,484)$67,484Y
Auntie Anne'sB33C (13.8%)$74,134 ($11,905)$86,039 (10.7%)$324,970 ($39,023)$363,993Y
BrightonB33C -$53,765 $53,765- -$146,185 $146,185-Y
Cantina LaredoB34C (15.5%)$417,183 ($76,296)$493,479 (13.5%)$1,697,750 ($264,233)$1,961,983Y
McDonald'sB40C (2.8%)$316,450 ($9,226)$325,676 (4.7%)$1,251,416 ($62,290)$1,313,707Y
U Food GrillB40C (18.2%)$99,440 ($22,107)$121,546 (17.3%)$402,655 ($84,228)$486,883Y
Natalie's Sweet GourmetB41C (2.5%)$51,749 ($1,328)$53,077 (6.4%)$227,079 ($15,489)$242,568Y
Texas TerritoriesB41C (3.6%)$36,813 ($1,377)$38,190 5.6%$175,037 $9,296$165,741Y
Data as of: 1/31/201812:00:00 AM
Performance Detail by Terminal
Run: 4/4/2018 12:11:06 PMFYTD PY: Jan 17 vs. FYTD: Jan 18MTD PFY: Jan 17 vs. MTD: Jan 18
7 / 20
Terminal B
LocationLocationGate
TerminalSection
% ChgGrossReceipts
MTD
VarGrossReceiptsMTD PFY
% ChgGrossReceipts
FYTD
VarGrossReceiptsFYTD PY
SecureFlag
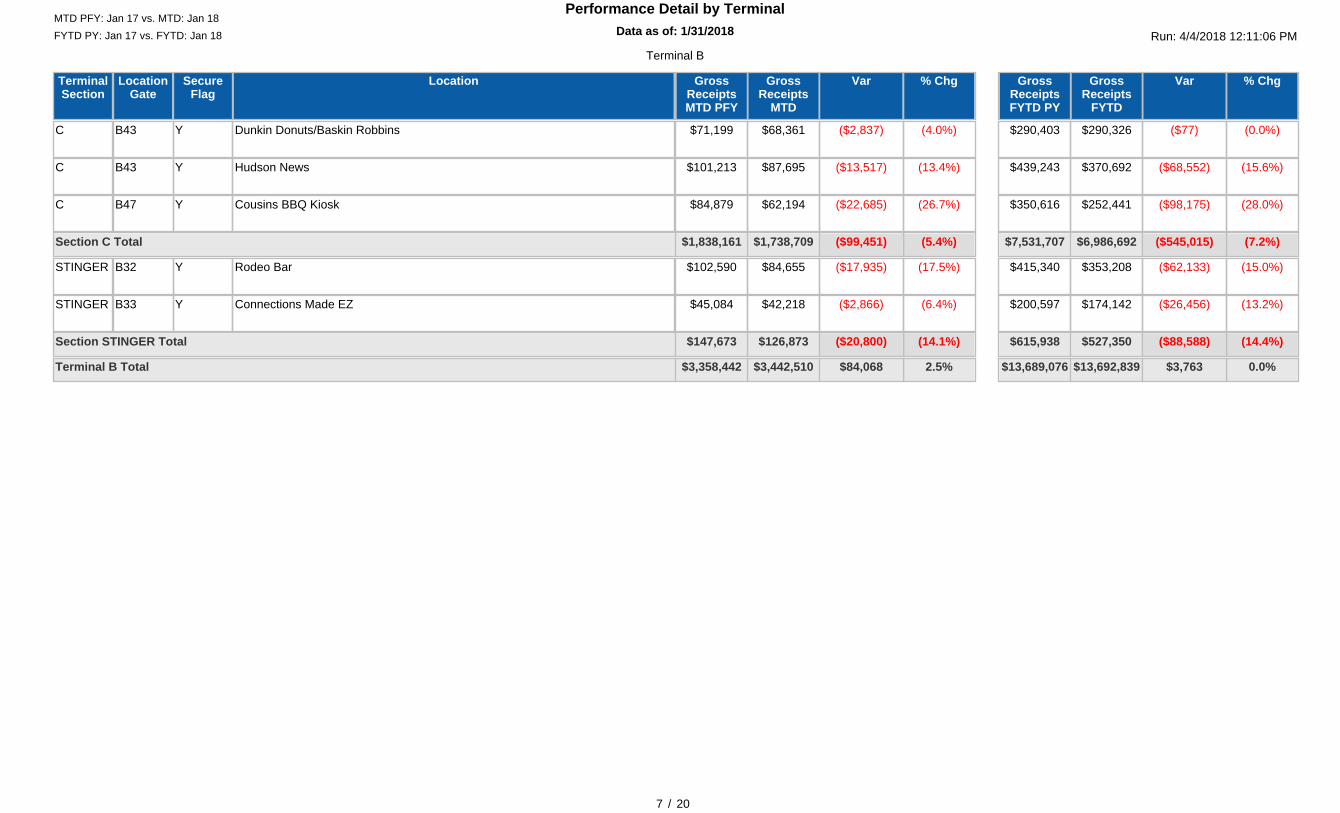
Dunkin Donuts/Baskin RobbinsB43C (4.0%)$68,361 ($2,837)$71,199 (0.0%)$290,326 ($77)$290,403Y
Hudson NewsB43C (13.4%)$87,695 ($13,517)$101,213 (15.6%)$370,692 ($68,552)$439,243Y
Cousins BBQ KioskB47C (26.7%)$62,194 ($22,685)$84,879 (28.0%)$252,441 ($98,175)$350,616Y
(5.4%)$1,738,709 ($99,451)$1,838,161 (7.2%)$6,986,692 ($545,015)$7,531,707Section C Total
Rodeo BarB32STINGER (17.5%)$84,655 ($17,935)$102,590 (15.0%)$353,208 ($62,133)$415,340Y
Connections Made EZB33STINGER (6.4%)$42,218 ($2,866)$45,084 (13.2%)$174,142 ($26,456)$200,597Y
(14.1%)$126,873 ($20,800)$147,673 (14.4%)$527,350 ($88,588)$615,938Section STINGER Total
2.5%$3,442,510 $84,068$3,358,442 0.0%$13,692,839 $3,763$13,689,076Terminal B Total
Data as of: 1/31/201812:00:00 AM
Performance Detail by Terminal
Run: 4/4/2018 12:11:06 PMFYTD PY: Jan 17 vs. FYTD: Jan 18MTD PFY: Jan 17 vs. MTD: Jan 18
8 / 20
Terminal C
LocationLocationGate
TerminalSection
% ChgGrossReceipts
MTD
VarGrossReceiptsMTD PFY
% ChgGrossReceipts
FYTD
VarGrossReceiptsFYTD PY
SecureFlag
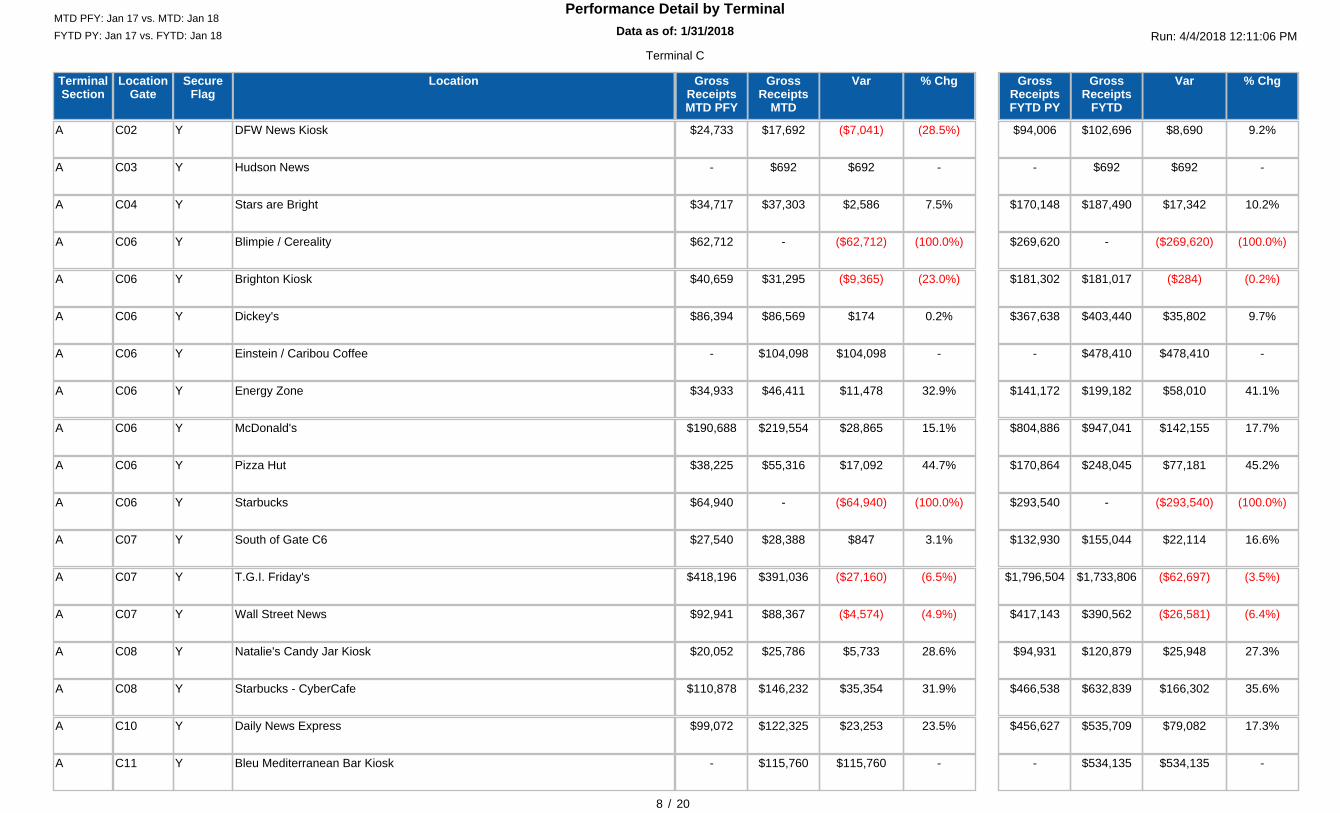
DFW News KioskC02A (28.5%)$17,692 ($7,041)$24,733 9.2%$102,696 $8,690$94,006Y
Hudson NewsC03A -$692 $692- -$692 $692-Y
Stars are BrightC04A 7.5%$37,303 $2,586$34,717 10.2%$187,490 $17,342$170,148Y
Blimpie / CerealityC06A (100.0%)- ($62,712)$62,712 (100.0%)- ($269,620)$269,620Y
Brighton KioskC06A (23.0%)$31,295 ($9,365)$40,659 (0.2%)$181,017 ($284)$181,302Y
Dickey'sC06A 0.2%$86,569 $174$86,394 9.7%$403,440 $35,802$367,638Y
Einstein / Caribou CoffeeC06A -$104,098 $104,098- -$478,410 $478,410-Y
Energy ZoneC06A 32.9%$46,411 $11,478$34,933 41.1%$199,182 $58,010$141,172Y
McDonald'sC06A 15.1%$219,554 $28,865$190,688 17.7%$947,041 $142,155$804,886Y
Pizza HutC06A 44.7%$55,316 $17,092$38,225 45.2%$248,045 $77,181$170,864Y
StarbucksC06A (100.0%)- ($64,940)$64,940 (100.0%)- ($293,540)$293,540Y
South of Gate C6C07A 3.1%$28,388 $847$27,540 16.6%$155,044 $22,114$132,930Y
T.G.I. Friday'sC07A (6.5%)$391,036 ($27,160)$418,196 (3.5%)$1,733,806 ($62,697)$1,796,504Y
Wall Street NewsC07A (4.9%)$88,367 ($4,574)$92,941 (6.4%)$390,562 ($26,581)$417,143Y
Natalie's Candy Jar KioskC08A 28.6%$25,786 $5,733$20,052 27.3%$120,879 $25,948$94,931Y
Starbucks - CyberCafeC08A 31.9%$146,232 $35,354$110,878 35.6%$632,839 $166,302$466,538Y
Daily News ExpressC10A 23.5%$122,325 $23,253$99,072 17.3%$535,709 $79,082$456,627Y
Bleu Mediterranean Bar KioskC11A -$115,760 $115,760- -$534,135 $534,135-Y
Data as of: 1/31/201812:00:00 AM
Performance Detail by Terminal
Run: 4/4/2018 12:11:06 PMFYTD PY: Jan 17 vs. FYTD: Jan 18MTD PFY: Jan 17 vs. MTD: Jan 18
9 / 20
Terminal C
LocationLocationGate
TerminalSection
% ChgGrossReceipts
MTD
VarGrossReceiptsMTD PFY
% ChgGrossReceipts
FYTD
VarGrossReceiptsFYTD PY
SecureFlag
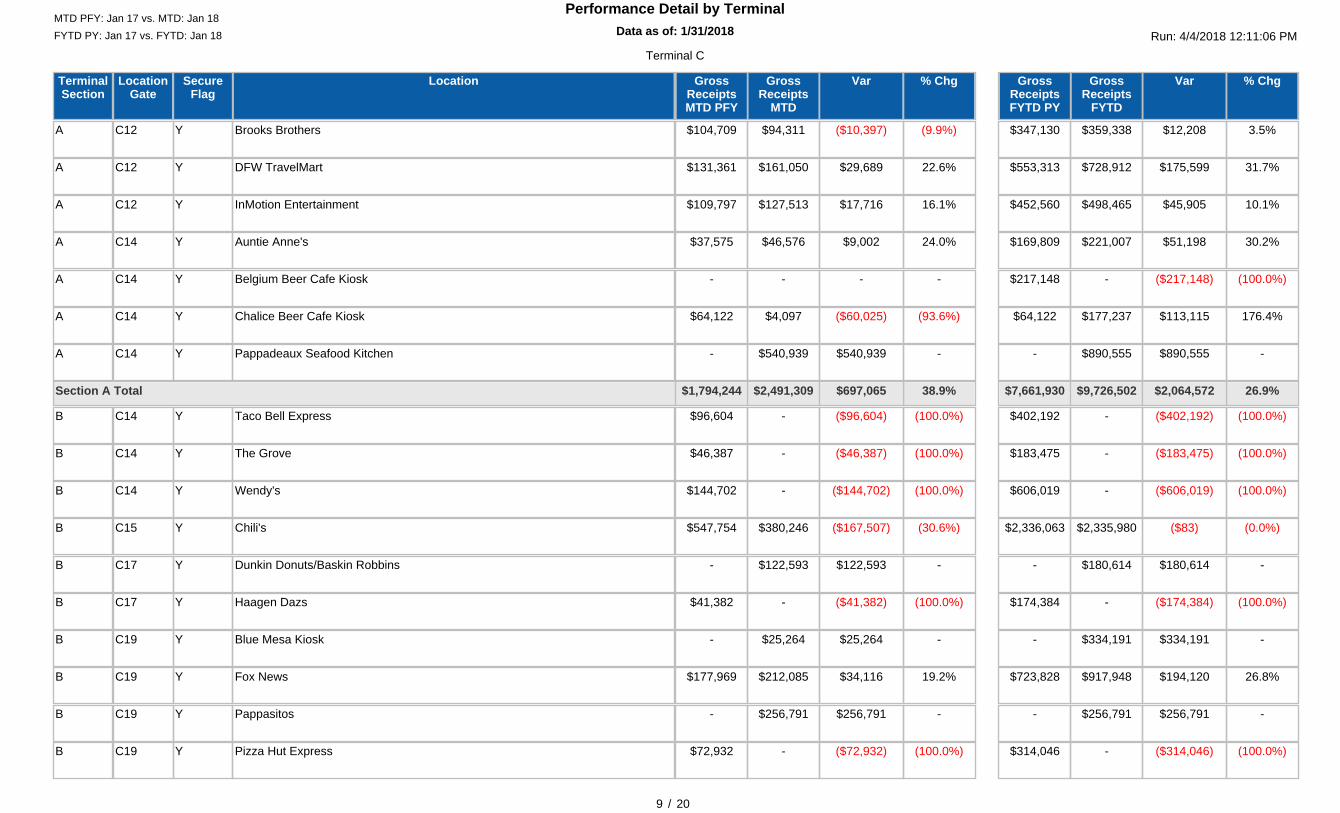
Brooks BrothersC12A (9.9%)$94,311 ($10,397)$104,709 3.5%$359,338 $12,208$347,130Y
DFW TravelMartC12A 22.6%$161,050 $29,689$131,361 31.7%$728,912 $175,599$553,313Y
InMotion EntertainmentC12A 16.1%$127,513 $17,716$109,797 10.1%$498,465 $45,905$452,560Y
Auntie Anne'sC14A 24.0%$46,576 $9,002$37,575 30.2%$221,007 $51,198$169,809Y
Belgium Beer Cafe KioskC14A -- -- (100.0%)- ($217,148)$217,148Y
Chalice Beer Cafe KioskC14A (93.6%)$4,097 ($60,025)$64,122 176.4%$177,237 $113,115$64,122Y
Pappadeaux Seafood KitchenC14A -$540,939 $540,939- -$890,555 $890,555-Y
38.9%$2,491,309 $697,065$1,794,244 26.9%$9,726,502 $2,064,572$7,661,930Section A Total
Taco Bell ExpressC14B (100.0%)- ($96,604)$96,604 (100.0%)- ($402,192)$402,192Y
The GroveC14B (100.0%)- ($46,387)$46,387 (100.0%)- ($183,475)$183,475Y
Wendy'sC14B (100.0%)- ($144,702)$144,702 (100.0%)- ($606,019)$606,019Y
Chili'sC15B (30.6%)$380,246 ($167,507)$547,754 (0.0%)$2,335,980 ($83)$2,336,063Y
Dunkin Donuts/Baskin RobbinsC17B -$122,593 $122,593- -$180,614 $180,614-Y
Haagen DazsC17B (100.0%)- ($41,382)$41,382 (100.0%)- ($174,384)$174,384Y
Blue Mesa KioskC19B -$25,264 $25,264- -$334,191 $334,191-Y
Fox NewsC19B 19.2%$212,085 $34,116$177,969 26.8%$917,948 $194,120$723,828Y
PappasitosC19B -$256,791 $256,791- -$256,791 $256,791-Y
Pizza Hut ExpressC19B (100.0%)- ($72,932)$72,932 (100.0%)- ($314,046)$314,046Y
Data as of: 1/31/201812:00:00 AM
Performance Detail by Terminal
Run: 4/4/2018 12:11:06 PMFYTD PY: Jan 17 vs. FYTD: Jan 18MTD PFY: Jan 17 vs. MTD: Jan 18
10 / 20
Terminal C
LocationLocationGate
TerminalSection
% ChgGrossReceipts
MTD
VarGrossReceiptsMTD PFY
% ChgGrossReceipts
FYTD
VarGrossReceiptsFYTD PY
SecureFlag
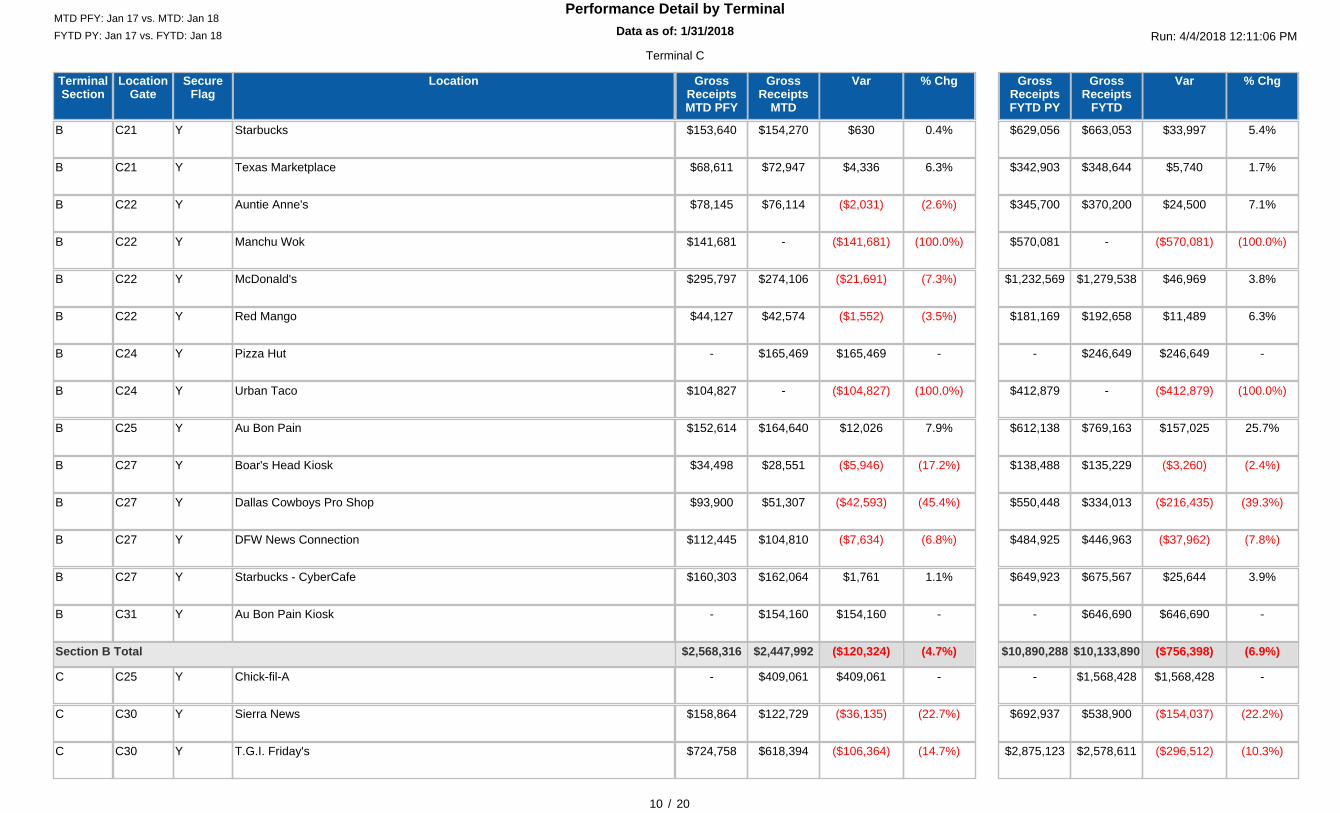
StarbucksC21B 0.4%$154,270 $630$153,640 5.4%$663,053 $33,997$629,056Y
Texas MarketplaceC21B 6.3%$72,947 $4,336$68,611 1.7%$348,644 $5,740$342,903Y
Auntie Anne'sC22B (2.6%)$76,114 ($2,031)$78,145 7.1%$370,200 $24,500$345,700Y
Manchu WokC22B (100.0%)- ($141,681)$141,681 (100.0%)- ($570,081)$570,081Y
McDonald'sC22B (7.3%)$274,106 ($21,691)$295,797 3.8%$1,279,538 $46,969$1,232,569Y
Red MangoC22B (3.5%)$42,574 ($1,552)$44,127 6.3%$192,658 $11,489$181,169Y
Pizza HutC24B -$165,469 $165,469- -$246,649 $246,649-Y
Urban TacoC24B (100.0%)- ($104,827)$104,827 (100.0%)- ($412,879)$412,879Y
Au Bon PainC25B 7.9%$164,640 $12,026$152,614 25.7%$769,163 $157,025$612,138Y
Boar's Head KioskC27B (17.2%)$28,551 ($5,946)$34,498 (2.4%)$135,229 ($3,260)$138,488Y
Dallas Cowboys Pro ShopC27B (45.4%)$51,307 ($42,593)$93,900 (39.3%)$334,013 ($216,435)$550,448Y
DFW News ConnectionC27B (6.8%)$104,810 ($7,634)$112,445 (7.8%)$446,963 ($37,962)$484,925Y
Starbucks - CyberCafeC27B 1.1%$162,064 $1,761$160,303 3.9%$675,567 $25,644$649,923Y
Au Bon Pain KioskC31B -$154,160 $154,160- -$646,690 $646,690-Y
(4.7%)$2,447,992 ($120,324)$2,568,316 (6.9%)$10,133,890 ($756,398)$10,890,288Section B Total
Chick-fil-AC25C -$409,061 $409,061- -$1,568,428 $1,568,428-Y
Sierra NewsC30C (22.7%)$122,729 ($36,135)$158,864 (22.2%)$538,900 ($154,037)$692,937Y
T.G.I. Friday'sC30C (14.7%)$618,394 ($106,364)$724,758 (10.3%)$2,578,611 ($296,512)$2,875,123Y
Data as of: 1/31/201812:00:00 AM
Performance Detail by Terminal
Run: 4/4/2018 12:11:06 PMFYTD PY: Jan 17 vs. FYTD: Jan 18MTD PFY: Jan 17 vs. MTD: Jan 18
11 / 20
Terminal C
LocationLocationGate
TerminalSection
% ChgGrossReceipts
MTD
VarGrossReceiptsMTD PFY
% ChgGrossReceipts
FYTD
VarGrossReceiptsFYTD PY
SecureFlag
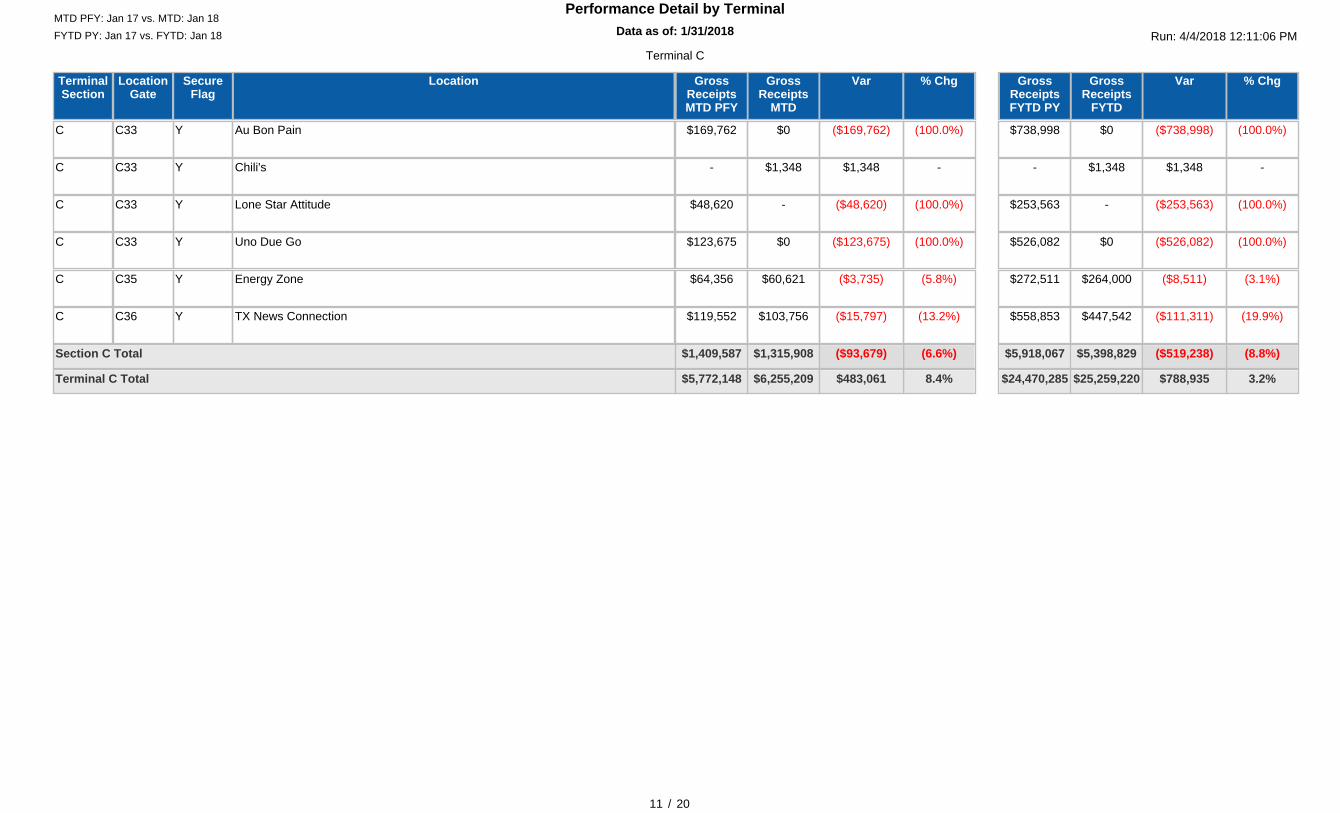
Au Bon PainC33C (100.0%)$0 ($169,762)$169,762 (100.0%)$0 ($738,998)$738,998Y
Chili'sC33C -$1,348 $1,348- -$1,348 $1,348-Y
Lone Star AttitudeC33C (100.0%)- ($48,620)$48,620 (100.0%)- ($253,563)$253,563Y
Uno Due GoC33C (100.0%)$0 ($123,675)$123,675 (100.0%)$0 ($526,082)$526,082Y
Energy ZoneC35C (5.8%)$60,621 ($3,735)$64,356 (3.1%)$264,000 ($8,511)$272,511Y
TX News ConnectionC36C (13.2%)$103,756 ($15,797)$119,552 (19.9%)$447,542 ($111,311)$558,853Y
(6.6%)$1,315,908 ($93,679)$1,409,587 (8.8%)$5,398,829 ($519,238)$5,918,067Section C Total
8.4%$6,255,209 $483,061$5,772,148 3.2%$25,259,220 $788,935$24,470,285Terminal C Total

Data as of: 1/31/201812:00:00 AM
Performance Detail by Terminal
Run: 4/4/2018 12:11:06 PMFYTD PY: Jan 17 vs. FYTD: Jan 18MTD PFY: Jan 17 vs. MTD: Jan 18
12 / 20
Terminal D
LocationLocationGate
TerminalSection
% ChgGrossReceipts
MTD
VarGrossReceiptsMTD PFY
% ChgGrossReceipts
FYTD
VarGrossReceiptsFYTD PY
SecureFlag
DFW Travelmart KioskD21N -- -- (100.0%)- ($206,230)$206,230Y
Dallas Cowboys Pro ShopD23N (100.0%)- ($106,516)$106,516 (100.0%)- ($587,089)$587,089Y
Cantina LaredoD24N (3.4%)$159,674 ($5,683)$165,357 (11.8%)$626,961 ($83,742)$710,703Y
CoachD24N 1.0%$87,604 $870$86,734 (2.5%)$375,578 ($9,485)$385,063Y
Jo Malone, Aveda, MACD24N 5.0%$122,404 $5,814$116,591 (2.6%)$543,852 ($14,750)$558,602Y
LongchampD24N (29.6%)$36,536 ($15,341)$51,877 (3.5%)$192,690 ($7,023)$199,714Y
Mont BlancD24N 31.5%$80,413 $19,258$61,154 22.8%$297,108 $55,170$241,938Y
Cool RiverD25N 3.8%$196,839 $7,153$189,686 (2.8%)$777,885 ($22,723)$800,608Y
Simply Books & Starbucks CoffeeD25N (51.4%)$99,829 ($105,755)$205,584 (52.7%)$437,140 ($486,702)$923,842Y
Artisan MarketD27N (0.2%)$160,265 ($313)$160,578 (10.2%)$630,342 ($71,256)$701,598Y
Ben & Jerry'sD27N -- $0$0 -- $0$0Y
CRU Wine BarD27N 20.8%$74,052 $12,750$61,302 11.1%$301,290 $30,121$271,169Y
Hugo Boss / TUMID27N 17.0%$143,639 $20,839$122,800 34.8%$578,555 $149,506$429,049Y
III ForksD27N (100.0%)- ($75,839)$75,839 (100.0%)- ($304,615)$304,615Y
Kate SpadeD27N -$57,629 $57,629- -$198,181 $198,181-Y
Michael KorsD27N -$79,585 $79,585- -$363,233 $363,233-Y
Stampede 66 ExpressD27N (16.8%)$77,268 ($15,643)$92,910 (25.3%)$298,869 ($101,339)$400,207Y
StarbucksD27N (0.5%)$103,838 ($545)$104,383 (12.8%)$424,785 ($62,341)$487,125Y
Data as of: 1/31/201812:00:00 AM
Performance Detail by Terminal
Run: 4/4/2018 12:11:06 PMFYTD PY: Jan 17 vs. FYTD: Jan 18MTD PFY: Jan 17 vs. MTD: Jan 18
13 / 20
Terminal D
LocationLocationGate
TerminalSection
% ChgGrossReceipts
MTD
VarGrossReceiptsMTD PFY
% ChgGrossReceipts
FYTD
VarGrossReceiptsFYTD PY
SecureFlag
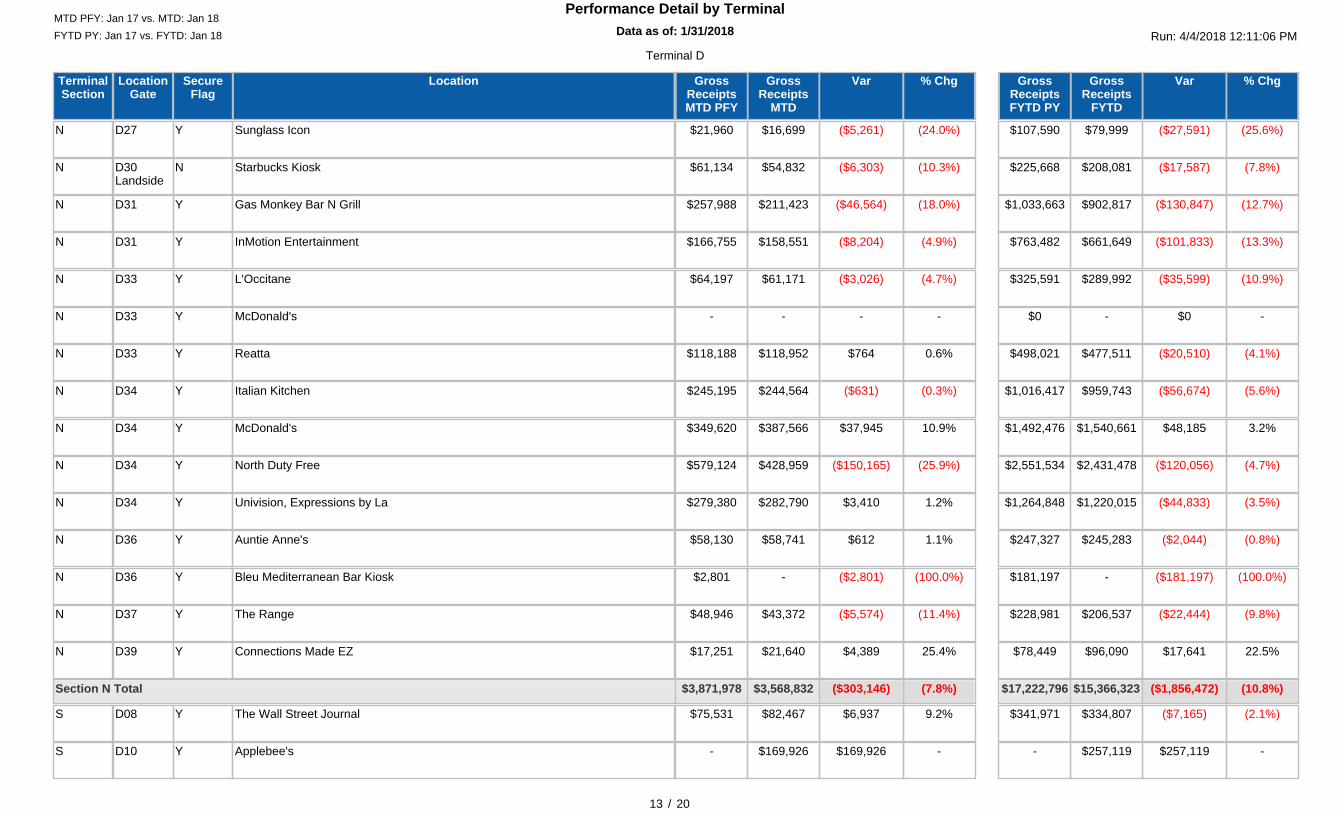
Sunglass IconD27N (24.0%)$16,699 ($5,261)$21,960 (25.6%)$79,999 ($27,591)$107,590Y
Starbucks KioskD30Landside
N (10.3%)$54,832 ($6,303)$61,134 (7.8%)$208,081 ($17,587)$225,668N
Gas Monkey Bar N GrillD31N (18.0%)$211,423 ($46,564)$257,988 (12.7%)$902,817 ($130,847)$1,033,663Y
InMotion EntertainmentD31N (4.9%)$158,551 ($8,204)$166,755 (13.3%)$661,649 ($101,833)$763,482Y
L'OccitaneD33N (4.7%)$61,171 ($3,026)$64,197 (10.9%)$289,992 ($35,599)$325,591Y
McDonald'sD33N -- -- -- $0$0Y
ReattaD33N 0.6%$118,952 $764$118,188 (4.1%)$477,511 ($20,510)$498,021Y
Italian KitchenD34N (0.3%)$244,564 ($631)$245,195 (5.6%)$959,743 ($56,674)$1,016,417Y
McDonald'sD34N 10.9%$387,566 $37,945$349,620 3.2%$1,540,661 $48,185$1,492,476Y
North Duty FreeD34N (25.9%)$428,959 ($150,165)$579,124 (4.7%)$2,431,478 ($120,056)$2,551,534Y
Univision, Expressions by LaD34N 1.2%$282,790 $3,410$279,380 (3.5%)$1,220,015 ($44,833)$1,264,848Y
Auntie Anne'sD36N 1.1%$58,741 $612$58,130 (0.8%)$245,283 ($2,044)$247,327Y
Bleu Mediterranean Bar KioskD36N (100.0%)- ($2,801)$2,801 (100.0%)- ($181,197)$181,197Y
The RangeD37N (11.4%)$43,372 ($5,574)$48,946 (9.8%)$206,537 ($22,444)$228,981Y
Connections Made EZD39N 25.4%$21,640 $4,389$17,251 22.5%$96,090 $17,641$78,449Y
(7.8%)$3,568,832 ($303,146)$3,871,978 (10.8%)$15,366,323 ($1,856,472)$17,222,796Section N Total
The Wall Street JournalD08S 9.2%$82,467 $6,937$75,531 (2.1%)$334,807 ($7,165)$341,971Y
Applebee'sD10S -$169,926 $169,926- -$257,119 $257,119-Y
Data as of: 1/31/201812:00:00 AM
Performance Detail by Terminal
Run: 4/4/2018 12:11:06 PMFYTD PY: Jan 17 vs. FYTD: Jan 18MTD PFY: Jan 17 vs. MTD: Jan 18
14 / 20
Terminal D
LocationLocationGate
TerminalSection
% ChgGrossReceipts
MTD
VarGrossReceiptsMTD PFY
% ChgGrossReceipts
FYTD
VarGrossReceiptsFYTD PY
SecureFlag
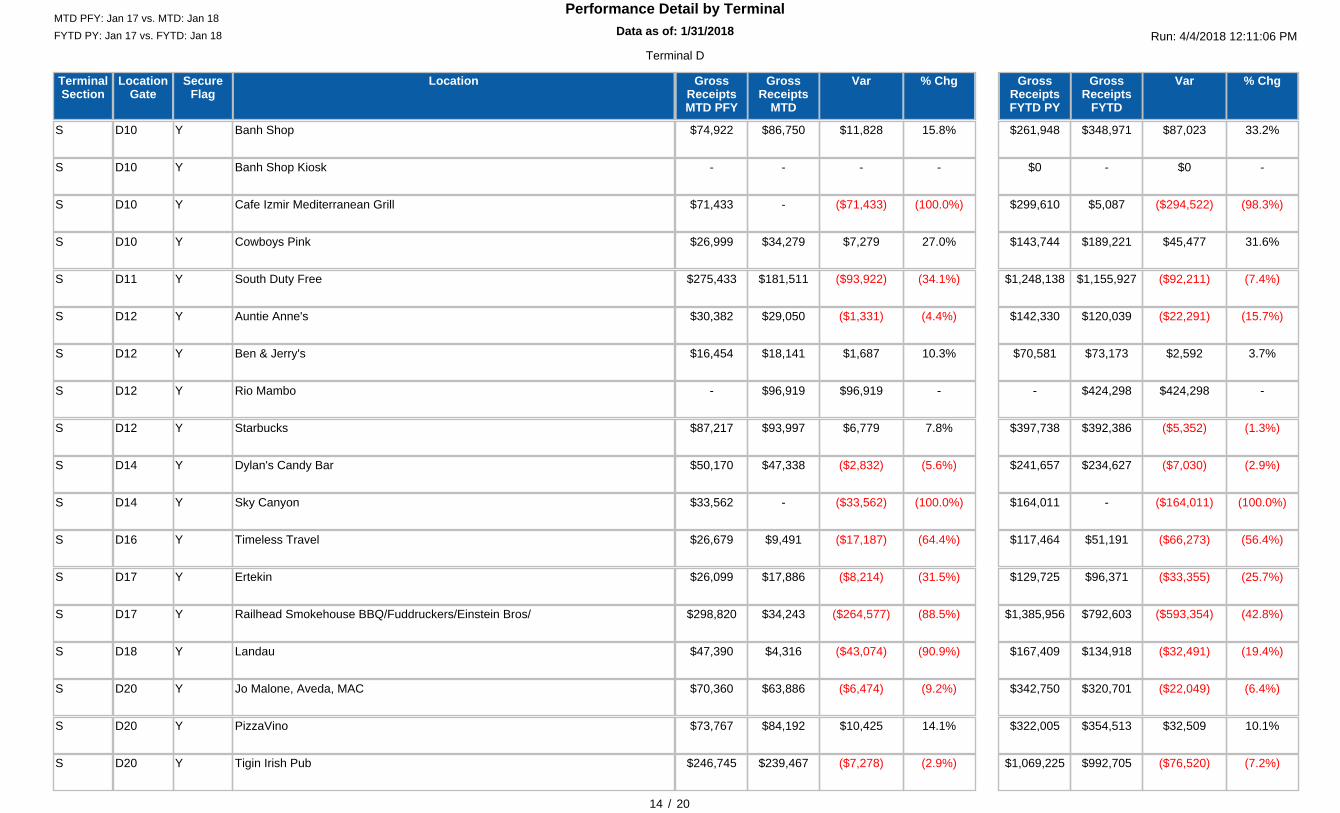
Banh ShopD10S 15.8%$86,750 $11,828$74,922 33.2%$348,971 $87,023$261,948Y
Banh Shop KioskD10S -- -- -- $0$0Y
Cafe Izmir Mediterranean GrillD10S (100.0%)- ($71,433)$71,433 (98.3%)$5,087 ($294,522)$299,610Y
Cowboys PinkD10S 27.0%$34,279 $7,279$26,999 31.6%$189,221 $45,477$143,744Y
South Duty FreeD11S (34.1%)$181,511 ($93,922)$275,433 (7.4%)$1,155,927 ($92,211)$1,248,138Y
Auntie Anne'sD12S (4.4%)$29,050 ($1,331)$30,382 (15.7%)$120,039 ($22,291)$142,330Y
Ben & Jerry'sD12S 10.3%$18,141 $1,687$16,454 3.7%$73,173 $2,592$70,581Y
Rio MamboD12S -$96,919 $96,919- -$424,298 $424,298-Y
StarbucksD12S 7.8%$93,997 $6,779$87,217 (1.3%)$392,386 ($5,352)$397,738Y
Dylan's Candy BarD14S (5.6%)$47,338 ($2,832)$50,170 (2.9%)$234,627 ($7,030)$241,657Y
Sky CanyonD14S (100.0%)- ($33,562)$33,562 (100.0%)- ($164,011)$164,011Y
Timeless TravelD16S (64.4%)$9,491 ($17,187)$26,679 (56.4%)$51,191 ($66,273)$117,464Y
ErtekinD17S (31.5%)$17,886 ($8,214)$26,099 (25.7%)$96,371 ($33,355)$129,725Y
Railhead Smokehouse BBQ/Fuddruckers/Einstein Bros/D17S (88.5%)$34,243 ($264,577)$298,820 (42.8%)$792,603 ($593,354)$1,385,956Y
LandauD18S (90.9%)$4,316 ($43,074)$47,390 (19.4%)$134,918 ($32,491)$167,409Y
Jo Malone, Aveda, MACD20S (9.2%)$63,886 ($6,474)$70,360 (6.4%)$320,701 ($22,049)$342,750Y
PizzaVinoD20S 14.1%$84,192 $10,425$73,767 10.1%$354,513 $32,509$322,005Y
Tigin Irish PubD20S (2.9%)$239,467 ($7,278)$246,745 (7.2%)$992,705 ($76,520)$1,069,225Y
Data as of: 1/31/201812:00:00 AM
Performance Detail by Terminal
Run: 4/4/2018 12:11:06 PMFYTD PY: Jan 17 vs. FYTD: Jan 18MTD PFY: Jan 17 vs. MTD: Jan 18
15 / 20
Terminal D
LocationLocationGate
TerminalSection
% ChgGrossReceipts
MTD
VarGrossReceiptsMTD PFY
% ChgGrossReceipts
FYTD
VarGrossReceiptsFYTD PY
SecureFlag
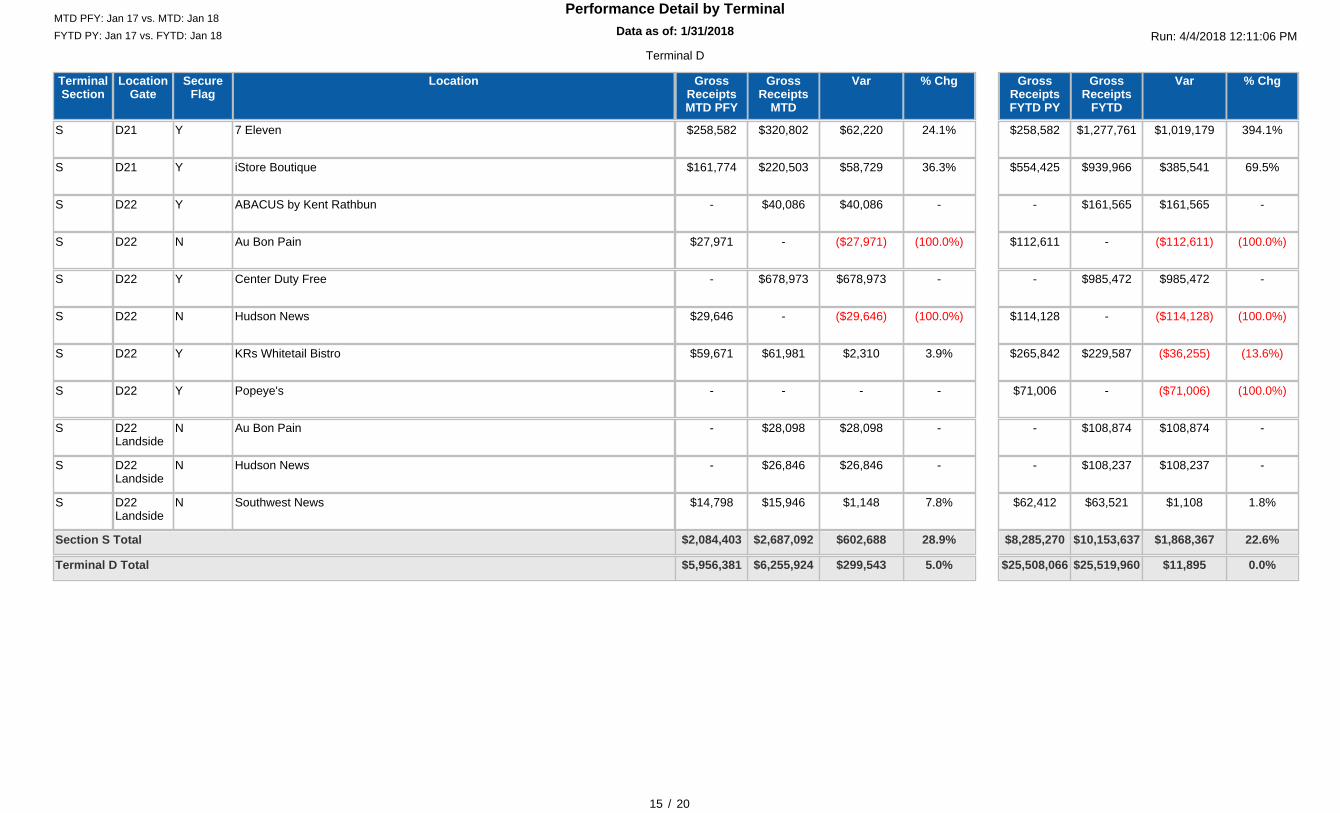
7 ElevenD21S 24.1%$320,802 $62,220$258,582 394.1%$1,277,761 $1,019,179$258,582Y
iStore BoutiqueD21S 36.3%$220,503 $58,729$161,774 69.5%$939,966 $385,541$554,425Y
ABACUS by Kent RathbunD22S -$40,086 $40,086- -$161,565 $161,565-Y
Au Bon PainD22S (100.0%)- ($27,971)$27,971 (100.0%)- ($112,611)$112,611N
Center Duty FreeD22S -$678,973 $678,973- -$985,472 $985,472-Y
Hudson NewsD22S (100.0%)- ($29,646)$29,646 (100.0%)- ($114,128)$114,128N
KRs Whitetail BistroD22S 3.9%$61,981 $2,310$59,671 (13.6%)$229,587 ($36,255)$265,842Y
Popeye'sD22S -- -- (100.0%)- ($71,006)$71,006Y
Au Bon PainD22Landside
S -$28,098 $28,098- -$108,874 $108,874-N
Hudson NewsD22Landside
S -$26,846 $26,846- -$108,237 $108,237-N
Southwest NewsD22Landside
S 7.8%$15,946 $1,148$14,798 1.8%$63,521 $1,108$62,412N
28.9%$2,687,092 $602,688$2,084,403 22.6%$10,153,637 $1,868,367$8,285,270Section S Total
5.0%$6,255,924 $299,543$5,956,381 0.0%$25,519,960 $11,895$25,508,066Terminal D Total
Data as of: 1/31/201812:00:00 AM
Performance Detail by Terminal
Run: 4/4/2018 12:11:06 PMFYTD PY: Jan 17 vs. FYTD: Jan 18MTD PFY: Jan 17 vs. MTD: Jan 18
16 / 20
Terminal E
LocationLocationGate
TerminalSection
% ChgGrossReceipts
MTD
VarGrossReceiptsMTD PFY
% ChgGrossReceipts
FYTD
VarGrossReceiptsFYTD PY
SecureFlag
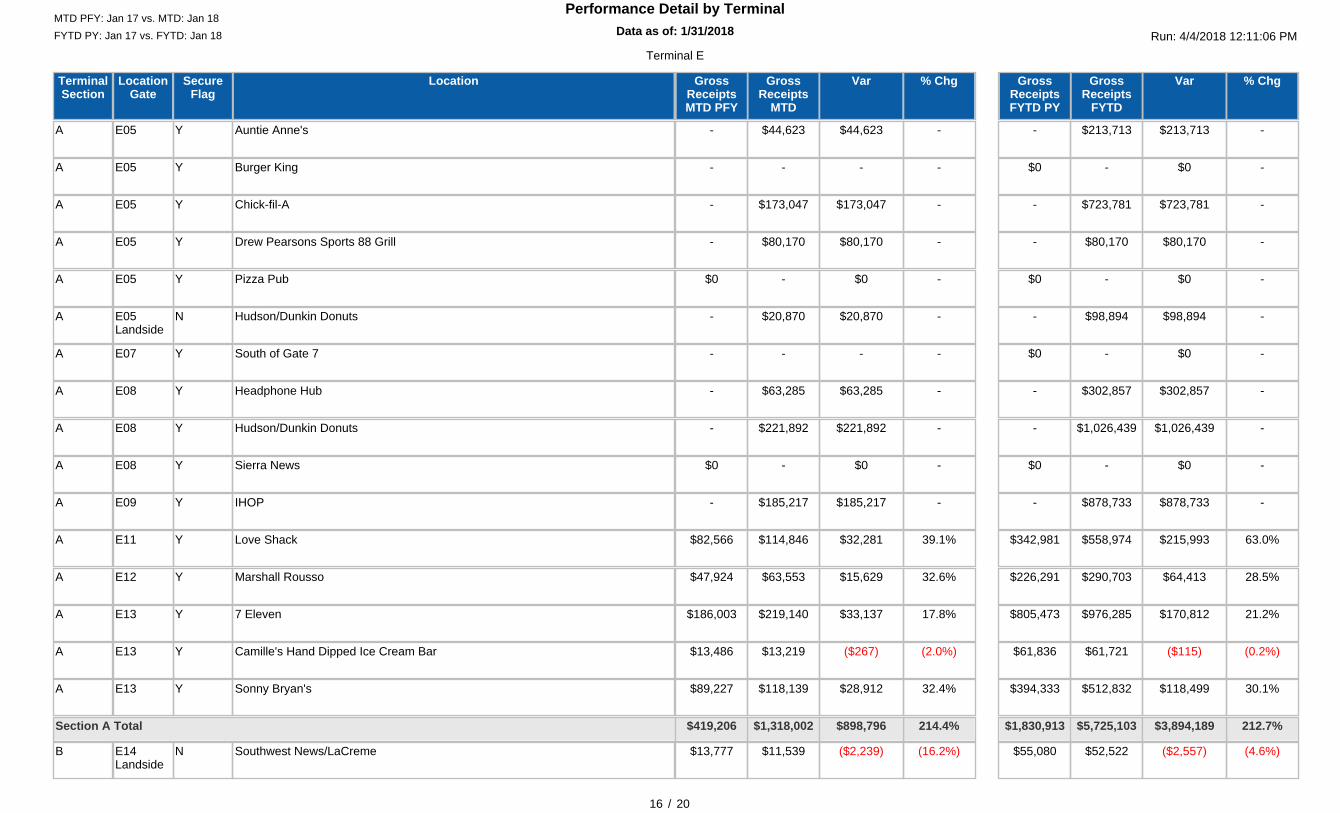
Auntie Anne'sE05A -$44,623 $44,623- -$213,713 $213,713-Y
Burger KingE05A -- -- -- $0$0Y
Chick-fil-AE05A -$173,047 $173,047- -$723,781 $723,781-Y
Drew Pearsons Sports 88 GrillE05A -$80,170 $80,170- -$80,170 $80,170-Y
Pizza PubE05A -- $0$0 -- $0$0Y
Hudson/Dunkin DonutsE05Landside
A -$20,870 $20,870- -$98,894 $98,894-N
South of Gate 7E07A -- -- -- $0$0Y
Headphone HubE08A -$63,285 $63,285- -$302,857 $302,857-Y
Hudson/Dunkin DonutsE08A -$221,892 $221,892- -$1,026,439 $1,026,439-Y
Sierra NewsE08A -- $0$0 -- $0$0Y
IHOPE09A -$185,217 $185,217- -$878,733 $878,733-Y
Love ShackE11A 39.1%$114,846 $32,281$82,566 63.0%$558,974 $215,993$342,981Y
Marshall RoussoE12A 32.6%$63,553 $15,629$47,924 28.5%$290,703 $64,413$226,291Y
7 ElevenE13A 17.8%$219,140 $33,137$186,003 21.2%$976,285 $170,812$805,473Y
Camille's Hand Dipped Ice Cream BarE13A (2.0%)$13,219 ($267)$13,486 (0.2%)$61,721 ($115)$61,836Y
Sonny Bryan'sE13A 32.4%$118,139 $28,912$89,227 30.1%$512,832 $118,499$394,333Y
214.4%$1,318,002 $898,796$419,206 212.7%$5,725,103 $3,894,189$1,830,913Section A Total
Southwest News/LaCremeE14Landside
B (16.2%)$11,539 ($2,239)$13,777 (4.6%)$52,522 ($2,557)$55,080N
Data as of: 1/31/201812:00:00 AM
Performance Detail by Terminal
Run: 4/4/2018 12:11:06 PMFYTD PY: Jan 17 vs. FYTD: Jan 18MTD PFY: Jan 17 vs. MTD: Jan 18
17 / 20
Terminal E
LocationLocationGate
TerminalSection
% ChgGrossReceipts
MTD
VarGrossReceiptsMTD PFY
% ChgGrossReceipts
FYTD
VarGrossReceiptsFYTD PY
SecureFlag
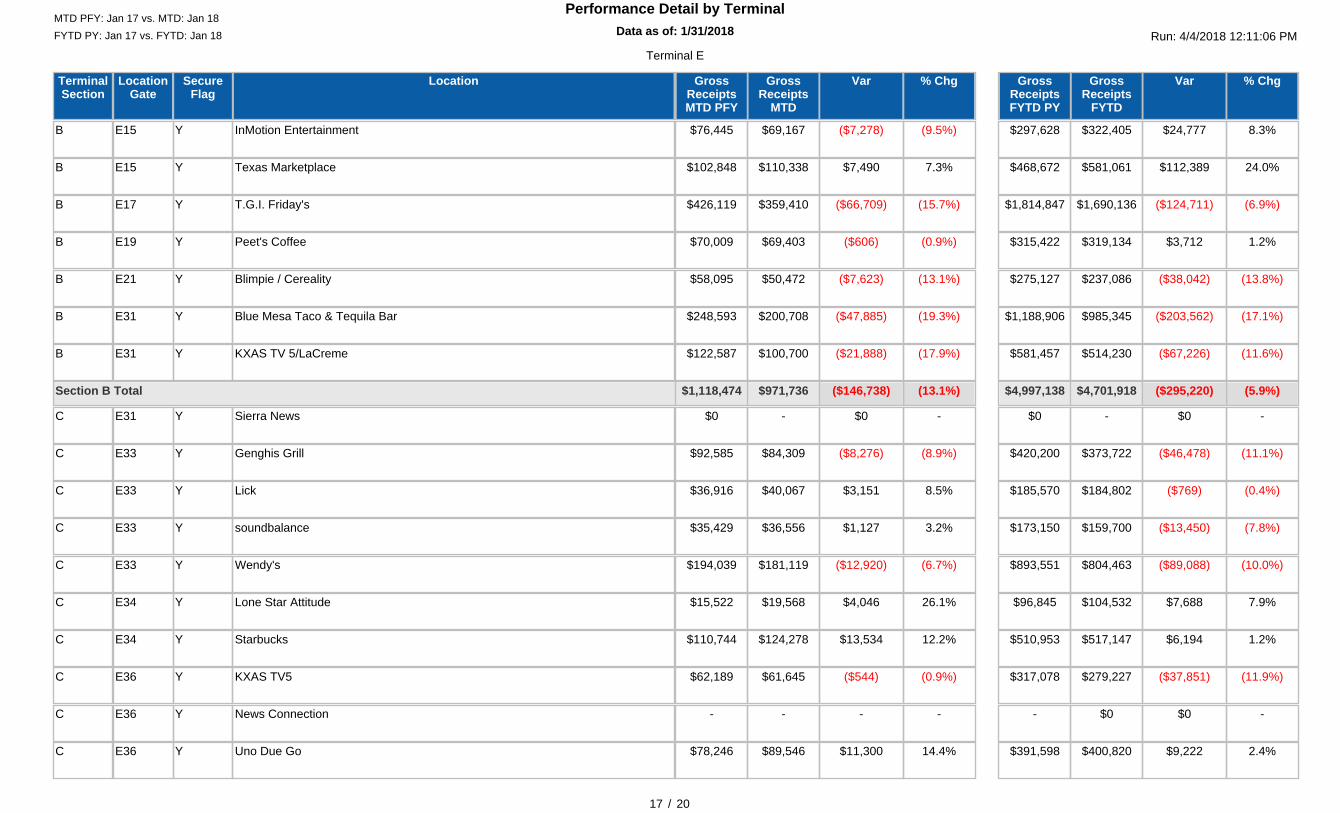
InMotion EntertainmentE15B (9.5%)$69,167 ($7,278)$76,445 8.3%$322,405 $24,777$297,628Y
Texas MarketplaceE15B 7.3%$110,338 $7,490$102,848 24.0%$581,061 $112,389$468,672Y
T.G.I. Friday'sE17B (15.7%)$359,410 ($66,709)$426,119 (6.9%)$1,690,136 ($124,711)$1,814,847Y
Peet's CoffeeE19B (0.9%)$69,403 ($606)$70,009 1.2%$319,134 $3,712$315,422Y
Blimpie / CerealityE21B (13.1%)$50,472 ($7,623)$58,095 (13.8%)$237,086 ($38,042)$275,127Y
Blue Mesa Taco & Tequila BarE31B (19.3%)$200,708 ($47,885)$248,593 (17.1%)$985,345 ($203,562)$1,188,906Y
KXAS TV 5/LaCremeE31B (17.9%)$100,700 ($21,888)$122,587 (11.6%)$514,230 ($67,226)$581,457Y
(13.1%)$971,736 ($146,738)$1,118,474 (5.9%)$4,701,918 ($295,220)$4,997,138Section B Total
Sierra NewsE31C -- $0$0 -- $0$0Y
Genghis GrillE33C (8.9%)$84,309 ($8,276)$92,585 (11.1%)$373,722 ($46,478)$420,200Y
LickE33C 8.5%$40,067 $3,151$36,916 (0.4%)$184,802 ($769)$185,570Y
soundbalanceE33C 3.2%$36,556 $1,127$35,429 (7.8%)$159,700 ($13,450)$173,150Y
Wendy'sE33C (6.7%)$181,119 ($12,920)$194,039 (10.0%)$804,463 ($89,088)$893,551Y
Lone Star AttitudeE34C 26.1%$19,568 $4,046$15,522 7.9%$104,532 $7,688$96,845Y
StarbucksE34C 12.2%$124,278 $13,534$110,744 1.2%$517,147 $6,194$510,953Y
KXAS TV5E36C (0.9%)$61,645 ($544)$62,189 (11.9%)$279,227 ($37,851)$317,078Y
News ConnectionE36C -- -- -$0 $0-Y
Uno Due GoE36C 14.4%$89,546 $11,300$78,246 2.4%$400,820 $9,222$391,598Y
Data as of: 1/31/201812:00:00 AM
Performance Detail by Terminal
Run: 4/4/2018 12:11:06 PMFYTD PY: Jan 17 vs. FYTD: Jan 18MTD PFY: Jan 17 vs. MTD: Jan 18
18 / 20
Terminal E
LocationLocationGate
TerminalSection
% ChgGrossReceipts
MTD
VarGrossReceiptsMTD PFY
% ChgGrossReceipts
FYTD
VarGrossReceiptsFYTD PY
SecureFlag
Southwest News/LaCremeE37Landside
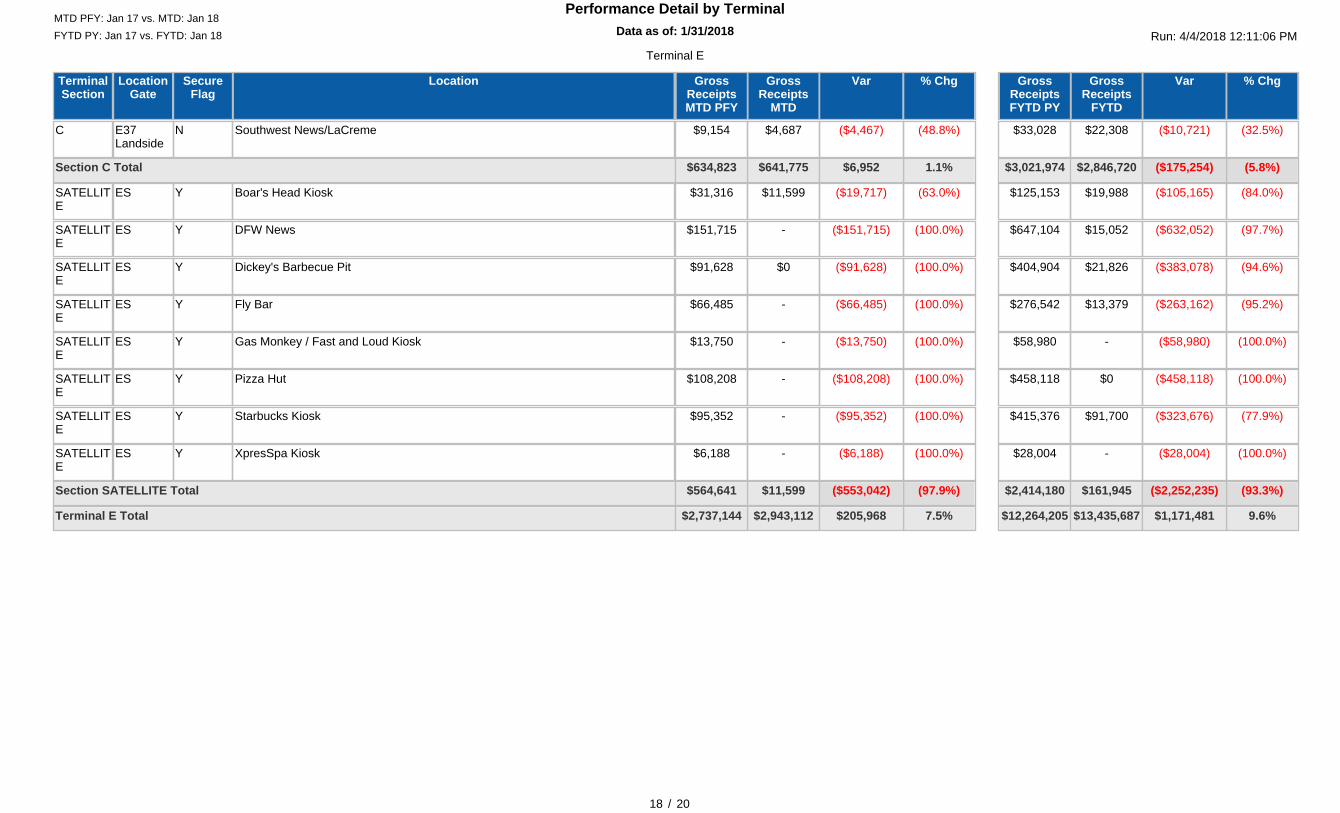
C (48.8%)$4,687 ($4,467)$9,154 (32.5%)$22,308 ($10,721)$33,028N
1.1%$641,775 $6,952$634,823 (5.8%)$2,846,720 ($175,254)$3,021,974Section C Total
Boar's Head KioskESSATELLITE
(63.0%)$11,599 ($19,717)$31,316 (84.0%)$19,988 ($105,165)$125,153Y
DFW NewsESSATELLITE
(100.0%)- ($151,715)$151,715 (97.7%)$15,052 ($632,052)$647,104Y
Dickey's Barbecue PitESSATELLITE
(100.0%)$0 ($91,628)$91,628 (94.6%)$21,826 ($383,078)$404,904Y
Fly BarESSATELLITE
(100.0%)- ($66,485)$66,485 (95.2%)$13,379 ($263,162)$276,542Y
Gas Monkey / Fast and Loud KioskESSATELLITE
(100.0%)- ($13,750)$13,750 (100.0%)- ($58,980)$58,980Y
Pizza HutESSATELLITE
(100.0%)- ($108,208)$108,208 (100.0%)$0 ($458,118)$458,118Y
Starbucks KioskESSATELLITE
(100.0%)- ($95,352)$95,352 (77.9%)$91,700 ($323,676)$415,376Y
XpresSpa KioskESSATELLITE
(100.0%)- ($6,188)$6,188 (100.0%)- ($28,004)$28,004Y
(97.9%)$11,599 ($553,042)$564,641 (93.3%)$161,945 ($2,252,235)$2,414,180Section SATELLITE Total
7.5%$2,943,112 $205,968$2,737,144 9.6%$13,435,687 $1,171,481$12,264,205Terminal E Total
Data as of: 1/31/201812:00:00 AM
Performance Detail by Terminal
Run: 4/4/2018 12:11:06 PMFYTD PY: Jan 17 vs. FYTD: Jan 18MTD PFY: Jan 17 vs. MTD: Jan 18
19 / 20
Terminal O
LocationLocationGate
TerminalSection
% ChgGrossReceipts
MTD
VarGrossReceiptsMTD PFY
% ChgGrossReceipts
FYTD
VarGrossReceiptsFYTD PY
SecureFlag
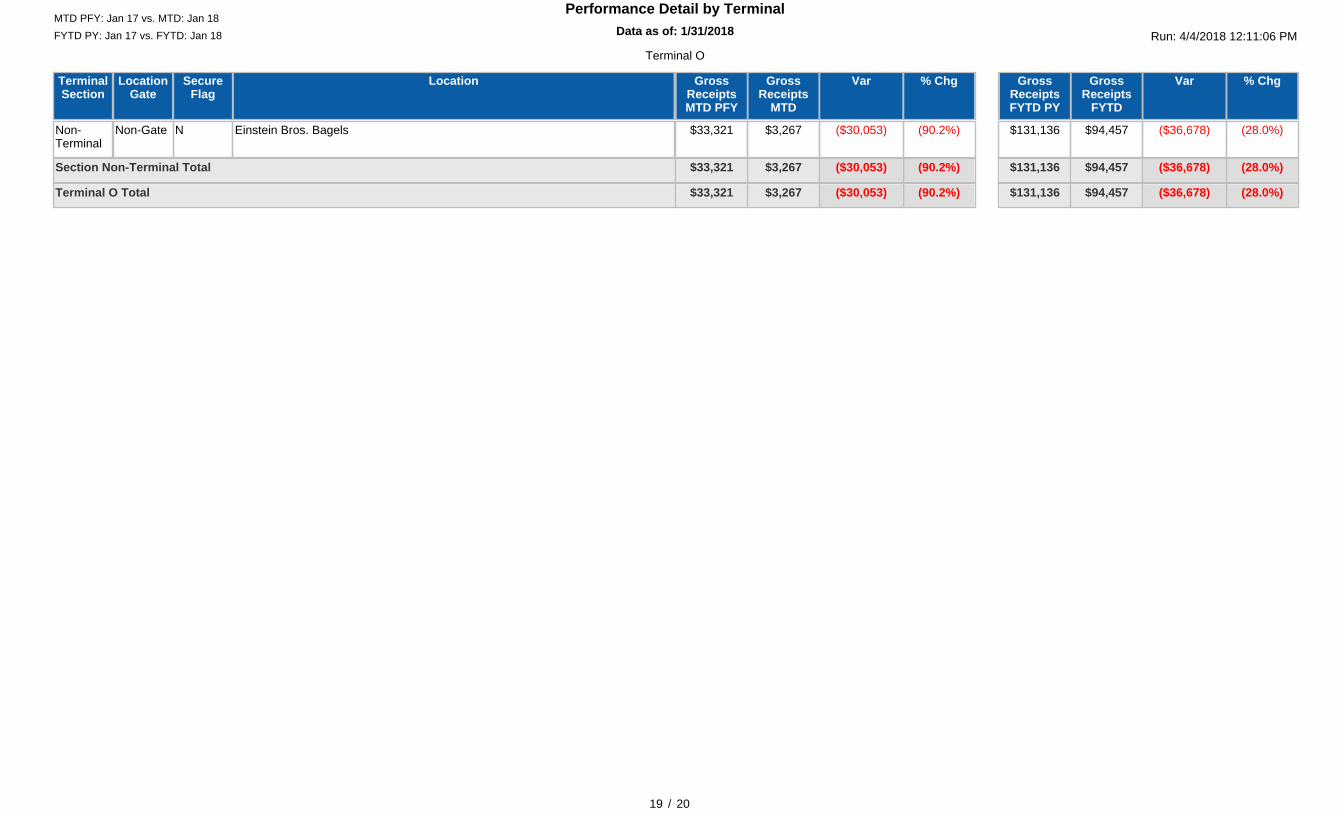
Einstein Bros. BagelsNon-GateNon-Terminal
(90.2%)$3,267 ($30,053)$33,321 (28.0%)$94,457 ($36,678)$131,136N
(90.2%)$3,267 ($30,053)$33,321 (28.0%)$94,457 ($36,678)$131,136Section Non-Terminal Total
(90.2%)$3,267 ($30,053)$33,321 (28.0%)$94,457 ($36,678)$131,136Terminal O Total
Data as of: 1/31/201812:00:00 AM
Performance Detail by Terminal
Run: 4/4/2018 12:11:06 PMFYTD PY: Jan 17 vs. FYTD: Jan 18MTD PFY: Jan 17 vs. MTD: Jan 18
20 / 20
RAC
LocationLocationGate
TerminalSection
% ChgGrossReceipts
MTD
VarGrossReceiptsMTD PFY
% ChgGrossReceipts
FYTD
VarGrossReceiptsFYTD PY
SecureFlag
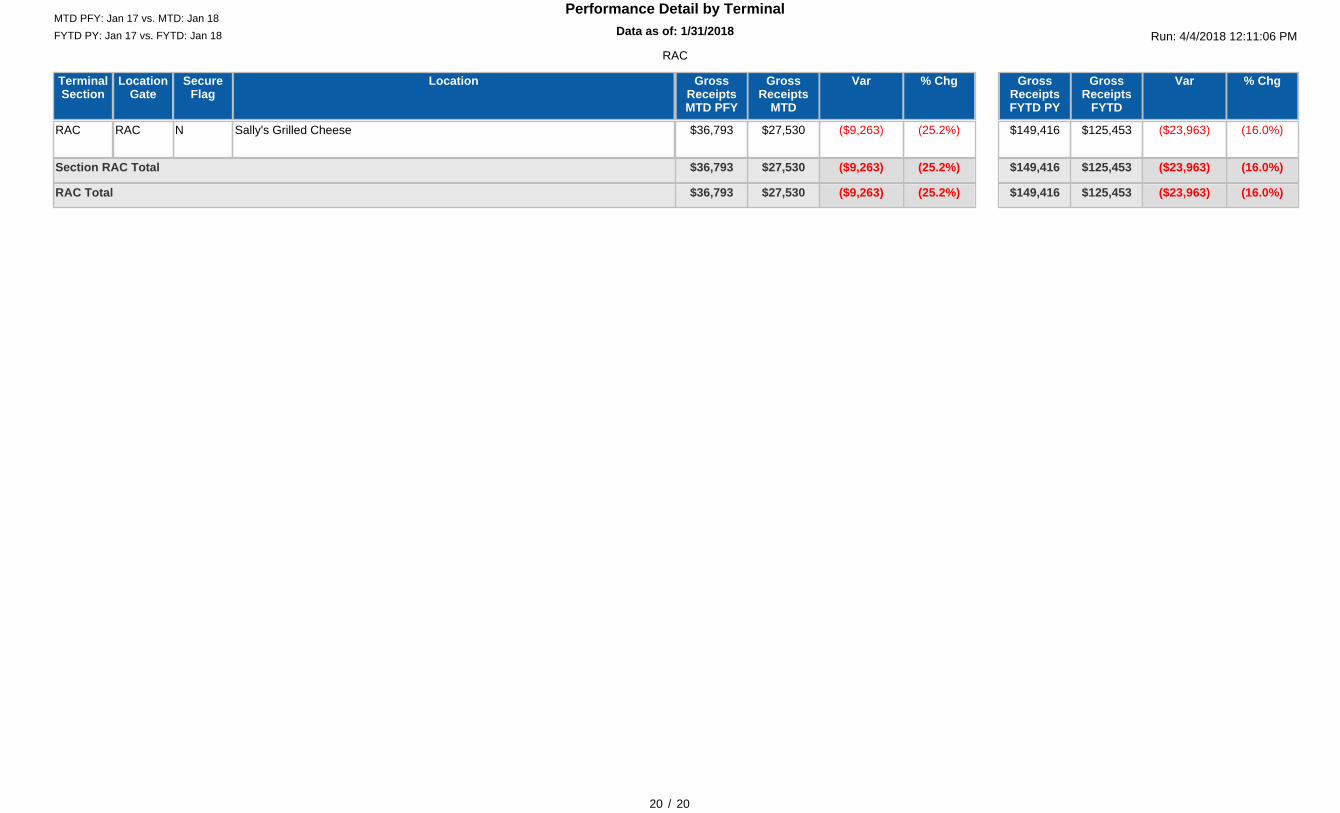
Sally's Grilled CheeseRACRAC (25.2%)$27,530 ($9,263)$36,793 (16.0%)$125,453 ($23,963)$149,416N
(25.2%)$27,530 ($9,263)$36,793 (16.0%)$125,453 ($23,963)$149,416Section RAC Total
(25.2%)$27,530 ($9,263)$36,793 (16.0%)$125,453 ($23,963)$149,416RAC Total
Data as of: 1/31/201812:00:00 AM
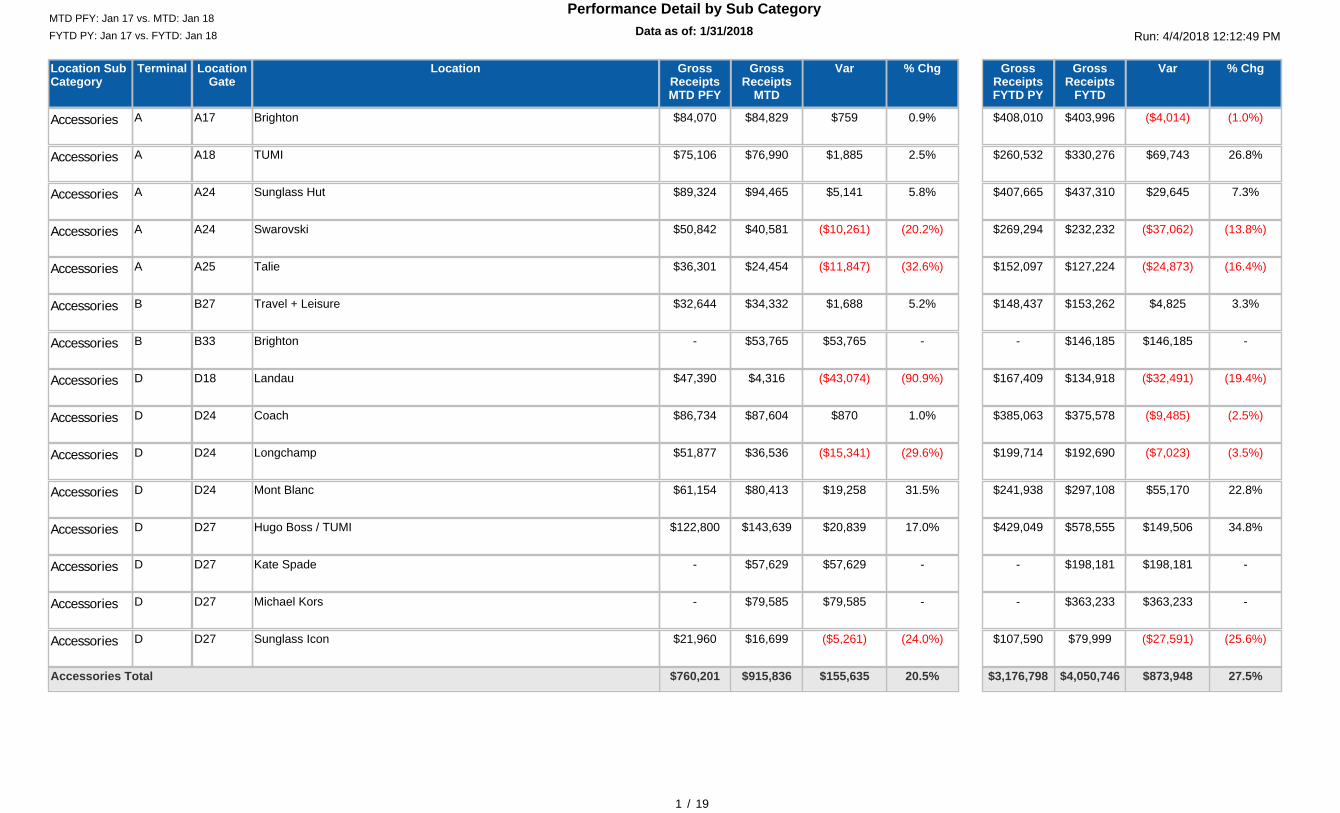
Performance Detail by Sub Category
LocationLocationGate
Terminal % ChgGrossReceipts
MTD
VarGrossReceiptsMTD PFY
% ChgGrossReceipts
FYTD
VarGrossReceiptsFYTD PY
Location SubCategory
Run: 4/4/2018 12:12:49 PMFYTD PY: Jan 17 vs. FYTD: Jan 18MTD PFY: Jan 17 vs. MTD: Jan 18
1 / 19
BrightonA17A 0.9%$84,829 $759$84,070 (1.0%)$403,996 ($4,014)$408,010Accessories
TUMIA18A 2.5%$76,990 $1,885$75,106 26.8%$330,276 $69,743$260,532Accessories
Sunglass HutA24A 5.8%$94,465 $5,141$89,324 7.3%$437,310 $29,645$407,665Accessories
SwarovskiA24A (20.2%)$40,581 ($10,261)$50,842 (13.8%)$232,232 ($37,062)$269,294Accessories
TalieA25A (32.6%)$24,454 ($11,847)$36,301 (16.4%)$127,224 ($24,873)$152,097Accessories
Travel + LeisureB27B 5.2%$34,332 $1,688$32,644 3.3%$153,262 $4,825$148,437Accessories
BrightonB33B -$53,765 $53,765- -$146,185 $146,185-Accessories
LandauD18D (90.9%)$4,316 ($43,074)$47,390 (19.4%)$134,918 ($32,491)$167,409Accessories
CoachD24D 1.0%$87,604 $870$86,734 (2.5%)$375,578 ($9,485)$385,063Accessories
LongchampD24D (29.6%)$36,536 ($15,341)$51,877 (3.5%)$192,690 ($7,023)$199,714Accessories
Mont BlancD24D 31.5%$80,413 $19,258$61,154 22.8%$297,108 $55,170$241,938Accessories
Hugo Boss / TUMID27D 17.0%$143,639 $20,839$122,800 34.8%$578,555 $149,506$429,049Accessories
Kate SpadeD27D -$57,629 $57,629- -$198,181 $198,181-Accessories
Michael KorsD27D -$79,585 $79,585- -$363,233 $363,233-Accessories
Sunglass IconD27D (24.0%)$16,699 ($5,261)$21,960 (25.6%)$79,999 ($27,591)$107,590Accessories
20.5%$915,836 $155,635$760,201 27.5%$4,050,746 $873,948$3,176,798Accessories Total
Data as of: 1/31/201812:00:00 AM
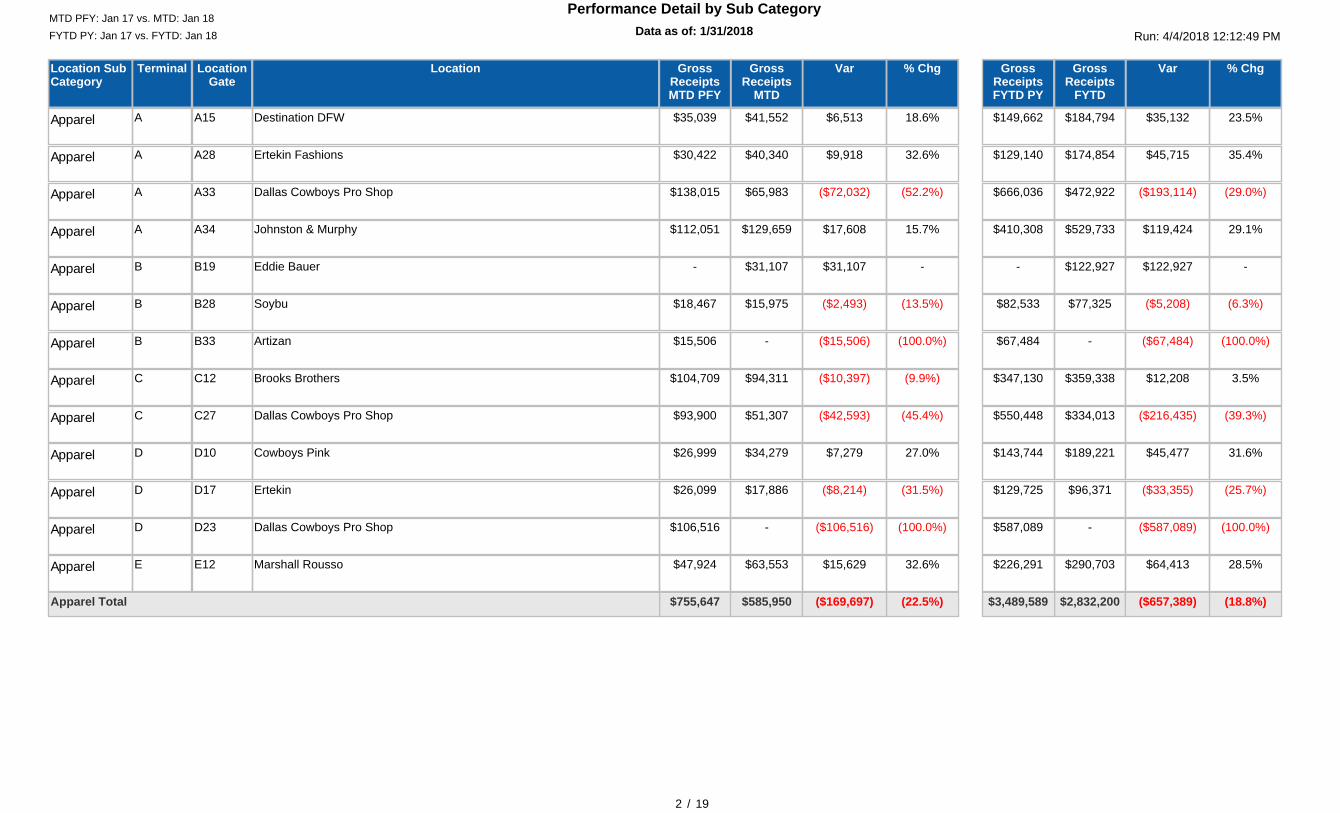
Performance Detail by Sub Category
LocationLocationGate
Terminal % ChgGrossReceipts
MTD
VarGrossReceiptsMTD PFY
% ChgGrossReceipts
FYTD
VarGrossReceiptsFYTD PY
Location SubCategory
Run: 4/4/2018 12:12:49 PMFYTD PY: Jan 17 vs. FYTD: Jan 18MTD PFY: Jan 17 vs. MTD: Jan 18
2 / 19
Destination DFWA15A 18.6%$41,552 $6,513$35,039 23.5%$184,794 $35,132$149,662Apparel
Ertekin FashionsA28A 32.6%$40,340 $9,918$30,422 35.4%$174,854 $45,715$129,140Apparel
Dallas Cowboys Pro ShopA33A (52.2%)$65,983 ($72,032)$138,015 (29.0%)$472,922 ($193,114)$666,036Apparel
Johnston & MurphyA34A 15.7%$129,659 $17,608$112,051 29.1%$529,733 $119,424$410,308Apparel
Eddie BauerB19B -$31,107 $31,107- -$122,927 $122,927-Apparel
SoybuB28B (13.5%)$15,975 ($2,493)$18,467 (6.3%)$77,325 ($5,208)$82,533Apparel
ArtizanB33B (100.0%)- ($15,506)$15,506 (100.0%)- ($67,484)$67,484Apparel
Brooks BrothersC12C (9.9%)$94,311 ($10,397)$104,709 3.5%$359,338 $12,208$347,130Apparel
Dallas Cowboys Pro ShopC27C (45.4%)$51,307 ($42,593)$93,900 (39.3%)$334,013 ($216,435)$550,448Apparel
Cowboys PinkD10D 27.0%$34,279 $7,279$26,999 31.6%$189,221 $45,477$143,744Apparel
ErtekinD17D (31.5%)$17,886 ($8,214)$26,099 (25.7%)$96,371 ($33,355)$129,725Apparel
Dallas Cowboys Pro ShopD23D (100.0%)- ($106,516)$106,516 (100.0%)- ($587,089)$587,089Apparel
Marshall RoussoE12E 32.6%$63,553 $15,629$47,924 28.5%$290,703 $64,413$226,291Apparel
(22.5%)$585,950 ($169,697)$755,647 (18.8%)$2,832,200 ($657,389)$3,489,589Apparel Total
Data as of: 1/31/201812:00:00 AM
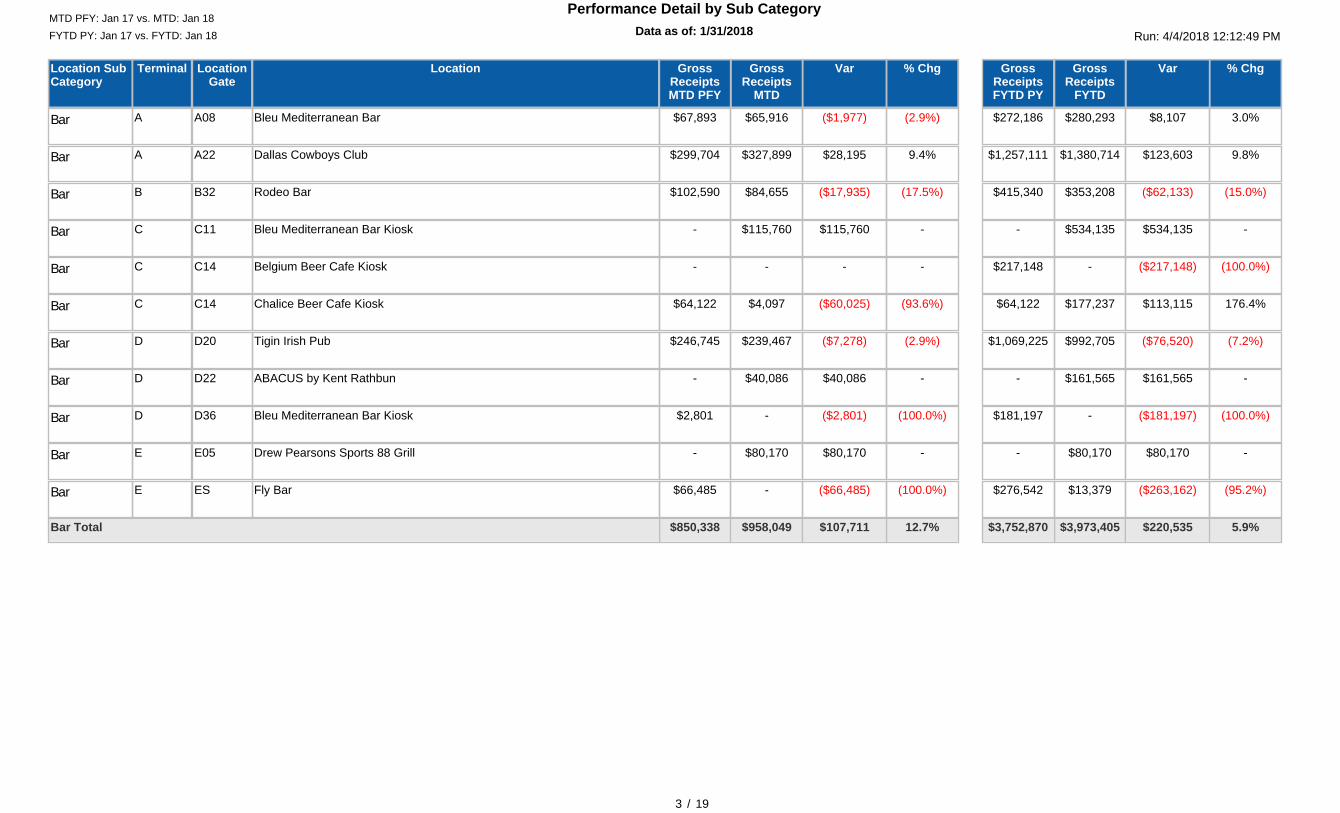
Performance Detail by Sub Category
LocationLocationGate
Terminal % ChgGrossReceipts
MTD
VarGrossReceiptsMTD PFY
% ChgGrossReceipts
FYTD
VarGrossReceiptsFYTD PY
Location SubCategory
Run: 4/4/2018 12:12:49 PMFYTD PY: Jan 17 vs. FYTD: Jan 18MTD PFY: Jan 17 vs. MTD: Jan 18
3 / 19
Bleu Mediterranean BarA08A (2.9%)$65,916 ($1,977)$67,893 3.0%$280,293 $8,107$272,186Bar
Dallas Cowboys ClubA22A 9.4%$327,899 $28,195$299,704 9.8%$1,380,714 $123,603$1,257,111Bar
Rodeo BarB32B (17.5%)$84,655 ($17,935)$102,590 (15.0%)$353,208 ($62,133)$415,340Bar
Bleu Mediterranean Bar KioskC11C -$115,760 $115,760- -$534,135 $534,135-Bar
Belgium Beer Cafe KioskC14C -- -- (100.0%)- ($217,148)$217,148Bar
Chalice Beer Cafe KioskC14C (93.6%)$4,097 ($60,025)$64,122 176.4%$177,237 $113,115$64,122Bar
Tigin Irish PubD20D (2.9%)$239,467 ($7,278)$246,745 (7.2%)$992,705 ($76,520)$1,069,225Bar
ABACUS by Kent RathbunD22D -$40,086 $40,086- -$161,565 $161,565-Bar
Bleu Mediterranean Bar KioskD36D (100.0%)- ($2,801)$2,801 (100.0%)- ($181,197)$181,197Bar
Drew Pearsons Sports 88 GrillE05E -$80,170 $80,170- -$80,170 $80,170-Bar
Fly BarESE (100.0%)- ($66,485)$66,485 (95.2%)$13,379 ($263,162)$276,542Bar
12.7%$958,049 $107,711$850,338 5.9%$3,973,405 $220,535$3,752,870Bar Total

Data as of: 1/31/201812:00:00 AM
Performance Detail by Sub Category
LocationLocationGate
Terminal % ChgGrossReceipts
MTD
VarGrossReceiptsMTD PFY
% ChgGrossReceipts
FYTD
VarGrossReceiptsFYTD PY
Location SubCategory
Run: 4/4/2018 12:12:49 PMFYTD PY: Jan 17 vs. FYTD: Jan 18MTD PFY: Jan 17 vs. MTD: Jan 18
4 / 19
Ling & Louie'sA13A 0.1%$270,646 $378$270,268 2.6%$1,125,565 $28,927$1,096,637CasualDining/Bar
T.G.I. Friday'sA14A 1.5%$539,896 $7,916$531,980 (0.4%)$2,210,691 ($9,558)$2,220,249CasualDining/Bar
Pappadeaux Seafood KitchenA25A 1.2%$450,253 $5,156$445,097 10.8%$1,957,229 $191,457$1,765,773CasualDining/Bar
PappasitosA28A 6.7%$685,894 $42,804$643,090 16.7%$2,889,220 $412,931$2,476,288CasualDining/Bar
Lorena Garcia Tapas DallasA33A 37.6%$245,665 $67,176$178,489 66.6%$1,008,317 $403,184$605,133CasualDining/Bar
Blue Mesa Cafe KioskB01B (100.0%)- ($11,702)$11,702 (100.0%)- ($51,972)$51,972CasualDining/Bar
T.G.I. Friday'sB12B (13.5%)$525,725 ($82,140)$607,864 (17.7%)$1,987,674 ($426,264)$2,413,938CasualDining/Bar
HickoryB22B -$221,811 $221,811- -$904,586 $904,586-CasualDining/Bar
Cantina LaredoB34B (15.5%)$417,183 ($76,296)$493,479 (13.5%)$1,697,750 ($264,233)$1,961,983CasualDining/Bar
T.G.I. Friday'sC07C (6.5%)$391,036 ($27,160)$418,196 (3.5%)$1,733,806 ($62,697)$1,796,504CasualDining/Bar
Pappadeaux Seafood KitchenC14C -$540,939 $540,939- -$890,555 $890,555-CasualDining/Bar
Chili'sC15C (30.6%)$380,246 ($167,507)$547,754 (0.0%)$2,335,980 ($83)$2,336,063CasualDining/Bar
Blue Mesa KioskC19C -$25,264 $25,264- -$334,191 $334,191-CasualDining/Bar
PappasitosC19C -$256,791 $256,791- -$256,791 $256,791-CasualDining/Bar
T.G.I. Friday'sC30C (14.7%)$618,394 ($106,364)$724,758 (10.3%)$2,578,611 ($296,512)$2,875,123CasualDining/Bar
Chili'sC33C -$1,348 $1,348- -$1,348 $1,348-CasualDining/Bar
Applebee'sD10D -$169,926 $169,926- -$257,119 $257,119-CasualDining/Bar
Cafe Izmir Mediterranean GrillD10D (100.0%)- ($71,433)$71,433 (98.3%)$5,087 ($294,522)$299,610CasualDining/Bar

Data as of: 1/31/201812:00:00 AM
Performance Detail by Sub Category
LocationLocationGate
Terminal % ChgGrossReceipts
MTD
VarGrossReceiptsMTD PFY
% ChgGrossReceipts
FYTD
VarGrossReceiptsFYTD PY
Location SubCategory
Run: 4/4/2018 12:12:49 PMFYTD PY: Jan 17 vs. FYTD: Jan 18MTD PFY: Jan 17 vs. MTD: Jan 18
5 / 19
Rio MamboD12D -$96,919 $96,919- -$424,298 $424,298-CasualDining/Bar
Sky CanyonD14D (100.0%)- ($33,562)$33,562 (100.0%)- ($164,011)$164,011CasualDining/Bar
PizzaVinoD20D 14.1%$84,192 $10,425$73,767 10.1%$354,513 $32,509$322,005CasualDining/Bar
KRs Whitetail BistroD22D 3.9%$61,981 $2,310$59,671 (13.6%)$229,587 ($36,255)$265,842CasualDining/Bar
Cantina LaredoD24D (3.4%)$159,674 ($5,683)$165,357 (11.8%)$626,961 ($83,742)$710,703CasualDining/Bar
Cool RiverD25D 3.8%$196,839 $7,153$189,686 (2.8%)$777,885 ($22,723)$800,608CasualDining/Bar
CRU Wine BarD27D 20.8%$74,052 $12,750$61,302 11.1%$301,290 $30,121$271,169CasualDining/Bar
III ForksD27D (100.0%)- ($75,839)$75,839 (100.0%)- ($304,615)$304,615CasualDining/Bar
Gas Monkey Bar N GrillD31D (18.0%)$211,423 ($46,564)$257,988 (12.7%)$902,817 ($130,847)$1,033,663CasualDining/Bar
ReattaD33D 0.6%$118,952 $764$118,188 (4.1%)$477,511 ($20,510)$498,021CasualDining/Bar
Italian KitchenD34D (0.3%)$244,564 ($631)$245,195 (5.6%)$959,743 ($56,674)$1,016,417CasualDining/Bar
IHOPE09E -$185,217 $185,217- -$878,733 $878,733-CasualDining/Bar
T.G.I. Friday'sE17E (15.7%)$359,410 ($66,709)$426,119 (6.9%)$1,690,136 ($124,711)$1,814,847CasualDining/Bar
Blue Mesa Taco & Tequila BarE31E (19.3%)$200,708 ($47,885)$248,593 (17.1%)$985,345 ($203,562)$1,188,906CasualDining/Bar
12.1%$7,734,946 $835,568$6,899,377 8.8%$30,783,337 $2,493,256$28,290,080Casual Dining/Bar Total
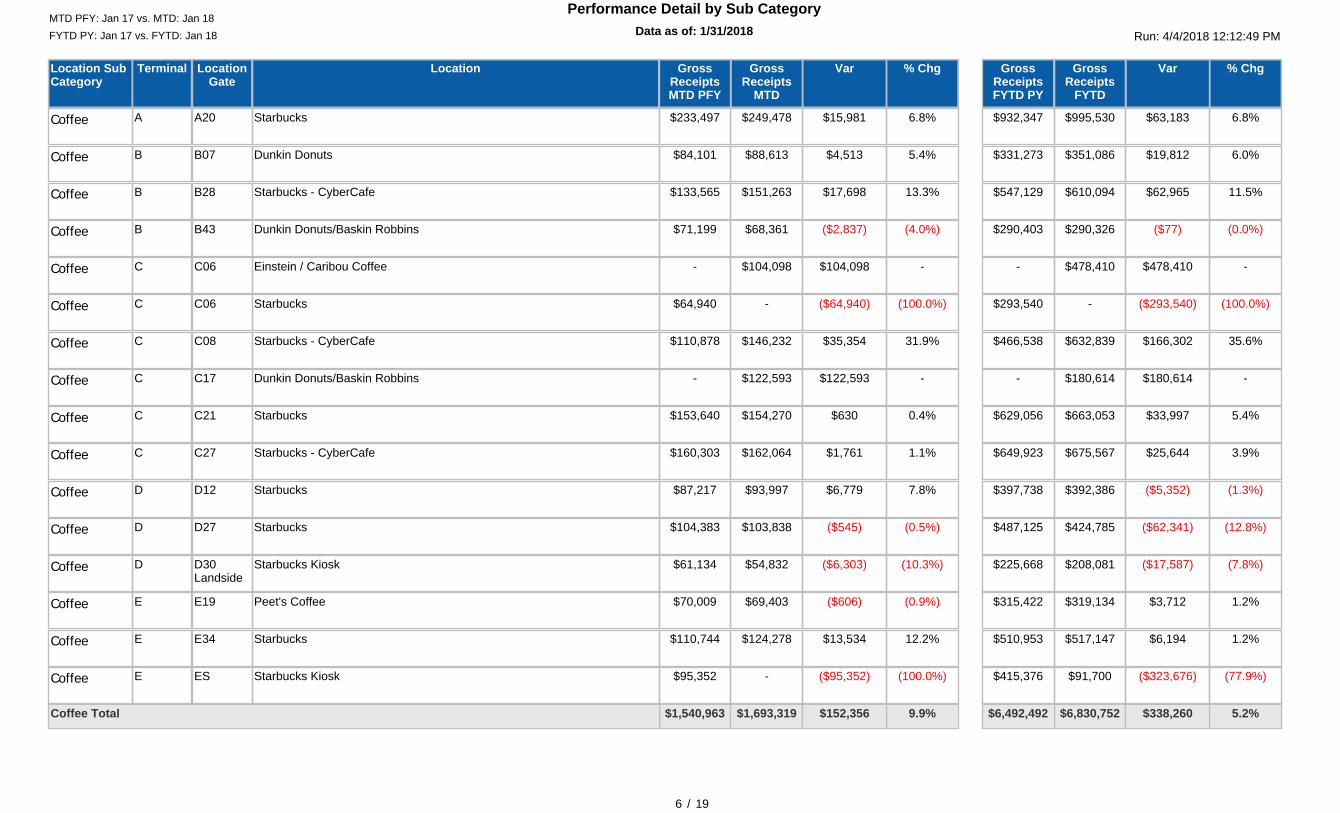
Data as of: 1/31/201812:00:00 AM
Performance Detail by Sub Category
LocationLocationGate
Terminal % ChgGrossReceipts
MTD
VarGrossReceiptsMTD PFY
% ChgGrossReceipts
FYTD
VarGrossReceiptsFYTD PY
Location SubCategory
Run: 4/4/2018 12:12:49 PMFYTD PY: Jan 17 vs. FYTD: Jan 18MTD PFY: Jan 17 vs. MTD: Jan 18
6 / 19
StarbucksA20A 6.8%$249,478 $15,981$233,497 6.8%$995,530 $63,183$932,347Coffee
Dunkin DonutsB07B 5.4%$88,613 $4,513$84,101 6.0%$351,086 $19,812$331,273Coffee
Starbucks - CyberCafeB28B 13.3%$151,263 $17,698$133,565 11.5%$610,094 $62,965$547,129Coffee
Dunkin Donuts/Baskin RobbinsB43B (4.0%)$68,361 ($2,837)$71,199 (0.0%)$290,326 ($77)$290,403Coffee
Einstein / Caribou CoffeeC06C -$104,098 $104,098- -$478,410 $478,410-Coffee
StarbucksC06C (100.0%)- ($64,940)$64,940 (100.0%)- ($293,540)$293,540Coffee
Starbucks - CyberCafeC08C 31.9%$146,232 $35,354$110,878 35.6%$632,839 $166,302$466,538Coffee
Dunkin Donuts/Baskin RobbinsC17C -$122,593 $122,593- -$180,614 $180,614-Coffee
StarbucksC21C 0.4%$154,270 $630$153,640 5.4%$663,053 $33,997$629,056Coffee
Starbucks - CyberCafeC27C 1.1%$162,064 $1,761$160,303 3.9%$675,567 $25,644$649,923Coffee
StarbucksD12D 7.8%$93,997 $6,779$87,217 (1.3%)$392,386 ($5,352)$397,738Coffee
StarbucksD27D (0.5%)$103,838 ($545)$104,383 (12.8%)$424,785 ($62,341)$487,125Coffee
Starbucks KioskD30Landside
D (10.3%)$54,832 ($6,303)$61,134 (7.8%)$208,081 ($17,587)$225,668Coffee
Peet's CoffeeE19E (0.9%)$69,403 ($606)$70,009 1.2%$319,134 $3,712$315,422Coffee
StarbucksE34E 12.2%$124,278 $13,534$110,744 1.2%$517,147 $6,194$510,953Coffee
Starbucks KioskESE (100.0%)- ($95,352)$95,352 (77.9%)$91,700 ($323,676)$415,376Coffee
9.9%$1,693,319 $152,356$1,540,963 5.2%$6,830,752 $338,260$6,492,492Coffee Total
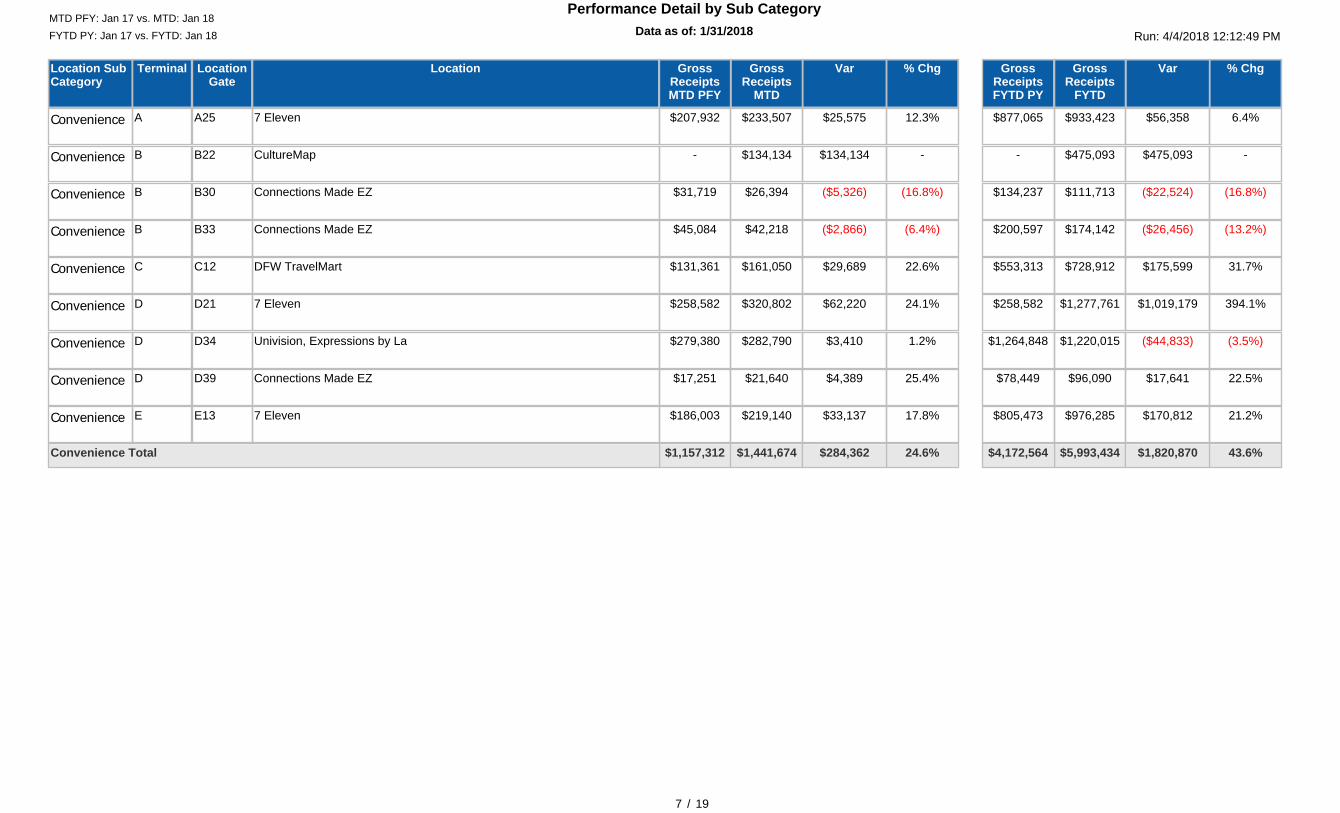
Data as of: 1/31/201812:00:00 AM
Performance Detail by Sub Category
LocationLocationGate
Terminal % ChgGrossReceipts
MTD
VarGrossReceiptsMTD PFY
% ChgGrossReceipts
FYTD
VarGrossReceiptsFYTD PY
Location SubCategory
Run: 4/4/2018 12:12:49 PMFYTD PY: Jan 17 vs. FYTD: Jan 18MTD PFY: Jan 17 vs. MTD: Jan 18
7 / 19
7 ElevenA25A 12.3%$233,507 $25,575$207,932 6.4%$933,423 $56,358$877,065Convenience
CultureMapB22B -$134,134 $134,134- -$475,093 $475,093-Convenience
Connections Made EZB30B (16.8%)$26,394 ($5,326)$31,719 (16.8%)$111,713 ($22,524)$134,237Convenience
Connections Made EZB33B (6.4%)$42,218 ($2,866)$45,084 (13.2%)$174,142 ($26,456)$200,597Convenience
DFW TravelMartC12C 22.6%$161,050 $29,689$131,361 31.7%$728,912 $175,599$553,313Convenience
7 ElevenD21D 24.1%$320,802 $62,220$258,582 394.1%$1,277,761 $1,019,179$258,582Convenience
Univision, Expressions by LaD34D 1.2%$282,790 $3,410$279,380 (3.5%)$1,220,015 ($44,833)$1,264,848Convenience
Connections Made EZD39D 25.4%$21,640 $4,389$17,251 22.5%$96,090 $17,641$78,449Convenience
7 ElevenE13E 17.8%$219,140 $33,137$186,003 21.2%$976,285 $170,812$805,473Convenience
24.6%$1,441,674 $284,362$1,157,312 43.6%$5,993,434 $1,820,870$4,172,564Convenience Total
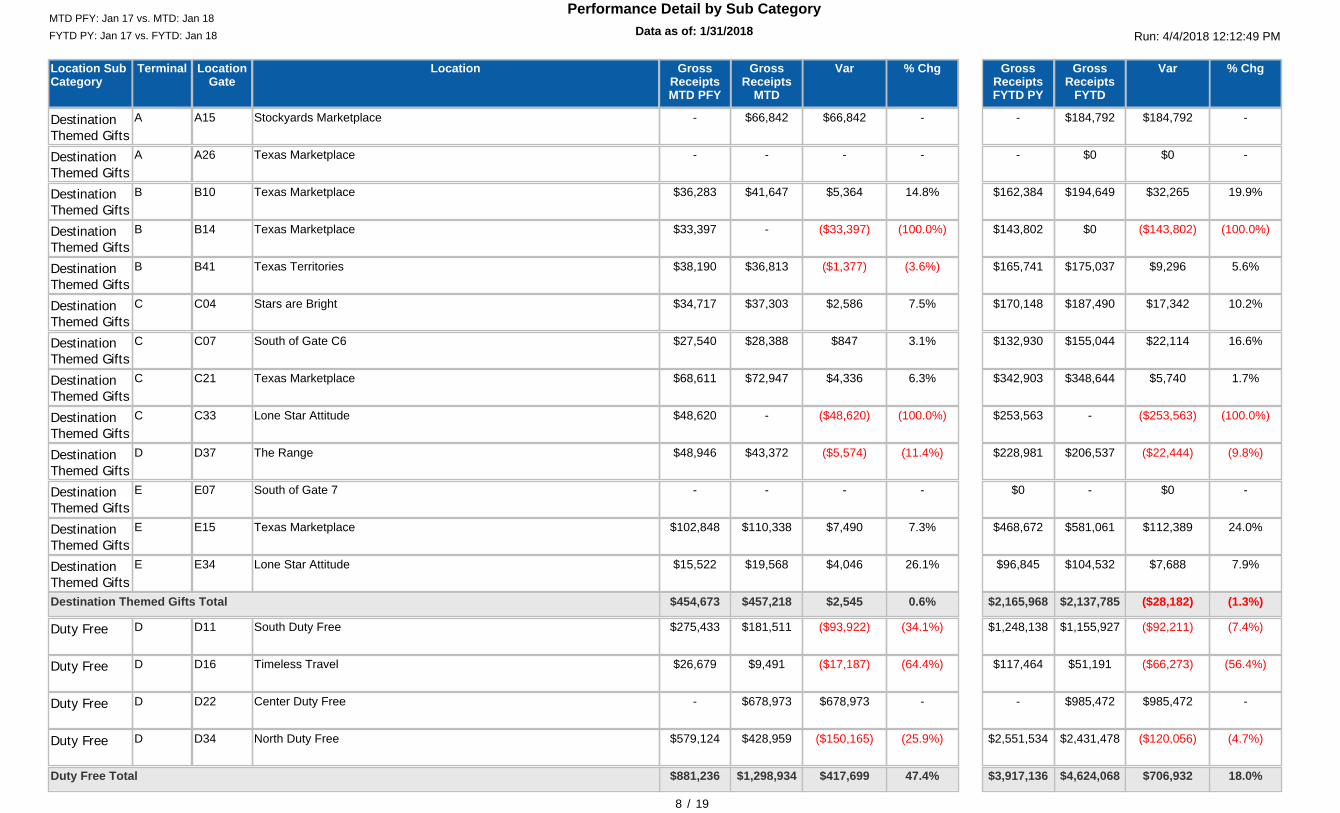
Data as of: 1/31/201812:00:00 AM
Performance Detail by Sub Category
LocationLocationGate
Terminal % ChgGrossReceipts
MTD
VarGrossReceiptsMTD PFY
% ChgGrossReceipts
FYTD
VarGrossReceiptsFYTD PY
Location SubCategory
Run: 4/4/2018 12:12:49 PMFYTD PY: Jan 17 vs. FYTD: Jan 18MTD PFY: Jan 17 vs. MTD: Jan 18
8 / 19
Stockyards MarketplaceA15A -$66,842 $66,842- -$184,792 $184,792-DestinationThemed Gifts
Texas MarketplaceA26A -- -- -$0 $0-DestinationThemed Gifts
Texas MarketplaceB10B 14.8%$41,647 $5,364$36,283 19.9%$194,649 $32,265$162,384DestinationThemed Gifts
Texas MarketplaceB14B (100.0%)- ($33,397)$33,397 (100.0%)$0 ($143,802)$143,802DestinationThemed Gifts
Texas TerritoriesB41B (3.6%)$36,813 ($1,377)$38,190 5.6%$175,037 $9,296$165,741DestinationThemed Gifts
Stars are BrightC04C 7.5%$37,303 $2,586$34,717 10.2%$187,490 $17,342$170,148DestinationThemed Gifts
South of Gate C6C07C 3.1%$28,388 $847$27,540 16.6%$155,044 $22,114$132,930DestinationThemed Gifts
Texas MarketplaceC21C 6.3%$72,947 $4,336$68,611 1.7%$348,644 $5,740$342,903DestinationThemed Gifts
Lone Star AttitudeC33C (100.0%)- ($48,620)$48,620 (100.0%)- ($253,563)$253,563DestinationThemed Gifts
The RangeD37D (11.4%)$43,372 ($5,574)$48,946 (9.8%)$206,537 ($22,444)$228,981DestinationThemed Gifts
South of Gate 7E07E -- -- -- $0$0DestinationThemed Gifts
Texas MarketplaceE15E 7.3%$110,338 $7,490$102,848 24.0%$581,061 $112,389$468,672DestinationThemed Gifts
Lone Star AttitudeE34E 26.1%$19,568 $4,046$15,522 7.9%$104,532 $7,688$96,845DestinationThemed Gifts
0.6%$457,218 $2,545$454,673 (1.3%)$2,137,785 ($28,182)$2,165,968Destination Themed Gifts Total
South Duty FreeD11D (34.1%)$181,511 ($93,922)$275,433 (7.4%)$1,155,927 ($92,211)$1,248,138Duty Free
Timeless TravelD16D (64.4%)$9,491 ($17,187)$26,679 (56.4%)$51,191 ($66,273)$117,464Duty Free
Center Duty FreeD22D -$678,973 $678,973- -$985,472 $985,472-Duty Free
North Duty FreeD34D (25.9%)$428,959 ($150,165)$579,124 (4.7%)$2,431,478 ($120,056)$2,551,534Duty Free
47.4%$1,298,934 $417,699$881,236 18.0%$4,624,068 $706,932$3,917,136Duty Free Total
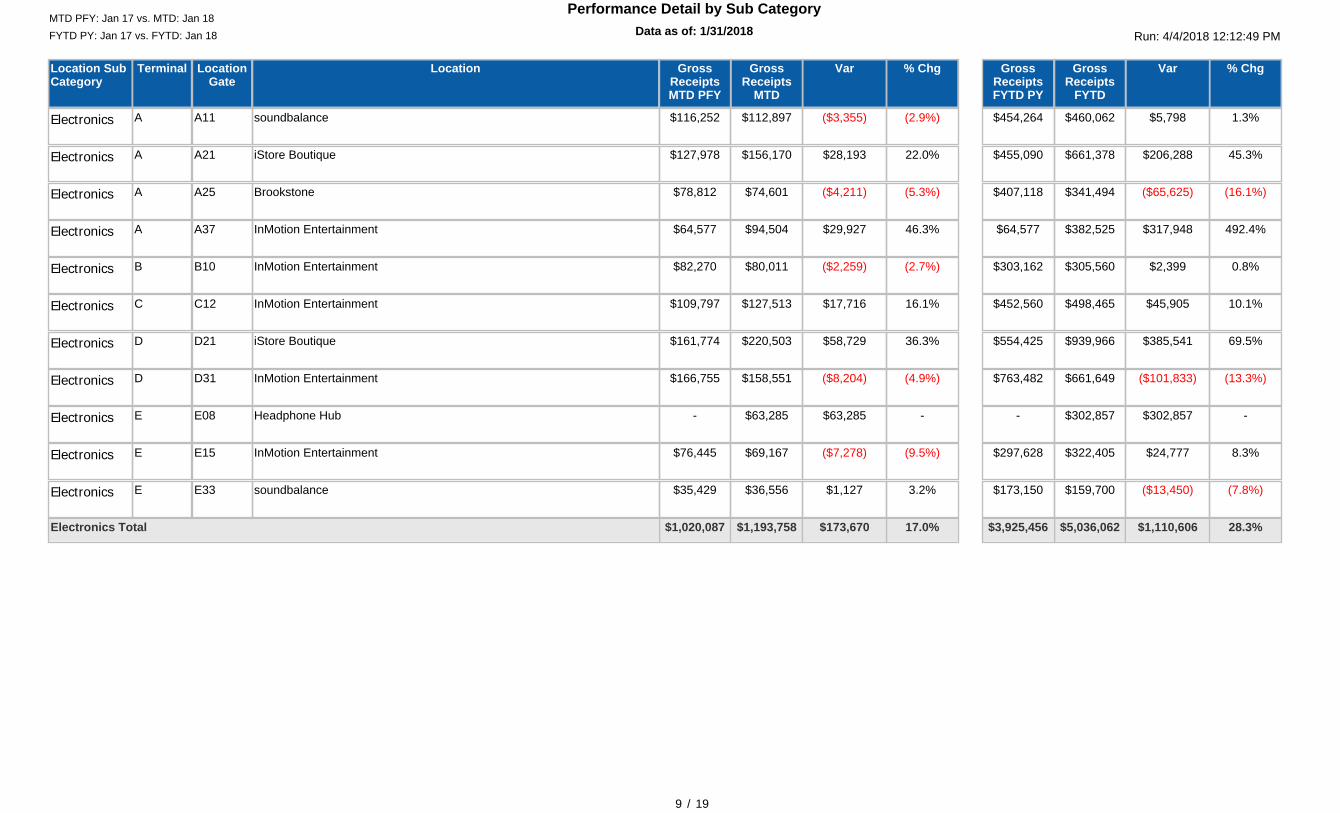
Data as of: 1/31/201812:00:00 AM
Performance Detail by Sub Category
LocationLocationGate
Terminal % ChgGrossReceipts
MTD
VarGrossReceiptsMTD PFY
% ChgGrossReceipts
FYTD
VarGrossReceiptsFYTD PY
Location SubCategory
Run: 4/4/2018 12:12:49 PMFYTD PY: Jan 17 vs. FYTD: Jan 18MTD PFY: Jan 17 vs. MTD: Jan 18
9 / 19
soundbalanceA11A (2.9%)$112,897 ($3,355)$116,252 1.3%$460,062 $5,798$454,264Electronics
iStore BoutiqueA21A 22.0%$156,170 $28,193$127,978 45.3%$661,378 $206,288$455,090Electronics
BrookstoneA25A (5.3%)$74,601 ($4,211)$78,812 (16.1%)$341,494 ($65,625)$407,118Electronics
InMotion EntertainmentA37A 46.3%$94,504 $29,927$64,577 492.4%$382,525 $317,948$64,577Electronics
InMotion EntertainmentB10B (2.7%)$80,011 ($2,259)$82,270 0.8%$305,560 $2,399$303,162Electronics
InMotion EntertainmentC12C 16.1%$127,513 $17,716$109,797 10.1%$498,465 $45,905$452,560Electronics
iStore BoutiqueD21D 36.3%$220,503 $58,729$161,774 69.5%$939,966 $385,541$554,425Electronics
InMotion EntertainmentD31D (4.9%)$158,551 ($8,204)$166,755 (13.3%)$661,649 ($101,833)$763,482Electronics
Headphone HubE08E -$63,285 $63,285- -$302,857 $302,857-Electronics
InMotion EntertainmentE15E (9.5%)$69,167 ($7,278)$76,445 8.3%$322,405 $24,777$297,628Electronics
soundbalanceE33E 3.2%$36,556 $1,127$35,429 (7.8%)$159,700 ($13,450)$173,150Electronics
17.0%$1,193,758 $173,670$1,020,087 28.3%$5,036,062 $1,110,606$3,925,456Electronics Total
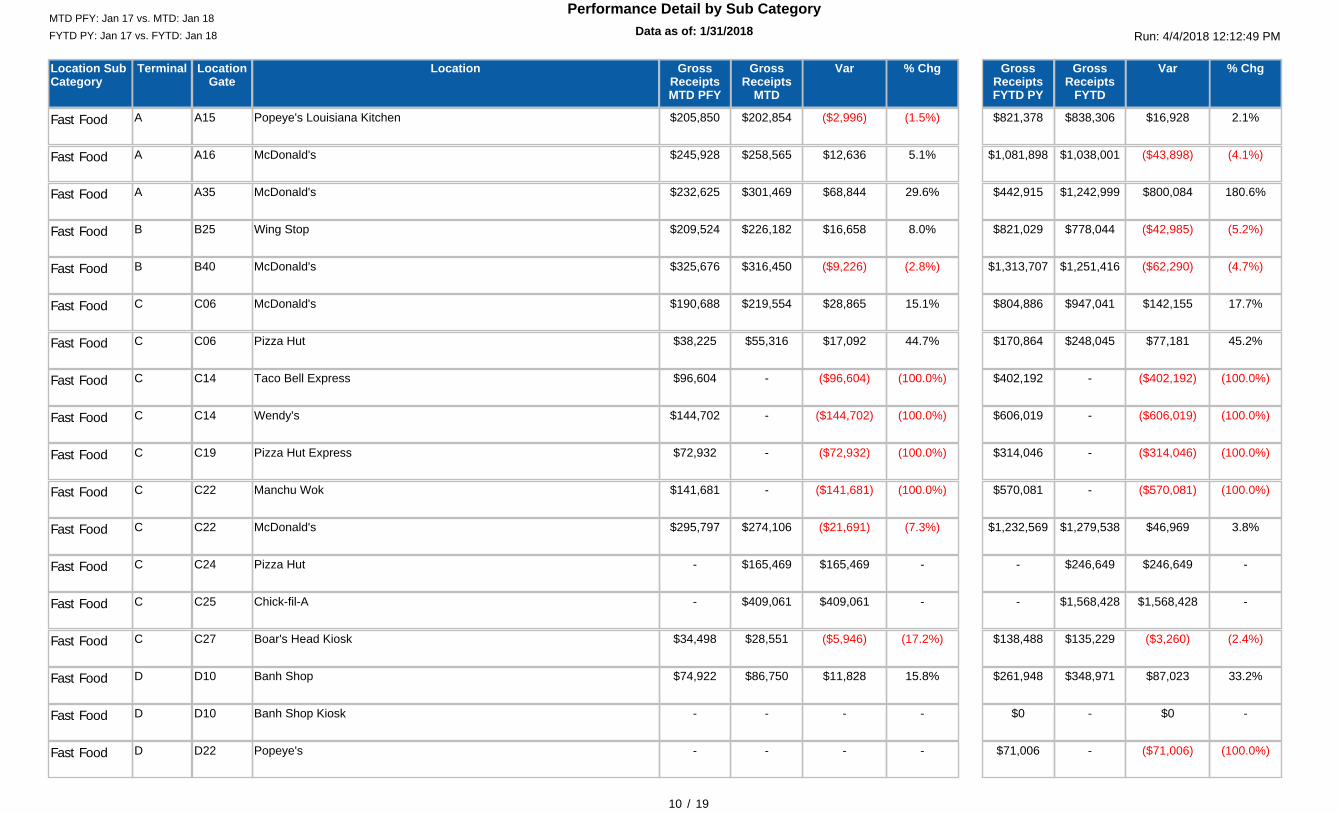
Data as of: 1/31/201812:00:00 AM
Performance Detail by Sub Category
LocationLocationGate
Terminal % ChgGrossReceipts
MTD
VarGrossReceiptsMTD PFY
% ChgGrossReceipts
FYTD
VarGrossReceiptsFYTD PY
Location SubCategory
Run: 4/4/2018 12:12:49 PMFYTD PY: Jan 17 vs. FYTD: Jan 18MTD PFY: Jan 17 vs. MTD: Jan 18
10 / 19
Popeye's Louisiana KitchenA15A (1.5%)$202,854 ($2,996)$205,850 2.1%$838,306 $16,928$821,378Fast Food
McDonald'sA16A 5.1%$258,565 $12,636$245,928 (4.1%)$1,038,001 ($43,898)$1,081,898Fast Food
McDonald'sA35A 29.6%$301,469 $68,844$232,625 180.6%$1,242,999 $800,084$442,915Fast Food
Wing StopB25B 8.0%$226,182 $16,658$209,524 (5.2%)$778,044 ($42,985)$821,029Fast Food
McDonald'sB40B (2.8%)$316,450 ($9,226)$325,676 (4.7%)$1,251,416 ($62,290)$1,313,707Fast Food
McDonald'sC06C 15.1%$219,554 $28,865$190,688 17.7%$947,041 $142,155$804,886Fast Food
Pizza HutC06C 44.7%$55,316 $17,092$38,225 45.2%$248,045 $77,181$170,864Fast Food
Taco Bell ExpressC14C (100.0%)- ($96,604)$96,604 (100.0%)- ($402,192)$402,192Fast Food
Wendy'sC14C (100.0%)- ($144,702)$144,702 (100.0%)- ($606,019)$606,019Fast Food
Pizza Hut ExpressC19C (100.0%)- ($72,932)$72,932 (100.0%)- ($314,046)$314,046Fast Food
Manchu WokC22C (100.0%)- ($141,681)$141,681 (100.0%)- ($570,081)$570,081Fast Food
McDonald'sC22C (7.3%)$274,106 ($21,691)$295,797 3.8%$1,279,538 $46,969$1,232,569Fast Food
Pizza HutC24C -$165,469 $165,469- -$246,649 $246,649-Fast Food
Chick-fil-AC25C -$409,061 $409,061- -$1,568,428 $1,568,428-Fast Food
Boar's Head KioskC27C (17.2%)$28,551 ($5,946)$34,498 (2.4%)$135,229 ($3,260)$138,488Fast Food
Banh ShopD10D 15.8%$86,750 $11,828$74,922 33.2%$348,971 $87,023$261,948Fast Food
Banh Shop KioskD10D -- -- -- $0$0Fast Food
Popeye'sD22D -- -- (100.0%)- ($71,006)$71,006Fast Food

Data as of: 1/31/201812:00:00 AM
Performance Detail by Sub Category
LocationLocationGate
Terminal % ChgGrossReceipts
MTD
VarGrossReceiptsMTD PFY
% ChgGrossReceipts
FYTD
VarGrossReceiptsFYTD PY
Location SubCategory
Run: 4/4/2018 12:12:49 PMFYTD PY: Jan 17 vs. FYTD: Jan 18MTD PFY: Jan 17 vs. MTD: Jan 18
11 / 19
McDonald'sD33D -- -- -- $0$0Fast Food
McDonald'sD34D 10.9%$387,566 $37,945$349,620 3.2%$1,540,661 $48,185$1,492,476Fast Food
Burger KingE05E -- -- -- $0$0Fast Food
Chick-fil-AE05E -$173,047 $173,047- -$723,781 $723,781-Fast Food
Pizza PubE05E -- $0$0 -- $0$0Fast Food
Wendy'sE33E (6.7%)$181,119 ($12,920)$194,039 (10.0%)$804,463 ($89,088)$893,551Fast Food
Boar's Head KioskESE (63.0%)$11,599 ($19,717)$31,316 (84.0%)$19,988 ($105,165)$125,153Fast Food
Pizza HutESE (100.0%)- ($108,208)$108,208 (100.0%)$0 ($458,118)$458,118Fast Food
10.2%$3,297,657 $304,821$2,992,836 8.2%$13,011,559 $989,236$12,022,323Fast Food Total
L'OccitaneA19A 12.0%$68,257 $7,291$60,966 8.7%$331,416 $26,583$304,834Health/Beauty
Kiehl'sA33A 13.3%$80,514 $9,425$71,090 22.9%$314,074 $58,546$255,528Health/Beauty
Jo Malone, Aveda, MACD20D (9.2%)$63,886 ($6,474)$70,360 (6.4%)$320,701 ($22,049)$342,750Health/Beauty
Jo Malone, Aveda, MACD24D 5.0%$122,404 $5,814$116,591 (2.6%)$543,852 ($14,750)$558,602Health/Beauty
L'OccitaneD33D (4.7%)$61,171 ($3,026)$64,197 (10.9%)$289,992 ($35,599)$325,591Health/Beauty
3.4%$396,232 $13,029$383,203 0.7%$1,800,035 $12,731$1,787,304Health/Beauty Total
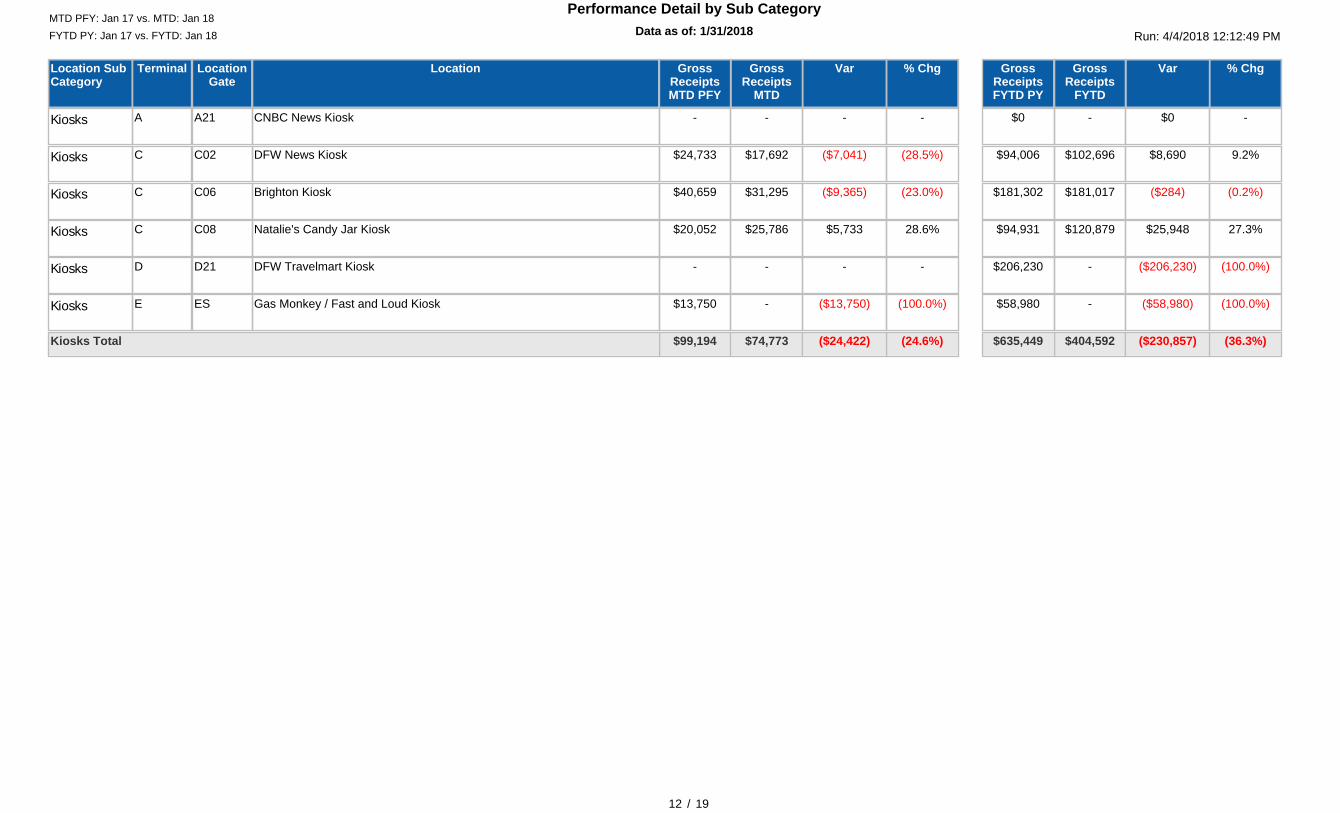
Data as of: 1/31/201812:00:00 AM
Performance Detail by Sub Category
LocationLocationGate
Terminal % ChgGrossReceipts
MTD
VarGrossReceiptsMTD PFY
% ChgGrossReceipts
FYTD
VarGrossReceiptsFYTD PY
Location SubCategory
Run: 4/4/2018 12:12:49 PMFYTD PY: Jan 17 vs. FYTD: Jan 18MTD PFY: Jan 17 vs. MTD: Jan 18
12 / 19
CNBC News KioskA21A -- -- -- $0$0Kiosks
DFW News KioskC02C (28.5%)$17,692 ($7,041)$24,733 9.2%$102,696 $8,690$94,006Kiosks
Brighton KioskC06C (23.0%)$31,295 ($9,365)$40,659 (0.2%)$181,017 ($284)$181,302Kiosks
Natalie's Candy Jar KioskC08C 28.6%$25,786 $5,733$20,052 27.3%$120,879 $25,948$94,931Kiosks
DFW Travelmart KioskD21D -- -- (100.0%)- ($206,230)$206,230Kiosks
Gas Monkey / Fast and Loud KioskESE (100.0%)- ($13,750)$13,750 (100.0%)- ($58,980)$58,980Kiosks
(24.6%)$74,773 ($24,422)$99,194 (36.3%)$404,592 ($230,857)$635,449Kiosks Total
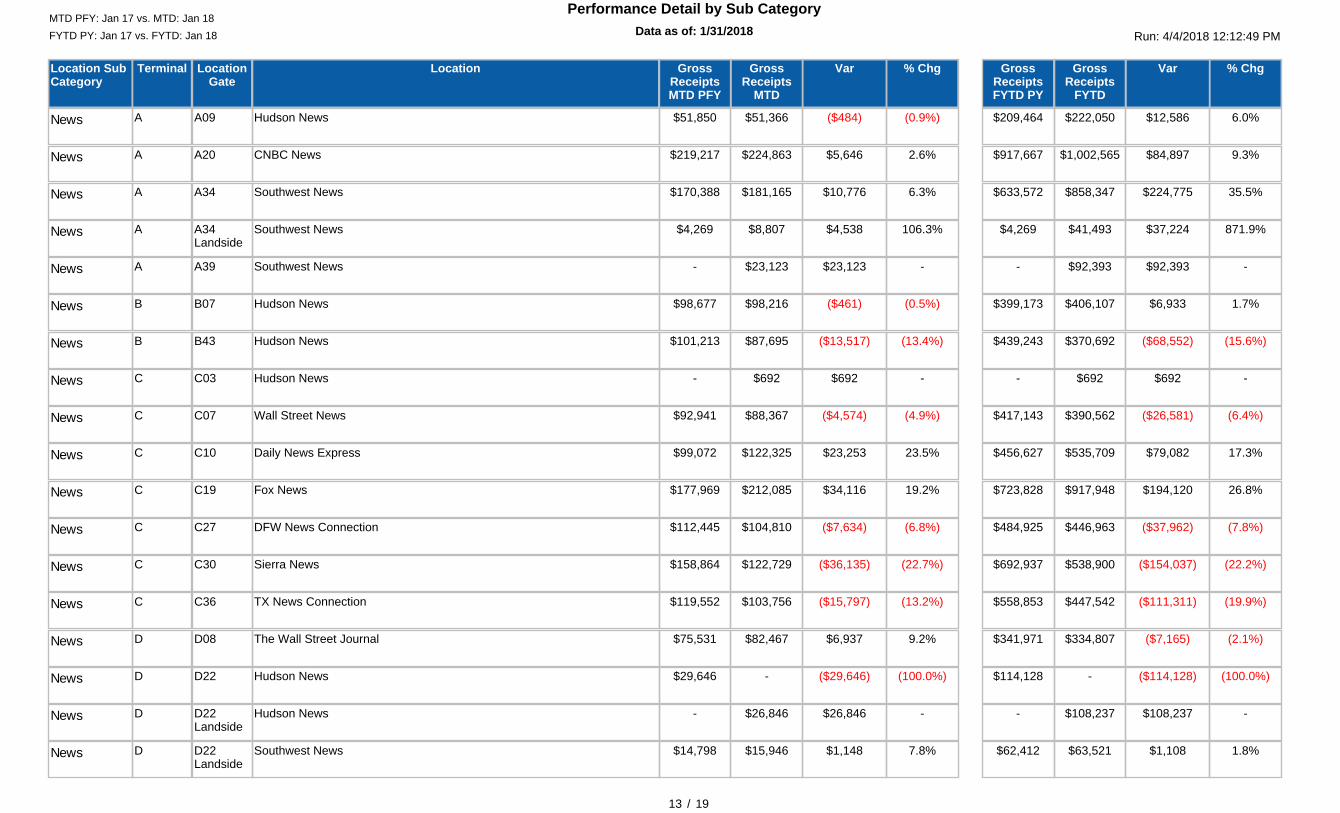
Data as of: 1/31/201812:00:00 AM
Performance Detail by Sub Category
LocationLocationGate
Terminal % ChgGrossReceipts
MTD
VarGrossReceiptsMTD PFY
% ChgGrossReceipts
FYTD
VarGrossReceiptsFYTD PY
Location SubCategory
Run: 4/4/2018 12:12:49 PMFYTD PY: Jan 17 vs. FYTD: Jan 18MTD PFY: Jan 17 vs. MTD: Jan 18
13 / 19
Hudson NewsA09A (0.9%)$51,366 ($484)$51,850 6.0%$222,050 $12,586$209,464News
CNBC NewsA20A 2.6%$224,863 $5,646$219,217 9.3%$1,002,565 $84,897$917,667News
Southwest NewsA34A 6.3%$181,165 $10,776$170,388 35.5%$858,347 $224,775$633,572News
Southwest NewsA34Landside
A 106.3%$8,807 $4,538$4,269 871.9%$41,493 $37,224$4,269News
Southwest NewsA39A -$23,123 $23,123- -$92,393 $92,393-News
Hudson NewsB07B (0.5%)$98,216 ($461)$98,677 1.7%$406,107 $6,933$399,173News
Hudson NewsB43B (13.4%)$87,695 ($13,517)$101,213 (15.6%)$370,692 ($68,552)$439,243News
Hudson NewsC03C -$692 $692- -$692 $692-News
Wall Street NewsC07C (4.9%)$88,367 ($4,574)$92,941 (6.4%)$390,562 ($26,581)$417,143News
Daily News ExpressC10C 23.5%$122,325 $23,253$99,072 17.3%$535,709 $79,082$456,627News
Fox NewsC19C 19.2%$212,085 $34,116$177,969 26.8%$917,948 $194,120$723,828News
DFW News ConnectionC27C (6.8%)$104,810 ($7,634)$112,445 (7.8%)$446,963 ($37,962)$484,925News
Sierra NewsC30C (22.7%)$122,729 ($36,135)$158,864 (22.2%)$538,900 ($154,037)$692,937News
TX News ConnectionC36C (13.2%)$103,756 ($15,797)$119,552 (19.9%)$447,542 ($111,311)$558,853News
The Wall Street JournalD08D 9.2%$82,467 $6,937$75,531 (2.1%)$334,807 ($7,165)$341,971News
Hudson NewsD22D (100.0%)- ($29,646)$29,646 (100.0%)- ($114,128)$114,128News
Hudson NewsD22Landside
D -$26,846 $26,846- -$108,237 $108,237-News
Southwest NewsD22Landside
D 7.8%$15,946 $1,148$14,798 1.8%$63,521 $1,108$62,412News
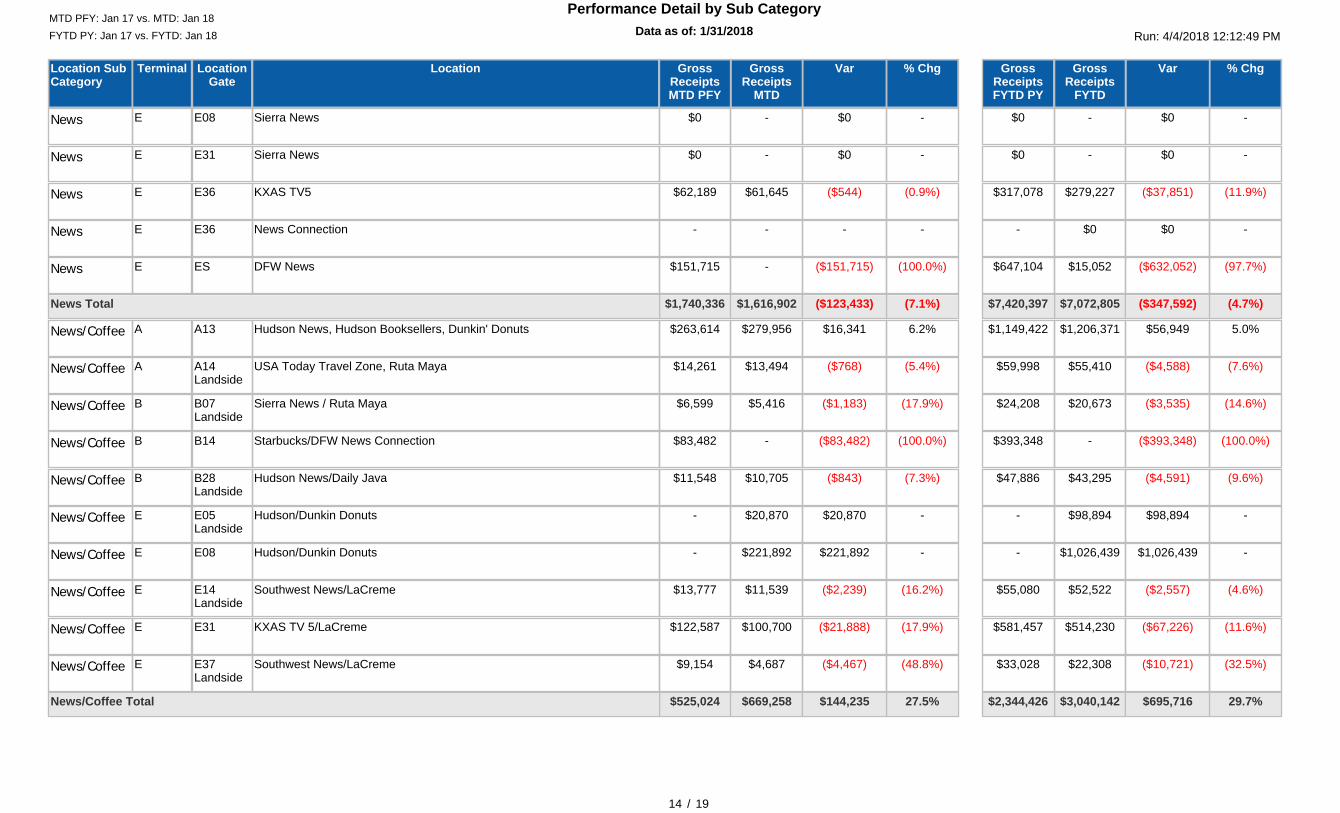
Data as of: 1/31/201812:00:00 AM
Performance Detail by Sub Category
LocationLocationGate
Terminal % ChgGrossReceipts
MTD
VarGrossReceiptsMTD PFY
% ChgGrossReceipts
FYTD
VarGrossReceiptsFYTD PY
Location SubCategory
Run: 4/4/2018 12:12:49 PMFYTD PY: Jan 17 vs. FYTD: Jan 18MTD PFY: Jan 17 vs. MTD: Jan 18
14 / 19
Sierra NewsE08E -- $0$0 -- $0$0News
Sierra NewsE31E -- $0$0 -- $0$0News
KXAS TV5E36E (0.9%)$61,645 ($544)$62,189 (11.9%)$279,227 ($37,851)$317,078News
News ConnectionE36E -- -- -$0 $0-News
DFW NewsESE (100.0%)- ($151,715)$151,715 (97.7%)$15,052 ($632,052)$647,104News
(7.1%)$1,616,902 ($123,433)$1,740,336 (4.7%)$7,072,805 ($347,592)$7,420,397News Total
Hudson News, Hudson Booksellers, Dunkin' DonutsA13A 6.2%$279,956 $16,341$263,614 5.0%$1,206,371 $56,949$1,149,422News/Coffee
USA Today Travel Zone, Ruta MayaA14Landside
A (5.4%)$13,494 ($768)$14,261 (7.6%)$55,410 ($4,588)$59,998News/Coffee
Sierra News / Ruta MayaB07Landside
B (17.9%)$5,416 ($1,183)$6,599 (14.6%)$20,673 ($3,535)$24,208News/Coffee
Starbucks/DFW News ConnectionB14B (100.0%)- ($83,482)$83,482 (100.0%)- ($393,348)$393,348News/Coffee
Hudson News/Daily JavaB28Landside
B (7.3%)$10,705 ($843)$11,548 (9.6%)$43,295 ($4,591)$47,886News/Coffee
Hudson/Dunkin DonutsE05Landside
E -$20,870 $20,870- -$98,894 $98,894-News/Coffee
Hudson/Dunkin DonutsE08E -$221,892 $221,892- -$1,026,439 $1,026,439-News/Coffee
Southwest News/LaCremeE14Landside
E (16.2%)$11,539 ($2,239)$13,777 (4.6%)$52,522 ($2,557)$55,080News/Coffee
KXAS TV 5/LaCremeE31E (17.9%)$100,700 ($21,888)$122,587 (11.6%)$514,230 ($67,226)$581,457News/Coffee
Southwest News/LaCremeE37Landside
E (48.8%)$4,687 ($4,467)$9,154 (32.5%)$22,308 ($10,721)$33,028News/Coffee
27.5%$669,258 $144,235$525,024 29.7%$3,040,142 $695,716$2,344,426News/Coffee Total
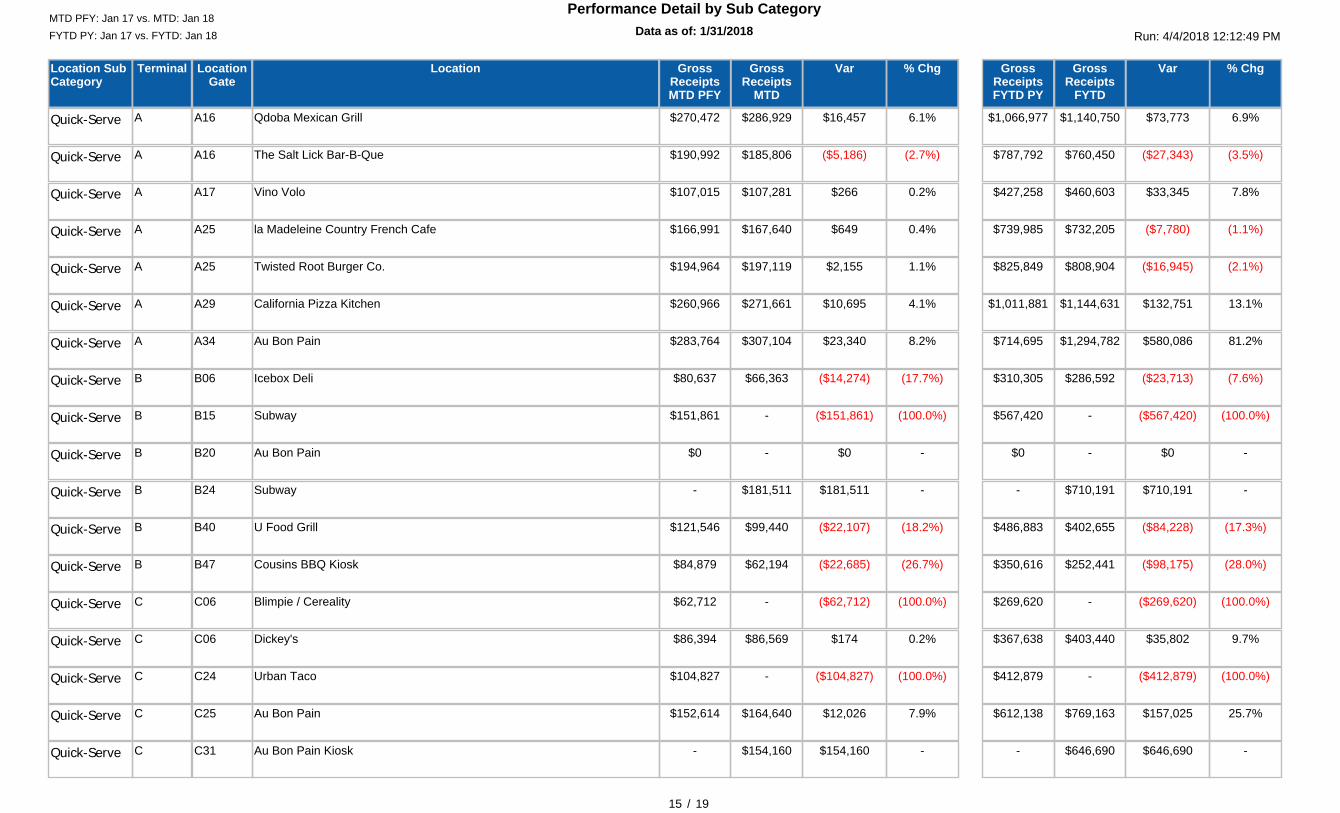
Data as of: 1/31/201812:00:00 AM
Performance Detail by Sub Category
LocationLocationGate
Terminal % ChgGrossReceipts
MTD
VarGrossReceiptsMTD PFY
% ChgGrossReceipts
FYTD
VarGrossReceiptsFYTD PY
Location SubCategory
Run: 4/4/2018 12:12:49 PMFYTD PY: Jan 17 vs. FYTD: Jan 18MTD PFY: Jan 17 vs. MTD: Jan 18
15 / 19
Qdoba Mexican GrillA16A 6.1%$286,929 $16,457$270,472 6.9%$1,140,750 $73,773$1,066,977Quick-Serve
The Salt Lick Bar-B-QueA16A (2.7%)$185,806 ($5,186)$190,992 (3.5%)$760,450 ($27,343)$787,792Quick-Serve
Vino VoloA17A 0.2%$107,281 $266$107,015 7.8%$460,603 $33,345$427,258Quick-Serve
la Madeleine Country French CafeA25A 0.4%$167,640 $649$166,991 (1.1%)$732,205 ($7,780)$739,985Quick-Serve
Twisted Root Burger Co.A25A 1.1%$197,119 $2,155$194,964 (2.1%)$808,904 ($16,945)$825,849Quick-Serve
California Pizza KitchenA29A 4.1%$271,661 $10,695$260,966 13.1%$1,144,631 $132,751$1,011,881Quick-Serve
Au Bon PainA34A 8.2%$307,104 $23,340$283,764 81.2%$1,294,782 $580,086$714,695Quick-Serve
Icebox DeliB06B (17.7%)$66,363 ($14,274)$80,637 (7.6%)$286,592 ($23,713)$310,305Quick-Serve
SubwayB15B (100.0%)- ($151,861)$151,861 (100.0%)- ($567,420)$567,420Quick-Serve
Au Bon PainB20B -- $0$0 -- $0$0Quick-Serve
SubwayB24B -$181,511 $181,511- -$710,191 $710,191-Quick-Serve
U Food GrillB40B (18.2%)$99,440 ($22,107)$121,546 (17.3%)$402,655 ($84,228)$486,883Quick-Serve
Cousins BBQ KioskB47B (26.7%)$62,194 ($22,685)$84,879 (28.0%)$252,441 ($98,175)$350,616Quick-Serve
Blimpie / CerealityC06C (100.0%)- ($62,712)$62,712 (100.0%)- ($269,620)$269,620Quick-Serve
Dickey'sC06C 0.2%$86,569 $174$86,394 9.7%$403,440 $35,802$367,638Quick-Serve
Urban TacoC24C (100.0%)- ($104,827)$104,827 (100.0%)- ($412,879)$412,879Quick-Serve
Au Bon PainC25C 7.9%$164,640 $12,026$152,614 25.7%$769,163 $157,025$612,138Quick-Serve
Au Bon Pain KioskC31C -$154,160 $154,160- -$646,690 $646,690-Quick-Serve
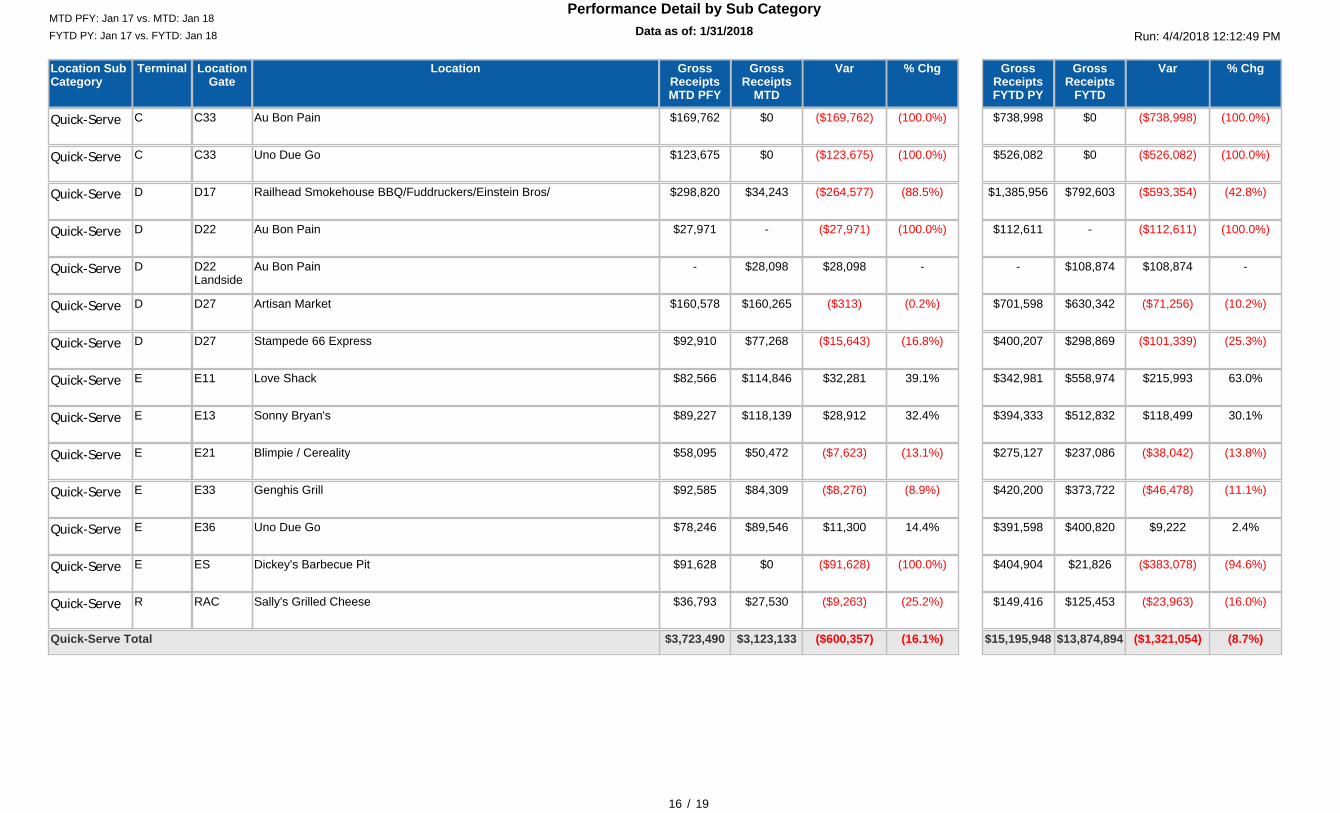
Data as of: 1/31/201812:00:00 AM
Performance Detail by Sub Category
LocationLocationGate
Terminal % ChgGrossReceipts
MTD
VarGrossReceiptsMTD PFY
% ChgGrossReceipts
FYTD
VarGrossReceiptsFYTD PY
Location SubCategory
Run: 4/4/2018 12:12:49 PMFYTD PY: Jan 17 vs. FYTD: Jan 18MTD PFY: Jan 17 vs. MTD: Jan 18
16 / 19
Au Bon PainC33C (100.0%)$0 ($169,762)$169,762 (100.0%)$0 ($738,998)$738,998Quick-Serve
Uno Due GoC33C (100.0%)$0 ($123,675)$123,675 (100.0%)$0 ($526,082)$526,082Quick-Serve
Railhead Smokehouse BBQ/Fuddruckers/Einstein Bros/D17D (88.5%)$34,243 ($264,577)$298,820 (42.8%)$792,603 ($593,354)$1,385,956Quick-Serve
Au Bon PainD22D (100.0%)- ($27,971)$27,971 (100.0%)- ($112,611)$112,611Quick-Serve
Au Bon PainD22Landside
D -$28,098 $28,098- -$108,874 $108,874-Quick-Serve
Artisan MarketD27D (0.2%)$160,265 ($313)$160,578 (10.2%)$630,342 ($71,256)$701,598Quick-Serve
Stampede 66 ExpressD27D (16.8%)$77,268 ($15,643)$92,910 (25.3%)$298,869 ($101,339)$400,207Quick-Serve
Love ShackE11E 39.1%$114,846 $32,281$82,566 63.0%$558,974 $215,993$342,981Quick-Serve
Sonny Bryan'sE13E 32.4%$118,139 $28,912$89,227 30.1%$512,832 $118,499$394,333Quick-Serve
Blimpie / CerealityE21E (13.1%)$50,472 ($7,623)$58,095 (13.8%)$237,086 ($38,042)$275,127Quick-Serve
Genghis GrillE33E (8.9%)$84,309 ($8,276)$92,585 (11.1%)$373,722 ($46,478)$420,200Quick-Serve
Uno Due GoE36E 14.4%$89,546 $11,300$78,246 2.4%$400,820 $9,222$391,598Quick-Serve
Dickey's Barbecue PitESE (100.0%)$0 ($91,628)$91,628 (94.6%)$21,826 ($383,078)$404,904Quick-Serve
Sally's Grilled CheeseRACR (25.2%)$27,530 ($9,263)$36,793 (16.0%)$125,453 ($23,963)$149,416Quick-Serve
(16.1%)$3,123,133 ($600,357)$3,723,490 (8.7%)$13,874,894 ($1,321,054)$15,195,948Quick-Serve Total
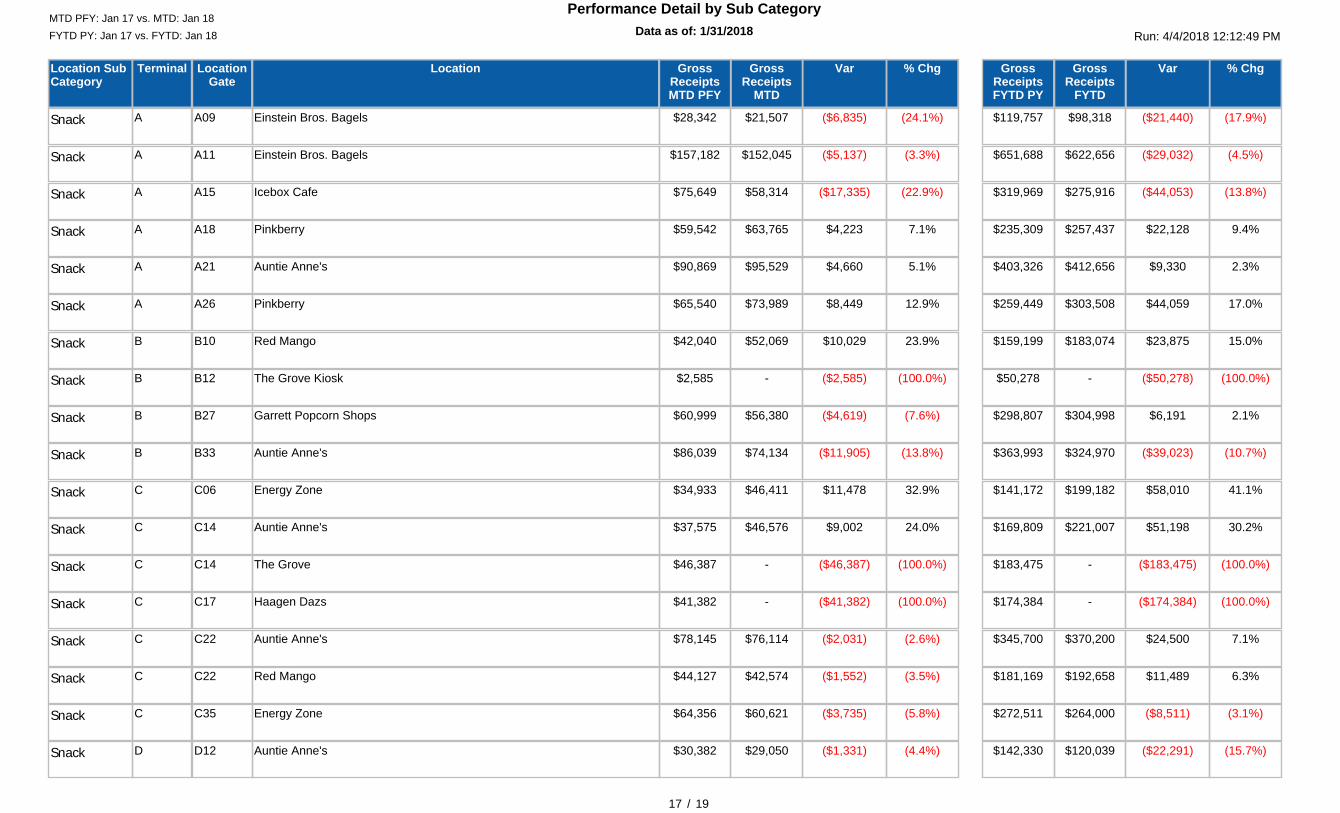
Data as of: 1/31/201812:00:00 AM
Performance Detail by Sub Category
LocationLocationGate
Terminal % ChgGrossReceipts
MTD
VarGrossReceiptsMTD PFY
% ChgGrossReceipts
FYTD
VarGrossReceiptsFYTD PY
Location SubCategory
Run: 4/4/2018 12:12:49 PMFYTD PY: Jan 17 vs. FYTD: Jan 18MTD PFY: Jan 17 vs. MTD: Jan 18
17 / 19
Einstein Bros. BagelsA09A (24.1%)$21,507 ($6,835)$28,342 (17.9%)$98,318 ($21,440)$119,757Snack
Einstein Bros. BagelsA11A (3.3%)$152,045 ($5,137)$157,182 (4.5%)$622,656 ($29,032)$651,688Snack
Icebox CafeA15A (22.9%)$58,314 ($17,335)$75,649 (13.8%)$275,916 ($44,053)$319,969Snack
PinkberryA18A 7.1%$63,765 $4,223$59,542 9.4%$257,437 $22,128$235,309Snack
Auntie Anne'sA21A 5.1%$95,529 $4,660$90,869 2.3%$412,656 $9,330$403,326Snack
PinkberryA26A 12.9%$73,989 $8,449$65,540 17.0%$303,508 $44,059$259,449Snack
Red MangoB10B 23.9%$52,069 $10,029$42,040 15.0%$183,074 $23,875$159,199Snack
The Grove KioskB12B (100.0%)- ($2,585)$2,585 (100.0%)- ($50,278)$50,278Snack
Garrett Popcorn ShopsB27B (7.6%)$56,380 ($4,619)$60,999 2.1%$304,998 $6,191$298,807Snack
Auntie Anne'sB33B (13.8%)$74,134 ($11,905)$86,039 (10.7%)$324,970 ($39,023)$363,993Snack
Energy ZoneC06C 32.9%$46,411 $11,478$34,933 41.1%$199,182 $58,010$141,172Snack
Auntie Anne'sC14C 24.0%$46,576 $9,002$37,575 30.2%$221,007 $51,198$169,809Snack
The GroveC14C (100.0%)- ($46,387)$46,387 (100.0%)- ($183,475)$183,475Snack
Haagen DazsC17C (100.0%)- ($41,382)$41,382 (100.0%)- ($174,384)$174,384Snack
Auntie Anne'sC22C (2.6%)$76,114 ($2,031)$78,145 7.1%$370,200 $24,500$345,700Snack
Red MangoC22C (3.5%)$42,574 ($1,552)$44,127 6.3%$192,658 $11,489$181,169Snack
Energy ZoneC35C (5.8%)$60,621 ($3,735)$64,356 (3.1%)$264,000 ($8,511)$272,511Snack
Auntie Anne'sD12D (4.4%)$29,050 ($1,331)$30,382 (15.7%)$120,039 ($22,291)$142,330Snack
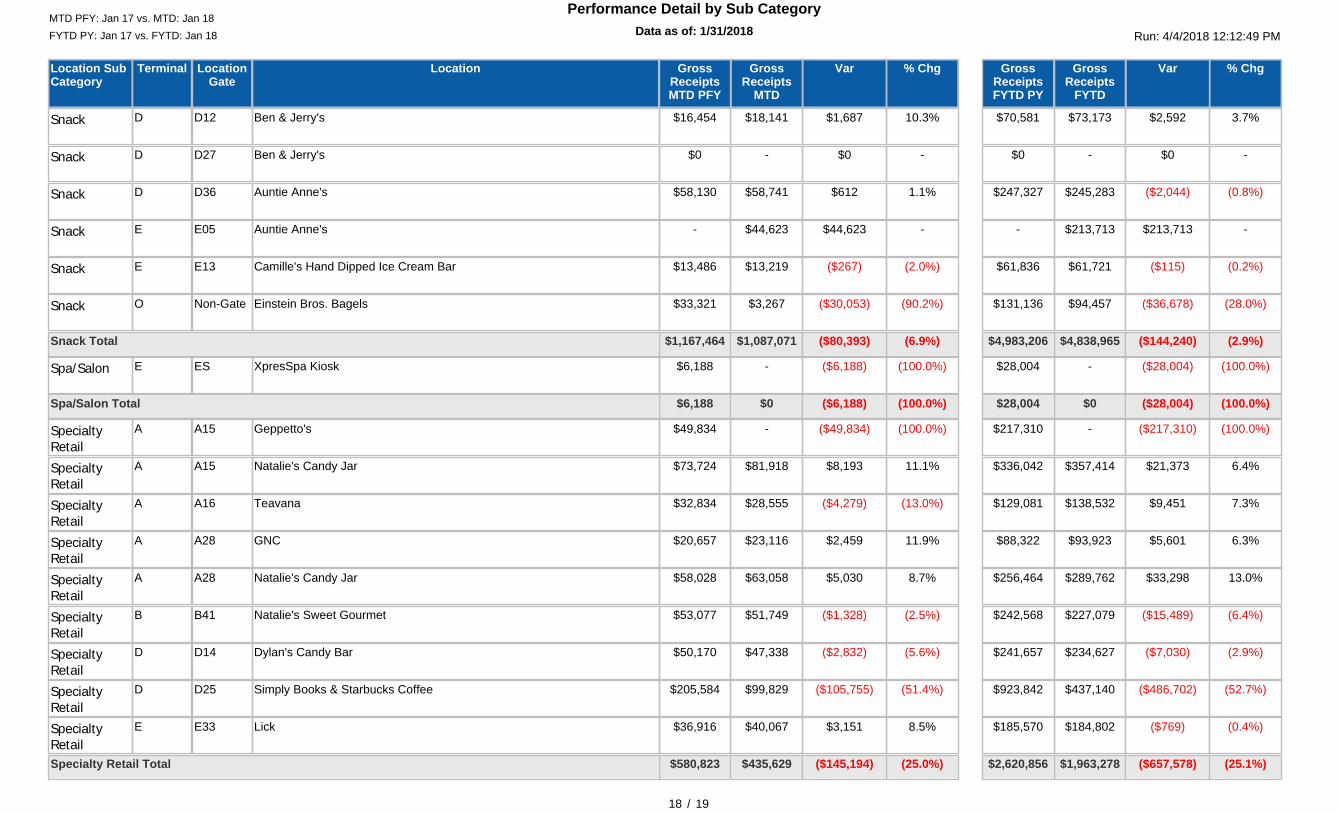
Data as of: 1/31/201812:00:00 AM
Performance Detail by Sub Category
LocationLocationGate
Terminal % ChgGrossReceipts
MTD
VarGrossReceiptsMTD PFY
% ChgGrossReceipts
FYTD
VarGrossReceiptsFYTD PY
Location SubCategory
Run: 4/4/2018 12:12:49 PMFYTD PY: Jan 17 vs. FYTD: Jan 18MTD PFY: Jan 17 vs. MTD: Jan 18
18 / 19
Ben & Jerry'sD12D 10.3%$18,141 $1,687$16,454 3.7%$73,173 $2,592$70,581Snack
Ben & Jerry'sD27D -- $0$0 -- $0$0Snack
Auntie Anne'sD36D 1.1%$58,741 $612$58,130 (0.8%)$245,283 ($2,044)$247,327Snack
Auntie Anne'sE05E -$44,623 $44,623- -$213,713 $213,713-Snack
Camille's Hand Dipped Ice Cream BarE13E (2.0%)$13,219 ($267)$13,486 (0.2%)$61,721 ($115)$61,836Snack
Einstein Bros. BagelsNon-GateO (90.2%)$3,267 ($30,053)$33,321 (28.0%)$94,457 ($36,678)$131,136Snack
(6.9%)$1,087,071 ($80,393)$1,167,464 (2.9%)$4,838,965 ($144,240)$4,983,206Snack Total
XpresSpa KioskESE (100.0%)- ($6,188)$6,188 (100.0%)- ($28,004)$28,004Spa/Salon
(100.0%)$0 ($6,188)$6,188 (100.0%)$0 ($28,004)$28,004Spa/Salon Total
Geppetto'sA15A (100.0%)- ($49,834)$49,834 (100.0%)- ($217,310)$217,310SpecialtyRetail
Natalie's Candy JarA15A 11.1%$81,918 $8,193$73,724 6.4%$357,414 $21,373$336,042SpecialtyRetail
TeavanaA16A (13.0%)$28,555 ($4,279)$32,834 7.3%$138,532 $9,451$129,081SpecialtyRetail
GNCA28A 11.9%$23,116 $2,459$20,657 6.3%$93,923 $5,601$88,322SpecialtyRetail
Natalie's Candy JarA28A 8.7%$63,058 $5,030$58,028 13.0%$289,762 $33,298$256,464SpecialtyRetail
Natalie's Sweet GourmetB41B (2.5%)$51,749 ($1,328)$53,077 (6.4%)$227,079 ($15,489)$242,568SpecialtyRetail
Dylan's Candy BarD14D (5.6%)$47,338 ($2,832)$50,170 (2.9%)$234,627 ($7,030)$241,657SpecialtyRetail
Simply Books & Starbucks CoffeeD25D (51.4%)$99,829 ($105,755)$205,584 (52.7%)$437,140 ($486,702)$923,842SpecialtyRetail
LickE33E 8.5%$40,067 $3,151$36,916 (0.4%)$184,802 ($769)$185,570SpecialtyRetail
(25.0%)$435,629 ($145,194)$580,823 (25.1%)$1,963,278 ($657,578)$2,620,856Specialty Retail Total
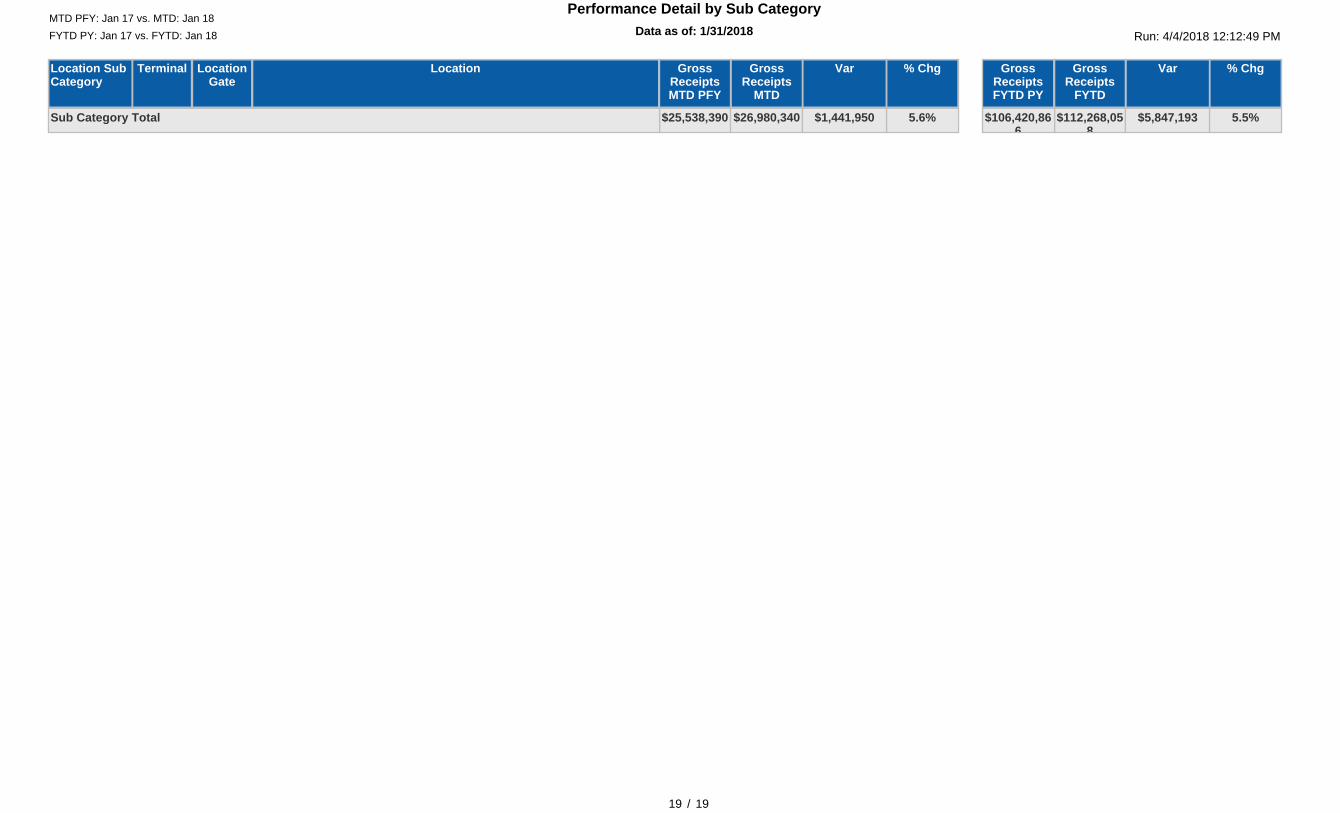
Data as of: 1/31/201812:00:00 AM
Performance Detail by Sub Category
LocationLocationGate
Terminal % ChgGrossReceipts
MTD
VarGrossReceiptsMTD PFY
% ChgGrossReceipts
FYTD
VarGrossReceiptsFYTD PY
Location SubCategory
Run: 4/4/2018 12:12:49 PMFYTD PY: Jan 17 vs. FYTD: Jan 18MTD PFY: Jan 17 vs. MTD: Jan 18
19 / 19
5.6%$26,980,340 $1,441,950$25,538,390 5.5%$112,268,058
$5,847,193$106,420,866
Sub Category Total
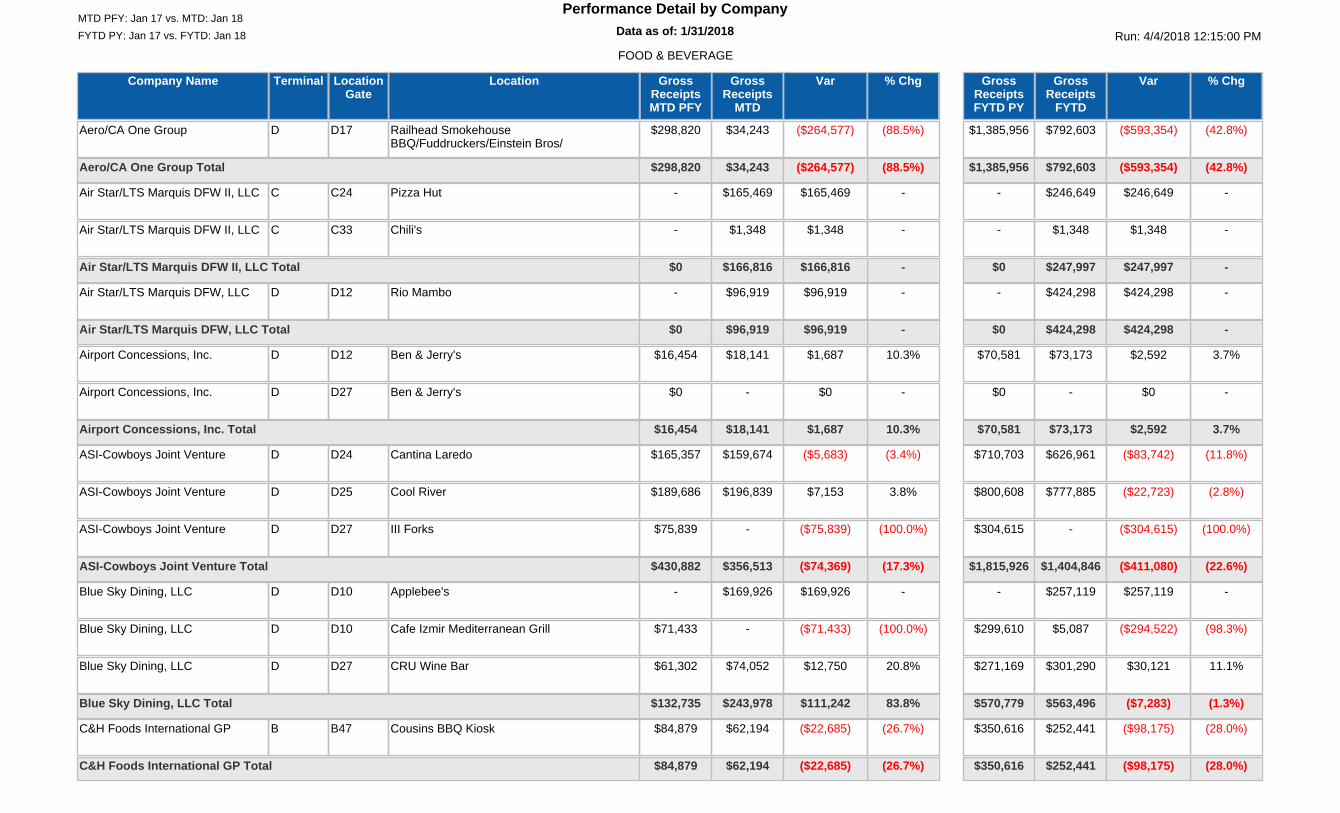
FYTD PY: Jan 17 vs. FYTD: Jan 18 Run: 4/4/2018 12:15:00 PMData as of: 1/31/201812:00:00 AM
Performance Detail by CompanyMTD PFY: Jan 17 vs. MTD: Jan 18
FOOD & BEVERAGE
Company Name LocationLocationGate
Terminal % ChgGrossReceipts
MTD
VarGrossReceiptsMTD PFY
% ChgGrossReceipts
FYTD
VarGrossReceiptsFYTD PY
Aero/CA One Group Railhead SmokehouseBBQ/Fuddruckers/Einstein Bros/
D17D (88.5%)$34,243 ($264,577)$298,820 (42.8%)$792,603 ($593,354)$1,385,956
(88.5%)$34,243 ($264,577)$298,820 (42.8%)$792,603 ($593,354)$1,385,956Aero/CA One Group Total
Air Star/LTS Marquis DFW II, LLC Pizza HutC24C -$165,469 $165,469- -$246,649 $246,649-
Air Star/LTS Marquis DFW II, LLC Chili'sC33C -$1,348 $1,348- -$1,348 $1,348-
-$166,816 $166,816$0 -$247,997 $247,997$0Air Star/LTS Marquis DFW II, LLC Total
Air Star/LTS Marquis DFW, LLC Rio MamboD12D -$96,919 $96,919- -$424,298 $424,298-
-$96,919 $96,919$0 -$424,298 $424,298$0Air Star/LTS Marquis DFW, LLC Total
Airport Concessions, Inc. Ben & Jerry'sD12D 10.3%$18,141 $1,687$16,454 3.7%$73,173 $2,592$70,581
Airport Concessions, Inc. Ben & Jerry'sD27D -- $0$0 -- $0$0
10.3%$18,141 $1,687$16,454 3.7%$73,173 $2,592$70,581Airport Concessions, Inc. Total
ASI-Cowboys Joint Venture Cantina LaredoD24D (3.4%)$159,674 ($5,683)$165,357 (11.8%)$626,961 ($83,742)$710,703
ASI-Cowboys Joint Venture Cool RiverD25D 3.8%$196,839 $7,153$189,686 (2.8%)$777,885 ($22,723)$800,608
ASI-Cowboys Joint Venture III ForksD27D (100.0%)- ($75,839)$75,839 (100.0%)- ($304,615)$304,615
(17.3%)$356,513 ($74,369)$430,882 (22.6%)$1,404,846 ($411,080)$1,815,926ASI-Cowboys Joint Venture Total
Blue Sky Dining, LLC Applebee'sD10D -$169,926 $169,926- -$257,119 $257,119-
Blue Sky Dining, LLC Cafe Izmir Mediterranean GrillD10D (100.0%)- ($71,433)$71,433 (98.3%)$5,087 ($294,522)$299,610
Blue Sky Dining, LLC CRU Wine BarD27D 20.8%$74,052 $12,750$61,302 11.1%$301,290 $30,121$271,169
83.8%$243,978 $111,242$132,735 (1.3%)$563,496 ($7,283)$570,779Blue Sky Dining, LLC Total
C&H Foods International GP Cousins BBQ KioskB47B (26.7%)$62,194 ($22,685)$84,879 (28.0%)$252,441 ($98,175)$350,616
(26.7%)$62,194 ($22,685)$84,879 (28.0%)$252,441 ($98,175)$350,616C&H Foods International GP Total
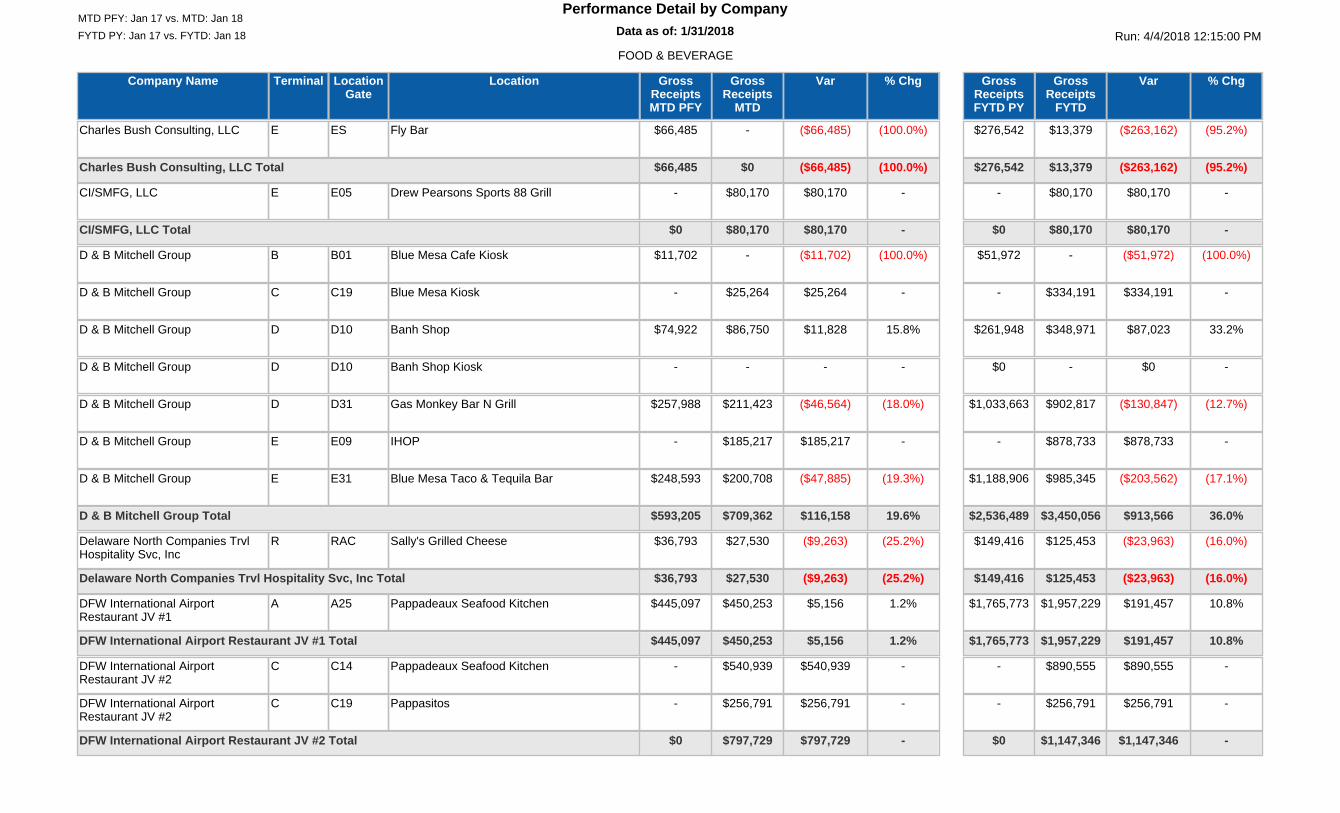
FYTD PY: Jan 17 vs. FYTD: Jan 18 Run: 4/4/2018 12:15:00 PMData as of: 1/31/201812:00:00 AM
Performance Detail by CompanyMTD PFY: Jan 17 vs. MTD: Jan 18
FOOD & BEVERAGE
Company Name LocationLocationGate
Terminal % ChgGrossReceipts
MTD
VarGrossReceiptsMTD PFY
% ChgGrossReceipts
FYTD
VarGrossReceiptsFYTD PY
Charles Bush Consulting, LLC Fly BarESE (100.0%)- ($66,485)$66,485 (95.2%)$13,379 ($263,162)$276,542
(100.0%)$0 ($66,485)$66,485 (95.2%)$13,379 ($263,162)$276,542Charles Bush Consulting, LLC Total
CI/SMFG, LLC Drew Pearsons Sports 88 GrillE05E -$80,170 $80,170- -$80,170 $80,170-
-$80,170 $80,170$0 -$80,170 $80,170$0CI/SMFG, LLC Total
D & B Mitchell Group Blue Mesa Cafe KioskB01B (100.0%)- ($11,702)$11,702 (100.0%)- ($51,972)$51,972
D & B Mitchell Group Blue Mesa KioskC19C -$25,264 $25,264- -$334,191 $334,191-
D & B Mitchell Group Banh ShopD10D 15.8%$86,750 $11,828$74,922 33.2%$348,971 $87,023$261,948
D & B Mitchell Group Banh Shop KioskD10D -- -- -- $0$0
D & B Mitchell Group Gas Monkey Bar N GrillD31D (18.0%)$211,423 ($46,564)$257,988 (12.7%)$902,817 ($130,847)$1,033,663
D & B Mitchell Group IHOPE09E -$185,217 $185,217- -$878,733 $878,733-
D & B Mitchell Group Blue Mesa Taco & Tequila BarE31E (19.3%)$200,708 ($47,885)$248,593 (17.1%)$985,345 ($203,562)$1,188,906
19.6%$709,362 $116,158$593,205 36.0%$3,450,056 $913,566$2,536,489D & B Mitchell Group Total
Delaware North Companies TrvlHospitality Svc, Inc
Sally's Grilled CheeseRACR (25.2%)$27,530 ($9,263)$36,793 (16.0%)$125,453 ($23,963)$149,416
(25.2%)$27,530 ($9,263)$36,793 (16.0%)$125,453 ($23,963)$149,416Delaware North Companies Trvl Hospitality Svc, Inc Total
DFW International AirportRestaurant JV #1
Pappadeaux Seafood KitchenA25A 1.2%$450,253 $5,156$445,097 10.8%$1,957,229 $191,457$1,765,773
1.2%$450,253 $5,156$445,097 10.8%$1,957,229 $191,457$1,765,773DFW International Airport Restaurant JV #1 Total
DFW International AirportRestaurant JV #2
Pappadeaux Seafood KitchenC14C -$540,939 $540,939- -$890,555 $890,555-
DFW International AirportRestaurant JV #2
PappasitosC19C -$256,791 $256,791- -$256,791 $256,791-
-$797,729 $797,729$0 -$1,147,346 $1,147,346$0DFW International Airport Restaurant JV #2 Total
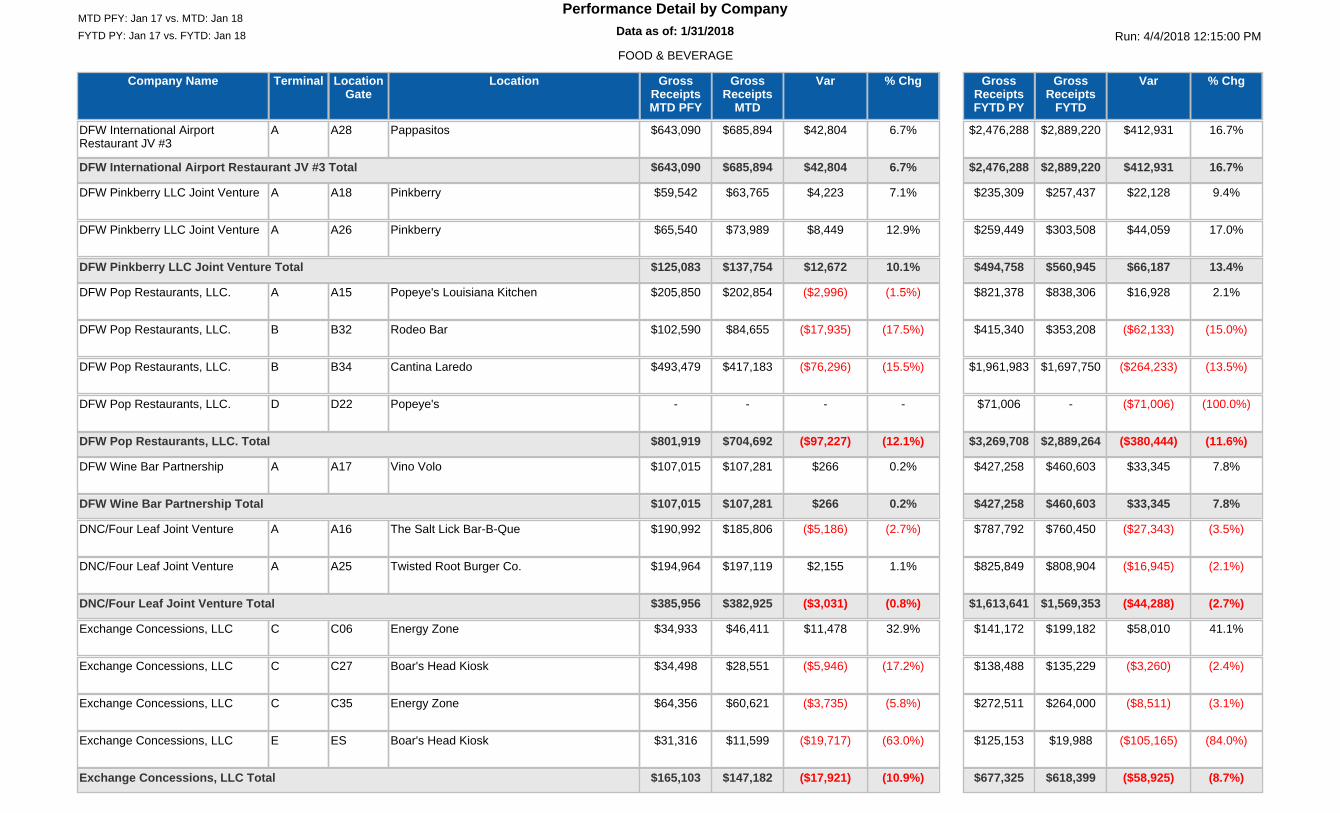
FYTD PY: Jan 17 vs. FYTD: Jan 18 Run: 4/4/2018 12:15:00 PMData as of: 1/31/201812:00:00 AM
Performance Detail by CompanyMTD PFY: Jan 17 vs. MTD: Jan 18
FOOD & BEVERAGE
Company Name LocationLocationGate
Terminal % ChgGrossReceipts
MTD
VarGrossReceiptsMTD PFY
% ChgGrossReceipts
FYTD
VarGrossReceiptsFYTD PY
DFW International AirportRestaurant JV #3
PappasitosA28A 6.7%$685,894 $42,804$643,090 16.7%$2,889,220 $412,931$2,476,288
6.7%$685,894 $42,804$643,090 16.7%$2,889,220 $412,931$2,476,288DFW International Airport Restaurant JV #3 Total
DFW Pinkberry LLC Joint Venture PinkberryA18A 7.1%$63,765 $4,223$59,542 9.4%$257,437 $22,128$235,309
DFW Pinkberry LLC Joint Venture PinkberryA26A 12.9%$73,989 $8,449$65,540 17.0%$303,508 $44,059$259,449
10.1%$137,754 $12,672$125,083 13.4%$560,945 $66,187$494,758DFW Pinkberry LLC Joint Venture Total
DFW Pop Restaurants, LLC. Popeye's Louisiana KitchenA15A (1.5%)$202,854 ($2,996)$205,850 2.1%$838,306 $16,928$821,378
DFW Pop Restaurants, LLC. Rodeo BarB32B (17.5%)$84,655 ($17,935)$102,590 (15.0%)$353,208 ($62,133)$415,340
DFW Pop Restaurants, LLC. Cantina LaredoB34B (15.5%)$417,183 ($76,296)$493,479 (13.5%)$1,697,750 ($264,233)$1,961,983
DFW Pop Restaurants, LLC. Popeye'sD22D -- -- (100.0%)- ($71,006)$71,006
(12.1%)$704,692 ($97,227)$801,919 (11.6%)$2,889,264 ($380,444)$3,269,708DFW Pop Restaurants, LLC. Total
DFW Wine Bar Partnership Vino VoloA17A 0.2%$107,281 $266$107,015 7.8%$460,603 $33,345$427,258
0.2%$107,281 $266$107,015 7.8%$460,603 $33,345$427,258DFW Wine Bar Partnership Total
DNC/Four Leaf Joint Venture The Salt Lick Bar-B-QueA16A (2.7%)$185,806 ($5,186)$190,992 (3.5%)$760,450 ($27,343)$787,792
DNC/Four Leaf Joint Venture Twisted Root Burger Co.A25A 1.1%$197,119 $2,155$194,964 (2.1%)$808,904 ($16,945)$825,849
(0.8%)$382,925 ($3,031)$385,956 (2.7%)$1,569,353 ($44,288)$1,613,641DNC/Four Leaf Joint Venture Total
Exchange Concessions, LLC Energy ZoneC06C 32.9%$46,411 $11,478$34,933 41.1%$199,182 $58,010$141,172
Exchange Concessions, LLC Boar's Head KioskC27C (17.2%)$28,551 ($5,946)$34,498 (2.4%)$135,229 ($3,260)$138,488
Exchange Concessions, LLC Energy ZoneC35C (5.8%)$60,621 ($3,735)$64,356 (3.1%)$264,000 ($8,511)$272,511
Exchange Concessions, LLC Boar's Head KioskESE (63.0%)$11,599 ($19,717)$31,316 (84.0%)$19,988 ($105,165)$125,153
(10.9%)$147,182 ($17,921)$165,103 (8.7%)$618,399 ($58,925)$677,325Exchange Concessions, LLC Total
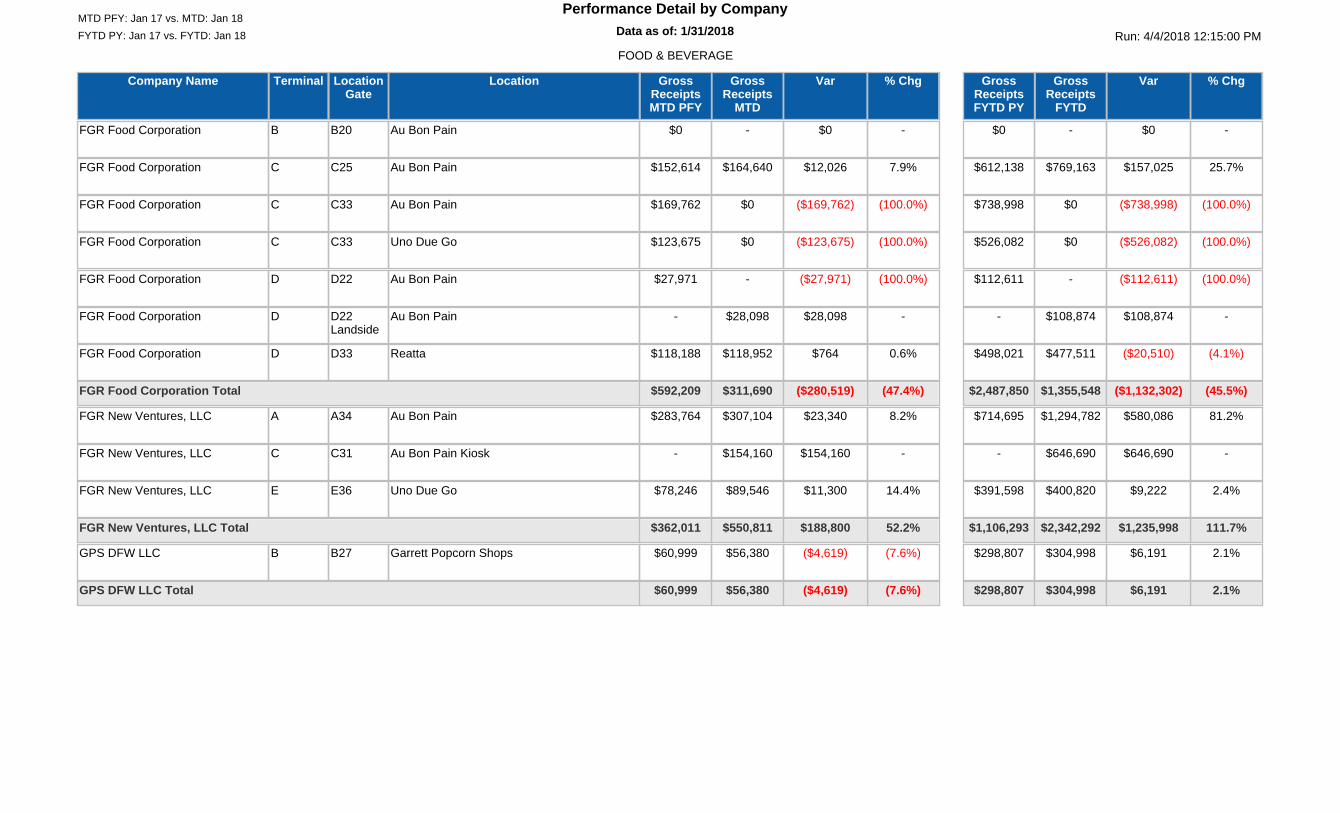
FYTD PY: Jan 17 vs. FYTD: Jan 18 Run: 4/4/2018 12:15:00 PMData as of: 1/31/201812:00:00 AM
Performance Detail by CompanyMTD PFY: Jan 17 vs. MTD: Jan 18
FOOD & BEVERAGE
Company Name LocationLocationGate
Terminal % ChgGrossReceipts
MTD
VarGrossReceiptsMTD PFY
% ChgGrossReceipts
FYTD
VarGrossReceiptsFYTD PY
FGR Food Corporation Au Bon PainB20B -- $0$0 -- $0$0
FGR Food Corporation Au Bon PainC25C 7.9%$164,640 $12,026$152,614 25.7%$769,163 $157,025$612,138
FGR Food Corporation Au Bon PainC33C (100.0%)$0 ($169,762)$169,762 (100.0%)$0 ($738,998)$738,998
FGR Food Corporation Uno Due GoC33C (100.0%)$0 ($123,675)$123,675 (100.0%)$0 ($526,082)$526,082
FGR Food Corporation Au Bon PainD22D (100.0%)- ($27,971)$27,971 (100.0%)- ($112,611)$112,611
FGR Food Corporation Au Bon PainD22Landside
D -$28,098 $28,098- -$108,874 $108,874-
FGR Food Corporation ReattaD33D 0.6%$118,952 $764$118,188 (4.1%)$477,511 ($20,510)$498,021
(47.4%)$311,690 ($280,519)$592,209 (45.5%)$1,355,548 ($1,132,302)$2,487,850FGR Food Corporation Total
FGR New Ventures, LLC Au Bon PainA34A 8.2%$307,104 $23,340$283,764 81.2%$1,294,782 $580,086$714,695
FGR New Ventures, LLC Au Bon Pain KioskC31C -$154,160 $154,160- -$646,690 $646,690-
FGR New Ventures, LLC Uno Due GoE36E 14.4%$89,546 $11,300$78,246 2.4%$400,820 $9,222$391,598
52.2%$550,811 $188,800$362,011 111.7%$2,342,292 $1,235,998$1,106,293FGR New Ventures, LLC Total
GPS DFW LLC Garrett Popcorn ShopsB27B (7.6%)$56,380 ($4,619)$60,999 2.1%$304,998 $6,191$298,807
(7.6%)$56,380 ($4,619)$60,999 2.1%$304,998 $6,191$298,807GPS DFW LLC Total
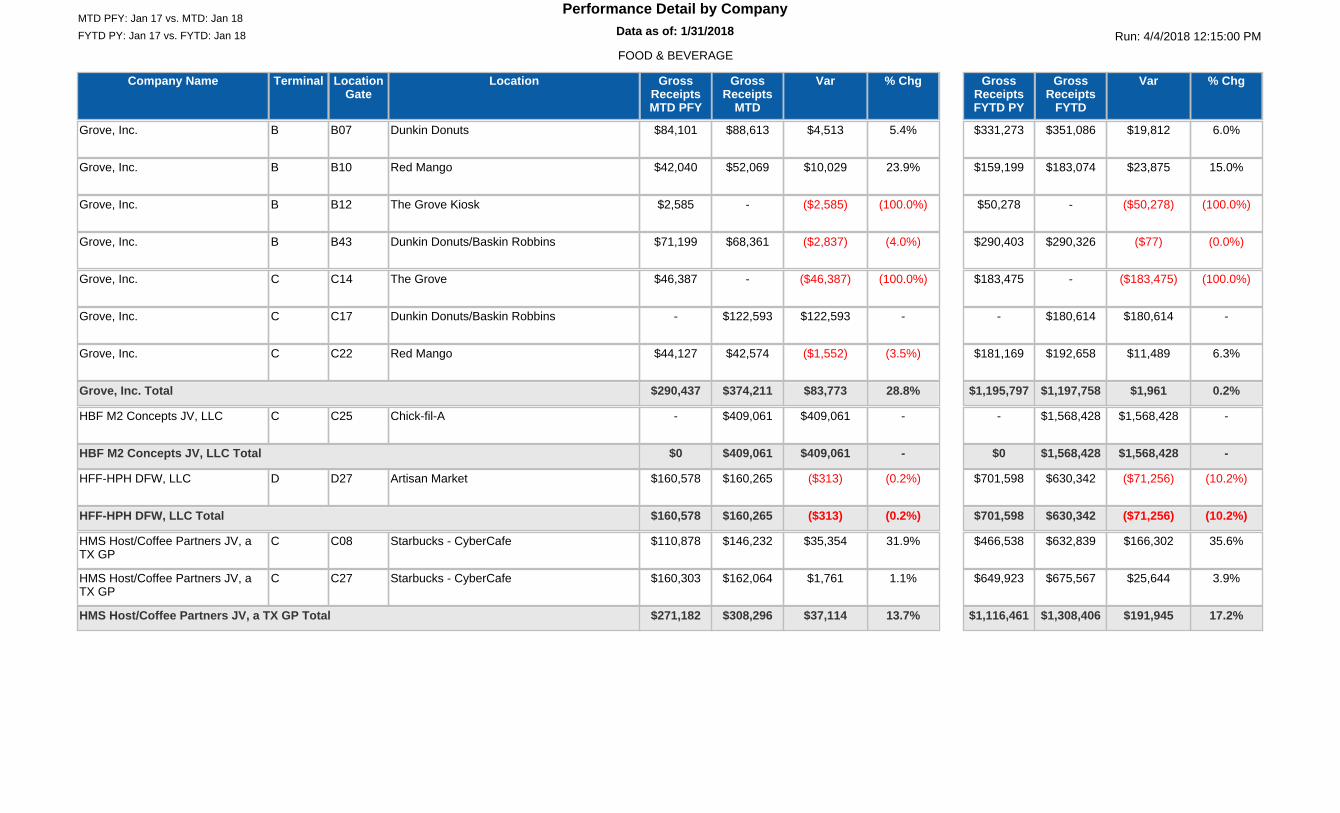
FYTD PY: Jan 17 vs. FYTD: Jan 18 Run: 4/4/2018 12:15:00 PMData as of: 1/31/201812:00:00 AM
Performance Detail by CompanyMTD PFY: Jan 17 vs. MTD: Jan 18
FOOD & BEVERAGE
Company Name LocationLocationGate
Terminal % ChgGrossReceipts
MTD
VarGrossReceiptsMTD PFY
% ChgGrossReceipts
FYTD
VarGrossReceiptsFYTD PY
Grove, Inc. Dunkin DonutsB07B 5.4%$88,613 $4,513$84,101 6.0%$351,086 $19,812$331,273
Grove, Inc. Red MangoB10B 23.9%$52,069 $10,029$42,040 15.0%$183,074 $23,875$159,199
Grove, Inc. The Grove KioskB12B (100.0%)- ($2,585)$2,585 (100.0%)- ($50,278)$50,278
Grove, Inc. Dunkin Donuts/Baskin RobbinsB43B (4.0%)$68,361 ($2,837)$71,199 (0.0%)$290,326 ($77)$290,403
Grove, Inc. The GroveC14C (100.0%)- ($46,387)$46,387 (100.0%)- ($183,475)$183,475
Grove, Inc. Dunkin Donuts/Baskin RobbinsC17C -$122,593 $122,593- -$180,614 $180,614-
Grove, Inc. Red MangoC22C (3.5%)$42,574 ($1,552)$44,127 6.3%$192,658 $11,489$181,169
28.8%$374,211 $83,773$290,437 0.2%$1,197,758 $1,961$1,195,797Grove, Inc. Total
HBF M2 Concepts JV, LLC Chick-fil-AC25C -$409,061 $409,061- -$1,568,428 $1,568,428-
-$409,061 $409,061$0 -$1,568,428 $1,568,428$0HBF M2 Concepts JV, LLC Total
HFF-HPH DFW, LLC Artisan MarketD27D (0.2%)$160,265 ($313)$160,578 (10.2%)$630,342 ($71,256)$701,598
(0.2%)$160,265 ($313)$160,578 (10.2%)$630,342 ($71,256)$701,598HFF-HPH DFW, LLC Total
HMS Host/Coffee Partners JV, aTX GP
Starbucks - CyberCafeC08C 31.9%$146,232 $35,354$110,878 35.6%$632,839 $166,302$466,538
HMS Host/Coffee Partners JV, aTX GP
Starbucks - CyberCafeC27C 1.1%$162,064 $1,761$160,303 3.9%$675,567 $25,644$649,923
13.7%$308,296 $37,114$271,182 17.2%$1,308,406 $191,945$1,116,461HMS Host/Coffee Partners JV, a TX GP Total
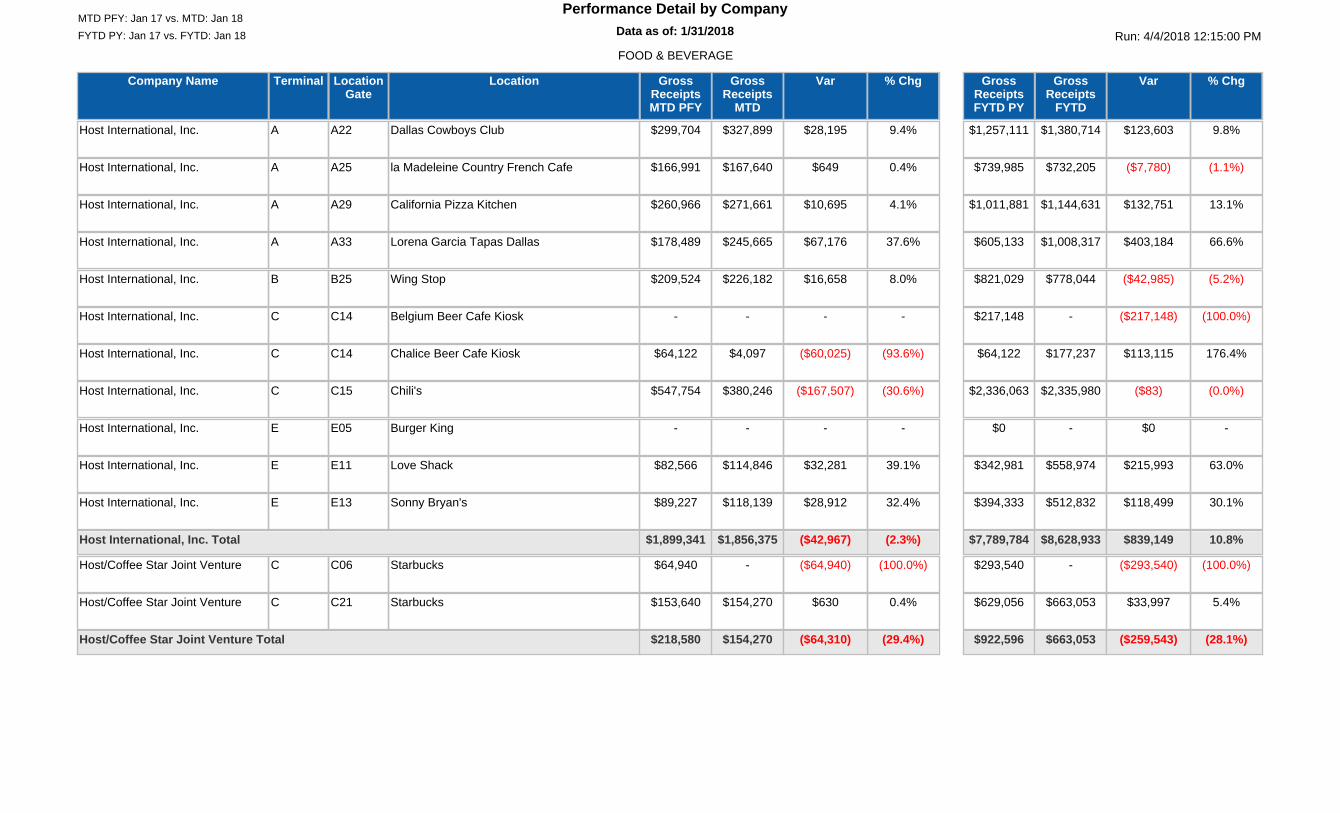
FYTD PY: Jan 17 vs. FYTD: Jan 18 Run: 4/4/2018 12:15:00 PMData as of: 1/31/201812:00:00 AM
Performance Detail by CompanyMTD PFY: Jan 17 vs. MTD: Jan 18
FOOD & BEVERAGE
Company Name LocationLocationGate
Terminal % ChgGrossReceipts
MTD
VarGrossReceiptsMTD PFY
% ChgGrossReceipts
FYTD
VarGrossReceiptsFYTD PY
Host International, Inc. Dallas Cowboys ClubA22A 9.4%$327,899 $28,195$299,704 9.8%$1,380,714 $123,603$1,257,111
Host International, Inc. la Madeleine Country French CafeA25A 0.4%$167,640 $649$166,991 (1.1%)$732,205 ($7,780)$739,985
Host International, Inc. California Pizza KitchenA29A 4.1%$271,661 $10,695$260,966 13.1%$1,144,631 $132,751$1,011,881
Host International, Inc. Lorena Garcia Tapas DallasA33A 37.6%$245,665 $67,176$178,489 66.6%$1,008,317 $403,184$605,133
Host International, Inc. Wing StopB25B 8.0%$226,182 $16,658$209,524 (5.2%)$778,044 ($42,985)$821,029
Host International, Inc. Belgium Beer Cafe KioskC14C -- -- (100.0%)- ($217,148)$217,148
Host International, Inc. Chalice Beer Cafe KioskC14C (93.6%)$4,097 ($60,025)$64,122 176.4%$177,237 $113,115$64,122
Host International, Inc. Chili'sC15C (30.6%)$380,246 ($167,507)$547,754 (0.0%)$2,335,980 ($83)$2,336,063
Host International, Inc. Burger KingE05E -- -- -- $0$0
Host International, Inc. Love ShackE11E 39.1%$114,846 $32,281$82,566 63.0%$558,974 $215,993$342,981
Host International, Inc. Sonny Bryan'sE13E 32.4%$118,139 $28,912$89,227 30.1%$512,832 $118,499$394,333
(2.3%)$1,856,375 ($42,967)$1,899,341 10.8%$8,628,933 $839,149$7,789,784Host International, Inc. Total
Host/Coffee Star Joint Venture StarbucksC06C (100.0%)- ($64,940)$64,940 (100.0%)- ($293,540)$293,540
Host/Coffee Star Joint Venture StarbucksC21C 0.4%$154,270 $630$153,640 5.4%$663,053 $33,997$629,056
(29.4%)$154,270 ($64,310)$218,580 (28.1%)$663,053 ($259,543)$922,596Host/Coffee Star Joint Venture Total
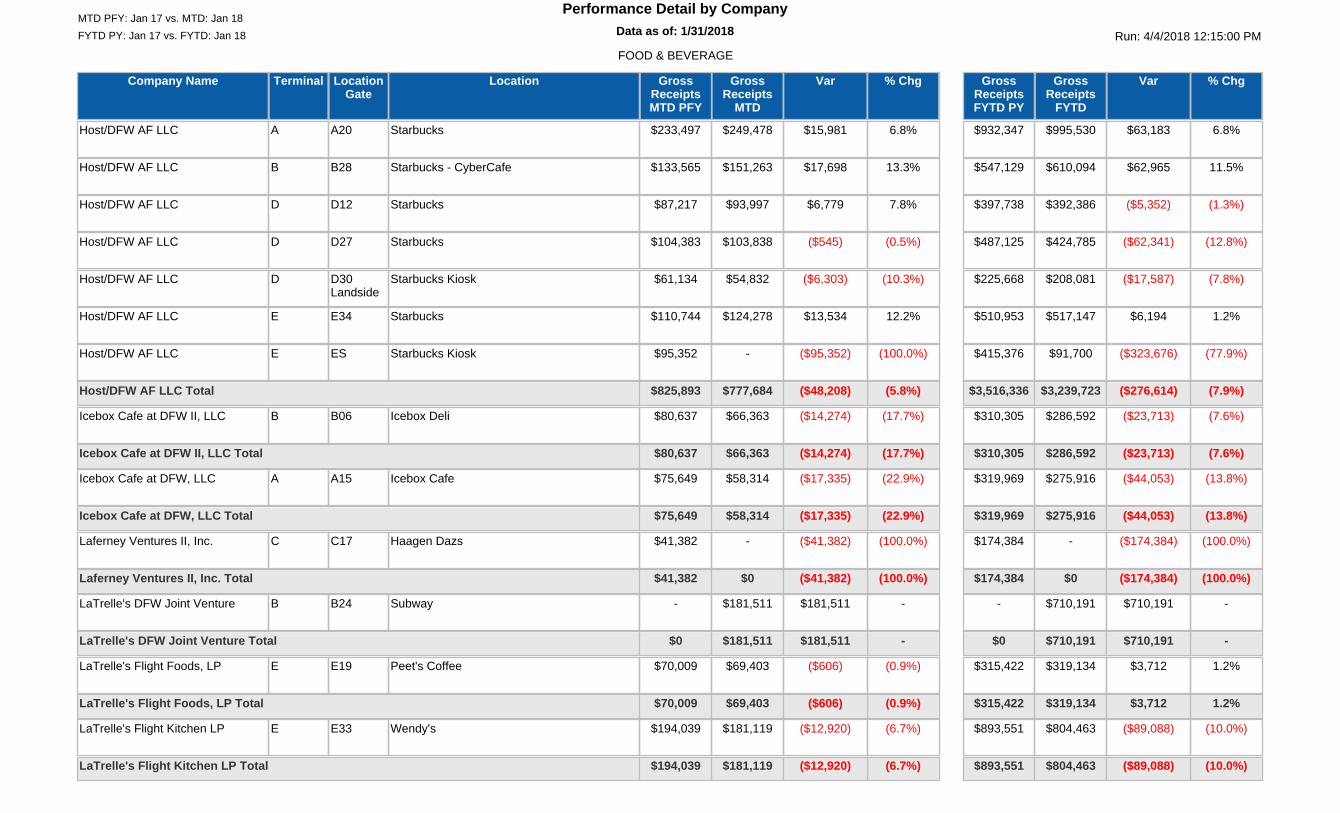
FYTD PY: Jan 17 vs. FYTD: Jan 18 Run: 4/4/2018 12:15:00 PMData as of: 1/31/201812:00:00 AM
Performance Detail by CompanyMTD PFY: Jan 17 vs. MTD: Jan 18
FOOD & BEVERAGE
Company Name LocationLocationGate
Terminal % ChgGrossReceipts
MTD
VarGrossReceiptsMTD PFY
% ChgGrossReceipts
FYTD
VarGrossReceiptsFYTD PY
Host/DFW AF LLC StarbucksA20A 6.8%$249,478 $15,981$233,497 6.8%$995,530 $63,183$932,347
Host/DFW AF LLC Starbucks - CyberCafeB28B 13.3%$151,263 $17,698$133,565 11.5%$610,094 $62,965$547,129
Host/DFW AF LLC StarbucksD12D 7.8%$93,997 $6,779$87,217 (1.3%)$392,386 ($5,352)$397,738
Host/DFW AF LLC StarbucksD27D (0.5%)$103,838 ($545)$104,383 (12.8%)$424,785 ($62,341)$487,125
Host/DFW AF LLC Starbucks KioskD30Landside
D (10.3%)$54,832 ($6,303)$61,134 (7.8%)$208,081 ($17,587)$225,668
Host/DFW AF LLC StarbucksE34E 12.2%$124,278 $13,534$110,744 1.2%$517,147 $6,194$510,953
Host/DFW AF LLC Starbucks KioskESE (100.0%)- ($95,352)$95,352 (77.9%)$91,700 ($323,676)$415,376
(5.8%)$777,684 ($48,208)$825,893 (7.9%)$3,239,723 ($276,614)$3,516,336Host/DFW AF LLC Total
Icebox Cafe at DFW II, LLC Icebox DeliB06B (17.7%)$66,363 ($14,274)$80,637 (7.6%)$286,592 ($23,713)$310,305
(17.7%)$66,363 ($14,274)$80,637 (7.6%)$286,592 ($23,713)$310,305Icebox Cafe at DFW II, LLC Total
Icebox Cafe at DFW, LLC Icebox CafeA15A (22.9%)$58,314 ($17,335)$75,649 (13.8%)$275,916 ($44,053)$319,969
(22.9%)$58,314 ($17,335)$75,649 (13.8%)$275,916 ($44,053)$319,969Icebox Cafe at DFW, LLC Total
Laferney Ventures II, Inc. Haagen DazsC17C (100.0%)- ($41,382)$41,382 (100.0%)- ($174,384)$174,384
(100.0%)$0 ($41,382)$41,382 (100.0%)$0 ($174,384)$174,384Laferney Ventures II, Inc. Total
LaTrelle's DFW Joint Venture SubwayB24B -$181,511 $181,511- -$710,191 $710,191-
-$181,511 $181,511$0 -$710,191 $710,191$0LaTrelle's DFW Joint Venture Total
LaTrelle's Flight Foods, LP Peet's CoffeeE19E (0.9%)$69,403 ($606)$70,009 1.2%$319,134 $3,712$315,422
(0.9%)$69,403 ($606)$70,009 1.2%$319,134 $3,712$315,422LaTrelle's Flight Foods, LP Total
LaTrelle's Flight Kitchen LP Wendy'sE33E (6.7%)$181,119 ($12,920)$194,039 (10.0%)$804,463 ($89,088)$893,551
(6.7%)$181,119 ($12,920)$194,039 (10.0%)$804,463 ($89,088)$893,551LaTrelle's Flight Kitchen LP Total
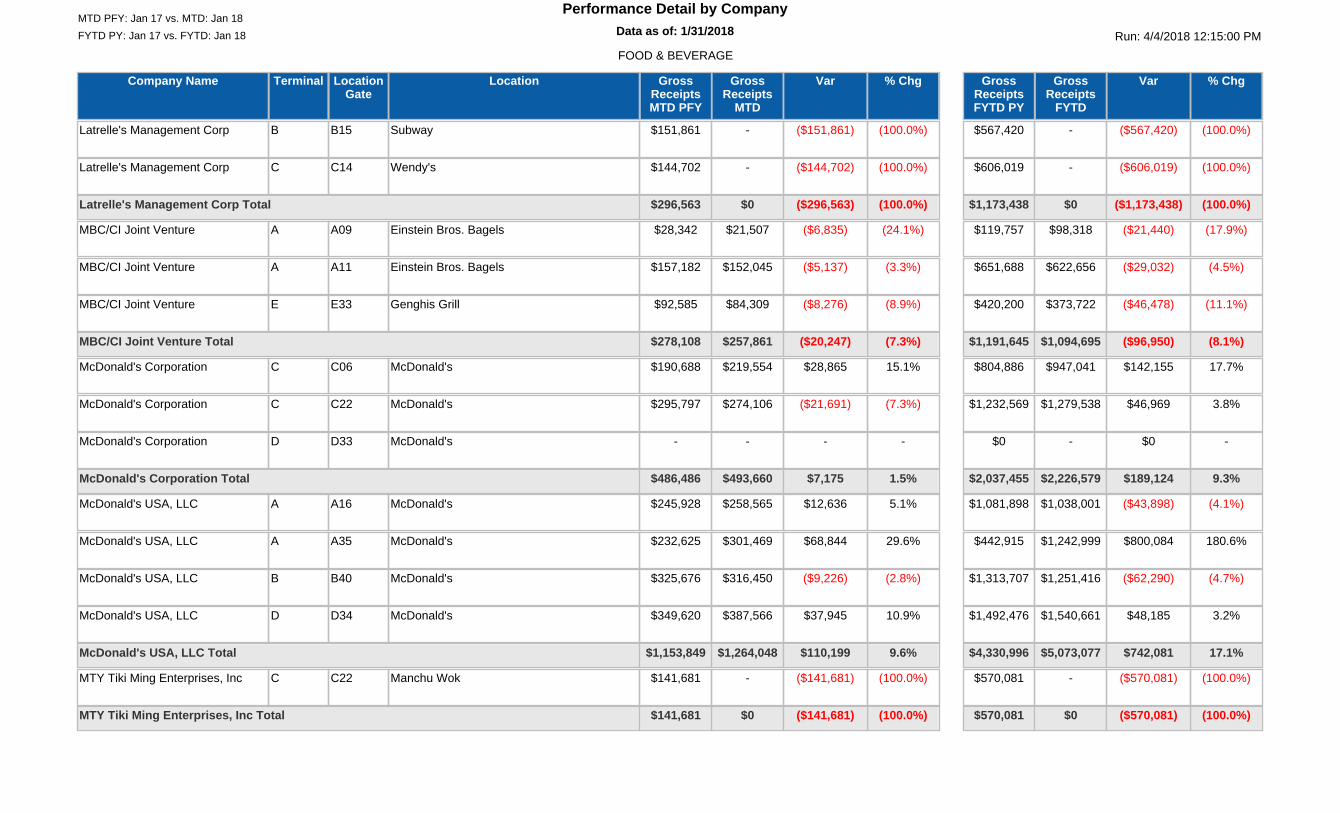
FYTD PY: Jan 17 vs. FYTD: Jan 18 Run: 4/4/2018 12:15:00 PMData as of: 1/31/201812:00:00 AM
Performance Detail by CompanyMTD PFY: Jan 17 vs. MTD: Jan 18
FOOD & BEVERAGE
Company Name LocationLocationGate
Terminal % ChgGrossReceipts
MTD
VarGrossReceiptsMTD PFY
% ChgGrossReceipts
FYTD
VarGrossReceiptsFYTD PY
Latrelle's Management Corp SubwayB15B (100.0%)- ($151,861)$151,861 (100.0%)- ($567,420)$567,420
Latrelle's Management Corp Wendy'sC14C (100.0%)- ($144,702)$144,702 (100.0%)- ($606,019)$606,019
(100.0%)$0 ($296,563)$296,563 (100.0%)$0 ($1,173,438)$1,173,438Latrelle's Management Corp Total
MBC/CI Joint Venture Einstein Bros. BagelsA09A (24.1%)$21,507 ($6,835)$28,342 (17.9%)$98,318 ($21,440)$119,757
MBC/CI Joint Venture Einstein Bros. BagelsA11A (3.3%)$152,045 ($5,137)$157,182 (4.5%)$622,656 ($29,032)$651,688
MBC/CI Joint Venture Genghis GrillE33E (8.9%)$84,309 ($8,276)$92,585 (11.1%)$373,722 ($46,478)$420,200
(7.3%)$257,861 ($20,247)$278,108 (8.1%)$1,094,695 ($96,950)$1,191,645MBC/CI Joint Venture Total
McDonald's Corporation McDonald'sC06C 15.1%$219,554 $28,865$190,688 17.7%$947,041 $142,155$804,886
McDonald's Corporation McDonald'sC22C (7.3%)$274,106 ($21,691)$295,797 3.8%$1,279,538 $46,969$1,232,569
McDonald's Corporation McDonald'sD33D -- -- -- $0$0
1.5%$493,660 $7,175$486,486 9.3%$2,226,579 $189,124$2,037,455McDonald's Corporation Total
McDonald's USA, LLC McDonald'sA16A 5.1%$258,565 $12,636$245,928 (4.1%)$1,038,001 ($43,898)$1,081,898
McDonald's USA, LLC McDonald'sA35A 29.6%$301,469 $68,844$232,625 180.6%$1,242,999 $800,084$442,915
McDonald's USA, LLC McDonald'sB40B (2.8%)$316,450 ($9,226)$325,676 (4.7%)$1,251,416 ($62,290)$1,313,707
McDonald's USA, LLC McDonald'sD34D 10.9%$387,566 $37,945$349,620 3.2%$1,540,661 $48,185$1,492,476
9.6%$1,264,048 $110,199$1,153,849 17.1%$5,073,077 $742,081$4,330,996McDonald's USA, LLC Total
MTY Tiki Ming Enterprises, Inc Manchu WokC22C (100.0%)- ($141,681)$141,681 (100.0%)- ($570,081)$570,081
(100.0%)$0 ($141,681)$141,681 (100.0%)$0 ($570,081)$570,081MTY Tiki Ming Enterprises, Inc Total
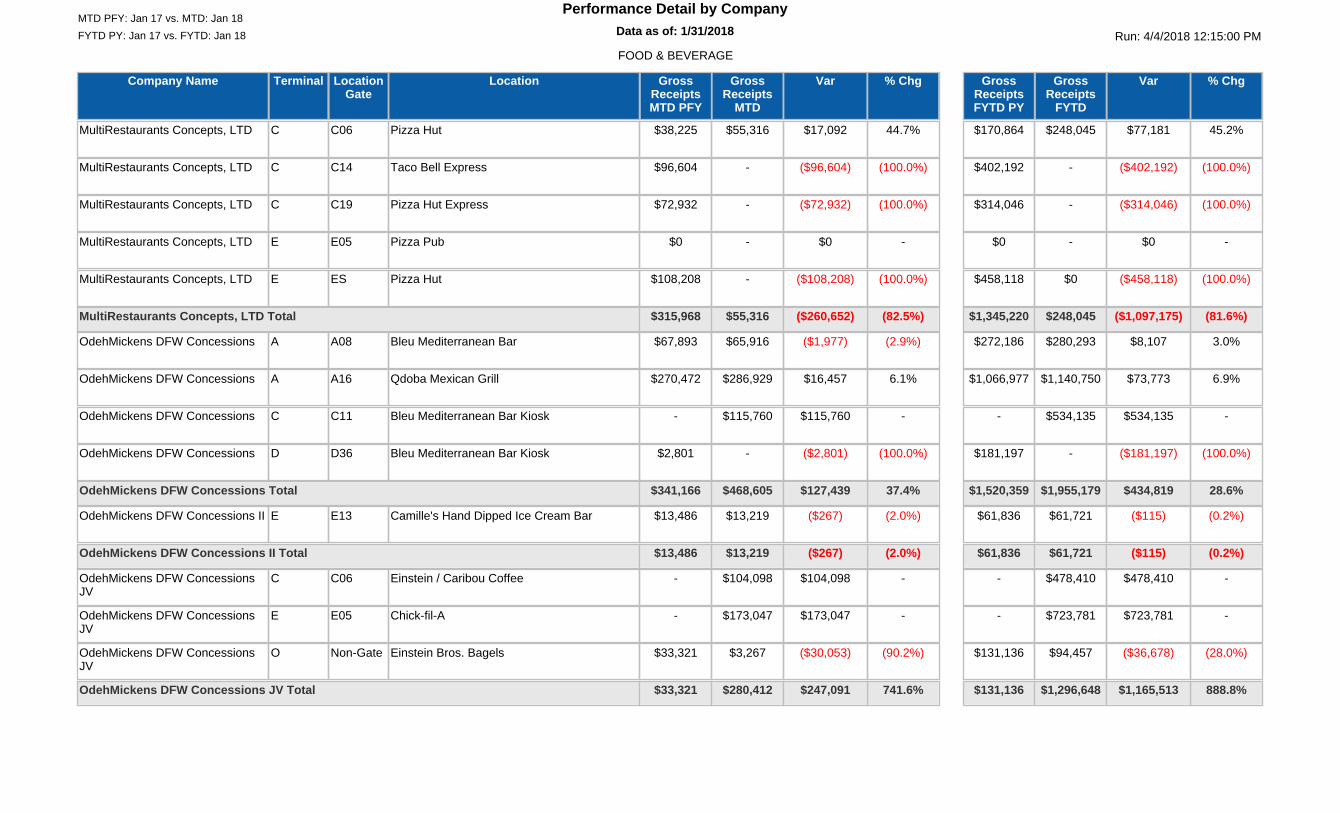
FYTD PY: Jan 17 vs. FYTD: Jan 18 Run: 4/4/2018 12:15:00 PMData as of: 1/31/201812:00:00 AM
Performance Detail by CompanyMTD PFY: Jan 17 vs. MTD: Jan 18
FOOD & BEVERAGE
Company Name LocationLocationGate
Terminal % ChgGrossReceipts
MTD
VarGrossReceiptsMTD PFY
% ChgGrossReceipts
FYTD
VarGrossReceiptsFYTD PY
MultiRestaurants Concepts, LTD Pizza HutC06C 44.7%$55,316 $17,092$38,225 45.2%$248,045 $77,181$170,864
MultiRestaurants Concepts, LTD Taco Bell ExpressC14C (100.0%)- ($96,604)$96,604 (100.0%)- ($402,192)$402,192
MultiRestaurants Concepts, LTD Pizza Hut ExpressC19C (100.0%)- ($72,932)$72,932 (100.0%)- ($314,046)$314,046
MultiRestaurants Concepts, LTD Pizza PubE05E -- $0$0 -- $0$0
MultiRestaurants Concepts, LTD Pizza HutESE (100.0%)- ($108,208)$108,208 (100.0%)$0 ($458,118)$458,118
(82.5%)$55,316 ($260,652)$315,968 (81.6%)$248,045 ($1,097,175)$1,345,220MultiRestaurants Concepts, LTD Total
OdehMickens DFW Concessions Bleu Mediterranean BarA08A (2.9%)$65,916 ($1,977)$67,893 3.0%$280,293 $8,107$272,186
OdehMickens DFW Concessions Qdoba Mexican GrillA16A 6.1%$286,929 $16,457$270,472 6.9%$1,140,750 $73,773$1,066,977
OdehMickens DFW Concessions Bleu Mediterranean Bar KioskC11C -$115,760 $115,760- -$534,135 $534,135-
OdehMickens DFW Concessions Bleu Mediterranean Bar KioskD36D (100.0%)- ($2,801)$2,801 (100.0%)- ($181,197)$181,197
37.4%$468,605 $127,439$341,166 28.6%$1,955,179 $434,819$1,520,359OdehMickens DFW Concessions Total
OdehMickens DFW Concessions II Camille's Hand Dipped Ice Cream BarE13E (2.0%)$13,219 ($267)$13,486 (0.2%)$61,721 ($115)$61,836
(2.0%)$13,219 ($267)$13,486 (0.2%)$61,721 ($115)$61,836OdehMickens DFW Concessions II Total
OdehMickens DFW ConcessionsJV
Einstein / Caribou CoffeeC06C -$104,098 $104,098- -$478,410 $478,410-
OdehMickens DFW ConcessionsJV
Chick-fil-AE05E -$173,047 $173,047- -$723,781 $723,781-
OdehMickens DFW ConcessionsJV
Einstein Bros. BagelsNon-GateO (90.2%)$3,267 ($30,053)$33,321 (28.0%)$94,457 ($36,678)$131,136
741.6%$280,412 $247,091$33,321 888.8%$1,296,648 $1,165,513$131,136OdehMickens DFW Concessions JV Total
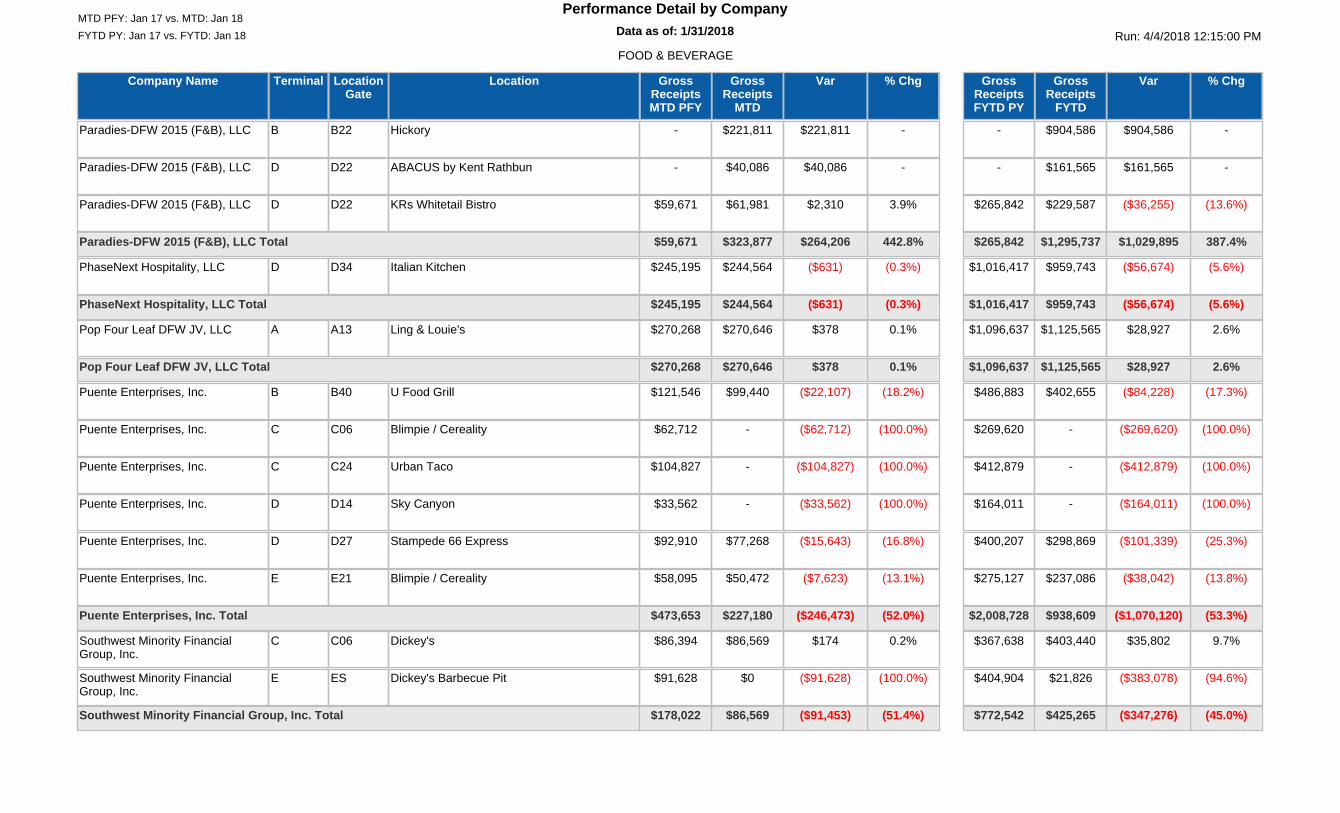
FYTD PY: Jan 17 vs. FYTD: Jan 18 Run: 4/4/2018 12:15:00 PMData as of: 1/31/201812:00:00 AM
Performance Detail by CompanyMTD PFY: Jan 17 vs. MTD: Jan 18
FOOD & BEVERAGE
Company Name LocationLocationGate
Terminal % ChgGrossReceipts
MTD
VarGrossReceiptsMTD PFY
% ChgGrossReceipts
FYTD
VarGrossReceiptsFYTD PY
Paradies-DFW 2015 (F&B), LLC HickoryB22B -$221,811 $221,811- -$904,586 $904,586-
Paradies-DFW 2015 (F&B), LLC ABACUS by Kent RathbunD22D -$40,086 $40,086- -$161,565 $161,565-
Paradies-DFW 2015 (F&B), LLC KRs Whitetail BistroD22D 3.9%$61,981 $2,310$59,671 (13.6%)$229,587 ($36,255)$265,842
442.8%$323,877 $264,206$59,671 387.4%$1,295,737 $1,029,895$265,842Paradies-DFW 2015 (F&B), LLC Total
PhaseNext Hospitality, LLC Italian KitchenD34D (0.3%)$244,564 ($631)$245,195 (5.6%)$959,743 ($56,674)$1,016,417
(0.3%)$244,564 ($631)$245,195 (5.6%)$959,743 ($56,674)$1,016,417PhaseNext Hospitality, LLC Total
Pop Four Leaf DFW JV, LLC Ling & Louie'sA13A 0.1%$270,646 $378$270,268 2.6%$1,125,565 $28,927$1,096,637
0.1%$270,646 $378$270,268 2.6%$1,125,565 $28,927$1,096,637Pop Four Leaf DFW JV, LLC Total
Puente Enterprises, Inc. U Food GrillB40B (18.2%)$99,440 ($22,107)$121,546 (17.3%)$402,655 ($84,228)$486,883
Puente Enterprises, Inc. Blimpie / CerealityC06C (100.0%)- ($62,712)$62,712 (100.0%)- ($269,620)$269,620
Puente Enterprises, Inc. Urban TacoC24C (100.0%)- ($104,827)$104,827 (100.0%)- ($412,879)$412,879
Puente Enterprises, Inc. Sky CanyonD14D (100.0%)- ($33,562)$33,562 (100.0%)- ($164,011)$164,011
Puente Enterprises, Inc. Stampede 66 ExpressD27D (16.8%)$77,268 ($15,643)$92,910 (25.3%)$298,869 ($101,339)$400,207
Puente Enterprises, Inc. Blimpie / CerealityE21E (13.1%)$50,472 ($7,623)$58,095 (13.8%)$237,086 ($38,042)$275,127
(52.0%)$227,180 ($246,473)$473,653 (53.3%)$938,609 ($1,070,120)$2,008,728Puente Enterprises, Inc. Total
Southwest Minority FinancialGroup, Inc.
Dickey'sC06C 0.2%$86,569 $174$86,394 9.7%$403,440 $35,802$367,638
Southwest Minority FinancialGroup, Inc.
Dickey's Barbecue PitESE (100.0%)$0 ($91,628)$91,628 (94.6%)$21,826 ($383,078)$404,904
(51.4%)$86,569 ($91,453)$178,022 (45.0%)$425,265 ($347,276)$772,542Southwest Minority Financial Group, Inc. Total

FYTD PY: Jan 17 vs. FYTD: Jan 18 Run: 4/4/2018 12:15:00 PMData as of: 1/31/201812:00:00 AM
Performance Detail by CompanyMTD PFY: Jan 17 vs. MTD: Jan 18
FOOD & BEVERAGE
Company Name LocationLocationGate
Terminal % ChgGrossReceipts
MTD
VarGrossReceiptsMTD PFY
% ChgGrossReceipts
FYTD
VarGrossReceiptsFYTD PY
SSP America Inc. PizzaVinoD20D 14.1%$84,192 $10,425$73,767 10.1%$354,513 $32,509$322,005
SSP America Inc. Tigin Irish PubD20D (2.9%)$239,467 ($7,278)$246,745 (7.2%)$992,705 ($76,520)$1,069,225
1.0%$323,658 $3,146$320,512 (3.2%)$1,347,218 ($44,011)$1,391,229SSP America Inc. Total
Texas Pretzels, Inc. Auntie Anne'sA21A 5.1%$95,529 $4,660$90,869 2.3%$412,656 $9,330$403,326
Texas Pretzels, Inc. Auntie Anne'sB33B (13.8%)$74,134 ($11,905)$86,039 (10.7%)$324,970 ($39,023)$363,993
Texas Pretzels, Inc. Auntie Anne'sC14C 24.0%$46,576 $9,002$37,575 30.2%$221,007 $51,198$169,809
Texas Pretzels, Inc. Auntie Anne'sC22C (2.6%)$76,114 ($2,031)$78,145 7.1%$370,200 $24,500$345,700
Texas Pretzels, Inc. Auntie Anne'sD12D (4.4%)$29,050 ($1,331)$30,382 (15.7%)$120,039 ($22,291)$142,330
Texas Pretzels, Inc. Auntie Anne'sD36D 1.1%$58,741 $612$58,130 (0.8%)$245,283 ($2,044)$247,327
Texas Pretzels, Inc. Auntie Anne'sE05E -$44,623 $44,623- -$213,713 $213,713-
11.4%$424,767 $43,628$381,139 14.1%$1,907,867 $235,382$1,672,485Texas Pretzels, Inc. Total
TGIF/DFW Restaurant JointVenture
T.G.I. Friday'sB12B (13.5%)$525,725 ($82,140)$607,864 (17.7%)$1,987,674 ($426,264)$2,413,938
TGIF/DFW Restaurant JointVenture
T.G.I. Friday'sC07C (6.5%)$391,036 ($27,160)$418,196 (3.5%)$1,733,806 ($62,697)$1,796,504
TGIF/DFW Restaurant JointVenture
T.G.I. Friday'sC30C (14.7%)$618,394 ($106,364)$724,758 (10.3%)$2,578,611 ($296,512)$2,875,123
TGIF/DFW Restaurant JointVenture
T.G.I. Friday'sE17E (15.7%)$359,410 ($66,709)$426,119 (6.9%)$1,690,136 ($124,711)$1,814,847
(13.0%)$1,894,564 ($282,373)$2,176,938 (10.2%)$7,990,228 ($910,185)$8,900,412TGIF/DFW Restaurant Joint Venture Total
TGIF/DFW Terminal A RestaurantJoint Venture
T.G.I. Friday'sA14A 1.5%$539,896 $7,916$531,980 (0.4%)$2,210,691 ($9,558)$2,220,249
1.5%$539,896 $7,916$531,980 (0.4%)$2,210,691 ($9,558)$2,220,249TGIF/DFW Terminal A Restaurant Joint Venture Total
4.2%$17,894,175 $719,708$17,174,467 3.6%$73,312,912 $2,575,993$70,736,919FOOD & BEVERAGE Total

FYTD PY: Jan 17 vs. FYTD: Jan 18 Run: 4/4/2018 12:15:00 PMData as of: 1/31/201812:00:00 AM
Performance Detail by CompanyMTD PFY: Jan 17 vs. MTD: Jan 18
RETAIL
Company Name LocationLocationGate
Terminal % ChgGrossReceipts
MTD
VarGrossReceiptsMTD PFY
% ChgGrossReceipts
FYTD
VarGrossReceiptsFYTD PY
Airport Management Services, LLC Hudson NewsD22D (100.0%)- ($29,646)$29,646 (100.0%)- ($114,128)$114,128
Airport Management Services, LLC Hudson NewsD22Landside
D -$26,846 $26,846- -$108,237 $108,237-
(9.4%)$26,846 ($2,800)$29,646 (5.2%)$108,237 ($5,892)$114,128Airport Management Services, LLC Total
AirSun Joint Venture Sunglass HutA24A 5.8%$94,465 $5,141$89,324 7.3%$437,310 $29,645$407,665
5.8%$94,465 $5,141$89,324 7.3%$437,310 $29,645$407,665AirSun Joint Venture Total
Brookstone Dallas Fort Worth, LLC BrookstoneA25A (5.3%)$74,601 ($4,211)$78,812 (16.1%)$341,494 ($65,625)$407,118
(5.3%)$74,601 ($4,211)$78,812 (16.1%)$341,494 ($65,625)$407,118Brookstone Dallas Fort Worth, LLC Total
Concessions Venture Ltd. Dallas Cowboys Pro ShopC27C (45.4%)$51,307 ($42,593)$93,900 (39.3%)$334,013 ($216,435)$550,448
(45.4%)$51,307 ($42,593)$93,900 (39.3%)$334,013 ($216,435)$550,448Concessions Venture Ltd. Total
Corliss Stone-Littles, LLC SwarovskiA24A (20.2%)$40,581 ($10,261)$50,842 (13.8%)$232,232 ($37,062)$269,294
(20.2%)$40,581 ($10,261)$50,842 (13.8%)$232,232 ($37,062)$269,294Corliss Stone-Littles, LLC Total
D & B Mitchell Group Gas Monkey / Fast and Loud KioskESE (100.0%)- ($13,750)$13,750 (100.0%)- ($58,980)$58,980
(100.0%)$0 ($13,750)$13,750 (100.0%)$0 ($58,980)$58,980D & B Mitchell Group Total
DFW-A Retail Partners, LLC soundbalanceA11A (2.9%)$112,897 ($3,355)$116,252 1.3%$460,062 $5,798$454,264
DFW-A Retail Partners, LLC InMotion EntertainmentA37A 46.3%$94,504 $29,927$64,577 492.4%$382,525 $317,948$64,577
14.7%$207,401 $26,573$180,828 62.4%$842,587 $323,746$518,840DFW-A Retail Partners, LLC Total
DFW-E Retail Partners, LLC InMotion EntertainmentB10B (2.7%)$80,011 ($2,259)$82,270 0.8%$305,560 $2,399$303,162
DFW-E Retail Partners, LLC InMotion EntertainmentC12C 16.1%$127,513 $17,716$109,797 10.1%$498,465 $45,905$452,560
DFW-E Retail Partners, LLC InMotion EntertainmentE15E (9.5%)$69,167 ($7,278)$76,445 8.3%$322,405 $24,777$297,628
DFW-E Retail Partners, LLC soundbalanceE33E 3.2%$36,556 $1,127$35,429 (7.8%)$159,700 ($13,450)$173,150
3.1%$313,246 $9,306$303,940 4.9%$1,286,131 $59,630$1,226,500DFW-E Retail Partners, LLC Total
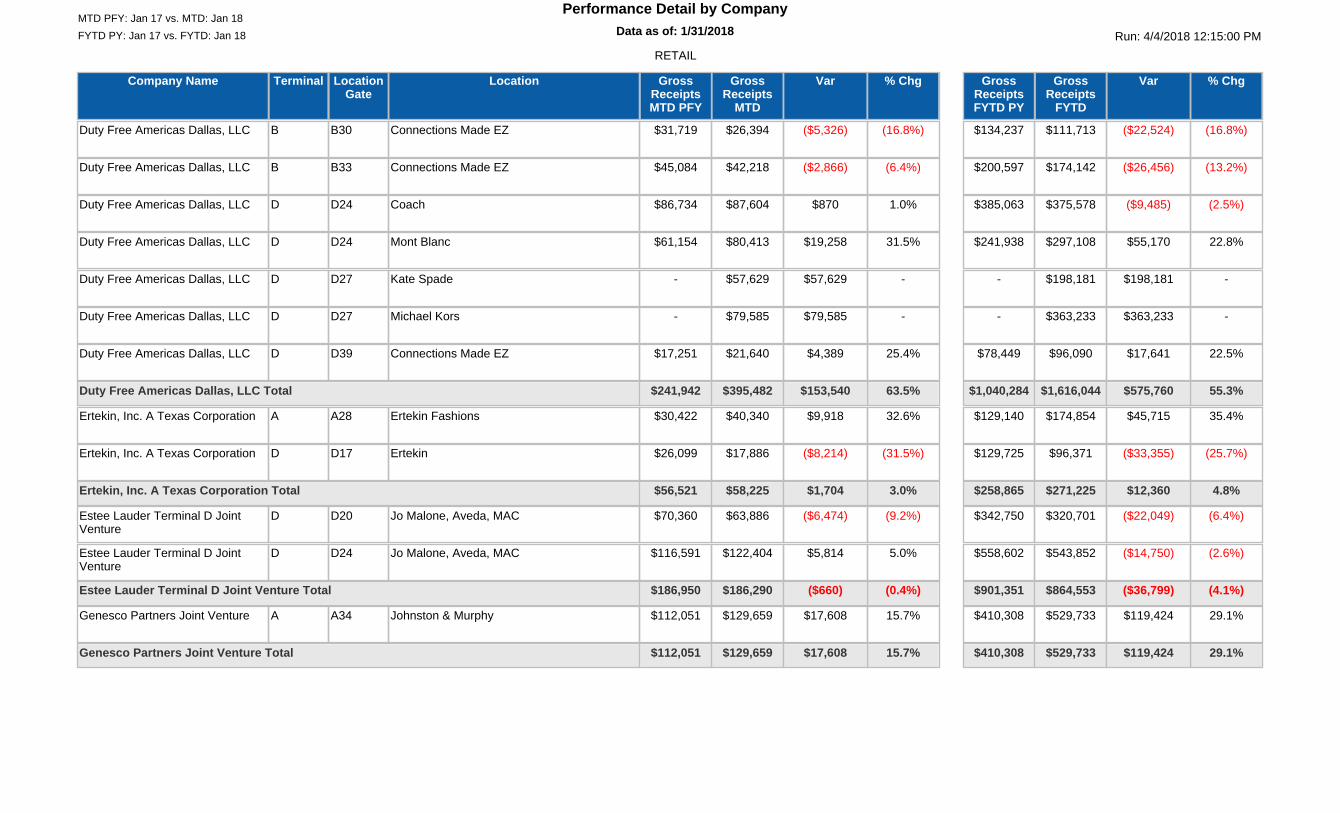
FYTD PY: Jan 17 vs. FYTD: Jan 18 Run: 4/4/2018 12:15:00 PMData as of: 1/31/201812:00:00 AM
Performance Detail by CompanyMTD PFY: Jan 17 vs. MTD: Jan 18
RETAIL
Company Name LocationLocationGate
Terminal % ChgGrossReceipts
MTD
VarGrossReceiptsMTD PFY
% ChgGrossReceipts
FYTD
VarGrossReceiptsFYTD PY
Duty Free Americas Dallas, LLC Connections Made EZB30B (16.8%)$26,394 ($5,326)$31,719 (16.8%)$111,713 ($22,524)$134,237
Duty Free Americas Dallas, LLC Connections Made EZB33B (6.4%)$42,218 ($2,866)$45,084 (13.2%)$174,142 ($26,456)$200,597
Duty Free Americas Dallas, LLC CoachD24D 1.0%$87,604 $870$86,734 (2.5%)$375,578 ($9,485)$385,063
Duty Free Americas Dallas, LLC Mont BlancD24D 31.5%$80,413 $19,258$61,154 22.8%$297,108 $55,170$241,938
Duty Free Americas Dallas, LLC Kate SpadeD27D -$57,629 $57,629- -$198,181 $198,181-
Duty Free Americas Dallas, LLC Michael KorsD27D -$79,585 $79,585- -$363,233 $363,233-
Duty Free Americas Dallas, LLC Connections Made EZD39D 25.4%$21,640 $4,389$17,251 22.5%$96,090 $17,641$78,449
63.5%$395,482 $153,540$241,942 55.3%$1,616,044 $575,760$1,040,284Duty Free Americas Dallas, LLC Total
Ertekin, Inc. A Texas Corporation Ertekin FashionsA28A 32.6%$40,340 $9,918$30,422 35.4%$174,854 $45,715$129,140
Ertekin, Inc. A Texas Corporation ErtekinD17D (31.5%)$17,886 ($8,214)$26,099 (25.7%)$96,371 ($33,355)$129,725
3.0%$58,225 $1,704$56,521 4.8%$271,225 $12,360$258,865Ertekin, Inc. A Texas Corporation Total
Estee Lauder Terminal D JointVenture
Jo Malone, Aveda, MACD20D (9.2%)$63,886 ($6,474)$70,360 (6.4%)$320,701 ($22,049)$342,750
Estee Lauder Terminal D JointVenture
Jo Malone, Aveda, MACD24D 5.0%$122,404 $5,814$116,591 (2.6%)$543,852 ($14,750)$558,602
(0.4%)$186,290 ($660)$186,950 (4.1%)$864,553 ($36,799)$901,351Estee Lauder Terminal D Joint Venture Total
Genesco Partners Joint Venture Johnston & MurphyA34A 15.7%$129,659 $17,608$112,051 29.1%$529,733 $119,424$410,308
15.7%$129,659 $17,608$112,051 29.1%$529,733 $119,424$410,308Genesco Partners Joint Venture Total
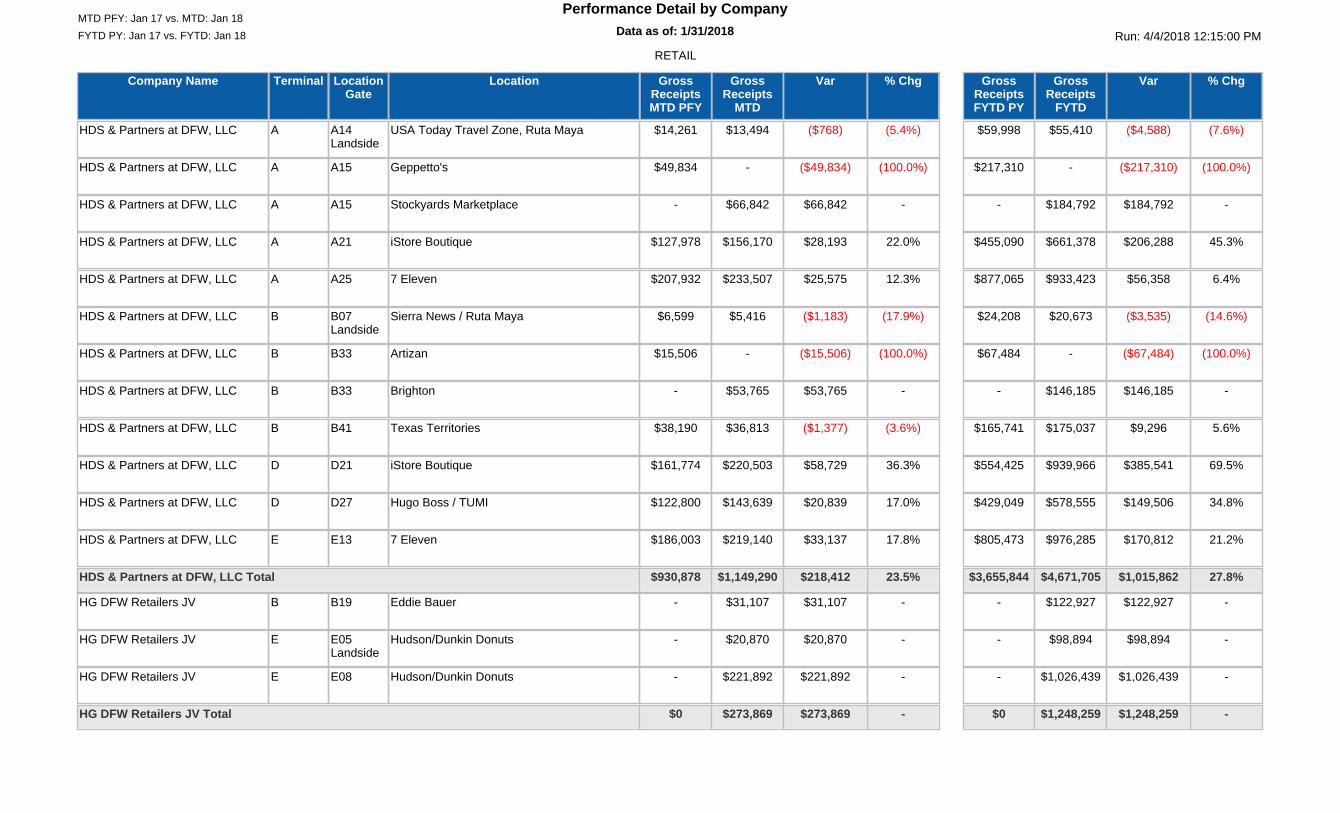
FYTD PY: Jan 17 vs. FYTD: Jan 18 Run: 4/4/2018 12:15:00 PMData as of: 1/31/201812:00:00 AM
Performance Detail by CompanyMTD PFY: Jan 17 vs. MTD: Jan 18
RETAIL
Company Name LocationLocationGate
Terminal % ChgGrossReceipts
MTD
VarGrossReceiptsMTD PFY
% ChgGrossReceipts
FYTD
VarGrossReceiptsFYTD PY
HDS & Partners at DFW, LLC USA Today Travel Zone, Ruta MayaA14Landside
A (5.4%)$13,494 ($768)$14,261 (7.6%)$55,410 ($4,588)$59,998
HDS & Partners at DFW, LLC Geppetto'sA15A (100.0%)- ($49,834)$49,834 (100.0%)- ($217,310)$217,310
HDS & Partners at DFW, LLC Stockyards MarketplaceA15A -$66,842 $66,842- -$184,792 $184,792-
HDS & Partners at DFW, LLC iStore BoutiqueA21A 22.0%$156,170 $28,193$127,978 45.3%$661,378 $206,288$455,090
HDS & Partners at DFW, LLC 7 ElevenA25A 12.3%$233,507 $25,575$207,932 6.4%$933,423 $56,358$877,065
HDS & Partners at DFW, LLC Sierra News / Ruta MayaB07Landside
B (17.9%)$5,416 ($1,183)$6,599 (14.6%)$20,673 ($3,535)$24,208
HDS & Partners at DFW, LLC ArtizanB33B (100.0%)- ($15,506)$15,506 (100.0%)- ($67,484)$67,484
HDS & Partners at DFW, LLC BrightonB33B -$53,765 $53,765- -$146,185 $146,185-
HDS & Partners at DFW, LLC Texas TerritoriesB41B (3.6%)$36,813 ($1,377)$38,190 5.6%$175,037 $9,296$165,741
HDS & Partners at DFW, LLC iStore BoutiqueD21D 36.3%$220,503 $58,729$161,774 69.5%$939,966 $385,541$554,425
HDS & Partners at DFW, LLC Hugo Boss / TUMID27D 17.0%$143,639 $20,839$122,800 34.8%$578,555 $149,506$429,049
HDS & Partners at DFW, LLC 7 ElevenE13E 17.8%$219,140 $33,137$186,003 21.2%$976,285 $170,812$805,473
23.5%$1,149,290 $218,412$930,878 27.8%$4,671,705 $1,015,862$3,655,844HDS & Partners at DFW, LLC Total
HG DFW Retailers JV Eddie BauerB19B -$31,107 $31,107- -$122,927 $122,927-
HG DFW Retailers JV Hudson/Dunkin DonutsE05Landside
E -$20,870 $20,870- -$98,894 $98,894-
HG DFW Retailers JV Hudson/Dunkin DonutsE08E -$221,892 $221,892- -$1,026,439 $1,026,439-
-$273,869 $273,869$0 -$1,248,259 $1,248,259$0HG DFW Retailers JV Total
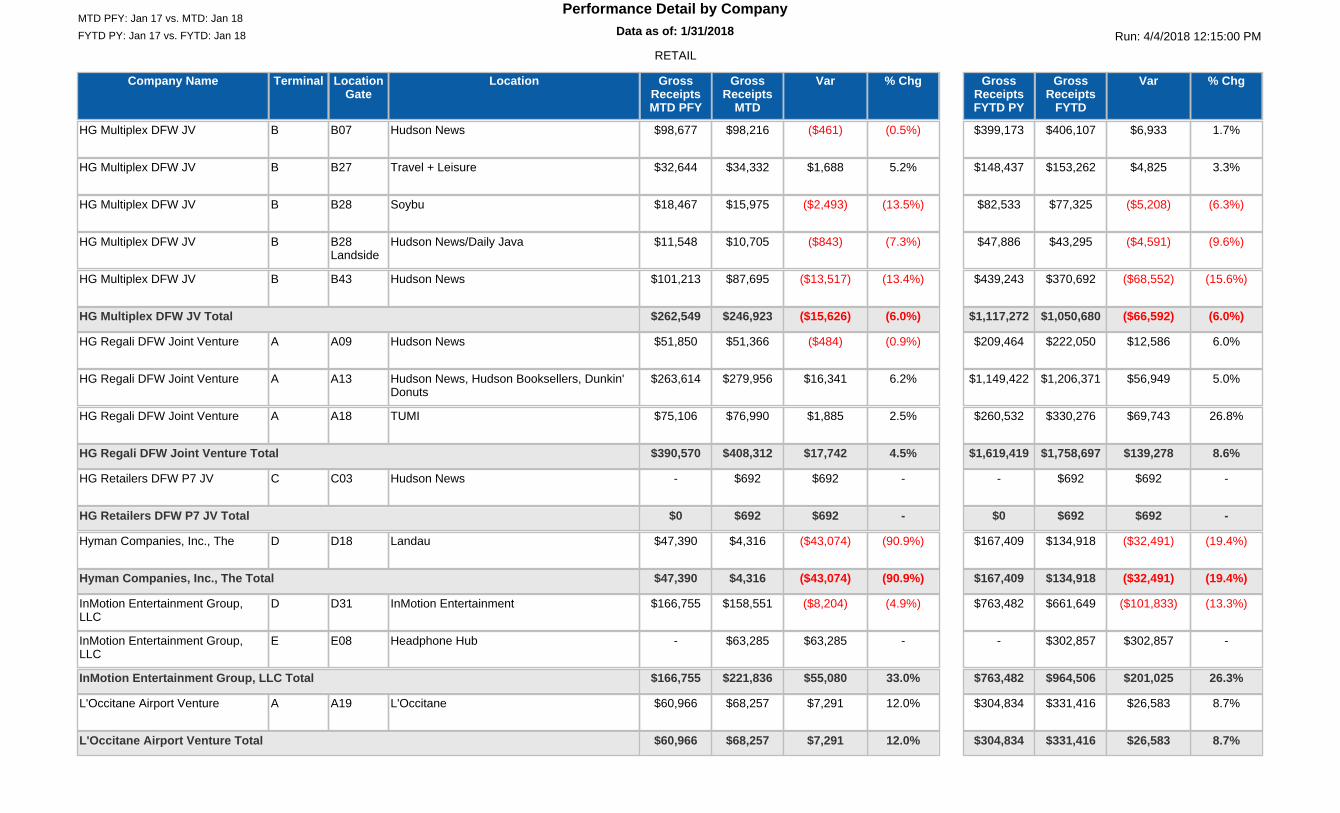
FYTD PY: Jan 17 vs. FYTD: Jan 18 Run: 4/4/2018 12:15:00 PMData as of: 1/31/201812:00:00 AM
Performance Detail by CompanyMTD PFY: Jan 17 vs. MTD: Jan 18
RETAIL
Company Name LocationLocationGate
Terminal % ChgGrossReceipts
MTD
VarGrossReceiptsMTD PFY
% ChgGrossReceipts
FYTD
VarGrossReceiptsFYTD PY
HG Multiplex DFW JV Hudson NewsB07B (0.5%)$98,216 ($461)$98,677 1.7%$406,107 $6,933$399,173
HG Multiplex DFW JV Travel + LeisureB27B 5.2%$34,332 $1,688$32,644 3.3%$153,262 $4,825$148,437
HG Multiplex DFW JV SoybuB28B (13.5%)$15,975 ($2,493)$18,467 (6.3%)$77,325 ($5,208)$82,533
HG Multiplex DFW JV Hudson News/Daily JavaB28Landside
B (7.3%)$10,705 ($843)$11,548 (9.6%)$43,295 ($4,591)$47,886
HG Multiplex DFW JV Hudson NewsB43B (13.4%)$87,695 ($13,517)$101,213 (15.6%)$370,692 ($68,552)$439,243
(6.0%)$246,923 ($15,626)$262,549 (6.0%)$1,050,680 ($66,592)$1,117,272HG Multiplex DFW JV Total
HG Regali DFW Joint Venture Hudson NewsA09A (0.9%)$51,366 ($484)$51,850 6.0%$222,050 $12,586$209,464
HG Regali DFW Joint Venture Hudson News, Hudson Booksellers, Dunkin'Donuts
A13A 6.2%$279,956 $16,341$263,614 5.0%$1,206,371 $56,949$1,149,422
HG Regali DFW Joint Venture TUMIA18A 2.5%$76,990 $1,885$75,106 26.8%$330,276 $69,743$260,532
4.5%$408,312 $17,742$390,570 8.6%$1,758,697 $139,278$1,619,419HG Regali DFW Joint Venture Total
HG Retailers DFW P7 JV Hudson NewsC03C -$692 $692- -$692 $692-
-$692 $692$0 -$692 $692$0HG Retailers DFW P7 JV Total
Hyman Companies, Inc., The LandauD18D (90.9%)$4,316 ($43,074)$47,390 (19.4%)$134,918 ($32,491)$167,409
(90.9%)$4,316 ($43,074)$47,390 (19.4%)$134,918 ($32,491)$167,409Hyman Companies, Inc., The Total
InMotion Entertainment Group,LLC
InMotion EntertainmentD31D (4.9%)$158,551 ($8,204)$166,755 (13.3%)$661,649 ($101,833)$763,482
InMotion Entertainment Group,LLC
Headphone HubE08E -$63,285 $63,285- -$302,857 $302,857-
33.0%$221,836 $55,080$166,755 26.3%$964,506 $201,025$763,482InMotion Entertainment Group, LLC Total
L'Occitane Airport Venture L'OccitaneA19A 12.0%$68,257 $7,291$60,966 8.7%$331,416 $26,583$304,834
12.0%$68,257 $7,291$60,966 8.7%$331,416 $26,583$304,834L'Occitane Airport Venture Total
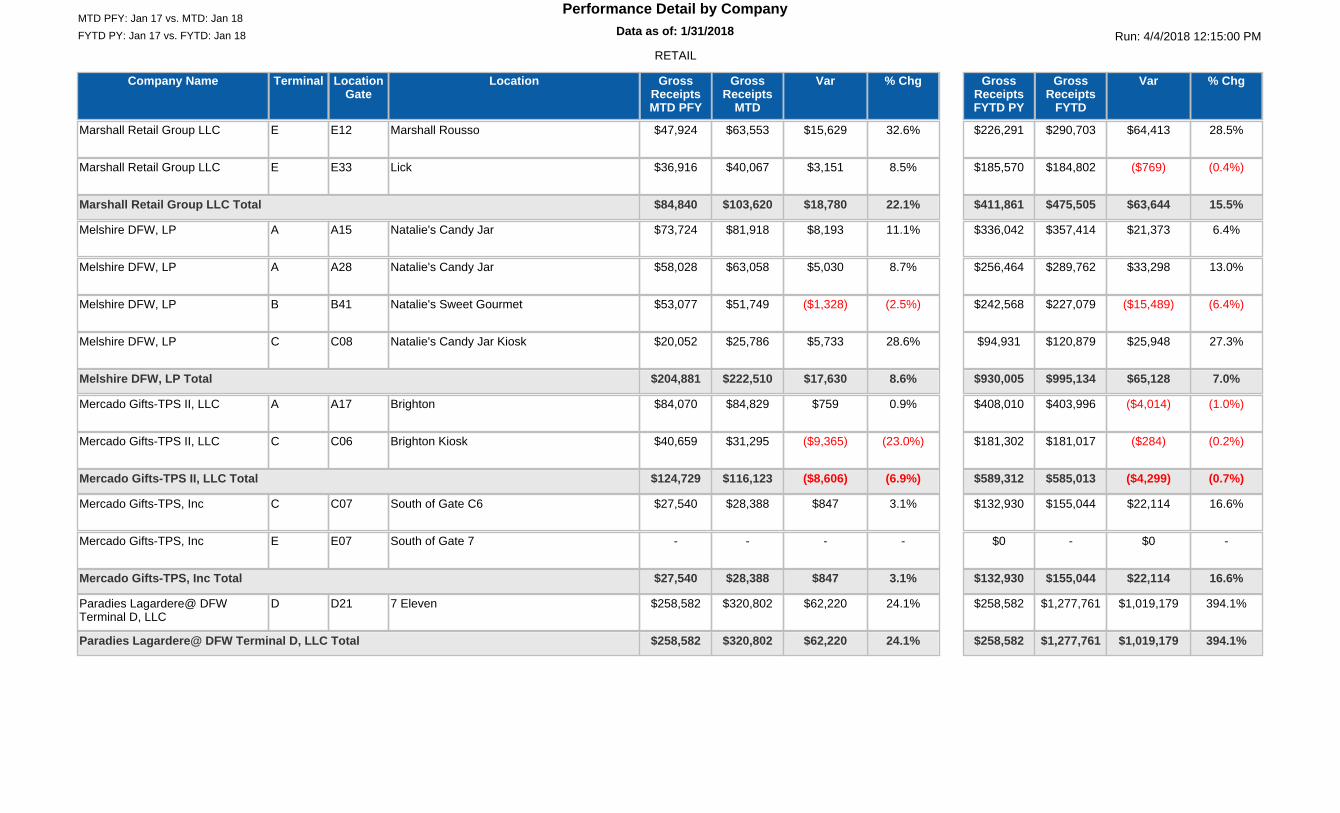
FYTD PY: Jan 17 vs. FYTD: Jan 18 Run: 4/4/2018 12:15:00 PMData as of: 1/31/201812:00:00 AM
Performance Detail by CompanyMTD PFY: Jan 17 vs. MTD: Jan 18
RETAIL
Company Name LocationLocationGate
Terminal % ChgGrossReceipts
MTD
VarGrossReceiptsMTD PFY
% ChgGrossReceipts
FYTD
VarGrossReceiptsFYTD PY
Marshall Retail Group LLC Marshall RoussoE12E 32.6%$63,553 $15,629$47,924 28.5%$290,703 $64,413$226,291
Marshall Retail Group LLC LickE33E 8.5%$40,067 $3,151$36,916 (0.4%)$184,802 ($769)$185,570
22.1%$103,620 $18,780$84,840 15.5%$475,505 $63,644$411,861Marshall Retail Group LLC Total
Melshire DFW, LP Natalie's Candy JarA15A 11.1%$81,918 $8,193$73,724 6.4%$357,414 $21,373$336,042
Melshire DFW, LP Natalie's Candy JarA28A 8.7%$63,058 $5,030$58,028 13.0%$289,762 $33,298$256,464
Melshire DFW, LP Natalie's Sweet GourmetB41B (2.5%)$51,749 ($1,328)$53,077 (6.4%)$227,079 ($15,489)$242,568
Melshire DFW, LP Natalie's Candy Jar KioskC08C 28.6%$25,786 $5,733$20,052 27.3%$120,879 $25,948$94,931
8.6%$222,510 $17,630$204,881 7.0%$995,134 $65,128$930,005Melshire DFW, LP Total
Mercado Gifts-TPS II, LLC BrightonA17A 0.9%$84,829 $759$84,070 (1.0%)$403,996 ($4,014)$408,010
Mercado Gifts-TPS II, LLC Brighton KioskC06C (23.0%)$31,295 ($9,365)$40,659 (0.2%)$181,017 ($284)$181,302
(6.9%)$116,123 ($8,606)$124,729 (0.7%)$585,013 ($4,299)$589,312Mercado Gifts-TPS II, LLC Total
Mercado Gifts-TPS, Inc South of Gate C6C07C 3.1%$28,388 $847$27,540 16.6%$155,044 $22,114$132,930
Mercado Gifts-TPS, Inc South of Gate 7E07E -- -- -- $0$0
3.1%$28,388 $847$27,540 16.6%$155,044 $22,114$132,930Mercado Gifts-TPS, Inc Total
Paradies Lagardere@ DFWTerminal D, LLC
7 ElevenD21D 24.1%$320,802 $62,220$258,582 394.1%$1,277,761 $1,019,179$258,582
24.1%$320,802 $62,220$258,582 394.1%$1,277,761 $1,019,179$258,582Paradies Lagardere@ DFW Terminal D, LLC Total
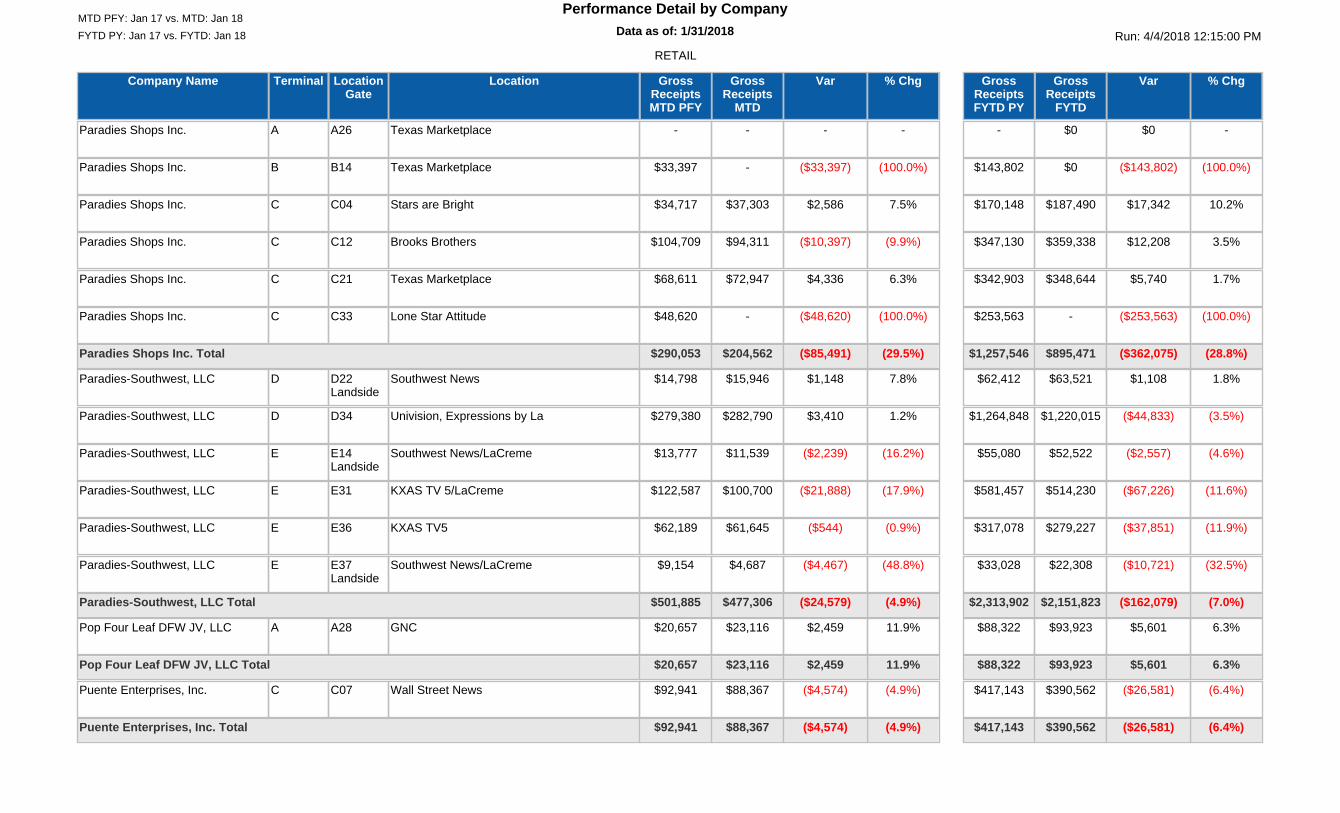
FYTD PY: Jan 17 vs. FYTD: Jan 18 Run: 4/4/2018 12:15:00 PMData as of: 1/31/201812:00:00 AM
Performance Detail by CompanyMTD PFY: Jan 17 vs. MTD: Jan 18
RETAIL
Company Name LocationLocationGate
Terminal % ChgGrossReceipts
MTD
VarGrossReceiptsMTD PFY
% ChgGrossReceipts
FYTD
VarGrossReceiptsFYTD PY
Paradies Shops Inc. Texas MarketplaceA26A -- -- -$0 $0-
Paradies Shops Inc. Texas MarketplaceB14B (100.0%)- ($33,397)$33,397 (100.0%)$0 ($143,802)$143,802
Paradies Shops Inc. Stars are BrightC04C 7.5%$37,303 $2,586$34,717 10.2%$187,490 $17,342$170,148
Paradies Shops Inc. Brooks BrothersC12C (9.9%)$94,311 ($10,397)$104,709 3.5%$359,338 $12,208$347,130
Paradies Shops Inc. Texas MarketplaceC21C 6.3%$72,947 $4,336$68,611 1.7%$348,644 $5,740$342,903
Paradies Shops Inc. Lone Star AttitudeC33C (100.0%)- ($48,620)$48,620 (100.0%)- ($253,563)$253,563
(29.5%)$204,562 ($85,491)$290,053 (28.8%)$895,471 ($362,075)$1,257,546Paradies Shops Inc. Total
Paradies-Southwest, LLC Southwest NewsD22Landside
D 7.8%$15,946 $1,148$14,798 1.8%$63,521 $1,108$62,412
Paradies-Southwest, LLC Univision, Expressions by LaD34D 1.2%$282,790 $3,410$279,380 (3.5%)$1,220,015 ($44,833)$1,264,848
Paradies-Southwest, LLC Southwest News/LaCremeE14Landside
E (16.2%)$11,539 ($2,239)$13,777 (4.6%)$52,522 ($2,557)$55,080
Paradies-Southwest, LLC KXAS TV 5/LaCremeE31E (17.9%)$100,700 ($21,888)$122,587 (11.6%)$514,230 ($67,226)$581,457
Paradies-Southwest, LLC KXAS TV5E36E (0.9%)$61,645 ($544)$62,189 (11.9%)$279,227 ($37,851)$317,078
Paradies-Southwest, LLC Southwest News/LaCremeE37Landside
E (48.8%)$4,687 ($4,467)$9,154 (32.5%)$22,308 ($10,721)$33,028
(4.9%)$477,306 ($24,579)$501,885 (7.0%)$2,151,823 ($162,079)$2,313,902Paradies-Southwest, LLC Total
Pop Four Leaf DFW JV, LLC GNCA28A 11.9%$23,116 $2,459$20,657 6.3%$93,923 $5,601$88,322
11.9%$23,116 $2,459$20,657 6.3%$93,923 $5,601$88,322Pop Four Leaf DFW JV, LLC Total
Puente Enterprises, Inc. Wall Street NewsC07C (4.9%)$88,367 ($4,574)$92,941 (6.4%)$390,562 ($26,581)$417,143
(4.9%)$88,367 ($4,574)$92,941 (6.4%)$390,562 ($26,581)$417,143Puente Enterprises, Inc. Total

FYTD PY: Jan 17 vs. FYTD: Jan 18 Run: 4/4/2018 12:15:00 PMData as of: 1/31/201812:00:00 AM
Performance Detail by CompanyMTD PFY: Jan 17 vs. MTD: Jan 18
RETAIL
Company Name LocationLocationGate
Terminal % ChgGrossReceipts
MTD
VarGrossReceiptsMTD PFY
% ChgGrossReceipts
FYTD
VarGrossReceiptsFYTD PY
Quintanilla Technologies, Inc Sierra NewsC30C (22.7%)$122,729 ($36,135)$158,864 (22.2%)$538,900 ($154,037)$692,937
Quintanilla Technologies, Inc Sierra NewsE08E -- $0$0 -- $0$0
Quintanilla Technologies, Inc Sierra NewsE31E -- $0$0 -- $0$0
(22.7%)$122,729 ($36,135)$158,864 (22.2%)$538,900 ($154,037)$692,937Quintanilla Technologies, Inc Total
RQ-Cowboys Joint Venture Dallas Cowboys Pro ShopD23D (100.0%)- ($106,516)$106,516 (100.0%)- ($587,089)$587,089
(100.0%)$0 ($106,516)$106,516 (100.0%)$0 ($587,089)$587,089RQ-Cowboys Joint Venture Total
Southwest Concessions, Inc. Southwest NewsA34A 6.3%$181,165 $10,776$170,388 35.5%$858,347 $224,775$633,572
Southwest Concessions, Inc. Southwest NewsA34Landside
A 106.3%$8,807 $4,538$4,269 871.9%$41,493 $37,224$4,269
Southwest Concessions, Inc. Southwest NewsA39A -$23,123 $23,123- -$92,393 $92,393-
22.0%$213,095 $38,437$174,658 55.6%$992,234 $354,392$637,842Southwest Concessions, Inc. Total
Team Retail J V / Dallas, a TexasGP
Dallas Cowboys Pro ShopA33A (52.2%)$65,983 ($72,032)$138,015 (29.0%)$472,922 ($193,114)$666,036
Team Retail J V / Dallas, a TexasGP
Cowboys PinkD10D 27.0%$34,279 $7,279$26,999 31.6%$189,221 $45,477$143,744
(39.2%)$100,262 ($64,753)$165,014 (18.2%)$662,143 ($147,637)$809,780Team Retail J V / Dallas, a Texas GP Total

FYTD PY: Jan 17 vs. FYTD: Jan 18 Run: 4/4/2018 12:15:00 PMData as of: 1/31/201812:00:00 AM
Performance Detail by CompanyMTD PFY: Jan 17 vs. MTD: Jan 18
RETAIL
Company Name LocationLocationGate
Terminal % ChgGrossReceipts
MTD
VarGrossReceiptsMTD PFY
% ChgGrossReceipts
FYTD
VarGrossReceiptsFYTD PY
The Jethro Pugh Shops II, LLC TeavanaA16A (13.0%)$28,555 ($4,279)$32,834 7.3%$138,532 $9,451$129,081
The Jethro Pugh Shops II, LLC CNBC NewsA20A 2.6%$224,863 $5,646$219,217 9.3%$1,002,565 $84,897$917,667
The Jethro Pugh Shops II, LLC CNBC News KioskA21A -- -- -- $0$0
The Jethro Pugh Shops II, LLC Texas MarketplaceB10B 14.8%$41,647 $5,364$36,283 19.9%$194,649 $32,265$162,384
The Jethro Pugh Shops II, LLC DFW News KioskC02C (28.5%)$17,692 ($7,041)$24,733 9.2%$102,696 $8,690$94,006
The Jethro Pugh Shops II, LLC L'OccitaneD33D (4.7%)$61,171 ($3,026)$64,197 (10.9%)$289,992 ($35,599)$325,591
The Jethro Pugh Shops II, LLC The RangeD37D (11.4%)$43,372 ($5,574)$48,946 (9.8%)$206,537 ($22,444)$228,981
The Jethro Pugh Shops II, LLC Texas MarketplaceE15E 7.3%$110,338 $7,490$102,848 24.0%$581,061 $112,389$468,672
The Jethro Pugh Shops II, LLC Lone Star AttitudeE34E 26.1%$19,568 $4,046$15,522 7.9%$104,532 $7,688$96,845
The Jethro Pugh Shops II, LLC DFW NewsESE (100.0%)- ($151,715)$151,715 (97.7%)$15,052 ($632,052)$647,104
(21.4%)$547,206 ($149,088)$696,294 (14.2%)$2,635,615 ($434,714)$3,070,329The Jethro Pugh Shops II, LLC Total
The Jethro Pugh Shops III, LLC Dylan's Candy BarD14D (5.6%)$47,338 ($2,832)$50,170 (2.9%)$234,627 ($7,030)$241,657
(5.6%)$47,338 ($2,832)$50,170 (2.9%)$234,627 ($7,030)$241,657The Jethro Pugh Shops III, LLC Total
TRG Duty Free Joint Venture South Duty FreeD11D (34.1%)$181,511 ($93,922)$275,433 (7.4%)$1,155,927 ($92,211)$1,248,138
TRG Duty Free Joint Venture Timeless TravelD16D (64.4%)$9,491 ($17,187)$26,679 (56.4%)$51,191 ($66,273)$117,464
TRG Duty Free Joint Venture Center Duty FreeD22D -$678,973 $678,973- -$985,472 $985,472-
TRG Duty Free Joint Venture North Duty FreeD34D (25.9%)$428,959 ($150,165)$579,124 (4.7%)$2,431,478 ($120,056)$2,551,534
47.4%$1,298,934 $417,699$881,236 18.0%$4,624,068 $706,932$3,917,136TRG Duty Free Joint Venture Total
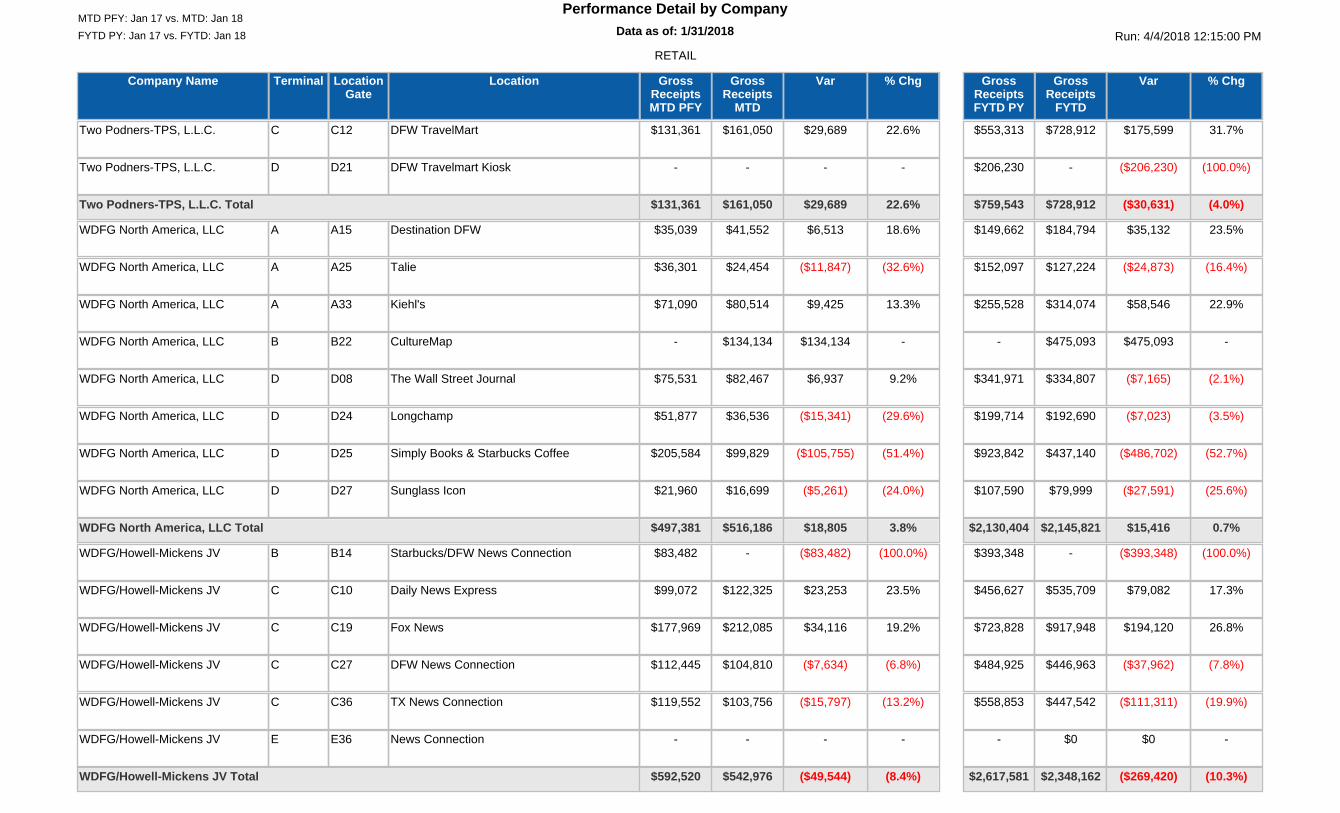
FYTD PY: Jan 17 vs. FYTD: Jan 18 Run: 4/4/2018 12:15:00 PMData as of: 1/31/201812:00:00 AM
Performance Detail by CompanyMTD PFY: Jan 17 vs. MTD: Jan 18
RETAIL
Company Name LocationLocationGate
Terminal % ChgGrossReceipts
MTD
VarGrossReceiptsMTD PFY
% ChgGrossReceipts
FYTD
VarGrossReceiptsFYTD PY
Two Podners-TPS, L.L.C. DFW TravelMartC12C 22.6%$161,050 $29,689$131,361 31.7%$728,912 $175,599$553,313
Two Podners-TPS, L.L.C. DFW Travelmart KioskD21D -- -- (100.0%)- ($206,230)$206,230
22.6%$161,050 $29,689$131,361 (4.0%)$728,912 ($30,631)$759,543Two Podners-TPS, L.L.C. Total
WDFG North America, LLC Destination DFWA15A 18.6%$41,552 $6,513$35,039 23.5%$184,794 $35,132$149,662
WDFG North America, LLC TalieA25A (32.6%)$24,454 ($11,847)$36,301 (16.4%)$127,224 ($24,873)$152,097
WDFG North America, LLC Kiehl'sA33A 13.3%$80,514 $9,425$71,090 22.9%$314,074 $58,546$255,528
WDFG North America, LLC CultureMapB22B -$134,134 $134,134- -$475,093 $475,093-
WDFG North America, LLC The Wall Street JournalD08D 9.2%$82,467 $6,937$75,531 (2.1%)$334,807 ($7,165)$341,971
WDFG North America, LLC LongchampD24D (29.6%)$36,536 ($15,341)$51,877 (3.5%)$192,690 ($7,023)$199,714
WDFG North America, LLC Simply Books & Starbucks CoffeeD25D (51.4%)$99,829 ($105,755)$205,584 (52.7%)$437,140 ($486,702)$923,842
WDFG North America, LLC Sunglass IconD27D (24.0%)$16,699 ($5,261)$21,960 (25.6%)$79,999 ($27,591)$107,590
3.8%$516,186 $18,805$497,381 0.7%$2,145,821 $15,416$2,130,404WDFG North America, LLC Total
WDFG/Howell-Mickens JV Starbucks/DFW News ConnectionB14B (100.0%)- ($83,482)$83,482 (100.0%)- ($393,348)$393,348
WDFG/Howell-Mickens JV Daily News ExpressC10C 23.5%$122,325 $23,253$99,072 17.3%$535,709 $79,082$456,627
WDFG/Howell-Mickens JV Fox NewsC19C 19.2%$212,085 $34,116$177,969 26.8%$917,948 $194,120$723,828
WDFG/Howell-Mickens JV DFW News ConnectionC27C (6.8%)$104,810 ($7,634)$112,445 (7.8%)$446,963 ($37,962)$484,925
WDFG/Howell-Mickens JV TX News ConnectionC36C (13.2%)$103,756 ($15,797)$119,552 (19.9%)$447,542 ($111,311)$558,853
WDFG/Howell-Mickens JV News ConnectionE36E -- -- -$0 $0-
(8.4%)$542,976 ($49,544)$592,520 (10.3%)$2,348,162 ($269,420)$2,617,581WDFG/Howell-Mickens JV Total

FYTD PY: Jan 17 vs. FYTD: Jan 18 Run: 4/4/2018 12:15:00 PMData as of: 1/31/201812:00:00 AM
Performance Detail by CompanyMTD PFY: Jan 17 vs. MTD: Jan 18
RETAIL
Company Name LocationLocationGate
Terminal % ChgGrossReceipts
MTD
VarGrossReceiptsMTD PFY
% ChgGrossReceipts
FYTD
VarGrossReceiptsFYTD PY
XpresSpa DFW Kiosk, LLC XpresSpa KioskESE (100.0%)- ($6,188)$6,188 (100.0%)- ($28,004)$28,004
(100.0%)$0 ($6,188)$6,188 (100.0%)$0 ($28,004)$28,004XpresSpa DFW Kiosk, LLC Total
8.6%$9,086,165 $722,242$8,363,924 9.2%$38,955,147 $3,271,200$35,683,947RETAIL Total
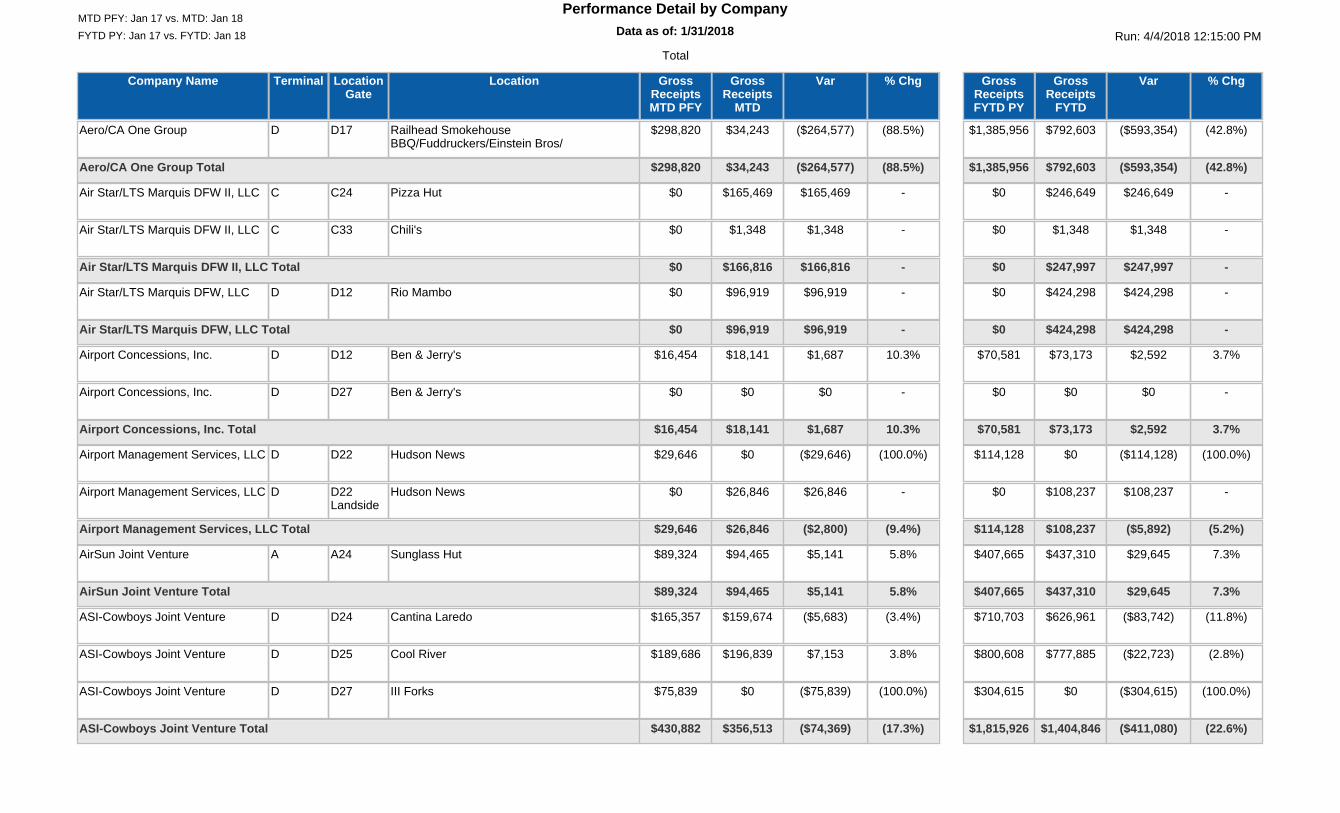
FYTD PY: Jan 17 vs. FYTD: Jan 18 Run: 4/4/2018 12:15:00 PMData as of: 1/31/201812:00:00 AM
Performance Detail by CompanyMTD PFY: Jan 17 vs. MTD: Jan 18
Total
Company Name LocationLocationGate
Terminal % ChgGrossReceipts
MTD
VarGrossReceiptsMTD PFY
% ChgGrossReceipts
FYTD
VarGrossReceiptsFYTD PY
Aero/CA One Group Railhead SmokehouseBBQ/Fuddruckers/Einstein Bros/
D17D (88.5%)$34,243 ($264,577)$298,820 (42.8%)$792,603 ($593,354)$1,385,956
(88.5%)$34,243 ($264,577)$298,820 (42.8%)$792,603 ($593,354)$1,385,956Aero/CA One Group Total
Air Star/LTS Marquis DFW II, LLC Pizza HutC24C -$165,469 $165,469$0 -$246,649 $246,649$0
Air Star/LTS Marquis DFW II, LLC Chili'sC33C -$1,348 $1,348$0 -$1,348 $1,348$0
-$166,816 $166,816$0 -$247,997 $247,997$0Air Star/LTS Marquis DFW II, LLC Total
Air Star/LTS Marquis DFW, LLC Rio MamboD12D -$96,919 $96,919$0 -$424,298 $424,298$0
-$96,919 $96,919$0 -$424,298 $424,298$0Air Star/LTS Marquis DFW, LLC Total
Airport Concessions, Inc. Ben & Jerry'sD12D 10.3%$18,141 $1,687$16,454 3.7%$73,173 $2,592$70,581
Airport Concessions, Inc. Ben & Jerry'sD27D -$0 $0$0 -$0 $0$0
10.3%$18,141 $1,687$16,454 3.7%$73,173 $2,592$70,581Airport Concessions, Inc. Total
Airport Management Services, LLC Hudson NewsD22D (100.0%)$0 ($29,646)$29,646 (100.0%)$0 ($114,128)$114,128
Airport Management Services, LLC Hudson NewsD22Landside
D -$26,846 $26,846$0 -$108,237 $108,237$0
(9.4%)$26,846 ($2,800)$29,646 (5.2%)$108,237 ($5,892)$114,128Airport Management Services, LLC Total
AirSun Joint Venture Sunglass HutA24A 5.8%$94,465 $5,141$89,324 7.3%$437,310 $29,645$407,665
5.8%$94,465 $5,141$89,324 7.3%$437,310 $29,645$407,665AirSun Joint Venture Total
ASI-Cowboys Joint Venture Cantina LaredoD24D (3.4%)$159,674 ($5,683)$165,357 (11.8%)$626,961 ($83,742)$710,703
ASI-Cowboys Joint Venture Cool RiverD25D 3.8%$196,839 $7,153$189,686 (2.8%)$777,885 ($22,723)$800,608
ASI-Cowboys Joint Venture III ForksD27D (100.0%)$0 ($75,839)$75,839 (100.0%)$0 ($304,615)$304,615
(17.3%)$356,513 ($74,369)$430,882 (22.6%)$1,404,846 ($411,080)$1,815,926ASI-Cowboys Joint Venture Total
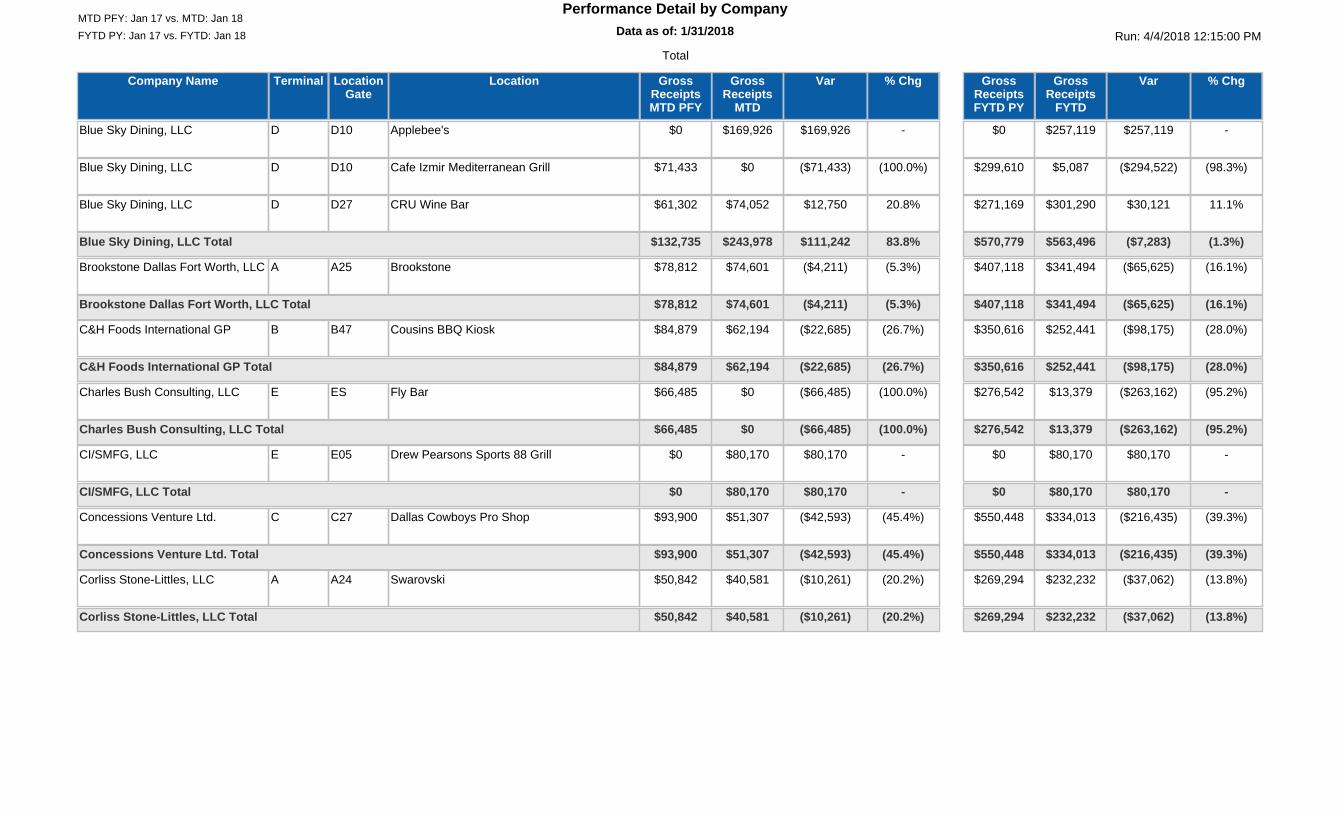
FYTD PY: Jan 17 vs. FYTD: Jan 18 Run: 4/4/2018 12:15:00 PMData as of: 1/31/201812:00:00 AM
Performance Detail by CompanyMTD PFY: Jan 17 vs. MTD: Jan 18
Total
Company Name LocationLocationGate
Terminal % ChgGrossReceipts
MTD
VarGrossReceiptsMTD PFY
% ChgGrossReceipts
FYTD
VarGrossReceiptsFYTD PY
Blue Sky Dining, LLC Applebee'sD10D -$169,926 $169,926$0 -$257,119 $257,119$0
Blue Sky Dining, LLC Cafe Izmir Mediterranean GrillD10D (100.0%)$0 ($71,433)$71,433 (98.3%)$5,087 ($294,522)$299,610
Blue Sky Dining, LLC CRU Wine BarD27D 20.8%$74,052 $12,750$61,302 11.1%$301,290 $30,121$271,169
83.8%$243,978 $111,242$132,735 (1.3%)$563,496 ($7,283)$570,779Blue Sky Dining, LLC Total
Brookstone Dallas Fort Worth, LLC BrookstoneA25A (5.3%)$74,601 ($4,211)$78,812 (16.1%)$341,494 ($65,625)$407,118
(5.3%)$74,601 ($4,211)$78,812 (16.1%)$341,494 ($65,625)$407,118Brookstone Dallas Fort Worth, LLC Total
C&H Foods International GP Cousins BBQ KioskB47B (26.7%)$62,194 ($22,685)$84,879 (28.0%)$252,441 ($98,175)$350,616
(26.7%)$62,194 ($22,685)$84,879 (28.0%)$252,441 ($98,175)$350,616C&H Foods International GP Total
Charles Bush Consulting, LLC Fly BarESE (100.0%)$0 ($66,485)$66,485 (95.2%)$13,379 ($263,162)$276,542
(100.0%)$0 ($66,485)$66,485 (95.2%)$13,379 ($263,162)$276,542Charles Bush Consulting, LLC Total
CI/SMFG, LLC Drew Pearsons Sports 88 GrillE05E -$80,170 $80,170$0 -$80,170 $80,170$0
-$80,170 $80,170$0 -$80,170 $80,170$0CI/SMFG, LLC Total
Concessions Venture Ltd. Dallas Cowboys Pro ShopC27C (45.4%)$51,307 ($42,593)$93,900 (39.3%)$334,013 ($216,435)$550,448
(45.4%)$51,307 ($42,593)$93,900 (39.3%)$334,013 ($216,435)$550,448Concessions Venture Ltd. Total
Corliss Stone-Littles, LLC SwarovskiA24A (20.2%)$40,581 ($10,261)$50,842 (13.8%)$232,232 ($37,062)$269,294
(20.2%)$40,581 ($10,261)$50,842 (13.8%)$232,232 ($37,062)$269,294Corliss Stone-Littles, LLC Total
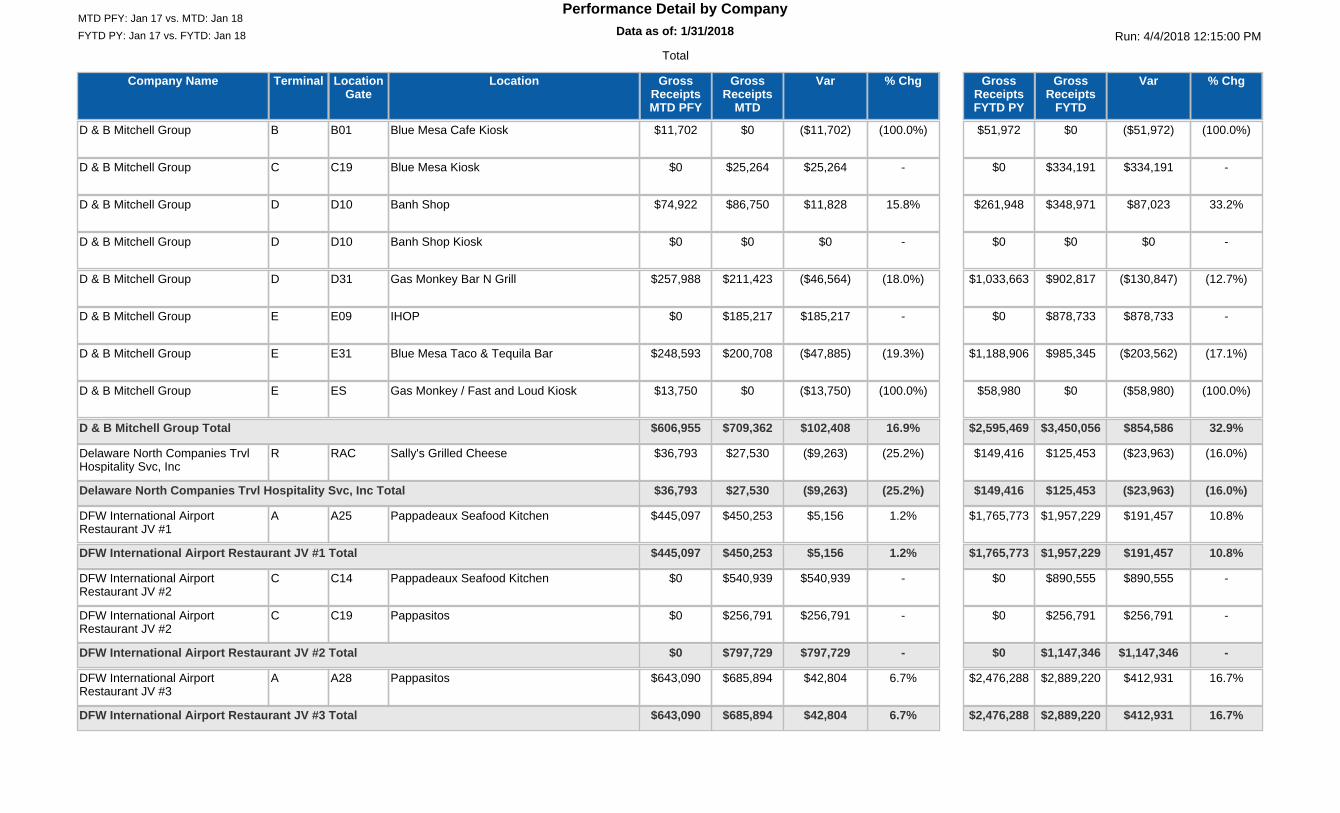
FYTD PY: Jan 17 vs. FYTD: Jan 18 Run: 4/4/2018 12:15:00 PMData as of: 1/31/201812:00:00 AM
Performance Detail by CompanyMTD PFY: Jan 17 vs. MTD: Jan 18
Total
Company Name LocationLocationGate
Terminal % ChgGrossReceipts
MTD
VarGrossReceiptsMTD PFY
% ChgGrossReceipts
FYTD
VarGrossReceiptsFYTD PY
D & B Mitchell Group Blue Mesa Cafe KioskB01B (100.0%)$0 ($11,702)$11,702 (100.0%)$0 ($51,972)$51,972
D & B Mitchell Group Blue Mesa KioskC19C -$25,264 $25,264$0 -$334,191 $334,191$0
D & B Mitchell Group Banh ShopD10D 15.8%$86,750 $11,828$74,922 33.2%$348,971 $87,023$261,948
D & B Mitchell Group Banh Shop KioskD10D -$0 $0$0 -$0 $0$0
D & B Mitchell Group Gas Monkey Bar N GrillD31D (18.0%)$211,423 ($46,564)$257,988 (12.7%)$902,817 ($130,847)$1,033,663
D & B Mitchell Group IHOPE09E -$185,217 $185,217$0 -$878,733 $878,733$0
D & B Mitchell Group Blue Mesa Taco & Tequila BarE31E (19.3%)$200,708 ($47,885)$248,593 (17.1%)$985,345 ($203,562)$1,188,906
D & B Mitchell Group Gas Monkey / Fast and Loud KioskESE (100.0%)$0 ($13,750)$13,750 (100.0%)$0 ($58,980)$58,980
16.9%$709,362 $102,408$606,955 32.9%$3,450,056 $854,586$2,595,469D & B Mitchell Group Total
Delaware North Companies TrvlHospitality Svc, Inc
Sally's Grilled CheeseRACR (25.2%)$27,530 ($9,263)$36,793 (16.0%)$125,453 ($23,963)$149,416
(25.2%)$27,530 ($9,263)$36,793 (16.0%)$125,453 ($23,963)$149,416Delaware North Companies Trvl Hospitality Svc, Inc Total
DFW International AirportRestaurant JV #1
Pappadeaux Seafood KitchenA25A 1.2%$450,253 $5,156$445,097 10.8%$1,957,229 $191,457$1,765,773
1.2%$450,253 $5,156$445,097 10.8%$1,957,229 $191,457$1,765,773DFW International Airport Restaurant JV #1 Total
DFW International AirportRestaurant JV #2
Pappadeaux Seafood KitchenC14C -$540,939 $540,939$0 -$890,555 $890,555$0
DFW International AirportRestaurant JV #2
PappasitosC19C -$256,791 $256,791$0 -$256,791 $256,791$0
-$797,729 $797,729$0 -$1,147,346 $1,147,346$0DFW International Airport Restaurant JV #2 Total
DFW International AirportRestaurant JV #3
PappasitosA28A 6.7%$685,894 $42,804$643,090 16.7%$2,889,220 $412,931$2,476,288
6.7%$685,894 $42,804$643,090 16.7%$2,889,220 $412,931$2,476,288DFW International Airport Restaurant JV #3 Total
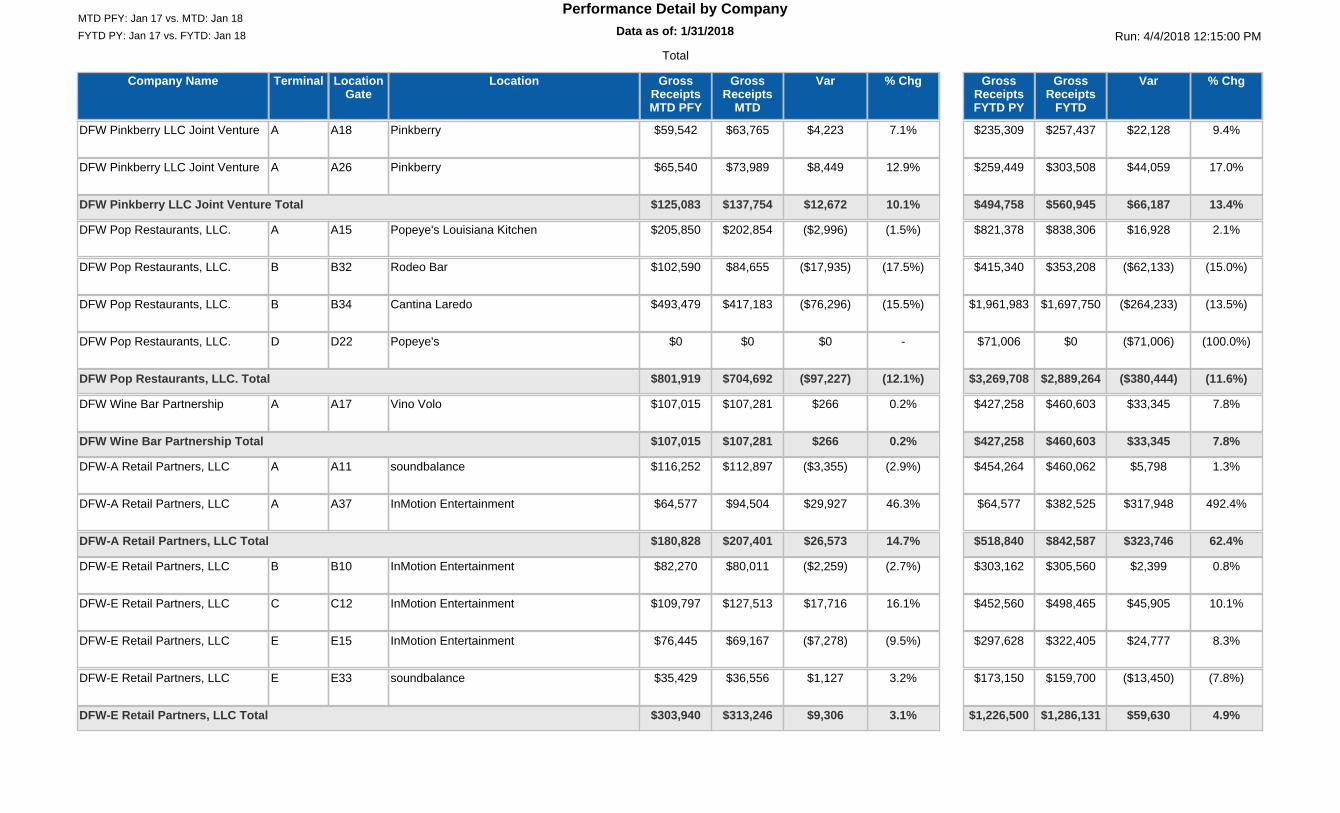
FYTD PY: Jan 17 vs. FYTD: Jan 18 Run: 4/4/2018 12:15:00 PMData as of: 1/31/201812:00:00 AM
Performance Detail by CompanyMTD PFY: Jan 17 vs. MTD: Jan 18
Total
Company Name LocationLocationGate
Terminal % ChgGrossReceipts
MTD
VarGrossReceiptsMTD PFY
% ChgGrossReceipts
FYTD
VarGrossReceiptsFYTD PY
DFW Pinkberry LLC Joint Venture PinkberryA18A 7.1%$63,765 $4,223$59,542 9.4%$257,437 $22,128$235,309
DFW Pinkberry LLC Joint Venture PinkberryA26A 12.9%$73,989 $8,449$65,540 17.0%$303,508 $44,059$259,449
10.1%$137,754 $12,672$125,083 13.4%$560,945 $66,187$494,758DFW Pinkberry LLC Joint Venture Total
DFW Pop Restaurants, LLC. Popeye's Louisiana KitchenA15A (1.5%)$202,854 ($2,996)$205,850 2.1%$838,306 $16,928$821,378
DFW Pop Restaurants, LLC. Rodeo BarB32B (17.5%)$84,655 ($17,935)$102,590 (15.0%)$353,208 ($62,133)$415,340
DFW Pop Restaurants, LLC. Cantina LaredoB34B (15.5%)$417,183 ($76,296)$493,479 (13.5%)$1,697,750 ($264,233)$1,961,983
DFW Pop Restaurants, LLC. Popeye'sD22D -$0 $0$0 (100.0%)$0 ($71,006)$71,006
(12.1%)$704,692 ($97,227)$801,919 (11.6%)$2,889,264 ($380,444)$3,269,708DFW Pop Restaurants, LLC. Total
DFW Wine Bar Partnership Vino VoloA17A 0.2%$107,281 $266$107,015 7.8%$460,603 $33,345$427,258
0.2%$107,281 $266$107,015 7.8%$460,603 $33,345$427,258DFW Wine Bar Partnership Total
DFW-A Retail Partners, LLC soundbalanceA11A (2.9%)$112,897 ($3,355)$116,252 1.3%$460,062 $5,798$454,264
DFW-A Retail Partners, LLC InMotion EntertainmentA37A 46.3%$94,504 $29,927$64,577 492.4%$382,525 $317,948$64,577
14.7%$207,401 $26,573$180,828 62.4%$842,587 $323,746$518,840DFW-A Retail Partners, LLC Total
DFW-E Retail Partners, LLC InMotion EntertainmentB10B (2.7%)$80,011 ($2,259)$82,270 0.8%$305,560 $2,399$303,162
DFW-E Retail Partners, LLC InMotion EntertainmentC12C 16.1%$127,513 $17,716$109,797 10.1%$498,465 $45,905$452,560
DFW-E Retail Partners, LLC InMotion EntertainmentE15E (9.5%)$69,167 ($7,278)$76,445 8.3%$322,405 $24,777$297,628
DFW-E Retail Partners, LLC soundbalanceE33E 3.2%$36,556 $1,127$35,429 (7.8%)$159,700 ($13,450)$173,150
3.1%$313,246 $9,306$303,940 4.9%$1,286,131 $59,630$1,226,500DFW-E Retail Partners, LLC Total
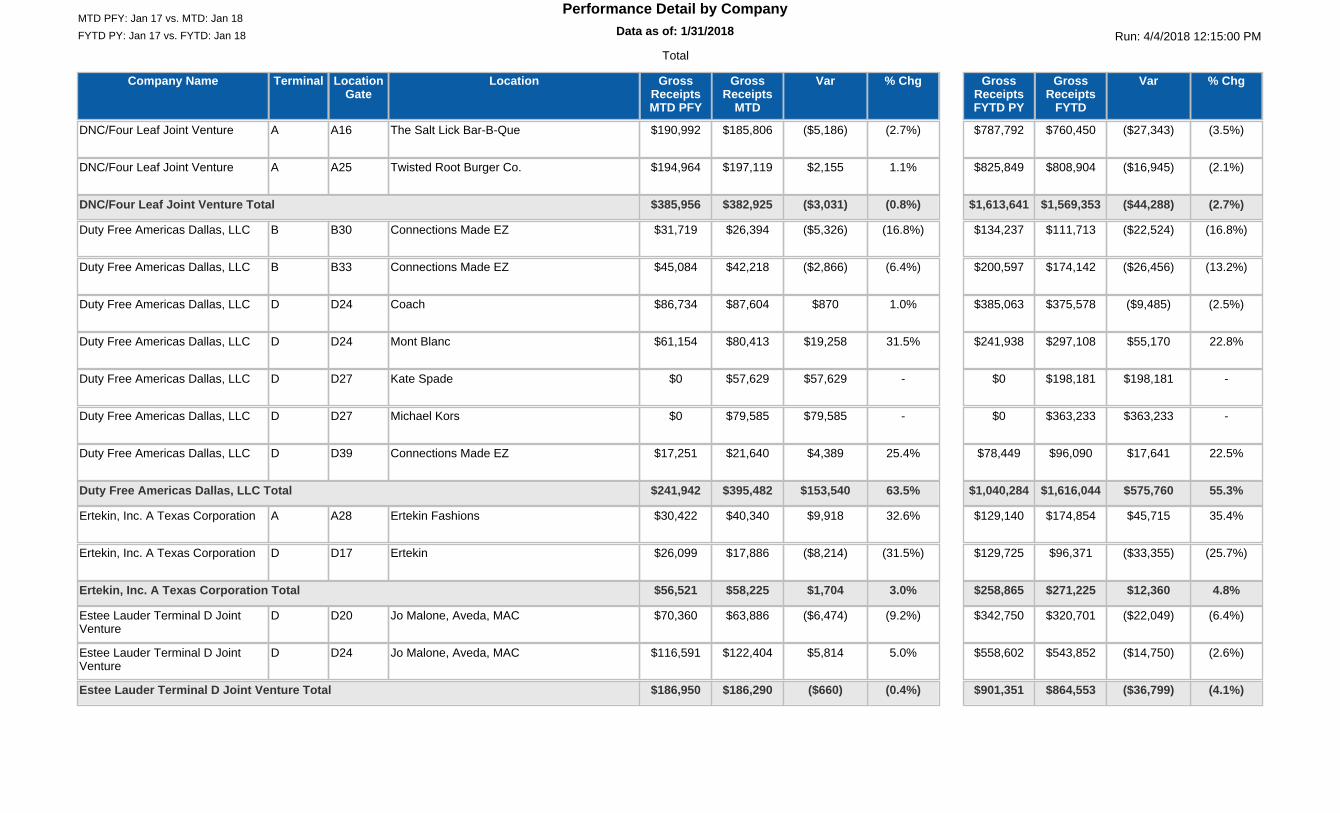
FYTD PY: Jan 17 vs. FYTD: Jan 18 Run: 4/4/2018 12:15:00 PMData as of: 1/31/201812:00:00 AM
Performance Detail by CompanyMTD PFY: Jan 17 vs. MTD: Jan 18
Total
Company Name LocationLocationGate
Terminal % ChgGrossReceipts
MTD
VarGrossReceiptsMTD PFY
% ChgGrossReceipts
FYTD
VarGrossReceiptsFYTD PY
DNC/Four Leaf Joint Venture The Salt Lick Bar-B-QueA16A (2.7%)$185,806 ($5,186)$190,992 (3.5%)$760,450 ($27,343)$787,792
DNC/Four Leaf Joint Venture Twisted Root Burger Co.A25A 1.1%$197,119 $2,155$194,964 (2.1%)$808,904 ($16,945)$825,849
(0.8%)$382,925 ($3,031)$385,956 (2.7%)$1,569,353 ($44,288)$1,613,641DNC/Four Leaf Joint Venture Total
Duty Free Americas Dallas, LLC Connections Made EZB30B (16.8%)$26,394 ($5,326)$31,719 (16.8%)$111,713 ($22,524)$134,237
Duty Free Americas Dallas, LLC Connections Made EZB33B (6.4%)$42,218 ($2,866)$45,084 (13.2%)$174,142 ($26,456)$200,597
Duty Free Americas Dallas, LLC CoachD24D 1.0%$87,604 $870$86,734 (2.5%)$375,578 ($9,485)$385,063
Duty Free Americas Dallas, LLC Mont BlancD24D 31.5%$80,413 $19,258$61,154 22.8%$297,108 $55,170$241,938
Duty Free Americas Dallas, LLC Kate SpadeD27D -$57,629 $57,629$0 -$198,181 $198,181$0
Duty Free Americas Dallas, LLC Michael KorsD27D -$79,585 $79,585$0 -$363,233 $363,233$0
Duty Free Americas Dallas, LLC Connections Made EZD39D 25.4%$21,640 $4,389$17,251 22.5%$96,090 $17,641$78,449
63.5%$395,482 $153,540$241,942 55.3%$1,616,044 $575,760$1,040,284Duty Free Americas Dallas, LLC Total
Ertekin, Inc. A Texas Corporation Ertekin FashionsA28A 32.6%$40,340 $9,918$30,422 35.4%$174,854 $45,715$129,140
Ertekin, Inc. A Texas Corporation ErtekinD17D (31.5%)$17,886 ($8,214)$26,099 (25.7%)$96,371 ($33,355)$129,725
3.0%$58,225 $1,704$56,521 4.8%$271,225 $12,360$258,865Ertekin, Inc. A Texas Corporation Total
Estee Lauder Terminal D JointVenture
Jo Malone, Aveda, MACD20D (9.2%)$63,886 ($6,474)$70,360 (6.4%)$320,701 ($22,049)$342,750
Estee Lauder Terminal D JointVenture
Jo Malone, Aveda, MACD24D 5.0%$122,404 $5,814$116,591 (2.6%)$543,852 ($14,750)$558,602
(0.4%)$186,290 ($660)$186,950 (4.1%)$864,553 ($36,799)$901,351Estee Lauder Terminal D Joint Venture Total
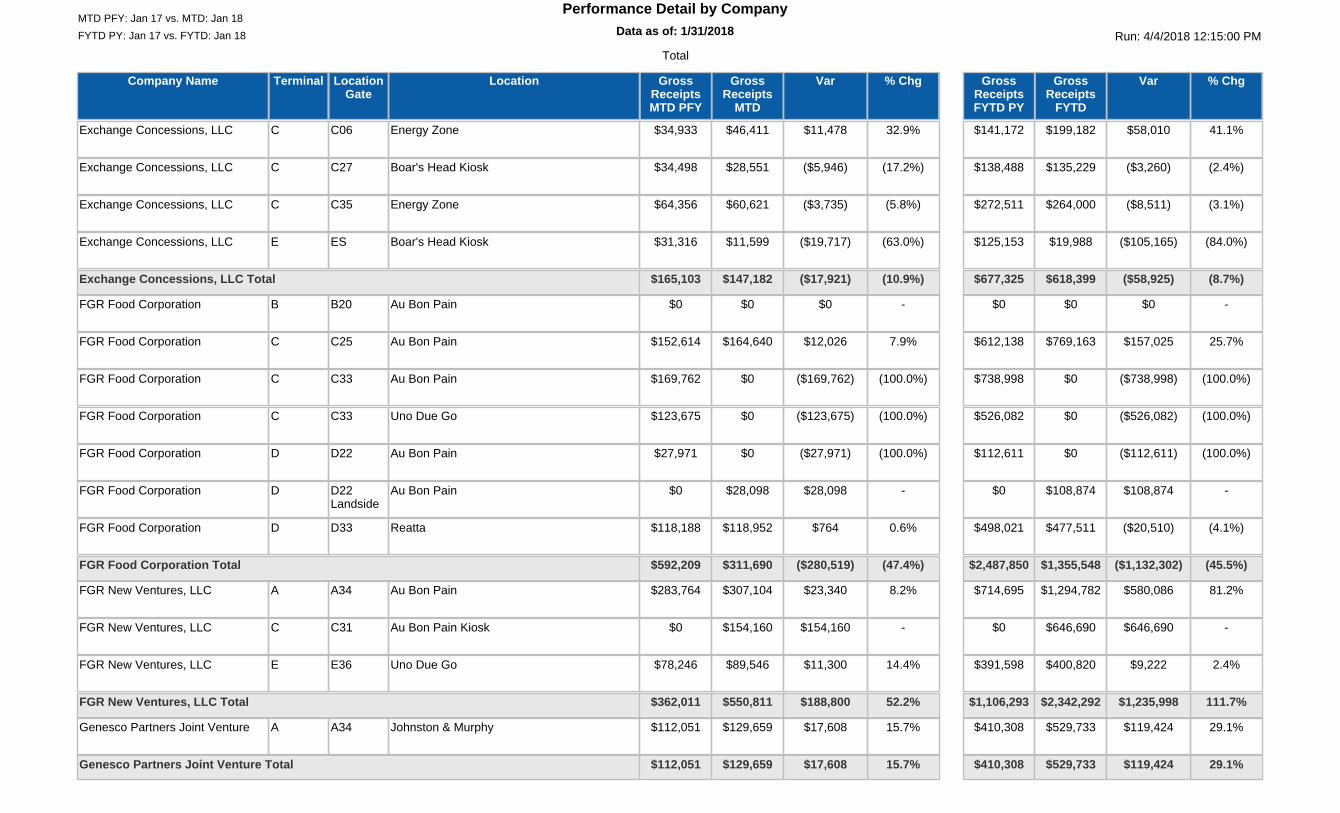
FYTD PY: Jan 17 vs. FYTD: Jan 18 Run: 4/4/2018 12:15:00 PMData as of: 1/31/201812:00:00 AM
Performance Detail by CompanyMTD PFY: Jan 17 vs. MTD: Jan 18
Total
Company Name LocationLocationGate
Terminal % ChgGrossReceipts
MTD
VarGrossReceiptsMTD PFY
% ChgGrossReceipts
FYTD
VarGrossReceiptsFYTD PY
Exchange Concessions, LLC Energy ZoneC06C 32.9%$46,411 $11,478$34,933 41.1%$199,182 $58,010$141,172
Exchange Concessions, LLC Boar's Head KioskC27C (17.2%)$28,551 ($5,946)$34,498 (2.4%)$135,229 ($3,260)$138,488
Exchange Concessions, LLC Energy ZoneC35C (5.8%)$60,621 ($3,735)$64,356 (3.1%)$264,000 ($8,511)$272,511
Exchange Concessions, LLC Boar's Head KioskESE (63.0%)$11,599 ($19,717)$31,316 (84.0%)$19,988 ($105,165)$125,153
(10.9%)$147,182 ($17,921)$165,103 (8.7%)$618,399 ($58,925)$677,325Exchange Concessions, LLC Total
FGR Food Corporation Au Bon PainB20B -$0 $0$0 -$0 $0$0
FGR Food Corporation Au Bon PainC25C 7.9%$164,640 $12,026$152,614 25.7%$769,163 $157,025$612,138
FGR Food Corporation Au Bon PainC33C (100.0%)$0 ($169,762)$169,762 (100.0%)$0 ($738,998)$738,998
FGR Food Corporation Uno Due GoC33C (100.0%)$0 ($123,675)$123,675 (100.0%)$0 ($526,082)$526,082
FGR Food Corporation Au Bon PainD22D (100.0%)$0 ($27,971)$27,971 (100.0%)$0 ($112,611)$112,611
FGR Food Corporation Au Bon PainD22Landside
D -$28,098 $28,098$0 -$108,874 $108,874$0
FGR Food Corporation ReattaD33D 0.6%$118,952 $764$118,188 (4.1%)$477,511 ($20,510)$498,021
(47.4%)$311,690 ($280,519)$592,209 (45.5%)$1,355,548 ($1,132,302)$2,487,850FGR Food Corporation Total
FGR New Ventures, LLC Au Bon PainA34A 8.2%$307,104 $23,340$283,764 81.2%$1,294,782 $580,086$714,695
FGR New Ventures, LLC Au Bon Pain KioskC31C -$154,160 $154,160$0 -$646,690 $646,690$0
FGR New Ventures, LLC Uno Due GoE36E 14.4%$89,546 $11,300$78,246 2.4%$400,820 $9,222$391,598
52.2%$550,811 $188,800$362,011 111.7%$2,342,292 $1,235,998$1,106,293FGR New Ventures, LLC Total
Genesco Partners Joint Venture Johnston & MurphyA34A 15.7%$129,659 $17,608$112,051 29.1%$529,733 $119,424$410,308
15.7%$129,659 $17,608$112,051 29.1%$529,733 $119,424$410,308Genesco Partners Joint Venture Total
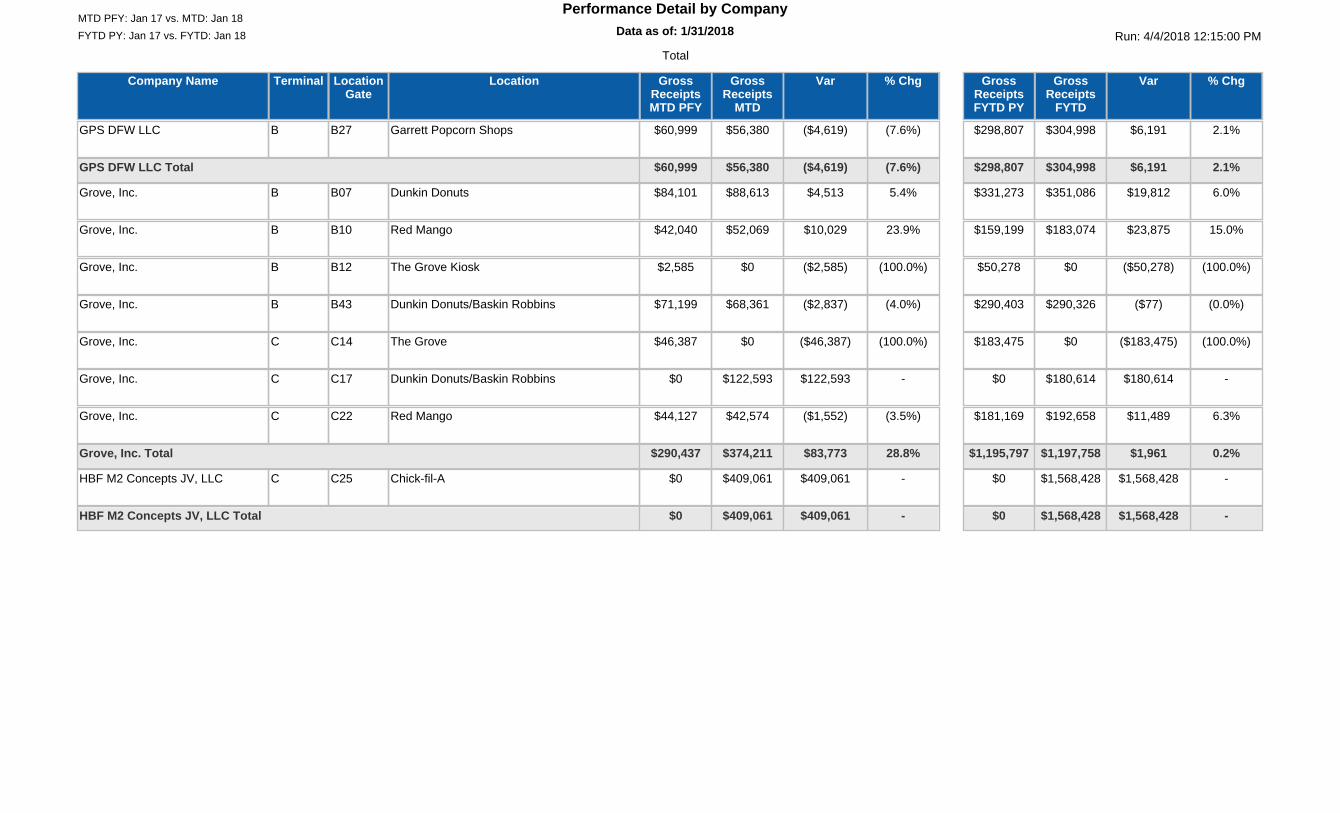
FYTD PY: Jan 17 vs. FYTD: Jan 18 Run: 4/4/2018 12:15:00 PMData as of: 1/31/201812:00:00 AM
Performance Detail by CompanyMTD PFY: Jan 17 vs. MTD: Jan 18
Total
Company Name LocationLocationGate
Terminal % ChgGrossReceipts
MTD
VarGrossReceiptsMTD PFY
% ChgGrossReceipts
FYTD
VarGrossReceiptsFYTD PY
GPS DFW LLC Garrett Popcorn ShopsB27B (7.6%)$56,380 ($4,619)$60,999 2.1%$304,998 $6,191$298,807
(7.6%)$56,380 ($4,619)$60,999 2.1%$304,998 $6,191$298,807GPS DFW LLC Total
Grove, Inc. Dunkin DonutsB07B 5.4%$88,613 $4,513$84,101 6.0%$351,086 $19,812$331,273
Grove, Inc. Red MangoB10B 23.9%$52,069 $10,029$42,040 15.0%$183,074 $23,875$159,199
Grove, Inc. The Grove KioskB12B (100.0%)$0 ($2,585)$2,585 (100.0%)$0 ($50,278)$50,278
Grove, Inc. Dunkin Donuts/Baskin RobbinsB43B (4.0%)$68,361 ($2,837)$71,199 (0.0%)$290,326 ($77)$290,403
Grove, Inc. The GroveC14C (100.0%)$0 ($46,387)$46,387 (100.0%)$0 ($183,475)$183,475
Grove, Inc. Dunkin Donuts/Baskin RobbinsC17C -$122,593 $122,593$0 -$180,614 $180,614$0
Grove, Inc. Red MangoC22C (3.5%)$42,574 ($1,552)$44,127 6.3%$192,658 $11,489$181,169
28.8%$374,211 $83,773$290,437 0.2%$1,197,758 $1,961$1,195,797Grove, Inc. Total
HBF M2 Concepts JV, LLC Chick-fil-AC25C -$409,061 $409,061$0 -$1,568,428 $1,568,428$0
-$409,061 $409,061$0 -$1,568,428 $1,568,428$0HBF M2 Concepts JV, LLC Total
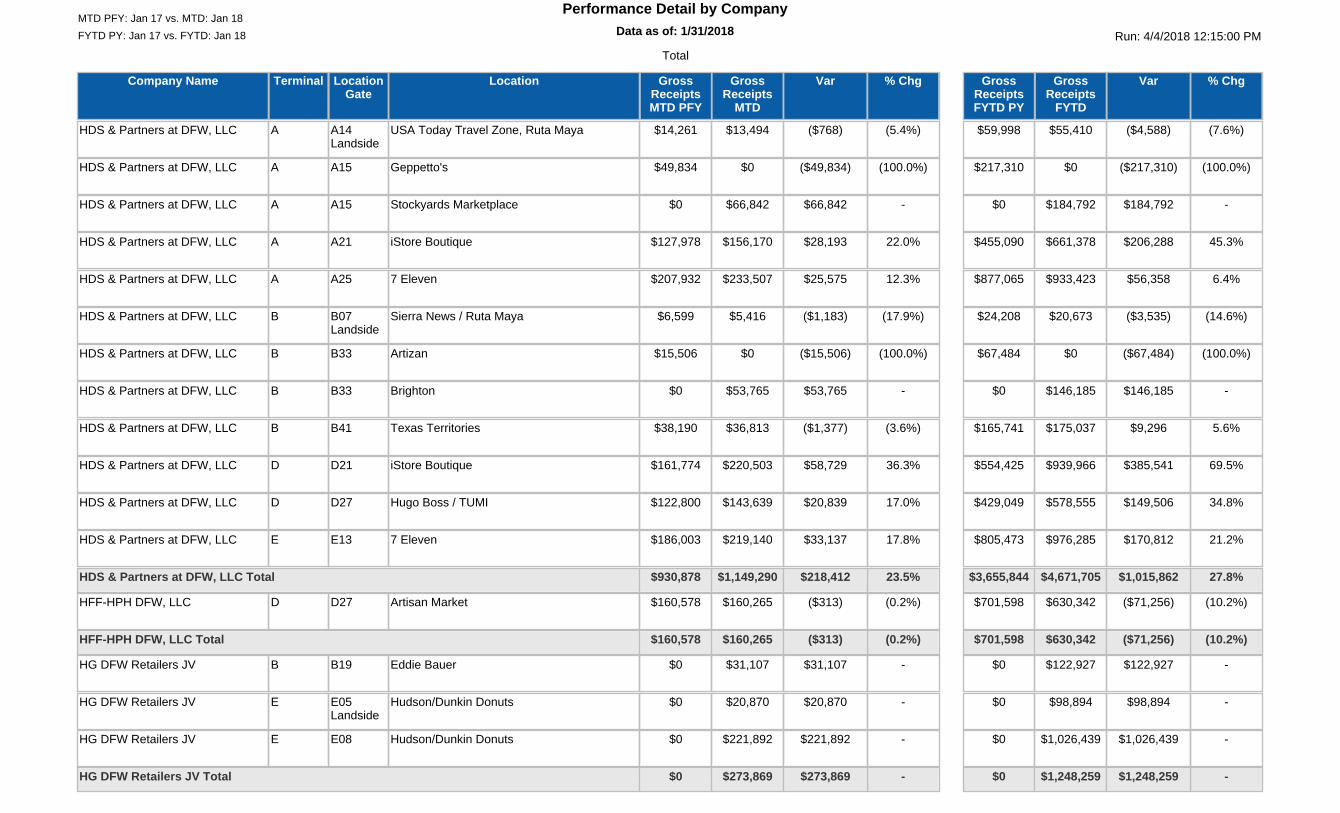
FYTD PY: Jan 17 vs. FYTD: Jan 18 Run: 4/4/2018 12:15:00 PMData as of: 1/31/201812:00:00 AM
Performance Detail by CompanyMTD PFY: Jan 17 vs. MTD: Jan 18
Total
Company Name LocationLocationGate
Terminal % ChgGrossReceipts
MTD
VarGrossReceiptsMTD PFY
% ChgGrossReceipts
FYTD
VarGrossReceiptsFYTD PY
HDS & Partners at DFW, LLC USA Today Travel Zone, Ruta MayaA14Landside
A (5.4%)$13,494 ($768)$14,261 (7.6%)$55,410 ($4,588)$59,998
HDS & Partners at DFW, LLC Geppetto'sA15A (100.0%)$0 ($49,834)$49,834 (100.0%)$0 ($217,310)$217,310
HDS & Partners at DFW, LLC Stockyards MarketplaceA15A -$66,842 $66,842$0 -$184,792 $184,792$0
HDS & Partners at DFW, LLC iStore BoutiqueA21A 22.0%$156,170 $28,193$127,978 45.3%$661,378 $206,288$455,090
HDS & Partners at DFW, LLC 7 ElevenA25A 12.3%$233,507 $25,575$207,932 6.4%$933,423 $56,358$877,065
HDS & Partners at DFW, LLC Sierra News / Ruta MayaB07Landside
B (17.9%)$5,416 ($1,183)$6,599 (14.6%)$20,673 ($3,535)$24,208
HDS & Partners at DFW, LLC ArtizanB33B (100.0%)$0 ($15,506)$15,506 (100.0%)$0 ($67,484)$67,484
HDS & Partners at DFW, LLC BrightonB33B -$53,765 $53,765$0 -$146,185 $146,185$0
HDS & Partners at DFW, LLC Texas TerritoriesB41B (3.6%)$36,813 ($1,377)$38,190 5.6%$175,037 $9,296$165,741
HDS & Partners at DFW, LLC iStore BoutiqueD21D 36.3%$220,503 $58,729$161,774 69.5%$939,966 $385,541$554,425
HDS & Partners at DFW, LLC Hugo Boss / TUMID27D 17.0%$143,639 $20,839$122,800 34.8%$578,555 $149,506$429,049
HDS & Partners at DFW, LLC 7 ElevenE13E 17.8%$219,140 $33,137$186,003 21.2%$976,285 $170,812$805,473
23.5%$1,149,290 $218,412$930,878 27.8%$4,671,705 $1,015,862$3,655,844HDS & Partners at DFW, LLC Total
HFF-HPH DFW, LLC Artisan MarketD27D (0.2%)$160,265 ($313)$160,578 (10.2%)$630,342 ($71,256)$701,598
(0.2%)$160,265 ($313)$160,578 (10.2%)$630,342 ($71,256)$701,598HFF-HPH DFW, LLC Total
HG DFW Retailers JV Eddie BauerB19B -$31,107 $31,107$0 -$122,927 $122,927$0
HG DFW Retailers JV Hudson/Dunkin DonutsE05Landside
E -$20,870 $20,870$0 -$98,894 $98,894$0
HG DFW Retailers JV Hudson/Dunkin DonutsE08E -$221,892 $221,892$0 -$1,026,439 $1,026,439$0
-$273,869 $273,869$0 -$1,248,259 $1,248,259$0HG DFW Retailers JV Total
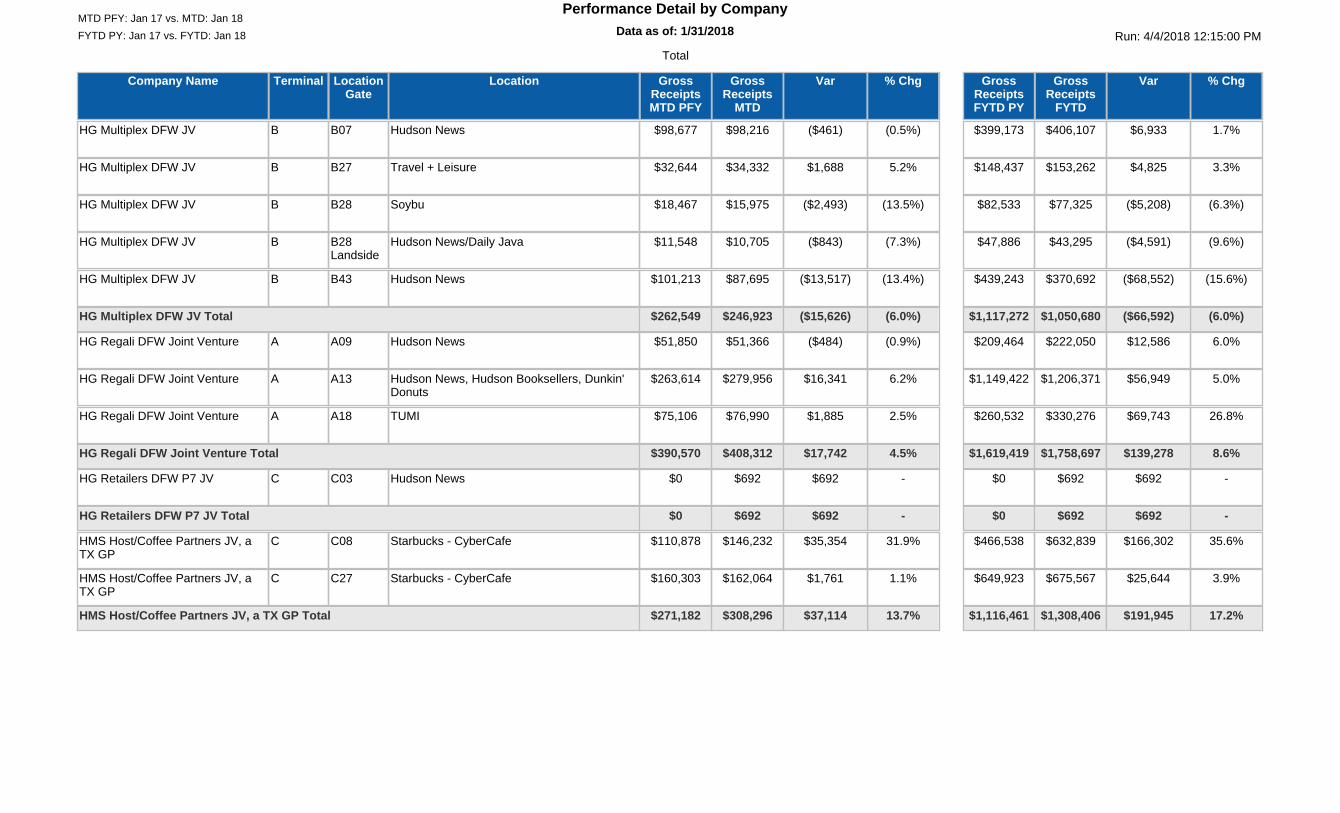
FYTD PY: Jan 17 vs. FYTD: Jan 18 Run: 4/4/2018 12:15:00 PMData as of: 1/31/201812:00:00 AM
Performance Detail by CompanyMTD PFY: Jan 17 vs. MTD: Jan 18
Total
Company Name LocationLocationGate
Terminal % ChgGrossReceipts
MTD
VarGrossReceiptsMTD PFY
% ChgGrossReceipts
FYTD
VarGrossReceiptsFYTD PY
HG Multiplex DFW JV Hudson NewsB07B (0.5%)$98,216 ($461)$98,677 1.7%$406,107 $6,933$399,173
HG Multiplex DFW JV Travel + LeisureB27B 5.2%$34,332 $1,688$32,644 3.3%$153,262 $4,825$148,437
HG Multiplex DFW JV SoybuB28B (13.5%)$15,975 ($2,493)$18,467 (6.3%)$77,325 ($5,208)$82,533
HG Multiplex DFW JV Hudson News/Daily JavaB28Landside
B (7.3%)$10,705 ($843)$11,548 (9.6%)$43,295 ($4,591)$47,886
HG Multiplex DFW JV Hudson NewsB43B (13.4%)$87,695 ($13,517)$101,213 (15.6%)$370,692 ($68,552)$439,243
(6.0%)$246,923 ($15,626)$262,549 (6.0%)$1,050,680 ($66,592)$1,117,272HG Multiplex DFW JV Total
HG Regali DFW Joint Venture Hudson NewsA09A (0.9%)$51,366 ($484)$51,850 6.0%$222,050 $12,586$209,464
HG Regali DFW Joint Venture Hudson News, Hudson Booksellers, Dunkin'Donuts
A13A 6.2%$279,956 $16,341$263,614 5.0%$1,206,371 $56,949$1,149,422
HG Regali DFW Joint Venture TUMIA18A 2.5%$76,990 $1,885$75,106 26.8%$330,276 $69,743$260,532
4.5%$408,312 $17,742$390,570 8.6%$1,758,697 $139,278$1,619,419HG Regali DFW Joint Venture Total
HG Retailers DFW P7 JV Hudson NewsC03C -$692 $692$0 -$692 $692$0
-$692 $692$0 -$692 $692$0HG Retailers DFW P7 JV Total
HMS Host/Coffee Partners JV, aTX GP
Starbucks - CyberCafeC08C 31.9%$146,232 $35,354$110,878 35.6%$632,839 $166,302$466,538
HMS Host/Coffee Partners JV, aTX GP
Starbucks - CyberCafeC27C 1.1%$162,064 $1,761$160,303 3.9%$675,567 $25,644$649,923
13.7%$308,296 $37,114$271,182 17.2%$1,308,406 $191,945$1,116,461HMS Host/Coffee Partners JV, a TX GP Total
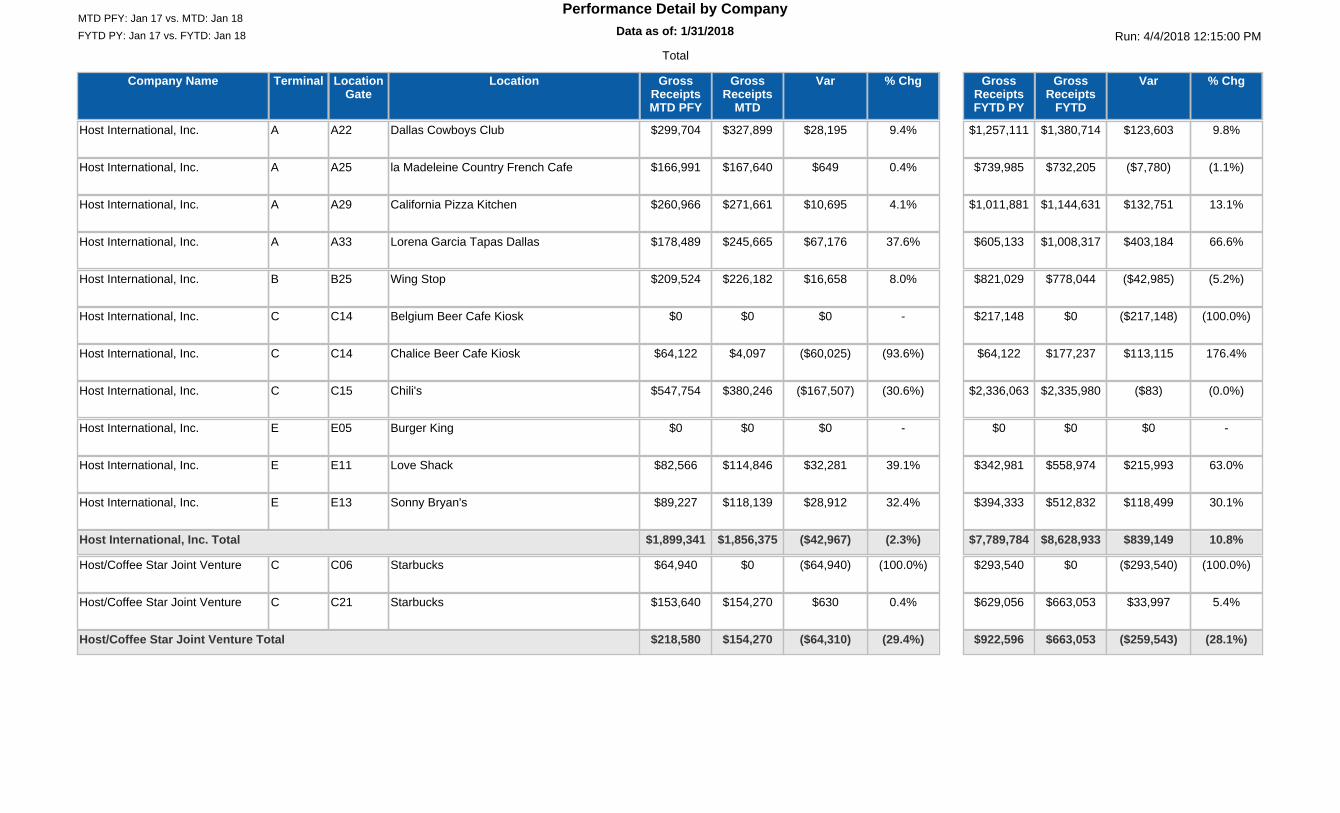
FYTD PY: Jan 17 vs. FYTD: Jan 18 Run: 4/4/2018 12:15:00 PMData as of: 1/31/201812:00:00 AM
Performance Detail by CompanyMTD PFY: Jan 17 vs. MTD: Jan 18
Total
Company Name LocationLocationGate
Terminal % ChgGrossReceipts
MTD
VarGrossReceiptsMTD PFY
% ChgGrossReceipts
FYTD
VarGrossReceiptsFYTD PY
Host International, Inc. Dallas Cowboys ClubA22A 9.4%$327,899 $28,195$299,704 9.8%$1,380,714 $123,603$1,257,111
Host International, Inc. la Madeleine Country French CafeA25A 0.4%$167,640 $649$166,991 (1.1%)$732,205 ($7,780)$739,985
Host International, Inc. California Pizza KitchenA29A 4.1%$271,661 $10,695$260,966 13.1%$1,144,631 $132,751$1,011,881
Host International, Inc. Lorena Garcia Tapas DallasA33A 37.6%$245,665 $67,176$178,489 66.6%$1,008,317 $403,184$605,133
Host International, Inc. Wing StopB25B 8.0%$226,182 $16,658$209,524 (5.2%)$778,044 ($42,985)$821,029
Host International, Inc. Belgium Beer Cafe KioskC14C -$0 $0$0 (100.0%)$0 ($217,148)$217,148
Host International, Inc. Chalice Beer Cafe KioskC14C (93.6%)$4,097 ($60,025)$64,122 176.4%$177,237 $113,115$64,122
Host International, Inc. Chili'sC15C (30.6%)$380,246 ($167,507)$547,754 (0.0%)$2,335,980 ($83)$2,336,063
Host International, Inc. Burger KingE05E -$0 $0$0 -$0 $0$0
Host International, Inc. Love ShackE11E 39.1%$114,846 $32,281$82,566 63.0%$558,974 $215,993$342,981
Host International, Inc. Sonny Bryan'sE13E 32.4%$118,139 $28,912$89,227 30.1%$512,832 $118,499$394,333
(2.3%)$1,856,375 ($42,967)$1,899,341 10.8%$8,628,933 $839,149$7,789,784Host International, Inc. Total
Host/Coffee Star Joint Venture StarbucksC06C (100.0%)$0 ($64,940)$64,940 (100.0%)$0 ($293,540)$293,540
Host/Coffee Star Joint Venture StarbucksC21C 0.4%$154,270 $630$153,640 5.4%$663,053 $33,997$629,056
(29.4%)$154,270 ($64,310)$218,580 (28.1%)$663,053 ($259,543)$922,596Host/Coffee Star Joint Venture Total

FYTD PY: Jan 17 vs. FYTD: Jan 18 Run: 4/4/2018 12:15:00 PMData as of: 1/31/201812:00:00 AM
Performance Detail by CompanyMTD PFY: Jan 17 vs. MTD: Jan 18
Total
Company Name LocationLocationGate
Terminal % ChgGrossReceipts
MTD
VarGrossReceiptsMTD PFY
% ChgGrossReceipts
FYTD
VarGrossReceiptsFYTD PY
Host/DFW AF LLC StarbucksA20A 6.8%$249,478 $15,981$233,497 6.8%$995,530 $63,183$932,347
Host/DFW AF LLC Starbucks - CyberCafeB28B 13.3%$151,263 $17,698$133,565 11.5%$610,094 $62,965$547,129
Host/DFW AF LLC StarbucksD12D 7.8%$93,997 $6,779$87,217 (1.3%)$392,386 ($5,352)$397,738
Host/DFW AF LLC StarbucksD27D (0.5%)$103,838 ($545)$104,383 (12.8%)$424,785 ($62,341)$487,125
Host/DFW AF LLC Starbucks KioskD30Landside
D (10.3%)$54,832 ($6,303)$61,134 (7.8%)$208,081 ($17,587)$225,668
Host/DFW AF LLC StarbucksE34E 12.2%$124,278 $13,534$110,744 1.2%$517,147 $6,194$510,953
Host/DFW AF LLC Starbucks KioskESE (100.0%)$0 ($95,352)$95,352 (77.9%)$91,700 ($323,676)$415,376
(5.8%)$777,684 ($48,208)$825,893 (7.9%)$3,239,723 ($276,614)$3,516,336Host/DFW AF LLC Total
Hyman Companies, Inc., The LandauD18D (90.9%)$4,316 ($43,074)$47,390 (19.4%)$134,918 ($32,491)$167,409
(90.9%)$4,316 ($43,074)$47,390 (19.4%)$134,918 ($32,491)$167,409Hyman Companies, Inc., The Total
Icebox Cafe at DFW II, LLC Icebox DeliB06B (17.7%)$66,363 ($14,274)$80,637 (7.6%)$286,592 ($23,713)$310,305
(17.7%)$66,363 ($14,274)$80,637 (7.6%)$286,592 ($23,713)$310,305Icebox Cafe at DFW II, LLC Total
Icebox Cafe at DFW, LLC Icebox CafeA15A (22.9%)$58,314 ($17,335)$75,649 (13.8%)$275,916 ($44,053)$319,969
(22.9%)$58,314 ($17,335)$75,649 (13.8%)$275,916 ($44,053)$319,969Icebox Cafe at DFW, LLC Total
InMotion Entertainment Group,LLC
InMotion EntertainmentD31D (4.9%)$158,551 ($8,204)$166,755 (13.3%)$661,649 ($101,833)$763,482
InMotion Entertainment Group,LLC
Headphone HubE08E -$63,285 $63,285$0 -$302,857 $302,857$0
33.0%$221,836 $55,080$166,755 26.3%$964,506 $201,025$763,482InMotion Entertainment Group, LLC Total
L'Occitane Airport Venture L'OccitaneA19A 12.0%$68,257 $7,291$60,966 8.7%$331,416 $26,583$304,834
12.0%$68,257 $7,291$60,966 8.7%$331,416 $26,583$304,834L'Occitane Airport Venture Total
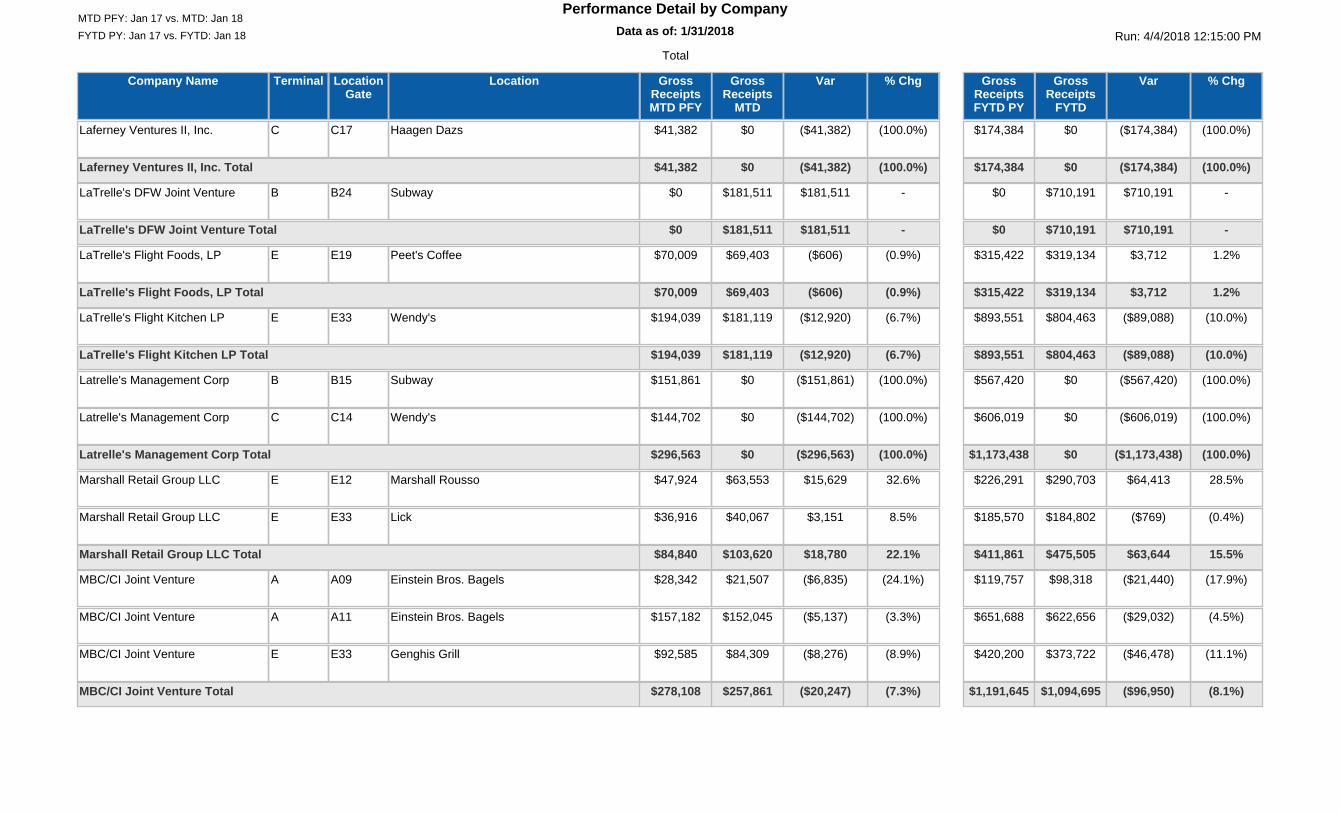
FYTD PY: Jan 17 vs. FYTD: Jan 18 Run: 4/4/2018 12:15:00 PMData as of: 1/31/201812:00:00 AM
Performance Detail by CompanyMTD PFY: Jan 17 vs. MTD: Jan 18
Total
Company Name LocationLocationGate
Terminal % ChgGrossReceipts
MTD
VarGrossReceiptsMTD PFY
% ChgGrossReceipts
FYTD
VarGrossReceiptsFYTD PY
Laferney Ventures II, Inc. Haagen DazsC17C (100.0%)$0 ($41,382)$41,382 (100.0%)$0 ($174,384)$174,384
(100.0%)$0 ($41,382)$41,382 (100.0%)$0 ($174,384)$174,384Laferney Ventures II, Inc. Total
LaTrelle's DFW Joint Venture SubwayB24B -$181,511 $181,511$0 -$710,191 $710,191$0
-$181,511 $181,511$0 -$710,191 $710,191$0LaTrelle's DFW Joint Venture Total
LaTrelle's Flight Foods, LP Peet's CoffeeE19E (0.9%)$69,403 ($606)$70,009 1.2%$319,134 $3,712$315,422
(0.9%)$69,403 ($606)$70,009 1.2%$319,134 $3,712$315,422LaTrelle's Flight Foods, LP Total
LaTrelle's Flight Kitchen LP Wendy'sE33E (6.7%)$181,119 ($12,920)$194,039 (10.0%)$804,463 ($89,088)$893,551
(6.7%)$181,119 ($12,920)$194,039 (10.0%)$804,463 ($89,088)$893,551LaTrelle's Flight Kitchen LP Total
Latrelle's Management Corp SubwayB15B (100.0%)$0 ($151,861)$151,861 (100.0%)$0 ($567,420)$567,420
Latrelle's Management Corp Wendy'sC14C (100.0%)$0 ($144,702)$144,702 (100.0%)$0 ($606,019)$606,019
(100.0%)$0 ($296,563)$296,563 (100.0%)$0 ($1,173,438)$1,173,438Latrelle's Management Corp Total
Marshall Retail Group LLC Marshall RoussoE12E 32.6%$63,553 $15,629$47,924 28.5%$290,703 $64,413$226,291
Marshall Retail Group LLC LickE33E 8.5%$40,067 $3,151$36,916 (0.4%)$184,802 ($769)$185,570
22.1%$103,620 $18,780$84,840 15.5%$475,505 $63,644$411,861Marshall Retail Group LLC Total
MBC/CI Joint Venture Einstein Bros. BagelsA09A (24.1%)$21,507 ($6,835)$28,342 (17.9%)$98,318 ($21,440)$119,757
MBC/CI Joint Venture Einstein Bros. BagelsA11A (3.3%)$152,045 ($5,137)$157,182 (4.5%)$622,656 ($29,032)$651,688
MBC/CI Joint Venture Genghis GrillE33E (8.9%)$84,309 ($8,276)$92,585 (11.1%)$373,722 ($46,478)$420,200
(7.3%)$257,861 ($20,247)$278,108 (8.1%)$1,094,695 ($96,950)$1,191,645MBC/CI Joint Venture Total
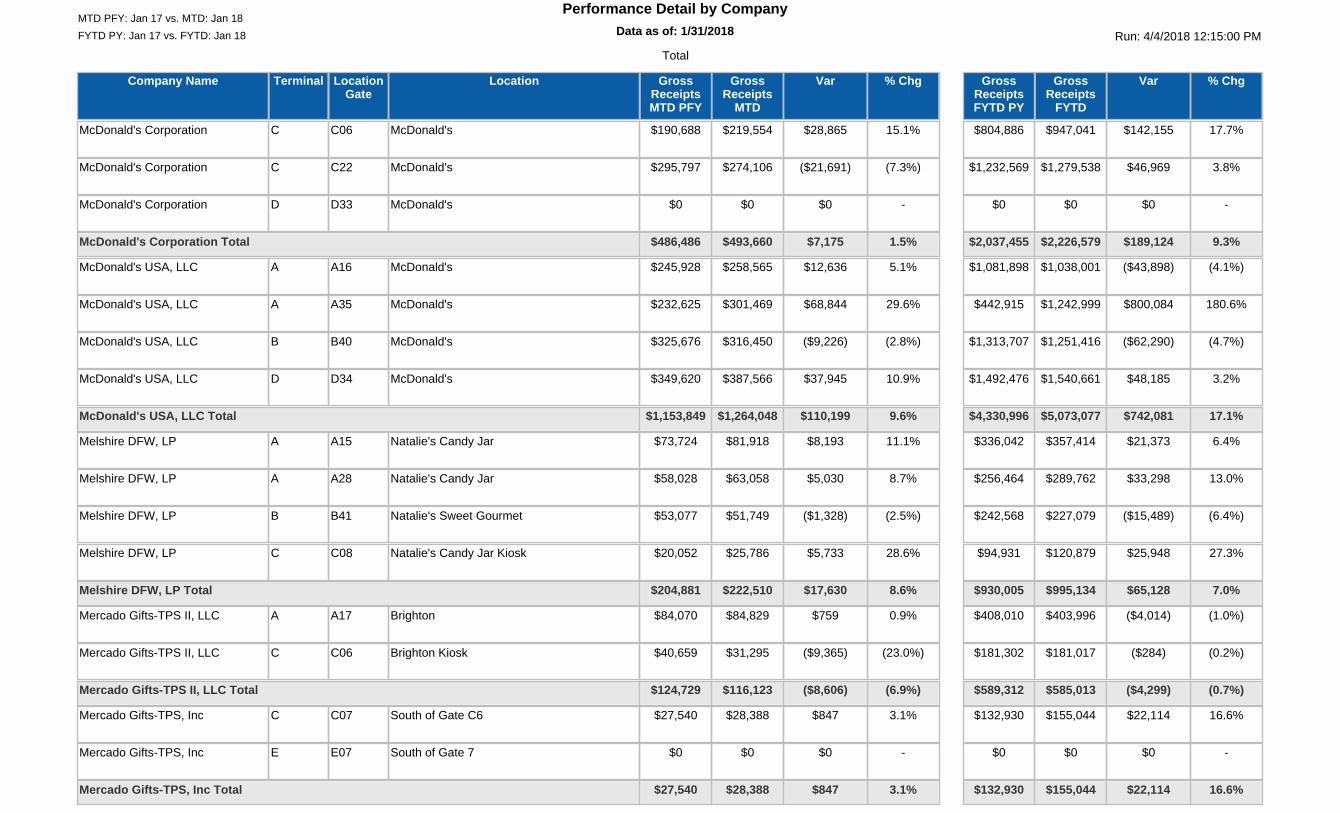
FYTD PY: Jan 17 vs. FYTD: Jan 18 Run: 4/4/2018 12:15:00 PMData as of: 1/31/201812:00:00 AM
Performance Detail by CompanyMTD PFY: Jan 17 vs. MTD: Jan 18
Total
Company Name LocationLocationGate
Terminal % ChgGrossReceipts
MTD
VarGrossReceiptsMTD PFY
% ChgGrossReceipts
FYTD
VarGrossReceiptsFYTD PY
McDonald's Corporation McDonald'sC06C 15.1%$219,554 $28,865$190,688 17.7%$947,041 $142,155$804,886
McDonald's Corporation McDonald'sC22C (7.3%)$274,106 ($21,691)$295,797 3.8%$1,279,538 $46,969$1,232,569
McDonald's Corporation McDonald'sD33D -$0 $0$0 -$0 $0$0
1.5%$493,660 $7,175$486,486 9.3%$2,226,579 $189,124$2,037,455McDonald's Corporation Total
McDonald's USA, LLC McDonald'sA16A 5.1%$258,565 $12,636$245,928 (4.1%)$1,038,001 ($43,898)$1,081,898
McDonald's USA, LLC McDonald'sA35A 29.6%$301,469 $68,844$232,625 180.6%$1,242,999 $800,084$442,915
McDonald's USA, LLC McDonald'sB40B (2.8%)$316,450 ($9,226)$325,676 (4.7%)$1,251,416 ($62,290)$1,313,707
McDonald's USA, LLC McDonald'sD34D 10.9%$387,566 $37,945$349,620 3.2%$1,540,661 $48,185$1,492,476
9.6%$1,264,048 $110,199$1,153,849 17.1%$5,073,077 $742,081$4,330,996McDonald's USA, LLC Total
Melshire DFW, LP Natalie's Candy JarA15A 11.1%$81,918 $8,193$73,724 6.4%$357,414 $21,373$336,042
Melshire DFW, LP Natalie's Candy JarA28A 8.7%$63,058 $5,030$58,028 13.0%$289,762 $33,298$256,464
Melshire DFW, LP Natalie's Sweet GourmetB41B (2.5%)$51,749 ($1,328)$53,077 (6.4%)$227,079 ($15,489)$242,568
Melshire DFW, LP Natalie's Candy Jar KioskC08C 28.6%$25,786 $5,733$20,052 27.3%$120,879 $25,948$94,931
8.6%$222,510 $17,630$204,881 7.0%$995,134 $65,128$930,005Melshire DFW, LP Total
Mercado Gifts-TPS II, LLC BrightonA17A 0.9%$84,829 $759$84,070 (1.0%)$403,996 ($4,014)$408,010
Mercado Gifts-TPS II, LLC Brighton KioskC06C (23.0%)$31,295 ($9,365)$40,659 (0.2%)$181,017 ($284)$181,302
(6.9%)$116,123 ($8,606)$124,729 (0.7%)$585,013 ($4,299)$589,312Mercado Gifts-TPS II, LLC Total
Mercado Gifts-TPS, Inc South of Gate C6C07C 3.1%$28,388 $847$27,540 16.6%$155,044 $22,114$132,930
Mercado Gifts-TPS, Inc South of Gate 7E07E -$0 $0$0 -$0 $0$0
3.1%$28,388 $847$27,540 16.6%$155,044 $22,114$132,930Mercado Gifts-TPS, Inc Total
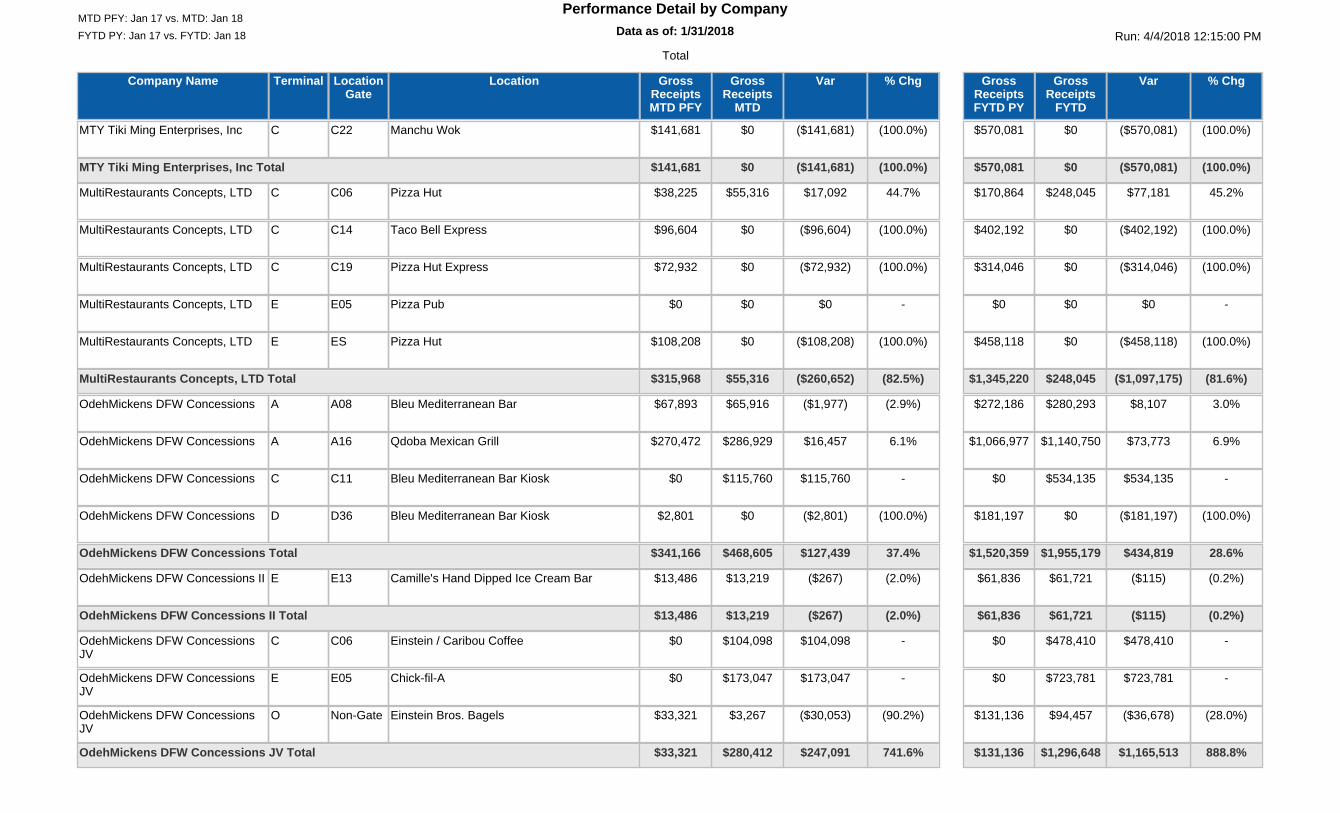
FYTD PY: Jan 17 vs. FYTD: Jan 18 Run: 4/4/2018 12:15:00 PMData as of: 1/31/201812:00:00 AM
Performance Detail by CompanyMTD PFY: Jan 17 vs. MTD: Jan 18
Total
Company Name LocationLocationGate
Terminal % ChgGrossReceipts
MTD
VarGrossReceiptsMTD PFY
% ChgGrossReceipts
FYTD
VarGrossReceiptsFYTD PY
MTY Tiki Ming Enterprises, Inc Manchu WokC22C (100.0%)$0 ($141,681)$141,681 (100.0%)$0 ($570,081)$570,081
(100.0%)$0 ($141,681)$141,681 (100.0%)$0 ($570,081)$570,081MTY Tiki Ming Enterprises, Inc Total
MultiRestaurants Concepts, LTD Pizza HutC06C 44.7%$55,316 $17,092$38,225 45.2%$248,045 $77,181$170,864
MultiRestaurants Concepts, LTD Taco Bell ExpressC14C (100.0%)$0 ($96,604)$96,604 (100.0%)$0 ($402,192)$402,192
MultiRestaurants Concepts, LTD Pizza Hut ExpressC19C (100.0%)$0 ($72,932)$72,932 (100.0%)$0 ($314,046)$314,046
MultiRestaurants Concepts, LTD Pizza PubE05E -$0 $0$0 -$0 $0$0
MultiRestaurants Concepts, LTD Pizza HutESE (100.0%)$0 ($108,208)$108,208 (100.0%)$0 ($458,118)$458,118
(82.5%)$55,316 ($260,652)$315,968 (81.6%)$248,045 ($1,097,175)$1,345,220MultiRestaurants Concepts, LTD Total
OdehMickens DFW Concessions Bleu Mediterranean BarA08A (2.9%)$65,916 ($1,977)$67,893 3.0%$280,293 $8,107$272,186
OdehMickens DFW Concessions Qdoba Mexican GrillA16A 6.1%$286,929 $16,457$270,472 6.9%$1,140,750 $73,773$1,066,977
OdehMickens DFW Concessions Bleu Mediterranean Bar KioskC11C -$115,760 $115,760$0 -$534,135 $534,135$0
OdehMickens DFW Concessions Bleu Mediterranean Bar KioskD36D (100.0%)$0 ($2,801)$2,801 (100.0%)$0 ($181,197)$181,197
37.4%$468,605 $127,439$341,166 28.6%$1,955,179 $434,819$1,520,359OdehMickens DFW Concessions Total
OdehMickens DFW Concessions II Camille's Hand Dipped Ice Cream BarE13E (2.0%)$13,219 ($267)$13,486 (0.2%)$61,721 ($115)$61,836
(2.0%)$13,219 ($267)$13,486 (0.2%)$61,721 ($115)$61,836OdehMickens DFW Concessions II Total
OdehMickens DFW ConcessionsJV
Einstein / Caribou CoffeeC06C -$104,098 $104,098$0 -$478,410 $478,410$0
OdehMickens DFW ConcessionsJV
Chick-fil-AE05E -$173,047 $173,047$0 -$723,781 $723,781$0
OdehMickens DFW ConcessionsJV
Einstein Bros. BagelsNon-GateO (90.2%)$3,267 ($30,053)$33,321 (28.0%)$94,457 ($36,678)$131,136
741.6%$280,412 $247,091$33,321 888.8%$1,296,648 $1,165,513$131,136OdehMickens DFW Concessions JV Total
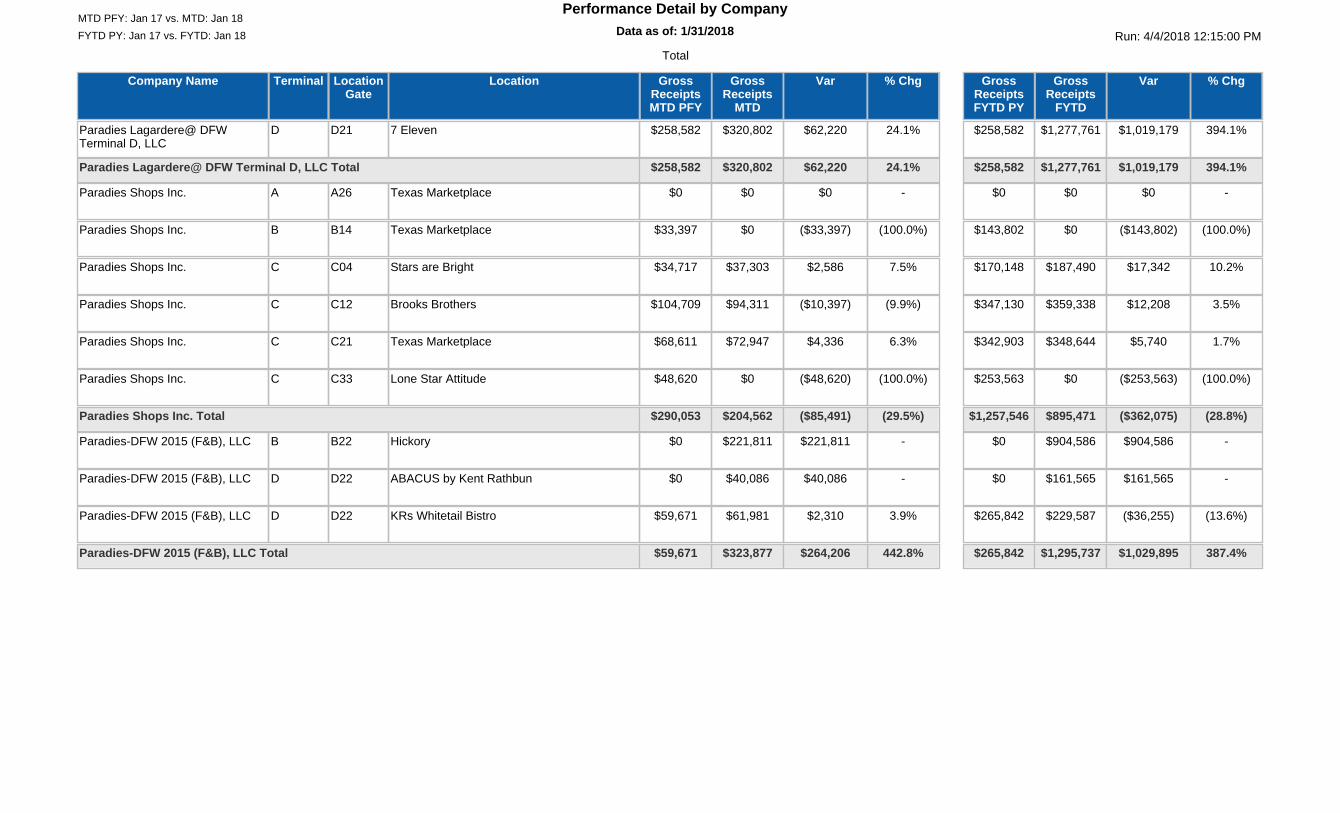
FYTD PY: Jan 17 vs. FYTD: Jan 18 Run: 4/4/2018 12:15:00 PMData as of: 1/31/201812:00:00 AM
Performance Detail by CompanyMTD PFY: Jan 17 vs. MTD: Jan 18
Total
Company Name LocationLocationGate
Terminal % ChgGrossReceipts
MTD
VarGrossReceiptsMTD PFY
% ChgGrossReceipts
FYTD
VarGrossReceiptsFYTD PY
Paradies Lagardere@ DFWTerminal D, LLC
7 ElevenD21D 24.1%$320,802 $62,220$258,582 394.1%$1,277,761 $1,019,179$258,582
24.1%$320,802 $62,220$258,582 394.1%$1,277,761 $1,019,179$258,582Paradies Lagardere@ DFW Terminal D, LLC Total
Paradies Shops Inc. Texas MarketplaceA26A -$0 $0$0 -$0 $0$0
Paradies Shops Inc. Texas MarketplaceB14B (100.0%)$0 ($33,397)$33,397 (100.0%)$0 ($143,802)$143,802
Paradies Shops Inc. Stars are BrightC04C 7.5%$37,303 $2,586$34,717 10.2%$187,490 $17,342$170,148
Paradies Shops Inc. Brooks BrothersC12C (9.9%)$94,311 ($10,397)$104,709 3.5%$359,338 $12,208$347,130
Paradies Shops Inc. Texas MarketplaceC21C 6.3%$72,947 $4,336$68,611 1.7%$348,644 $5,740$342,903
Paradies Shops Inc. Lone Star AttitudeC33C (100.0%)$0 ($48,620)$48,620 (100.0%)$0 ($253,563)$253,563
(29.5%)$204,562 ($85,491)$290,053 (28.8%)$895,471 ($362,075)$1,257,546Paradies Shops Inc. Total
Paradies-DFW 2015 (F&B), LLC HickoryB22B -$221,811 $221,811$0 -$904,586 $904,586$0
Paradies-DFW 2015 (F&B), LLC ABACUS by Kent RathbunD22D -$40,086 $40,086$0 -$161,565 $161,565$0
Paradies-DFW 2015 (F&B), LLC KRs Whitetail BistroD22D 3.9%$61,981 $2,310$59,671 (13.6%)$229,587 ($36,255)$265,842
442.8%$323,877 $264,206$59,671 387.4%$1,295,737 $1,029,895$265,842Paradies-DFW 2015 (F&B), LLC Total
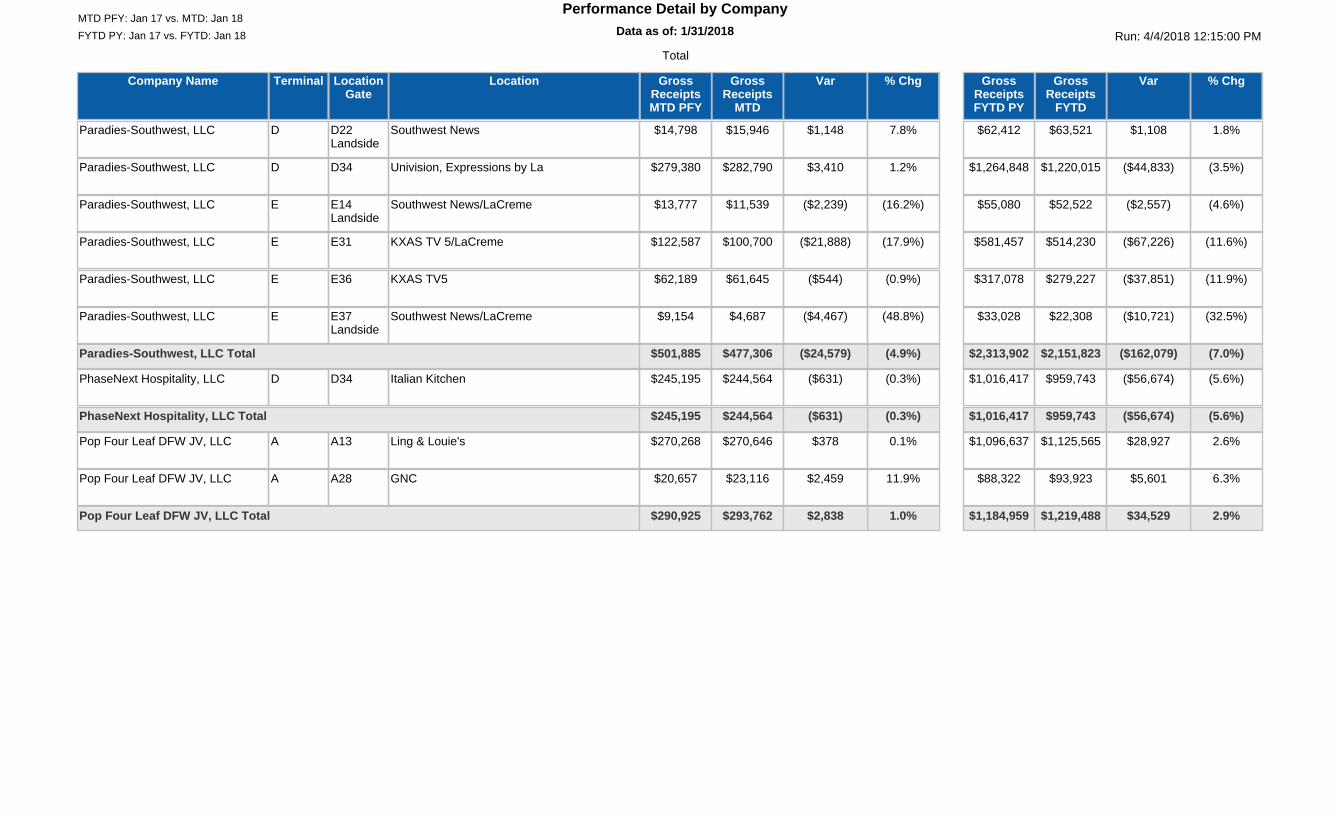
FYTD PY: Jan 17 vs. FYTD: Jan 18 Run: 4/4/2018 12:15:00 PMData as of: 1/31/201812:00:00 AM
Performance Detail by CompanyMTD PFY: Jan 17 vs. MTD: Jan 18
Total
Company Name LocationLocationGate
Terminal % ChgGrossReceipts
MTD
VarGrossReceiptsMTD PFY
% ChgGrossReceipts
FYTD
VarGrossReceiptsFYTD PY
Paradies-Southwest, LLC Southwest NewsD22Landside
D 7.8%$15,946 $1,148$14,798 1.8%$63,521 $1,108$62,412
Paradies-Southwest, LLC Univision, Expressions by LaD34D 1.2%$282,790 $3,410$279,380 (3.5%)$1,220,015 ($44,833)$1,264,848
Paradies-Southwest, LLC Southwest News/LaCremeE14Landside
E (16.2%)$11,539 ($2,239)$13,777 (4.6%)$52,522 ($2,557)$55,080
Paradies-Southwest, LLC KXAS TV 5/LaCremeE31E (17.9%)$100,700 ($21,888)$122,587 (11.6%)$514,230 ($67,226)$581,457
Paradies-Southwest, LLC KXAS TV5E36E (0.9%)$61,645 ($544)$62,189 (11.9%)$279,227 ($37,851)$317,078
Paradies-Southwest, LLC Southwest News/LaCremeE37Landside
E (48.8%)$4,687 ($4,467)$9,154 (32.5%)$22,308 ($10,721)$33,028
(4.9%)$477,306 ($24,579)$501,885 (7.0%)$2,151,823 ($162,079)$2,313,902Paradies-Southwest, LLC Total
PhaseNext Hospitality, LLC Italian KitchenD34D (0.3%)$244,564 ($631)$245,195 (5.6%)$959,743 ($56,674)$1,016,417
(0.3%)$244,564 ($631)$245,195 (5.6%)$959,743 ($56,674)$1,016,417PhaseNext Hospitality, LLC Total
Pop Four Leaf DFW JV, LLC Ling & Louie'sA13A 0.1%$270,646 $378$270,268 2.6%$1,125,565 $28,927$1,096,637
Pop Four Leaf DFW JV, LLC GNCA28A 11.9%$23,116 $2,459$20,657 6.3%$93,923 $5,601$88,322
1.0%$293,762 $2,838$290,925 2.9%$1,219,488 $34,529$1,184,959Pop Four Leaf DFW JV, LLC Total
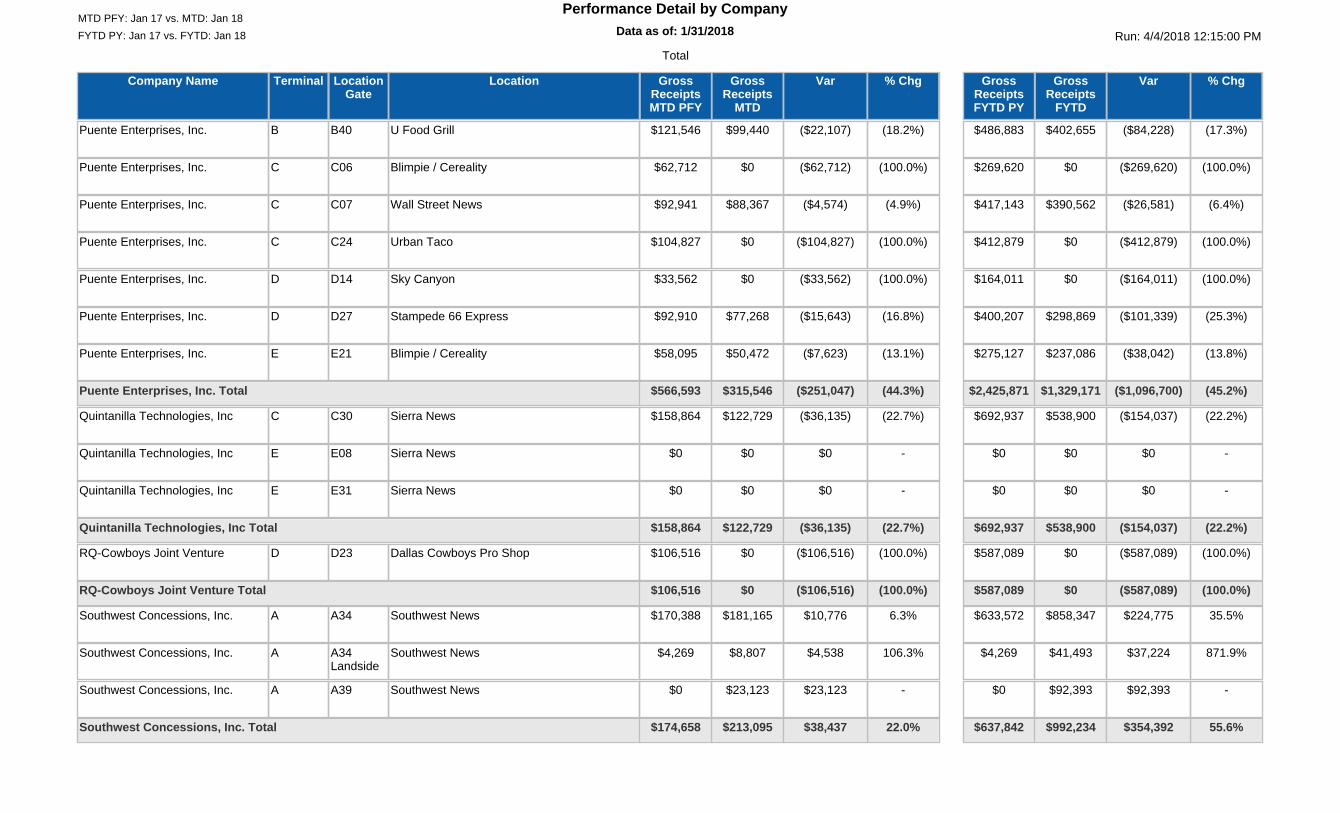
FYTD PY: Jan 17 vs. FYTD: Jan 18 Run: 4/4/2018 12:15:00 PMData as of: 1/31/201812:00:00 AM
Performance Detail by CompanyMTD PFY: Jan 17 vs. MTD: Jan 18
Total
Company Name LocationLocationGate
Terminal % ChgGrossReceipts
MTD
VarGrossReceiptsMTD PFY
% ChgGrossReceipts
FYTD
VarGrossReceiptsFYTD PY
Puente Enterprises, Inc. U Food GrillB40B (18.2%)$99,440 ($22,107)$121,546 (17.3%)$402,655 ($84,228)$486,883
Puente Enterprises, Inc. Blimpie / CerealityC06C (100.0%)$0 ($62,712)$62,712 (100.0%)$0 ($269,620)$269,620
Puente Enterprises, Inc. Wall Street NewsC07C (4.9%)$88,367 ($4,574)$92,941 (6.4%)$390,562 ($26,581)$417,143
Puente Enterprises, Inc. Urban TacoC24C (100.0%)$0 ($104,827)$104,827 (100.0%)$0 ($412,879)$412,879
Puente Enterprises, Inc. Sky CanyonD14D (100.0%)$0 ($33,562)$33,562 (100.0%)$0 ($164,011)$164,011
Puente Enterprises, Inc. Stampede 66 ExpressD27D (16.8%)$77,268 ($15,643)$92,910 (25.3%)$298,869 ($101,339)$400,207
Puente Enterprises, Inc. Blimpie / CerealityE21E (13.1%)$50,472 ($7,623)$58,095 (13.8%)$237,086 ($38,042)$275,127
(44.3%)$315,546 ($251,047)$566,593 (45.2%)$1,329,171 ($1,096,700)$2,425,871Puente Enterprises, Inc. Total
Quintanilla Technologies, Inc Sierra NewsC30C (22.7%)$122,729 ($36,135)$158,864 (22.2%)$538,900 ($154,037)$692,937
Quintanilla Technologies, Inc Sierra NewsE08E -$0 $0$0 -$0 $0$0
Quintanilla Technologies, Inc Sierra NewsE31E -$0 $0$0 -$0 $0$0
(22.7%)$122,729 ($36,135)$158,864 (22.2%)$538,900 ($154,037)$692,937Quintanilla Technologies, Inc Total
RQ-Cowboys Joint Venture Dallas Cowboys Pro ShopD23D (100.0%)$0 ($106,516)$106,516 (100.0%)$0 ($587,089)$587,089
(100.0%)$0 ($106,516)$106,516 (100.0%)$0 ($587,089)$587,089RQ-Cowboys Joint Venture Total
Southwest Concessions, Inc. Southwest NewsA34A 6.3%$181,165 $10,776$170,388 35.5%$858,347 $224,775$633,572
Southwest Concessions, Inc. Southwest NewsA34Landside
A 106.3%$8,807 $4,538$4,269 871.9%$41,493 $37,224$4,269
Southwest Concessions, Inc. Southwest NewsA39A -$23,123 $23,123$0 -$92,393 $92,393$0
22.0%$213,095 $38,437$174,658 55.6%$992,234 $354,392$637,842Southwest Concessions, Inc. Total

FYTD PY: Jan 17 vs. FYTD: Jan 18 Run: 4/4/2018 12:15:00 PMData as of: 1/31/201812:00:00 AM
Performance Detail by CompanyMTD PFY: Jan 17 vs. MTD: Jan 18
Total
Company Name LocationLocationGate
Terminal % ChgGrossReceipts
MTD
VarGrossReceiptsMTD PFY
% ChgGrossReceipts
FYTD
VarGrossReceiptsFYTD PY
Southwest Minority FinancialGroup, Inc.
Dickey'sC06C 0.2%$86,569 $174$86,394 9.7%$403,440 $35,802$367,638
Southwest Minority FinancialGroup, Inc.
Dickey's Barbecue PitESE (100.0%)$0 ($91,628)$91,628 (94.6%)$21,826 ($383,078)$404,904
(51.4%)$86,569 ($91,453)$178,022 (45.0%)$425,265 ($347,276)$772,542Southwest Minority Financial Group, Inc. Total
SSP America Inc. PizzaVinoD20D 14.1%$84,192 $10,425$73,767 10.1%$354,513 $32,509$322,005
SSP America Inc. Tigin Irish PubD20D (2.9%)$239,467 ($7,278)$246,745 (7.2%)$992,705 ($76,520)$1,069,225
1.0%$323,658 $3,146$320,512 (3.2%)$1,347,218 ($44,011)$1,391,229SSP America Inc. Total
Team Retail J V / Dallas, a TexasGP
Dallas Cowboys Pro ShopA33A (52.2%)$65,983 ($72,032)$138,015 (29.0%)$472,922 ($193,114)$666,036
Team Retail J V / Dallas, a TexasGP
Cowboys PinkD10D 27.0%$34,279 $7,279$26,999 31.6%$189,221 $45,477$143,744
(39.2%)$100,262 ($64,753)$165,014 (18.2%)$662,143 ($147,637)$809,780Team Retail J V / Dallas, a Texas GP Total
Texas Pretzels, Inc. Auntie Anne'sA21A 5.1%$95,529 $4,660$90,869 2.3%$412,656 $9,330$403,326
Texas Pretzels, Inc. Auntie Anne'sB33B (13.8%)$74,134 ($11,905)$86,039 (10.7%)$324,970 ($39,023)$363,993
Texas Pretzels, Inc. Auntie Anne'sC14C 24.0%$46,576 $9,002$37,575 30.2%$221,007 $51,198$169,809
Texas Pretzels, Inc. Auntie Anne'sC22C (2.6%)$76,114 ($2,031)$78,145 7.1%$370,200 $24,500$345,700
Texas Pretzels, Inc. Auntie Anne'sD12D (4.4%)$29,050 ($1,331)$30,382 (15.7%)$120,039 ($22,291)$142,330
Texas Pretzels, Inc. Auntie Anne'sD36D 1.1%$58,741 $612$58,130 (0.8%)$245,283 ($2,044)$247,327
Texas Pretzels, Inc. Auntie Anne'sE05E -$44,623 $44,623$0 -$213,713 $213,713$0
11.4%$424,767 $43,628$381,139 14.1%$1,907,867 $235,382$1,672,485Texas Pretzels, Inc. Total

FYTD PY: Jan 17 vs. FYTD: Jan 18 Run: 4/4/2018 12:15:00 PMData as of: 1/31/201812:00:00 AM
Performance Detail by CompanyMTD PFY: Jan 17 vs. MTD: Jan 18
Total
Company Name LocationLocationGate
Terminal % ChgGrossReceipts
MTD
VarGrossReceiptsMTD PFY
% ChgGrossReceipts
FYTD
VarGrossReceiptsFYTD PY
TGIF/DFW Restaurant JointVenture
T.G.I. Friday'sB12B (13.5%)$525,725 ($82,140)$607,864 (17.7%)$1,987,674 ($426,264)$2,413,938
TGIF/DFW Restaurant JointVenture
T.G.I. Friday'sC07C (6.5%)$391,036 ($27,160)$418,196 (3.5%)$1,733,806 ($62,697)$1,796,504
TGIF/DFW Restaurant JointVenture
T.G.I. Friday'sC30C (14.7%)$618,394 ($106,364)$724,758 (10.3%)$2,578,611 ($296,512)$2,875,123
TGIF/DFW Restaurant JointVenture
T.G.I. Friday'sE17E (15.7%)$359,410 ($66,709)$426,119 (6.9%)$1,690,136 ($124,711)$1,814,847
(13.0%)$1,894,564 ($282,373)$2,176,938 (10.2%)$7,990,228 ($910,185)$8,900,412TGIF/DFW Restaurant Joint Venture Total
TGIF/DFW Terminal A RestaurantJoint Venture
T.G.I. Friday'sA14A 1.5%$539,896 $7,916$531,980 (0.4%)$2,210,691 ($9,558)$2,220,249
1.5%$539,896 $7,916$531,980 (0.4%)$2,210,691 ($9,558)$2,220,249TGIF/DFW Terminal A Restaurant Joint Venture Total
The Jethro Pugh Shops II, LLC TeavanaA16A (13.0%)$28,555 ($4,279)$32,834 7.3%$138,532 $9,451$129,081
The Jethro Pugh Shops II, LLC CNBC NewsA20A 2.6%$224,863 $5,646$219,217 9.3%$1,002,565 $84,897$917,667
The Jethro Pugh Shops II, LLC CNBC News KioskA21A -$0 $0$0 -$0 $0$0
The Jethro Pugh Shops II, LLC Texas MarketplaceB10B 14.8%$41,647 $5,364$36,283 19.9%$194,649 $32,265$162,384
The Jethro Pugh Shops II, LLC DFW News KioskC02C (28.5%)$17,692 ($7,041)$24,733 9.2%$102,696 $8,690$94,006
The Jethro Pugh Shops II, LLC L'OccitaneD33D (4.7%)$61,171 ($3,026)$64,197 (10.9%)$289,992 ($35,599)$325,591
The Jethro Pugh Shops II, LLC The RangeD37D (11.4%)$43,372 ($5,574)$48,946 (9.8%)$206,537 ($22,444)$228,981
The Jethro Pugh Shops II, LLC Texas MarketplaceE15E 7.3%$110,338 $7,490$102,848 24.0%$581,061 $112,389$468,672
The Jethro Pugh Shops II, LLC Lone Star AttitudeE34E 26.1%$19,568 $4,046$15,522 7.9%$104,532 $7,688$96,845
The Jethro Pugh Shops II, LLC DFW NewsESE (100.0%)$0 ($151,715)$151,715 (97.7%)$15,052 ($632,052)$647,104
(21.4%)$547,206 ($149,088)$696,294 (14.2%)$2,635,615 ($434,714)$3,070,329The Jethro Pugh Shops II, LLC Total
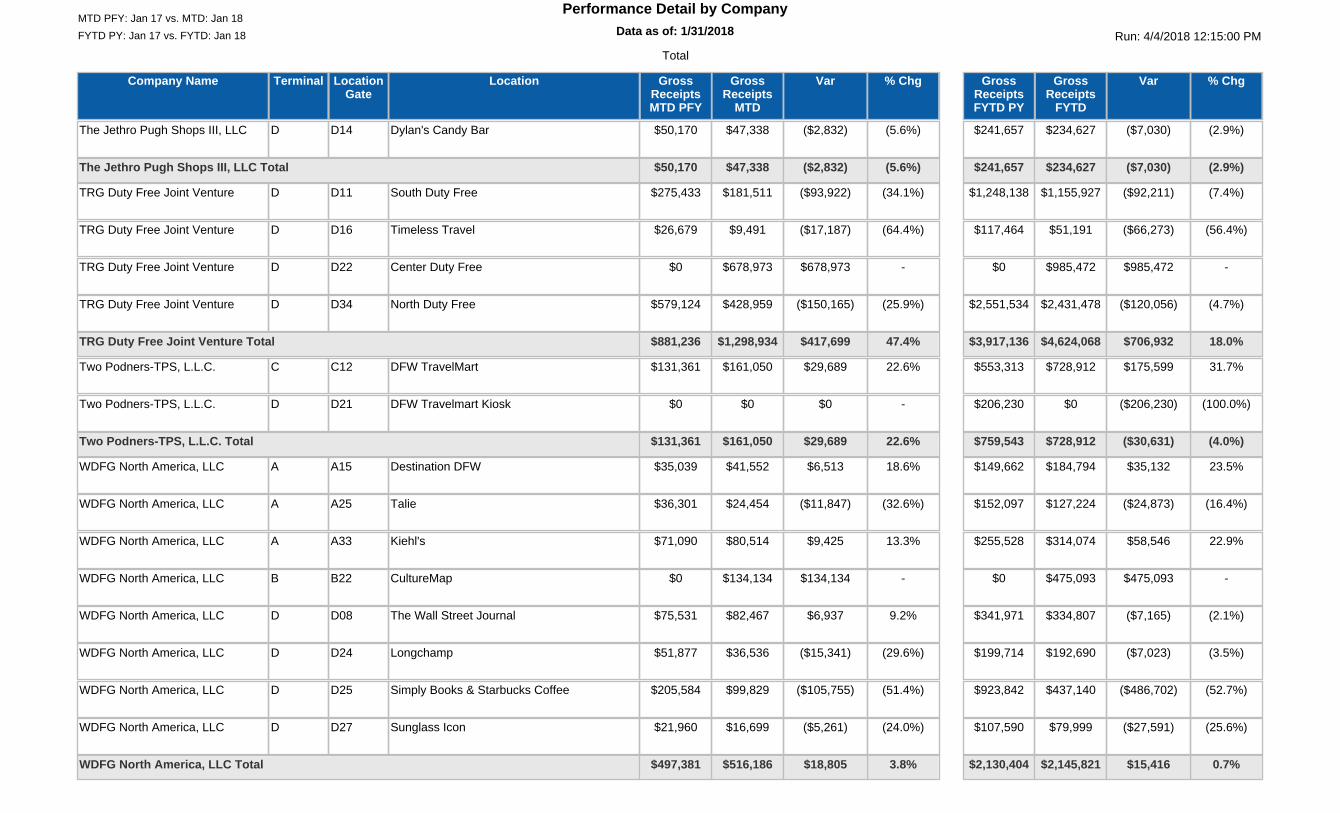
FYTD PY: Jan 17 vs. FYTD: Jan 18 Run: 4/4/2018 12:15:00 PMData as of: 1/31/201812:00:00 AM
Performance Detail by CompanyMTD PFY: Jan 17 vs. MTD: Jan 18
Total
Company Name LocationLocationGate
Terminal % ChgGrossReceipts
MTD
VarGrossReceiptsMTD PFY
% ChgGrossReceipts
FYTD
VarGrossReceiptsFYTD PY
The Jethro Pugh Shops III, LLC Dylan's Candy BarD14D (5.6%)$47,338 ($2,832)$50,170 (2.9%)$234,627 ($7,030)$241,657
(5.6%)$47,338 ($2,832)$50,170 (2.9%)$234,627 ($7,030)$241,657The Jethro Pugh Shops III, LLC Total
TRG Duty Free Joint Venture South Duty FreeD11D (34.1%)$181,511 ($93,922)$275,433 (7.4%)$1,155,927 ($92,211)$1,248,138
TRG Duty Free Joint Venture Timeless TravelD16D (64.4%)$9,491 ($17,187)$26,679 (56.4%)$51,191 ($66,273)$117,464
TRG Duty Free Joint Venture Center Duty FreeD22D -$678,973 $678,973$0 -$985,472 $985,472$0
TRG Duty Free Joint Venture North Duty FreeD34D (25.9%)$428,959 ($150,165)$579,124 (4.7%)$2,431,478 ($120,056)$2,551,534
47.4%$1,298,934 $417,699$881,236 18.0%$4,624,068 $706,932$3,917,136TRG Duty Free Joint Venture Total
Two Podners-TPS, L.L.C. DFW TravelMartC12C 22.6%$161,050 $29,689$131,361 31.7%$728,912 $175,599$553,313
Two Podners-TPS, L.L.C. DFW Travelmart KioskD21D -$0 $0$0 (100.0%)$0 ($206,230)$206,230
22.6%$161,050 $29,689$131,361 (4.0%)$728,912 ($30,631)$759,543Two Podners-TPS, L.L.C. Total
WDFG North America, LLC Destination DFWA15A 18.6%$41,552 $6,513$35,039 23.5%$184,794 $35,132$149,662
WDFG North America, LLC TalieA25A (32.6%)$24,454 ($11,847)$36,301 (16.4%)$127,224 ($24,873)$152,097
WDFG North America, LLC Kiehl'sA33A 13.3%$80,514 $9,425$71,090 22.9%$314,074 $58,546$255,528
WDFG North America, LLC CultureMapB22B -$134,134 $134,134$0 -$475,093 $475,093$0
WDFG North America, LLC The Wall Street JournalD08D 9.2%$82,467 $6,937$75,531 (2.1%)$334,807 ($7,165)$341,971
WDFG North America, LLC LongchampD24D (29.6%)$36,536 ($15,341)$51,877 (3.5%)$192,690 ($7,023)$199,714
WDFG North America, LLC Simply Books & Starbucks CoffeeD25D (51.4%)$99,829 ($105,755)$205,584 (52.7%)$437,140 ($486,702)$923,842
WDFG North America, LLC Sunglass IconD27D (24.0%)$16,699 ($5,261)$21,960 (25.6%)$79,999 ($27,591)$107,590
3.8%$516,186 $18,805$497,381 0.7%$2,145,821 $15,416$2,130,404WDFG North America, LLC Total
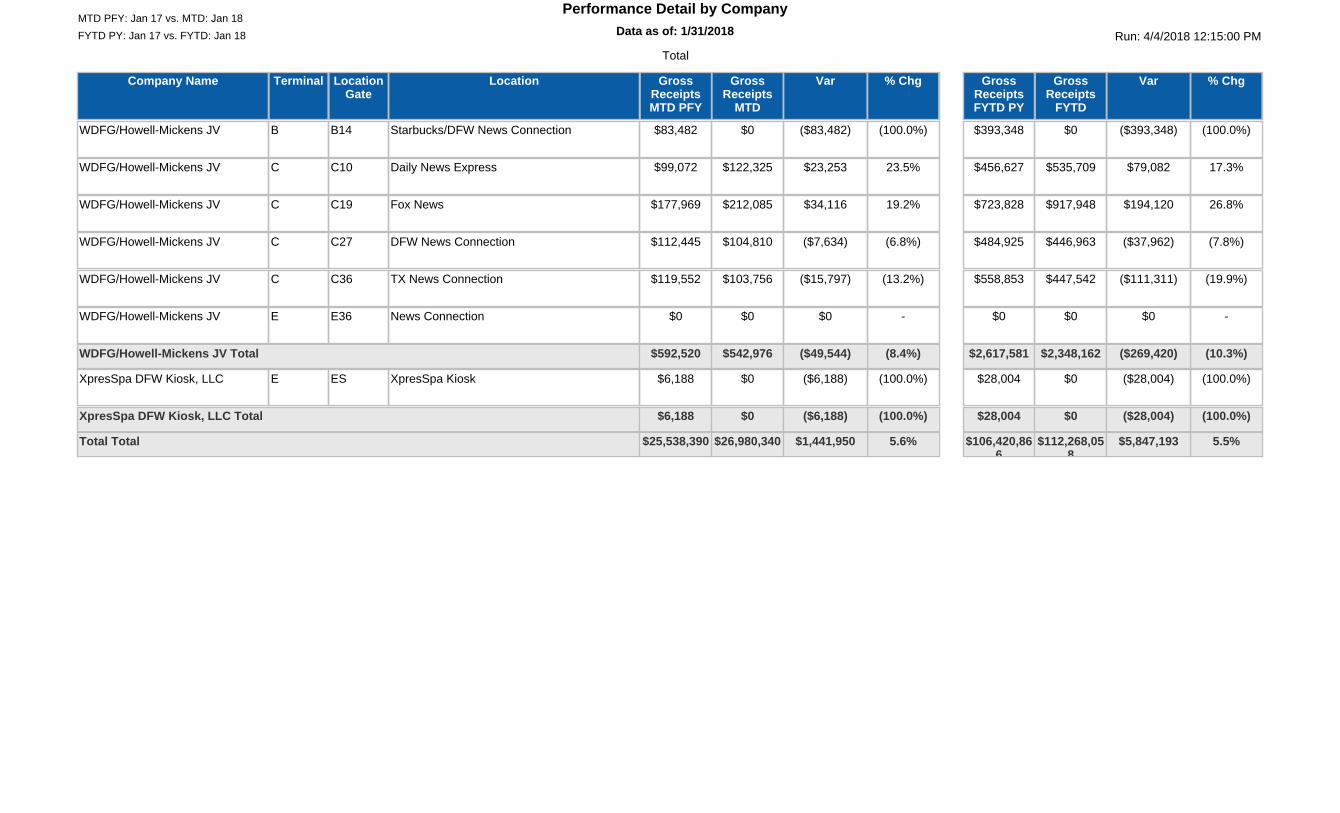
FYTD PY: Jan 17 vs. FYTD: Jan 18 Run: 4/4/2018 12:15:00 PMData as of: 1/31/201812:00:00 AM
Performance Detail by CompanyMTD PFY: Jan 17 vs. MTD: Jan 18
Total
Company Name LocationLocationGate
Terminal % ChgGrossReceipts
MTD
VarGrossReceiptsMTD PFY
% ChgGrossReceipts
FYTD
VarGrossReceiptsFYTD PY
WDFG/Howell-Mickens JV Starbucks/DFW News ConnectionB14B (100.0%)$0 ($83,482)$83,482 (100.0%)$0 ($393,348)$393,348
WDFG/Howell-Mickens JV Daily News ExpressC10C 23.5%$122,325 $23,253$99,072 17.3%$535,709 $79,082$456,627
WDFG/Howell-Mickens JV Fox NewsC19C 19.2%$212,085 $34,116$177,969 26.8%$917,948 $194,120$723,828
WDFG/Howell-Mickens JV DFW News ConnectionC27C (6.8%)$104,810 ($7,634)$112,445 (7.8%)$446,963 ($37,962)$484,925
WDFG/Howell-Mickens JV TX News ConnectionC36C (13.2%)$103,756 ($15,797)$119,552 (19.9%)$447,542 ($111,311)$558,853
WDFG/Howell-Mickens JV News ConnectionE36E -$0 $0$0 -$0 $0$0
(8.4%)$542,976 ($49,544)$592,520 (10.3%)$2,348,162 ($269,420)$2,617,581WDFG/Howell-Mickens JV Total
XpresSpa DFW Kiosk, LLC XpresSpa KioskESE (100.0%)$0 ($6,188)$6,188 (100.0%)$0 ($28,004)$28,004
(100.0%)$0 ($6,188)$6,188 (100.0%)$0 ($28,004)$28,004XpresSpa DFW Kiosk, LLC Total
5.6%$26,980,340 $1,441,950$25,538,390 5.5%$112,268,058
$5,847,193$106,420,866
Total Total