Embed Size (px)
Citation preview

Audited by
SUPREME AUDIT OFFICE OF POLAND NAJWYŻSZA IZBA KONTROLI (NIK)
CERN/3303CERN/FC/6117Original: English/French31 March 2017
2016Financial Statements
for the year ended 31 December
The Finance Committee is invited to recommend to the Counciland the Council is invited to approve the 2016 Financial Statementsand to grant discharge to the Director-General.
For recommendation to Council
FINANCE COMMITTEE 360th Meeting13 and 14 June 2017
Simple majority of Member States represented and voting and 51% of the contributions of all Member States
For approval COUNCIL185th Session15 and 16 June 2017
Simple majority of Member States represented and voting
Action to be taken
Voting Procedure

1
Table of contents
EXECUTIVE SUMMARY .................................................................................................... 5
AUDIT OPINION ................................................................................................................. 7
SIGNATURE OF THE CERN OFFICIAL REPRESENTATIVES ..................................... 13
1. STATEMENT OF FINANCIAL POSITION ............................................................... 15
2. STATEMENT OF CHANGES IN NET ASSETS ...................................................... 16
3. STATEMENT OF FINANCIAL PERFORMANCE ................................................... 17
4. CASH-FLOW STATEMENT ..................................................................................... 18
5. STATEMENT OF COMPARISON OF BUDGET AND ACTUAL AMOUNTS ........ 19
6. ACCOUNTING RECONCILIATION OF BUDGET ACTUAL AMOUNTS TO STATEMENT OF FINANCIAL PERFORMANCE ................................................... 20
7. NOTES TO THE FINANCIAL STATEMENTS ......................................................... 21 7.1. SUMMARY OF SIGNIFICANT ACCOUNTING POLICIES .................................... 21 7.1.1. BASIS OF PREPARATION ............................................................................... 21 7.1.2. USE OF ESTIMATES AND ASSUMPTIONS.................................................... 22 7.1.3. UNIT OF ACCOUNT AND FOREIGN CURRENCY TRANSLATION ............... 22 7.1.4. ADJUSTMENTS AND CHANGES IN ACCOUNTING POLICY ........................ 22 7.1.5. ASSETS ............................................................................................................. 24 7.1.6. LIABILITIES ....................................................................................................... 34 7.1.7. REVENUE .......................................................................................................... 36 7.1.8. INTERNAL TAXATION ...................................................................................... 37 7.1.9. FINANCIAL INSTRUMENTS ............................................................................. 37 7.2. COMMITMENTS NOT SHOWN IN THE STATEMENT OF FINANCIAL POSITION
........................................................................................................................... 38 7.2.1. PENSION FUND ................................................................................................ 38 7.2.2. BANKER’S GUARANTEES IN OUR POSSESSION ........................................ 38 7.2.3. BANKER’S GUARANTEES GIVEN BY CERN ................................................. 39 7.2.4. FUTURE COMMITMENTS TO SUPPLIERS .................................................... 39 7.3. PROPERTY, PLANT AND EQUIPMENT ............................................................... 39 7.3.1. PROPERTY, PLANT AND EQUIPMENT AVAILABLE FOR USE .................... 39 7.3.2. PROPERTY, PLANT AND EQUIPMENT IN PROGRESS ............................... 41 7.4. INTANGIBLE ASSETS ........................................................................................... 43 7.4.1. INTANGIBLE ASSETS AVAILABLE FOR USE ................................................ 43 7.4.2. INTANGIBLE ASSETS IN PROGRESS ............................................................ 44 7.5. INVENTORIES ......................................................................................................... 44 7.6. RECEIVABLES ....................................................................................................... 45

2
7.6.1. MEMBER STATES ............................................................................................ 45 7.6.2. TAXES ............................................................................................................... 45 7.6.3. TEAMS AND COLLABORATIONS ................................................................... 45 7.6.4. OTHER RECEIVABLES AND PREPAYMENTS ............................................... 46 7.7. OTHER FINANCIAL ASSETS ................................................................................ 46 7.8. CASH AND CASH EQUIVALENTS ........................................................................ 46 7.9. NET ASSETS .......................................................................................................... 46 7.10. LONG-TERM DEBTS .............................................................................................. 47 7.10.1. BNP FORTIS ..................................................................................................... 48 7.10.2. FIPOI .................................................................................................................. 48 7.11. CHIS FUND ............................................................................................................. 49 7.12. OTHER LIABILITIES - MEMBER STATES ............................................................ 50 7.13. POST-EMPLOYMENT BENEFITS ......................................................................... 51 7.14. OTHER PROVISIONS ............................................................................................. 55 7.15. SHORT-TERM DEBT AND BANK OVERDRAFT .................................................. 59 7.16. PAYABLES ............................................................................................................. 59 7.16.1. TRADE ACCOUNTS ......................................................................................... 59 7.16.2. TEAMS AND COLLABORATIONS ................................................................... 60 7.16.3. EMPLOYEE BENEFITS .................................................................................... 60 7.17. DEFERRED REVENUE ........................................................................................... 61 7.18. OTHER CURRENT LIABILITIES ............................................................................ 62 7.19. MEMBER STATES’ CONTRIBUTIONS ................................................................. 63 7.20. EU CONTRIBUTIONS ............................................................................................. 64 7.21. OTHER REVENUE .................................................................................................. 65 7.22. MATERIAL EXPENSES .......................................................................................... 66 7.23. PERSONNEL EXPENSES ...................................................................................... 67 7.24. FINANCIAL REVENUE AND EXPENSES ............................................................. 68 7.25. MANAGEMENT OF FINANCIAL RISKS ................................................................ 68 7.25.1. LIQUIDITY RISK ................................................................................................ 69 7.25.2. MARKET RISK ................................................................................................... 69 7.25.3. CREDIT RISK .................................................................................................... 70 7.25.4. INTEREST RISK ................................................................................................ 71 7.25.5. CURRENCY RISK ............................................................................................. 71 7.26. FINANCIAL INSTRUMENTS .................................................................................. 72 7.26.1. FINANCIAL INSTRUMENTS BY CATEGORY ................................................. 72 7.26.2. FAIR VALUE LEVELS ....................................................................................... 73 7.26.3. GAINS AND LOSSES ON FINANCIAL INSTRUMENTS ................................. 74 7.27. RECAPITALISATION OF THE PENSION FUND .................................................. 74 7.28. RELATED PARTY DISCLOSURES ....................................................................... 75
8. NOTES TO THE BUDGET ACTUAL AMOUNTS ................................................... 77 8.1. SUMMARY OF REVENUE AND EXPENSES BY ACTIVITY ................................ 79 8.2. MATERIAL EXPENSES .......................................................................................... 80 8.3. PERSONNEL EXPENSES ...................................................................................... 80 8.3.1. EXPENSES BY NATURE .................................................................................. 80

3
8.3.2. DISTRIBUTION OF FTE BY ACTIVITY ............................................................ 81 8.4. INTEREST AND FINANCIAL COSTS .................................................................... 82 8.5. CAPITAL REPAYMENTS ....................................................................................... 82

4

5
EXECUTIVE SUMMARY
CERN, the European Organisation for Nuclear Research, operates the world’s leading laboratory for particle physics. Its mission is fundamental physics research, namely the study of the elementary constituents of the Universe and their interactions. Founded in 1954, CERN has become a prime example of international collaboration, with 22 Member States as of December 2016. Associate Member States and additional countries around the globe also contribute to, and participate in, the research programmes.
Presented in this document are the Financial Statements of CERN for the year ending 31 December 2016. These accounts have been prepared in compliance with the International Public Sector Accounting Standards (IPSAS), as they have been every year since 2007. Highlights from the 2016 financial statements include
Budget surplus in the year of 84.8 MCHF compared to original expected deficit of 8.5 MCHF, mainly attributable to a re-profiling of some expenses to take into account a more realistic time scale for the execution of some projects and activities (see details below);
Restatement of prior year financial position and cumulative balances as a result of Property, Plant and Equipment (PPE) adjustments to the opening balances and a change in accounting policy for calculating the radioactive waste provision;
Actuarial gains relating to the post-employment benefits were recognized in the year amounting to 434.6 MCHF following a review of the actuarial parameters resulting in a reduction of the expected inflation rate of costs on long-term care;
Increase in net assets of 296.7 MCHF, to bring the balance at the end of 2016 to -329.7 MCHF, compared to the restated balance of -626.4 MCHF (reported in the 2015 financial statements as -598.3 MCHF prior to restatement).
The year 2016 is the first full year operating under the revised PPE accounting policy and procedures, and the intangible assets accounting policy implemented in 2015. In the course of the year, it was identified that some adjustments were needed to the figures appearing in the 2015 financial statements. These adjustments are due to changes in opening balances integrated in 2015, changes in residual values used in calculating depreciation, and reclassifications between the in-progress and completed assets. Equally, a change in the method for calculating the radioactive waste provision is implemented in the 2016 financial statements. A discount rate is applied to the estimated future cash flows for disposing of radioactive waste in order to ensure the liability reflects the time value of money. As a result of the corrections to non-current assets and the change in policy for calculating the provision, the Statement of Financial Position at 31 December 2015 and all cumulative balances are restated in the 2016 financial statements to reflect the impact of these adjustments as if they had always been in effect in order to comply with IPSAS. The total effect on net assets of the restatement is -28.1 MCHF.

6
The budget deficit for 2016 was initially foreseen to be -8.5 MCHF, revised to 29.5 MCHF in June 2016. The actual budget surplus for the year amounts to 84.8 MCHF. The main reasons for the 93.3 MCHF difference are as follows
The revised budget surplus was mainly the result of the re-profiling of some expenses to years after 2016, amounting to 30 MCHF in total, and the expected reduction of 13 MCHF to expenses due to the appreciation of the exchange rate CHF-EUR;
Priority was given to the LHC operation and upgrades, for which slightly more than the anticipated budget was spent. This entailed a shortage of personnel for other activities and thus an underspending in e.g. some non-LHC and R&D projects, and in accelerator maintenance and consolidation;
Expenses were re-profiled also for some building projects; savings were made in the expenses of the administration budget allocated to the Directorate, coming from the new organizational structure.
Taking into account 25.1 MCHF in capital repayments and 60 MCHF for the recapitalization of the Pension Fund, the final amount to be allocated to the budget balance is -0.3 MCHF, which will be added to the cumulative budget deficit. More details are available in the Annual Progress Report for 20161, and a reconciliation of the financial net deficit to the budget surplus appears in the following pages.
1 CERN/FC/6096/RA – CERN/3294/RA
7
AUDIT OPINION
8

9

10
11

12
13
SIGNATURE OF THE CERN OFFICIAL REPRESENTATIVES
The undersigned hereby certify that, to the best of their knowledge, the information contained in the Financial Statements for 2016 fairly presents the financial conditions and results of operations of the Organization.
Martin Steinacher Fabiola Gianotti
Director for Finance Director-General
and Human Resources

14

15
1. STATEMENT OF FINANCIAL POSITION
As at As at31.12.2016 31.12.2015
(*restated)
ASSETSNon-current assetsScientific Programmes
LHC Programme 7.3.1 5 372 441 5 645 314 Other Programmes 7.3.1 1 324 816 1 232 819
Non Scientific Programmes 7.3.1 691 575 631 163
7 388 832 7 509 296 *
In progress Scientific Programmes 7.3.2 502 997 440 644 Non Scientific Programmes 7.3.2 30 466 61 596
533 463 502 240 *
Intangible Assets available for use 7.4.1 124 656 115 943 *Intangible Assets in progress 7.4.2 6 492 5 509 *CHIS Fund financial assets 7.11 217 393 205 027
8 270 836 8 338 015
Current assetsInventories 7.5 15 188 14 328 Receivables - Member States 7.6.1 38 296 80 165 Receivables - Taxes 7.6.2 7 619 14 215 Receivables - Teams & Collaborations 7.6.3 5 258 4 936 Other receivables and prepayments 7.6.4 24 742 24 440 Other financial assets 7.7 60 000 Cash and cash equivalents 7.8 154 615 176 200
305 719 314 285
8 576 555 8 652 300
LIABILITIES & NET ASSETSNet assets 7.9
Accumulated surpluses & deficits - 171 108 - 358 295 Net surplus/deficit (-) for the period - 158 565 - 268 064
- 329 673 - 626 359 *
Non-current liabilitiesLong-term debts 7.10 281 939 307 868 Long term liabilities - CHIS Fund 7.11 188 484 177 946 Post-employment benefits 7.13 7 858 110 8 155 838 Provisions - Others 7.14 155 273 201 846 *
8 483 806 8 843 498
Current liabilitiesShort-term debt and bank overdraft 7.15 25 929 25 108 Short term liabilities - CHIS Fund 7.11 28 909 27 081 Payables - Trade accounts 7.16.1 70 992 67 352 Payables - Teams & Collaborations 7.16.2 197 355 183 615 Payables - Employee benefits 7.16.3 68 006 67 359 Deferred revenue 7.17 26 856 60 167 Other liabilities - Member States 7.12 2 277 2 277 Other current liabilities 7.18 2 098 2 203
422 422 435 161
8 576 555 8 652 300 Total
kCHF
Note
Total
Sub-total - Property, Plant and Equipment available for use
Sub-total - Property, Plant and Equipment in progress

16
2. STATEMENT OF CHANGES IN NET ASSETS
kCHF
Accumulated gains & losses from defined
benefits plans*
Revaluation surplus *
Accumulated surpluses &
deficitsTotal
Balance as at 31.12.2014 -8 458 101 15 764 7 381 184 -1 061 153
Changes during the period 2015 738 852 - 7 949 - 268 064 462 840
Actuarial gains – Health Care 297 289
Actuarial gains – Pensions 441 563
Balance as at 31.12.2015 -7 719 248 7 815 7 113 120 - 598 313 Adjustments and change to accounting method
- 28 046 - 28 046
Balance as at 31.12.2015 (restated) -7 719 248 7 815 7 085 075 - 626 359
Changes during the period 2016 434 686 20 564 - 158 565 296 685
Actuarial gains – Health Care 416 603
Actuarial gains – Pensions 18 083
Balance as at 31.12.2016 -7 284 562 28 379 6 926 510 - 329 673
* recognized directly in net assets
The above statement includes the Organization’s net surplus for the year as well as other valuations adjustments that, in line with IPSAS, are not recorded in the Statement of Financial Performance but directly in the Statement of Financial Position. In 2016, these included the actuarial gains on defined benefit plans and the impact of the revaluation of the land.
Also included in the above table are the effects of the restatement to the financial statements for adjustments and change in accounting methods. Refer to note 7.1.4 for more details.
For more information about the variation for the year, please refer to note 7.9.

17
3. STATEMENT OF FINANCIAL PERFORMANCE
Note 2016 2015 Variation
Member States' Contributions 7.19 1 114 232 1 048 775 65 456 Candidate for Accession Contributions 7.19 4 774 8 155 - 3 380 Associate Member State Contributions 7.19 8 439 5 273 3 166 Special Contribution from Member State 7.19 602 9 451 - 8 850 EU contributions 7.20 17 628 16 440 1 188 Financial Revenue 7.24 1 082 6 369 - 5 287 Internal taxation 31 451 30 047 1 404 Other revenue 7.21 54 223 64 748 - 10 526
Total 1 232 429 1 189 258 43 171
Goods, Consumables & Supplies 67 161 66 786 374 Electricity, heating gas and water 59 281 64 604 - 5 323 Industrial services 76 094 75 694 400 Associated Members of Personnel 28 691 32 068 - 3 378 Other overheads 42 365 50 419 - 8 054
7.22 273 591 289 571 - 15 980
Remuneration 285 382 264 834 20 548 Social and family benefits 59 298 58 414 884 Social insurance cover 102 671 98 313 4 358 Annual variation - paid leave - 823 - 758 - 65 Post-employment benefits 166 778 183 262 - 16 484 Internal taxation 31 451 30 047 1 404
7.23 644 756 634 111 10 645 7.24 13 857 15 124 - 1 267
418 730 407 725 11 005
CHANGE IN PROVISION FOR RADIOACTIVE WASTE 7.14 - 36 344 45 894 - 82 238
7.3.1 16 405 4 897 11 508
7.27 60 000 60 000
Total 1 390 994 1 457 322 - 66 327
- 158 565 - 268 064 109 499
kCHF
REVENUE
PERSONNEL
EXPENSES
MATERIALS
FINANCIAL EXPENSES
NET SURPLUS/DEFICIT (-) FOR THE PERIOD
RECAPITALISATION PENSION FUND
DEPRECIATION AND AMORTIZATION EXPENSES
WRITE-OFF PROPERTY, PLANT AND EQUIPMENT

18
4. CASH-FLOW STATEMENT
2016 2015
- 158 565 - 268 064
60 000 60 000
Adjustments for Non-cash movementsDepreciation on non-current assets 418 712 407 743 Provision for post employment benefits 136 958 153 463 Provision for radioactive waste - 36 344 45 893 Increase (Decrease) in provision for doubtful debts 18 - 18 Increase (Decrease) in provision for expenses - 45 - 455 Losses (Gains) on write-off of non-current assets 16 405 4 897 In-kind revenues - 7 384 - 19 465
Net adjustments for non-cash movements 528 320 592 058 Increase (Decrease) in inventories - 861 2 518 Increase (Decrease) in receivable - Member States 16 974 42 295 Increase (Decrease) in receivable - EU projects - 12 250 1 843 Increase (Decrease) in receivable - Taxation 6 596 4 814 Increase (Decrease) in payables - Personnel 12 932 11 175 Increase (Decrease) in payables - Suppliers 1 687 - 18 399 Increase (Decrease) in other current assets - 2 632 - 5 188 Net variation of Teams and Collaborations 13 462 2 806
Net cash-flow - Operating Activities (A) 465 663 425 858
Personnel expenses in PPE - 122 073 - 130 957 Material expenses in PPE - 207 701 - 154 703 Variance in other financial assets - 60 000 50 000 CHIS Fund capitalisation - 12 365 - 14 769
Net cash-flow - Investing activities (B) - 402 140 - 250 429
Proceeds from long-term borrowingsRepayments of long-term borrowings - 25 108 - 56 952 Net variation of short-term borrowingsRecapitalisation Pension Fund - 60 000 - 60 000
Net cash-flow - Financing activities (C) - 85 108 - 116 952
- 21 585 58 477
176 200 117 723
154 615 176 200
* Recapitalisation Pension Fund is included in the Deficit. Since it is an investing activity, it is added
back under the operating activities and shown in the financing activities.
CASH-FLOW FROM INVESTING ACTIVITIES
CASH-FLOW FROM FINANCING ACTIVITIES
Less recapitalisation Pension Fund*
CASH AND CASH EQUIVALENTS AT END OF PERIOD
CASH AND CASH EQUIVALENTS AT BEGINNING OF PERIOD
NET VARIATION IN CASH AND CASH EQUIVALENTS (A+B+C)
kCHF
CASH-FLOW FROM OPERATING ACTIVITIES
Surplus/(Deficit) from the Statement of Financial Performance

19
5. STATEMENT OF COMPARISON OF BUDGET AND ACTUAL AMOUNTS
Final 2016 Budget
NoteCERN/FC/5955 (2016 prices)
Member States' contributions 1 108.8 1 114.2 5.4 Additional contribution from Romania as Candidate for Accession 10.9 4.8 - 6.1
Special contribution from Israel 0.2 - 0.2 Additional contribution from Serbia as Associate Member State 1.3 1.3 0.0 Additional contribution from Turkey as Associate Member State 4.8 4.8 - 0.0 Additional contribution from Pakistan as Associate Member State 1.4 1.3 - 0.1 Contributions anticipated from new Associate Member States 3.5 1.0 - 2.5 EU Contributions 14.4 17.6 3.2 Other revenues 82.2 93.0 10.8
8.1 1 227.5 1 238.0 10.5
Materials 8.2 592.9 486.5 - 106.4 Personnel 8.3 630.3 647.2 17.0 Interest and Financial Costs 8.4 12.9 19.5 6.6
1 236.0 1 153.2 - 82.8
A. - 8.5 84.8 93.4
B. 8.5 25.1 25.1
C. 7.27 60.0 60.0
7.9 - 93.6 - 0.3 93.4
7.9 - 260.4 - 118.4 93.4
BUDGET SURPLUS/DEFICIT (-) FOR THE PERIOD*
CAPITAL REPAYMENTS
RECAPITALISATION PENSION FUND
Variation of Actual
amounts with respect to
Budget
CUMULATIVE BUDGET BALANCE
MCHF
ALLOCATION TO BUDGET BALANCE (A-B-C)
2016 Actual amounts
Revenues
Expenses
* refer to note 8

20
6. ACCOUNTING RECONCILIATION OF BUDGET ACTUAL AMOUNTS TO STATEMENT OF FINANCIAL PERFORMANCE
The Budget is recorded based on modified accrual basis accounting while the revenue and expenses on the Statement of Financial Performance are recorded under accrual basis accounting.
The summary of differences between the budget actual amounts and the amounts recognised in the Statement of Financial Performance are shown in the following table. Note that the expenses transferred to PPE concern most categories of expenses, which should be taken into account if making a detailed comparison.
Note MCHF
84.8
- 100.2
Expenses capitalized to PPE and intangible assets 7.3, 7.4 334.9
Depreciation and amortization expenses 7.3, 7.4 - 418.7
Write-off PPE 7.3 - 16.4
- 143.3
Variation of provision for post-employment benefits 7.13 - 136.9
Recapitalisation Pension Fund 7.27 - 60.0
Variation of provision for elimination of radioactive waste 7.14 36.3
Amortization of staff benefit accruals* 17.3
- 243.5
- 158.6
BUDGET SURPLUS/DEFICIT (-) FOR THE PERIOD (A)
Property, plant and equipment (PPE) reconciliation (B)
TOTAL ACCOUNTING RECONCILIATION (D) = (B)+(C)
Items not recognized in the Budget Surplus/Deficit (C)
NET ACCOUNTING SURPLUS/DEFICIT (-) FOR THE PERIOD = (A)+(D)
* Amortization of the accruals of staff's paid leave and similar allowances, introduced for the first time in the Financial Statements for the year 2007 (CERN/FC/5245 - CERN/2787)

21
7. NOTES TO THE FINANCIAL STATEMENTS
Founded in 1954, CERN, the European Organization for Nuclear Research, is an Intergovernmental Organization located in Geneva, Switzerland.
CERN’s mission is to provide for collaboration between Member States and Associate Member States in the field of high-energy particle physics research, and to this end, it designs, constructs and runs the necessary particle accelerators and the associated experimental areas. Accelerators boost beams of particles to high energies before they are made to collide with each other or with stationary targets. Detectors observe and record the results of these collisions.
CERN also hosts numerous international collaborations and visiting scientists.
7.1. SUMMARY OF SIGNIFICANT ACCOUNTING POLICIES
7.1.1. BASIS OF PREPARATION
The financial statements of CERN as at and for the year ending 31 December 2016 have been prepared in accordance with International Public Sector Accounting Standards (IPSAS) and in conformity with the Financial Rules and their implementing regulations approved by the Organization's governing bodies.
They have been approved by the Director-General and the Director for Finance and Human Resources on 31 March 2017.
Although the Pension Fund is legally part of the Organization, its accounts are the subject of a separate report by the Administration of the Pension Fund. The report is endorsed by the Governing Board of the Pension Fund and submitted to the Council for approval through the Finance Committee.
While the accounts of CERN are maintained to the cent, these financial statements are expressed in thousands or millions of Swiss Francs. Some rounding differences therefore occur.
The accounting principles applied to the financial statements of 31 December 2016 are identical to those used in the financial statements of 31 December 2015. The application of IPSAS new standards and interpretations had no impact on the CERN’s financial statements as of 31 December 2016.
The IPSAS Board has published IPSAS 39 on Employee Benefits, which will replace IPSAS 25 on Employee Benefits effective 1 January 2018. The impact of the replacement of interest cost and expected return on plan assets by a single net interest component is expected not to have an impact on the net post -employment benefit obligations. However, it is expected to result in slightly higher charges in the financial performance and an offsetting

22
reduction in the actuarial gains/losses recognized directly to net assets. CERN does not currently plan to adopt this change before required, so this change will not be seen until the financial statements of 31 December 2018.
The financial statements are prepared on the basis of the historical cost principle, unless otherwise stated.
7.1.2. USE OF ESTIMATES AND ASSUMPTIONS
The financial statements necessarily include amounts based on estimates and assumptions by Management. Estimates include, but are not limited to: post-employment benefits obligations, provisions, financial risk on inventories and receivables, accrued charges, contingent liabilities, estimated useful life of property, plant and equipment, and degree of impairment of property, plant and equipment. Actual results could differ from those estimates. Changes in estimates are reflected in the period in which they become known.
7.1.3. UNIT OF ACCOUNT AND FOREIGN CURRENCY TRANSLATION
The unit of account for all transactions is the Swiss franc, in compliance with Article 4 of the Financial Rules (CERN/FC/5305 – CERN/2822).
Transactions denominated in the other main currencies (EUR, USD, GBP, JPY) are converted into Swiss francs:
using the Swiss National Bank daily exchange rate, for receipts and payments;
using a weekly reference exchange rate for all other transactions.
At the end of the year, all monetary items denominated in a foreign currency are converted at the rates of exchange applicable on the last working day of the year. The rates of exchange used are those of the Swiss National Bank and if not available, those of the European Central Bank. The resulting gains and losses, including those relating to foreign currency transactions during the financial year, are recorded in the Financial Revenue and Expenses included in the Statement of Financial Performance.
7.1.4. ADJUSTMENTS AND CHANGES IN ACCOUNTING POLICY
Property Plant and Equipment
In 2015 a new policy relating to the tangible assets of CERN was implemented, which includes an approach by components for the calculation of depreciation, a more extensive identification of asset classes and a change in the recognition threshold. The implementation of this new policy required a significant amount of data collection from technical contacts throughout CERN and a number of complex adjustments.

23
During the course of 2016, it was identified that for some assets, the opening balances integrated in 2015 and the residual costs used in calculating the depreciation of certain assets had to be adjusted. In addition, some reclassifications between in progress and completed assets were needed. As a result, and in compliance with IPSAS, the Statement of Financial Position at 31 December 2015 and all cumulative balances have been restated to reflect the impact of these adjustments as if they had always been in effect.
Provision for Radioactive Waste
During 2016, a change has been made to the measurement basis for calculating the provision for radioactive waste. A discount rate is now been applied to the estimated future cashflows for disposing of the waste in order to ensure the liability reflects the time value of money. This is considered a change in an accounting policy and not a change in accounting estimate. Consequently, the 2015 figures have been restated to apply the discounting also to the 2015 provision.
Consistent with IPSAS 3 (Accounting Policies, Changes in Accounting Estimates and Errors), a retrospective restatement has been applied to reflect the 2015 financial statements as if the adjustments to the non-current asset balances and the change in accounting policy for radioactive waste had been applied in 2015. The opening balances are restated for the earliest period presented, being 2015. The Statement of Financial Position at 31 December 2015 has therefore been restated for each affected component, and the impact of the restatements appears in the table below.
kCHF
Balances at 1 January 2015, as
previously reported
Impact of restatement
on 2015 opening balance
Restated Balances at 1 January
2015
Balances at 31
December 2015, as
previously reported
Impact of restatement at 1 January
2015
Impact of restatement during 2015
Restated Balances at
31 December
2015
Property, Plant and Equipment 7 590 728 - 3 324 7 587 404 7 515 161 - 3 324 - 2 542 7 509 296 PPE in progress 613 726 - 60 270 553 456 547 110 - 60 270 15 400 502 240 Sub-total Property, Plant and Equipment
8 204 454 - 63 594 8 140 859 8 062 271 - 63 594 12 858 8 011 536
Intangible Assets - available for use 79 166 334 79 500 115 140 334 469 115 943
Intangible Assets - in progress 16 721 38 16 759 5 457 38 14 5 509
Sub-total Intangible Assets 95 887 373 96 260 120 597 373 483 121 451
Provision for radioactive waste - 87 978 12 630 - 75 348 - 133 872 12 630 9 205 - 112 037
Net Assets 8 212 362 - 50 591 8 161 771 8 048 996 - 50 591 22 545 8 020 950
- 28 046
The Statement of Financial Performance for the year ended 31 December 2015 has not been restated since it is impracticable to arrive at the impact on each line item in this statement. The restated Net Deficit for the period would have been -245.6 MCHF, an improvement of 22.5 MCHF from the originally reported net deficit of -268.1 MCHF. The table above shows the restatement effect on net assets.
The Cash-Flow Statement for the year ended 31 December 2015 has not been adjusted to reflect the impact of the restatement for the same reason.

24
The total effect of the restatement on the net assets is disclosed in the Statement of Changes in Net Assets and amounts to -28.0 MCHF.
7.1.5. ASSETS
7.1.5.1. Property, Plant and Equipment (PPE)
A) General Policy
According to IPSAS 17, Property Plant and Equipment (PPE) are tangible items that are held for use in the production or supply of goods or services, or for administrative purposes, and that are expected to be used during more than one reporting period. The cost of these items shall be recognized in Property Plant and Equipment (PPE) if it is probable that future service potential or economic benefits associated with it will flow to CERN and their cost can be measured reliably. Details of the CERN criteria for recognition as well as of the measurement policy appear below.
CERN discloses the PPE in its Financial Statements split into Scientific Programmes and Non-Scientific Programmes to reflect the Organization’s main activities and to correspond to the budget presentation. As an international laboratory, CERN builds and operates particle accelerators, also building or procuring the apparatus and infrastructure necessary to conduct related scientific research programmes. It also builds or acquires the infrastructure for hosting non-scientific supporting activities, administration and logistics. Further disclosure of PPE is based on asset classes which equate to the sub-programmes of activity. An approach by components is used to facilitate fair depreciation calculations.
Criteria for recognition:
General threshold:
The criterion for the recognition of the cost of any project – construction, consolidation, upgrade of any scientific or non-scientific installation or building – as an asset is set at 100 000 CHF. This threshold also applies to the acquisition or the construction of any individual item or group of similar items not included in a project, and to items acquired through non-exchange transactions. The cost of large collective purchases of items is also recognised as assets for the aggregate value if the total value of the purchase exceeds 100 000 CHF.
Timing for recognition:
Costs relating to projects and items of PPE in progress are added to the in progress assets category as they occur. Assets are moved to the completed category when the commissioning date has occurred and the assets are available for use.

25
Measurement and depreciation policy :
CERN applies the cost model in accounting for all PPE with the exception of land, whereby assets are carried at historical cost, less any accumulated depreciation and any impairment losses. The cost of PPE acquired through a non-exchange transaction is determined to be the fair value at the date of acquisition as determined by the parties to the transaction.
Depreciation of PPE items is recognised in the Statement of Financial Performance on a straight-line basis over the estimated useful life of the items concerned. The estimated useful life and residual values are determined by technicians responsible for PPE items, and these estimates are reviewed regularly.
Land is accounted for according to the revaluation model based on the market price in force on 31 December in Switzerland or France, as appropriate. No depreciation is therefore recorded for land.
Impairment:
Under IPSAS 21, PPE are reviewed regularly for impairment to ensure the carrying amount is still considered to be recoverable. Recoverable service value corresponds to the higher of the value in use and the fair value. As there is no market for CERN’s scientific assemblies, only the value in use is quoted for comparison with the carrying value. The value in use is usually arrived at using the depreciated replacement cost approach, however for some assets the restoration cost approach is used.
The impairment reviews are performed each year for major equipment or installations by the technical experts in charge of the assets provided that the initial useful life of the asset(s) concerned is more than 5 years and its initial unit value over 100 000 CHF.
Derecognition:
An item of PPE is derecognised if the stakeholder responsible for the asset informs General Accounting that the asset is no longer in use.
Items are derecognised in the following cases: disposal or sale of the item or when an item becomes obsolete and is out of service, even if it is not physically destroyed or sold.

26
B) Scientific Programmes – LHC Programme and Other Programmes
Measurement:
The Scientific Programmes describes the scientific installations in use at CERN, and which are classified as being for the LHC programme and for the Other programmes based on the CERN Technical Layout.
All new scientific installations are monitored using a dedicated project code which captures both material and personnel costs related to the project. The total cost of each project is broken down into components based on function, and a useful life is assigned to the component.
COMPONENTISATION OF SCIENTIFIC INSTALLATIONS Useful life ‐
Range
Civil engineering consisting of machine buildings and undergrounds depending on the componentization of each construction
20 to 100
Magnets 17 to 90
Radio Frequency 10 to 30
Beam Instrumentation 10 to 50
Beam Transfer Primary 2 to 50
Cooling and Ventilation 10 to 40
Cryogenics 20 to 50
Electrical Installation and Cabling 25
Fire and Gas Detection 15
Accelerators Back/Front End Controls 5 to 15
Accelerators and beam physics 5
Machine Protection and Integrity 15 to 25
Vacuum 10 to 90
Shieldings 90
Power Converters 15 to 30
Targets, Dumps, Collimators 4 to 40
Access Control 15 to 20
Computer Networking 5 to 15
LHC Computing ‐ Servers and Storage 3 to 15
LHC Computing – Others 30
Detectors ATLAS, CMS, ALICE, LHCb (depending on the detector) 5 to 30
Scientific Support corresponding to Personnel cost and Miscellaneous
11 to 30
Scientific Support corresponding to the remainder of the equipment and installations after their componentization and that are individually non‐significant
1

27
Subsequent costs:
CERN capitalises subsequent expenditure relating to an existing scientific installation only if it either:
extends the original useful life of the installation significantly (by more than one year)
improves the asset compared to its original condition
increases or improves the quality of the original physical output
results in an increase in the service capacity of the installation.
In the case of the scientific programmes, CERN considers that only consolidation programmes and long shutdowns (LS) are programmes that improve the performance of the accelerator complexes and should therefore be recorded as items of PPE. Note that for certain long life assets such as cryo or resistive magnets, consolidation programmes are considered maintenance and are therefore not capitalised.
Spares:
Only spares connected with the scientific installations are recognised as PPE items. They follow the same recognition criteria and depreciation policy as described in Chapter 1 “General policy”.
Provided that there is no acquisition or creation of new spares, the replacement of installed items by spares will not be recorded in the accounting system nor in the PPE register, and will not give rise to changes in asset values since the replaced items are refurbished when they are removed from the installations and thereafter kept as a spare.
Residual value:
As a general rule, any item that has been in contact with radioactivity is considered to have no residual value. Hence, all the PPE items recognised as part of the accelerators are deemed to have no residual value. Where a residual value is applicable, it is usually equal to the scrap value, as defined by the technical experts in charge of the assets.

28
Detectors:
The detectors at CERN are operated by Collaborations to which CERN is a party. Although CERN is not the legal owner of these installations, since the detectors are located at CERN and require the accelerators to run, for accounting purposes they are deemed to be under the control of CERN and are therefore included in the assets of CERN. As with the other scientific installations, the four main detectors are split into components.
Because all the costs of the detectors are shared by a large number of different entities, the basis for the historical value of the detectors as well as for the value of the upgrades during Long Shutdown 1 are the Memoranda of Understanding signed between the parties, CERN being a member of the collaborations on the same footing as any other member. Revenues in kind are recorded to reflect the contributions of other collaboration members to the cost of the assets recorded. Please refer to note 7.21.

29
C) Non Scientific Programmes
The Non Scientific programmes are classed into sub-programmes and then split into components with various useful lives depending on their function and nature. The following table displays the range of useful lives for each component
Non Scientific sub‐programmes Equipment and installations Useful life ‐ Range
General Facilities and Logistics
Civil engineering consisting of tertiary buildings, undergrounds, roads and car parks depending on the componentization of each construction
20 to 100
Electrical Equipment and Distribution 20 to 50
Heavy Handling 10 to 50
Non‐scientific support that corresponds to the remainder of the equipment and installations after their componentization and that are individually non‐significant
1
Vehicles 4 to 10
Logistics 15
Manufacturing Facilities Workshops 10 to 50
Informatics
Audiovisual and Conferencing 5 to 10
Computer Networking 3 to 15
Desktop Service 5 to 25
Safety, Health and Environment
Access Control 20
Environment 10 to 15
Fire and Gas Detection 2 to 15
Personnel Safety 15
Safety 10 to 15
Radioactive Waste 10 to 20
Radioprotection Instrumentation 5 to 17
Outreach Visit Points and Exhibitions 10
30
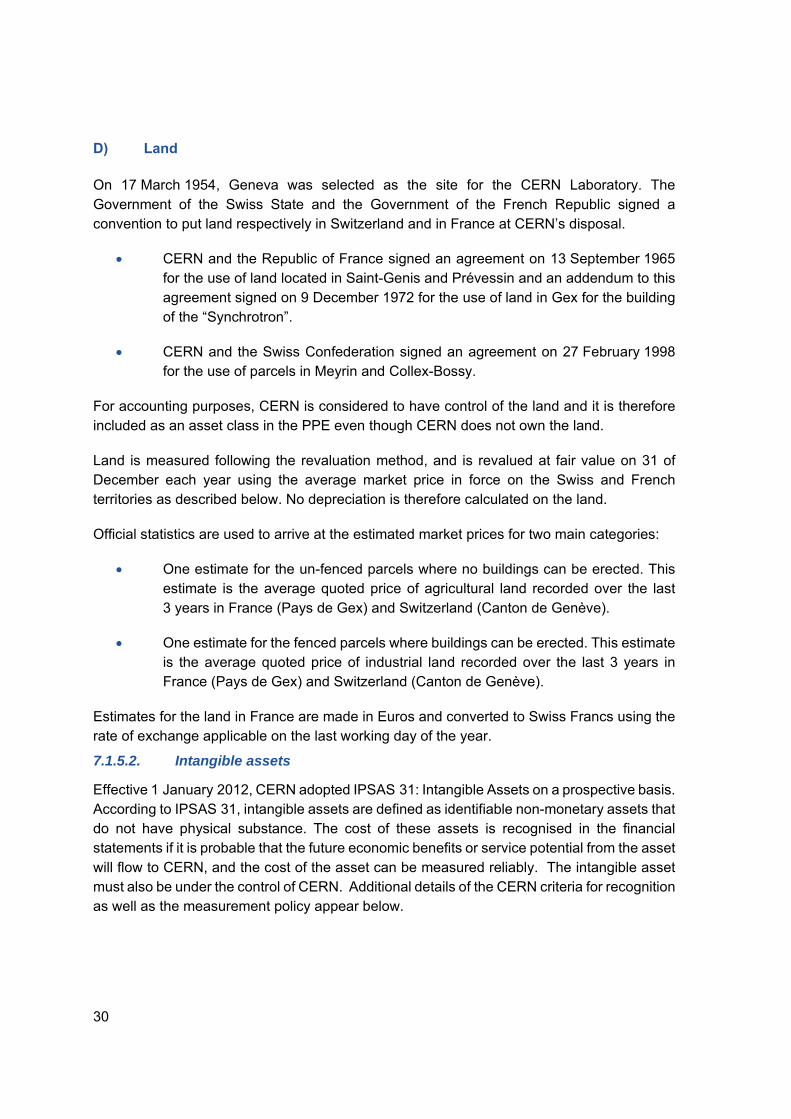
D) Land
On 17 March 1954, Geneva was selected as the site for the CERN Laboratory. The Government of the Swiss State and the Government of the French Republic signed a convention to put land respectively in Switzerland and in France at CERN’s disposal.
CERN and the Republic of France signed an agreement on 13 September 1965 for the use of land located in Saint-Genis and Prévessin and an addendum to this agreement signed on 9 December 1972 for the use of land in Gex for the building of the “Synchrotron”.
CERN and the Swiss Confederation signed an agreement on 27 February 1998 for the use of parcels in Meyrin and Collex-Bossy.
For accounting purposes, CERN is considered to have control of the land and it is therefore included as an asset class in the PPE even though CERN does not own the land.
Land is measured following the revaluation method, and is revalued at fair value on 31 of December each year using the average market price in force on the Swiss and French territories as described below. No depreciation is therefore calculated on the land.
Official statistics are used to arrive at the estimated market prices for two main categories:
One estimate for the un-fenced parcels where no buildings can be erected. This estimate is the average quoted price of agricultural land recorded over the last 3 years in France (Pays de Gex) and Switzerland (Canton de Genève).
One estimate for the fenced parcels where buildings can be erected. This estimate is the average quoted price of industrial land recorded over the last 3 years in France (Pays de Gex) and Switzerland (Canton de Genève).
Estimates for the land in France are made in Euros and converted to Swiss Francs using the rate of exchange applicable on the last working day of the year.
7.1.5.2. Intangible assets
Effective 1 January 2012, CERN adopted IPSAS 31: Intangible Assets on a prospective basis. According to IPSAS 31, intangible assets are defined as identifiable non-monetary assets that do not have physical substance. The cost of these assets is recognised in the financial statements if it is probable that the future economic benefits or service potential from the asset will flow to CERN, and the cost of the asset can be measured reliably. The intangible asset must also be under the control of CERN. Additional details of the CERN criteria for recognition as well as the measurement policy appear below.

31
The following are recorded as intangible assets at CERN:
Internally developed software, including development on external origin software;
External origin (purchased) software, including internal development costs;
Patents;
Software is used at CERN for many operations in both the scientific programmes and non-scientific programmes. For the scientific programmes, software is used for activities such as monitoring, controlling, simulating, configuration and data acquisition. For the non-scientific programmes, software is used for activities such as controlling, monitoring, data management and storage. CERN therefore discloses the intangible assets in its Financial Statements split into Scientific Programmes and Non-Scientific Programmes to reflect the Organization’s main activities and to be consistent with PPE reporting. The patents relate to CERN’s knowledge transfer activities and appear at Non-scientific Programmes assets.
Criteria for recognition:
General threshold:
A general threshold of 100 000 CHF is applied for internally developed software and for internal developments on external origin software. For purchases of external origin software, a threshold of 50 000 CHF is applied. These thresholds will be applied to the totality of the costs accumulated in the in-progress asset at the time of the transfer to completed assets. For subsequent improvement costs, the threshold will be applied to the costs accumulated each year. No threshold is applied for patents.
Timing for recognition:
Costs relating to software in-progress are added to the in-progress assets category in the year they occur. Assets are moved to the completed category in the year the software is put into production and the software is available for use, or the year the patent starts to generate income.
Measurement and amortization policy:
CERN applies the cost model in accounting for all intangible assets, whereby assets are carried at historical cost, less any accumulated depreciation and any impairment losses.
The cost for internally developed software is generally the estimated costs for the time spent developing software by members of CERN personnel. Where software is acquired, the purchase price of the software is also included in the costs. Costs relating to the research phase and for time spent on maintenance are not

32
capitalised, but rather are expensed as they occur. IPSAS 31 requires that the aggregate amount of research and development expenditure recognised as expenses in the Statement of Financial Performance be disclosed. Given the prevalence of research and development activities throughout CERN operations, it is difficult and costly to arrive at a reasonable estimate of this amount. No estimate of aggregate research and development expenditure is therefore disclosed in note 7.4 for Intangible Assets.
The cost of patents includes those costs paid directly for acquiring patents, and the materials and time spent to develop the ideas under patent, which can take a number of years. Research costs incurred as part of regular CERN operations, and prior to identification of a potential/existing market, are not included in these costs.
The estimated useful life of software is determined by technicians responsible for intangible assets, and these estimates are reviewed annually. The period of useful life of an intangible asset can be assessed and classified as definite or indefinite. At the reporting date CERN has no intangible assets with indefinite useful life.
Amortization of intangible assets is recognised in the Statement of Financial Performance on a straight-line basis over the estimated useful life of the items concerned. The amortization of software is calculated from 1st of July in the year the software is put into production.
For subsequent development costs on software already in production, the subsequent costs of each year will be assigned a useful life and amortised separately, calculated from 1 July. There is assumed to be no residual value for software, so the amortization calculation will be applied to the full cost of the software.
For the patents, the estimated useful life is the lifetime until the patent expires (usually 20 years from when the patent is filed). Amortization is calculated from the 1s of July of the year the revenue flows commence.
Estimated useful lives (in years)
Non Scientific ProgrammesDevelopment on External Origin Software 2 to 15Internally Developed Software 1 to 15Knowledge Transfer Patents 20Purchased External Origin Software 5 to 10
Scientific ProgrammesDevelopment on External Origin Software 6 to 22Internally Developed Software 1 to 50Purchased External Origin Software 5

33
Impairment:
Under IPSAS 21 and IPSAS 26 (depending on if the asset in non-cash generating or cash generating), intangible assets are reviewed regularly for impairment to ensure the carrying amount is still considered to be recoverable. For non-cash generating assets (software), the carrying value will be compared to its recoverable service amount (which is the value in use for CERN software as no fair market value exists). The value in use of a non-cash-generating is the present value of the asset’s remaining service potential. CERN will apply replacement cost approach to assess the value in use.
For cash generating assets (patents), the carrying value will be compared to expected recoverable amount.
The impairment reviews are performed each year from 2016.
Derecognition:
An intangible asset is derecognised if the stakeholder responsible for the asset informs General Accounting that the asset is no longer in use.
Items are derecognised when an item becomes obsolete and is out of service.
7.1.5.3. Financial assets – CHIS Fund
The CERN Health Insurance Scheme (CHIS) provides health insurance to CHIS members. Contributions to the scheme are received from the Organization and the individual members.
This item represents investments in shares and bonds, plus deposits dedicated to the scheme and available in specific bank accounts. It is carried at fair value.
7.1.5.4. Inventories
Inventory is measured at lower of cost and net realizable value.
The cost is assigned according to the weighted average cost formula, whereby the average cost is calculated based on an average of the purchase price with a coefficient applied to represent the costs incurred in bringing products to their present location and condition.
The estimate of the net realisable value of inventories is assessed for each item of inventory based on the stock turnover and the nature of the article.
7.1.5.5. Receivables and prepayments
Receivables mainly relate to amounts due from Member States, national institutes, laboratories and the European Union. The amounts due from private companies are shown under the sub heading “Other receivables and prepayments”.

34
The expenditure committed on behalf of collaborations or research institutes in order to facilitate their participation in the experiments conducted on the CERN site as well as internal recharging are not reported in the Statement of Financial Performance but charged to the corresponding third party account in the Statement of Financial Position.
7.1.5.6. Other financial assets
Fixed-term deposits with an initial term greater than 3 months are reported as other financial assets. Other financial assets are carried at their fair value.
7.1.5.7. Cash and cash equivalents
Cash and cash equivalents comprise cash on hand, bank accounts and deposits held up to 90 days that are readily convertible to cash.
Cash and cash equivalents are subject to an insignificant risk of changes in value, and therefore their carrying value is assumed to be their fair value.
Bank overdrafts are shown under current liabilities of the Statement of Financial Position.
7.1.6. LIABILITIES
7.1.6.1. Debts
The amounts expected to be settled after more than twelve months from the reporting date are shown under Non-current liabilities. The amounts expected to be settled within twelve months from the reporting date, including the accrued interest over the period, are shown as part of Current liabilities.
7.1.6.2. Liabilities - CHIS Fund
In December 2007 the CERN Council approved the setting-up of a fund for the CERN Health Insurance Scheme (CERN/FC/5209 - CERN/2759).
The fund is allocated exclusively to the Organization’s health insurance liabilities and contributes to addressing the problem of an ageing population and to improving the financial balance of the Health Insurance Scheme. The value of the liability is affected by the capital return and by the difference between contributions and benefits and external overheads.
This item includes the accrued benefits to be paid from the fund at the reporting date.
7.1.6.3. Post-employment benefits
Post-employment benefits represent the estimated actuarial liability of defined-benefit plans for retirement benefits and post-employment health cover calculated in accordance with IPSAS 25.

35
The actuarial liability of the defined-benefit plans for retirement benefits and post-employment health cover is the present value of the defined-benefit obligations at the reporting date minus the fair value of the corresponding plan assets.
The defined-benefit obligation is calculated annually by independent actuaries using the projected credit method. The present value of the defined-benefit obligations is determined by the estimated future cash outflows using the interest rate on long-term Swiss Confederation Bonds as the discount rate. A review of the discount rate used in this calculation was performed in 2015 as a result of a recommendation from the auditors. Following this review, the interest rate on the long-term Swiss Confederation Bonds continues to be the reference rate for the time value of money, however in addition, the principle that the discount rate should never fall below the best estimate of future inflation has been adopted.
The actuarial gains or losses arising from experience adjustments and changes in actuarial assumptions are recognised immediately in net assets.
The Organization’s post-employment benefits are partly funded by separately held assets: the Pension Fund and the CHIS fund.
As indicated in 7.2.1, the accounts of the Pension Fund are subject to separate Financial Statements reported by the Administration of the Pension Fund.
Since the CERN Pension Fund holds the retirement benefits for both CERN and ESO members, the scheme must be considered as multi-employer. Therefore, the fair value of plan assets to be considered by CERN is calculated on a pro-rata basis of the employers’ obligations, by independent actuaries.
7.1.6.4. Provisions
Provisions are recognised when the Organization has a legal or constructive obligation as a result of a past event where it is probable that an outflow of resources will be required to settle the obligation, and where a reliable estimate of the amount of the obligation can be made.
The present value of the special leaves for long service, of shift work compensation and of the contract termination allowances is calculated using the projected credit method. The discount rate used for calculating the present value is the relevant Swiss Confederation Bond’s interest rate. As from 2015, regarding the accounting estimate of the discount rate, the principle has been adopted that the relevant discount rate should never fall below the best estimate of future inflation over the similar period. This is consistent with the principle adopted for the post-employment benefits.
7.1.6.5. Current liabilities
Current liabilities are expected to be settled in the normal course of the operating cycle or are due to be settled within twelve months.

36
This heading includes mainly:
the current liability of the long-term debts as well as the short-term borrowings from commercial banks;
debts to suppliers and to the personnel;
debts to third parties and advances from Teams and Collaborations;
deferred revenue from the European Union and third parties which are accounted for as revenue up to the extent of the related projects’ expenses;
the accumulated remuneration estimated to be paid within twelve months to the members of the personnel when they are absent for annual, saved or compensation leave reasons.
7.1.7. REVENUE
Contributions and special contributions from Member States are non-exchange transactions which are recognised in the period in which the transfer arrangement becomes binding.
EU contributions and revenue from Knowledge Transfer are recognised as revenue according to the stage of completion of the various projects involved. The yearly amounts allocated to revenue are based on the related projects’ expenses.
The other revenue mainly concerns:
bank interest earned on the short-term deposits in various currencies at certain times of the year. The amount of interest varies from year to year depending on the funds available, i.e. the receipt of contributions from the Member States and the timing of personnel and materials expenses and on the evolution of the market rates;
sale of scrap, obsolete equipment, rents, overnight stays at CERN hostels, revenue from Collaborations and miscellaneous revenue. These are recorded at the time of the transactions;
in-kind contributions to property, plant and equipment are recognised as revenue and incorporated into the property, plant and equipment at the date of start-up;
for all the in-kind contributions below, the amounts shown in revenue are offset by similar amounts shown in expenses:
in-kind contributions resulting from the advantage granted to the Organization from loans without interest. The estimate is based on the equivalent interest rates prevailing when the loans were granted;

37
in-kind contributions resulting from the advantage granted to the Organization from various supplies made available without charge.
Following the 2015 change in accounting policy for Property, Plant and Equipment, land is included in the assets of CERN and revalued annually. Therefore there will no longer be in-kind contribution revenues and offsetting expenses recorded as a result of the advantage granted to the Organization of the right to use land with minimal or no charge.
7.1.8. INTERNAL TAXATION
In accordance with document CERN/FC/4914 - CERN/2599, the system of internal taxation of remuneration, payments and other financial benefits was introduced with effect from 1 January 2005.
The amount shown in revenue is offset by a similar amount shown under Personnel expenses.
7.1.9. FINANCIAL INSTRUMENTS
Effective 1 January 2013, CERN adopted IPSAS 28 Financial instruments: Presentation, IPSAS 29 Financial instruments: Recognition and measurements, IPSAS 30 Financial instruments: Disclosures. A financial instrument is any contract that gives rise to both a financial asset of one entity and a financial liability or equity instrument of another entity.
Financial instruments are split into the categories of financial assets or financial liabilities as defined in IPSAS 29: financial assets and liabilities at fair value through surplus or deficit (designated upon initial recognition), held to maturity investments, loans and receivables, available-for-sale financial assets and financial liabilities measured at amortized cost. The classification of the financial assets and financial liabilities determines the measurement after initial recognition; either at fair value, or at amortized cost. Carrying value it the amount at which the financial instruments are recognized in the statement of financial position. Fair value is the amount for which an asset could be exchanged, or a liability settled, between knowledgeable, willing parties in an arm’s length transaction.
The Organization’s financial assets include: cash and cash equivalents, trade and other receivables, other financial assets, derivative financial instruments and quoted financial instruments, most of which are held in the CERN Health Insurance Scheme (CHIS) fund.
The Organization’s financial liabilities include: trade and other payables, short-term debt and bank overdrafts, long-term debts.
CERN’s financial instruments measured at fair value through the surplus or deficit are designated at initial recognition. The instruments are revalued at the value quoted in an active market on the balance sheet date. The resulting gains and losses appear in the Statement of Financial Performance. Typical examples are derivatives, specifically forward-rate agreements and foreign currencies options. The Organization uses these types of financial

38
instruments for the purpose of managing its exposure to currency fluctuations and interest rate risks (refer to note 7.25).
7.2. COMMITMENTS NOT SHOWN IN THE STATEMENT OF FINANCIAL POSITION
Some memoranda accounts which do not appear in the Statement of Financial Position are given below. They relate to the Pension Fund, guarantees received or given by the Organization and future commitments to suppliers.
7.2.1. PENSION FUND
As mentioned in section 7.1.1, although the Pension Fund is legally part of the Organization, its accounts are reported separately.
7.2.2. BANKER’S GUARANTEES IN OUR POSSESSION
The following amounts relate to banker's guarantees provided by various suppliers in connection with CERN contracts. The amounts corresponding to these guarantees is shown below:
As at As atkCHF 31.12.2016 31.12.2015
Currency
CHF 10 282 9 951
DKK 63 115
EUR 26 693 22 596
GBP 625 537
JPY 1 176 711
NOK 119 112
SEK 47 103
USD 6 391 6 147
45 396 40 272
Banker's guarantees
Total
39
7.2.3. BANKER’S GUARANTEES GIVEN BY CERN
As at 31 December 2016, CERN has provided the following guarantees:
18 kUSD to ICANN Internet Corporation for Assigned Names and Numbers (175.5 kUSD in 2015);
7.6 kCHF to agencies to guarantee rentals of Housing Fund apartments (7.6 kCHF in 2015);
2.0 kCHF to the Chamber of Commerce Geneva to guarantee books of ATA tickets (0 in 2015)
34.3 kCHF to the Prefecture de l’Ain to guarantee for the transfer of waste (34.3 kCHF in 2015).
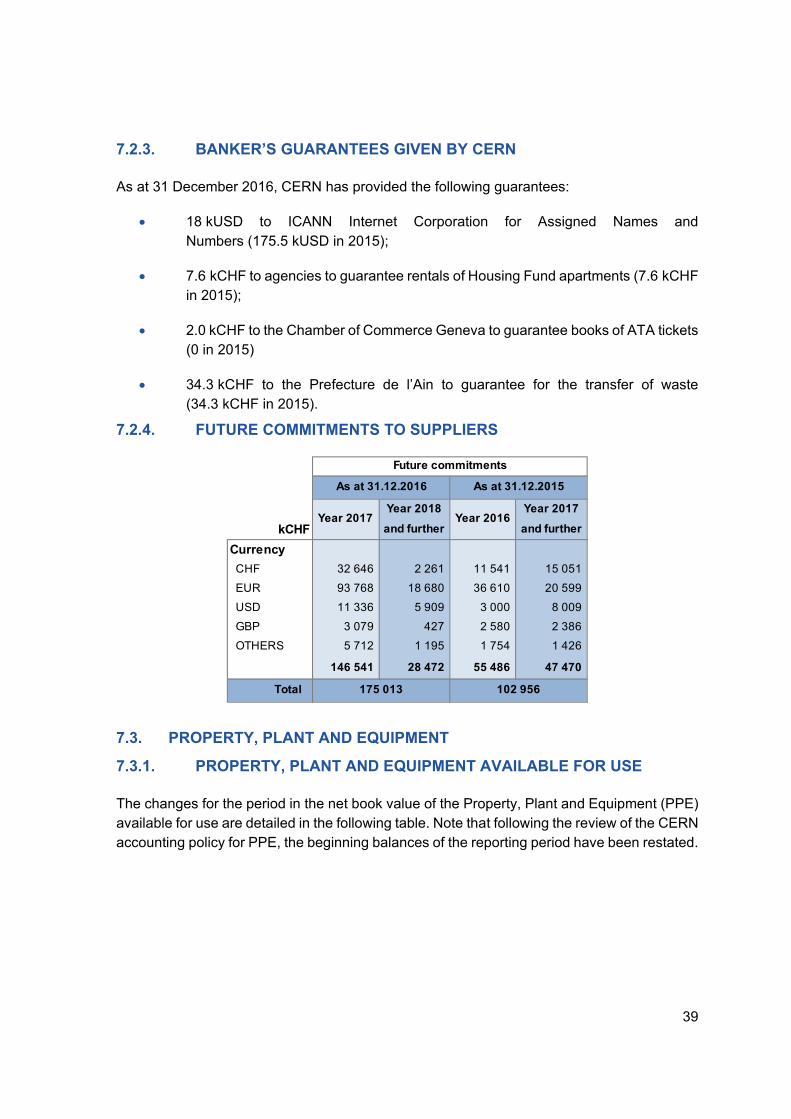
7.2.4. FUTURE COMMITMENTS TO SUPPLIERS
Year 2018 Year 2017
kCHF and further and further
Currency
CHF 32 646 2 261 11 541 15 051
EUR 93 768 18 680 36 610 20 599
USD 11 336 5 909 3 000 8 009
GBP 3 079 427 2 580 2 386
OTHERS 5 712 1 195 1 754 1 426
146 541 28 472 55 486 47 470
Future commitments
175 013 102 956
As at 31.12.2016 As at 31.12.2015
Total
Year 2017 Year 2016
7.3. PROPERTY, PLANT AND EQUIPMENT
7.3.1. PROPERTY, PLANT AND EQUIPMENT AVAILABLE FOR USE
The changes for the period in the net book value of the Property, Plant and Equipment (PPE) available for use are detailed in the following table. Note that following the review of the CERN accounting policy for PPE, the beginning balances of the reporting period have been restated.

40
Gross Balance as
at Additions
Disposals and Transfers
Gross balance
as at
31/12/2015 (restated)
2016 2016 31/12/2016
kCHF a b c d=a+b-c
LHC Programme 8 471 347 12 736 8 510 701
Other Programmes 2 510 258 2 467 2 654 311
10 981 605 15 203 11 165 012
928 652 17 148 966 193
26 953 301 28 729
114 949 907 120 930
72 637 213 87 604
6 678 6 756
160 433 180 997
1 310 302 18 569 1 391 209
PPE - available for use 12 291 907 33 772 12 556 221
Accumulated Depreciation
as at
Recognized in
Disposals Accumulated Depreciation
as at
Net book value as at
Net book value as at
31/12/2015 (restated)
2016 2016 31/12/2016 31/12/2015 (restated)
31/12/2016
e f g h=e+f-g i=a-e j=d-h
LHC Programme 2 826 033 318 335 6 107 3 138 261 5 645 314 5 372 441
Other Programmes 1 277 439 54 012 1 957 1 329 494 1 232 819 1 324 816
4 103 472 372 347 8 064 4 467 755 6 878 133 6 697 257
572 836 20 014 9 479 583 371 355 816 382 822
15 795 2 524 260 18 059 11 158 10 670
52 268 3 309 505 55 072 62 681 65 858
35 441 4 490 193 39 738 37 196 47 866
2 799 595 3 394 3 879 3 362
160 433 180 997
679 139 30 932 10 437 699 634 631 163 691 575
PPE - available for use 4 782 611 403 279 18 501 5 167 389 7 509 296 7 388 832
Non Scientific Programmes
Non Scientific ProgrammesGeneral Facilities and Logistics
Informatics
Scientific Programmes
15 180
78
General Facilities and Logistics
Manufacturing Facilities 6 888
Land
Scientific Programmes
298 086
kCHF
Safety, Health and Environment
Outreach
99 476
52 090
146 520
198 610
54 689
2 077
Informatics
Manufacturing Facilities
Safety, Health and Environment
Land
20 564
Outreach
Details of the total additions to Scientific Programmes of 198.6 MCHF are the following.
The additions in LHC Programme amount to 52.1 MCHF: LHC machine 26.1 MCHF, LHC computing 18.4 MCHF, LHC buildings related 7.5 MCHF and LHC detectors 0.1 MCHF.
The additions in the other scientific facilities amount to 146.5 MCHF and are mainly linked to the total or partial completion of the following: NA62 41.5 MCHF, LINAC4 44.2 MCHF, HIE ISOLDE 21.2 MCHF and ELENA 12.8 MCHF.
41
Details of the total additions to Non Scientific Programmes of 99.5 MCHF are the following.
PPE in General infrastructure and Logistics have increased by 54.7 MCHF in 2016, mainly due to tertiary buildings completion or consolidation (45.4 MCHF), heavy handling equipment and vehicles (8.1 M CHF).
Additional equipment or replacements for 24.2 MCHF also occurred in other activities such as Safety, Informatics, Manufacturing facilities and Outreach.
Revaluation of the land resulted in an increase of 20.6 MCHF.
Details of the total disposals and transfers for PPE available for use of 33.8 MCHF are the following.
All the above-mentioned consolidation and renovation works generated a disposal of 5.8 MCHF in machine or tertiary buildings corresponding to the value of replaced equipment or construction.
Other replacements in single or pools of equipment generated an additional 14.2 MCHF disposal in the scientific facilities (11.9 MCHF in LHC programme and 2.3 MCHF in Other programmes) and 13.8 MCHF in the Non Scientific programmes (11.3 MCHF for vehicles and heavy handling and 2.5 MCHF for other activities).
The accumulated depreciation related to the above mentioned disposals equals 18.5 MCHF. After excluding the non-significant impact from assets that are transferred between programmes but not written-off (0.01 MCHF), the net value of write-off impacting the statement of financial performance amounts to 15.3 MCHF.
7.3.2. PROPERTY, PLANT AND EQUIPMENT IN PROGRESS
The changes for the period in the gross balance of the PPE in progress are detailed in the following table.
There is no depreciation as the assets in question are still under construction as at 31 December 2016. Note that following the review of the CERN accounting policy for PPE, the beginning balances of the reporting period have been restated.

42
Gross balance as at
AdditionsDisposals and
TransfersGross balance
as at
31/12/2015 (restated)
2016 2016 31/12/2016
kCHF a b c d=a+b-c
PPE in progress
Scientific Programmes
LHC programme
LHC access systems upgrade 4 066 438 4 504
LHC machine and areas reliability and consolidation 56 443 35 725 27 589 64 579
LHC detectors consolidation 137 137
LHC detectors upgrade 13 933 16 795 557 30 171
LHC luminosity upgrade (HL-LHC) 38 889 55 511 1 962 92 438
LHC spares 8 044 3 395 9 315 2 124
CERN control centre consolidation 144 323 467
121 655 112 187 40 027 193 815
Other programmes
Magnet infrastructure upgrade
LHC injectors upgrade 76 187 36 763 3 318 109 632
18 kV loop+substations SPS consolidation 1 838 1 538 3 376
66/18 kV loop PS consolidation 1 785 580 2 365
PS and SPS spares 1 657 404 505 1 556
Accelerators consolidation 15 681 13 973 9 347 20 307
AD consolidation 1 055 1 714 217 2 552
Proton plasma wakefield acceleration (AWAKE) 33 171 9 725 2 873 40 023
CLIC 11 776 7 503 95 19 184
East area consolidation 111 241 111 241
ELENA 26 050 10 031 12 749 23 332
FAIR 5 222 6 855 731 11 346
HIE ISOLDE 40 320 7 136 21 177 26 279
LINAC4 40 760 5 070 44 281 1 549
NA62 40 906 543 41 449
CERN Neutrino platform 10 645 22 594 33 239
SM18 upgrade 4 224 6 963 1 089 10 098
Building 163 upgrade 814 509 305
MEDICIS 4 252 1 494 2 112 3 634
North area consolidation 3 071 2 217 5 125 163
PCB workshop machine 277 6 283
318 989 136 164 145 971 309 182
440 645 248 351 185 998 502 997
Non Scientific Programmes
General Infrastructure and Services
Building 90 133 133
Building 107 (Surface Treatment) 18 644 6 248 11 255 13 637
Building 156 LHCb 803 1 578 2 091 290
Building 311 Renovation 670 2 732 3 402
Building 771 Polymerlab 202 1 217 1 308 111
Building 774 (Prevessin Main Building) 18 422 864 19 287 - 0
Building 947 153 153
LHCb building 3 814 155 3 969
Renovation globe of science and innovation 2 192 2 183 4 375
Mobility center 226 112 338
Cooling tower P18 10 10
Surface and technical infrastructure consolidation 2 061 10 152 6 517 5 696
Miscellaneous 5 880 84 5 964
Informatics
IT network HUB 19 551 570
Safety, Health and Environment
RAMSES II light 8 354 2 010 10 286 78
Outreach
Particules place 45 39 84
Workshop
Investment in new mechanical technologies 264 286 211 339
61 596 28 507 59 637 30 466
502 240 276 858 245 635 533 463
Sub-total Non Scientific Programmes
Sub-total Scientific Programmes
Total PPE - in progress
31 223
43
7.4. INTANGIBLE ASSETS
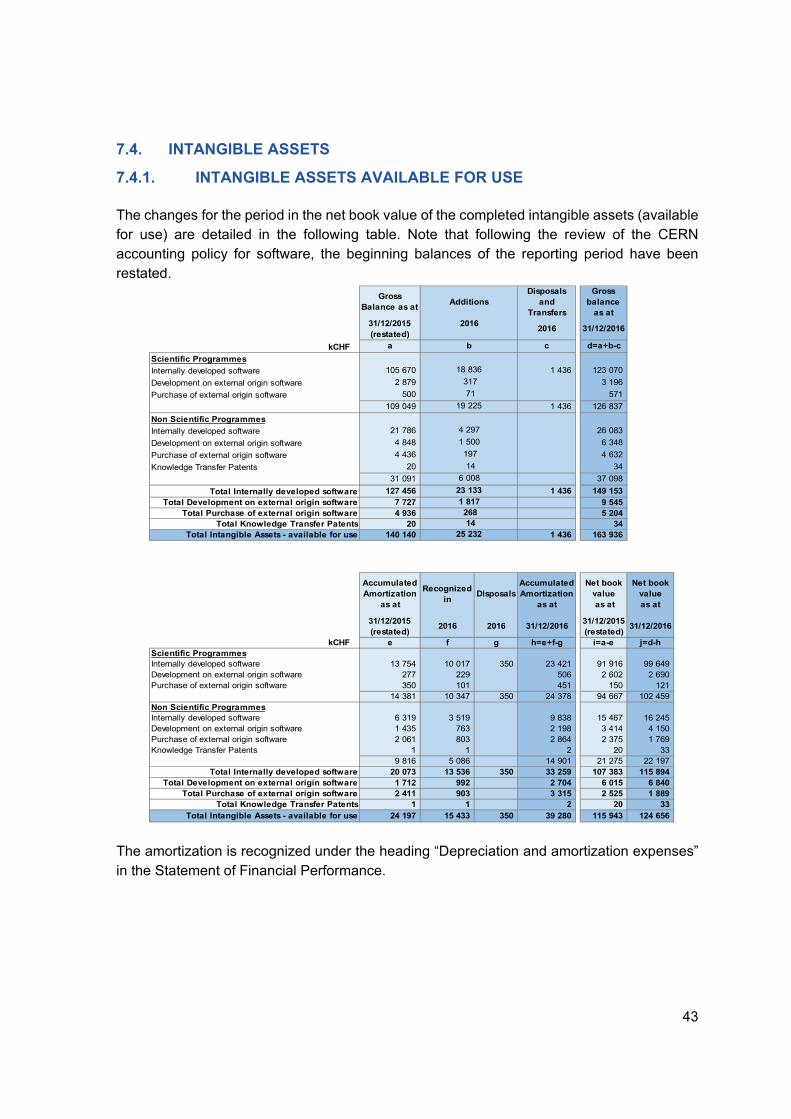
7.4.1. INTANGIBLE ASSETS AVAILABLE FOR USE
The changes for the period in the net book value of the completed intangible assets (available for use) are detailed in the following table. Note that following the review of the CERN accounting policy for software, the beginning balances of the reporting period have been restated.
Gross Balance as at
AdditionsDisposals
and Transfers
Gross balance
as at31/12/2015 (restated)
20162016 31/12/2016
kCHF a b c d=a+b-c
Internally developed software 105 670 1 436 123 070
Development on external origin software 2 879 3 196
Purchase of external origin software 500 571
109 049 1 436 126 837
Internally developed software 21 786 26 083
Development on external origin software 4 848 6 348
Purchase of external origin software 4 436 4 632
Knowledge Transfer Patents 20 34
31 091 37 098
Total Internally developed software 127 456 1 436 149 153 Total Development on external origin software 7 727 9 545
Total Purchase of external origin software 4 936 5 204 Total Knowledge Transfer Patents 20 34
Total Intangible Assets - available for use 140 140 1 436 163 936
Accumulated Amortization
as at
Recognized in
Disposals Accumulated Amortization
as at
Net book value as at
Net book value as at
31/12/2015 (restated)
2016 2016 31/12/201631/12/2015 (restated)
31/12/2016
kCHF e f g h=e+f-g i=a-e j=d-h
Internally developed software 13 754 10 017 350 23 421 91 916 99 649 Development on external origin software 277 229 506 2 602 2 690 Purchase of external origin software 350 101 451 150 121
14 381 10 347 350 24 378 94 667 102 459
Internally developed software 6 319 3 519 9 838 15 467 16 245 Development on external origin software 1 435 763 2 198 3 414 4 150 Purchase of external origin software 2 061 803 2 864 2 375 1 769 Knowledge Transfer Patents 1 1 2 20 33
9 816 5 086 14 901 21 275 22 197 Total Internally developed software 20 073 13 536 350 33 259 107 383 115 894
Total Development on external origin software 1 712 992 2 704 6 015 6 840 Total Purchase of external origin software 2 411 903 3 315 2 525 1 889
Total Knowledge Transfer Patents 1 1 2 20 33 Total Intangible Assets - available for use 24 197 15 433 350 39 280 115 943 124 656
Scientific Programmes 18 836
197
317
71
19 225
Non Scientific Programmes 4 297
1 500
14
6 008
23 133 1 817 268 14
Non Scientific Programmes
25 232
Scientific Programmes
The amortization is recognized under the heading “Depreciation and amortization expenses” in the Statement of Financial Performance.
44
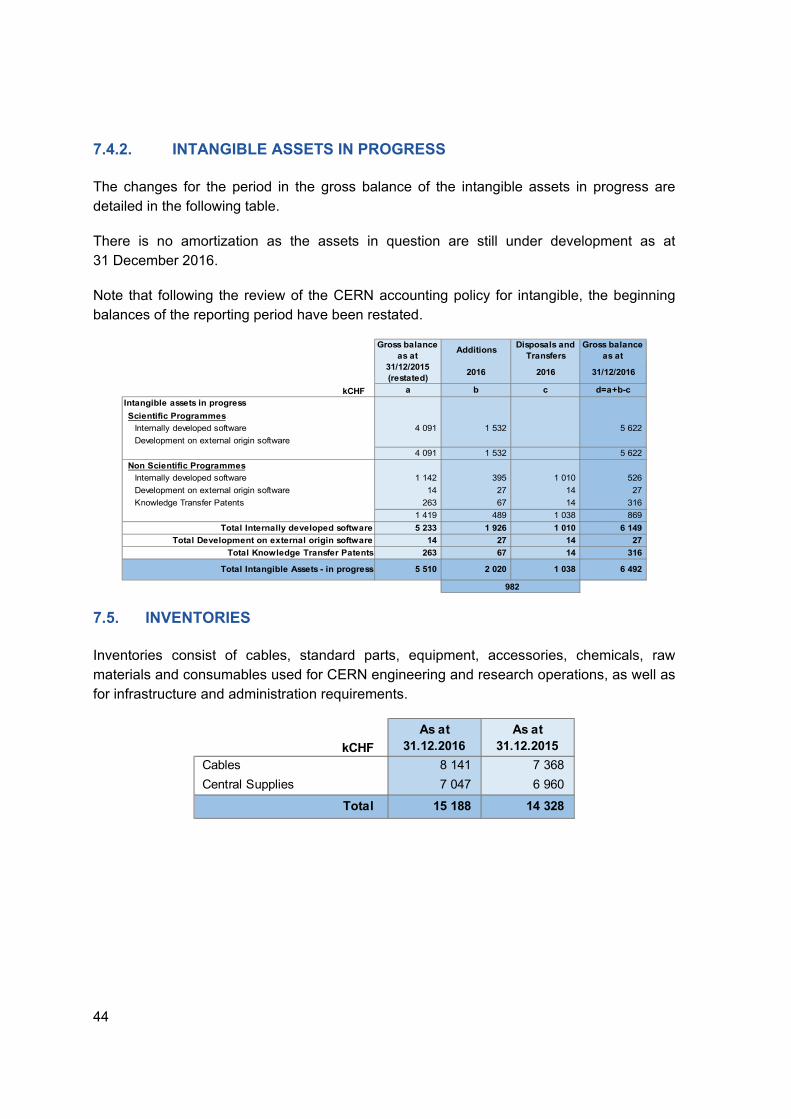
7.4.2. INTANGIBLE ASSETS IN PROGRESS
The changes for the period in the gross balance of the intangible assets in progress are detailed in the following table.
There is no amortization as the assets in question are still under development as at 31 December 2016.
Note that following the review of the CERN accounting policy for intangible, the beginning balances of the reporting period have been restated.
Gross balance as at
AdditionsDisposals and
TransfersGross balance
as at31/12/2015 (restated)
2016 2016 31/12/2016
kCHF a b c d=a+b-c
Scientific Programmes
Internally developed software 4 091 1 532 5 622
Development on external origin software
4 091 1 532 5 622
Non Scientific Programmes
Internally developed software 1 142 395 1 010 526
Development on external origin software 14 27 14 27
Knowledge Transfer Patents 263 67 14 316
1 419 489 1 038 869
Total Internally developed software 5 233 1 926 1 010 6 149
Total Development on external origin software 14 27 14 27
Total Knowledge Transfer Patents 263 67 14 316
5 510 2 020 1 038 6 492
Intangible assets in progress
Total Intangible Assets - in progress
982
7.5. INVENTORIES
Inventories consist of cables, standard parts, equipment, accessories, chemicals, raw materials and consumables used for CERN engineering and research operations, as well as for infrastructure and administration requirements.
As at As at31.12.2016 31.12.2015
Cables 8 141 7 368
Central Supplies 7 047 6 960
15 188 14 328 Total
kCHF

45
7.6. RECEIVABLES
7.6.1. MEMBER STATES
The amount shown in the Statement of Financial Position under this sub-heading can be broken down as follows:
As at As at31.12.2016 31.12.2015
Contributions - Greece 33 926 31 701
Contributions - Portugal 3 783 4 673
Contributions - Spain 34 030
Contributions - Italy 8 761
37 709 79 165 Contributions - Serbia 317 1 000 Contributions - Ukraine 270 -
Receivables from Associate Member States 587 1 000
38 296 80 165 TOTAL
Receivables from Member States
kCHF
7.6.2. TAXES
The amount shown in the Statement of Financial Position under this sub-heading can be broken down as follows:
As at As at31.12.2016 31.12.2015
French VAT 6 715 13 387
VAT other Member States 687 600
Swiss taxes and levies 217 228
7 619 14 215 Total
kCHF
7.6.3. TEAMS AND COLLABORATIONS
The various Teams and Collaborations owed 5.3 MCHF at the end of 2016 (4.9 MCHF in 2015). There exists also a liability to the Teams and Collaborations in the Liabilities section, the two balances being the result of the transactions arising from the collaborations and research institutes’ participation in experiments at CERN. The liability to Teams and Collaborations at the end of 2016 was 197.4 MCHF (183.6 MCHF in 2015). For more details, refer to note 7.16.2.
46
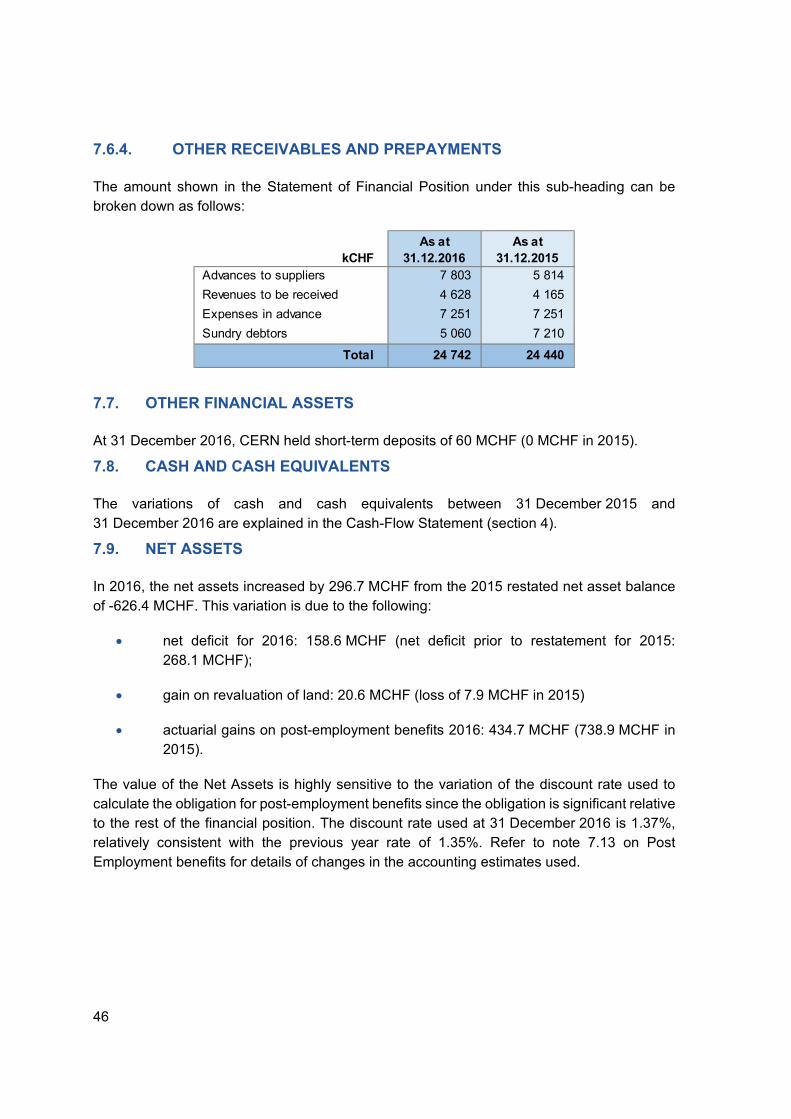
7.6.4. OTHER RECEIVABLES AND PREPAYMENTS
The amount shown in the Statement of Financial Position under this sub-heading can be broken down as follows:
As at As at31.12.2016 31.12.2015
Advances to suppliers 7 803 5 814
Revenues to be received 4 628 4 165
Expenses in advance 7 251 7 251
Sundry debtors 5 060 7 210
24 742 24 440 Total
kCHF
7.7. OTHER FINANCIAL ASSETS
At 31 December 2016, CERN held short-term deposits of 60 MCHF (0 MCHF in 2015).
7.8. CASH AND CASH EQUIVALENTS
The variations of cash and cash equivalents between 31 December 2015 and 31 December 2016 are explained in the Cash-Flow Statement (section 4).
7.9. NET ASSETS
In 2016, the net assets increased by 296.7 MCHF from the 2015 restated net asset balance of -626.4 MCHF. This variation is due to the following:
net deficit for 2016: 158.6 MCHF (net deficit prior to restatement for 2015: 268.1 MCHF);
gain on revaluation of land: 20.6 MCHF (loss of 7.9 MCHF in 2015)
actuarial gains on post-employment benefits 2016: 434.7 MCHF (738.9 MCHF in 2015).
The value of the Net Assets is highly sensitive to the variation of the discount rate used to calculate the obligation for post-employment benefits since the obligation is significant relative to the rest of the financial position. The discount rate used at 31 December 2016 is 1.37%, relatively consistent with the previous year rate of 1.35%. Refer to note 7.13 on Post Employment benefits for details of changes in the accounting estimates used.

47
The reconciliation with the cumulative budget deficit is summarised in the table below:
as at Var.* as at Var.* as at Var.* as at
31.12.2013
2014Cumulative
Restmt (2015)
31.12.2014Restated
2015Cumulative
Restmt (2016)
31.12.2015Restated
2016 31.12.2016
- 100 - 0 - 100 - 33 - 133 - 0 - 134
28 28 28 28
- 14 - 14 - 14 - 14
- 85 - 0 - 85 - 33 -118 - 0 -118
7 145 - 71 7 075 - 110 6 965 - 84 6 881
1 237 1 237 - 58 1 180 1 180
- 394 24 - 371 24 - 346 25 - 321
- 47 3 - 44 33 - 12 - 12
- 85 17 - 68 17 - 50 17 - 33
- 5 927 - 2 531 - 8 458 739 - 7 719 435 - 7 285
- 203 - 82 - 285 - 153 - 438 - 137 - 575
- 86 - 2 - 88 - 24 - 112 36 - 76
27 27 27 1 28
344 - 1 405 - 1 061 435 - 626 294 - 330
Variation
Capital repayments (SIG)
Post employment benefits (employer cost)
PPE: gross value less depreciation
Cumulative Budget Balance
Others
Provision: Elimination of waste
Post employment benefits (actuarial gains & losses)
SIG Debt- Impact of the annual repayment
SIG Debt - Impact of interest
Cumulative Budget Balance after SIG adjustments
MCHF
Accounting reconciliation
Personnel: Paid leave and CA22
Capital repayments (loans)
PPE: adjustments + changes in accounting methods
Net Assets
*
7.10. LONG-TERM DEBTS
This heading includes amounts expected to be settled after more than twelve months from the reporting date:
As at As at31.12.2016 31.12.2015
BNP FORTIS 248 359 273 182
FIPOI 33 580 34 685
281 939 307 868
kCHF
Total
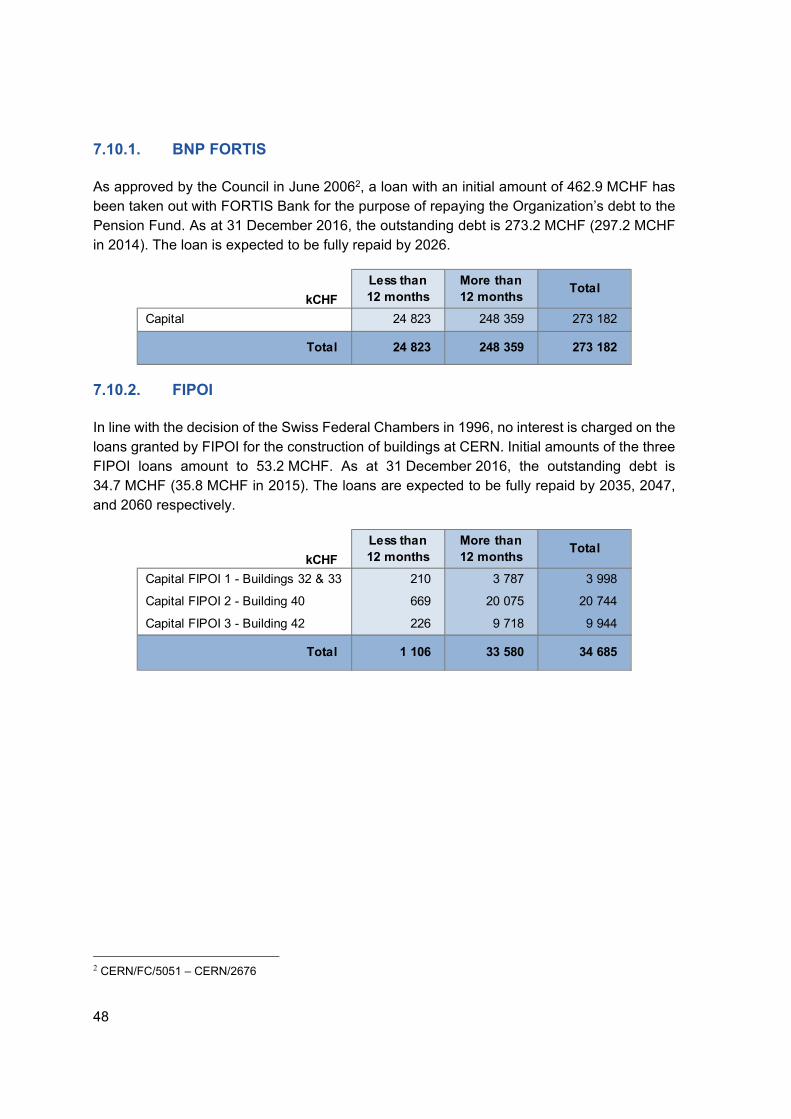
48
7.10.1. BNP FORTIS
As approved by the Council in June 20062, a loan with an initial amount of 462.9 MCHF has been taken out with FORTIS Bank for the purpose of repaying the Organization’s debt to the Pension Fund. As at 31 December 2016, the outstanding debt is 273.2 MCHF (297.2 MCHF in 2014). The loan is expected to be fully repaid by 2026.
Less than More than 12 months 12 months
Capital 24 823 248 359 273 182
24 823 248 359 273 182 Total
kCHF Total
7.10.2. FIPOI
In line with the decision of the Swiss Federal Chambers in 1996, no interest is charged on the loans granted by FIPOI for the construction of buildings at CERN. Initial amounts of the three FIPOI loans amount to 53.2 MCHF. As at 31 December 2016, the outstanding debt is 34.7 MCHF (35.8 MCHF in 2015). The loans are expected to be fully repaid by 2035, 2047, and 2060 respectively.
Less than More than 12 months 12 months
Capital FIPOI 1 - Buildings 32 & 33 210 3 787 3 998
Capital FIPOI 2 - Building 40 669 20 075 20 744
Capital FIPOI 3 - Building 42 226 9 718 9 944
1 106 33 580 34 685
kCHF Total
Total
2 CERN/FC/5051 – CERN/2676

49
7.11. CHIS FUND
In December 2007, the Council approved the set-up of a fund for the CERN Health Insurance Scheme (CERN/FC/5209 - CERN/2759).
A) The amount shown in the assets of the Statement of Financial Position can be broken down as follows:
As at As at31.12.2016 31.12.2015
Shares and bonds 176 590 179 990
Deposits and bank accounts 38 788 24 243
CHIS contractor 1 754 2 189
Withholding tax 261 380
Miscellaneous - 1 773
217 393 205 027 Total
kCHF
B) In order to enhance the visibility of the CHIS, the following table shows the distinction between Health Insurance Scheme (HIS) and Long Term Care (LTC).
As at As at31.12.2016 31.12.2015
CHIS Fund - HIS 111 938 102 951
CHIS Fund - LTC 44 374 40 641
156 312 143 592
Accrued benefits on LTC allowances - long term 32 172 34 355
188 484 177 947
Accrued benefits on HIS repayments - short term 20 395 19 681
Accrued benefits on LTC allowances - short term 8 514 7 400
28 909 27 081
217 393 205 027
Sub-total Short Term Liabilities
kCHF
Sub-total Plan Assets
Sub-total Long Term Liabilities
Total
The change in the CHIS Fund balance is the result of HIS and LTC movements throughout the year, a breakdown of which is shown in the following table.
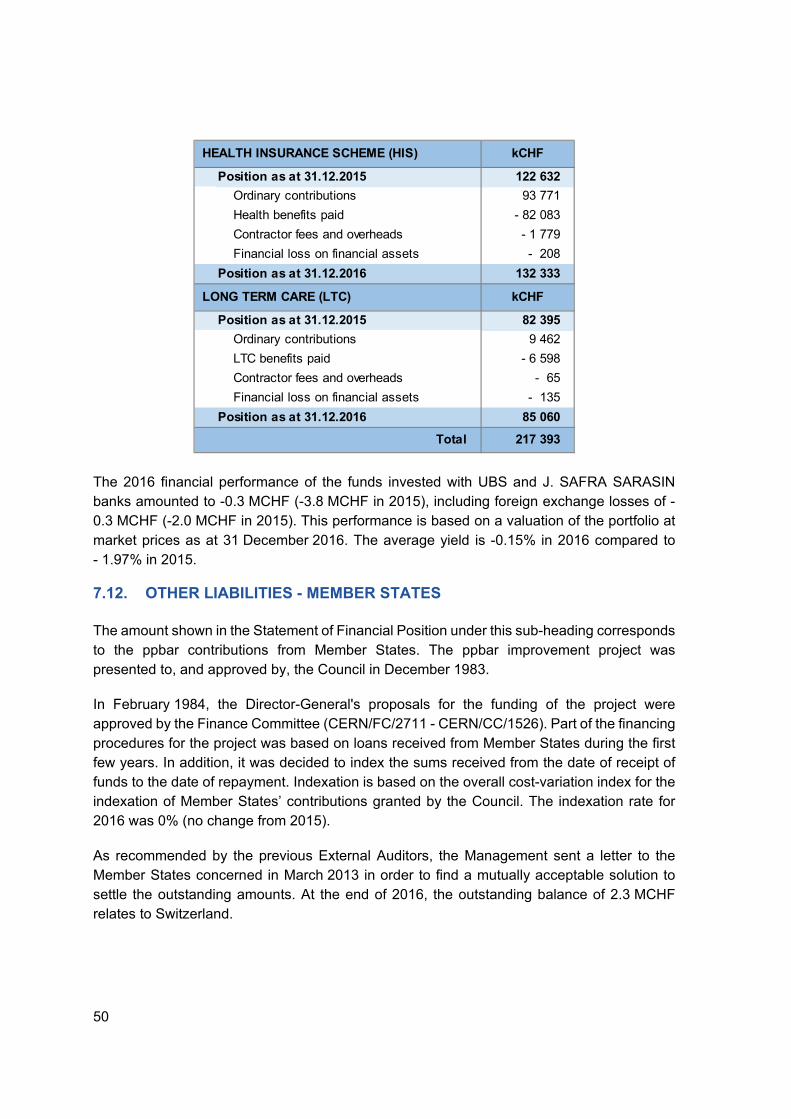
50
HEALTH INSURANCE SCHEME (HIS) kCHF
Position as at 31.12.2015 122 632
Ordinary contributions 93 771
Health benefits paid - 82 083
Contractor fees and overheads - 1 779
Financial loss on financial assets - 208
Position as at 31.12.2016 132 333
LONG TERM CARE (LTC) kCHF
Position as at 31.12.2015 82 395
Ordinary contributions 9 462
LTC benefits paid - 6 598
Contractor fees and overheads - 65
Financial loss on financial assets - 135
Position as at 31.12.2016 85 060
Total 217 393
The 2016 financial performance of the funds invested with UBS and J. SAFRA SARASIN banks amounted to -0.3 MCHF (-3.8 MCHF in 2015), including foreign exchange losses of -0.3 MCHF (-2.0 MCHF in 2015). This performance is based on a valuation of the portfolio at market prices as at 31 December 2016. The average yield is -0.15% in 2016 compared to - 1.97% in 2015.
7.12. OTHER LIABILITIES - MEMBER STATES
The amount shown in the Statement of Financial Position under this sub-heading corresponds to the ppbar contributions from Member States. The ppbar improvement project was presented to, and approved by, the Council in December 1983.
In February 1984, the Director-General's proposals for the funding of the project were approved by the Finance Committee (CERN/FC/2711 - CERN/CC/1526). Part of the financing procedures for the project was based on loans received from Member States during the first few years. In addition, it was decided to index the sums received from the date of receipt of funds to the date of repayment. Indexation is based on the overall cost-variation index for the indexation of Member States’ contributions granted by the Council. The indexation rate for 2016 was 0% (no change from 2015).
As recommended by the previous External Auditors, the Management sent a letter to the Member States concerned in March 2013 in order to find a mutually acceptable solution to settle the outstanding amounts. At the end of 2016, the outstanding balance of 2.3 MCHF relates to Switzerland.
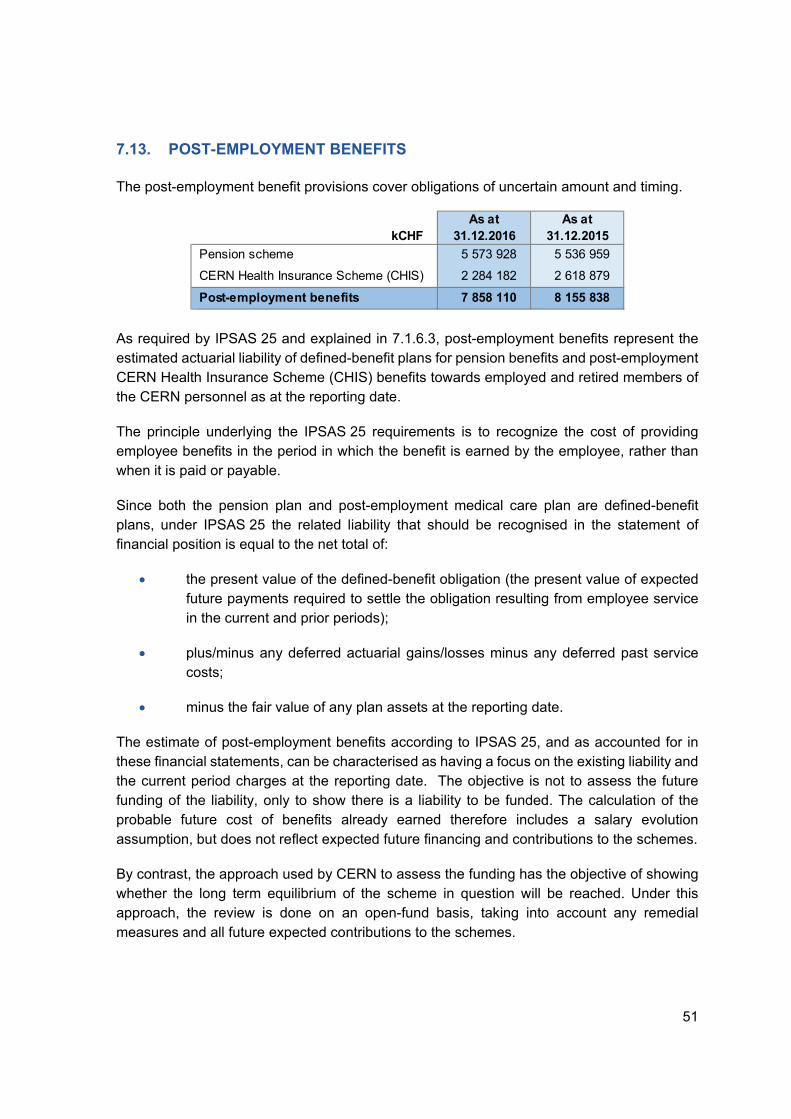
51
7.13. POST-EMPLOYMENT BENEFITS
The post-employment benefit provisions cover obligations of uncertain amount and timing.
As at As at31.12.2016 31.12.2015
Pension scheme 5 573 928 5 536 959
CERN Health Insurance Scheme (CHIS) 2 284 182 2 618 879
Post-employment benefits 7 858 110 8 155 838
kCHF
As required by IPSAS 25 and explained in 7.1.6.3, post-employment benefits represent the estimated actuarial liability of defined-benefit plans for pension benefits and post-employment CERN Health Insurance Scheme (CHIS) benefits towards employed and retired members of the CERN personnel as at the reporting date.
The principle underlying the IPSAS 25 requirements is to recognize the cost of providing employee benefits in the period in which the benefit is earned by the employee, rather than when it is paid or payable.
Since both the pension plan and post-employment medical care plan are defined-benefit plans, under IPSAS 25 the related liability that should be recognised in the statement of financial position is equal to the net total of:
the present value of the defined-benefit obligation (the present value of expected future payments required to settle the obligation resulting from employee service in the current and prior periods);
plus/minus any deferred actuarial gains/losses minus any deferred past service costs;
minus the fair value of any plan assets at the reporting date.
The estimate of post-employment benefits according to IPSAS 25, and as accounted for in these financial statements, can be characterised as having a focus on the existing liability and the current period charges at the reporting date. The objective is not to assess the future funding of the liability, only to show there is a liability to be funded. The calculation of the probable future cost of benefits already earned therefore includes a salary evolution assumption, but does not reflect expected future financing and contributions to the schemes.
By contrast, the approach used by CERN to assess the funding has the objective of showing whether the long term equilibrium of the scheme in question will be reached. Under this approach, the review is done on an open-fund basis, taking into account any remedial measures and all future expected contributions to the schemes.
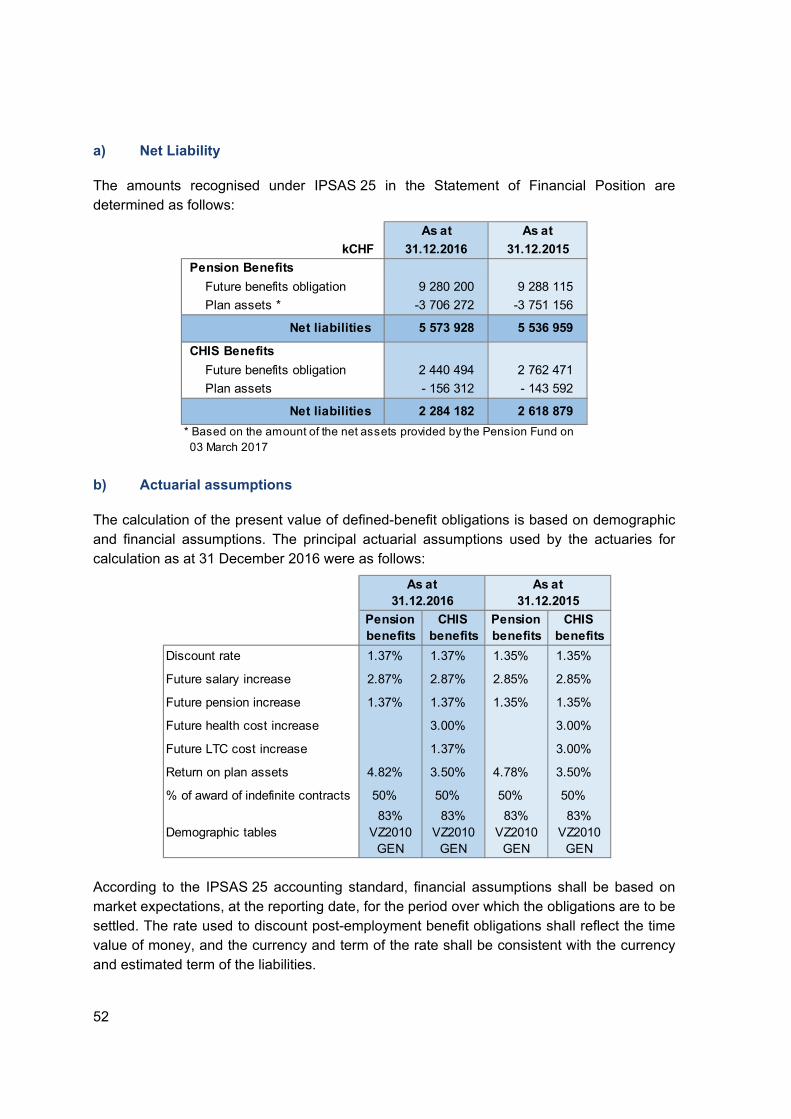
52
a) Net Liability
The amounts recognised under IPSAS 25 in the Statement of Financial Position are determined as follows:
As at As at
31.12.2016 31.12.2015
Pension Benefits
Future benefits obligation 9 280 200 9 288 115
Plan assets * -3 706 272 -3 751 156
Net liabilities 5 573 928 5 536 959
CHIS Benefits
Future benefits obligation 2 440 494 2 762 471
Plan assets - 156 312 - 143 592
Net liabilities 2 284 182 2 618 879
* Based on the amount of the net assets provided by the Pension Fund on 03 March 2017
kCHF
b) Actuarial assumptions
The calculation of the present value of defined-benefit obligations is based on demographic and financial assumptions. The principal actuarial assumptions used by the actuaries for calculation as at 31 December 2016 were as follows:
Pension CHIS Pension CHISbenefits benefits benefits benefits
Discount rate 1.37% 1.37% 1.35% 1.35%
Future salary increase 2.87% 2.87% 2.85% 2.85%
Future pension increase 1.37% 1.37% 1.35% 1.35%
Future health cost increase 3.00% 3.00%
Future LTC cost increase 1.37% 3.00%
Return on plan assets 4.82% 3.50% 4.78% 3.50%
% of award of indefinite contracts 50% 50% 50% 50%
Demographic tables83%
VZ2010 GEN
83% VZ2010
GEN
83% VZ2010
GEN
83% VZ2010
GEN
31.12.2016 31.12.2015As at As at
According to the IPSAS 25 accounting standard, financial assumptions shall be based on market expectations, at the reporting date, for the period over which the obligations are to be settled. The rate used to discount post-employment benefit obligations shall reflect the time value of money, and the currency and term of the rate shall be consistent with the currency and estimated term of the liabilities.

53
The discount rate used at CERN from 2007 to 2014 was the long-term (30-year) Swiss Confederation Bond interest rate. A review of the discount rate was made in 2015 as a result of a recommendation from the external auditors. Following this review, CERN decided to continue to use the interest rate on the long-term Swiss Confederation Bonds as the reference rate for the time value of money. However, it was decided to adopt the principle that the discount rate should never fall below the best estimate of future inflation. This principle addresses the issue of volatility noted by the external auditors, and is considered to result in a better approximation of the time value of money. At 31 December 2016, the 30-year Swiss Confederation Bond interest rate was 0.35%. Since this is below the average long term inflation rate compounded to be 1.37% per annum as the best estimate provided by the external risk advisor of the Pension Fund at 31 December 2016, the rate of 1.37% has been used as the discount rate estimate. Note that the inflation assumption of the average 1.37%p.a. is the weighted average based on the inflation assumption suggested by the Pension Fund’s risk advisor of 1.00% p.a. from 2017 to 2024 and 1.50% p.a. for 2025 onward.
Other actuarial assumptions used in the calculation of the post-employment benefit provisions reflect the best estimates of Management. Where relevant, these financial and demographic assumptions are aligned with the assumptions used in the Funding Review performed by the Pension Fund in 2015, however since the actuarial calculation for the IPSAS compliant financial statements has a different objective than the periodic funding review actuarial calculation, it is not appropriate to adopt all the assumptions from the funding review.
c) Sensitivity of the discount rate
As a consequence of the post-employment benefit liability’s sensitivity to the discount rate, and due to the systematic change of such a sensitive parameter, it can be difficult to compare present value from year to year. As shown in the table below, an increase or decrease of half a percentage point in the assumed discount rate would result in a significant change in the present values of pension benefits and health cover obligations.
Pension CHISbenefits benefits
Present value of future benefits obligation (in MCHF) 9 280 2 440
Effect if increase of + 0.5% point in discount rate (in MCHF) - 848 - 291
Effect if increase of + 0.5% point in discount rate (in %) -9.1% -11.9%
31.12.2016As at
Since the CERN Pension Fund holds the retirement benefits for both CERN and ESO members, the plan assets deducted from the Pension benefits obligation has been calculated by the independent actuary on a prorata basis of the employers’ obligations and based on the amount of net assets provided by the Pension Fund on 3 March 2017.

54
The plan assets deducted from the CHIS benefits obligations consist of 156.3 MCHF (143.6 MCHF in 2015). Refer to note 7.11.B regarding the CHIS fund.
d) Evolution of the net liabilities
The change in net liabilities resulted in the following:
Pension CHISbenefits benefits
Net liabilities as at 31.12.2015 5 537 2 619 8 156
Employer cost* 55 82 137
Actuarial variations** - 18 - 417 - 435
Total of the annual variation 37 - 335 - 298
Net liabilities as at 31.12.2016 5 574 2 284 7 858
*
**
As at31.12.2016
The Employer cost heading corresponds to the difference between the employer's actual contributions for the year and the estimated cost for the year calculated according to the actuarial assessment made at the end of the previous year. The actuarial assessment corresponds to the sum of the service cost and the interest cost, minus the expected return
The actuarial variations are attribuable to changes in the actuarial assumptions and to adjustments to take account of what has actually occurred (differences between what has occured and the estimates made using assumptions).
MCHF Total
The table below shows the detailed variations over the three previous years:
as at Var. as at Var. as at Var. as at
MCHF 31.12.2013
2014(restated)
31.12.2014 2015 31.12.2015 2016 31.12.2016
Net Liabilities - Pension benefits 4 062 1 841 5 903 - 367 5 537 37 5 574
Discount rate used in the actuarial assumptions
1.97% 0.81% 1.35% 1.37%
Impact of the change in the discount rate
1 851 - 932
Impact of revised demographic tables 497
Various adjustments - 71 - 6 - 18
Total - Actuarial variations 1 780 - 442 - 18
Employer cost 61 75 55
Net Liabilities - CHIS benefits 2 066 772 2 838 - 219 2 619 - 335 2 284
Discount rate used in the actuarial assumptions
1.97% 0.81% 1.35% 1.37%
Impact of the change in the discount rate
803 - 415 - 15
Impact of revised demographic tables 167 Impact of the change in LTC assumptions
- 348
Various adjustments - 107 - 49 - 54
Total - Actuarial variations 696 - 298 - 417
Employer cost 76 79 82

55
In summary, for 2016:
for the Pension benefits net liabilities, the change year on year has been minor. This increase is offset by negative actuarial variations. Note that unlike previous years, the actuarial variations due to the discount rate were negligible (-932 MCHF in 2015) and there were no changes in the demographic tables during 2016 (497 MCHF in 2015).
for the CHIS benefits net liabilities, the decrease in the assumption regarding the rate of evolution of LTC benefits to be consistent with the inflation estimate had an impact of -348 MCHF (0 in 2015). The actuarial variations due to the discount rate were -15 MCHF (-415 MCHF in 2015) and there were no changes in the demographic tables during 2016 (167 MCHF in 2015).
e) Pension Fund
Since 2008, the Pension Fund Governing Board has used for the Financial Statements of the Pension Fund a set of assumptions in line with the requirements of IAS 26. The funding ratio under another set of assumptions is included in an annex to the Pension Fund’s Financial Statements for information purposes:
the first set of assumptions follows the IPSAS principles and IAS 26 (i.e. using the discount rate of 1.37%). At the end of 2016, the IPSAS coverage ratio of the Pension Fund calculated according to this set is 39.9% compared to 40.4% at the end of 2015;
the second set of assumptions reflects the actuarial assumptions referred to as “Best Estimate”. At the end of 2016, the funding ratio of the Pension Fund calculated according to this set is 72.5% compared to 73.0% at the end of 2015.
7.14. OTHER PROVISIONS
These provisions cover obligations of uncertain amount and timing.
As at As at31.12.2016 31.12.2015
(restated)Radioactive waste management A 75 693 112 037 Paid leave - long term portion B 79 206 79 807 Damages on accidents and defects C 550 Obligations under special contributions D 374 9 451
Others 155 273 201 846
kCHF Comments

56
Details of provisions recognised
A) Radioactive waste management
The disposal costs for radioactive waste from CERN’s facilities are assessed annually in the framework of the evaluation of CERN’s financial commitments.
The Tripartite Agreement on radiation safety and radiation protection (“Tripartite Agreement”) signed on 15 November 2010 by CERN and its Host States represented by the Swiss Federal Office of Public Health (OFSP) and the French Authority for Nuclear Security (ASN), foresees that CERN’s radioactive waste will be disposed of through the different elimination pathways available in the two Host States in accordance with their applicable legislation. The Tripartite Agreement further stipulates that CERN’s radioactive waste should be equally divided between the two Host States, taking into account quantity, toxicity and total activity of the radioactive waste, as well as the disposal cost.
Starting from 2013, the calculation of the disposal costs takes into account the provisions in the Tripartite Agreement and the elimination pathways that have been opened since its entry into force. The costs per unit of volume of disposed waste are based on recent experience (waste disposal campaigns performed in 2011-2016) as well as on updated estimates for the elimination pathways not yet in use.
The estimated volume of radioactive waste for disposal from CERN’s facilities is based on an inventory indicating the amount and radiotoxicity of the waste already temporarily stored at CERN and the future waste that is forecasted to be produced by preventive and corrective maintenance or by the upgrade of CERN’s facilities or experiments. The estimate of future waste is based on declarations by the different CERN groups concerned, that provide estimates to the best of their knowledge, and a forecast for waste production over the next 20 years. The inventory of stored waste, the waste classification and the waste forecast are regularly updated taking into account lessons learnt.
It has to be noted that the inventory on future waste does not include an estimate of waste produced in case of the decommissioning of CERN’s facilities and experiments. The estimated costs for disposal do not include the cost of the tools and manpower needed for the radiological characterization of the waste or for the handling and conditioning of the waste at CERN. A discount rate of 1% until 2024 and 1.5% thereafter has been applied to the estimated future waste elimination costs to arrive at the present value of the provision. No discounting was previously applied to the calculation of the provision for radioactive waste, please refer to note 7.1.4 for further details on this change in accounting policy.
The estimates for disposal costs in 2016 have decreased as a result of reviewed ratios of Clearance from regulatory control (CL), Very low level waste (TFA) and Low and intermediate level waste (FMA) applicable to stored waste and future waste forecast. The 2016 calculation is further influenced by a first global elimination planning of the stored radioactive waste and the waste expected to be produced over the next 20 years. In addition,
57
there has been a significant decrease in the estimated costs per m3 of TFA waste as a result of improved process performance. Finally, a significant volume of radioactive waste was eliminated during the year.
The disposal costs for radioactive waste on 31 December 2016 are estimated to be 75.7 MCHF (112 MCHF in 2015 restated to reflect the present value).
B) Paid leave – long term portion
At 31 December 2016, the total provision for Paid leave amounts to 123.7 MCHF (123.8 MCHF in 2015). The current portion of the provision appears under the heading Employee Benefits (refer to note 7.16.3), and the long term portion of the provision at 31 December 2016 amounts to 79.2 MCHF (79.8 MCHF in 2015).
C) Damages on accidents and defects
In 2016 there were no accidents in progress requiring provision of the insurance franchise (550 kCHF in 2015).
D) Obligations under Special Contributions
France, Hungary and Czech Republic opted to make a special contribution to CERN with their portion of the one-off rebate granted by CERN on the member state contributions for 2015. Please refer to 7.19 for more details of the rebate. An obligation is recognized to reflect the extent to which the constructive obligations relating to the contribution from Hungary (0.4 MCHF) have not been satisfied. The timing of the related cash outflows are uncertain, therefore this amount is included in the provisions.
Other Items not recognized in the Financial Statements
a) Dismantling
The applicable texts (in particular CERN's founding Convention and the pertinent agreements with Switzerland and France) do not stipulate an obligation for CERN to dismantle its’ installations at the end of their operating period.
In the absence of an obligation to dismantle and given that the fate and state of the installations at the end of their operating period is not foreseeable at present, no provisions for dismantling are included in the financial statements.
If CERN were to dismantle installations, such operations would have to be carried out in the applicable legal framework and involve costs which cannot be determined today.

58
b) Litigations and claims
Where there are ongoing litigations or claims for which the amount and timing of the financial impact is known or can be estimated, and the outcome is likely, an accrual is included in the trade payables. Refer to note 7.16 for accrued amounts. The following are not included in the accrued liabilities.
As part of the contract for construction works for the CERN Globe parking, it was agreed that the contractor would purchase from CERN the soil that he was to remove to permit the works to proceed. Several months after finalization of the works, the contractor submitted an invoice to CERN that included an amount of 167 kCHF (related to the evacuation of the soil). The parties have settled the matter through the payment by CERN in 2016 of an amount of 21 kCHF.
The report on litigation and claims related to procurement covering 2015 mentioned a technical dispute with a contractor having installed capacitors at CERN. CERN has alleged a non-conformity in the design of the capacitors. Subsequently, in April 2016, a short circuit in a capacitor has led to the loss of an entire capacitor bank. The non-conformity notified to the contractor was confirmed in a third party expertise established in November 2016. On this basis, CERN is currently preparing a claim.
Relating to a supply of defective hoses to CERN and a settlement under which the contractor committed to replace all defective hoses at an estimated cost to the contractor of 3.9 MEUR, with CERN contributing 1 MEUR towards the cost of the replacement work, there existed an accrued amount of 0.5 MCHF in 2014 for the correction work completed during LS1. This amount was paid at the start of 2016. The remainder of the replacement work is to be completed and paid during LHC LS2, so no accrual has yet be entered for the work still to be completed.
Following the discovery by CERN, within the defects liability period, of a number of non-conformities in waterproofing, drainage and intumescent painting in the Building 107 construction works, CERN has notified the contractor of its obligation to remedy such non-conformities. The current estimate of the cost of remedial works is 1.44 MEUR. CERN has commissioned remedial works with various local contractors and discussions with the contractor regarding recovery of CERN’s damage are underway. Charges relating to some of the remedial work already appear in the 2016 results, and a bank guarantee issued by the contractor is held by CERN in the amount of 800 kEUR, which is expected to be sufficient to offset any future costs if needed. No additional liability has therefore been recognized.
In May 2016, CERN, alongside a number of other defendants, received a summons to appear in the courts of Paris concerning a claim in an amount of 735 kEUR. The claimant is a French firm that has contributed to the preparation of

59
an application for a EU grant for a cultural event on the theme of particle physics. CERN has informed the court of its particular legal status in France, which stipulates immunity from court jurisdiction and foresees settlement of disputes through arbitration.
A number of claims related to human resources are ongoing, both internal and before the ILOAT, however in the opinion of the Organization it is not clear there is a present obligation in any of the cases.
7.15. SHORT-TERM DEBT AND BANK OVERDRAFT
As mentioned under Long-term debts, the amounts falling due next year are included under this heading in addition to short-term borrowing from banks.
As at As at31.12.2016 31.12.2015
BNP FORTIS - to be reimbursed within 1 year 24 823 24 003
FIPOI - to be reimbursed within 1 year 1 106 1 106
25 929 25 108 Total
kCHF
CERN has credit lines with various financial establishments. These do not generate any financial cost on top of the interest incurred when used. No credit lines were being used by CERN at the end of 2016.
7.16. PAYABLES
7.16.1. TRADE ACCOUNTS
This sub-heading represents outstanding invoices and accrued Material expenses payable to suppliers. At 31 December 2016, the balance of trade payables is 71.0 MCHF (67.4 MCHF in 2015).
The accrued expenses for 2016 include an amount 0.15 MEUR relating to a claim on a contract for civil engineering consultancy services in relation to Building 107. This amount is the best estimate at the time of drawing up the financial statements, it being understood that the amount may be less due to major design non-conformities concerning drainage and seismic design attributable to the consultant.

60
7.16.2. TEAMS AND COLLABORATIONS
This represents the advances received from Teams and Collaborations and other Funds. The most important part concerns Collaborations and mainly:
The LHC Experiments
ATLAS (A Toroidal LHC Apparatus);
CMS (Compact Muon Solenoid);
ALICE (A Large Ion Collider Experiment);
LHCb (LHC beauty);
The balances as at 31 December 2016 are shown in the table below:
As at As at31.12.2016 31.12.2015
ATLAS 64,340 61,009
CMS 37,880 35,991
ALICE 15,978 13,609
LHCb 18,302 15,923
Other Collaborations 8,922 9,865
Teams & Special Funds 51,933 47,219
197,355 183,615
kCHF
Total
The status of the LHC experiments is reported regularly to Council, most recently in September 2016 (CERN/SPC/1064 – CERN/FC/6011 – CERN/3246).
7.16.3. EMPLOYEE BENEFITS
7.16.3.1. Employee benefits recognised in the Financial Statements
A) The amount shown in the Statement of Financial Position under this sub-heading can be broken down as follows:
As at As at31.12.2016 31.12.2015
Accruals
Paid leave 44 496 44 008
Shift work compensation 9 054 10 397
Paid leave for long service 9 557 9 199
Termination allowances 4 893 3 723
Other payables 6 32
68 006 67 359 Total
kCHF

61
At 31 December 2016, the total provision for Paid leave amounts to 123.7 MCHF (123.8 MCHF in 2015). The figure in the table above is the current portion of the provision, expected to be used within 12 months. The remaining long-term portion of Paid leave appears under the heading Provisions – Others (refer to note 7.14B).
B) The principal assumptions used for calculating the present value of special leaves for long service, shift work compensation and termination allowances were as follows:
Discount rate 1.10 % * 1.00 % * 1.00 % * 1.00 % * 1.00 % * 1.00 % *
10 years 5 years 2 years 10 years 5 years 2 years
Future salary increase 2.87% 2.87% 2.87% 2.85% 2.85% 2.85%
% of award of indefinite contracts
50.00% NA 50.00% 50.00% NA 50.00%
Shift work compensation
Termination allowance
As at
Shift workcompensation
Termination allowance
Long service
As at31.12.201531.12.2016
Long service
* From 2015, for the accounting estimate of the discount rate on employee benefits, the principle has been adopted that the relevant discount rate should never fall below the best estimate of future inflation over the similar period, consistent with the principle adopted for the post-employment benefits. The relevant Swiss Confederation Bond interest rates are -0.79% for 2 years, -0.65% for 5 years, and -0.14% for 10 years, and therefore the best estimate of future inflation has been used as the discount rate.
7.16.3.2. Other employee benefits not recognised in the Financial Statements
Reinstallation indemnities
As provided for in the Staff Rules and Regulations, reinstallation indemnities may be paid under certain conditions to non-resident staff within 30 months following the termination of their contract. At the reporting date, the corresponding contingent liability towards the members of personnel amounted to 7.6 MCHF (8.3 MCHF in 2015).
7.17. DEFERRED REVENUE
The amount shown in the Statement of Financial Position under this heading can be broken down as follows:
As at As at31.12.2016 31.12.2015
2017 Contributions paid in advance - within 1 year A 14 221 30 039
EU projects B 5 772 18 022
Other revenues in advance C 6 863 12 106
26 856 60 167
kCHF
Total
Comments

62
A) The detail of the 2017 contributions paid in advance is shown in the following table:
As at31.12.2016
Germany 17
Hungary 3 125
Israel 11 079
14 221
kCHF
Total 2017 Contributions paid in advance
Note the higher balance in the prior year is the result of deferred revenues for member states who had opted to apply the one-off member state contribution rebate toward their 2016 contributions. Refer to 7.19 for further information on the rebate.
B) Following the agreement with the EU in the context of the European Commission’s 7th and Horizon 2020 Framework Programme in 2008, CERN received advances for a large number of projects. These advances are either redistributed to other parties when CERN is project coordinator or retained to cover CERN expenditure. 17.6 MCHF were used in 2016 (16.4 MCHF in 2015) and transferred to revenue.
C) The sub-heading “Other revenue in advance” mainly concerns balances of various projects awaiting recognition as revenue according to the stage of completion of contracts.
7.18. OTHER CURRENT LIABILITIES
This heading amounts to 2.1 MCHF as at 31 December 2016 (2.2 MCHF in 2015) and includes the balance of advance payments from various companies, CERN schools and social activities.
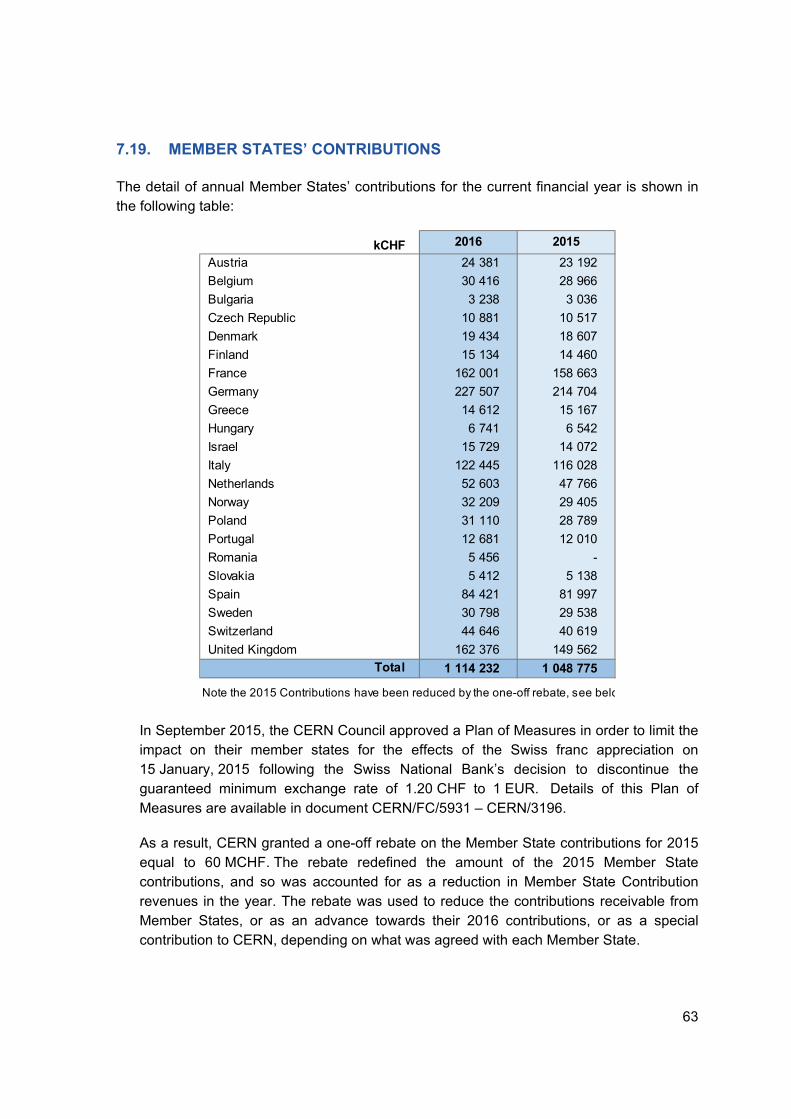
63
7.19. MEMBER STATES’ CONTRIBUTIONS
The detail of annual Member States’ contributions for the current financial year is shown in the following table:
2016 2015
Austria 24 381 23 192
Belgium 30 416 28 966
Bulgaria 3 238 3 036
Czech Republic 10 881 10 517
Denmark 19 434 18 607
Finland 15 134 14 460
France 162 001 158 663
Germany 227 507 214 704
Greece 14 612 15 167
Hungary 6 741 6 542
Israel 15 729 14 072
Italy 122 445 116 028
Netherlands 52 603 47 766
Norway 32 209 29 405
Poland 31 110 28 789
Portugal 12 681 12 010
Romania 5 456 -
Slovakia 5 412 5 138
Spain 84 421 81 997
Sweden 30 798 29 538
Switzerland 44 646 40 619
United Kingdom 162 376 149 562
1 114 232 1 048 775
Note the 2015 Contributions have been reduced by the one-off rebate, see belo
kCHF
Total
In September 2015, the CERN Council approved a Plan of Measures in order to limit the impact on their member states for the effects of the Swiss franc appreciation on 15 January, 2015 following the Swiss National Bank’s decision to discontinue the guaranteed minimum exchange rate of 1.20 CHF to 1 EUR. Details of this Plan of Measures are available in document CERN/FC/5931 – CERN/3196.
As a result, CERN granted a one-off rebate on the Member State contributions for 2015 equal to 60 MCHF. The rebate redefined the amount of the 2015 Member State contributions, and so was accounted for as a reduction in Member State Contribution revenues in the year. The rebate was used to reduce the contributions receivable from Member States, or as an advance towards their 2016 contributions, or as a special contribution to CERN, depending on what was agreed with each Member State.

64
The following amounts have also been recognised in the 2016 revenues. Romania became a Member State during 2016, and therefore appears in both the table below relating to the first part of the year, and that above for the remainder.
2016 2015
Romania 4 774 8 155
4 774 8 155
Serbia 1 317 1 000
Turkey 4 752 3 619
Pakistan 1 350 654
Cyprus 750 -
Ukraine 270 -
8 439 5 273
Czech Republic 602 -
France - 9 077
Hungary - 374
602 9 451
27 630 45 758
kCHF
Total
Sub-total Candidate for Accession Contributions
Sub-total Associate Member States contributions
Sub-total Special Contributions from Member States
7.20. EU CONTRIBUTIONS
Following the agreement between the EU and CERN in the context of the European Commission’s 7th and Horizon 2020 Framework Programmes, an amount of 17.6 MCHF (16.4 MCHF in 2015) was used to cover expenses in 2016. The corresponding EU projects were:
2016 2015
MARIE CURIE Actions 10 276 8 310
EUCARD2 project 1 385 556
AIDA project 882 161
Hilumi project 784 326
Tical project 530 613
AIDA2020 project 383 290
HICCUP project 325 84
BetaDropMNR project 305 75
HNSciCloud project 297
THOR project 288 127
NEANAT project 216
EUDAT 2020 project 207 114
Others 1 749 5 784 17 628 16 440 Total
kCHF

65
7.21. OTHER REVENUE
The amount shown under this heading can be broken down as follows.
The sub-total “Other in-kind contributions” represents the estimate of advantages granted to the Organization. These in-kind revenues have their counterpart within Material Expenses, with the exception of the revenues in-kind on detectors. These in-kind revenues are recorded for additions ATLAS Collaboration detectors during LS1, and the counterpart therefore appears in the “LHC Programme” category of PPE balances.
2016 2015
Interest benefit from interest-free loan 1 863 1 923
Computing : material and training 288 574
Revenues in-kind on detectors 5 233 16 949
Material made available without charge 20 7 384 19 466
Revenue for HIE-ISOLDE, IdeaLab, FAIR, SH.NEUTRINOS 7 504 7 925 Personnel paid on Team accounts 11 783 12 349
Personnel on detachment 921 1 142
Knowledge transfer 1 940 2 455
Sales and miscellaneous 16 434 13 392
OpenLab revenues 2 302 2 497
Revenue from the Housing activity 5 956 5 523
46 839 45 283
54 223 64 748
kCHF
Total
Sub-total Other in-kind contributions
Sub-total Others

66
7.22. MATERIAL EXPENSES
Details of materials expenses are shown in the following table:
2016 2015 Variation
67 161 66 786 374 Stock variations 20 1 219 - 1 199
Buildings, civil-engineering equipment and supplies 10 262 10 227 35
Electrotechnics, electronics equipment and supplies 18 819 19 120 - 301
IT equipment and supplies 5 162 7 939 - 2 777
Mechanics equipment and supplies 13 193 11 237 1 955
Vacuum and particle detection equipment and supplies 5 938 4 998 940
Cryogenics and gases for experiments 4 025 4 160 - 135
Transport, handling and hoisting equipment and supplies 481 198 283
Miscellaneous supplies 9 262 7 689 1 572
59 281 64 604 - 5 323
76 094 75 694 400 Service contracts 46 175 45 666 510
Repair & maintenance 25 067 25 998 - 932
Temporary labour 4 852 4 030 822
28 691 32 068 - 3 378
42 365 50 419 - 8 054 Consultancy 5 600 5 022 579
Contributions to Collaborations 6 314 5 174 1 140
Equipment hire - 1 190 - 1 393 203
Insurance premiums 5 102 5 163 - 61
Library 8 003 8 077 - 74
Visits, conferences and special contributions* 1 751 11 312 - 9 561
Duty travel and hospitality expenses 9 910 8 526 1 384
Transport 1 725 1 481 244
Training costs 3 909 3 525 384
Communications 437 578 - 141
Miscellaneous overheads 803 2 954 - 2 151
273 591 289 571 - 15 980
* special contributions relate to 2015 member state rebates
kCHF
Total
Goods, Consumables, Equipment & Supplies
Electricity, heating gas and water
Industrial Services
Associated Members of Personnel
Other overheads
The Materials expenses charged to the budget for 2016 and shown in note 8.2 amounted to 486.5 MCHF (444.3 MCHF in 2015). They can be reconciled with the above as follows:
MCHF 2016 2015
Materials Budget expenses 486.5 444.3
Material expenses transfered to PPE -212.9 -154.7
Materials expenses 273.6 289.6

67
7.23. PERSONNEL EXPENSES
The details of personnel expenses are shown in the following table:
2016 2015 Variation
285 382 264 834 20 547
Staff members 245 923 232 103 13 821
Fellows 39 196 32 453 6 743
Apprentices 263 278 - 16
59 298 58 414 884
Staff members 56 292 55 815 477
Fellows 3 006 2 599 407
102 671 98 313 4 358
Pension 80 348 76 945 3 403
Staff members 70 882 68 383 2 499
Fellows 9 465 8 562 903
Health Insurance 22 323 21 368 955
Staff members 20 742 19 997 745
Fellows 1 422 1 176 245
Apprentices 159 194 - 35
- 823 - 758 - 65
Staff members - 896 - 786 - 110
Fellows 73 28 46
166 778 183 262 - 16 484
Contribution to Health Insurance for pensioners 27 016 26 997 19
Contribution to Long-Term Care for pensioners 2 803 2 801 2
Changes in provision for the Pension scheme 55 052 74 889 - 19 837
Changes in provision for the Health scheme 81 906 78 574 3 332
31 451 30 047 1 404
644 756 634 111 10 645
Internal taxation
Total
kCHF
Remuneration
Social insurance cover
Social and family benefits
Post-employment benefits
Annual variation - paid leave
The Personnel expenses charged to the budget for 2016 and shown in note 8.3 amounted to 647.2 MCHF (628.9 MCHF in 2015). They can be reconciled with the above as follows:
MCHF 2016 2015
Personnel Budget expenses 647.2 628.9
Personnel expenses transfered to PPE -122.1 -131.0
Employer costs - Pension benefits * 55.1 74.9
Employer costs - HIS benefits * 81.9 78.6
Amortization of staff benefits accruals -17.3 -17.3
Personnel expenses 644.8 634.1
* refer to note 7.13 d

68
7.24. FINANCIAL REVENUE AND EXPENSES
The details of financial revenue and expenses are shown in the following table:
kCHF 2016 2015
Financial revenue
Interest 1 082 1 308
Discounts 94
Exchange gain (net) 4 967
Total 1 082 6 369
Financial expenses
Interest on FORTIS loan 9 873 10 666
Imputed interest for interest-free loans 1 863 1 923
Interest on SIG debt 2 500
Financial expenses on set up of investments 77 35
Exchange loss (net) 2 044
Other financial expenses 0
Total 13 857 15 124
Exchange gains and losses are the result of the revaluation of all monetary items denominated in a foreign currency at the rates of exchange applicable on the last working day of the year, and at the end of each month during the year. The resulting net gains and losses, including those relating to foreign currency transactions during the financial year, appear as financial revenues or charges in the year.
The Interest and Financial costs charged to the budget for 2016 and shown in note 8.4 amounted to 13.9 MCHF (15.1 MCHF in 2015).
7.25. MANAGEMENT OF FINANCIAL RISKS
Risk management policies depend on the type of financial instruments concerned. Risk management for CERN operating financial assets and financial liabilities is distinct from that for the CHIS portfolio. The following description of the policies and processes for managing and measuring the financial risks reflects the split of management responsibility for these two groups of assets and liabilities. A more general description of the CERN accounting policies on financial instruments, including a definition of financial instruments, appears in note 7.1.
Financial Instruments held by CERN
As disclosed in note 7.26, CERN holds a variety of financial instruments. The main risks arising from CERN’s financial instruments are liquidity risk, interest rate risk, currency risk and credit risk. For CERN financial assets used for investment purposes, the senior management

69
approves the investment instruments, policies and strategy for managing these assets and their associated risks.
Financial Instruments held by CHIS
Details of the CHIS financial instruments also appear in note 7 .26. The main risks arising from the CHIS financial instruments are market risk, interest rate risk, and credit risk. Two banks have been appointed to manage the portfolio of CHIS. They actively manage the assets following a pre-defined strategic allocation with maximum assets at risk to preserve the value of CHIS assets.
7.25.1. LIQUIDITY RISK
Liquidity risk is the risk of not being able to meet obligations that are settled by delivering cash (or another financial asset) as they fall due.
CERN’s activities are mainly financed by the annual contributions of the Member States, with the corresponding budget approved by member states and upon which the amounts of the contributions are based. Therefore liquidity risk is increased if the cash inflows and cash outflows are mismatched, namely if member state contributions are not received on a timely basis.
The Treasury section at CERN addresses liquidity risk by monitoring bank balances and estimating expected cash outflows based on open commitments and due dates on financial liabilities. They also monitor member state contributions, the most significant source of cash inflows to CERN. The Resource Planning and Control section monitors commitments and expenditures in order to ensure the budget is correctly executed and is not exceeded.
In the event that the contributions received are not sufficient to cover for CERN cash flow needs, CERN may, if necessary, take recourse to short-term loans with financial institutions to cover its exposure to liquidity risks. In the event of a cash surplus not needed to cover operational short-term expenses, CERN may invest the amounts concerned with the first objective of preserving capital, and the secondary objectives to maximise returns and ensure liquidity needs are met.
For a maturity analysis of the long term debts held by CERN, please refer to note 7.10.
7.25.2. MARKET RISK
Market risk is the risk that the fair value or future cash flows of a financial instrument will fluctuate because of changes in market prices. Market risk comprises three types of risk: currency risk, interest rate risk, and other price risk.
For CERN financial instruments, the Treasurer may have recourse to financial products to cover financial market risks such as variations in interest and exchange rates. The

70
Organization uses hedging tools to manage its exposure to currency and interest rate risks incurred in the normal course of business. The goal of financial risk management is to minimise the impact of the unpredictable nature of financial market trends on CERN’s financial position.
The financial assets held by the CHIS are exposed to market price risk. It is the responsibility of the two banks which manage the portfolio of CHIS to manage this risk through diversification and any other means they deem prudent in line with the mandate they have.
7.25.3. CREDIT RISK
Credit risk is the risk that one party to a financial instrument will cause a financial loss of the other party by failing to discharge an obligation.
For the CERN financial instruments, credit risk arises principally from the following financial instruments: all receivables, other financial assets and cash and cash equivalents. The carrying amount of these financial assets represents the maximum credit exposure. The maximum exposure to credit risk as at 31 December 2016 was therefore 283 MCHF (293 MCHF in 2015).
No other collateral is held as security for CERN.
Credit quality is the assessed risk of default attached to the counterparties with which CERN invests and deposits, and to which CERN extends credit. CERN invests with only top-rated financial institutions for holding cash and making investments in order to mitigate this risk.
CERN takes the following steps to protect itself from the risk of counterparty default:
having recourse to top-rated financial institutions and setting a ceiling on the level of operations authorised with each counterparty;
applying rules and procedures defining the conditions for opening and managing third-party accounts and limiting the amounts managed and the transactions authorised;
For the CHIS financial instruments, the financial assets exposed to credit risk are cash and investments held at banks. The carrying amount of these financial assets represents the maximum credit exposure. The maximum exposure to credit risk as at 31 December 2016 was therefore 217 MCHF (205 MCHF in 2015).
No collateral is held as security in the form of margin calls at 31 December 2016 for CHIS (0 kCHF for 2015).
71
7.25.4. INTEREST RISK
Interest rate risk is the risk that the fair value or future cash flows of a financial instrument will fluctuate because of changes in the market interest rates.
Exposure to interest risk at CERN is limited to interest bearing financial instruments which they hold. This includes cash, other financial asset, and long term debts. CERN uses forward exchange contracts and options to hedge its variable interest risk. At 31 December 2016, CERN had no interest swaps in progress.
The impact of a +/- 10% change in the average interest rates received/paid on the closing balances would result in a net loss/gain of 1.1 MCHF and a corresponding increase/decrease in the net asset value. Note this figure is calculated including the interest-bearing long term debts, however given these have fixed interest rates, the associated interest risk is low.
The CHIS fund is exposed to interest risk on the cash and bonds which they hold. It is the responsibility of the two banks which manage the portfolio of CHIS to manage this risk.
The impact of a +/- 10% change in the average interest rates received/paid on the closing balances would result in a net gain/loss of 0.2 MCHF and a corresponding increase/decrease in the net asset value.
7.25.5. CURRENCY RISK
Currency risk is the risk that the fair value or future cashflows of a financial instrument will fluctuate because of changes in exchange rates.
CERN is exposed to currency risk through its normal foreign-currency transactions, and the translation of financial instruments denominated in currencies other than the Swiss franc. Exposure to the currency risk on transactions is due to the fact that the member state contributions are in CHF while a percentage of CERN expenditure is committed in EUR, and to a lesser extent other currencies.
At 31 December 2016, the principal financial instruments denominated in foreign currencies held by CERN and translated into CHF were cash, receivables, other receivables and payables. The impact of a +/- 10% change in the exchange rates of the 4 significant foreign currencies used at CERN on the closing balances would result in a gain/loss of 0.4 MCHF and a corresponding increase/decrease in the net asset value.
CERN uses natural hedges where possible, and if not available, forward exchange contracts and options to hedge its foreign exchange risk. At 31 December 2016, CERN had no foreign exchange hedging instruments in progress.
The CHIS fund is exposed to currency risk through the translation of financial assets denominated in a foreign-currency. As 31 December 2016, the financial assets denominated

72
in foreign currencies were cash, bonds and shares. The impact of a +/- 10% change in the exchange rates on the closing balances would result in a gain/loss of 5.8 MCHF and a corresponding increase/decrease in the asset value.
7.26. FINANCIAL INSTRUMENTS
7.26.1. FINANCIAL INSTRUMENTS BY CATEGORY
The following table is a comparison by category of the carrying amounts and fair values of all of CERN’s financial instruments carried in the financial statements.
kCHFAs at
31.12.2016As at
31.12.2015As at
31.12.2016As at
31.12.2015CERN Financial InstrumentsFinancial Assets Fair Value through Profit and Loss Total - - - -
Cash and cash equivalents 154 615 176 200 154 615 176 200
Other financial assets 60 000 - 60 000 -
Financial assets measured at amortized cost -
Receivables 51 173 99 316 51 173 99 316
Other receivables 17 491 17 189 17 491 17 189
Total CERN Financial Assets 283 279 292 706 283 279 292 706
Short-term debt and bank overdraft 25 929 25 108 25 929 25 108
Financial liabilities measured at amortized cost
Payables 269 213 250 966 269 213 250 966
Long-term debts 281 939 307 868 257 467 278 623
Member States 2 277 2 277 2 277 2 277
Total CERN Financial Liabilities 579 358 586 219 554 886 556 974
CHIS Financial InstrumentsFinancial Assets Fair Value through Profit and Loss Bonds 90 410 72 276 90 410 72 276
Shares 47 594 68 086 47 594 68 086
Funds 38 586 39 628 38 586 39 628
Derivatives used for trading 2 873 4 944 2 873 19 482
Total 179 463 184 934 179 463 199 472
Cash and cash equivalents 35 915 19 298 35 915 4 760
Other 2 015 795 2 015 795
Total CHIS Financial Assets 217 393 205 026 217 393 205 027
Financial liabilities measured at amortized cost
Long-term liabilities - CHIS fund 188 484 177 946 178 669 160 002
Short-term liabilities - CHIS fund 28 909 27 081 28 909 27 081
Total CHIS Financial Liabilities 217 393 205 027 207 578 187 083
Carrying Value Fair Value
73
The fair value of the financial assets and liabilities are included at the amount at which the instrument could be exchanged in a current transaction between willing parties, other than in a forced sale or liquidation.
At 31 December 2016, no financial instruments at fair value through surplus or deficit were held directly by CERN. The fair values of the CHIS fund financial assets at fair value through surplus or deficit are measured based on quoted prices at the balance sheet date or at the last available price available to market participants. The carrying amounts and the fair value amounts do not differ.
For cash and cash equivalents, receivables, other financial assets, as well as payables, short-term debt and bank overdrafts, the carrying amounts are not considered to differ significantly from the fair value amounts largely due to the expected short-term maturities of these instruments.
The long term loans carried at amortised cost from Fortis and FIPOI are not traded on an active market. Their fair value as shown on the above table at the balance sheet date is calculated as the present value of the future cash flows discounted using the prevailing government interest rates for the approximate remaining period of each loan.
7.26.2. FAIR VALUE LEVELS
For valuation purposes, the financial assets at fair value through the surplus and deficit are classified under the following fair value levels:
level 1 – quoted prices (unadjusted) in active markets for identical assets or liabilities;
level 2 – inputs other than quoted prices included within Level 1 that are observable for the asset or liability, either directly or indirectly;
level 3 – inputs that are not based on observable market data.
At 31 December 2016, CERN did not hold any financial assets classified as fair value through surplus and deficit.
Based on the above fair value hierarchy, at 31 December 2016 all financial assets classified as fair value through surplus and deficit held by CHIS were classified as Level 1.

74
7.26.3. GAINS AND LOSSES ON FINANCIAL INSTRUMENTS
The table below details gains and losses on financial instruments recorded in the year.
kCHF
For the year ended
31.12.2016
For the year ended
31.12.2015CERN Financial InstrumentsFinancial Assets Fair Value through Profit and Loss
Net gains (losses) on assets at fair value through surplus or deficit
- 3 - 0
Interest income 1 082 1 308 Interest expense on long term debt - 11 736 - 15 089 Net exchange gains/losses* - 2 041 4 967 Fees and other costs - 62 - 35 Sundry - 15 94
Total - 12 775 - 8 756 * Exchange gains/losses related to financial assets at fair value through surplusor deficit are netted agains net gains (losses) on these assets in the table above
kCHF
For the year ended
31.12.2016
For the year ended
31.12.2015CHIS Financial Instruments*Financial Assets Fair Value through Profit and Loss
Net gains (losses) on assets at fair value through surplus or deficit
310 - 2 436
Interest incomeInterest expense - 56 - 12 Fees and other costs - 597 - 1 382 Sundry
Total - 343 - 3 830 * do not appear in Statement of financial performance
7.27. RECAPITALISATION OF THE PENSION FUND
Following the Five-Yearly Review 2010 and the approval by the Council in December 20103, CERN contributed in 2016 to the recapitalisation of the Pension Fund in an amount of 60 MCHF (60 MCHF in 2015).
3 CERN/FC/5498 – CERN/2947

75
7.28. RELATED PARTY DISCLOSURES
Requirements of the IPSAS 20 Standard
The standard requires the following disclosures:
The total amount of all other remuneration and compensation provided to key management personnel, and close members of the family of key management personnel, by the reporting entity during the reporting period, showing separately the aggregate amounts provided to:
(i) Key management personnel; and (ii) Close members of the family of key management personnel
The standard defines close members of the family of key management personnel as close relatives of the individual or members of the individual’s immediate family who can be expected to influence, or be influenced by, that individual in their dealings with the entity.
Key Management Personnel
The Organization is governed by the CERN Council composed of delegates of all Member States. The latter do not receive remuneration from the Organization. The CERN Council is the highest authority of the Organization and, as such, appoints the Director-General to manage the CERN Laboratory.
The Director-General is assisted by Directors and Key Advisors, and runs the Laboratory through a structure of Departments, each managed by a Head of Department. Together they represent the key management personnel of CERN, and are remunerated by the Organization.
The aggregate remuneration related to key management personnel and their close family members includes salaries, allowances, employer social contributions, benefits and other entitlements paid directly or indirectly in accordance with the Staff Rules & Regulations. Included in aggregate remuneration is therefore the average variation in unpaid leave that decreases when holidays are taken and increases when they are not, and is revalued each year based on current base salary. Since there was a change in the composition of the key management personnel in 2016, their personnel situations influence the unpaid leave and allowances they receive, and therefore the average remuneration received by the group is not comparable to the prior year.
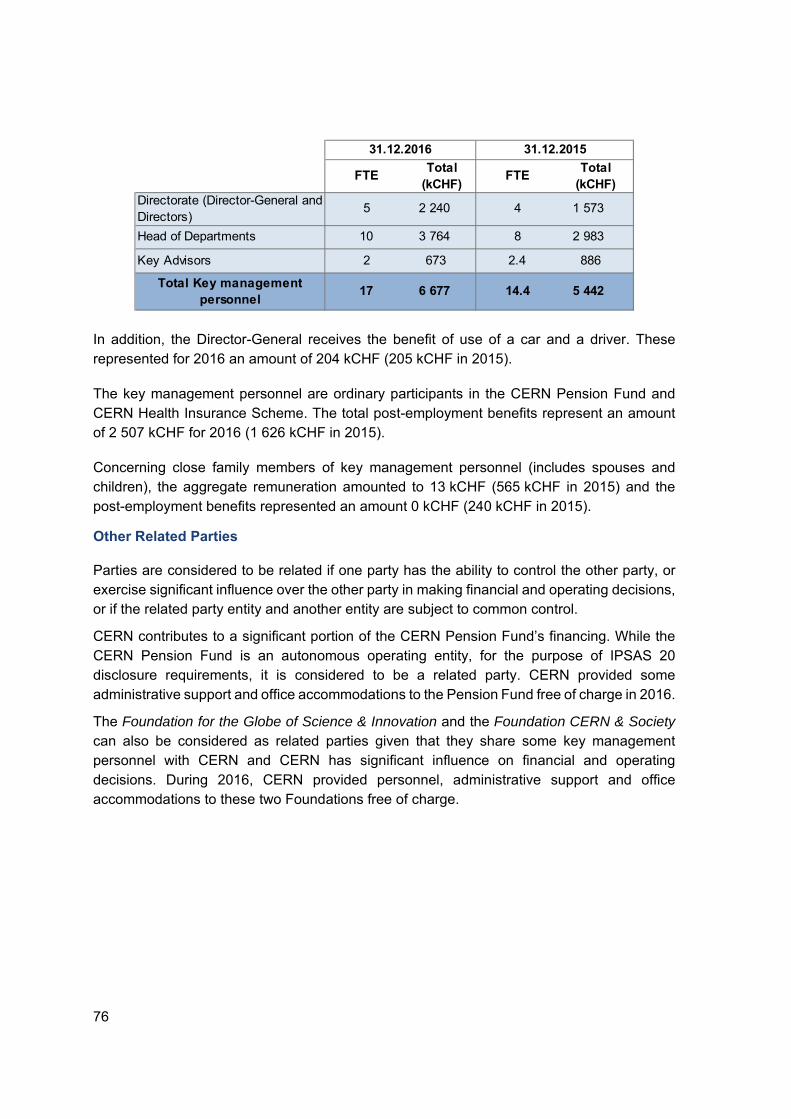
76
FTETotal
(kCHF)FTE
Total (kCHF)
Directorate (Director-General and Directors)
5 2 240 4 1 573
Head of Departments 10 3 764 8 2 983
Key Advisors 2 673 2.4 886
Total Key management personnel
17 6 677 14.4 5 442
31.12.201531.12.2016
In addition, the Director-General receives the benefit of use of a car and a driver. These represented for 2016 an amount of 204 kCHF (205 kCHF in 2015).
The key management personnel are ordinary participants in the CERN Pension Fund and CERN Health Insurance Scheme. The total post-employment benefits represent an amount of 2 507 kCHF for 2016 (1 626 kCHF in 2015).
Concerning close family members of key management personnel (includes spouses and children), the aggregate remuneration amounted to 13 kCHF (565 kCHF in 2015) and the post-employment benefits represented an amount 0 kCHF (240 kCHF in 2015).
Other Related Parties
Parties are considered to be related if one party has the ability to control the other party, or exercise significant influence over the other party in making financial and operating decisions, or if the related party entity and another entity are subject to common control.
CERN contributes to a significant portion of the CERN Pension Fund’s financing. While the CERN Pension Fund is an autonomous operating entity, for the purpose of IPSAS 20 disclosure requirements, it is considered to be a related party. CERN provided some administrative support and office accommodations to the Pension Fund free of charge in 2016.
The Foundation for the Globe of Science & Innovation and the Foundation CERN & Society can also be considered as related parties given that they share some key management personnel with CERN and CERN has significant influence on financial and operating decisions. During 2016, CERN provided personnel, administrative support and office accommodations to these two Foundations free of charge.

77
8. NOTES TO THE BUDGET ACTUAL AMOUNTS
As required by IPSAS 24 – Presentation of Budget Information in Financial Statements, section 8 of the notes makes a comparison of budget amounts and the actual amounts arising from execution of the budget. In addition, explanations of the reasons for material differences between the budget and actual amounts are provided.
The Final 2016 Budget4 for expenses of 1 236 MCHF at 2016 prices was endorsed by the Finance Committee in December 2015.
In the course of the annual planning exercise, the new Management reviewed the spending profile for 2016 thoroughly. Consequently, a Revised Budget5 was presented as part of the Medium Term Plan in June 2016. For this reason, the financial tables and figures in the Annual Progress Report6 show not only the Final Budget published at the end of 2015, but also the Revised Budget, and the Budget Out-Turn is compared to the revised figures.
2016 Probable Revenues and Expenses were presented to the Finance Committee in December 2016 in the framework of the Final 2017 Budget7.
The financial position of the Organization at the end of 2016 shows a significant improvement compared to expectations, with a cumulative budget deficit of -118.4 MCHF, about 93.3 MCHF lower than anticipated in the Final 2016 Budget, and compatible with the cumulative balance at the end of 2015 (-118.1 MCHF).
The 2016 Budget Out-Turn balance is larger than expected in the Final 2016 Budget, mainly due to 82.8 lower expenses. About 30 MCHF of expenses were reprofiled in the Revised 2016 Budget5. Further 51.7 MCHF of the differences in the expenses were already anticipated and explained as outcome of the probable revenues and expenses exercise for 2016 and presented as part of the Final 2017 Budget7.
The main reasons for the variation in expenses are explained below:
The appreciation of the exchange rate CHF-EUR contributed to the decrease of expenses of around 13 MCHF, including energy; this amount was already anticipated in the Revised 2016 Budget5;
The priority given to the LHC upgrades resulted in a slightly higher level of expenses for the LHC Injectors Upgrade, the LHC luminosity upgrade (HL-LHC) and the Phase-1 LHC detectors upgrades than planned;
The focus on the LHC upgrades resulted in shortage of personnel that generated some underspending in accelerator maintenance and consolidation and in other
4 CERN/FC/5955 – CERN/3212 5 CERN/FC/6011 – CERN/3246 6 CERN/FC/6096/RA – CERN/3294/RA 7 CERN/FC/6060 – CERN/3277

78
areas. For instances, less resources than planned have been spent in R&D projects such as superconducting magnets (beyond those for HL-LHC and FCC), superconducting RF and upgrade of the SM18 hall;
Re-profiling of some of the expenses for non-LHC projects, such as CLIC, ELENA, HIE-ISOLDE, AWAKE, MEDICIS and FAIR;
Some of the personnel allocated to scientific support was re-redeployed to the LHC experiments, FCC project and LHC detectors upgrade headings;
Re-profiling of the expenses for some building projects, such as construction of Building 311 (magnetic measurement laboratory) and consolidation of the polymer laboratory, taking into account contract adjudications and contractual deliverables;
Some reduction in the expenses of the administration budget allocated to the Directorate, mainly thanks to the savings coming from the new organizational structure.

79
8.1. SUMMARY OF REVENUE AND EXPENSES BY ACTIVITY
The table below shows a comparison between the budget and the actual amounts:
Final 2016 Budget 2016 Out-Turn
(in MCHF, rounded off) CERN/FC/5955 CERN/FC/6096/RA
(2016 prices) (2016 prices) MCHF %
(a) (b) (c)=(b)-(a) (c)/(a)
REVENUES 1,227.5 1,238.0 10.5 0.9%
Member States' contributions 1,119.7 1,119.0 -0.7 -0.1%
Associate Member States' contributions 7.6 8.4 0.8 11.2%
Contributions anticipated from new Associate Member States 3.5 -3.5 -100.0%
EU contributions 14.4 17.6 3.3 22.8%
Additional contributions 14.6 13.6 -1.0 -6.6%
Personnel paid from team accounts 11.7 11.8 0.1 0.8%
Personnel on detachment 0.9 0.9 0.0 -0.5%
Internal taxation 28.5 31.5 2.9 10.2%
Knowledge transfer 1.1 1.9 0.8 73.3%
Other revenues 25.5 33.2 7.7 30.1%
Fact sheet (MTP 2016) EXPENSES 1,236.0 1,153.2 -82.8 -6.7%
Running of scientific programmes and support 980.4 923.2 -57.1 -5.8%
Scientific programmes 506.7 459.7 -47.0 -9.3%
1, 2, 3, 4, 5, 6, 8 LHC (machine, detectors, computing, including spares and consolidation) 282.8 259.9 -22.9 -8.1%
9, 10, 11, 12 Non-LHC physics and scientific support 83.4 68.2 -15.2 -18.2%
13 Accelerators and areas (including consolidation) 140.4 131.5 -8.9 -6.3%
Infrastructure and services 280.6 278.6 -2.0 -0.7%
14, 15, 16, 17, 18, 19General Infrastructure, services and centralised expenses (incl. admin, international relations, safety)
249.5 246.3 -3.2 -1.3%
20 Infrastructure consolidation, buildings and renovation 31.1 32.3 1.3 4.1%
Centralised expenses 193.1 185.0 -8.2 -4.2%
21 Centralised personnel expenses 35.7 36.1 0.4 1.0%
21 Internal taxation 28.5 31.5 2.9 10.2%
21 Internal mobility, personnel on detachment, paid from team accounts 13.4 15.1 1.7 12.5%
21 Budget amortisation of staff benefit accruals 17.3 17.3 0.0 0.0%
21 Energy and water, insurance and postal charges, miscellaneous 82.3 65.4 -16.8 -20.5%
21 Interest, bank and financial expenses, in-k ind 15.8 19.6 3.7 23.5%
Projects and studies 255.7 229.9 -25.7 -10.1%
LHC upgrades 141.6 122.7 -18.9 -13.4%
22 LINAC4 4.9 5.3 0.5 9.3%
23 LHC injectors upgrade 45.5 37.1 -8.4 -18.5%
24 HL-LHC construction 62.9 56.1 -6.8 -10.8%
25 LHC detectors upgrade (Phase 1) and consolidation 19.7 17.2 -2.5 -12.7%
25 HL-LHC detectors, including R&D (Phase 2) 8.7 7.0 -1.7 -19.5%
Energy frontier 36.6 33.4 -3.2 -8.8%
26, 27 Linear collider studies (CLIC, ILC, detector R&D) 27.9 22.2 -5.7 -20.4%
28 Future Circular Collider study 8.8 11.2 2.4 27.9%
Scientific diversity activities 77.4 73.9 -3.5 -4.6%
29 ELENA 13.5 10.1 -3.4 -24.9%
30 HIE-ISOLDE 10.0 7.2 -2.8 -28.4%
31 CERN neutrino platform 16.8 22.8 6.0 35.9%
32, 33, 34, 35, 36 R&D (incl. EU support) for accelerators, medical applications 37.1 33.8 -3.3 -9.0%
BALANCE
Annual balance -8.5 84.8 93.3
Capital repayment allocated to the budget (Fortis, FIPOI 1, 2 and 3) -25.1 -25.1 0.0
Recapitalisation pension fund -60.0 -60.0
Annual balance allocated to budget deficit -93.6 -0.3 93.3
-Cumulative balance- - 118.1 -211.7 -118.4 93.3
Page 16, Figure 3"Total Expenses by
Activity and Balance"
VariationReference toAnnual Progress Report
2016CERN/FC/6096/RA
Page 14, Figure 2"Total Revenues"

80
8.2. MATERIAL EXPENSES
In addition to the above table which details expenses by Activity, the following table shows the breakdown of Materials budget expenses by nature.
Comments Budget Expenses Difference
Goods, Consumables and Supplies A 323.3 213.5 - 109.8 Electricity, heating gas and water B 76.0 59.5 - 16.5 Industrial services C 106.2 122.9 16.7 Associated Members of Personnel 39.6 41.1 1.5 Other overheads 47.7 49.5 1.8
Total 592.9 486.5 - 106.4
MCHF
2016
Comments
A) The difference is largely explained by the re-scheduling of multi-annual projects and consolidation to take into account a more realistic execution versus time of the projects and other activities.
B) The difference results from the impact of the EUR-CHF exchange rate, as the electricity is mainly purchased in EUR.
C) The heading for industrial services is higher due to the impact of the EUR-CHF exchange rate and the inclusion of new contracts, including those for civil-engineering, consultancy, non-destructive analyses, CHIS management, operation of the CERN housing service and travel management services.
8.3. PERSONNEL EXPENSES
8.3.1. EXPENSES BY NATURE
For 2016, 630.3 MCHF were initially allocated to the Personnel Budget. The final expenses charged to the Personnel budget amounted to 647.2 MCHF.
The following tables show the breakdown of Personnel expenses.
Comments Budget Expenses DifferenceStaff Members D 475.4 480.2 4.8 Fellows and Apprentices E 61.6 70.4 8.8 Centralised Personnel Expenses F 35.6 36.1 0.4 Internal taxation 28.5 31.5 3.0 Amortization of staff benefits accruals 17.3 17.3 -
81.5 84.9 3.4 Personnel externally funded 11.8 11.8 0.0
Total 630.2 647.2 17.0
As at 31.12.2016
MCHF

81
Comments
D) With respect to the Final Budget, the overall expenses on staff members were 0.9% higher than budgeted, which is explained by the corresponding increase in FTE due to different departures and recruitments as presented in the Revised Budget
E) The fellowship programme increased with respect to the budget. This is due to more FTEs paid by transfers from materials for the GET fellowships and the Technical Trainee Programme.
The Apprentices recruited since September 2016 are no longer accounted to the Personnel budget
F) The centralised personnel expenses mainly consist of reinstallation indemnities and unemployment benefits as well as CERN contribution to the health insurance scheme for the pensioners.
8.3.2. DISTRIBUTION OF FTE BY ACTIVITY
8.3.2.1. Staff
The total CERN Staff Member strength in 2016 was 2513.4 FTEs (compared to 2500.6 in Final 2016 budget and 2488.6 in 2015).
FTE 1) FTE FTE
CERN BudgetPersonnel not
availableExternally
funded
680.8 19.5
554.2 4.7
776.8 20.7 9.1
19.7
427.7 0.2
2 439.5 20.7 53.2
Including staff financed by EU, TT and OpenLab funds.
Pension Fund2)
Activity
LHC Programme (incl. projects)
Other programmes
Infrastructure and services
Projects
Other expenses 2)
1)
Total 2 513.4
8.3.2.2. Fellows and Apprentices
For Fellows and Apprentices, the total strength in 2016 was 699.3 FTEs (compared to 654.3 in 2015). The increase in Fellows stems from the higher importance of the GET fellowship programme (i.e. funding fellowships with a transfer from materials) and TTE programme (Technical Training Experience).

82
FTE CERN Budget
FTE Externally funded
Fellows Fellows
215.6 19.0
125.5 4.3
131.7 4.0
1.0
195.7 2.5
668.5 30.8
Pension Fund
Activity
LHC Programme (incl. projects)
Other programmes
Other expenses 1)
Infrastructure and services
Projects
1)
699.3 Total
Further detailed explanations regarding the differences between actual Personnel expenses and Budget are given in the Annual Progress Report for 2016 (see CERN/FC/6096 – CERN/3294).
8.4. INTEREST AND FINANCIAL COSTS
Budget Expenses Difference
BNP FORTIS Bank 9.9 9.9 - 0.0 In-kind (FIPOI interests 0%) 2.0 1.9 - 0.2 Financial expenses 1.0 2.1 1.2
Total 12.9 13.9 1.0
MCHF
As at 31.12.2016
8.5. CAPITAL REPAYMENTS
In line with International Public Sector Accounting Standards (IPSAS), the capital repayment of long-term loans is not shown as budget expenditure but deducted from the liabilities in the Statement of Financial Position. However, in order to reflect cash requirements of the Organization, it is still allocated to the budget balance.
Budget Repayment Difference
FORTIS loan 24.0 24.0 - FIPOI loans 1.1 1.1 -
Total 25.1 25.1 -
MCHF
As at 31.12.2016
*
* *