Embed Size (px)
Citation preview
Financial statements and other informationReport of the auditor 118Financial statements Consolidated income statement 124 Consolidated statement of comprehensive income 125 Consolidated balance sheet 126 Consolidated statement of cash flows 127 Consolidated statement of changes in equity 128Notes to the accounts 129Company balance sheet 167Supplementary disclosures 173Other information 178Ten year record 190Shareholder information 191Glossary 193
116 British Land Annual Report and Accounts 2015
Financial statements

117British Land Annual Report and Accounts 2015
Photo taken by Will Hobman The Leadenhall Building
Report on the financial statements
Our opinionIn our opinion: – The British Land Company PLC’s group financial statements
and company financial statements (the “financial statements”) give a true and fair view of the state of the group’s and of the company’s affairs as at 31 March 2015 and of the group’s profit and cash flows for the year then ended
– the group financial statements have been properly prepared in accordance with International Financial Reporting Standards (“IFRSs”) as adopted by the European Union
– the company financial statements have been properly prepared in accordance with United Kingdom Generally Accepted Accounting Practice; and
– the financial statements have been prepared in accordance with the requirements of the Companies Act 2006 and, as regards the group financial statements, Article 4 of the IAS Regulation.
What we have auditedThe British Land Company PLC’s financial statements comprise: – the Consolidated Balance Sheet as at 31 March 2015 – the Company Balance Sheet as at 31 March 2015 – the Consolidated Income Statement and the Consolidated
Statement of Comprehensive Income for the year then ended – the Consolidated Statement of Cash Flows for the year then ended – the Consolidated Statement of Changes in Equity for the year then
ended; and – the notes to the financial statements, which include a summary
of significant accounting policies and other explanatory information. Certain required disclosures have been presented elsewhere in the Annual Report, rather than in the notes to the financial statements. These are cross-referenced from the financial statements and are identified as audited.
The financial reporting framework that has been applied in the preparation of the group financial statements is applicable law and IFRSs as adopted by the European Union. The financial reporting framework that has been applied in the preparation of the company financial statements is applicable law and United Kingdom Accounting Standards (United Kingdom Generally Accepted Accounting Practice).
Our audit approach
Materiality – Overall Group materiality: £130 million which represents 1%
of Total assets. – Specific Group materiality, applied to underlying pre-tax profit:
£15 million which represents 5% of underlying pre-tax profit.
Audit scope – First year audit procedures on opening balances. – A full scope audit was performed by the Group audit team for
all subsidiaries of the Group, and the following joint ventures: Broadgate, Meadowhall, Leadenhall and BL Sainsbury’s Superstores.
Areas of focus – Valuation of investment properties. – Revenue recognition, specifically non-standard transactions. – Acquisitions and disposals, and review of accounting treatment
on these transactions. – Investments in joint ventures and funds, and assessment of impact
of new accounting standards. – Taxation – REIT status and tax provisions.
The scope of our audit and our areas of focusWe conducted our audit in accordance with International Standards on Auditing (UK and Ireland) (“ISAs (UK & Ireland)”).
We designed our audit by determining materiality and assessing the risks of material misstatement in the financial statements. In particular, we looked at where the directors made subjective judgements, for example in respect of significant accounting estimates that involved making assumptions and considering future events that are inherently uncertain. As in all of our audits, we also addressed the risk of management override of internal controls, including evaluating whether there was evidence of bias by the directors that represented a risk of material misstatement due to fraud.
The risks of material misstatement that had the greatest effect on our audit, including the allocation of our resources and effort, are identified as “areas of focus” in the table below. We have also set out how we tailored our audit to address these specific areas in order to provide an opinion on the financial statements as a whole, and any comments we make on the results of our procedures should be read in this context. This is not a complete list of all risks identified by our audit.
118 British Land Annual Report and Accounts 2015
Financial statements
REPORT OF THE AUDITOR
Area of focus How our audit addressed the area of focus
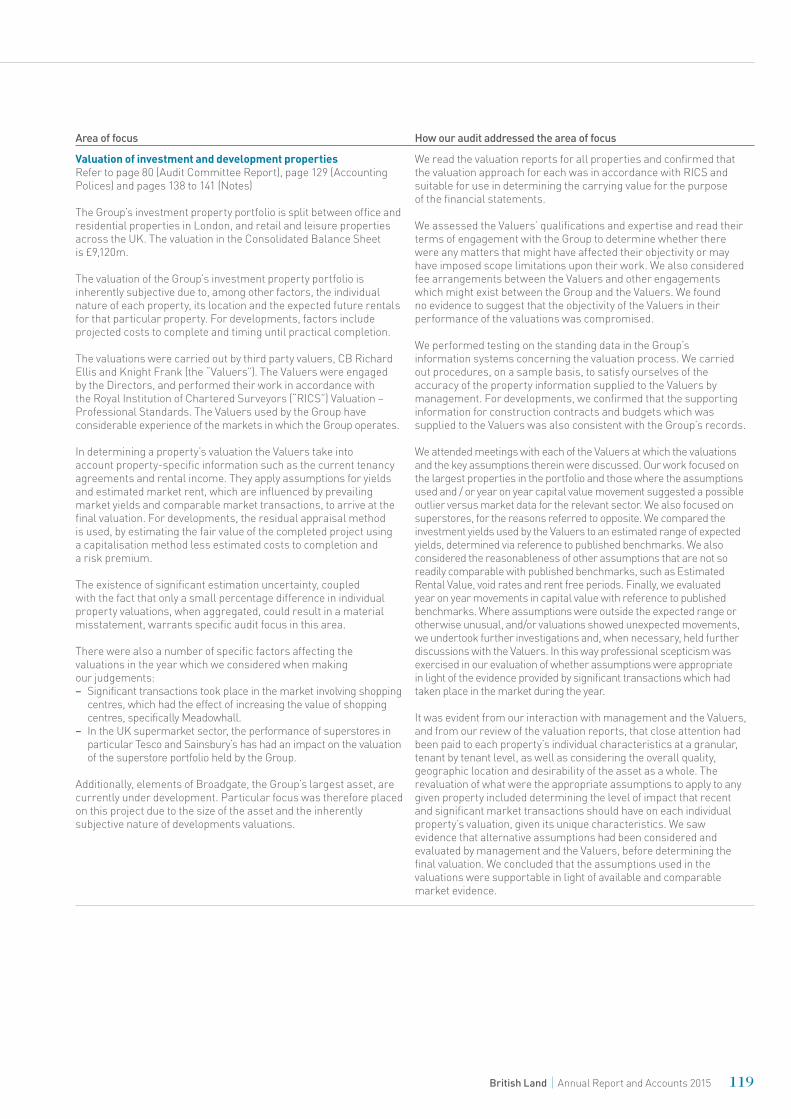
Valuation of investment and development propertiesRefer to page 80 (Audit Committee Report), page 129 (Accounting Polices) and pages 138 to 141 (Notes)
The Group’s investment property portfolio is split between office and residential properties in London, and retail and leisure properties across the UK. The valuation in the Consolidated Balance Sheet is £9,120m.
The valuation of the Group’s investment property portfolio is inherently subjective due to, among other factors, the individual nature of each property, its location and the expected future rentals for that particular property. For developments, factors include projected costs to complete and timing until practical completion.
The valuations were carried out by third party valuers, CB Richard Ellis and Knight Frank (the “Valuers”). The Valuers were engaged by the Directors, and performed their work in accordance with the Royal Institution of Chartered Surveyors (“RICS”) Valuation – Professional Standards. The Valuers used by the Group have considerable experience of the markets in which the Group operates.
In determining a property’s valuation the Valuers take into account property-specific information such as the current tenancy agreements and rental income. They apply assumptions for yields and estimated market rent, which are influenced by prevailing market yields and comparable market transactions, to arrive at the final valuation. For developments, the residual appraisal method is used, by estimating the fair value of the completed project using a capitalisation method less estimated costs to completion and a risk premium.
The existence of significant estimation uncertainty, coupled with the fact that only a small percentage difference in individual property valuations, when aggregated, could result in a material misstatement, warrants specific audit focus in this area.
There were also a number of specific factors affecting thevaluations in the year which we considered when makingour judgements: – Significant transactions took place in the market involving shopping
centres, which had the effect of increasing the value of shopping centres, specifically Meadowhall.
– In the UK supermarket sector, the performance of superstores in particular Tesco and Sainsbury’s has had an impact on the valuation of the superstore portfolio held by the Group.
Additionally, elements of Broadgate, the Group’s largest asset, are currently under development. Particular focus was therefore placed on this project due to the size of the asset and the inherently subjective nature of developments valuations.
We read the valuation reports for all properties and confirmed that the valuation approach for each was in accordance with RICS and suitable for use in determining the carrying value for the purpose of the financial statements.
We assessed the Valuers’ qualifications and expertise and read their terms of engagement with the Group to determine whether there were any matters that might have affected their objectivity or may have imposed scope limitations upon their work. We also considered fee arrangements between the Valuers and other engagements which might exist between the Group and the Valuers. We found no evidence to suggest that the objectivity of the Valuers in their performance of the valuations was compromised.
We performed testing on the standing data in the Group’s information systems concerning the valuation process. We carried out procedures, on a sample basis, to satisfy ourselves of the accuracy of the property information supplied to the Valuers by management. For developments, we confirmed that the supporting information for construction contracts and budgets which was supplied to the Valuers was also consistent with the Group’s records.
We attended meetings with each of the Valuers at which the valuations and the key assumptions therein were discussed. Our work focused on the largest properties in the portfolio and those where the assumptions used and / or year on year capital value movement suggested a possible outlier versus market data for the relevant sector. We also focused on superstores, for the reasons referred to opposite. We compared the investment yields used by the Valuers to an estimated range of expected yields, determined via reference to published benchmarks. We also considered the reasonableness of other assumptions that are not so readily comparable with published benchmarks, such as Estimated Rental Value, void rates and rent free periods. Finally, we evaluated year on year movements in capital value with reference to published benchmarks. Where assumptions were outside the expected range or otherwise unusual, and/or valuations showed unexpected movements, we undertook further investigations and, when necessary, held further discussions with the Valuers. In this way professional scepticism was exercised in our evaluation of whether assumptions were appropriate in light of the evidence provided by significant transactions which had taken place in the market during the year.
It was evident from our interaction with management and the Valuers, and from our review of the valuation reports, that close attention had been paid to each property’s individual characteristics at a granular, tenant by tenant level, as well as considering the overall quality, geographic location and desirability of the asset as a whole. The revaluation of what were the appropriate assumptions to apply to any given property included determining the level of impact that recent and significant market transactions should have on each individual property’s valuation, given its unique characteristics. We saw evidence that alternative assumptions had been considered and evaluated by management and the Valuers, before determining the final valuation. We concluded that the assumptions used in the valuations were supportable in light of available and comparable market evidence.
119British Land Annual Report and Accounts 2015
Area of focus How our audit addressed the area of focus
Revenue recognitionRefer to page 81 (Audit Committee Report), page 130 (Accounting Polices) and page 133 (Notes)
Revenue for the Group consists primarily of rental income. Rental income is based on tenancy agreements where there is a standard process in place for recording revenue, which is system generated. There are however certain transactions within revenue which warrant additional audit focus and have an increased inherent risk of error due to the non-standard nature of these transactions. These include: – spreading of tenant incentives and guaranteed rent increases; – surrender premia.
We carried out tests of the controls over the cash and accounts receivable processes and the related IT systems to obtain evidence that postings to these accounts were reliable. For rental income balances, we then used data-enabled audit techniques to identify all standard revenue journals posted using these systems and processes. The remaining journals related to non-standard transactions. These were individually tested through obtaining supporting information for all items and no issues were noted.
For balances not included within rental income, we performed substantive testing on a sample basis. No issues were noted.
Accounting for transactions Refer to page 81 (Audit Committee Report), page 131 (Accounting Polices) and pages 158 to 159 (Notes)
There have been a number of property transactions during the year. These warranted additional audit focus due to the magnitude of transactions, and the potential for complex contractual terms that introduce judgement into how they are accounted for. Key transactions subject to additional audit focus were as follows. – Purchase of 50% stake in Tesco BL Holdings Limited and the
Tesco British Land Property Partnership and sale of the Group’s 50% holding in the Tesco Aqua Limited Partnership for a net payment of £102m: This was accounted for as a business combination of the subsidiaries acquired and a disposal of Tesco Aqua Limited Partnership.
– Purchase of additional units in the Hercules Unit Trust (“HUT”) for £93m: The purchase price of the units was based on the net asset value per unit at the date of purchase.
– Acquisition of Surrey Quays Leisure Park for £135m. – Acquisition of additional units in the Speke Unit Trust for £93m:
HUT increased its investment in this unit trust which has subsequently been consolidated into the results of HUT. This acquisition has been treated as a business combination.
– Various disposals with a net result of £26m. These included the disposal of a portfolio of retail assets for proceeds of £218.6m, Green Lanes Barnstaple for proceeds of £32.1m and Cwmbran Retail Park for proceeds of £31.2m.
For each transaction, we understood the nature of the transaction and assessed the proposed accounting treatment in relation to the Group’s accounting policies and relevant IFRSs.
For the Tesco and Speke acquisitions that were treated as business combinations, we assessed these in relation to IFRS 3 Business Combinations. We agreed that these acquisitions should be accounted for under IFRS3 because these entities meet the definition of a business under the accounting standard.
For the Speke acquisition which resulted in the Unit Trust being consolidated in line with IFRS10 Consolidated Financial Statements, we assessed management’s treatment in line with the accounting standard and agreed that the Unit Trust had been properly accounted for because control had been gained of the business.
For the purchase of units in HUT and Speke, we agreed the net asset value used in the unit share price calculation to supporting information including external property valuations.
For all acquisitions and disposals, we obtained and reviewed the key supporting documentation such as Sales and Purchase Agreements and completion statements. Consideration received or paid was agreed to bank statements and deferred consideration postings. No material issues were noted as a result of these procedures.
120 British Land Annual Report and Accounts 2015
Financial statements
REPORT OF THE AUDITOR CONTINUED
Area of focus How our audit addressed the area of focus
Investments in joint ventures and funds and impact of new accounting standardsRefer to page 81 (Audit Committee Report), page 129 (Accounting Polices) and pages 141 to 146 (Notes)
The Group is party to a number of joint ventures, including Broadgate, Meadowhall, certain Tesco and Sainsbury’s joint ventures, and the Leadenhall Building. The Group also has investments in the Hercules Unit Trust and the Pillar Retail Europark Fund (“PREF”).
The nature and complexity of the agreements relating to the Group’s investments in joint ventures and funds required specific audit focus. In addition, IFRSs 10, 11 and 12 came into effect in the year (refer to Note 1 to the financial statements), requiring all such agreements to be reassessed to ascertain treatment under the new standards.
IFRS10 – Consolidated Financial Statements provides more clear guidance on determining control. HUT continues to be treated as a subsidiary of the Group, and PREF continues to be equity accounted for on introduction of the new standard.
IFRS11 – Joint Arrangements focuses on the rights and obligations of specific arrangements. Proportional consolidation for joint ventures is no longer allowed. This has not had an impact on the treatment of the Group’s joint ventures.
IFRS12 – Disclosure of Interests in Other Entities includes the disclosure arrangements for all interests in other entities, of which joint arrangements and associates are of relevance to the Group. Refer to note 28 of the financial statements.
We performed an assessment as to whether the requirements of IFRS10, 11, and 12 had been appropriately reflected in the consolidated financial statements. This included evaluating management’s technical papers on the treatment of HUT and PREF under IFRS10 and the Group’s joint ventures under IFRS11, and assessing each arrangement against the relevant accounting standards. For significant arrangements, we agreed the key contractual elements to the legal agreements in place. Based on our audit work we concurred with the Group’s treatment of its investments in joint ventures and funds.
Taxation Refer to page 81 (Audit Committee Report), page 130 (Accounting Polices) and page 135 (Notes)
The Group’s status as a REIT underpins its business model and shareholder returns. For this reason, it warrants specific audit focus. The obligations of the REIT regime include requirements to comply with balance of business, dividend and income cover tests. During the year, the Broadgate joint venture converted to a REIT and as a result REIT compliance is also of relevance for this joint venture in addition to the overall Group.
Tax provisions are in place to account for the risk of challenge of certain of the Group’s tax positions. Given the subjective nature of these provisions, additional audit focus was placed on tax provisions.
We re-performed the Group’s annual REIT compliance tests, and we also evaluated how the Broadgate REIT conversion had been implemented. Based on our work performed, we agreed with management’s assessment that all REIT compliance tests had been met to ensure that the Group maintains its REIT status.
We used our tax expertise to evaluate tax provisions and potential exposures as at 31 March 2015, challenging the Group’s assumptions and judgements through our knowledge of the tax circumstances and by reading relevant correspondence between the Group and Her Majesty’s Revenue & Customs and the Group’s external tax advisors. Based on our work, we concluded that the tax provisions were within an appropriate range based on the supporting information provided by the Group’s tax department.
121British Land Annual Report and Accounts 2015
How we tailored the audit scopeWe tailored the scope of our audit to ensure that we performed enough work to be able to give an opinion on the financial statements as a whole, taking into account the structure of the Group, the accounting processes and controls, and the industry in which the Group operates.
As part of our first year audit procedures, we performed work over opening balances. This involved a review of the predecessor auditor’s working papers, performing an assessment of the Group and Company accounting policies and prior year financial statements and discussion with management. The Group and Company financial statements are produced using a single consolidation system that has a direct interface with the general ledger. We performed our audit procedures over the general ledger system and tested the interface with the consolidation system.
A full scope audit was performed by the Group audit team for all subsidiaries of the Group, and the following joint ventures: Broadgate, Meadowhall, Leadenhall and BL Sainsbury’s Superstores.
In establishing the overall approach to our audit, we assessed the risk of material misstatement, taking into account the nature, likelihood and potential magnitude of any misstatement. Following this assessment, we applied professional judgement to determine the extent of testing required over each balance in the financial statements.
MaterialityThe scope of our audit was influenced by our application of materiality. We set certain quantitative thresholds for materiality. These, together with qualitative considerations, helped us to determine the scope of our audit and the nature, timing and extent of our audit procedures and to evaluate the effect of misstatements, both individually and on the financial statements as a whole.
Based on our professional judgement, we determined materiality for the financial statements as a whole as follows:
Overall group materiality £130 millionHow we determined it 1% of Total assets.Rationale for benchmark applied The key driver of the business and
determinant of the Group’s value is direct property investments. Due to this, the key area of focus in the audit is the valuation of investment properties. On this basis, we set an overall Group materiality level based on total assets.
In addition, we set a specific materiality level of £15 million for items within underlying pre-tax profit. This equates to 5% of this measure which represents profit before tax adjusted for capital and other items. In arriving at this judgement we had regard to the fact that underlying pre-tax profit is a secondary financial indicator of the Group. (Refer to page 124 Consolidated Income Statement). We agreed with the Audit Committee that we would report to them misstatements identified during our audit above £1 million as well as misstatements below that amount that, in our view, warranted reporting for qualitative reasons.
Going concern Under the Listing Rules we are required to review the Directors’ statement, set out on page 76, in relation to going concern. We have nothing to report having performed our review.
As noted in the Directors’ statement, the Directors have concluded that it is appropriate to prepare the financial statements using the going concern basis of accounting. The going concern basis presumes that the Group and Company have adequate resources to remain in operation, and that the Directors intend them to do so, for at least one year from the date the financial statements were signed. As part of our audit we have concluded that the Directors’ use of the going concern basis is appropriate.
However, because not all future events or conditions can be predicted, these statements are not a guarantee as to the Group’s and Company’s ability to continue as a going concern.
Other required reporting
Consistency of other information
Companies Act 2006 opinionIn our opinion, the information given in the Strategic Report and the Directors’ Report for the financial year for which the financial statements are prepared is consistent with the financial statements.
ISAs (UK & Ireland) reportingUnder ISAs (UK & Ireland) we are required to report to you if, in our opinion: – Information in the Annual Report is:
– materially inconsistent with the information in the audited financial statements; or
– apparently materially incorrect based on, or materially inconsistent with, our knowledge of the group and company acquired in the course of performing our audit; or
– otherwise misleading.
We have no exceptions to report arising from this responsibility.
– The statement given by the Directors on page 75, in accordance with provision C.1.1 of the UK Corporate Governance Code (“the Code”), that they consider the Annual Report taken as a whole to be fair, balanced and understandable and provides the information necessary for members to assess the Group’s and company’s performance, business model and strategy is materially inconsistent with our knowledge of the Group and company acquired in the course of performing our audit.
We have no exceptions to report arising from this responsibility.
– The section of the Annual Report on page 79, as required by provision C.3.8 of the Code, describing the work of the Audit Committee does not appropriately address matters communicated by us to the Audit Committee.
We have no exceptions to report arising from this responsibility.
122 British Land Annual Report and Accounts 2015
Financial statements
REPORT OF THE AUDITOR CONTINUED
Adequacy of accounting records and information and explanations receivedUnder the Companies Act 2006 we are required to report to you if, in our opinion: – we have not received all the information and explanations we require
for our audit; or – adequate accounting records have not been kept by the company,
or returns adequate for our audit have not been received from branches not visited by us; or
– the Company financial statements and the part of the Directors’ Remuneration Report to be audited are not in agreement with the accounting records and returns.
We have no exceptions to report arising from this responsibility.
Directors’ remuneration
Directors’ remuneration report – Companies Act 2006 opinionIn our opinion, the part of the Directors’ Remuneration Report to be audited has been properly prepared in accordance with the Companies Act 2006.
Other Companies Act 2006 reportingUnder the Companies Act 2006 we are required to report to you if, in our opinion, certain disclosures of Directors’ remuneration specified by law are not made. We have no exceptions to report arising from this responsibility.
Corporate governance statementUnder the Listing Rules we are required to review the part of the Corporate Governance Statement relating to the company’s compliance with ten provisions of the UK Corporate Governance Code. We have nothing to report having performed our review.
Responsibilities for the financial statements and the audit
Our responsibilities and those of the directorsAs explained more fully in the Directors’ Responsibilities Statement set out on page 115, the Directors are responsible for the preparation of the financial statements and for being satisfied that they give a true and fair view.
Our responsibility is to audit and express an opinion on the financial statements in accordance with applicable law and ISAs (UK & Ireland). Those standards require us to comply with the Auditing Practices Board’s Ethical Standards for Auditors.
This report, including the opinions, has been prepared for and only for the company’s members as a body in accordance with Chapter 3 of Part 16 of the Companies Act 2006 and for no other purpose. We do not, in giving these opinions, accept or assume responsibility for any other purpose or to any other person to whom this report is shown or into whose hands it may come save where expressly agreed by our prior consent in writing.
What an audit of financial statements involvesAn audit involves obtaining evidence about the amounts and disclosures in the financial statements sufficient to give reasonable assurance that the financial statements are free from material misstatement, whether caused by fraud or error. This includes an assessment of: – whether the accounting policies are appropriate to the Group’s and
the Company’s circumstances and have been consistently applied and adequately disclosed
– the reasonableness of significant accounting estimates made by the directors; and
– the overall presentation of the financial statements.
We primarily focus our work in these areas by assessing the Directors’ judgements against available evidence, forming our own judgements, and evaluating the disclosures in the financial statements.
We test and examine information, using sampling and other auditing techniques, to the extent we consider necessary to provide a reasonable basis for us to draw conclusions. We obtain audit evidence through testing the effectiveness of controls, substantive procedures or a combination of both.
In addition, we read all the financial and non-financial information in the Annual Report to identify material inconsistencies with the audited financial statements and to identify any information that is apparently materially incorrect based on, or materially inconsistent with, the knowledge acquired by us in the course of performing the audit. If we become aware of any apparent material misstatements or inconsistencies we consider the implications for our report.
John Waters (Senior Statutory Auditor)for and on behalf of PricewaterhouseCoopers LLPChartered Accountants and Statutory AuditorsLondon
13 May 2015
123British Land Annual Report and Accounts 2015
2015 2014
Note
Underlying pre-tax1
£m
Capital and other
£mTotal
£m
Underlying pre-tax1
£m
Capital and other
£mTotal
£m
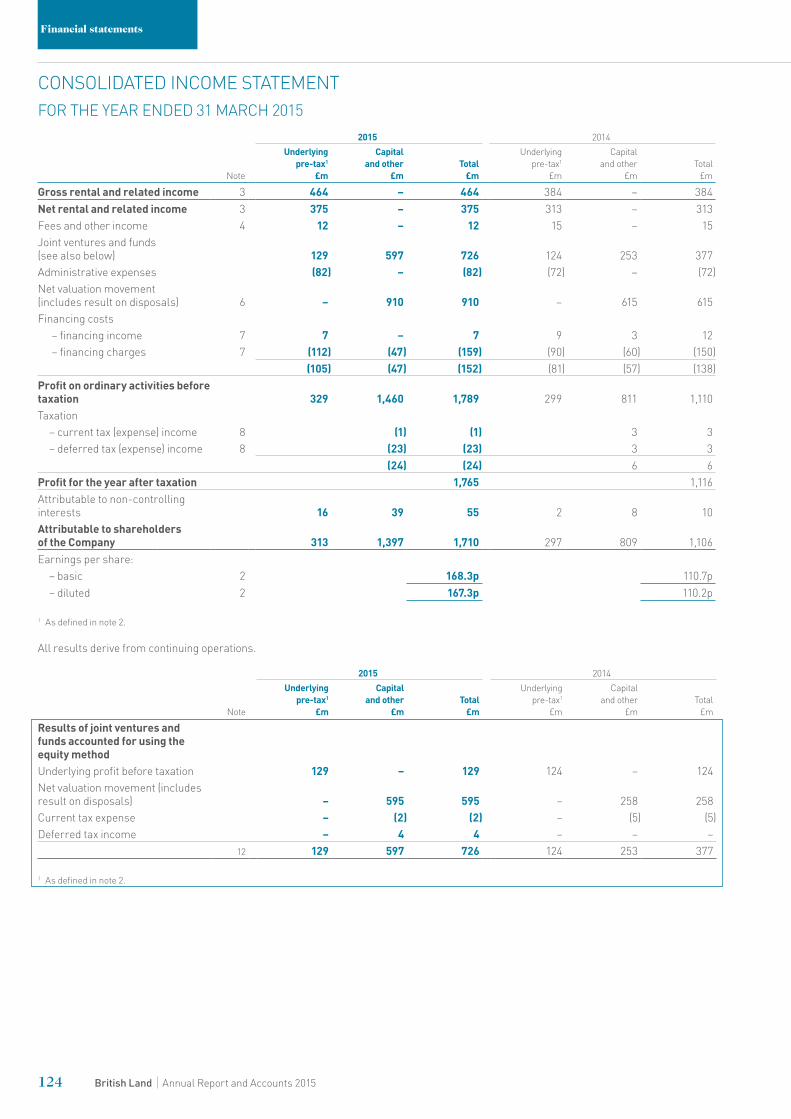
Gross rental and related income 3 464 – 464 384 – 384Net rental and related income 3 375 – 375 313 – 313Fees and other income 4 12 – 12 15 – 15Joint ventures and funds (see also below) 129 597 726 124 253 377Administrative expenses (82) – (82) (72) – (72)Net valuation movement (includes result on disposals) 6 – 910 910 – 615 615Financing costs
– financing income 7 7 – 7 9 3 12 – financing charges 7 (112) (47) (159) (90) (60) (150)
(105) (47) (152) (81) (57) (138)Profit on ordinary activities before taxation 329 1,460 1,789 299 811 1,110Taxation
– current tax (expense) income 8 (1) (1) 3 3– deferred tax (expense) income 8 (23) (23) 3 3
(24) (24) 6 6Profit for the year after taxation 1,765 1,116Attributable to non-controlling interests 16 39 55 2 8 10Attributable to shareholders of the Company 313 1,397 1,710 297 809 1,106Earnings per share:
– basic 2 168.3p 110.7p– diluted 2 167.3p 110.2p
1 As defined in note 2.
All results derive from continuing operations.
2015 2014
Note
Underlying pre-tax1
£m
Capital and other
£mTotal
£m
Underlying pre-tax1
£m
Capital and other
£mTotal
£m
Results of joint ventures and funds accounted for using the equity methodUnderlying profit before taxation 129 – 129 124 – 124Net valuation movement (includes result on disposals) – 595 595 – 258 258Current tax expense – (2) (2) – (5) (5)Deferred tax income – 4 4 – – –
12 129 597 726 124 253 377
1 As defined in note 2.
124 British Land Annual Report and Accounts 2015
Financial statements
CONSOLIDATED INCOME STATEMENTFOR THE YEAR ENDED 31 MARCH 2015
2015 £m
2014 £m
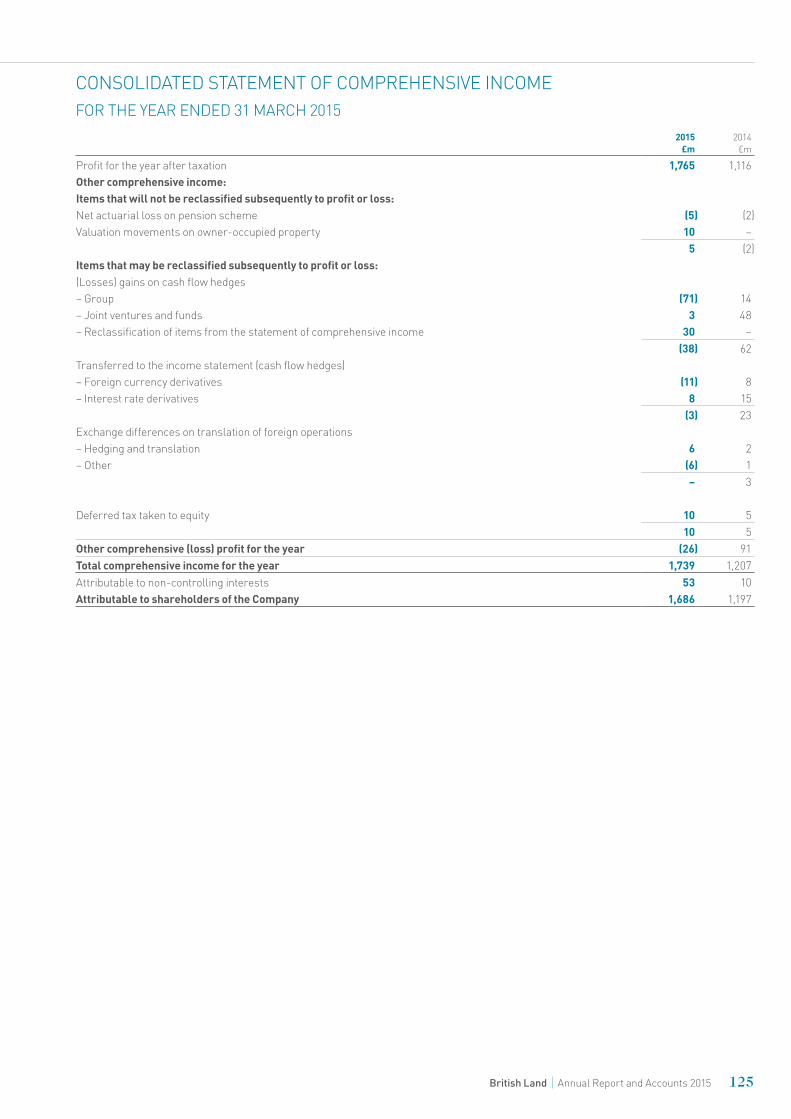
Profit for the year after taxation 1,765 1,116Other comprehensive income:Items that will not be reclassified subsequently to profit or loss:Net actuarial loss on pension scheme (5) (2)Valuation movements on owner-occupied property 10 –
5 (2)Items that may be reclassified subsequently to profit or loss:(Losses) gains on cash flow hedges– Group (71) 14– Joint ventures and funds 3 48– Reclassification of items from the statement of comprehensive income 30 –
(38) 62Transferred to the income statement (cash flow hedges)– Foreign currency derivatives (11) 8– Interest rate derivatives 8 15
(3) 23Exchange differences on translation of foreign operations– Hedging and translation 6 2– Other (6) 1
– 3
Deferred tax taken to equity 10 510 5
Other comprehensive (loss) profit for the year (26) 91Total comprehensive income for the year 1,739 1,207Attributable to non-controlling interests 53 10Attributable to shareholders of the Company 1,686 1,197
125British Land Annual Report and Accounts 2015
CONSOLIDATED STATEMENT OF COMPREHENSIVE INCOMEFOR THE YEAR ENDED 31 MARCH 2015
Note2015
£m2014
£m
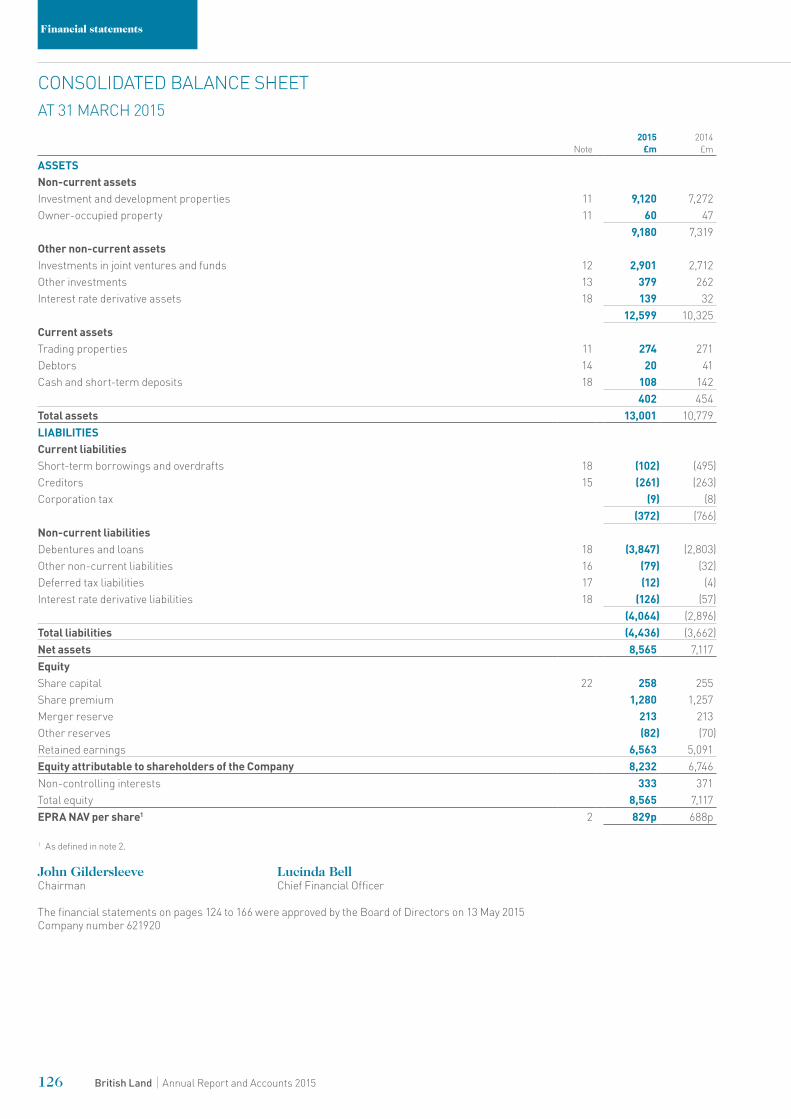
ASSETSNon-current assetsInvestment and development properties 11 9,120 7,272Owner-occupied property 11 60 47
9,180 7,319Other non-current assetsInvestments in joint ventures and funds 12 2,901 2,712Other investments 13 379 262Interest rate derivative assets 18 139 32
12,599 10,325 Current assetsTrading properties 11 274 271Debtors 14 20 41Cash and short-term deposits 18 108 142
402 454Total assets 13,001 10,779 LIABILITIESCurrent liabilitiesShort-term borrowings and overdrafts 18 (102) (495)Creditors 15 (261) (263)Corporation tax (9) (8)
(372) (766)Non-current liabilities Debentures and loans 18 (3,847) (2,803)Other non-current liabilities 16 (79) (32)Deferred tax liabilities 17 (12) (4)Interest rate derivative liabilities 18 (126) (57)
(4,064) (2,896)Total liabilities (4,436) (3,662)Net assets 8,565 7,117 EquityShare capital 22 258 255Share premium 1,280 1,257Merger reserve 213 213Other reserves (82) (70)Retained earnings 6,563 5,091Equity attributable to shareholders of the Company 8,232 6,746 Non-controlling interests 333 371Total equity 8,565 7,117 EPRA NAV per share1 2 829p 688p
1 As defined in note 2.
John Gildersleeve Lucinda BellChairman Chief Financial Officer
The financial statements on pages 124 to 166 were approved by the Board of Directors on 13 May 2015Company number 621920
126 British Land Annual Report and Accounts 2015
Financial statements
CONSOLIDATED BALANCE SHEETAT 31 MARCH 2015
Note2015
£m2014
£m
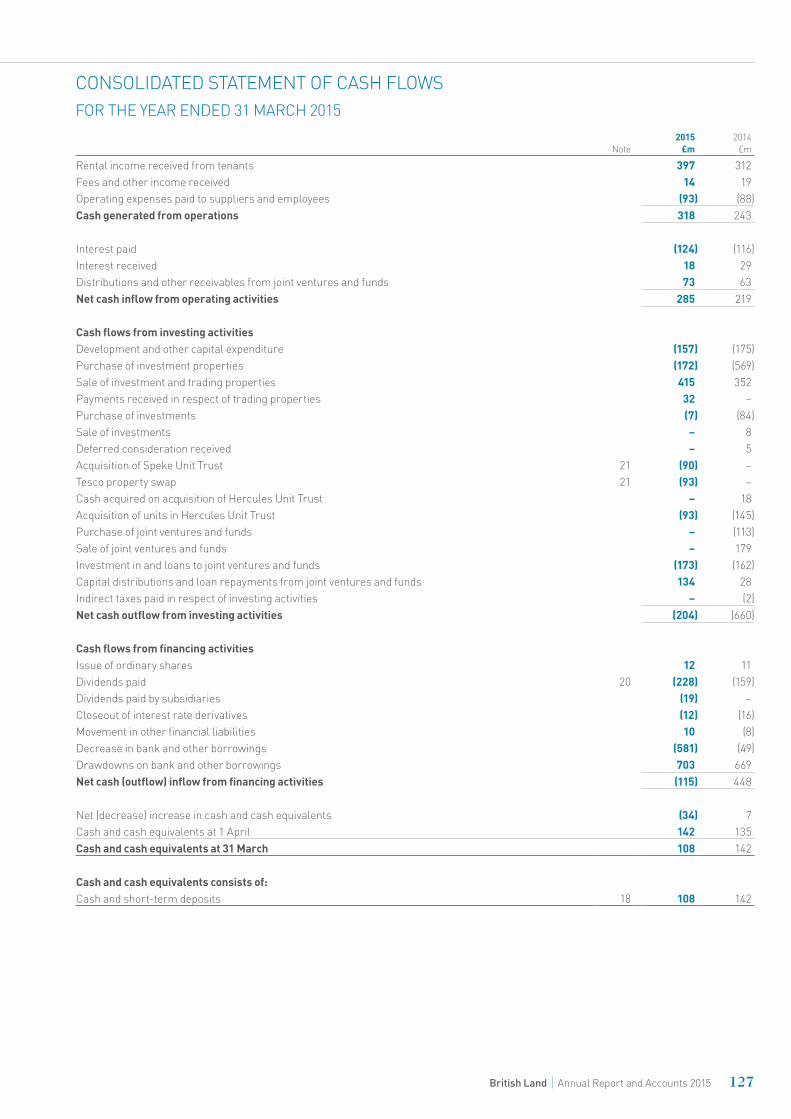
Rental income received from tenants 397 312Fees and other income received 14 19Operating expenses paid to suppliers and employees (93) (88)Cash generated from operations 318 243
Interest paid (124) (116)Interest received 18 29Distributions and other receivables from joint ventures and funds 73 63Net cash inflow from operating activities 285 219
Cash flows from investing activitiesDevelopment and other capital expenditure (157) (175)Purchase of investment properties (172) (569)Sale of investment and trading properties 415 352Payments received in respect of trading properties 32 –Purchase of investments (7) (84)Sale of investments – 8Deferred consideration received – 5Acquisition of Speke Unit Trust 21 (90) –Tesco property swap 21 (93) –Cash acquired on acquisition of Hercules Unit Trust – 18Acquisition of units in Hercules Unit Trust (93) (145)Purchase of joint ventures and funds – (113)Sale of joint ventures and funds – 179Investment in and loans to joint ventures and funds (173) (162)Capital distributions and loan repayments from joint ventures and funds 134 28Indirect taxes paid in respect of investing activities – (2)Net cash outflow from investing activities (204) (660)
Cash flows from financing activitiesIssue of ordinary shares 12 11Dividends paid 20 (228) (159)Dividends paid by subsidiaries (19) –Closeout of interest rate derivatives (12) (16)Movement in other financial liabilities 10 (8)Decrease in bank and other borrowings (581) (49)Drawdowns on bank and other borrowings 703 669Net cash (outflow) inflow from financing activities (115) 448
Net (decrease) increase in cash and cash equivalents (34) 7Cash and cash equivalents at 1 April 142 135Cash and cash equivalents at 31 March 108 142
Cash and cash equivalents consists of:Cash and short-term deposits 18 108 142
127British Land Annual Report and Accounts 2015
CONSOLIDATED STATEMENT OF CASH FLOWSFOR THE YEAR ENDED 31 MARCH 2015
Share capital1
£m
Share premium
£m
Hedging and
translation reserve1,2
£m
Revaluation reserve1
£m
Merger reserve1
£m
Retained earnings
£mTotal
£m
Non-controlling
interest £m
Total equity
£m
Balance at 1 April 2014 255 1,257 (32) (38) 213 5,091 6,746 371 7,117 Profit for the year after taxation – – – – – 1,710 1,710 55 1,765Losses on cash flow hedges – – (69) – – – (69) (2) (71)Revaluation of owner-occupied property – – – 10 – – 10 – 10 Joint ventures and funds revaluations – – – 3 – – 3 – 3Reclassification of items from the statement of comprehensive income – – – 30 – – 30 – 30Reclassification of (losses) gains on cash flow hedges
– Foreign currency derivatives – – (11) – – – (11) – (11)– Interest rate derivatives – – 8 – – – 8 – 8
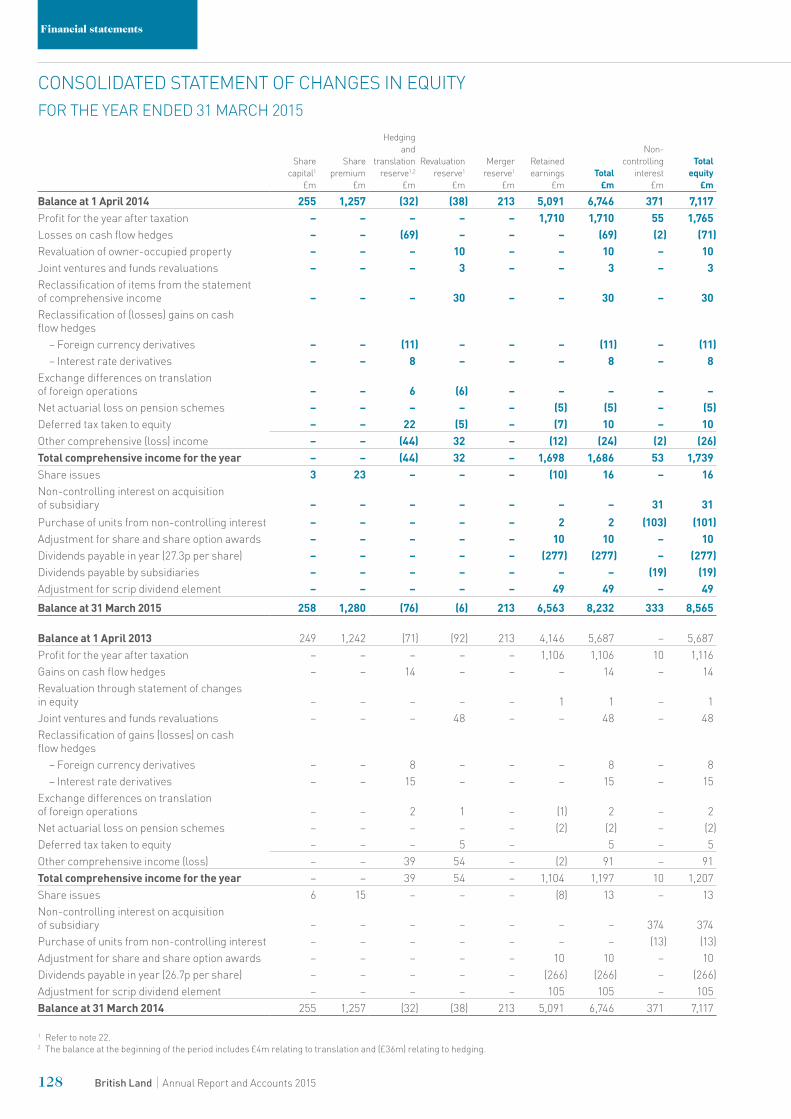
Exchange differences on translation of foreign operations – – 6 (6) – – – – –Net actuarial loss on pension schemes – – – – – (5) (5) – (5) Deferred tax taken to equity – – 22 (5) – (7) 10 – 10Other comprehensive (loss) income – – (44) 32 – (12) (24) (2) (26)Total comprehensive income for the year – – (44) 32 – 1,698 1,686 53 1,739 Share issues 3 23 – – – (10) 16 – 16 Non-controlling interest on acquisition of subsidiary – – – – – – – 31 31 Purchase of units from non-controlling interest – – – – – 2 2 (103) (101)Adjustment for share and share option awards – – – – – 10 10 – 10 Dividends payable in year (27.3p per share) – – – – – (277) (277) – (277)Dividends payable by subsidiaries – – – – – – – (19) (19)Adjustment for scrip dividend element – – – – – 49 49 – 49 Balance at 31 March 2015 258 1,280 (76) (6) 213 6,563 8,232 333 8,565
Balance at 1 April 2013 249 1,242 (71) (92) 213 4,146 5,687 – 5,687Profit for the year after taxation – – – – – 1,106 1,106 10 1,116Gains on cash flow hedges – – 14 – – – 14 – 14Revaluation through statement of changes in equity – – – – – 1 1 – 1Joint ventures and funds revaluations – – – 48 – – 48 – 48Reclassification of gains (losses) on cash flow hedges
– Foreign currency derivatives – – 8 – – – 8 – 8 – Interest rate derivatives – – 15 – – – 15 – 15
Exchange differences on translation of foreign operations – – 2 1 – (1) 2 – 2 Net actuarial loss on pension schemes – – – – – (2) (2) – (2)Deferred tax taken to equity – – – 5 – 5 – 5 Other comprehensive income (loss) – – 39 54 – (2) 91 – 91 Total comprehensive income for the year – – 39 54 – 1,104 1,197 10 1,207 Share issues 6 15 – – – (8) 13 – 13 Non-controlling interest on acquisition of subsidiary – – – – – – – 374 374 Purchase of units from non-controlling interest – – – – – – – (13) (13)Adjustment for share and share option awards – – – – – 10 10 – 10 Dividends payable in year (26.7p per share) – – – – – (266) (266) – (266)Adjustment for scrip dividend element – – – – – 105 105 – 105 Balance at 31 March 2014 255 1,257 (32) (38) 213 5,091 6,746 371 7,117
1 Refer to note 22.2 The balance at the beginning of the period includes £4m relating to translation and (£36m) relating to hedging.
128 British Land Annual Report and Accounts 2015
Financial statements
CONSOLIDATED STATEMENT OF CHANGES IN EQUITYFOR THE YEAR ENDED 31 MARCH 2015
1 Basis of preparation, significant accounting policies and accounting judgements
The financial statements for the year ended 31 March 2015 have been prepared on the historical cost basis, except for the revaluation of properties, investments held for trading and derivatives. The financial statements have also been prepared in accordance with International Financial Reporting Standards (IFRSs) as adopted by the European Union and therefore comply with article 4 of the EU IAS regulation.
In the current financial year the Group has adopted IFRS 10 ‘Consolidated financial statements’, IFRS 11 ‘Joint arrangements’, IFRS 12 ‘Disclosures of interests in other entities’ and amendments to IAS 32 ‘Financial Instruments: Presentation’, IAS 36 ‘Impairment of assets’ and IAS 39 ‘Financial Instruments: Recognition and measurement’.
The Group undertook an assessment of the treatment of its subsidiaries, joint ventures and interests in other entities prior to the adoption of IFRS 10, 11 and 12 and concluded that no changes in relation to the presentation of these interests was required.
The adoption of these standards has not had a material impact on the Group and otherwise the accounting policies used are consistent with those contained in the Group’s last Annual Report and accounts for the year ended 31 March 2014.
Standards and interpretations issued but not effective for the current accounting period were:
– IAS 19 (amended) – Employee benefits – Annual Improvements to IFRSs 2010-2012 cycle – Annual Improvements to IFRSs 2011-2013 cycle – IAS 16 (amended) – Property, plant and equipment – IAS 38 (amended) – Intangible assets – IAS 27 (amended) – Separate financial statements – IFRS 10 (amended) – Consolidated financial statements – IFRS 11 (amended) – Joint arrangements – IFRS 14 – Regulatory deferral accounts – Annual Improvements to IFRSs 2012-2014 cycle – IFRS 15 – Revenue from contracts with customers; – IFRS 9 – Financial Instruments.
The Directors do not expect that the adoption of the standards listed above will have a material impact on the financial statements of the Group in future periods except as follows.
– IFRS 9 will impact both the measurement and disclosures of financial instruments and is effective for the Group’s year ending 31 March 2019. The Group has not yet completed its evaluation of the effect of the adoption.
– IFRS 15 does not apply to gross rental income, but does apply to service charge income, other fees and trading property disposals and is effective for the Group’s year ending 31 March 2019. The Group does not expect adoption of IFRS 15 to have a material impact on the measurement of revenue recognition, but additional disclosures will be required with regards to the above sources of income.
Going concernThe financial statements are prepared on a going concern basis as explained in the corporate governance section on page 76. Subsidiaries, joint ventures and associates (including funds)The consolidated accounts include the accounts of the British Land Company PLC and all subsidiaries (entities controlled by British Land). Control is assumed where British Land has the power and
the ability to affect the financial and operating policies of an investee entity so as to gain benefits from its activities.
The results of subsidiaries, joint ventures or associates acquired or disposed of during the year are included from the effective date of acquisition or up to the effective date of disposal. Accounting practices of subsidiaries, joint ventures or associates which differ from Group accounting policies are adjusted on consolidation.
Business combinations are accounted for under the acquisition method. Any excess of the purchase price of business combinations over the fair value of the assets, liabilities and contingent liabilities acquired and resulting deferred tax thereon is recognised as goodwill. Any discount received is credited to the income statement in the period of acquisition.
All intra-Group transactions, balances, income and expenses are eliminated on consolidation.
Joint ventures and associates, including funds, are accounted for under the equity method, whereby the consolidated balance sheet incorporates the Group’s share (investor’s share) of the net assets of its joint ventures and associates. The consolidated income statement incorporates the Group’s share of joint venture and associate profits after tax, upon elimination of upstream and downstream transactions. Their profits include revaluation movements on investment properties. Interest income, management fees and performance fees are proportionately eliminated. PropertiesProperties are externally valued on the basis of fair value at the balance sheet date. Investment and owner-occupied properties are recorded at valuation whereas trading properties are stated at the lower of cost and net realisable value.
Any surplus or deficit arising on revaluing investment properties is recognised in the income statement.
Any surplus arising on revaluing owner-occupied properties above cost is recognised in equity, and any deficit arising in revaluation below cost for owner-occupied and trading properties is recognised in the income statement.
The cost of properties in the course of development includes attributable interest and other associated outgoings. Interest is calculated on the development expenditure by reference to specific borrowings, where relevant, and otherwise on the average rate applicable to short-term loans. Interest is not capitalised where no development activity is taking place. A property ceases to be treated as a development property on practical completion.
Disposals are recognised on completion: Profits and losses arising are recognised through the income statement. The profit on disposal is determined as the difference between the net sales proceeds and the carrying amount of the asset at the commencement of the accounting period plus capital expenditure in the period.
Where properties held for investment are appropriated to trading stock, they are transferred at market value. If properties held for trading are appropriated to investment, they are transferred at book value. In determining whether leases and related properties represent operating or finance leases, consideration is given to whether the tenant or landlord bears the risks and rewards of ownership. Financial assets and liabilitiesTrade debtors and creditors are initially recognised at fair value and subsequently measured at amortised cost and discounted as appropriate.
129British Land Annual Report and Accounts 2015
NOTES TO THE ACCOUNTS
Financial assets and liabilities continuedOther investments include loans and receivables held at amortised cost and investments held for trading classified as fair value through profit or loss. Amortised cost of loans and receivables is measured using the effective interest method, less any impairment. Interest is recognised by applying the effective interest rate. Investments held for trading are initially recorded at fair value and are subsequently externally valued on the same basis at the balance sheet date. Any surplus or deficit arising on revaluing investments held for trading is recognised in the income statement.
Where an investment property is held under a head lease, the head lease is initially recognised as an asset as the sum of the premium paid on acquisition and the present value of minimum ground rent payments. The corresponding rent liability to the head leaseholder is included in the balance sheet as a finance lease obligation.
Debt instruments are stated at their net proceeds on issue. Finance charges including premiums payable on settlement or redemption and direct issue costs are spread over the period to redemption, using the effective interest method.
Convertible bonds are designated as fair value through profit or loss and so are presented on the balance sheet at fair value with all gains and losses, including the write-off of issuance costs, recognised in the income statement within the capital and other component of net financing costs. The interest charge in respect of the coupon rate on the bonds has been recognised within the underlying component of net financing costs on an accruals basis.
As defined by IAS39, cash flow and fair value hedges are carried at fair value on the balance sheet. Changes in the fair value of derivatives that are designated and qualify as effective cash flow hedges are recognised directly in the hedging reserve. Changes in the fair value of derivatives that are designated and qualify as effective fair value hedges are recorded in the income statement, along with any changes in the fair value of the hedged item that is attributable to the hedged risk. Any ineffective portion of all derivatives is recognised in the income statement.
Cash equivalents are limited to instruments with a maturity of less than three months.
Net rental incomeRental income is recognised on an accruals basis. A rent adjustment based on open market estimated rental value is recognised from the rent review date in relation to unsettled rent reviews. Where a rent-free period is included in a lease, the rental income foregone is allocated evenly over the period from the date of lease commencement to the earliest termination date.
Rental income from fixed and minimum guaranteed rent reviews is recognised on a straight-line basis to the earliest termination date. Where such rental income is recognised ahead of the related cash flow, an adjustment is made to ensure that the carrying value of the related property including the accrued rent does not exceed the external valuation.
Initial direct costs incurred in negotiating and arranging a new lease are amortised on a straight-line basis over the period from the date of lease commencement to the earliest termination date.
Where a lease incentive payment, including surrender premia paid, does not enhance the value of a property, it is amortised on a straight-line basis over the period from the date of lease commencement to the earliest termination date. Upon receipt of a surrender premium for the early determination of a lease, the profit, net of dilapidations and non-recoverable outgoings relating to the lease concerned, is immediately reflected in income.
Management and performance feesManagement and performance fees receivable are recognised in the period to which they relate. Performance fees are recognised at the end of the performance period when the fee amount can be estimated reliably and it is virtually certain that the fee will be received. Management and performance fees receivable from joint ventures and funds are proportionately eliminated. Performance fees are discounted for any element subject to subsequent clawback, on a case-by-case basis. TaxationCurrent tax is based on taxable profit for the year and is calculated using tax rates that have been enacted or substantively enacted. At the balance sheet date, taxable profit differs from net profit as reported in the income statement because it excludes items of income or expense that are not taxable (or tax deductible).
Deferred tax is provided on items that may become taxable at a later date, on the difference between the balance sheet value and tax base value, on an undiscounted basis. On business combinations, the deferred tax effect of fair value adjustments is incorporated in the consolidated balance sheet. Employee costsThe fair value of equity-settled share-based payments to employees is determined at the date of grant and is expensed on a straight-line basis over the vesting period, based on the Group’s estimate of shares or options that will eventually vest. In the case of options granted, fair value is measured by a Black-Scholes pricing model. Compensation linked to performance fees accrued by the Group is amortised over the vesting period.
Defined benefit pension scheme assets are measured using fair values; pension scheme liabilities are measured using the projected unit credit method and discounted at the rate of return of a high-quality corporate bond of equivalent term to the scheme liabilities. The net surplus (where recoverable by the Group) or deficit is recognised in full in the consolidated balance sheet. Any asset resulting from the calculation is limited to past service costs plus the present value of available refunds and reductions in future contributions to the plan.
The current service cost and gains and losses on settlement and curtailments are charged to operating profit. Past service costs are recognised in the income statement if the benefits have vested or, if they have not vested, are amortised on a straight-line basis over the period until vesting occurs. Actuarial gains and losses are recognised in full in the period in which they occur and are presented in the consolidated statement of comprehensive income.
Contributions to the Group’s defined contribution schemes are expensed on the basis of the contracted annual contribution.
Accounting judgements and estimatesIn applying the Group’s accounting policies, the Directors are required to make judgements and estimates that affect the financial statements.
Significant areas of estimation are:
Valuation of properties and investments held for trading: The Group uses external professional valuers to determine the relevant amounts. The primary source of evidence for property valuations should be recent, comparable market transactions on an arms-length basis. However, the valuation of the Group’s property portfolio and investments held for trading are inherently subjective, as they are made on the basis of assumptions made by the valuers which may not prove to be accurate.
Other less significant areas of estimation include the valuation of fixed rate debt and interest rate derivatives, the determination
130 British Land Annual Report and Accounts 2015
NOTES TO THE ACCOUNTS CONTINUED
Financial statements
of share-based payment expense, and the actuarial assumptions used in calculating the Group’s retirement benefit obligations.
The key areas of accounting judgement are:
REIT status: British Land is a Real Estate Investment Trust (REIT) and does not pay tax on its property income or gains on property sales, provided that at least 90% of the Group’s property income is distributed as a dividend to shareholders, which becomes taxable in their hands. In addition, the Group has to meet certain conditions such as ensuring the property rental business represents more than 75% of total profits and assets. Any potential or proposed changes to the REIT legislation are monitored and discussed with HMRC. It is Management’s intention that the Group will continue as a REIT for the foreseeable future.
Accounting for joint ventures and funds: In accordance with IFRS 10 ‘Consolidated financial statements’, IFRS 11 ‘Joint arrangements’, and IFRS 12 ‘Disclosures of interests in other entities’ an assessment is required to determine the degree of control or influence the Group exercises and the form of any control to ensure that the financial statement treatment is appropriate.
Interest in the Group’s joint ventures is commonly driven by the terms of the partnership agreements which ensure that control is shared between the partners. These are accounted for under the equity method, whereby the consolidated balance sheet incorporates the Group’s share of the net assets of its joint ventures and associates. The consolidated income statement incorporates the Group’s share of joint venture and associate profits after tax upon elimination of upstream transactions.
Accounting for transactions: Property transactions are complex in nature and can be material to the financial statements. Assessment is required to determine the most appropriate accounting treatment of assets acquired and of potential contractual arrangements in the legal documents for both acquisitions and disposals. Management consider each transaction separately and, when considered appropriate, seek independent accounting advice. Examples of such transactions completed in the year include the acquisition of Speke Unit Trust, Tesco BL Holdings Limited and TBL Property Partnership which were accounted for as business combinations (see note 21).
131British Land Annual Report and Accounts 2015
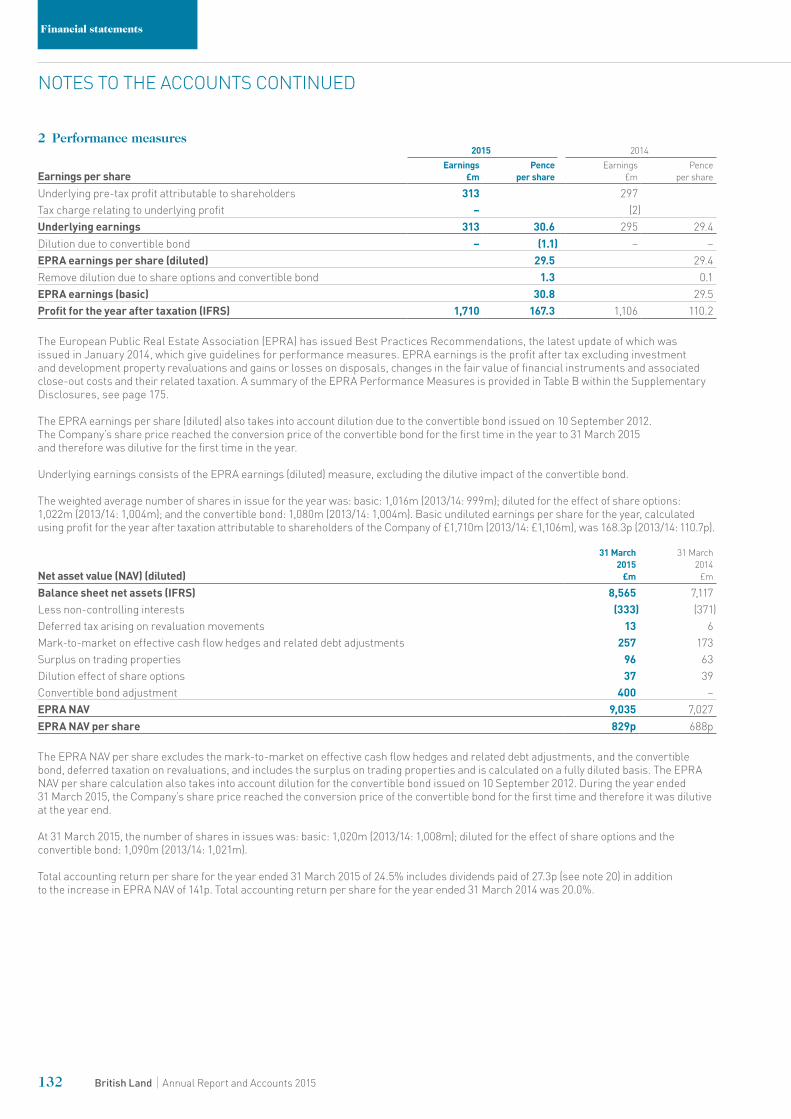
2 Performance measures2015 2014
Earnings per shareEarnings
£mPence
per shareEarnings
£mPence
per share
Underlying pre-tax profit attributable to shareholders 313 297Tax charge relating to underlying profit – (2)Underlying earnings 313 30.6 295 29.4Dilution due to convertible bond – (1.1) – –EPRA earnings per share (diluted) 29.5 29.4 Remove dilution due to share options and convertible bond 1.3 0.1EPRA earnings (basic) 30.8 29.5 Profit for the year after taxation (IFRS) 1,710 167.3 1,106 110.2
The European Public Real Estate Association (EPRA) has issued Best Practices Recommendations, the latest update of which was issued in January 2014, which give guidelines for performance measures. EPRA earnings is the profit after tax excluding investment and development property revaluations and gains or losses on disposals, changes in the fair value of financial instruments and associated close-out costs and their related taxation. A summary of the EPRA Performance Measures is provided in Table B within the Supplementary Disclosures, see page 175.
The EPRA earnings per share (diluted) also takes into account dilution due to the convertible bond issued on 10 September 2012. The Company’s share price reached the conversion price of the convertible bond for the first time in the year to 31 March 2015 and therefore was dilutive for the first time in the year. Underlying earnings consists of the EPRA earnings (diluted) measure, excluding the dilutive impact of the convertible bond.
The weighted average number of shares in issue for the year was: basic: 1,016m (2013/14: 999m); diluted for the effect of share options: 1,022m (2013/14: 1,004m); and the convertible bond: 1,080m (2013/14: 1,004m). Basic undiluted earnings per share for the year, calculated using profit for the year after taxation attributable to shareholders of the Company of £1,710m (2013/14: £1,106m), was 168.3p (2013/14: 110.7p).
Net asset value (NAV) (diluted)
31 March 2015
£m
31 March 2014
£m
Balance sheet net assets (IFRS) 8,565 7,117Less non-controlling interests (333) (371)Deferred tax arising on revaluation movements 13 6Mark-to-market on effective cash flow hedges and related debt adjustments 257 173Surplus on trading properties 96 63Dilution effect of share options 37 39Convertible bond adjustment 400 –EPRA NAV 9,035 7,027 EPRA NAV per share 829p 688p
The EPRA NAV per share excludes the mark-to-market on effective cash flow hedges and related debt adjustments, and the convertible bond, deferred taxation on revaluations, and includes the surplus on trading properties and is calculated on a fully diluted basis. The EPRA NAV per share calculation also takes into account dilution for the convertible bond issued on 10 September 2012. During the year ended 31 March 2015, the Company’s share price reached the conversion price of the convertible bond for the first time and therefore it was dilutive at the year end.
At 31 March 2015, the number of shares in issues was: basic: 1,020m (2013/14: 1,008m); diluted for the effect of share options and the convertible bond: 1,090m (2013/14: 1,021m).
Total accounting return per share for the year ended 31 March 2015 of 24.5% includes dividends paid of 27.3p (see note 20) in addition to the increase in EPRA NAV of 141p. Total accounting return per share for the year ended 31 March 2014 was 20.0%.
132 British Land Annual Report and Accounts 2015
NOTES TO THE ACCOUNTS CONTINUED
Financial statements
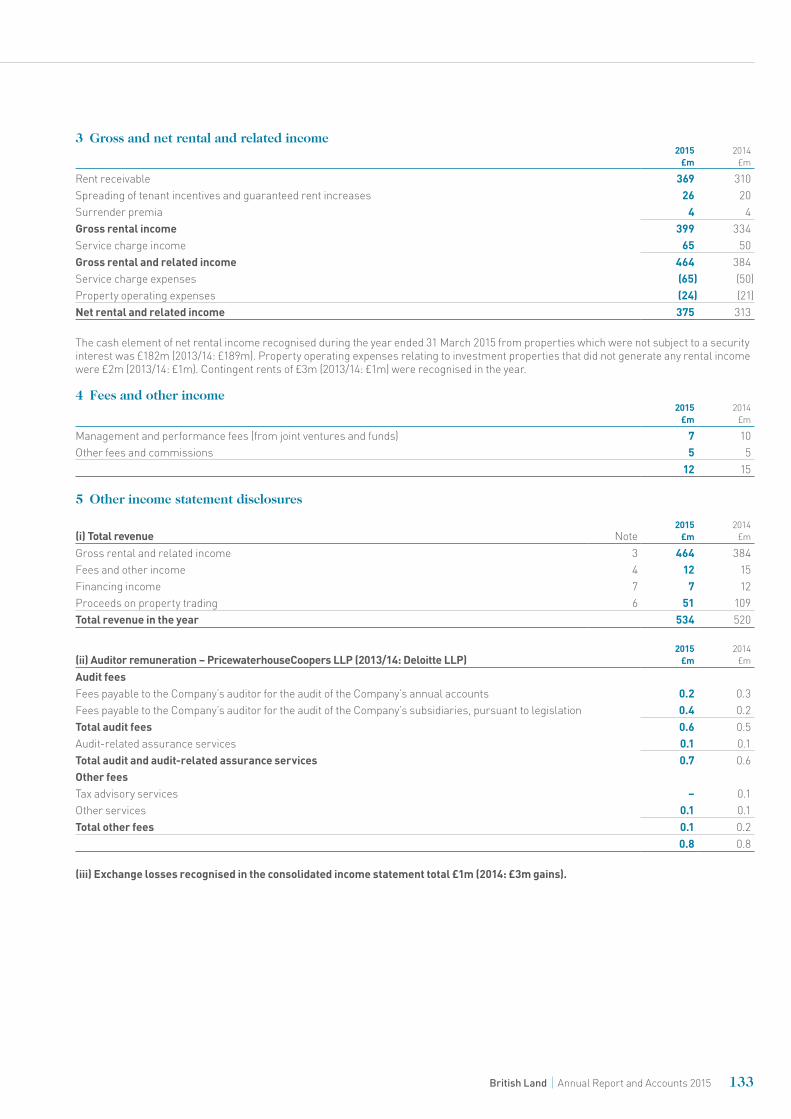
3 Gross and net rental and related income2015
£m2014
£m
Rent receivable 369 310Spreading of tenant incentives and guaranteed rent increases 26 20Surrender premia 4 4Gross rental income 399 334Service charge income 65 50Gross rental and related income 464 384Service charge expenses (65) (50)Property operating expenses (24) (21)Net rental and related income 375 313
The cash element of net rental income recognised during the year ended 31 March 2015 from properties which were not subject to a security interest was £182m (2013/14: £189m). Property operating expenses relating to investment properties that did not generate any rental income were £2m (2013/14: £1m). Contingent rents of £3m (2013/14: £1m) were recognised in the year.
4 Fees and other income2015
£m2014
£m
Management and performance fees (from joint ventures and funds) 7 10Other fees and commissions 5 5
12 15
5 Other income statement disclosures
(i) Total revenue Note2015
£m2014
£m
Gross rental and related income 3 464 384Fees and other income 4 12 15Financing income 7 7 12Proceeds on property trading 6 51 109Total revenue in the year 534 520
(ii) Auditor remuneration – PricewaterhouseCoopers LLP (2013/14: Deloitte LLP)2015
£m2014
£m
Audit feesFees payable to the Company’s auditor for the audit of the Company’s annual accounts 0.2 0.3Fees payable to the Company’s auditor for the audit of the Company’s subsidiaries, pursuant to legislation 0.4 0.2Total audit fees 0.6 0.5Audit-related assurance services 0.1 0.1Total audit and audit-related assurance services 0.7 0.6Other feesTax advisory services – 0.1Other services 0.1 0.1Total other fees 0.1 0.2
0.8 0.8
(iii) Exchange losses recognised in the consolidated income statement total £1m (2014: £3m gains).
133British Land Annual Report and Accounts 2015

6 Net revaluation gains on property and investments2015
£m2014
£m
Consolidated income statementRevaluation of properties 884 580 Result on property and investment disposals (excluding trading property disposals) 20 17 Result on trading property disposals (see below) 6 14 Revaluation of investments – 4
910 615 Valuation movements of joint ventures and funds accounted for using the equity method 595 258
1,505 873 Consolidated statement of comprehensive incomeRevaluation of owner occupied properties 10 – Total comprehensive income 1,515 873
Result on trading property disposalsSale proceeds 51 109Cost of sales (45) (95)Result on trading property disposals 6 14
7 Net financing costs2015
£m2014
£m
Interest payable on:Bank loans and overdrafts 36 29 Other loans 88 77 Obligations under finance leases 2 1
126 107 Development interest capitalised (14) (17)
112 90 Interest receivable on:Deposits, securities and liquid investments (2) (3)Loans to joint ventures (5) (6)
(7) (9)Net financing costs – underlying 105 81 Capital and other:Valuation movements on translation of foreign currency debt 11 (9)Hedging reserve recycling (11) 9 Valuation movements on fair value debt 104 (62)Valuation movements on fair value derivatives (108) 62 Net capital movement on convertible bond 35 50 Recycling of fair value movement on close-out of derivatives 12 10 Capital financing costs 2 – Valuation movement on translation of foreign currency net assets 1 (3)Fair value movement on non-hedge accounted derivatives 1 – Net financing costs – capital 47 57Net financing costs 152 138
Total financing income (7) (12)Total financing charges 159 150Net financing costs 152 138
Interest payable on unsecured bank loans and related interest rate derivatives was £24m (2013/14: £27m). Interest on development expenditure is capitalised at the Group’s weighted average interest rate of 3.3% (2013/14: 3.8%). The weighted average interest rate on a proportionally consolidated basis at 31 March 2015 was 3.8% (2013/14: 4.1%).
134 British Land Annual Report and Accounts 2015
NOTES TO THE ACCOUNTS CONTINUED
Financial statements
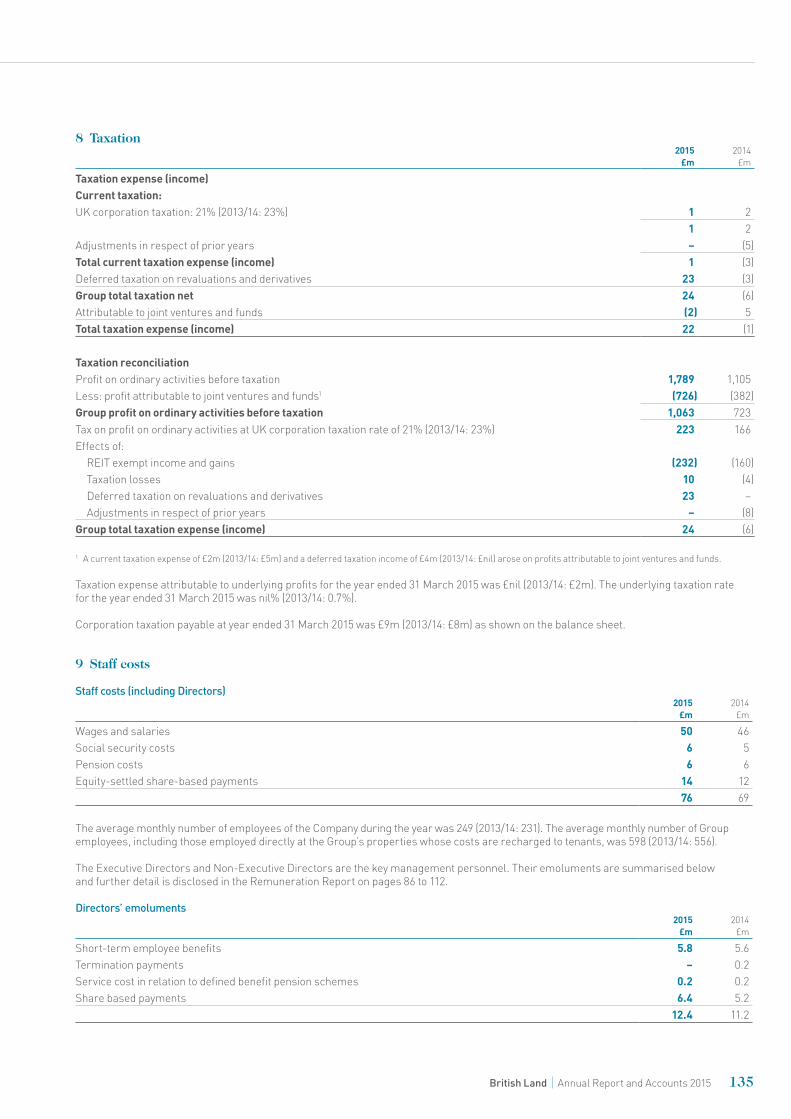
8 Taxation2015
£m2014
£m
Taxation expense (income)Current taxation:UK corporation taxation: 21% (2013/14: 23%) 1 2 1 2Adjustments in respect of prior years – (5)Total current taxation expense (income) 1 (3)Deferred taxation on revaluations and derivatives 23 (3)Group total taxation net 24 (6)Attributable to joint ventures and funds (2) 5Total taxation expense (income) 22 (1)
Taxation reconciliationProfit on ordinary activities before taxation 1,789 1,105Less: profit attributable to joint ventures and funds1 (726) (382)Group profit on ordinary activities before taxation 1,063 723Tax on profit on ordinary activities at UK corporation taxation rate of 21% (2013/14: 23%) 223 166Effects of:
REIT exempt income and gains (232) (160)Taxation losses 10 (4)Deferred taxation on revaluations and derivatives 23 –Adjustments in respect of prior years – (8)
Group total taxation expense (income) 24 (6)
1 A current taxation expense of £2m (2013/14: £5m) and a deferred taxation income of £4m (2013/14: £nil) arose on profits attributable to joint ventures and funds.
Taxation expense attributable to underlying profits for the year ended 31 March 2015 was £nil (2013/14: £2m). The underlying taxation rate for the year ended 31 March 2015 was nil% (2013/14: 0.7%).
Corporation taxation payable at year ended 31 March 2015 was £9m (2013/14: £8m) as shown on the balance sheet.
9 Staff costs
Staff costs (including Directors)2015
£m2014
£m
Wages and salaries 50 46Social security costs 6 5Pension costs 6 6Equity-settled share-based payments 14 12
76 69
The average monthly number of employees of the Company during the year was 249 (2013/14: 231). The average monthly number of Group employees, including those employed directly at the Group’s properties whose costs are recharged to tenants, was 598 (2013/14: 556).
The Executive Directors and Non-Executive Directors are the key management personnel. Their emoluments are summarised below and further detail is disclosed in the Remuneration Report on pages 86 to 112.
Directors’ emoluments2015
£m2014
£m
Short-term employee benefits 5.8 5.6Termination payments – 0.2Service cost in relation to defined benefit pension schemes 0.2 0.2Share based payments 6.4 5.2
12.4 11.2
135British Land Annual Report and Accounts 2015
9 Staff costs continued
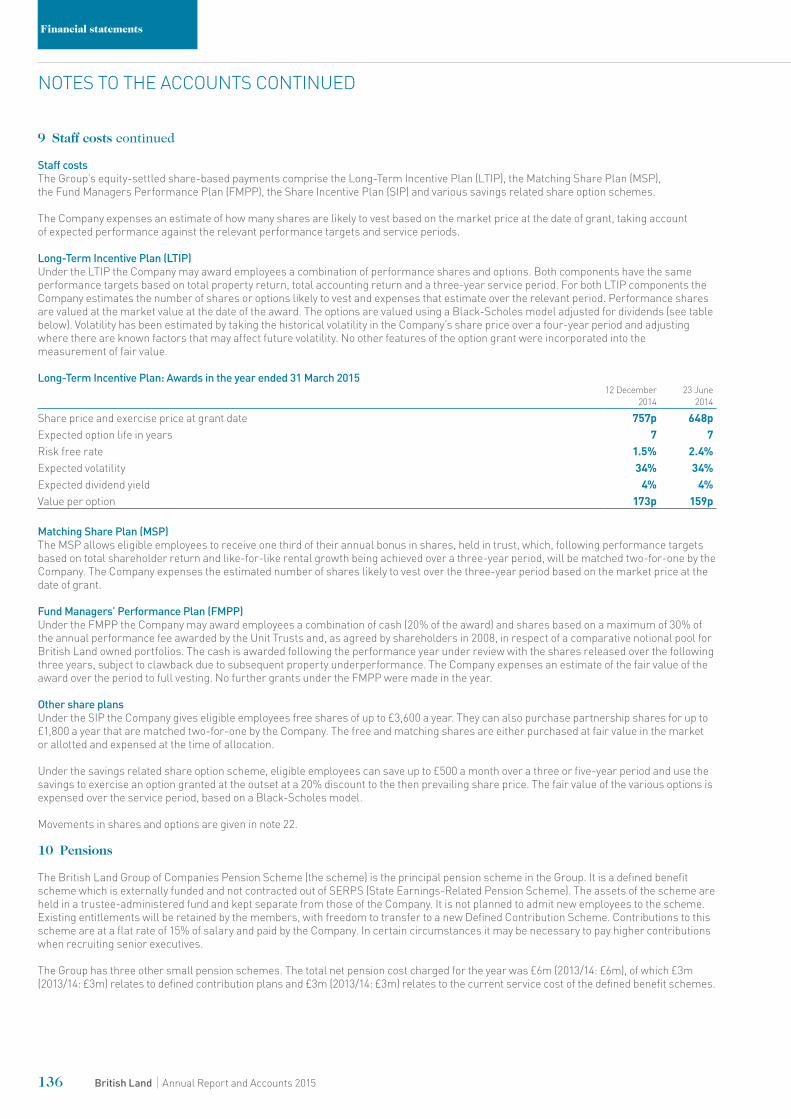
Staff costsThe Group’s equity-settled share-based payments comprise the Long-Term Incentive Plan (LTIP), the Matching Share Plan (MSP), the Fund Managers Performance Plan (FMPP), the Share Incentive Plan (SIP) and various savings related share option schemes.
The Company expenses an estimate of how many shares are likely to vest based on the market price at the date of grant, taking account of expected performance against the relevant performance targets and service periods.
Long-Term Incentive Plan (LTIP)Under the LTIP the Company may award employees a combination of performance shares and options. Both components have the same performance targets based on total property return, total accounting return and a three-year service period. For both LTIP components the Company estimates the number of shares or options likely to vest and expenses that estimate over the relevant period. Performance shares are valued at the market value at the date of the award. The options are valued using a Black-Scholes model adjusted for dividends (see table below). Volatility has been estimated by taking the historical volatility in the Company’s share price over a four-year period and adjusting where there are known factors that may affect future volatility. No other features of the option grant were incorporated into the measurement of fair value.
Long-Term Incentive Plan: Awards in the year ended 31 March 201512 December
201423 June
2014
Share price and exercise price at grant date 757p 648pExpected option life in years 7 7Risk free rate 1.5% 2.4%Expected volatility 34% 34%Expected dividend yield 4% 4%Value per option 173p 159p
Matching Share Plan (MSP)The MSP allows eligible employees to receive one third of their annual bonus in shares, held in trust, which, following performance targets based on total shareholder return and like-for-like rental growth being achieved over a three-year period, will be matched two-for-one by the Company. The Company expenses the estimated number of shares likely to vest over the three-year period based on the market price at the date of grant.
Fund Managers’ Performance Plan (FMPP)Under the FMPP the Company may award employees a combination of cash (20% of the award) and shares based on a maximum of 30% of the annual performance fee awarded by the Unit Trusts and, as agreed by shareholders in 2008, in respect of a comparative notional pool for British Land owned portfolios. The cash is awarded following the performance year under review with the shares released over the following three years, subject to clawback due to subsequent property underperformance. The Company expenses an estimate of the fair value of the award over the period to full vesting. No further grants under the FMPP were made in the year.
Other share plansUnder the SIP the Company gives eligible employees free shares of up to £3,600 a year. They can also purchase partnership shares for up to £1,800 a year that are matched two-for-one by the Company. The free and matching shares are either purchased at fair value in the market or allotted and expensed at the time of allocation.
Under the savings related share option scheme, eligible employees can save up to £500 a month over a three or five-year period and use the savings to exercise an option granted at the outset at a 20% discount to the then prevailing share price. The fair value of the various options is expensed over the service period, based on a Black-Scholes model.
Movements in shares and options are given in note 22.
10 Pensions
The British Land Group of Companies Pension Scheme (the scheme) is the principal pension scheme in the Group. It is a defined benefit scheme which is externally funded and not contracted out of SERPS (State Earnings-Related Pension Scheme). The assets of the scheme are held in a trustee-administered fund and kept separate from those of the Company. It is not planned to admit new employees to the scheme. Existing entitlements will be retained by the members, with freedom to transfer to a new Defined Contribution Scheme. Contributions to this scheme are at a flat rate of 15% of salary and paid by the Company. In certain circumstances it may be necessary to pay higher contributions when recruiting senior executives.
The Group has three other small pension schemes. The total net pension cost charged for the year was £6m (2013/14: £6m), of which £3m (2013/14: £3m) relates to defined contribution plans and £3m (2013/14: £3m) relates to the current service cost of the defined benefit schemes.
136 British Land Annual Report and Accounts 2015
NOTES TO THE ACCOUNTS CONTINUED
Financial statements
10 Pensions continued
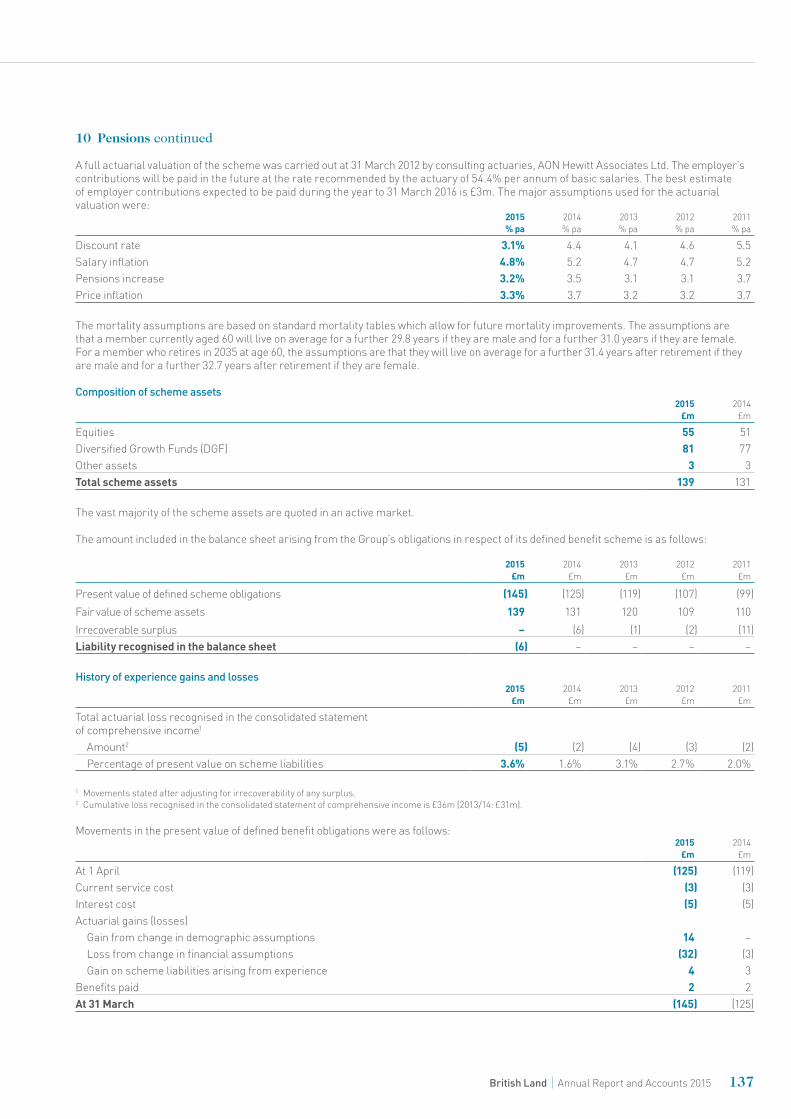
A full actuarial valuation of the scheme was carried out at 31 March 2012 by consulting actuaries, AON Hewitt Associates Ltd. The employer’s contributions will be paid in the future at the rate recommended by the actuary of 54.4% per annum of basic salaries. The best estimate of employer contributions expected to be paid during the year to 31 March 2016 is £3m. The major assumptions used for the actuarial valuation were:
2015 % pa
2014 % pa
2013 % pa
2012 % pa
2011 % pa
Discount rate 3.1% 4.4 4.1 4.6 5.5Salary inflation 4.8% 5.2 4.7 4.7 5.2Pensions increase 3.2% 3.5 3.1 3.1 3.7Price inflation 3.3% 3.7 3.2 3.2 3.7
The mortality assumptions are based on standard mortality tables which allow for future mortality improvements. The assumptions are that a member currently aged 60 will live on average for a further 29.8 years if they are male and for a further 31.0 years if they are female. For a member who retires in 2035 at age 60, the assumptions are that they will live on average for a further 31.4 years after retirement if they are male and for a further 32.7 years after retirement if they are female.
Composition of scheme assets2015
£m2014
£m
Equities 55 51Diversified Growth Funds (DGF) 81 77Other assets 3 3Total scheme assets 139 131
The vast majority of the scheme assets are quoted in an active market.
The amount included in the balance sheet arising from the Group’s obligations in respect of its defined benefit scheme is as follows:
2015 £m
2014 £m
2013 £m
2012 £m
2011 £m
Present value of defined scheme obligations (145) (125) (119) (107) (99)Fair value of scheme assets 139 131 120 109 110Irrecoverable surplus – (6) (1) (2) (11)Liability recognised in the balance sheet (6) – – – –
History of experience gains and losses2015
£m2014
£m2013
£m2012
£m2011
£m
Total actuarial loss recognised in the consolidated statement of comprehensive income1
Amount2 (5) (2) (4) (3) (2)Percentage of present value on scheme liabilities 3.6% 1.6% 3.1% 2.7% 2.0%
1 Movements stated after adjusting for irrecoverability of any surplus.2 Cumulative loss recognised in the consolidated statement of comprehensive income is £36m (2013/14: £31m).
Movements in the present value of defined benefit obligations were as follows:2015
£m2014
£m
At 1 April (125) (119)Current service cost (3) (3)Interest cost (5) (5)Actuarial gains (losses)
Gain from change in demographic assumptions 14 –Loss from change in financial assumptions (32) (3)Gain on scheme liabilities arising from experience 4 3
Benefits paid 2 2At 31 March (145) (125)
137British Land Annual Report and Accounts 2015
10 Pensions continued
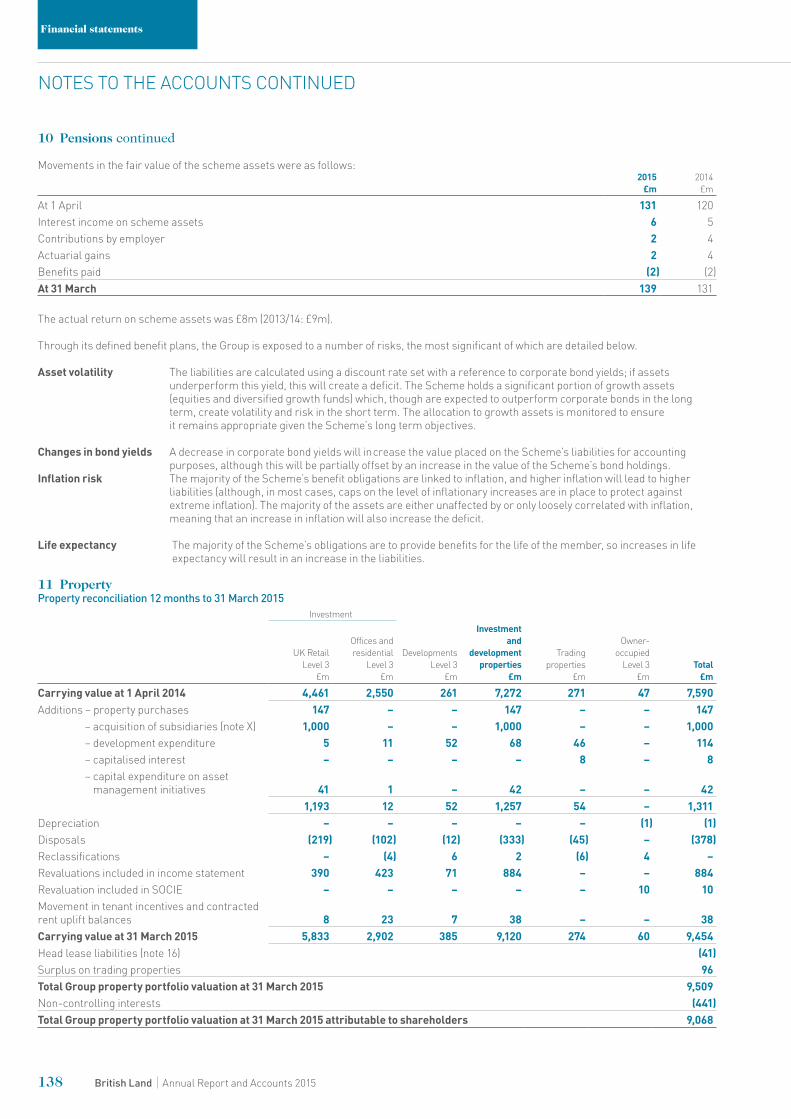
Movements in the fair value of the scheme assets were as follows:2015
£m2014
£m
At 1 April 131 120Interest income on scheme assets 6 5Contributions by employer 2 4Actuarial gains 2 4Benefits paid (2) (2)At 31 March 139 131
The actual return on scheme assets was £8m (2013/14: £9m).
Through its defined benefit plans, the Group is exposed to a number of risks, the most significant of which are detailed below.
Asset volatility The liabilities are calculated using a discount rate set with a reference to corporate bond yields; if assets underperform this yield, this will create a deficit. The Scheme holds a significant portion of growth assets (equities and diversified growth funds) which, though are expected to outperform corporate bonds in the long term, create volatility and risk in the short term. The allocation to growth assets is monitored to ensure it remains appropriate given the Scheme’s long term objectives.
Changes in bond yields A decrease in corporate bond yields will in crease the value placed on the Scheme’s liabilities for accounting purposes, although this will be partially offset by an increase in the value of the Scheme’s bond holdings.
Inflation risk The majority of the Scheme’s benefit obligations are linked to inflation, and higher inflation will lead to higher liabilities (although, in most cases, caps on the level of inflationary increases are in place to protect against extreme inflation). The majority of the assets are either unaffected by or only loosely correlated with inflation, meaning that an increase in inflation will also increase the deficit.
Life expectancy The majority of the Scheme’s obligations are to provide benefits for the life of the member, so increases in life expectancy will result in an increase in the liabilities.
11 PropertyProperty reconciliation 12 months to 31 March 2015
Investment
UK Retail Level 3
£m
Offices and residential
Level 3 £m
Developments Level 3
£m
Investment and
development properties
£m
Trading properties
£m
Owner-occupied
Level 3 £m
Total £m
Carrying value at 1 April 2014 4,461 2,550 261 7,272 271 47 7,590Additions – property purchases 147 – – 147 – – 147
– acquisition of subsidiaries (note X) 1,000 – – 1,000 – – 1,000– development expenditure 5 11 52 68 46 – 114– capitalised interest – – – – 8 – 8– capital expenditure on asset
management initiatives 41 1 – 42 – – 421,193 12 52 1,257 54 – 1,311
Depreciation – – – – – (1) (1)Disposals (219) (102) (12) (333) (45) – (378)Reclassifications – (4) 6 2 (6) 4 –Revaluations included in income statement 390 423 71 884 – – 884Revaluation included in SOCIE – – – – – 10 10Movement in tenant incentives and contracted rent uplift balances 8 23 7 38 – – 38Carrying value at 31 March 2015 5,833 2,902 385 9,120 274 60 9,454Head lease liabilities (note 16) (41)Surplus on trading properties 96Total Group property portfolio valuation at 31 March 2015 9,509Non-controlling interests (441)Total Group property portfolio valuation at 31 March 2015 attributable to shareholders 9,068
138 British Land Annual Report and Accounts 2015
NOTES TO THE ACCOUNTS CONTINUED
Financial statements
11 Property continued
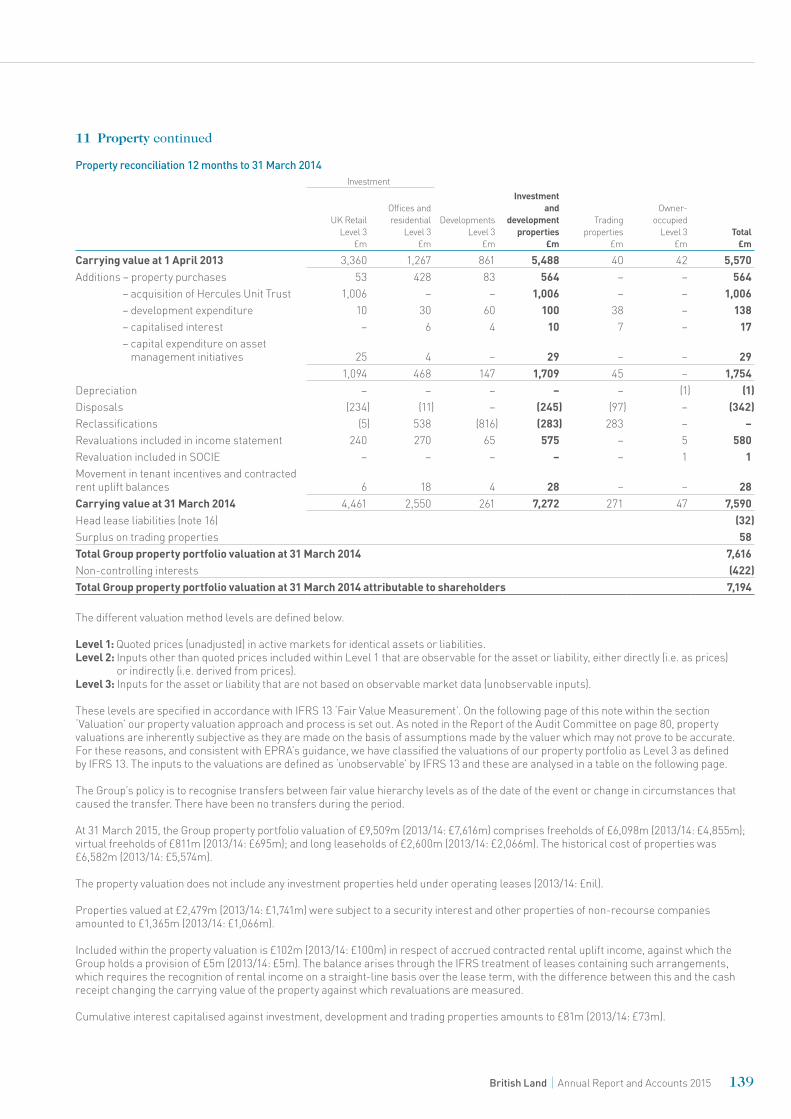
Property reconciliation 12 months to 31 March 2014Investment
UK Retail Level 3
£m
Offices and residential
Level 3 £m
Developments Level 3
£m
Investment and
development properties
£m
Trading properties
£m
Owner-occupied
Level 3 £m
Total £m
Carrying value at 1 April 2013 3,360 1,267 861 5,488 40 42 5,570Additions – property purchases 53 428 83 564 – – 564
– acquisition of Hercules Unit Trust 1,006 – – 1,006 – – 1,006– development expenditure 10 30 60 100 38 – 138– capitalised interest – 6 4 10 7 – 17– capital expenditure on asset
management initiatives 25 4 – 29 – – 291,094 468 147 1,709 45 – 1,754
Depreciation – – – – – (1) (1)Disposals (234) (11) – (245) (97) – (342)Reclassifications (5) 538 (816) (283) 283 – –Revaluations included in income statement 240 270 65 575 – 5 580Revaluation included in SOCIE – – – – – 1 1Movement in tenant incentives and contracted rent uplift balances 6 18 4 28 – – 28Carrying value at 31 March 2014 4,461 2,550 261 7,272 271 47 7,590Head lease liabilities (note 16) (32)Surplus on trading properties 58Total Group property portfolio valuation at 31 March 2014 7,616Non-controlling interests (422)Total Group property portfolio valuation at 31 March 2014 attributable to shareholders 7,194
The different valuation method levels are defined below.
Level 1: Quoted prices (unadjusted) in active markets for identical assets or liabilities.Level 2: Inputs other than quoted prices included within Level 1 that are observable for the asset or liability, either directly (i.e. as prices)
or indirectly (i.e. derived from prices).Level 3: Inputs for the asset or liability that are not based on observable market data (unobservable inputs).
These levels are specified in accordance with IFRS 13 ‘Fair Value Measurement’. On the following page of this note within the section ‘Valuation’ our property valuation approach and process is set out. As noted in the Report of the Audit Committee on page 80, property valuations are inherently subjective as they are made on the basis of assumptions made by the valuer which may not prove to be accurate. For these reasons, and consistent with EPRA’s guidance, we have classified the valuations of our property portfolio as Level 3 as defined by IFRS 13. The inputs to the valuations are defined as ‘unobservable’ by IFRS 13 and these are analysed in a table on the following page.
The Group’s policy is to recognise transfers between fair value hierarchy levels as of the date of the event or change in circumstances that caused the transfer. There have been no transfers during the period.
At 31 March 2015, the Group property portfolio valuation of £9,509m (2013/14: £7,616m) comprises freeholds of £6,098m (2013/14: £4,855m); virtual freeholds of £811m (2013/14: £695m); and long leaseholds of £2,600m (2013/14: £2,066m). The historical cost of properties was £6,582m (2013/14: £5,574m).
The property valuation does not include any investment properties held under operating leases (2013/14: £nil).
Properties valued at £2,479m (2013/14: £1,741m) were subject to a security interest and other properties of non-recourse companies amounted to £1,365m (2013/14: £1,066m).
Included within the property valuation is £102m (2013/14: £100m) in respect of accrued contracted rental uplift income, against which the Group holds a provision of £5m (2013/14: £5m). The balance arises through the IFRS treatment of leases containing such arrangements, which requires the recognition of rental income on a straight-line basis over the lease term, with the difference between this and the cash receipt changing the carrying value of the property against which revaluations are measured.
Cumulative interest capitalised against investment, development and trading properties amounts to £81m (2013/14: £73m).
139British Land Annual Report and Accounts 2015
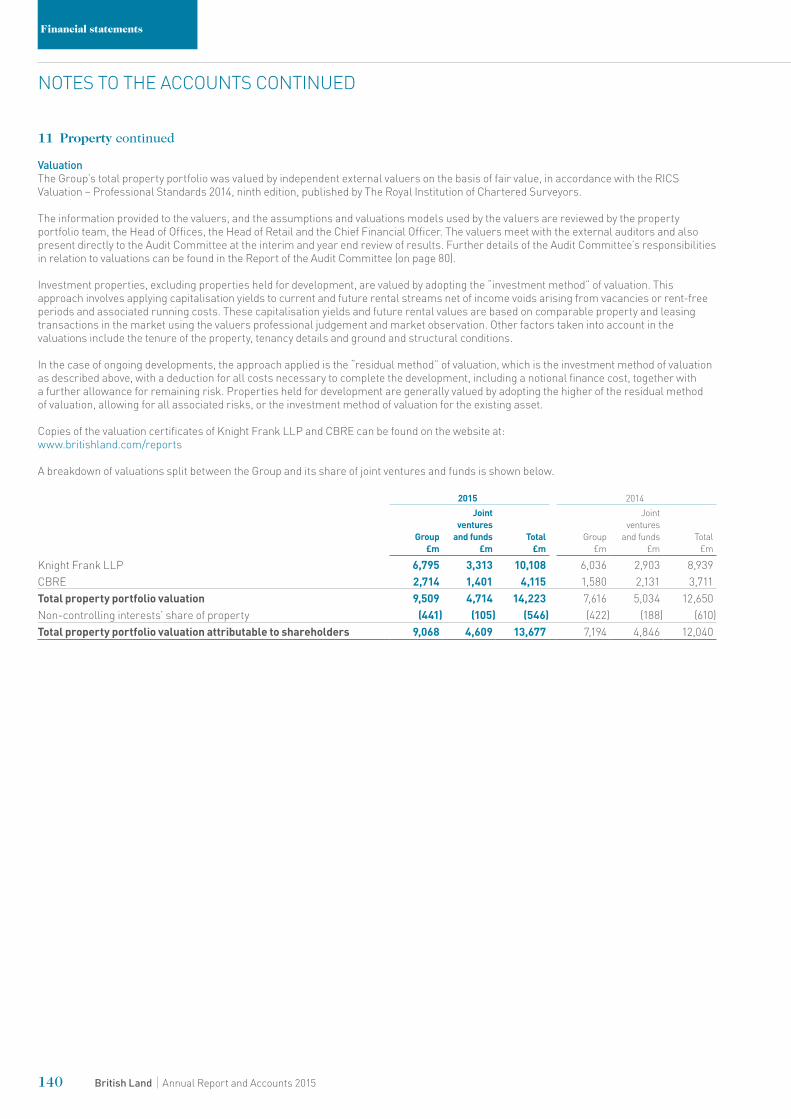
11 Property continued
ValuationThe Group’s total property portfolio was valued by independent external valuers on the basis of fair value, in accordance with the RICS Valuation – Professional Standards 2014, ninth edition, published by The Royal Institution of Chartered Surveyors.
The information provided to the valuers, and the assumptions and valuations models used by the valuers are reviewed by the property portfolio team, the Head of Offices, the Head of Retail and the Chief Financial Officer. The valuers meet with the external auditors and also present directly to the Audit Committee at the interim and year end review of results. Further details of the Audit Committee’s responsibilities in relation to valuations can be found in the Report of the Audit Committee (on page 80).
Investment properties, excluding properties held for development, are valued by adopting the “investment method” of valuation. This approach involves applying capitalisation yields to current and future rental streams net of income voids arising from vacancies or rent-free periods and associated running costs. These capitalisation yields and future rental values are based on comparable property and leasing transactions in the market using the valuers professional judgement and market observation. Other factors taken into account in the valuations include the tenure of the property, tenancy details and ground and structural conditions.
In the case of ongoing developments, the approach applied is the “residual method” of valuation, which is the investment method of valuation as described above, with a deduction for all costs necessary to complete the development, including a notional finance cost, together with a further allowance for remaining risk. Properties held for development are generally valued by adopting the higher of the residual method of valuation, allowing for all associated risks, or the investment method of valuation for the existing asset.
Copies of the valuation certificates of Knight Frank LLP and CBRE can be found on the website at: www.britishland.com/reports
A breakdown of valuations split between the Group and its share of joint ventures and funds is shown below.
2015 2014
Group £m
Joint ventures
and funds £m
Total £m
Group £m
Joint ventures
and funds £m
Total £m
Knight Frank LLP 6,795 3,313 10,108 6,036 2,903 8,939 CBRE 2,714 1,401 4,115 1,580 2,131 3,711 Total property portfolio valuation 9,509 4,714 14,223 7,616 5,034 12,650 Non-controlling interests’ share of property (441) (105) (546) (422) (188) (610)Total property portfolio valuation attributable to shareholders 9,068 4,609 13,677 7,194 4,846 12,040
140 British Land Annual Report and Accounts 2015
NOTES TO THE ACCOUNTS CONTINUED
Financial statements
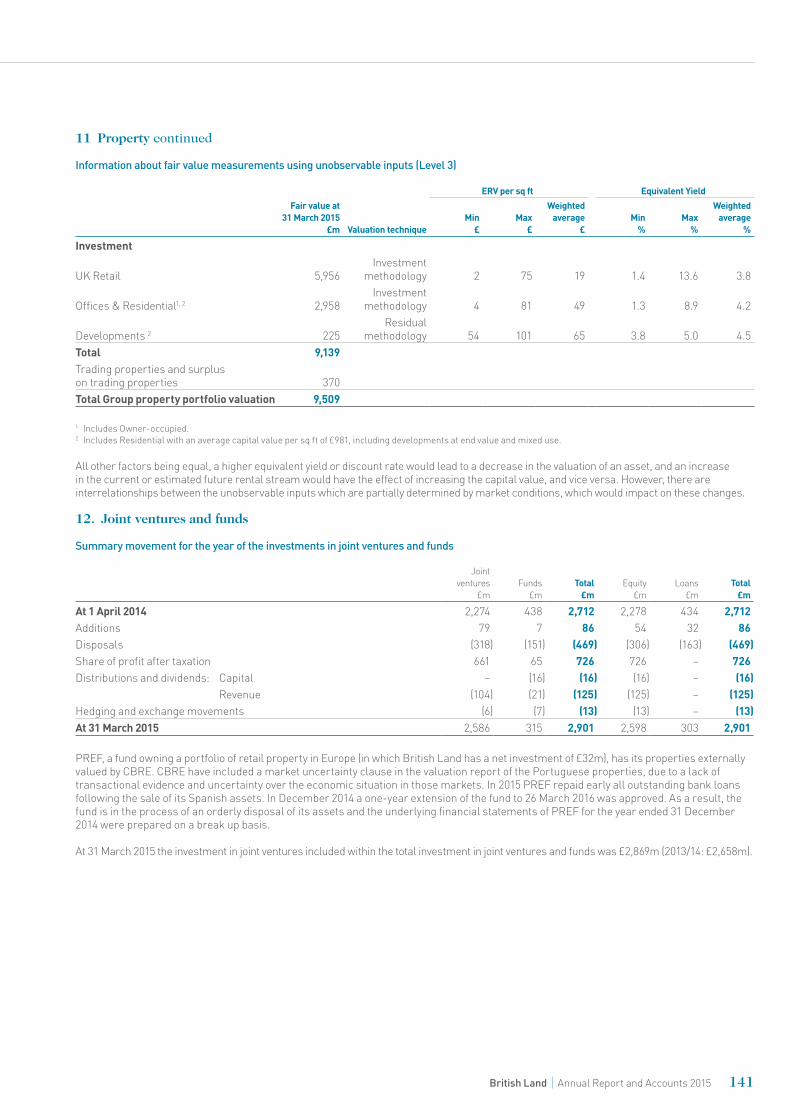
11 Property continued
Information about fair value measurements using unobservable inputs (Level 3)
ERV per sq ft Equivalent YieldFair value at
31 March 2015£m Valuation technique
Min£
Max£
Weighted average
£Min
%Max
%
Weighted average
%
Investment
UK Retail 5,956Investment
methodology 2 75 19 1.4 13.6 3.8
Offices & Residential1, 2 2,958Investment
methodology 4 81 49 1.3 8.9 4.2
Developments 2 225Residual
methodology 54 101 65 3.8 5.0 4.5Total 9,139Trading properties and surplus on trading properties 370Total Group property portfolio valuation 9,509
1 Includes Owner-occupied.2 Includes Residential with an average capital value per sq ft of £981, including developments at end value and mixed use.
All other factors being equal, a higher equivalent yield or discount rate would lead to a decrease in the valuation of an asset, and an increase in the current or estimated future rental stream would have the effect of increasing the capital value, and vice versa. However, there are interrelationships between the unobservable inputs which are partially determined by market conditions, which would impact on these changes.
12. Joint ventures and funds
Summary movement for the year of the investments in joint ventures and funds
Joint ventures
£mFunds
£mTotal
£m Equity
£m Loans
£m Total
£m
At 1 April 2014 2,274 438 2,712 2,278 434 2,712Additions 79 7 86 54 32 86Disposals (318) (151) (469) (306) (163) (469)Share of profit after taxation 661 65 726 726 – 726Distributions and dividends: Capital – (16) (16) (16) – (16) Revenue (104) (21) (125) (125) – (125)Hedging and exchange movements (6) (7) (13) (13) – (13)At 31 March 2015 2,586 315 2,901 2,598 303 2,901
PREF, a fund owning a portfolio of retail property in Europe (in which British Land has a net investment of £32m), has its properties externally valued by CBRE. CBRE have included a market uncertainty clause in the valuation report of the Portuguese properties, due to a lack of transactional evidence and uncertainty over the economic situation in those markets. In 2015 PREF repaid early all outstanding bank loans following the sale of its Spanish assets. In December 2014 a one-year extension of the fund to 26 March 2016 was approved. As a result, the fund is in the process of an orderly disposal of its assets and the underlying financial statements of PREF for the year ended 31 December 2014 were prepared on a break up basis.
At 31 March 2015 the investment in joint ventures included within the total investment in joint ventures and funds was £2,869m (2013/14: £2,658m).
141British Land Annual Report and Accounts 2015
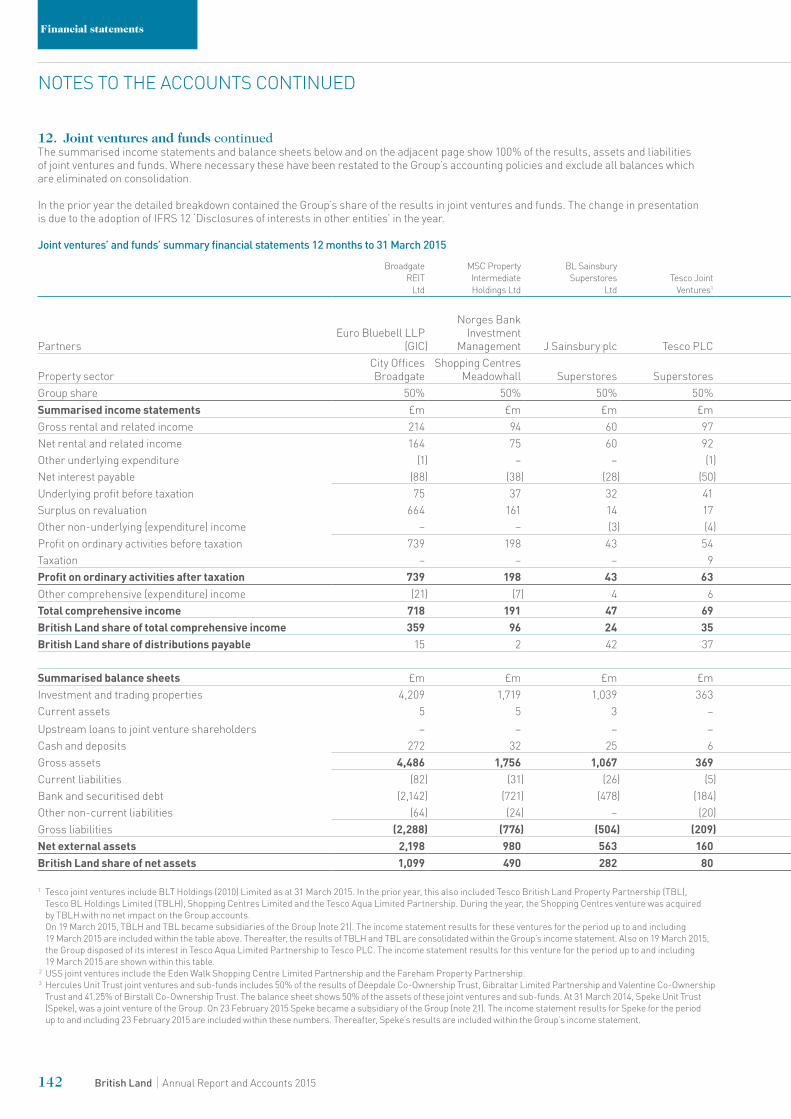
Financial statements
12. Joint ventures and funds continuedThe summarised income statements and balance sheets below and on the adjacent page show 100% of the results, assets and liabilities of joint ventures and funds. Where necessary these have been restated to the Group’s accounting policies and exclude all balances which are eliminated on consolidation.
In the prior year the detailed breakdown contained the Group’s share of the results in joint ventures and funds. The change in presentation is due to the adoption of IFRS 12 ‘Disclosures of interests in other entities’ in the year.
Joint ventures’ and funds’ summary financial statements 12 months to 31 March 2015
Broadgate REIT
Ltd
MSC PropertyIntermediateHoldings Ltd
BL SainsburySuperstores
Ltd Tesco Joint
Ventures1The SouthGate Limited
Partnership
USSJoint
Ventures2
LeadenhallHolding Co
(Jersey) Ltd
Hercules Unit Trustjoint ventures
and sub-funds3
Otherjoint ventures
and funds4
TOTAL
2015
TOTALGroup share
2015
PartnersEuro Bluebell LLP
(GIC)
Norges Bank Investment
Management J Sainsbury plc Tesco PLCAviva
Investors
Universities Superannuation Scheme Group
PLCOxford
Properties
Property sectorCity OfficesBroadgate
Shopping CentresMeadowhall Superstores Superstores
Shopping Centres
Shopping Centres
City OfficesLeadenhall
RetailParks
Group share 50% 50% 50% 50% 50% 50% 50% VariousSummarised income statements £m £m £m £m £m £m £m £m £m £m £mGross rental and related income 214 94 60 97 14 11 15 53 15 573 289Net rental and related income 164 75 60 92 13 8 6 47 12 477 240Other underlying expenditure (1) – – (1) (1) – – – (3) (6) (4)Net interest payable (88) (38) (28) (50) (1) – – (5) (2) (212) (107)Underlying profit before taxation 75 37 32 41 11 8 6 42 7 259 129Surplus on revaluation 664 161 14 17 26 25 201 63 – 1,171 589Other non-underlying (expenditure) income – – (3) (4) – – – (1) 16 8 6Profit on ordinary activities before taxation 739 198 43 54 37 33 207 104 23 1,438 724Taxation – – – 9 – – – – (2) 7 2Profit on ordinary activities after taxation 739 198 43 63 37 33 207 104 21 1,445 726Other comprehensive (expenditure) income (21) (7) 4 6 – – – (1) (10) (29) (13)Total comprehensive income 718 191 47 69 37 33 207 103 11 1,416 713British Land share of total comprehensive income 359 96 24 35 19 17 104 52 7 713British Land share of distributions payable 15 2 42 37 4 4 – 37 – 141
Summarised balance sheets £m £m £m £m £m £m £m £m £m £m £mInvestment and trading properties 4,209 1,719 1,039 363 262 235 770 706 140 9,443 4,719Current assets 5 5 3 – 2 – 2 2 23 42 25Upstream loans to joint venture shareholders – – – – – – – – – – –Cash and deposits 272 32 25 6 2 9 4 11 21 382 192Gross assets 4,486 1,756 1,067 369 266 244 776 719 184 9,867 4,936Current liabilities (82) (31) (26) (5) (4) (4) (4) (7) (65) (228) (119)Bank and securitised debt (2,142) (721) (478) (184) – – – (127) – (3,652) (1,827)Other non-current liabilities (64) (24) – (20) (28) – – (1) (44) (181) (89)Gross liabilities (2,288) (776) (504) (209) (32) (4) (4) (135) (109) (4,061) (2,035)Net external assets 2,198 980 563 160 234 240 772 584 75 5,806 2,901British Land share of net assets 1,099 490 282 80 117 120 386 283 44 2,901
1 Tesco joint ventures include BLT Holdings (2010) Limited as at 31 March 2015. In the prior year, this also included Tesco British Land Property Partnership (TBL), Tesco BL Holdings Limited (TBLH), Shopping Centres Limited and the Tesco Aqua Limited Partnership. During the year, the Shopping Centres venture was acquired by TBLH with no net impact on the Group accounts. On 19 March 2015, TBLH and TBL became subsidiaries of the Group (note 21). The income statement results for these ventures for the period up to and including 19 March 2015 are included within the table above. Thereafter, the results of TBLH and TBL are consolidated within the Group’s income statement. Also on 19 March 2015, the Group disposed of its interest in Tesco Aqua Limited Partnership to Tesco PLC. The income statement results for this venture for the period up to and including 19 March 2015 are shown within this table.
2 USS joint ventures include the Eden Walk Shopping Centre Limited Partnership and the Fareham Property Partnership. 3 Hercules Unit Trust joint ventures and sub-funds includes 50% of the results of Deepdale Co-Ownership Trust, Gibraltar Limited Partnership and Valentine Co-Ownership
Trust and 41.25% of Birstall Co-Ownership Trust. The balance sheet shows 50% of the assets of these joint ventures and sub-funds. At 31 March 2014, Speke Unit Trust (Speke), was a joint venture of the Group. On 23 February 2015 Speke became a subsidiary of the Group (note 21). The income statement results for Speke for the period up to and including 23 February 2015 are included within these numbers. Thereafter, Speke’s results are included within the Group’s income statement.
142 British Land Annual Report and Accounts 2015
NOTES TO THE ACCOUNTS CONTINUED
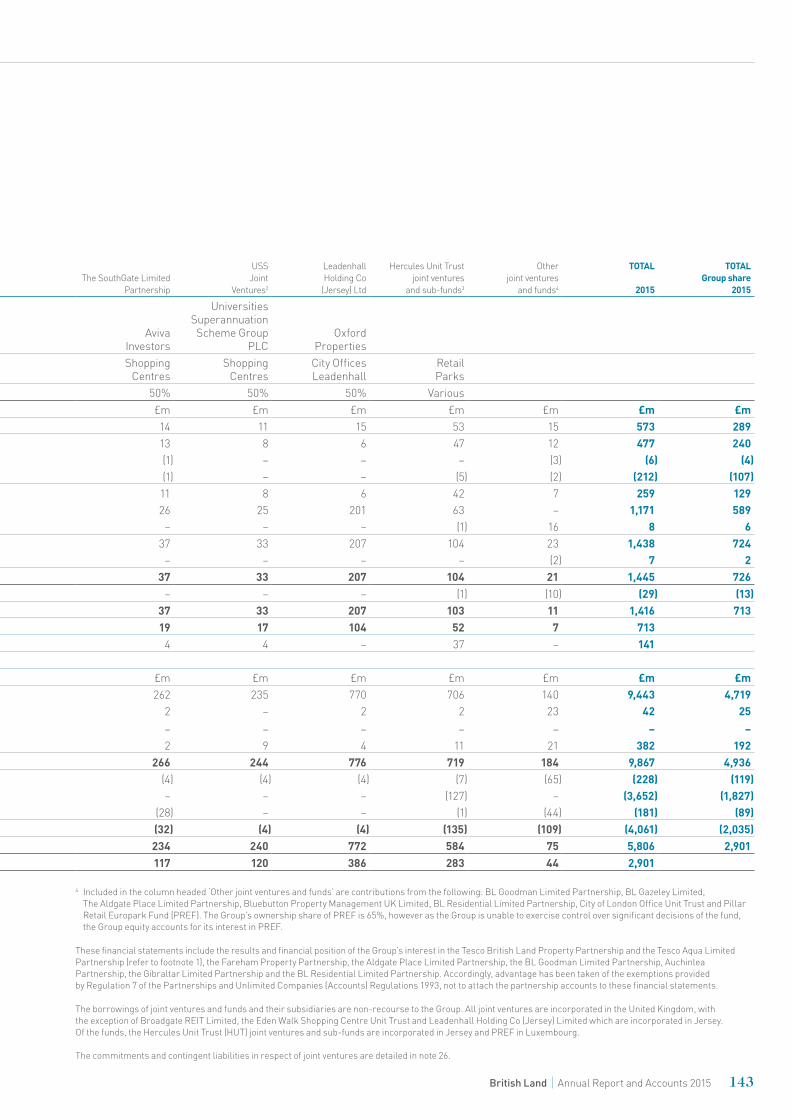
Joint ventures’ and funds’ summary financial statements 12 months to 31 March 2015
Broadgate REIT
Ltd
MSC PropertyIntermediateHoldings Ltd
BL SainsburySuperstores
Ltd Tesco Joint
Ventures1The SouthGate Limited
Partnership
USSJoint
Ventures2
LeadenhallHolding Co
(Jersey) Ltd
Hercules Unit Trustjoint ventures
and sub-funds3
Otherjoint ventures
and funds4
TOTAL
2015
TOTALGroup share
2015
PartnersEuro Bluebell LLP
(GIC)
Norges Bank Investment
Management J Sainsbury plc Tesco PLCAviva
Investors
Universities Superannuation Scheme Group
PLCOxford
Properties
Property sectorCity OfficesBroadgate
Shopping CentresMeadowhall Superstores Superstores
Shopping Centres
Shopping Centres
City OfficesLeadenhall
RetailParks
Group share 50% 50% 50% 50% 50% 50% 50% VariousSummarised income statements £m £m £m £m £m £m £m £m £m £m £mGross rental and related income 214 94 60 97 14 11 15 53 15 573 289Net rental and related income 164 75 60 92 13 8 6 47 12 477 240Other underlying expenditure (1) – – (1) (1) – – – (3) (6) (4)Net interest payable (88) (38) (28) (50) (1) – – (5) (2) (212) (107)Underlying profit before taxation 75 37 32 41 11 8 6 42 7 259 129Surplus on revaluation 664 161 14 17 26 25 201 63 – 1,171 589Other non-underlying (expenditure) income – – (3) (4) – – – (1) 16 8 6Profit on ordinary activities before taxation 739 198 43 54 37 33 207 104 23 1,438 724Taxation – – – 9 – – – – (2) 7 2Profit on ordinary activities after taxation 739 198 43 63 37 33 207 104 21 1,445 726Other comprehensive (expenditure) income (21) (7) 4 6 – – – (1) (10) (29) (13)Total comprehensive income 718 191 47 69 37 33 207 103 11 1,416 713British Land share of total comprehensive income 359 96 24 35 19 17 104 52 7 713British Land share of distributions payable 15 2 42 37 4 4 – 37 – 141
Summarised balance sheets £m £m £m £m £m £m £m £m £m £m £mInvestment and trading properties 4,209 1,719 1,039 363 262 235 770 706 140 9,443 4,719Current assets 5 5 3 – 2 – 2 2 23 42 25Upstream loans to joint venture shareholders – – – – – – – – – – –Cash and deposits 272 32 25 6 2 9 4 11 21 382 192Gross assets 4,486 1,756 1,067 369 266 244 776 719 184 9,867 4,936Current liabilities (82) (31) (26) (5) (4) (4) (4) (7) (65) (228) (119)Bank and securitised debt (2,142) (721) (478) (184) – – – (127) – (3,652) (1,827)Other non-current liabilities (64) (24) – (20) (28) – – (1) (44) (181) (89)Gross liabilities (2,288) (776) (504) (209) (32) (4) (4) (135) (109) (4,061) (2,035)Net external assets 2,198 980 563 160 234 240 772 584 75 5,806 2,901British Land share of net assets 1,099 490 282 80 117 120 386 283 44 2,901
4 Included in the column headed ‘Other joint ventures and funds’ are contributions from the following: BL Goodman Limited Partnership, BL Gazeley Limited, The Aldgate Place Limited Partnership, Bluebutton Property Management UK Limited, BL Residential Limited Partnership, City of London Office Unit Trust and Pillar Retail Europark Fund (PREF). The Group’s ownership share of PREF is 65%, however as the Group is unable to exercise control over significant decisions of the fund, the Group equity accounts for its interest in PREF.
These financial statements include the results and financial position of the Group’s interest in the Tesco British Land Property Partnership and the Tesco Aqua Limited Partnership (refer to footnote 1), the Fareham Property Partnership, the Aldgate Place Limited Partnership, the BL Goodman Limited Partnership, Auchinlea Partnership, the Gibraltar Limited Partnership and the BL Residential Limited Partnership. Accordingly, advantage has been taken of the exemptions provided by Regulation 7 of the Partnerships and Unlimited Companies (Accounts) Regulations 1993, not to attach the partnership accounts to these financial statements.
The borrowings of joint ventures and funds and their subsidiaries are non-recourse to the Group. All joint ventures are incorporated in the United Kingdom, with the exception of Broadgate REIT Limited, the Eden Walk Shopping Centre Unit Trust and Leadenhall Holding Co (Jersey) Limited which are incorporated in Jersey. Of the funds, the Hercules Unit Trust (HUT) joint ventures and sub-funds are incorporated in Jersey and PREF in Luxembourg.
The commitments and contingent liabilities in respect of joint ventures are detailed in note 26.
143British Land Annual Report and Accounts 2015

Financial statements
12. Joint ventures and funds continuedThe summarised income statements and balance sheets below and on the adjacent page show 100% of the results, assets and liabilities of joint ventures and funds. Where necessary these have been restated to the Group’s accounting policies and exclude all balances which are eliminated on consolidation.
In the prior year the detailed breakdown contained the Group’s share of the results in joint ventures and funds. The change in presentation is due to the adoption of IFRS 12 ‘Disclosures of interests in other entities’ in the year.
Joint ventures’ and funds’ summary financial statements 12 months to 31 March 2014
Broadgate REIT
Ltd
MSC PropertyIntermediateHoldings Ltd
BL SainsburySuperstores
Ltd Tesco Joint
VenturesThe SouthGate Limited
Partnership
USSJoint
Ventures
LeadenhallHolding Co
(Jersey) Ltd
Hercules Unit Trustjoint ventures
and sub-funds
Otherjoint ventures
and funds
TOTAL
2014
TOTALGroup share
2014
PartnersEuro Bluebell LLP
(GIC)
Norges Bank Investment
Management J Sainsbury plc Tesco PLCAviva
Investors
Universities Superannuation Scheme Group
PLCOxford
Properties
Property sectorCity OfficesBroadgate
Shopping CentresMeadowhall Superstores Superstores
Shopping Centres
Shopping Centres
City OfficesLeadenhall
RetailParks
Group share 50% 50% 50% 50% 50% 50% 50% VariousSummarised income statements £m £m £m £m £m £m £m £m £m £m £mGross rental and related income 216 96 65 101 7 10 – 80 40 615 307Net rental and related income 161 76 65 94 5 7 (1) 72 27 506 253Other underlying expenditure (1) – – (1) – – – (4) (5) (11) (6)Net interest payable (90) (38) (30) (55) – – – (26) (7) (246) (123)Underlying profit (loss) before taxation 70 38 35 38 5 7 (1) 42 15 249 124Surplus (deficit) on revaluation 287 8 6 87 5 19 133 10 (28) 527 262Other non-underlying income (expenditure) – – – 2 (3) 1 – (2) – (2) (4)Profit (loss) on ordinary activities before taxation 357 46 41 127 7 27 132 50 (13) 774 382Taxation – – – (3) – – – – (7) (10) (5)Profit (loss) on ordinary activities after taxation 357 46 41 124 7 27 132 50 (20) 764 377Other comprehensive income 21 5 4 52 – – – 3 – 85 43Total comprehensive income 378 51 45 176 7 27 132 53 (20) 849 420British Land share of total comprehensive income 189 26 22 88 3 14 66 26 (14) 420British Land share of distributions payable 6 2 4 17 2 2 – 23 19 75
Summarised balance sheets £m £m £m £m £m £m £m £m £m £m £mInvestment and trading properties 3,425 1,541 1,209 1,795 207 198 530 933 195 10,033 5,031Current assets 7 3 – 2 4 – – 2 40 58 31Upstream loans to joint venture shareholders – – – – – – – – 8 8 4Cash and deposits 270 31 21 32 3 8 1 13 18 397 199Gross assets 3,702 1,575 1,230 1,829 214 206 531 948 261 10,496 5,265Current liabilities (72) (30) (29) (29) (6) (4) (4) (10) (65) (249) (138)Bank and securitised debt (2,092) (745) (587) (1,009) – – – (149) (29) (4,611) (2,330)Other non-current liabilities (44) (17) (4) (108) – – – – (38) (211) (85)Gross liabilities (2,208) (792) (620) (1,146) (6) (4) (4) (159) (132) (5,071) (2,553)Net external assets 1,494 783 610 683 208 202 527 789 129 5,425 2,712British Land share of net assets 747 392 305 342 104 101 264 384 73 2,712
144 British Land Annual Report and Accounts 2015
NOTES TO THE ACCOUNTS CONTINUED
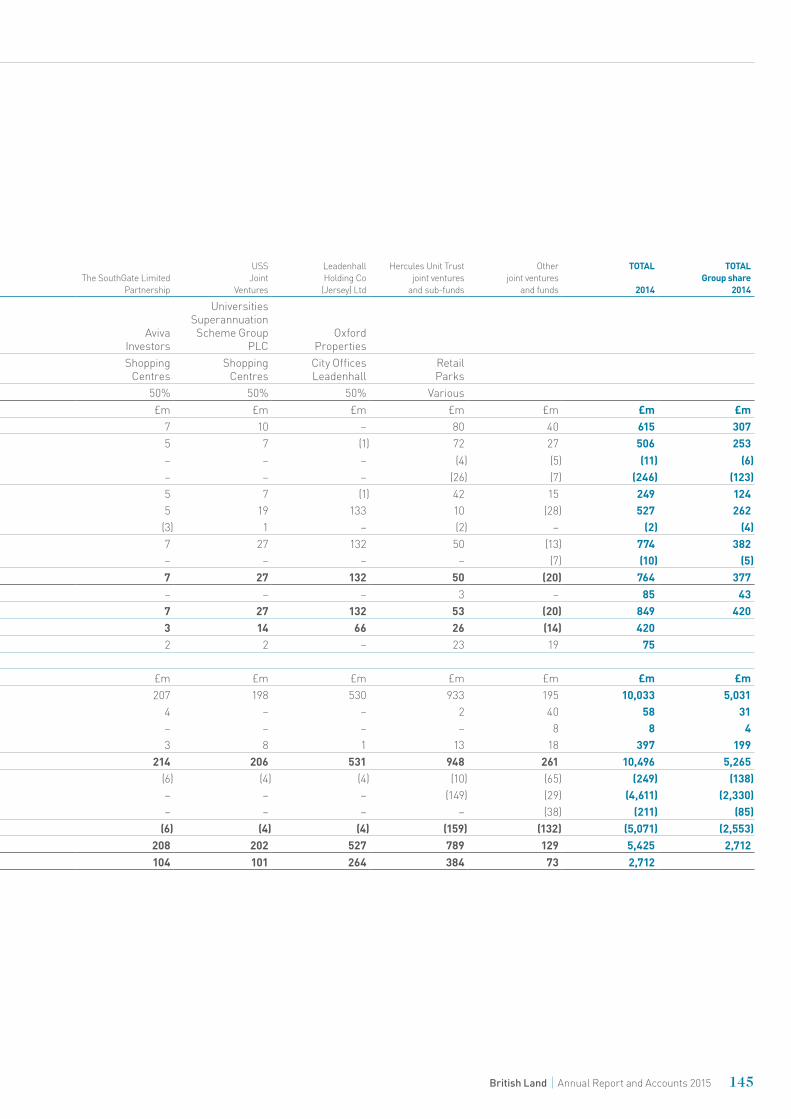
is due to the adoption of IFRS 12 ‘Disclosures of interests in other entities’ in the year.
Joint ventures’ and funds’ summary financial statements 12 months to 31 March 2014
Broadgate REIT
Ltd
MSC PropertyIntermediateHoldings Ltd
BL SainsburySuperstores
Ltd Tesco Joint
VenturesThe SouthGate Limited
Partnership
USSJoint
Ventures
LeadenhallHolding Co
(Jersey) Ltd
Hercules Unit Trustjoint ventures
and sub-funds
Otherjoint ventures
and funds
TOTAL
2014
TOTALGroup share
2014
PartnersEuro Bluebell LLP
(GIC)
Norges Bank Investment
Management J Sainsbury plc Tesco PLCAviva
Investors
Universities Superannuation Scheme Group
PLCOxford
Properties
Property sectorCity OfficesBroadgate
Shopping CentresMeadowhall Superstores Superstores
Shopping Centres
Shopping Centres
City OfficesLeadenhall
RetailParks
Group share 50% 50% 50% 50% 50% 50% 50% VariousSummarised income statements £m £m £m £m £m £m £m £m £m £m £mGross rental and related income 216 96 65 101 7 10 – 80 40 615 307Net rental and related income 161 76 65 94 5 7 (1) 72 27 506 253Other underlying expenditure (1) – – (1) – – – (4) (5) (11) (6)Net interest payable (90) (38) (30) (55) – – – (26) (7) (246) (123)Underlying profit (loss) before taxation 70 38 35 38 5 7 (1) 42 15 249 124Surplus (deficit) on revaluation 287 8 6 87 5 19 133 10 (28) 527 262Other non-underlying income (expenditure) – – – 2 (3) 1 – (2) – (2) (4)Profit (loss) on ordinary activities before taxation 357 46 41 127 7 27 132 50 (13) 774 382Taxation – – – (3) – – – – (7) (10) (5)Profit (loss) on ordinary activities after taxation 357 46 41 124 7 27 132 50 (20) 764 377Other comprehensive income 21 5 4 52 – – – 3 – 85 43Total comprehensive income 378 51 45 176 7 27 132 53 (20) 849 420British Land share of total comprehensive income 189 26 22 88 3 14 66 26 (14) 420British Land share of distributions payable 6 2 4 17 2 2 – 23 19 75
Summarised balance sheets £m £m £m £m £m £m £m £m £m £m £mInvestment and trading properties 3,425 1,541 1,209 1,795 207 198 530 933 195 10,033 5,031Current assets 7 3 – 2 4 – – 2 40 58 31Upstream loans to joint venture shareholders – – – – – – – – 8 8 4Cash and deposits 270 31 21 32 3 8 1 13 18 397 199Gross assets 3,702 1,575 1,230 1,829 214 206 531 948 261 10,496 5,265Current liabilities (72) (30) (29) (29) (6) (4) (4) (10) (65) (249) (138)Bank and securitised debt (2,092) (745) (587) (1,009) – – – (149) (29) (4,611) (2,330)Other non-current liabilities (44) (17) (4) (108) – – – – (38) (211) (85)Gross liabilities (2,208) (792) (620) (1,146) (6) (4) (4) (159) (132) (5,071) (2,553)Net external assets 1,494 783 610 683 208 202 527 789 129 5,425 2,712British Land share of net assets 747 392 305 342 104 101 264 384 73 2,712
145British Land Annual Report and Accounts 2015
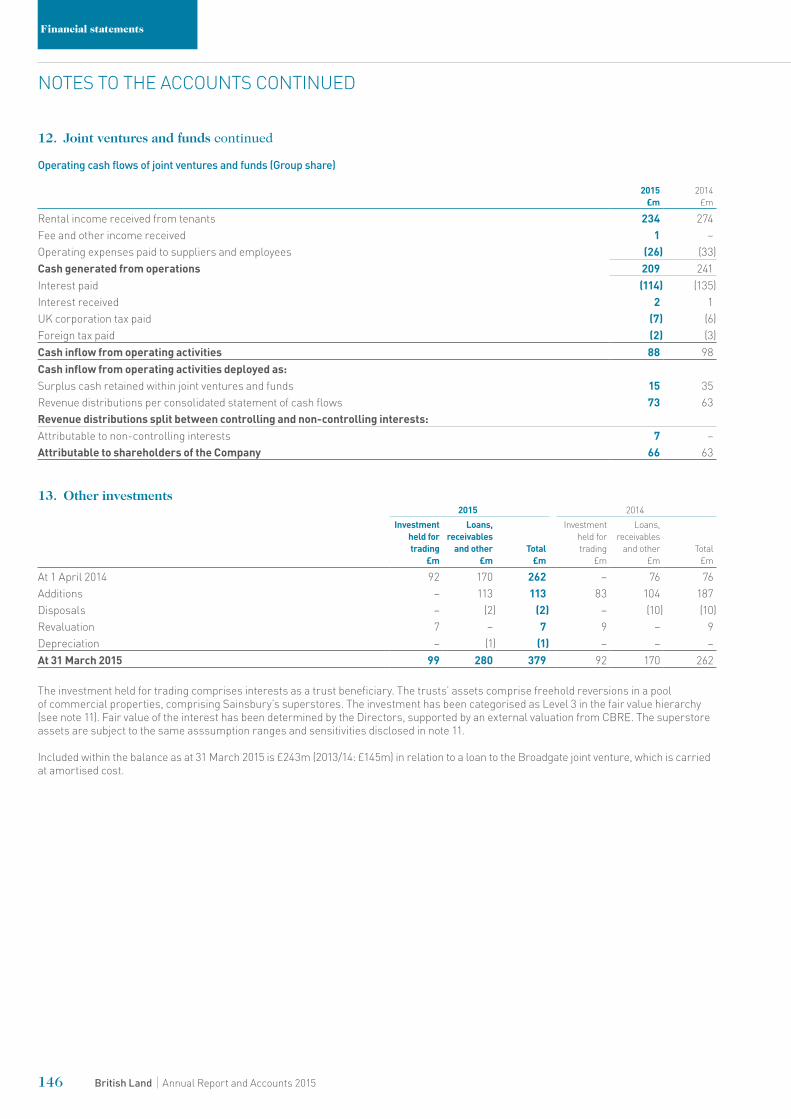
Financial statements
12. Joint ventures and funds continued
Operating cash flows of joint ventures and funds (Group share)
2015 £m
2014 £m
Rental income received from tenants 234 274Fee and other income received 1 –Operating expenses paid to suppliers and employees (26) (33)Cash generated from operations 209 241Interest paid (114) (135)Interest received 2 1UK corporation tax paid (7) (6)Foreign tax paid (2) (3)Cash inflow from operating activities 88 98Cash inflow from operating activities deployed as:Surplus cash retained within joint ventures and funds 15 35Revenue distributions per consolidated statement of cash flows 73 63Revenue distributions split between controlling and non-controlling interests:Attributable to non-controlling interests 7 –Attributable to shareholders of the Company 66 63
13. Other investments2015 2014
Investment held for trading
£m
Loans, receivables
and other£m
Total £m
Investment held for trading
£m
Loans, receivables
and other £m
Total £m
At 1 April 2014 92 170 262 – 76 76Additions – 113 113 83 104 187Disposals – (2) (2) – (10) (10)Revaluation 7 – 7 9 – 9Depreciation – (1) (1) – – –At 31 March 2015 99 280 379 92 170 262
The investment held for trading comprises interests as a trust beneficiary. The trusts’ assets comprise freehold reversions in a pool of commercial properties, comprising Sainsbury’s superstores. The investment has been categorised as Level 3 in the fair value hierarchy (see note 11). Fair value of the interest has been determined by the Directors, supported by an external valuation from CBRE. The superstore assets are subject to the same asssumption ranges and sensitivities disclosed in note 11.
Included within the balance as at 31 March 2015 is £243m (2013/14: £145m) in relation to a loan to the Broadgate joint venture, which is carried at amortised cost.
146 British Land Annual Report and Accounts 2015
NOTES TO THE ACCOUNTS CONTINUED
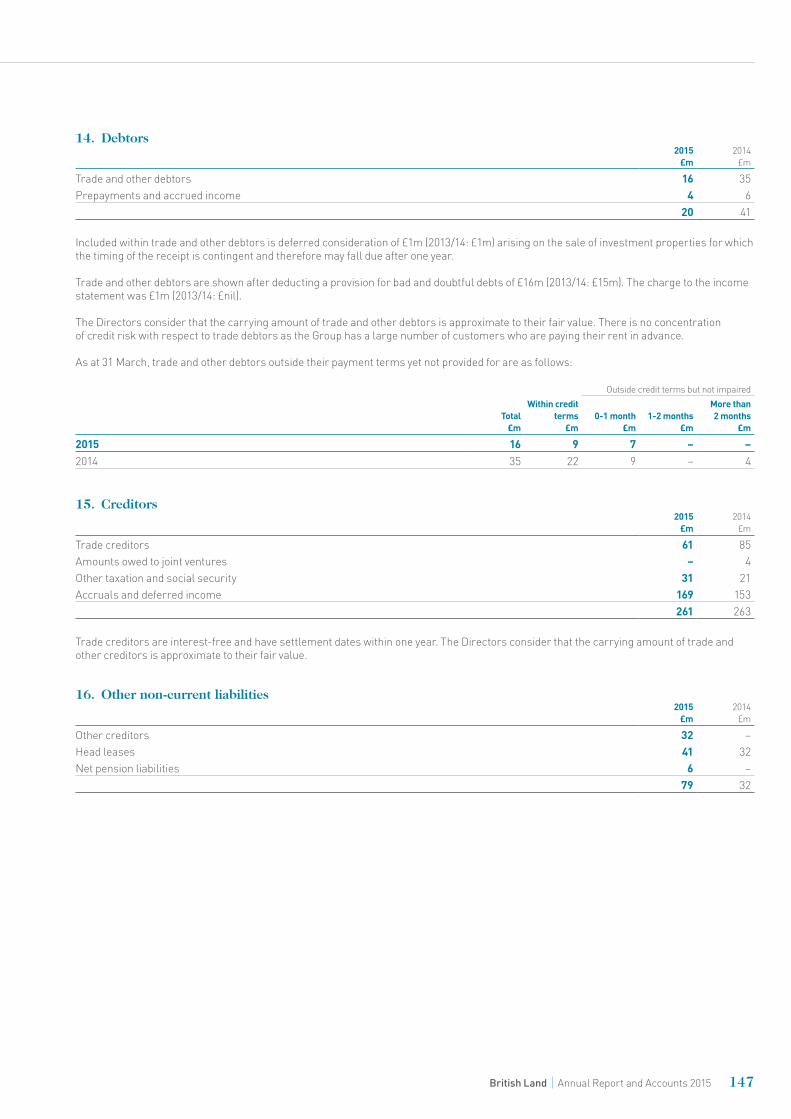
14. Debtors2015
£m2014
£m
Trade and other debtors 16 35Prepayments and accrued income 4 6
20 41
Included within trade and other debtors is deferred consideration of £1m (2013/14: £1m) arising on the sale of investment properties for which the timing of the receipt is contingent and therefore may fall due after one year.
Trade and other debtors are shown after deducting a provision for bad and doubtful debts of £16m (2013/14: £15m). The charge to the income statement was £1m (2013/14: £nil).
The Directors consider that the carrying amount of trade and other debtors is approximate to their fair value. There is no concentration of credit risk with respect to trade debtors as the Group has a large number of customers who are paying their rent in advance.
As at 31 March, trade and other debtors outside their payment terms yet not provided for are as follows:
Outside credit terms but not impaired
Total£m
Within credit terms
£m0-1 month
£m1-2 months
£m
More than 2 months
£m
2015 16 9 7 – –2014 35 22 9 – 4
15. Creditors2015
£m2014
£m
Trade creditors 61 85Amounts owed to joint ventures – 4Other taxation and social security 31 21Accruals and deferred income 169 153
261 263
Trade creditors are interest-free and have settlement dates within one year. The Directors consider that the carrying amount of trade and other creditors is approximate to their fair value.
16. Other non-current liabilities2015
£m2014
£m
Other creditors 32 –Head leases 41 32Net pension liabilities 6 –
79 32
147British Land Annual Report and Accounts 2015
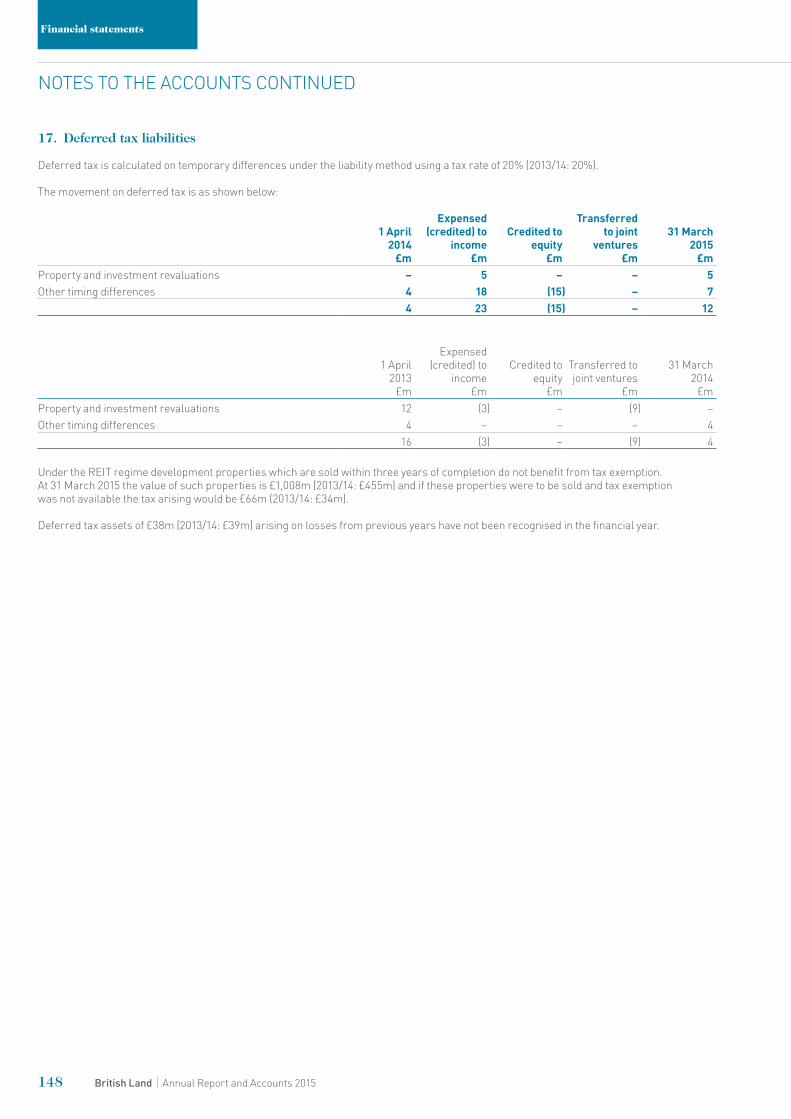
Financial statements
17. Deferred tax liabilities
Deferred tax is calculated on temporary differences under the liability method using a tax rate of 20% (2013/14: 20%).
The movement on deferred tax is as shown below:
1 April 2014
£m
Expensed(credited) to
income £m
Credited to equity
£m
Transferred to joint
ventures £m
31 March 2015
£m Property and investment revaluations – 5 – – 5Other timing differences 4 18 (15) – 7
4 23 (15) – 12
1 April 2013
£m
Expensed(credited) to
income £m
Credited to equity
£m
Transferred to joint ventures
£m
31 March 2014
£m Property and investment revaluations 12 (3) – (9) –Other timing differences 4 – – – 4
16 (3) – (9) 4
Under the REIT regime development properties which are sold within three years of completion do not benefit from tax exemption. At 31 March 2015 the value of such properties is £1,008m (2013/14: £455m) and if these properties were to be sold and tax exemption was not available the tax arising would be £66m (2013/14: £34m).
Deferred tax assets of £38m (2013/14: £39m) arising on losses from previous years have not been recognised in the financial year.
148 British Land Annual Report and Accounts 2015
NOTES TO THE ACCOUNTS CONTINUED
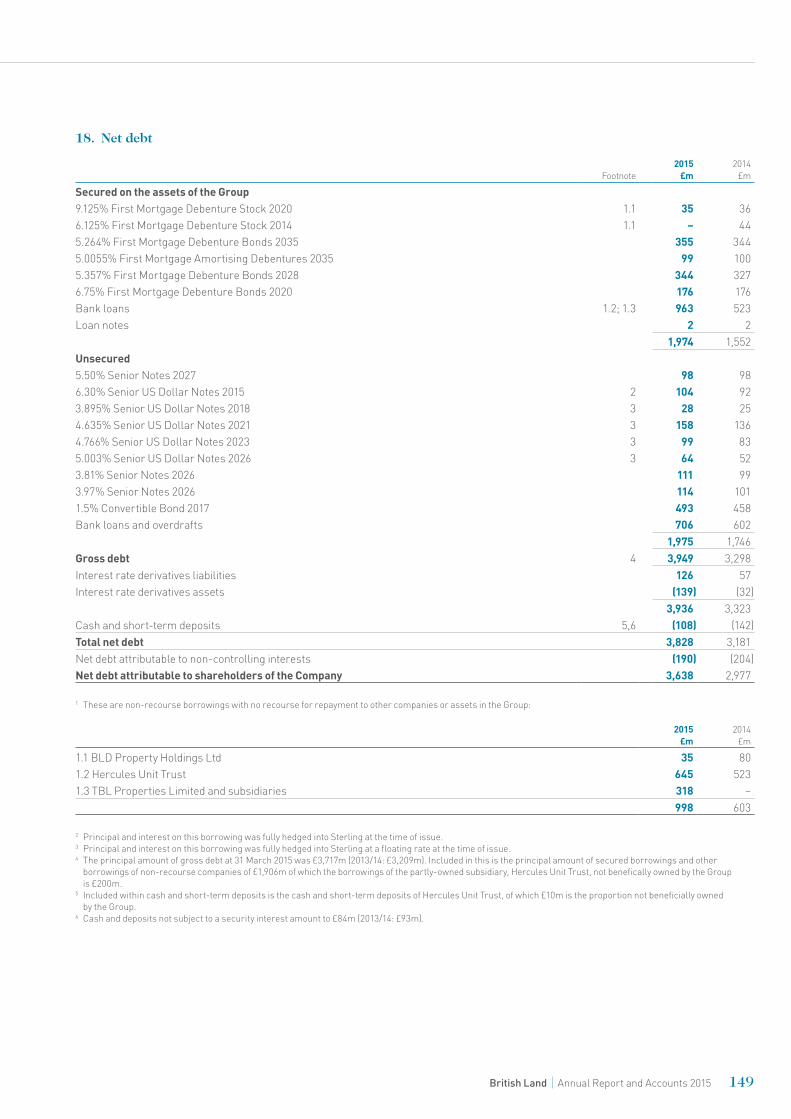
18. Net debt
Footnote2015
£m2014
£m
Secured on the assets of the Group9.125% First Mortgage Debenture Stock 2020 1.1 35 366.125% First Mortgage Debenture Stock 2014 1.1 – 445.264% First Mortgage Debenture Bonds 2035 355 3445.0055% First Mortgage Amortising Debentures 2035 99 1005.357% First Mortgage Debenture Bonds 2028 344 3276.75% First Mortgage Debenture Bonds 2020 176 176Bank loans 1.2; 1.3 963 523Loan notes 2 2
1,974 1,552Unsecured5.50% Senior Notes 2027 98 986.30% Senior US Dollar Notes 2015 2 104 923.895% Senior US Dollar Notes 2018 3 28 254.635% Senior US Dollar Notes 2021 3 158 1364.766% Senior US Dollar Notes 2023 3 99 835.003% Senior US Dollar Notes 2026 3 64 523.81% Senior Notes 2026 111 993.97% Senior Notes 2026 114 1011.5% Convertible Bond 2017 493 458Bank loans and overdrafts 706 602
1,975 1,746Gross debt 4 3,949 3,298Interest rate derivatives liabilities 126 57Interest rate derivatives assets (139) (32)
3,936 3,323Cash and short-term deposits 5,6 (108) (142)Total net debt 3,828 3,181Net debt attributable to non-controlling interests (190) (204)Net debt attributable to shareholders of the Company 3,638 2,977
1 These are non-recourse borrowings with no recourse for repayment to other companies or assets in the Group:
2015 £m
2014 £m
1.1 BLD Property Holdings Ltd 35 801.2 Hercules Unit Trust 645 5231.3 TBL Properties Limited and subsidiaries 318 –
998 603
2 Principal and interest on this borrowing was fully hedged into Sterling at the time of issue.3 Principal and interest on this borrowing was fully hedged into Sterling at a floating rate at the time of issue.4 The principal amount of gross debt at 31 March 2015 was £3,717m (2013/14: £3,209m). Included in this is the principal amount of secured borrowings and other
borrowings of non-recourse companies of £1,906m of which the borrowings of the partly-owned subsidiary, Hercules Unit Trust, not benefically owned by the Group is £200m.
5 Included within cash and short-term deposits is the cash and short-term deposits of Hercules Unit Trust, of which £10m is the proportion not beneficially owned by the Group.
6 Cash and deposits not subject to a security interest amount to £84m (2013/14: £93m).
149British Land Annual Report and Accounts 2015
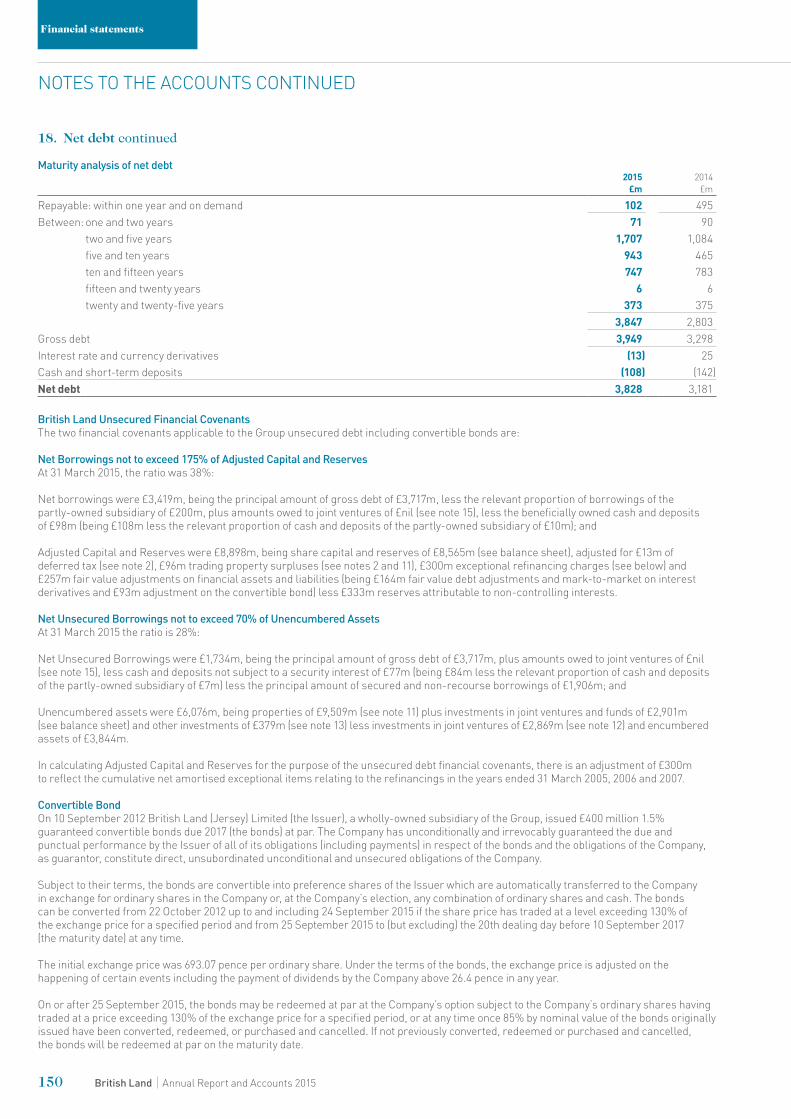
Financial statements
18. Net debt continued
Maturity analysis of net debt2015
£m2014
£m
Repayable: within one year and on demand 102 495Between: one and two years 71 90
two and five years 1,707 1,084five and ten years 943 465ten and fifteen years 747 783fifteen and twenty years 6 6twenty and twenty-five years 373 375
3,847 2,803Gross debt 3,949 3,298Interest rate and currency derivatives (13) 25Cash and short-term deposits (108) (142)Net debt 3,828 3,181
British Land Unsecured Financial CovenantsThe two financial covenants applicable to the Group unsecured debt including convertible bonds are:
Net Borrowings not to exceed 175% of Adjusted Capital and ReservesAt 31 March 2015, the ratio was 38%:
Net borrowings were £3,419m, being the principal amount of gross debt of £3,717m, less the relevant proportion of borrowings of the partly-owned subsidiary of £200m, plus amounts owed to joint ventures of £nil (see note 15), less the beneficially owned cash and deposits of £98m (being £108m less the relevant proportion of cash and deposits of the partly-owned subsidiary of £10m); and
Adjusted Capital and Reserves were £8,898m, being share capital and reserves of £8,565m (see balance sheet), adjusted for £13m of deferred tax (see note 2), £96m trading property surpluses (see notes 2 and 11), £300m exceptional refinancing charges (see below) and £257m fair value adjustments on financial assets and liabilities (being £164m fair value debt adjustments and mark-to-market on interest derivatives and £93m adjustment on the convertible bond) less £333m reserves attributable to non-controlling interests.
Net Unsecured Borrowings not to exceed 70% of Unencumbered AssetsAt 31 March 2015 the ratio is 28%:
Net Unsecured Borrowings were £1,734m, being the principal amount of gross debt of £3,717m, plus amounts owed to joint ventures of £nil (see note 15), less cash and deposits not subject to a security interest of £77m (being £84m less the relevant proportion of cash and deposits of the partly-owned subsidiary of £7m) less the principal amount of secured and non-recourse borrowings of £1,906m; and
Unencumbered assets were £6,076m, being properties of £9,509m (see note 11) plus investments in joint ventures and funds of £2,901m (see balance sheet) and other investments of £379m (see note 13) less investments in joint ventures of £2,869m (see note 12) and encumbered assets of £3,844m.
In calculating Adjusted Capital and Reserves for the purpose of the unsecured debt financial covenants, there is an adjustment of £300m to reflect the cumulative net amortised exceptional items relating to the refinancings in the years ended 31 March 2005, 2006 and 2007.
Convertible BondOn 10 September 2012 British Land (Jersey) Limited (the Issuer), a wholly-owned subsidiary of the Group, issued £400 million 1.5% guaranteed convertible bonds due 2017 (the bonds) at par. The Company has unconditionally and irrevocably guaranteed the due and punctual performance by the Issuer of all of its obligations (including payments) in respect of the bonds and the obligations of the Company, as guarantor, constitute direct, unsubordinated unconditional and unsecured obligations of the Company.
Subject to their terms, the bonds are convertible into preference shares of the Issuer which are automatically transferred to the Company in exchange for ordinary shares in the Company or, at the Company’s election, any combination of ordinary shares and cash. The bonds can be converted from 22 October 2012 up to and including 24 September 2015 if the share price has traded at a level exceeding 130% of the exchange price for a specified period and from 25 September 2015 to (but excluding) the 20th dealing day before 10 September 2017 (the maturity date) at any time.
The initial exchange price was 693.07 pence per ordinary share. Under the terms of the bonds, the exchange price is adjusted on the happening of certain events including the payment of dividends by the Company above 26.4 pence in any year.
On or after 25 September 2015, the bonds may be redeemed at par at the Company’s option subject to the Company’s ordinary shares having traded at a price exceeding 130% of the exchange price for a specified period, or at any time once 85% by nominal value of the bonds originally issued have been converted, redeemed, or purchased and cancelled. If not previously converted, redeemed or purchased and cancelled, the bonds will be redeemed at par on the maturity date.
150 British Land Annual Report and Accounts 2015
NOTES TO THE ACCOUNTS CONTINUED
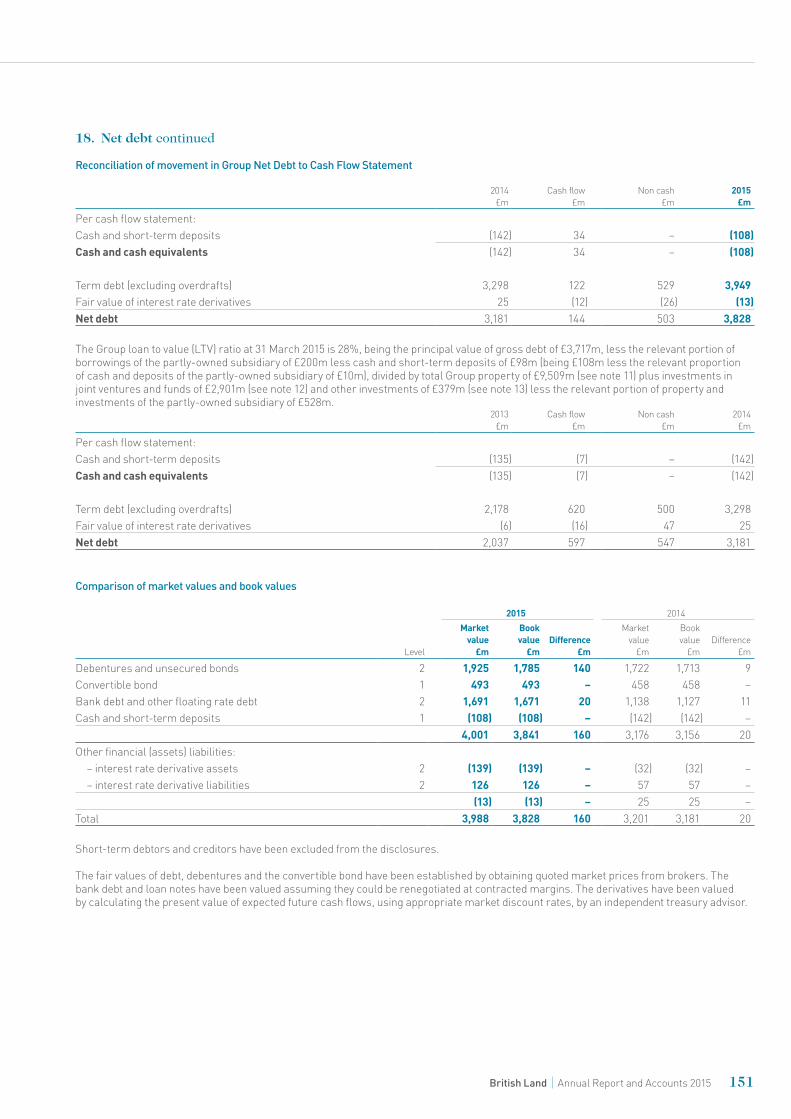
18. Net debt continued
Reconciliation of movement in Group Net Debt to Cash Flow Statement
2014£m
Cash flow£m
Non cash£m
2015£m
Per cash flow statement:Cash and short-term deposits (142) 34 – (108)Cash and cash equivalents (142) 34 – (108)
Term debt (excluding overdrafts) 3,298 122 529 3,949Fair value of interest rate derivatives 25 (12) (26) (13)Net debt 3,181 144 503 3,828
The Group loan to value (LTV) ratio at 31 March 2015 is 28%, being the principal value of gross debt of £3,717m, less the relevant portion of borrowings of the partly-owned subsidiary of £200m less cash and short-term deposits of £98m (being £108m less the relevant proportion of cash and deposits of the partly-owned subsidiary of £10m), divided by total Group property of £9,509m (see note 11) plus investments in joint ventures and funds of £2,901m (see note 12) and other investments of £379m (see note 13) less the relevant portion of property and investments of the partly-owned subsidiary of £528m.
2013£m
Cash flow£m
Non cash£m
2014£m
Per cash flow statement:Cash and short-term deposits (135) (7) – (142)Cash and cash equivalents (135) (7) – (142)
Term debt (excluding overdrafts) 2,178 620 500 3,298 Fair value of interest rate derivatives (6) (16) 47 25 Net debt 2,037 597 547 3,181
Comparison of market values and book values
2015 2014
Level
Market value
£m
Book value
£mDifference
£m
Market value
£m
Book value
£mDifference
£m
Debentures and unsecured bonds 2 1,925 1,785 140 1,722 1,713 9Convertible bond 1 493 493 – 458 458 –Bank debt and other floating rate debt 2 1,691 1,671 20 1,138 1,127 11Cash and short-term deposits 1 (108) (108) – (142) (142) –
4,001 3,841 160 3,176 3,156 20Other financial (assets) liabilities:
– interest rate derivative assets 2 (139) (139) – (32) (32) –– interest rate derivative liabilities 2 126 126 – 57 57 –
(13) (13) – 25 25 –Total 3,988 3,828 160 3,201 3,181 20
Short-term debtors and creditors have been excluded from the disclosures.
The fair values of debt, debentures and the convertible bond have been established by obtaining quoted market prices from brokers. The bank debt and loan notes have been valued assuming they could be renegotiated at contracted margins. The derivatives have been valued by calculating the present value of expected future cash flows, using appropriate market discount rates, by an independent treasury advisor.
151British Land Annual Report and Accounts 2015
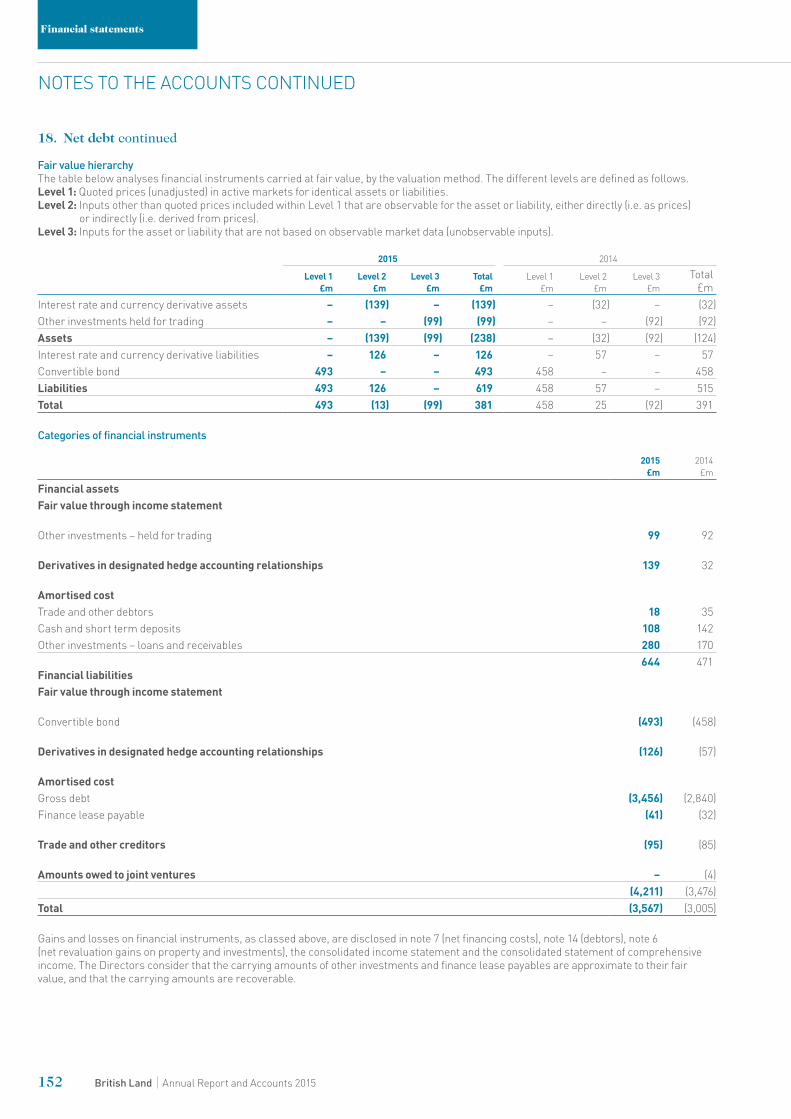
Financial statements
18. Net debt continued
Fair value hierarchyThe table below analyses financial instruments carried at fair value, by the valuation method. The different levels are defined as follows.Level 1: Quoted prices (unadjusted) in active markets for identical assets or liabilities.Level 2: Inputs other than quoted prices included within Level 1 that are observable for the asset or liability, either directly (i.e. as prices)
or indirectly (i.e. derived from prices).Level 3: Inputs for the asset or liability that are not based on observable market data (unobservable inputs).
2015 2014
Level 1£m
Level 2£m
Level 3£m
Total £m
Level 1£m
Level 2£m
Level 3£m
Total £m
Interest rate and currency derivative assets – (139) – (139) – (32) – (32)Other investments held for trading – – (99) (99) – – (92) (92)Assets – (139) (99) (238) – (32) (92) (124)Interest rate and currency derivative liabilities – 126 – 126 – 57 – 57Convertible bond 493 – – 493 458 – – 458Liabilities 493 126 – 619 458 57 – 515Total 493 (13) (99) 381 458 25 (92) 391
Categories of financial instruments
2015£m
2014£m
Financial assetsFair value through income statement
Other investments – held for trading 99 92
Derivatives in designated hedge accounting relationships 139 32
Amortised costTrade and other debtors 18 35Cash and short term deposits 108 142Other investments – loans and receivables 280 170
644 471Financial liabilitiesFair value through income statement
Convertible bond (493) (458)
Derivatives in designated hedge accounting relationships (126) (57)
Amortised costGross debt (3,456) (2,840)Finance lease payable (41) (32)
Trade and other creditors (95) (85)
Amounts owed to joint ventures – (4)(4,211) (3,476)
Total (3,567) (3,005)
Gains and losses on financial instruments, as classed above, are disclosed in note 7 (net financing costs), note 14 (debtors), note 6 (net revaluation gains on property and investments), the consolidated income statement and the consolidated statement of comprehensive income. The Directors consider that the carrying amounts of other investments and finance lease payables are approximate to their fair value, and that the carrying amounts are recoverable.
152 British Land Annual Report and Accounts 2015
NOTES TO THE ACCOUNTS CONTINUED
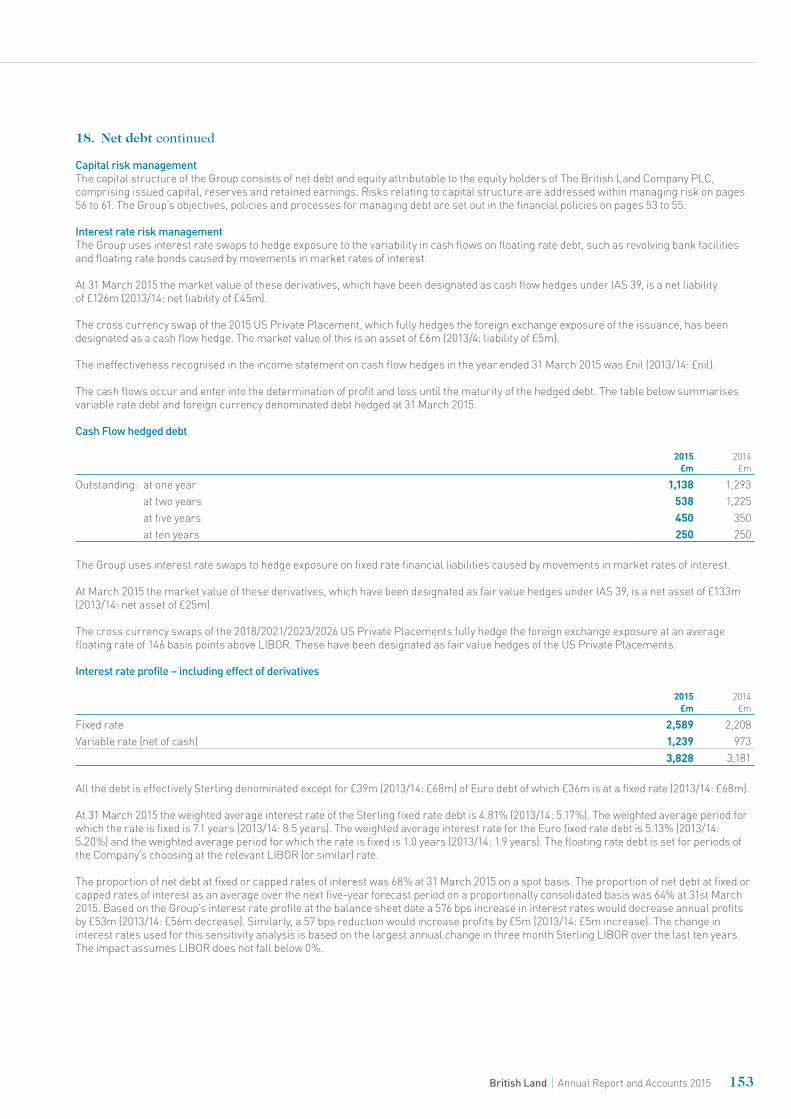
18. Net debt continued
Capital risk managementThe capital structure of the Group consists of net debt and equity attributable to the equity holders of The British Land Company PLC, comprising issued capital, reserves and retained earnings. Risks relating to capital structure are addressed within managing risk on pages 56 to 61. The Group’s objectives, policies and processes for managing debt are set out in the financial policies on pages 53 to 55.
Interest rate risk managementThe Group uses interest rate swaps to hedge exposure to the variability in cash flows on floating rate debt, such as revolving bank facilities and floating rate bonds caused by movements in market rates of interest.
At 31 March 2015 the market value of these derivatives, which have been designated as cash flow hedges under IAS 39, is a net liability of £126m (2013/14: net liability of £45m).
The cross currency swap of the 2015 US Private Placement, which fully hedges the foreign exchange exposure of the issuance, has been designated as a cash flow hedge. The market value of this is an asset of £6m (2013/4: liability of £5m).
The ineffectiveness recognised in the income statement on cash flow hedges in the year ended 31 March 2015 was £nil (2013/14: £nil).
The cash flows occur and enter into the determination of profit and loss until the maturity of the hedged debt. The table below summarises variable rate debt and foreign currency denominated debt hedged at 31 March 2015.
Cash Flow hedged debt
2015 £m
2014 £m
Outstanding: at one year 1,138 1,293at two years 538 1,225 at five years 450 350at ten years 250 250
The Group uses interest rate swaps to hedge exposure on fixed rate financial liabilities caused by movements in market rates of interest.
At March 2015 the market value of these derivatives, which have been designated as fair value hedges under IAS 39, is a net asset of £133m (2013/14: net asset of £25m).
The cross currency swaps of the 2018/2021/2023/2026 US Private Placements fully hedge the foreign exchange exposure at an average floating rate of 146 basis points above LIBOR. These have been designated as fair value hedges of the US Private Placements.
Interest rate profile – including effect of derivatives
2015 £m
2014 £m
Fixed rate 2,589 2,208 Variable rate (net of cash) 1,239 973
3,828 3,181
All the debt is effectively Sterling denominated except for £39m (2013/14: £68m) of Euro debt of which £36m is at a fixed rate (2013/14: £68m).
At 31 March 2015 the weighted average interest rate of the Sterling fixed rate debt is 4.81% (2013/14: 5.17%). The weighted average period for which the rate is fixed is 7.1 years (2013/14: 8.5 years). The weighted average interest rate for the Euro fixed rate debt is 5.13% (2013/14: 5.20%) and the weighted average period for which the rate is fixed is 1.0 years (2013/14: 1.9 years). The floating rate debt is set for periods of the Company’s choosing at the relevant LIBOR (or similar) rate.
The proportion of net debt at fixed or capped rates of interest was 68% at 31 March 2015 on a spot basis. The proportion of net debt at fixed or capped rates of interest as an average over the next five-year forecast period on a proportionally consolidated basis was 64% at 31st March 2015. Based on the Group’s interest rate profile at the balance sheet date a 576 bps increase in interest rates would decrease annual profits by £53m (2013/14: £56m decrease). Similarly, a 57 bps reduction would increase profits by £5m (2013/14: £5m increase). The change in interest rates used for this sensitivity analysis is based on the largest annual change in three month Sterling LIBOR over the last ten years. The impact assumes LIBOR does not fall below 0%.
153British Land Annual Report and Accounts 2015
Financial statements
18. Net debt continued
Upward movements in medium and long term interest rates, associated with higher interest rate expectations, increase the value of the Group’s interest rate swaps that provide protection against such moves. The converse is true for downward movements in the yield curve. The majority of the Group’s interest rate swaps which provide such protection qualify as effective cash flow hedges under IAS 39 therefore movements in the fair value are recognised directly in equity rather than the income statement. A 204 bps shift represents the largest annual change in the seven-year Sterling swap rate over the last ten years. At 31 March 2015 a 204 bps parallel upward shift in swap rates would increase the value of these interest rate swaps by £151m (2013/4: £136m). A 204 bps downward shift in swap rates would reduce the value of the interest rate swap portfolio by £155m (2013/14: 164m). Because the interest rate swaps are matched by floating rate debt, the overall effect on Group cash flows of such movements is minimal.
The 1.5% Convertible Bond is designated as fair value through profit or loss. Principal components of the market value include British Land’s share price and its volatility, and market interest rates. The fair value at 31 March 2015 was £493m. At 31 March 2015 a 204 bps parallel upward shift in interest rates would reduce the fair value by £24.6m, and a 204 bps downward shift in interest rates would increase the value by £26.2m.
Foreign currency risk managementThe Group’s policy is to have no material unhedged net assets or liabilities denominated in foreign currencies. The currency risk on overseas investments is hedged via foreign currency denominated borrowings and derivatives. The Group has adopted net investment hedging in accordance with IAS 39 and therefore the portion of the gain or loss on the hedging instrument that is determined to be an effective hedge is recognised directly in equity. The ineffective portion of the gain or loss on the hedging instrument is recognised immediately in the income statement.
The table below shows the carrying amounts of the Group’s foreign currency denominated assets and liabilities. Provided contingent tax on overseas investments is not expected to occur it will be ignored for hedging purposes, as will the requirement to fair value interest rate swaps. Based on the 31 March 2015 position a 33% appreciation (largest annual change over the last ten years) in the Euro relative to Sterling would result in a £nil change (2013/14: £nil) in reported profits.
Assets Liabilities2015
£m2014
£m2015
£m2014
£m
Euro denominated 39 69 39 68
Credit risk managementThe Group’s approach to credit risk management of counterparties is referred to in the financial policies on pages 53 to 55 and the risks addressed within managing risk on pages 56 to 61. The carrying amount of financial assets recorded in the financial statements represents the Group’s maximum exposure to credit risk without taking account of the value of any collateral obtained.
Cash and short term deposits at 31 March 2015 amounted to £108m (2013/14: £142m). Deposits and interest rate deposits were placed with financial institutions with A- or better credit ratings.
At 31 March 2015, the fair value of all interest rate derivative assets was £139m (2013/14: £32m).
At 31 March 2015, prior to taking into account any offset arrangements, the largest combined credit exposure to a single counterparty arising from money market deposits, liquid investments and derivatives was £59m (2013/14: £71m). This represents 0.5% (2013/14: 0.7%) of gross assets.
The deposit exposures are with UK and international high street banks and branches.
The Group’s exposure to credit risk in respect of its trade receivables is analysed in note 14.
Provisions are made taking account historic credit losses and the creditworthiness of debtors.
Liquidity risk managementThe Group’s approach to liquidity risk management is discussed in the financial policies on pages 53 to 55, and the risks addressed within managing risk on pages 56 to 61.
The table on page 155 presents a maturity profile of the contracted undiscounted cash flows of financial liabilities based on the earliest date on which the Group can be required to pay. The table includes both interest and principal flows. Where the interest payable is not fixed, the amount disclosed has been determined by reference to the projected interest rates implied by yield curves at the reporting date. For derivative financial instruments that settle on a net basis (e.g. interest rate swaps) the undiscounted net cash flows are shown and for derivatives that require gross settlement (e.g. cross currency swaps) the undiscounted gross cash flows are presented. Where payment obligations are in foreign currencies, the spot exchange rate ruling at the balance sheet date is used. Trade creditors and amounts owed to joint ventures, which are repayable within one year, have been excluded from the analysis.
The Group expects to meet its financial liabilities through the various available liquidity sources, including a secure rental income profile, asset sales, undrawn committed borrowing facilities and, in the longer term, debt refinancings.
154 British Land Annual Report and Accounts 2015
NOTES TO THE ACCOUNTS CONTINUED
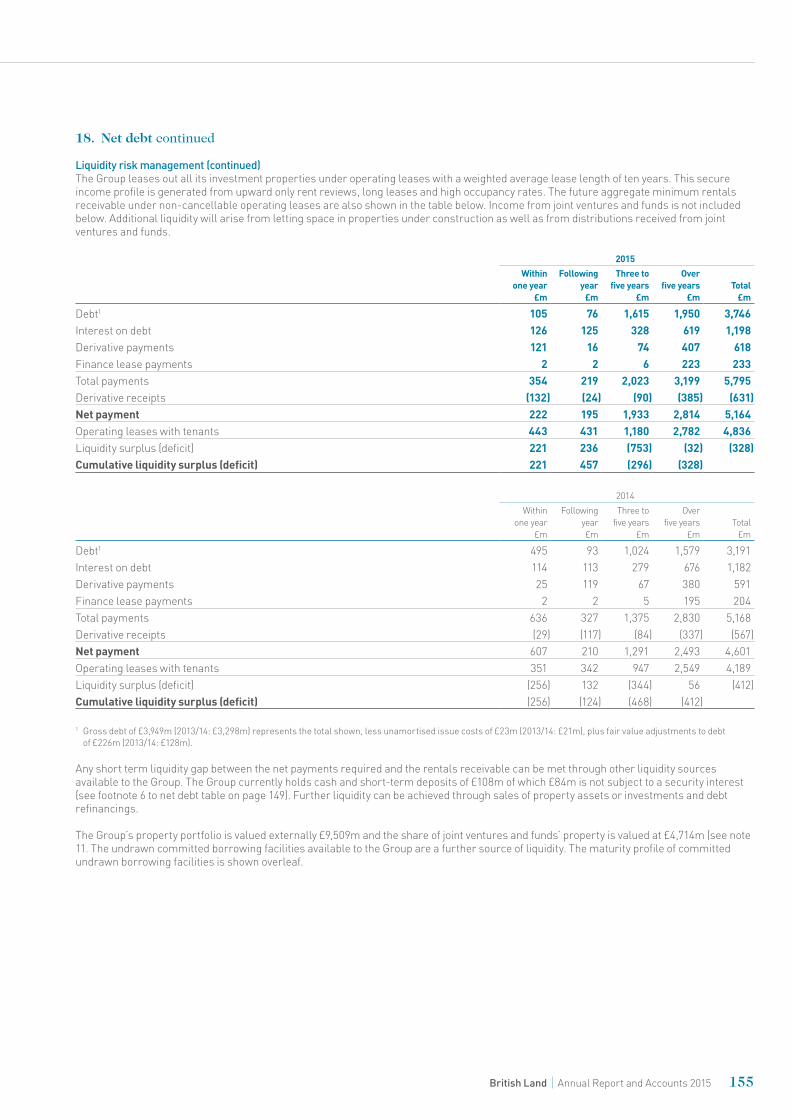
18. Net debt continued
Liquidity risk management (continued)The Group leases out all its investment properties under operating leases with a weighted average lease length of ten years. This secure income profile is generated from upward only rent reviews, long leases and high occupancy rates. The future aggregate minimum rentals receivable under non-cancellable operating leases are also shown in the table below. Income from joint ventures and funds is not included below. Additional liquidity will arise from letting space in properties under construction as well as from distributions received from joint ventures and funds.
2015Within
one year £m
Following year
£m
Three to five years
£m
Over five years
£mTotal
£m
Debt1 105 76 1,615 1,950 3,746Interest on debt 126 125 328 619 1,198Derivative payments 121 16 74 407 618Finance lease payments 2 2 6 223 233Total payments 354 219 2,023 3,199 5,795Derivative receipts (132) (24) (90) (385) (631)Net payment 222 195 1,933 2,814 5,164Operating leases with tenants 443 431 1,180 2,782 4,836Liquidity surplus (deficit) 221 236 (753) (32) (328)Cumulative liquidity surplus (deficit) 221 457 (296) (328)
2014Within
one year £m
Following year£m
Three to five years
£m
Over five years
£mTotal
£m
Debt1 495 93 1,024 1,579 3,191Interest on debt 114 113 279 676 1,182Derivative payments 25 119 67 380 591Finance lease payments 2 2 5 195 204Total payments 636 327 1,375 2,830 5,168Derivative receipts (29) (117) (84) (337) (567)Net payment 607 210 1,291 2,493 4,601Operating leases with tenants 351 342 947 2,549 4,189Liquidity surplus (deficit) (256) 132 (344) 56 (412)Cumulative liquidity surplus (deficit) (256) (124) (468) (412)
1 Gross debt of £3,949m (2013/14: £3,298m) represents the total shown, less unamortised issue costs of £23m (2013/14: £21m), plus fair value adjustments to debt of £226m (2013/14: £128m).
Any short term liquidity gap between the net payments required and the rentals receivable can be met through other liquidity sources available to the Group. The Group currently holds cash and short-term deposits of £108m of which £84m is not subject to a security interest (see footnote 6 to net debt table on page 149). Further liquidity can be achieved through sales of property assets or investments and debt refinancings.
The Group’s property portfolio is valued externally £9,509m and the share of joint ventures and funds’ property is valued at £4,714m (see note 11. The undrawn committed borrowing facilities available to the Group are a further source of liquidity. The maturity profile of committed undrawn borrowing facilities is shown overleaf.
155British Land Annual Report and Accounts 2015
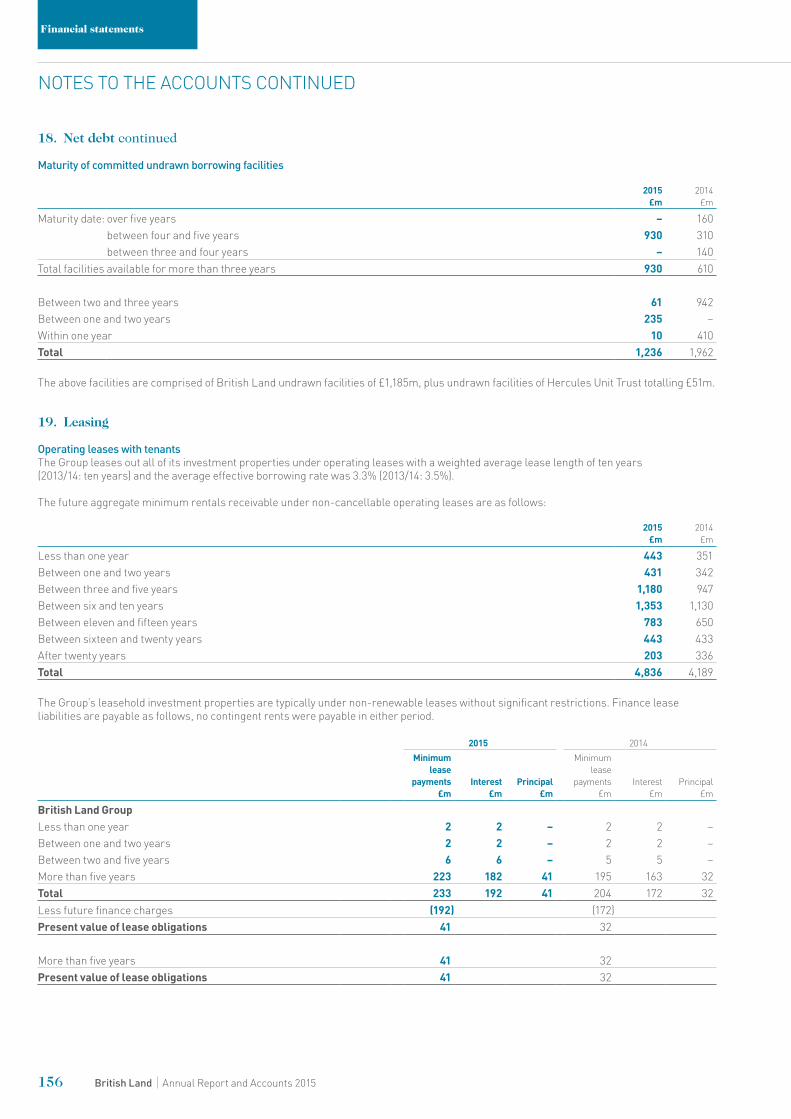
Financial statements
18. Net debt continued
Maturity of committed undrawn borrowing facilities
2015 £m
2014 £m
Maturity date: over five years – 160 between four and five years 930 310 between three and four years – 140
Total facilities available for more than three years 930 610
Between two and three years 61 942 Between one and two years 235 – Within one year 10 410 Total 1,236 1,962
The above facilities are comprised of British Land undrawn facilities of £1,185m, plus undrawn facilities of Hercules Unit Trust totalling £51m.
19. Leasing
Operating leases with tenantsThe Group leases out all of its investment properties under operating leases with a weighted average lease length of ten years (2013/14: ten years) and the average effective borrowing rate was 3.3% (2013/14: 3.5%).
The future aggregate minimum rentals receivable under non-cancellable operating leases are as follows:
2015 £m
2014 £m
Less than one year 443 351 Between one and two years 431 342 Between three and five years 1,180 947 Between six and ten years 1,353 1,130 Between eleven and fifteen years 783 650 Between sixteen and twenty years 443 433 After twenty years 203 336 Total 4,836 4,189
The Group’s leasehold investment properties are typically under non-renewable leases without significant restrictions. Finance lease liabilities are payable as follows, no contingent rents were payable in either period.
2015 2014Minimum
lease payments
£mInterest
£mPrincipal
£m
Minimum lease
payments £m
Interest £m
Principal £m
British Land GroupLess than one year 2 2 – 2 2 –Between one and two years 2 2 – 2 2 –Between two and five years 6 6 – 5 5 –More than five years 223 182 41 195 163 32Total 233 192 41 204 172 32Less future finance charges (192) (172)Present value of lease obligations 41 32
More than five years 41 32Present value of lease obligations 41 32
156 British Land Annual Report and Accounts 2015
NOTES TO THE ACCOUNTS CONTINUED
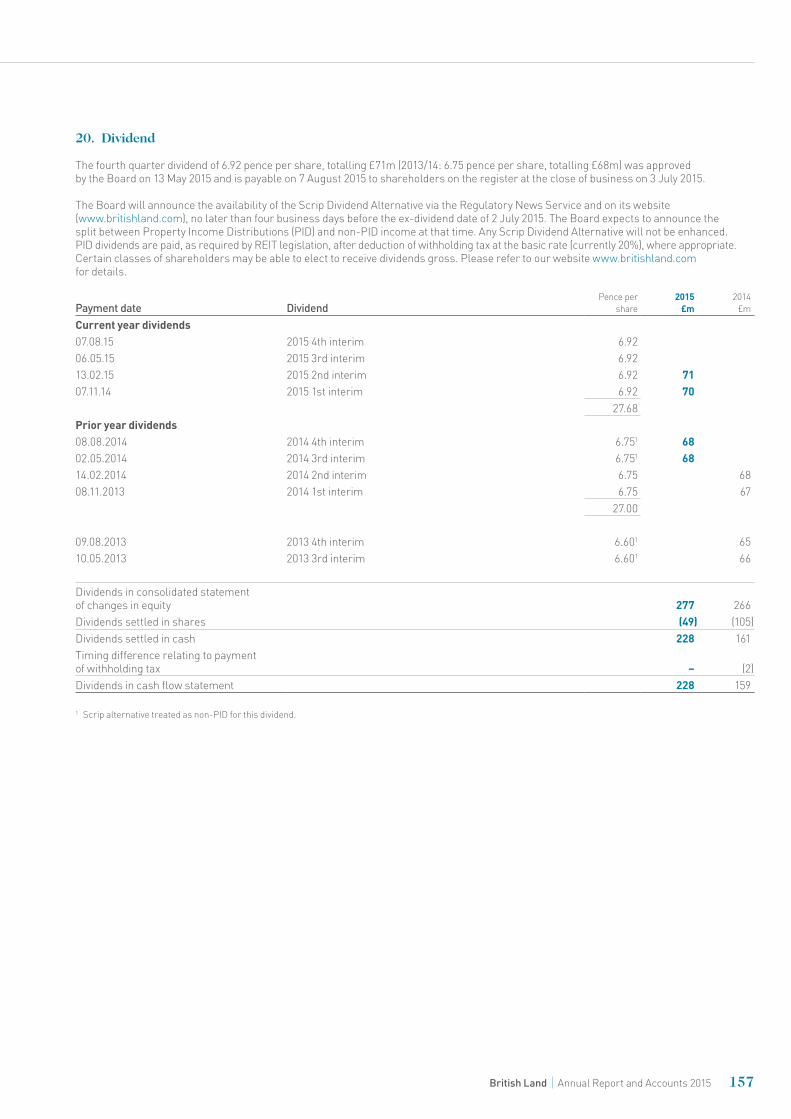
20. Dividend
The fourth quarter dividend of 6.92 pence per share, totalling £71m (2013/14: 6.75 pence per share, totalling £68m) was approved by the Board on 13 May 2015 and is payable on 7 August 2015 to shareholders on the register at the close of business on 3 July 2015.
The Board will announce the availability of the Scrip Dividend Alternative via the Regulatory News Service and on its website (www.britishland.com), no later than four business days before the ex-dividend date of 2 July 2015. The Board expects to announce the split between Property Income Distributions (PID) and non-PID income at that time. Any Scrip Dividend Alternative will not be enhanced. PID dividends are paid, as required by REIT legislation, after deduction of withholding tax at the basic rate (currently 20%), where appropriate. Certain classes of shareholders may be able to elect to receive dividends gross. Please refer to our website www.britishland.com for details.
Payment date DividendPence per
share2015
£m2014
£m
Current year dividends07.08.15 2015 4th interim 6.92 06.05.15 2015 3rd interim 6.92 13.02.15 2015 2nd interim 6.92 71 07.11.14 2015 1st interim 6.92 70
27.68 Prior year dividends08.08.2014 2014 4th interim 6.751 68 02.05.2014 2014 3rd interim 6.751 68 14.02.2014 2014 2nd interim 6.75 68 08.11.2013 2014 1st interim 6.75 67
27.00
09.08.2013 2013 4th interim 6.601 6510.05.2013 2013 3rd interim 6.601 66
Dividends in consolidated statement of changes in equity 277 266 Dividends settled in shares (49) (105)Dividends settled in cash 228 161 Timing difference relating to payment of withholding tax – (2)Dividends in cash flow statement 228 159
1 Scrip alternative treated as non-PID for this dividend.
157British Land Annual Report and Accounts 2015

Financial statements
21. Acquisition of subsidiaries (business combinations)
Acquisition of Tesco BL Holdings Limited and TBL Property Partnership
On 19 March 2015, the Group acquired the 50% interest in Tesco BL Holdings Limited (TBLH) and TBL Property Partnership (TBL) which were previously owned by Tesco PLC. This resulted in ownership of 100% of the entities. Management determined that the acquisitions should be accounted for as a business combination in accordance with IFRS 3 ‘Business Combinations’.
The fair value of the Group’s 50% equity interest in TBLH and TBL held before the business combination amounted to £149m and £29m respectively. A gain of £5m was recognised as a result of re-measuring the equity interest in TBLH to fair value and a gain of £1m was recognised as a result of re-measuring the equity interest in TBL to fair value as part of the business combinations.
The acquired subsidiaries have contributed net revenues of £1m and underlying profit of £1m to the Group for the period from the date of acquisition to 31 March 2015. If the acquisition had occurred on 1 April 2014, Group net revenue for 2015 would have increased by £37m, and underlying profit for 2015 would have increased by £12m.
The purchase of TBLH and TBL was completed at the same time as the sale of the Group’s interest in the Tesco Aqua Limited Partnership (‘Aqua’). The consideration paid for TBLH and TBL was net of the sale consideration receivable for Aqua and the settlement of the Group’s shareholder loan to Aqua. A reconciliation of the consideration is shown below:
Attributed fair value Total
TBLH£m
TBL£m £m
Investment Property 639 118 757Other net current (liabilities) assets (11) 5 (6)Cash and cash equivalents 7 2 9Loans (337) (61) (398)Fair value of acquired interest in net assets of subsidiary 298 64 362Goodwill – – –Total purchase consideration 298 64 362Less: Fair value of previously held interest (149) (29) (178)Consideration 149 35 184Less: cash acquired (7) (2) (9)Net consideration 142 33 175
Represented by:Cash 102Cash acquired (9)Settlement of Aqua shareholder loan 35Disposal of interest in Aqua 47Net consideration 175
The acquired bank loans and overdrafts in TBLH and TBL have no recourse to other companies or assets in the Group. On 20 March 2015 the £60m secured facility acquired with TBL was repaid.
Acquisition of Speke Unit Trust
On 23 February 2015, the Group acquired an additional 37.5% of the units in the Speke Unit Trust, a unit trust registered in Jersey, which is engaged in property investment, resulting in cumulative ownership of 87.5% of the outstanding units and control of the underlying entity. Management determined that the acquisition of control should be accounted for as a business combination in accordance with IFRS 3 ‘Business Combinations’
The fair value of the Group’s 50% equity interest in the Speke Unit Trust held before the business combination amounted to £122m. No gain or loss was recognised as a result of re-measuring the equity interest at fair value.
The acquired subsidiary has contributed net rents of £1m and underlying profit of £1m to the Group for the period from the date of acquisition to 31 March 2015. If the acquisition had occurred on 1 April 2014, Group net rents for 2015 would have increased by £15m, and underlying profit for 2015 would have increased by £7m.
The purchase consideration disclosed below comprises cash and cash equivalents paid to the acquiree’s previous owner of £93m for 37.5% of the units in the Speke Unit Trust.
158 British Land Annual Report and Accounts 2015
NOTES TO THE ACCOUNTS CONTINUED
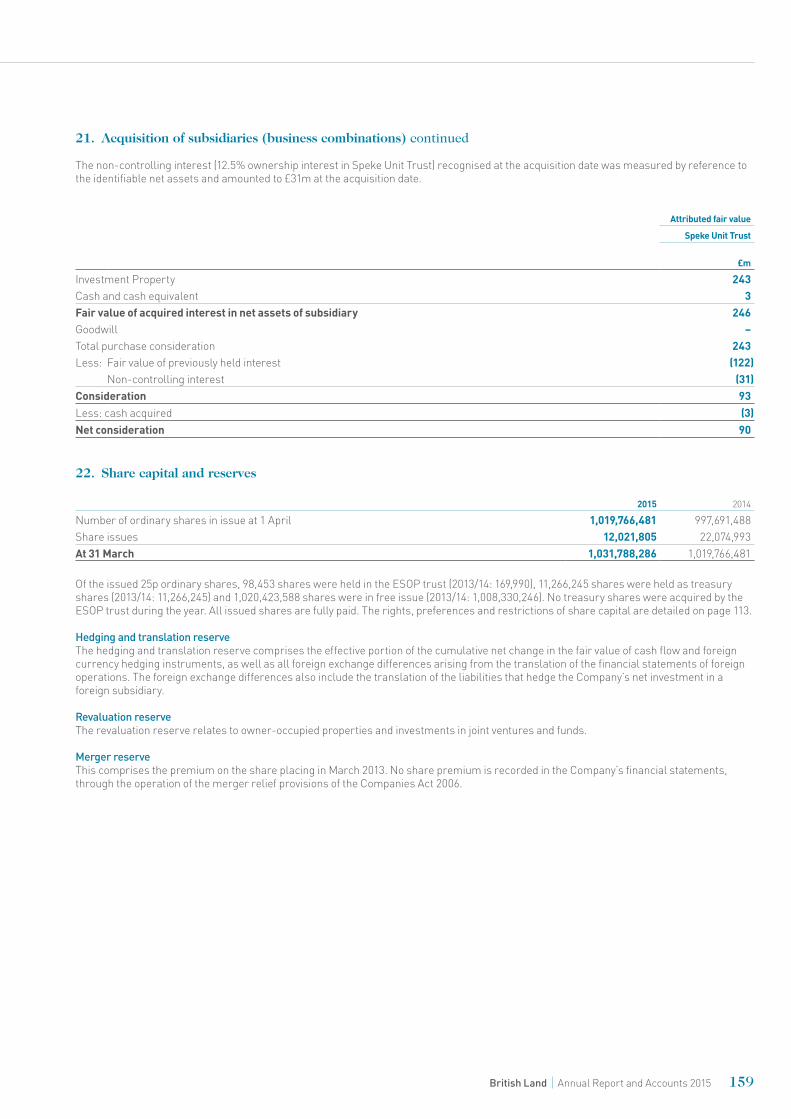
21. Acquisition of subsidiaries (business combinations) continued
The non-controlling interest (12.5% ownership interest in Speke Unit Trust) recognised at the acquisition date was measured by reference to the identifiable net assets and amounted to £31m at the acquisition date.
Attributed fair value
Speke Unit Trust
£m
Investment Property 243Cash and cash equivalent 3Fair value of acquired interest in net assets of subsidiary 246Goodwill –Total purchase consideration 243Less: Fair value of previously held interest (122)
Non-controlling interest (31)Consideration 93Less: cash acquired (3)Net consideration 90
22. Share capital and reserves
2015 2014
Number of ordinary shares in issue at 1 April 1,019,766,481 997,691,488Share issues 12,021,805 22,074,993At 31 March 1,031,788,286 1,019,766,481
Of the issued 25p ordinary shares, 98,453 shares were held in the ESOP trust (2013/14: 169,990), 11,266,245 shares were held as treasury shares (2013/14: 11,266,245) and 1,020,423,588 shares were in free issue (2013/14: 1,008,330,246). No treasury shares were acquired by the ESOP trust during the year. All issued shares are fully paid. The rights, preferences and restrictions of share capital are detailed on page 113.
Hedging and translation reserveThe hedging and translation reserve comprises the effective portion of the cumulative net change in the fair value of cash flow and foreign currency hedging instruments, as well as all foreign exchange differences arising from the translation of the financial statements of foreign operations. The foreign exchange differences also include the translation of the liabilities that hedge the Company’s net investment in a foreign subsidiary.
Revaluation reserveThe revaluation reserve relates to owner-occupied properties and investments in joint ventures and funds.
Merger reserveThis comprises the premium on the share placing in March 2013. No share premium is recorded in the Company’s financial statements, through the operation of the merger relief provisions of the Companies Act 2006.
159British Land Annual Report and Accounts 2015
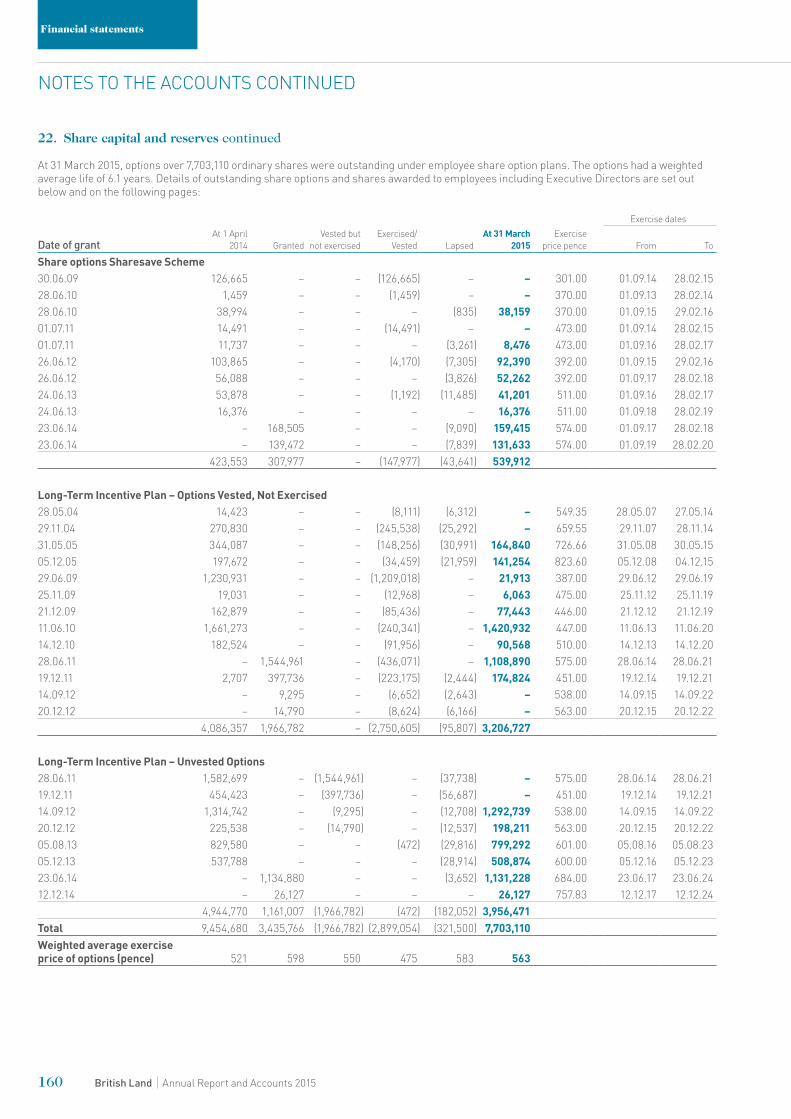
Financial statements
22. Share capital and reserves continued
At 31 March 2015, options over 7,703,110 ordinary shares were outstanding under employee share option plans. The options had a weighted average life of 6.1 years. Details of outstanding share options and shares awarded to employees including Executive Directors are set out below and on the following pages:
Exercise dates
Date of grantAt 1 April
2014 GrantedVested but
not exercisedExercised/
Vested LapsedAt 31 March
2015Exercise
price pence From To
Share options Sharesave Scheme30.06.09 126,665 – – (126,665) – – 301.00 01.09.14 28.02.1528.06.10 1,459 – – (1,459) – – 370.00 01.09.13 28.02.1428.06.10 38,994 – – – (835) 38,159 370.00 01.09.15 29.02.1601.07.11 14,491 – – (14,491) – – 473.00 01.09.14 28.02.1501.07.11 11,737 – – – (3,261) 8,476 473.00 01.09.16 28.02.1726.06.12 103,865 – – (4,170) (7,305) 92,390 392.00 01.09.15 29.02.1626.06.12 56,088 – – – (3,826) 52,262 392.00 01.09.17 28.02.1824.06.13 53,878 – – (1,192) (11,485) 41,201 511.00 01.09.16 28.02.1724.06.13 16,376 – – – – 16,376 511.00 01.09.18 28.02.1923.06.14 – 168,505 – – (9,090) 159,415 574.00 01.09.17 28.02.1823.06.14 – 139,472 – – (7,839) 131,633 574.00 01.09.19 28.02.20
423,553 307,977 – (147,977) (43,641) 539,912
Long-Term Incentive Plan – Options Vested, Not Exercised28.05.04 14,423 – – (8,111) (6,312) – 549.35 28.05.07 27.05.1429.11.04 270,830 – – (245,538) (25,292) – 659.55 29.11.07 28.11.1431.05.05 344,087 – – (148,256) (30,991) 164,840 726.66 31.05.08 30.05.1505.12.05 197,672 – – (34,459) (21,959) 141,254 823.60 05.12.08 04.12.1529.06.09 1,230,931 – – (1,209,018) – 21,913 387.00 29.06.12 29.06.1925.11.09 19,031 – – (12,968) – 6,063 475.00 25.11.12 25.11.1921.12.09 162,879 – – (85,436) – 77,443 446.00 21.12.12 21.12.1911.06.10 1,661,273 – – (240,341) – 1,420,932 447.00 11.06.13 11.06.2014.12.10 182,524 – – (91,956) – 90,568 510.00 14.12.13 14.12.2028.06.11 – 1,544,961 – (436,071) – 1,108,890 575.00 28.06.14 28.06.2119.12.11 2,707 397,736 – (223,175) (2,444) 174,824 451.00 19.12.14 19.12.2114.09.12 – 9,295 – (6,652) (2,643) – 538.00 14.09.15 14.09.2220.12.12 – 14,790 – (8,624) (6,166) – 563.00 20.12.15 20.12.22
4,086,357 1,966,782 – (2,750,605) (95,807) 3,206,727
Long-Term Incentive Plan – Unvested Options28.06.11 1,582,699 – (1,544,961) – (37,738) – 575.00 28.06.14 28.06.2119.12.11 454,423 – (397,736) – (56,687) – 451.00 19.12.14 19.12.2114.09.12 1,314,742 – (9,295) – (12,708) 1,292,739 538.00 14.09.15 14.09.2220.12.12 225,538 – (14,790) – (12,537) 198,211 563.00 20.12.15 20.12.2205.08.13 829,580 – – (472) (29,816) 799,292 601.00 05.08.16 05.08.2305.12.13 537,788 – – – (28,914) 508,874 600.00 05.12.16 05.12.2323.06.14 – 1,134,880 – – (3,652) 1,131,228 684.00 23.06.17 23.06.2412.12.14 – 26,127 – – – 26,127 757.83 12.12.17 12.12.24
4,944,770 1,161,007 (1,966,782) (472) (182,052) 3,956,471Total 9,454,680 3,435,766 (1,966,782) (2,899,054) (321,500) 7,703,110Weighted average exercise price of options (pence) 521 598 550 475 583 563
160 British Land Annual Report and Accounts 2015
NOTES TO THE ACCOUNTS CONTINUED
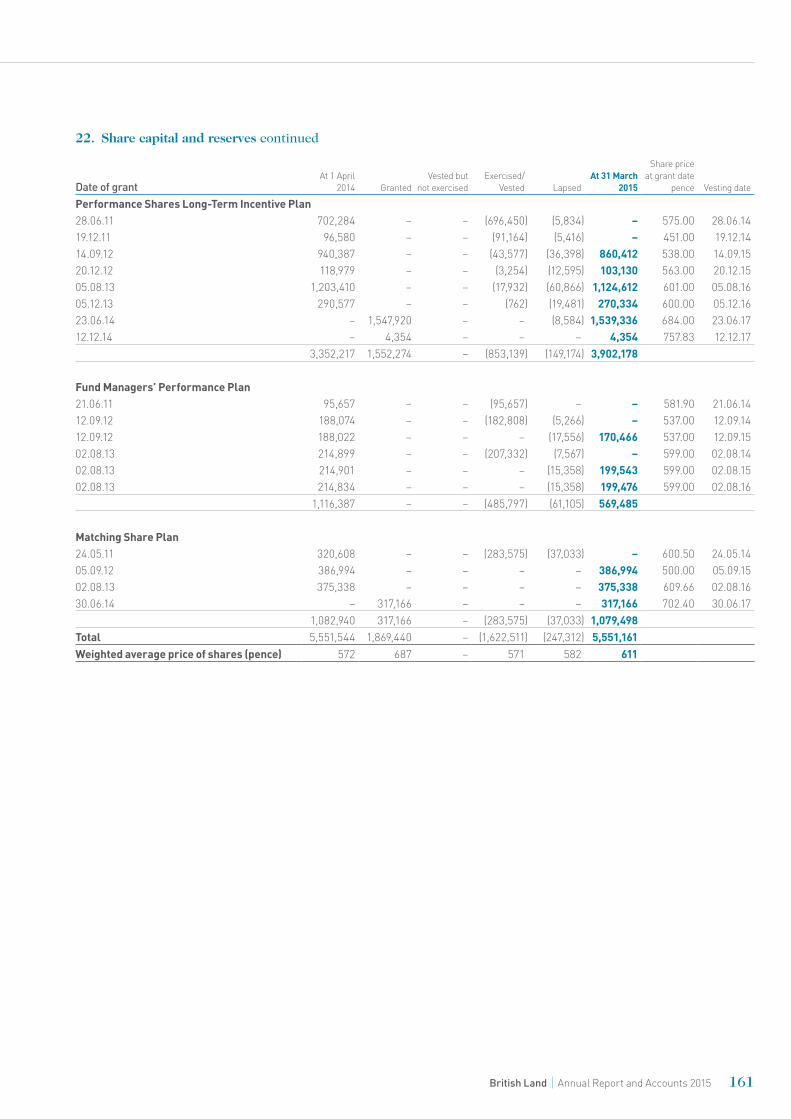
22. Share capital and reserves continued
Date of grantAt 1 April
2014 GrantedVested but
not exercisedExercised/
Vested LapsedAt 31 March
2015
Share price at grant date
pence Vesting date
Performance Shares Long-Term Incentive Plan28.06.11 702,284 – – (696,450) (5,834) – 575.00 28.06.1419.12.11 96,580 – – (91,164) (5,416) – 451.00 19.12.1414.09.12 940,387 – – (43,577) (36,398) 860,412 538.00 14.09.1520.12.12 118,979 – – (3,254) (12,595) 103,130 563.00 20.12.1505.08.13 1,203,410 – – (17,932) (60,866) 1,124,612 601.00 05.08.1605.12.13 290,577 – – (762) (19,481) 270,334 600.00 05.12.1623.06.14 – 1,547,920 – – (8,584) 1,539,336 684.00 23.06.1712.12.14 – 4,354 – – – 4,354 757.83 12.12.17
3,352,217 1,552,274 – (853,139) (149,174) 3,902,178
Fund Managers’ Performance Plan21.06.11 95,657 – – (95,657) – – 581.90 21.06.1412.09.12 188,074 – – (182,808) (5,266) – 537.00 12.09.1412.09.12 188,022 – – – (17,556) 170,466 537.00 12.09.1502.08.13 214,899 – – (207,332) (7,567) – 599.00 02.08.1402.08.13 214,901 – – – (15,358) 199,543 599.00 02.08.1502.08.13 214,834 – – – (15,358) 199,476 599.00 02.08.16
1,116,387 – – (485,797) (61,105) 569,485
Matching Share Plan24.05.11 320,608 – – (283,575) (37,033) – 600.50 24.05.1405.09.12 386,994 – – – – 386,994 500.00 05.09.1502.08.13 375,338 – – – – 375,338 609.66 02.08.1630.06.14 – 317,166 – – – 317,166 702.40 30.06.17
1,082,940 317,166 – (283,575) (37,033) 1,079,498Total 5,551,544 1,869,440 – (1,622,511) (247,312) 5,551,161Weighted average price of shares (pence) 572 687 – 571 582 611
161British Land Annual Report and Accounts 2015
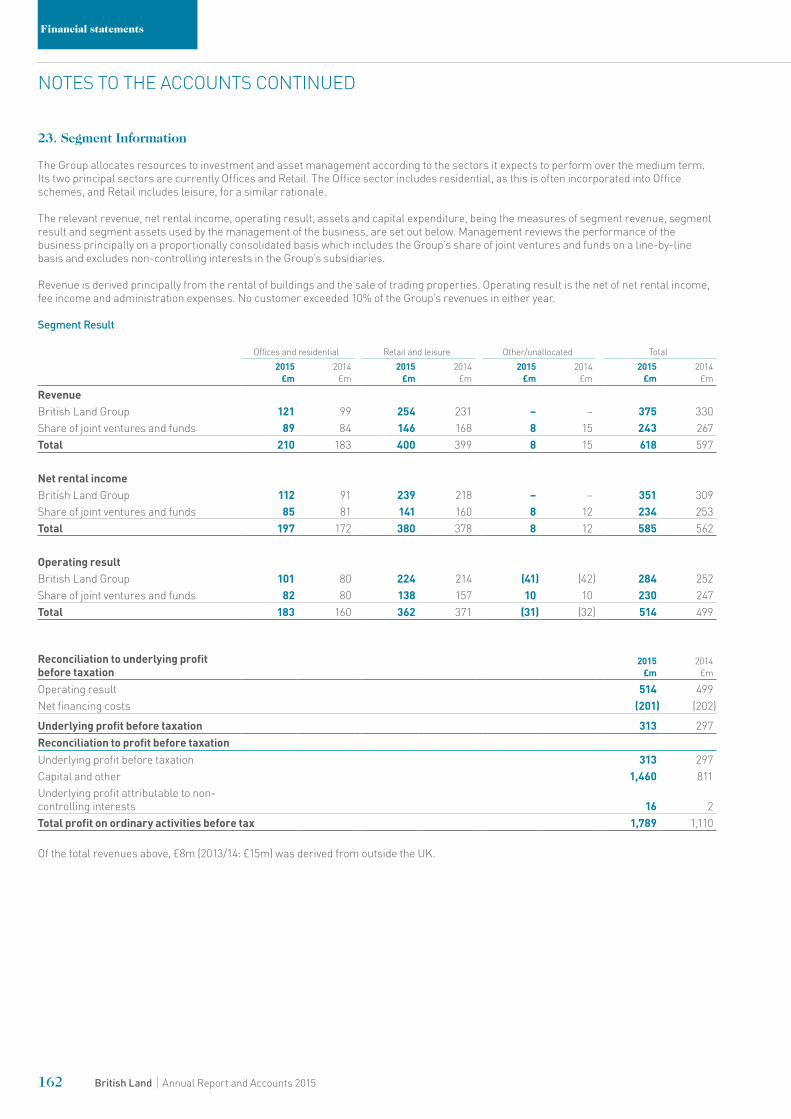
Financial statements
23. Segment Information
The Group allocates resources to investment and asset management according to the sectors it expects to perform over the medium term. Its two principal sectors are currently Offices and Retail. The Office sector includes residential, as this is often incorporated into Office schemes, and Retail includes leisure, for a similar rationale.
The relevant revenue, net rental income, operating result, assets and capital expenditure, being the measures of segment revenue, segment result and segment assets used by the management of the business, are set out below. Management reviews the performance of the business principally on a proportionally consolidated basis which includes the Group’s share of joint ventures and funds on a line-by-line basis and excludes non-controlling interests in the Group’s subsidiaries.
Revenue is derived principally from the rental of buildings and the sale of trading properties. Operating result is the net of net rental income, fee income and administration expenses. No customer exceeded 10% of the Group’s revenues in either year.
Segment Result
Offices and residential Retail and leisure Other/unallocated Total2015
£m2014
£m2015
£m2014
£m2015
£m2014
£m2015
£m2014
£m
RevenueBritish Land Group 121 99 254 231 – – 375 330Share of joint ventures and funds 89 84 146 168 8 15 243 267Total 210 183 400 399 8 15 618 597
Net rental incomeBritish Land Group 112 91 239 218 – – 351 309Share of joint ventures and funds 85 81 141 160 8 12 234 253Total 197 172 380 378 8 12 585 562
Operating resultBritish Land Group 101 80 224 214 (41) (42) 284 252Share of joint ventures and funds 82 80 138 157 10 10 230 247Total 183 160 362 371 (31) (32) 514 499
Reconciliation to underlying profit before taxation
2015£m
2014£m
Operating result 514 499 Net financing costs (201) (202)
Underlying profit before taxation 313 297Reconciliation to profit before taxationUnderlying profit before taxation 313 297Capital and other 1,460 811Underlying profit attributable to non-controlling interests 16 2Total profit on ordinary activities before tax 1,789 1,110
Of the total revenues above, £8m (2013/14: £15m) was derived from outside the UK.
162 British Land Annual Report and Accounts 2015
NOTES TO THE ACCOUNTS CONTINUED
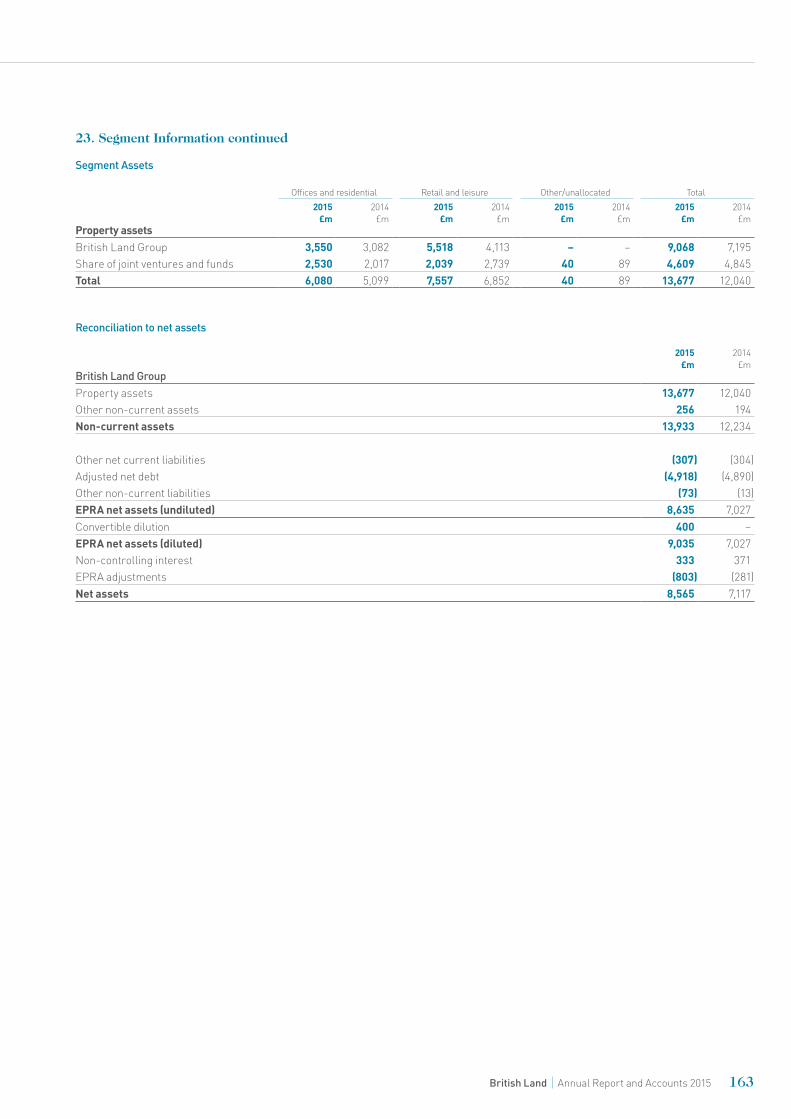
23. Segment Information continued
Segment Assets
Offices and residential Retail and leisure Other/unallocated Total2015
£m2014
£m2015
£m2014
£m2015
£m2014
£m2015
£m2014
£mProperty assetsBritish Land Group 3,550 3,082 5,518 4,113 – – 9,068 7,195Share of joint ventures and funds 2,530 2,017 2,039 2,739 40 89 4,609 4,845Total 6,080 5,099 7,557 6,852 40 89 13,677 12,040
Reconciliation to net assets
2015 £m
2014 £m
British Land Group
Property assets 13,677 12,040 Other non-current assets 256 194 Non-current assets 13,933 12,234
Other net current liabilities (307) (304)Adjusted net debt (4,918) (4,890)Other non-current liabilities (73) (13)EPRA net assets (undiluted) 8,635 7,027Convertible dilution 400 –EPRA net assets (diluted) 9,035 7,027Non-controlling interest 333 371EPRA adjustments (803) (281)Net assets 8,565 7,117
163British Land Annual Report and Accounts 2015
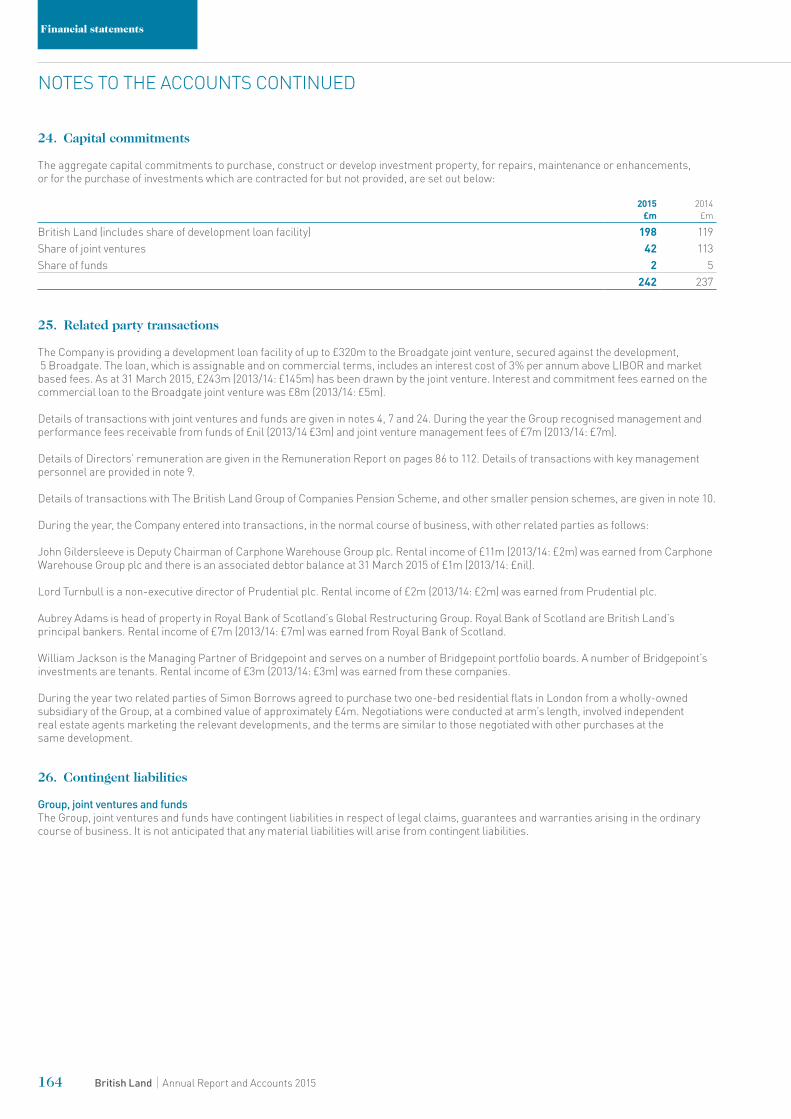
Financial statements
24. Capital commitments
The aggregate capital commitments to purchase, construct or develop investment property, for repairs, maintenance or enhancements, or for the purchase of investments which are contracted for but not provided, are set out below:
2015£m
2014£m
British Land (includes share of development loan facility) 198 119 Share of joint ventures 42 113 Share of funds 2 5
242 237
25. Related party transactions
The Company is providing a development loan facility of up to £320m to the Broadgate joint venture, secured against the development, 5 Broadgate. The loan, which is assignable and on commercial terms, includes an interest cost of 3% per annum above LIBOR and market based fees. As at 31 March 2015, £243m (2013/14: £145m) has been drawn by the joint venture. Interest and commitment fees earned on the commercial loan to the Broadgate joint venture was £8m (2013/14: £5m). Details of transactions with joint ventures and funds are given in notes 4, 7 and 24. During the year the Group recognised management and performance fees receivable from funds of £nil (2013/14 £3m) and joint venture management fees of £7m (2013/14: £7m).
Details of Directors’ remuneration are given in the Remuneration Report on pages 86 to 112. Details of transactions with key management personnel are provided in note 9.
Details of transactions with The British Land Group of Companies Pension Scheme, and other smaller pension schemes, are given in note 10.
During the year, the Company entered into transactions, in the normal course of business, with other related parties as follows:
John Gildersleeve is Deputy Chairman of Carphone Warehouse Group plc. Rental income of £11m (2013/14: £2m) was earned from Carphone Warehouse Group plc and there is an associated debtor balance at 31 March 2015 of £1m (2013/14: £nil).
Lord Turnbull is a non-executive director of Prudential plc. Rental income of £2m (2013/14: £2m) was earned from Prudential plc. Aubrey Adams is head of property in Royal Bank of Scotland’s Global Restructuring Group. Royal Bank of Scotland are British Land’s principal bankers. Rental income of £7m (2013/14: £7m) was earned from Royal Bank of Scotland. William Jackson is the Managing Partner of Bridgepoint and serves on a number of Bridgepoint portfolio boards. A number of Bridgepoint’s investments are tenants. Rental income of £3m (2013/14: £3m) was earned from these companies. During the year two related parties of Simon Borrows agreed to purchase two one-bed residential flats in London from a wholly-owned subsidiary of the Group, at a combined value of approximately £4m. Negotiations were conducted at arm’s length, involved independent real estate agents marketing the relevant developments, and the terms are similar to those negotiated with other purchases at the same development.
26. Contingent liabilities
Group, joint ventures and fundsThe Group, joint ventures and funds have contingent liabilities in respect of legal claims, guarantees and warranties arising in the ordinary course of business. It is not anticipated that any material liabilities will arise from contingent liabilities.
164 British Land Annual Report and Accounts 2015
NOTES TO THE ACCOUNTS CONTINUED
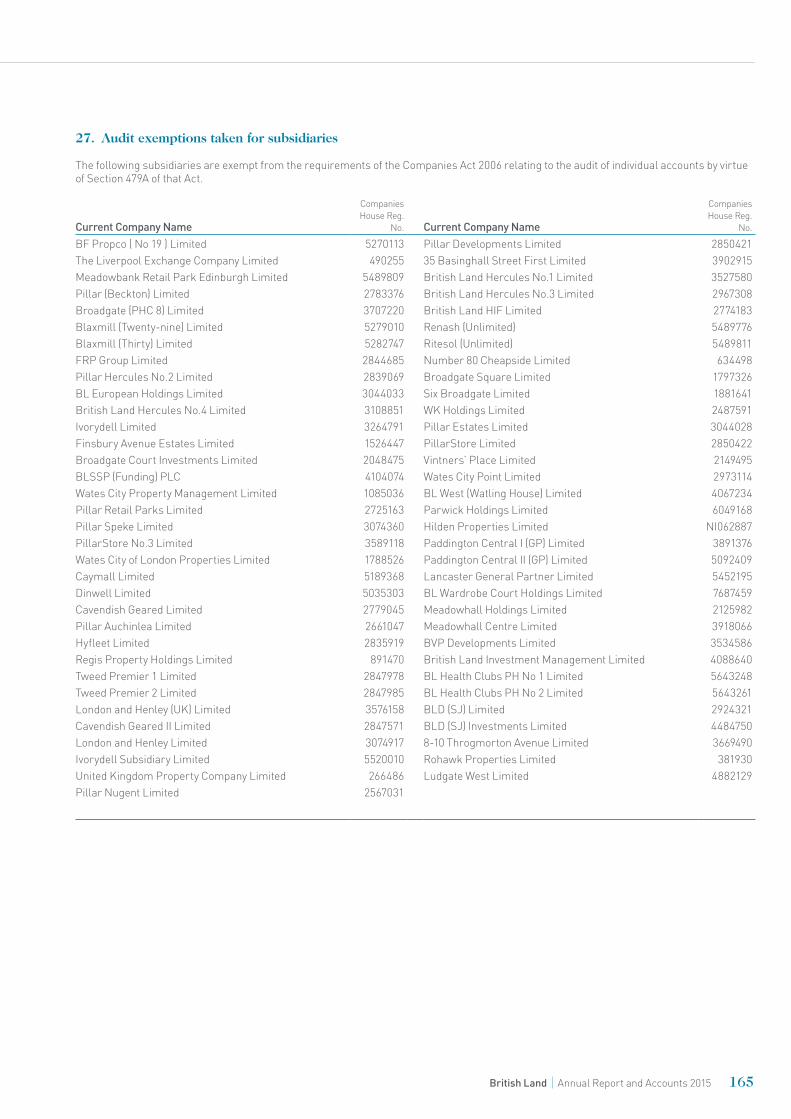
27. Audit exemptions taken for subsidiaries
The following subsidiaries are exempt from the requirements of the Companies Act 2006 relating to the audit of individual accounts by virtue of Section 479A of that Act.
Current Company Name
Companies House Reg.
No. Current Company Name
Companies House Reg.
No.
BF Propco ( No 19 ) Limited 5270113 Pillar Developments Limited 2850421The Liverpool Exchange Company Limited 490255 35 Basinghall Street First Limited 3902915Meadowbank Retail Park Edinburgh Limited 5489809 British Land Hercules No.1 Limited 3527580Pillar (Beckton) Limited 2783376 British Land Hercules No.3 Limited 2967308Broadgate (PHC 8) Limited 3707220 British Land HIF Limited 2774183Blaxmill (Twenty-nine) Limited 5279010 Renash (Unlimited) 5489776Blaxmill (Thirty) Limited 5282747 Ritesol (Unlimited) 5489811FRP Group Limited 2844685 Number 80 Cheapside Limited 634498Pillar Hercules No.2 Limited 2839069 Broadgate Square Limited 1797326BL European Holdings Limited 3044033 Six Broadgate Limited 1881641British Land Hercules No.4 Limited 3108851 WK Holdings Limited 2487591Ivorydell Limited 3264791 Pillar Estates Limited 3044028Finsbury Avenue Estates Limited 1526447 PillarStore Limited 2850422Broadgate Court Investments Limited 2048475 Vintners’ Place Limited 2149495BLSSP (Funding) PLC 4104074 Wates City Point Limited 2973114Wates City Property Management Limited 1085036 BL West (Watling House) Limited 4067234Pillar Retail Parks Limited 2725163 Parwick Holdings Limited 6049168Pillar Speke Limited 3074360 Hilden Properties Limited NI062887PillarStore No.3 Limited 3589118 Paddington Central I (GP) Limited 3891376Wates City of London Properties Limited 1788526 Paddington Central II (GP) Limited 5092409Caymall Limited 5189368 Lancaster General Partner Limited 5452195Dinwell Limited 5035303 BL Wardrobe Court Holdings Limited 7687459Cavendish Geared Limited 2779045 Meadowhall Holdings Limited 2125982Pillar Auchinlea Limited 2661047 Meadowhall Centre Limited 3918066Hyfleet Limited 2835919 BVP Developments Limited 3534586Regis Property Holdings Limited 891470 British Land Investment Management Limited 4088640Tweed Premier 1 Limited 2847978 BL Health Clubs PH No 1 Limited 5643248Tweed Premier 2 Limited 2847985 BL Health Clubs PH No 2 Limited 5643261London and Henley (UK) Limited 3576158 BLD (SJ) Limited 2924321Cavendish Geared II Limited 2847571 BLD (SJ) Investments Limited 4484750London and Henley Limited 3074917 8-10 Throgmorton Avenue Limited 3669490Ivorydell Subsidiary Limited 5520010 Rohawk Properties Limited 381930United Kingdom Property Company Limited 266486 Ludgate West Limited 4882129Pillar Nugent Limited 2567031
165British Land Annual Report and Accounts 2015

Financial statements
28. Subsidiaries with material non-controlling interests – summarised financial information
Set out below is summarised financial information for each subsidiary that has non-controlling interests that are material to the Group. The information below is presented before intercompany eliminations. The non-controlling interests shown below relate to that from the Group perspective.
Summarised income statement for the year ended 31 March
Hercules Unit Trust2015
£m2014
£m
Gross rental and related income 58 58Net rental and related income 55 55Other income and expenditure (13) (10)Underlying profit before taxation 42 45Surplus on revaluation 69 28Share of profit (loss) of joint ventures and funds 31 (11)Profit on ordinary activities before taxation 142 62Current tax – –Deferred tax – –Profit on ordinary activities after taxation 142 62Attributable to non-controlling interests 55 10Attributable to the shareholders of the Company 87 52
Summarised balance sheet as at 31 March
Hercules Unit Trust2015
£m2014
£m
Non-currentAssets 1,647 1,404 Liabilities (653) (525)Total non-current net assets 994 879 CurrentAssets 40 39 Liabilities (21) (21)Total current net assets 19 18 Net assets 1,013 897 Non-controlling interests 333 371Equity attributable to shareholders of the Company 680 526
Summarised cash flowsHercules Unit Trust
2015£m
2014£m
Cash flows from operating activitiesCash generated from operations 69 74Interest paid (24) (25)Net cash generated from operating activities 45 49Net cash used in investing activities (111) 31Net cash used in financing activities 68 (80)Net increase in cash and cash equivalents 2 –Cash and cash equivalents at 1 April 33 33Cash and cash equivalents at 31 March 35 33
The Hercules Unit Trust is a publicly listed Unit Trust. The unit price at 31 March 2015 is £711 (2013/14: £651).
166 British Land Annual Report and Accounts 2015
NOTES TO THE ACCOUNTS CONTINUED
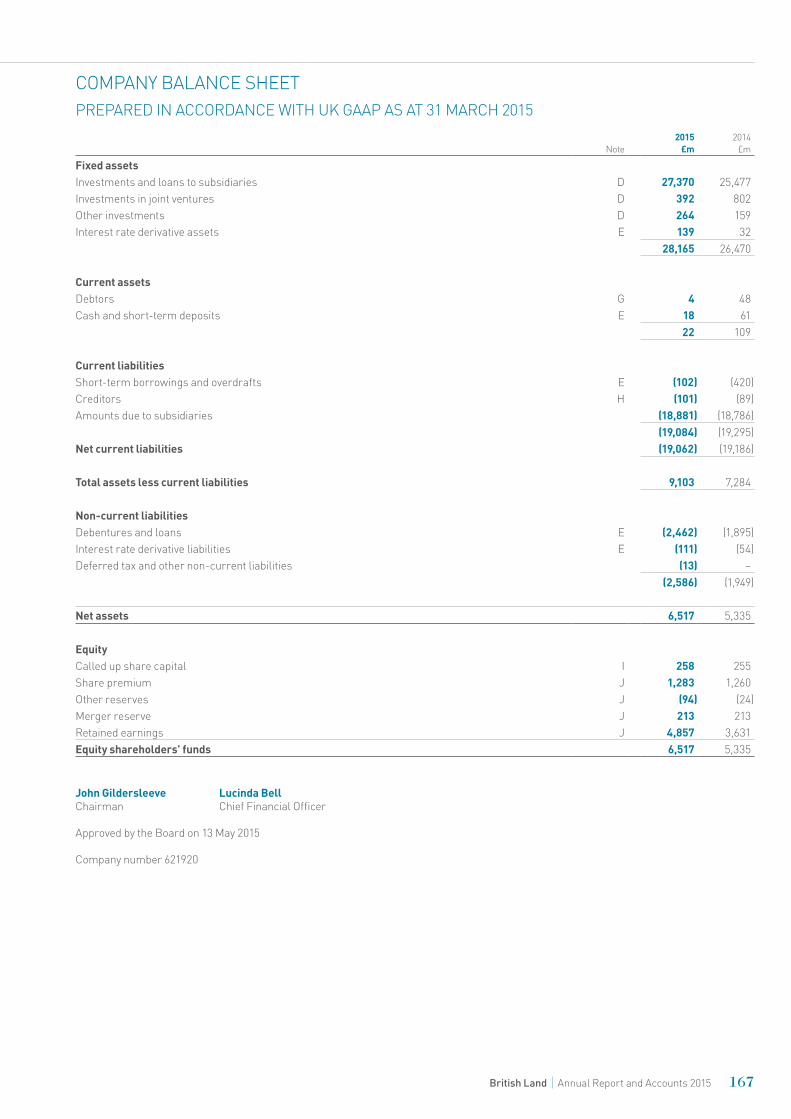
Note2015
£m2014
£m
Fixed assetsInvestments and loans to subsidiaries D 27,370 25,477 Investments in joint ventures D 392 802 Other investments D 264 159 Interest rate derivative assets E 139 32
28,165 26,470
Current assetsDebtors G 4 48 Cash and short-term deposits E 18 61
22 109
Current liabilitiesShort-term borrowings and overdrafts E (102) (420)Creditors H (101) (89)Amounts due to subsidiaries (18,881) (18,786)
(19,084) (19,295)Net current liabilities (19,062) (19,186)
Total assets less current liabilities 9,103 7,284
Non-current liabilitiesDebentures and loans E (2,462) (1,895)Interest rate derivative liabilities E (111) (54)Deferred tax and other non-current liabilities (13) –
(2,586) (1,949)
Net assets 6,517 5,335
EquityCalled up share capital I 258 255 Share premium J 1,283 1,260 Other reserves J (94) (24)Merger reserve J 213 213 Retained earnings J 4,857 3,631 Equity shareholders’ funds 6,517 5,335
John Gildersleeve Lucinda BellChairman Chief Financial Officer
Approved by the Board on 13 May 2015
Company number 621920
167British Land Annual Report and Accounts 2015
COMPANY BALANCE SHEETPREPARED IN ACCORDANCE WITH UK GAAP AS AT 31 MARCH 2015
(A) Accounting policies
The financial statements are prepared in accordance with applicable United Kingdom law and accounting standards (UK GAAP).
The major accounting policies of the Company are set out below and have been applied consistently throughout the current and the previous year, with the exception of the accounting policy in relation to capitalisation of interest. In the year, the Company opted to align the accounting policy in relation to capitalised interest with the Group (see note J).
The policies that differ from those applied by the Group (as stated in Note 1 of the consolidated financial statements) are for investments and deferred taxation.
– Going concern The financial statements are prepared on the going concern basis as explained in the corporate governance section on page 76.
– Investments Investments in joint ventures are stated at cost less provision for impairment. Investments in subsidiaries are stated at cost or Directors’ valuation less provision for impairment.
– Deferred taxation Deferred taxation is not recognised when fixed assets are revalued unless by the balance sheet date there is a binding agreement to sell the revalued assets and the gain or loss expected to arise on the sale has been recognised in the financial statements. A deferred tax asset is regarded as recoverable and therefore recognised only when, on the basis of all available evidence, it can be regarded as more likely than not that there will be suitable taxable profits from which the future reversal of the underlying timing differences can be deducted.
Adoption of financial reporting standard (FRS) 101 - reduced disclosure framework
Following the publication of FRS 100 Application of Financial Reporting Requirements by the Financial Reporting Council, The British Land Company plc is required to change its accounting framework for its Company only financial statements, which is currently in UK GAAP, for its financial year commencing 1 April 2015.
The Board considers that it is in the best interests of the Group for The British Land Company plc to adopt FRS 101 Reduced Disclosure Framework. No disclosures in the current UK GAAP financial statements would be omitted on adoption of FRS 101. A shareholder or shareholders holding in aggregate 5% or more of the total allotted shares in The British Land Company plc may serve objections to the use of the disclosure exemptions on The British Land Company plc, in writing, to its registered office (York House, 45 Seymour Street, London, W1H 7LX) not later than 31 July 2015.
(B) Dividends
Details of dividends paid and proposed are included in note 20 of the consolidated financial statements.
(C) Company profit for the financial year after tax
The Company has not presented its own profit and loss account as permitted by Section 408 of the Companies Act 2006. The profit after tax for the year was £1,422m (2013/14: profit £749m).
The average monthly number of employees of the Company during the year was 249 (2013/14: 231).
Employee costs include wages and salaries of £33m (2013/14: £30m), social security costs of £5m (2013/14: £4m) and pension costs of £5m (2013/14: £5m). Details of the Executive Directors’ remuneration are disclosed in the Remuneration Report.
Audit fees in relation to the parent Company only were £0.2m (2013/14: £0.3m).
168 British Land Annual Report and Accounts 2015
Financial statements
COMPANY BALANCE SHEET CONTINUED
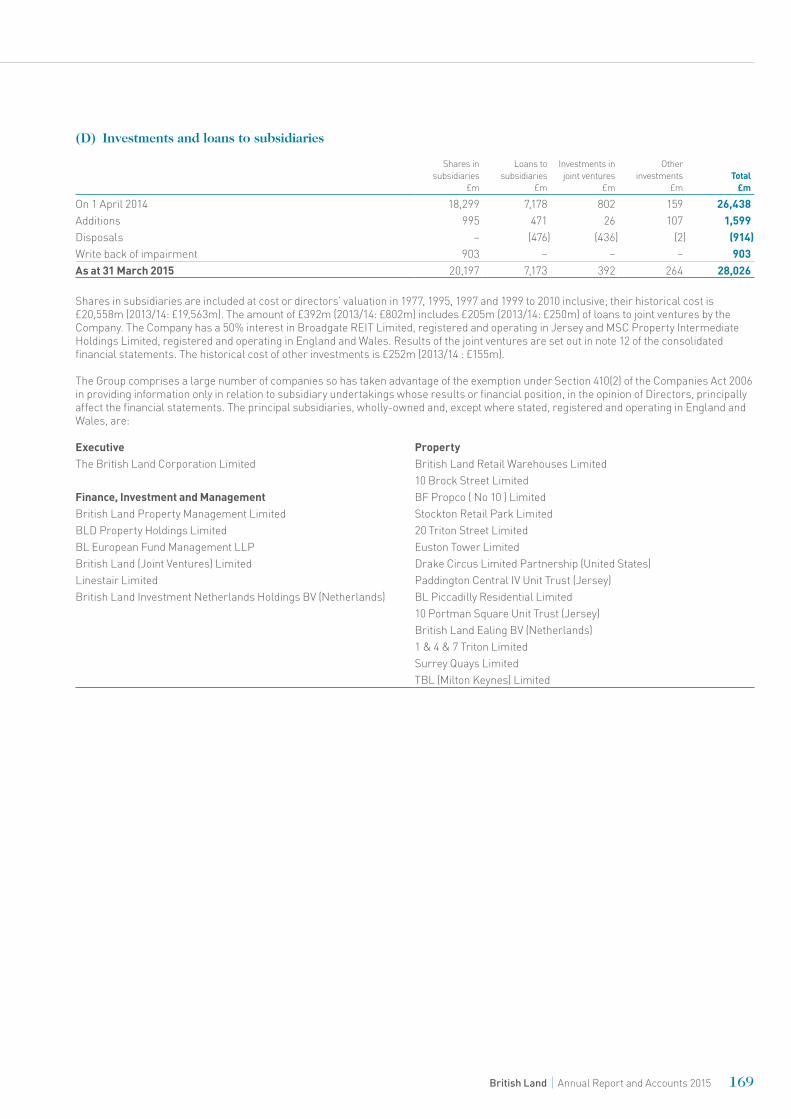
(D) Investments and loans to subsidiaries
Shares in subsidiaries
£m
Loans to subsidiaries
£m
Investments in joint ventures
£m
Other investments
£mTotal
£m
On 1 April 2014 18,299 7,178 802 159 26,438Additions 995 471 26 107 1,599Disposals – (476) (436) (2) (914)Write back of impairment 903 – – – 903As at 31 March 2015 20,197 7,173 392 264 28,026
Shares in subsidiaries are included at cost or directors’ valuation in 1977, 1995, 1997 and 1999 to 2010 inclusive; their historical cost is £20,558m (2013/14: £19,563m). The amount of £392m (2013/14: £802m) includes £205m (2013/14: £250m) of loans to joint ventures by the Company. The Company has a 50% interest in Broadgate REIT Limited, registered and operating in Jersey and MSC Property Intermediate Holdings Limited, registered and operating in England and Wales. Results of the joint ventures are set out in note 12 of the consolidated financial statements. The historical cost of other investments is £252m (2013/14 : £155m).
The Group comprises a large number of companies so has taken advantage of the exemption under Section 410(2) of the Companies Act 2006 in providing information only in relation to subsidiary undertakings whose results or financial position, in the opinion of Directors, principally affect the financial statements. The principal subsidiaries, wholly-owned and, except where stated, registered and operating in England and Wales, are:
Executive PropertyThe British Land Corporation Limited British Land Retail Warehouses Limited
10 Brock Street LimitedFinance, Investment and Management BF Propco ( No 10 ) LimitedBritish Land Property Management Limited Stockton Retail Park Limited BLD Property Holdings Limited 20 Triton Street LimitedBL European Fund Management LLP Euston Tower LimitedBritish Land (Joint Ventures) Limited Drake Circus Limited Partnership (United States)Linestair Limited Paddington Central IV Unit Trust (Jersey)British Land Investment Netherlands Holdings BV (Netherlands) BL Piccadilly Residential Limited
10 Portman Square Unit Trust (Jersey)British Land Ealing BV (Netherlands)1 & 4 & 7 Triton LimitedSurrey Quays LimitedTBL (Milton Keynes) Limited
169British Land Annual Report and Accounts 2015

(E) Net debt
2015£m
2014£m
Secured on the assets of the Company5.264% First Mortgage Debenture Bonds 2035 355 344 5.0055% First Mortgage Amortising Debentures 2035 98 100 5.357% First Mortgage Debenture Bonds 2028 344 327 6.75% First Mortgage Debenture Bonds 2020 184 185
981 956
Unsecured 5.50% Senior Notes 2027 98 98 6.30% Senior US Dollar Notes 20151 104 92 Series A 3.895% Senior US Notes 20182 28 25 Series B 4.635% Senior US Notes 20212 158 136 Series C 4.766% Senior US Notes 20232 99 83 Series D 5.003% Senior US Notes 20262 64 52 Fair value of options to issue under 1.5% convertible bond 2017 100 72 Bank loans & overdrafts 707 601 3.81% senior notes 2026 111 99 3.97% senior notes 2026 114 101
1,583 1,359 Gross debt 2,564 2,315
Interest rate derivatives: liabilities 111 54 Interest derivatives: assets (139) (32)
2,536 2,337
Cash short-term deposits (18) (61)Net debt 2,518 2,276
1 Principal and interest on this borrowing was fully hedged into Sterling at the time of issue.2 Principal and interest on these borrowings were fully hedged into Sterling at a floating rate at the time of issue.
On 10 September 2012 British Land (Jersey) Limited (the Issuer) – a wholly-owned subsidiary of the Company – issued £400 million 1.5% Guaranteed Convertible Bonds due 2017 (the Bonds) at par. The proceeds have been loaned to the Company and the Company has unconditionally and irrevocably guaranteed the due and punctual performance by the Issuer of all of its obligations (including payments) in respect of the Bonds and the obligations of the Company, as Guarantor, constitute direct, unsubordinated, unconditional and unsecured obligations of the Company.
Subject to their terms, the Bonds are convertible into preference shares of the Issuer which are automatically transferred to the Company in exchange for ordinary shares in the Company or, at the Company’s election, any combination of ordinary shares and cash.
The intercompany loan between the Issuer and the Company arising from the transfer of the loan proceeds was initially recognised at fair value, net of capitalised issue costs, and is accounted for using the amortised cost method.
In addition to the intercompany loan, the Company has entered into a derivative contract relating to its guarantee of the obligations of the Issuer in respect of the Bonds and the commitment to provide shares or a combination of shares and cash on conversion of the Bonds. This derivative contract is included within the balance sheet as a liability carried at fair value through profit and loss.
See Note 18 in the consolidated financial statements for further details about the convertible bond.
170 British Land Annual Report and Accounts 2015
Financial statements
COMPANY BALANCE SHEET CONTINUED
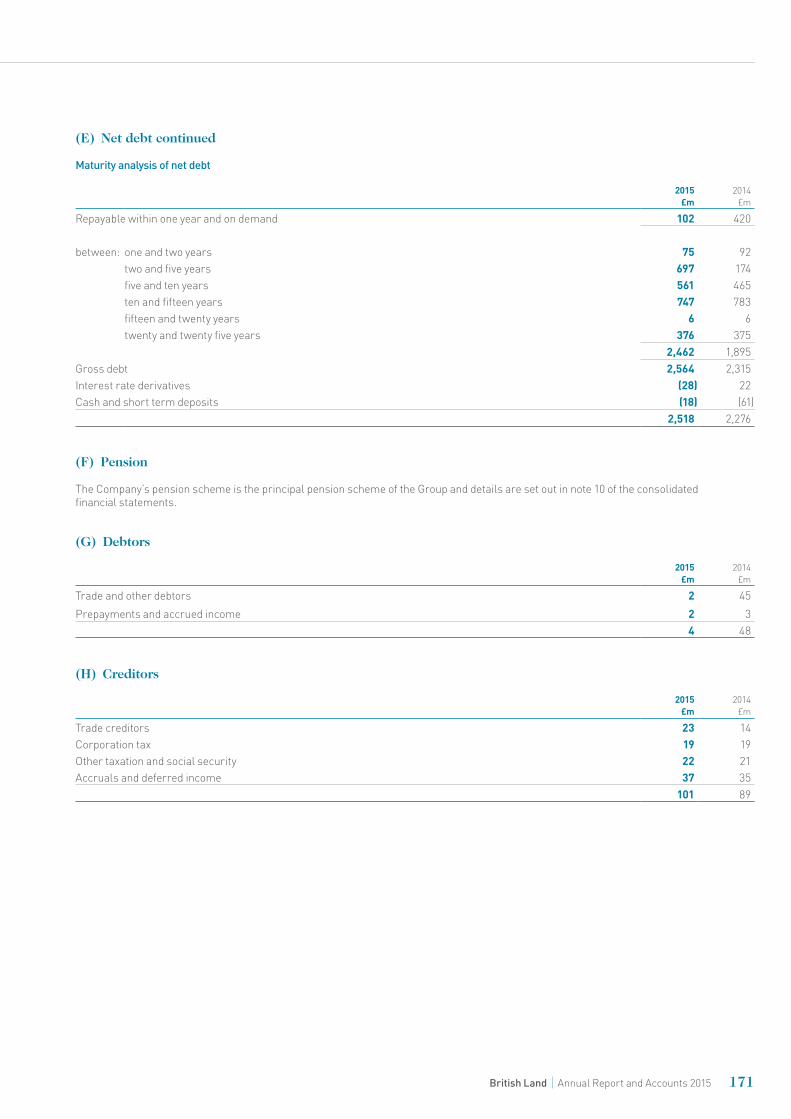
(E) Net debt continued
Maturity analysis of net debt
2015£m
2014£m
Repayable within one year and on demand 102 420
between: one and two years 75 92 two and five years 697 174 five and ten years 561 465 ten and fifteen years 747 783 fifteen and twenty years 6 6 twenty and twenty five years 376 375
2,462 1,895 Gross debt 2,564 2,315 Interest rate derivatives (28) 22 Cash and short term deposits (18) (61)
2,518 2,276
(F) Pension
The Company’s pension scheme is the principal pension scheme of the Group and details are set out in note 10 of the consolidated financial statements.
(G) Debtors
2015£m
2014£m
Trade and other debtors 2 45 Prepayments and accrued income 2 3
4 48
(H) Creditors
2015£m
2014£m
Trade creditors 23 14 Corporation tax 19 19 Other taxation and social security 22 21 Accruals and deferred income 37 35
101 89
171British Land Annual Report and Accounts 2015

(I) Share capital
£mOrdinary shares
of 25p each
Issued, called and fully paidAt 1 April 2014 255 1,019,766,481 Issued 3 12,021,805At 31 March 2015 258 1,031,788,286
£mOrdinary shares
of 25p each
Issued, called and fully paidAt 1 April 2013 249 997,691,488 Issued 6 22,074,993At 31 March 2014 255 1,019,766,481
(J) Share capital and reserves
Share capital£m
Share premium
£m
Other reserves
£m
Merger reserve
£m
Profit and loss
account£m
Total£m
At 1 April 2014 255 1,260 (24) 213 3,631 5,335 Adjustment for change in capitalised interest accounting policy1 – – – – 37 37Share issues 3 23 – – – 26 Adjustment for scrip dividend element – – – – 49 49 Dividend paid – – – – (277) (277)Pension scheme movements – – – – (5) (5)Retained profit (loss) – – – – 1,422 1,422Derivative valuation movement – – (70) – – (70) At 31 March 2015 258 1,283 (94) 213 4,857 6,517
1 During the year, the Company changed its accounting policy in relation to capitalisation of interest on borrowing costs. The policy changed from not opting to capitalise applicable interest to opting to capitalise in the current year. Reserves have been restated by £37m as a result of this change.
The value of distributable reserves within the profit and loss account is £3,514m (2013/14: £2,299m).
(K) Contingent liabilities, capital commitments and related party transactions
The Company has contingent liabilities in respect of legal claims, guarantees and warranties arising in the ordinary course of business. It is not anticipated that any material liabilities will arise from the contingent liabilities.
At 31 March 2015, the company has £27m of capital commitments (2013/14: £93m).
The Company has chosen to provide a development loan facility of up to £320m to the Broadgate joint venture secured against the development, 5 Broadgate. The loan, which is assignable and on commercial terms, includes an interest cost of 3% per annum above LIBOR and market based fees. As at 31 March 2015 £243m had been drawn by the joint venture (2013/14: £145m).
Related party transactions are the same for the Company as for the Group. For details refer to note 25 of the consolidated financial statements.
The Company has used the exemption under FRS 8 where disclosure is not required of transactions with fellow subsidiary undertakings 100% of whose voting rights are controlled within the Group. The Company has utilised the exemptions provided by FRS 1 (Revised) and has not presented a cash flow statement. A consolidated cash flow statement has been presented in the Group financial statements.
172 British Land Annual Report and Accounts 2015
Financial statements
COMPANY BALANCE SHEET CONTINUED
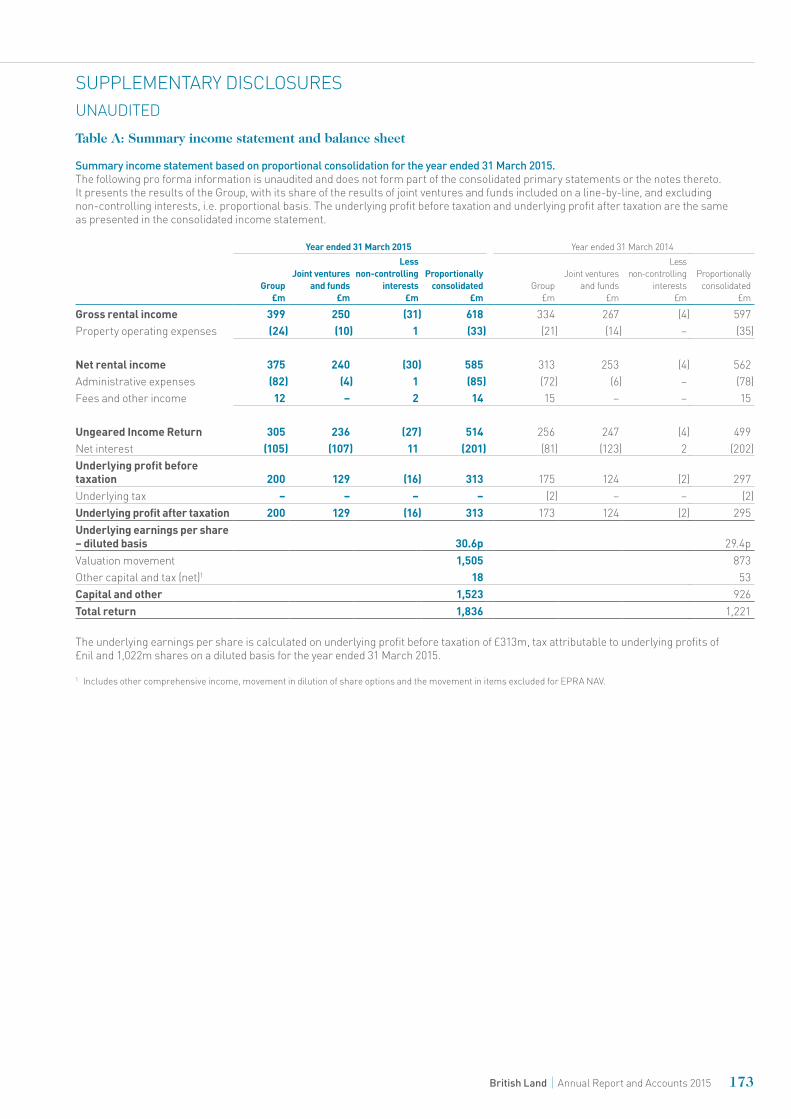
Table A: Summary income statement and balance sheet
Summary income statement based on proportional consolidation for the year ended 31 March 2015.The following pro forma information is unaudited and does not form part of the consolidated primary statements or the notes thereto. It presents the results of the Group, with its share of the results of joint ventures and funds included on a line-by-line, and excluding non-controlling interests, i.e. proportional basis. The underlying profit before taxation and underlying profit after taxation are the same as presented in the consolidated income statement.
Year ended 31 March 2015 Year ended 31 March 2014
Group£m
Joint ventures and funds
£m
Less non-controlling
interests£m
Proportionally consolidated
£mGroup
£m
Joint ventures and funds
£m
Less non-controlling
interests£m
Proportionally consolidated
£m
Gross rental income 399 250 (31) 618 334 267 (4) 597Property operating expenses (24) (10) 1 (33) (21) (14) – (35)
Net rental income 375 240 (30) 585 313 253 (4) 562Administrative expenses (82) (4) 1 (85) (72) (6) – (78)Fees and other income 12 – 2 14 15 – – 15
Ungeared Income Return 305 236 (27) 514 256 247 (4) 499Net interest (105) (107) 11 (201) (81) (123) 2 (202)Underlying profit before taxation 200 129 (16) 313 175 124 (2) 297Underlying tax – – – – (2) – – (2)Underlying profit after taxation 200 129 (16) 313 173 124 (2) 295Underlying earnings per share – diluted basis 30.6p 29.4p Valuation movement 1,505 873 Other capital and tax (net)1 18 53 Capital and other 1,523 926 Total return 1,836 1,221
The underlying earnings per share is calculated on underlying profit before taxation of £313m, tax attributable to underlying profits of £nil and 1,022m shares on a diluted basis for the year ended 31 March 2015.
1 Includes other comprehensive income, movement in dilution of share options and the movement in items excluded for EPRA NAV.
173British Land Annual Report and Accounts 2015
SUPPLEMENTARY DISCLOSURESUNAUDITED
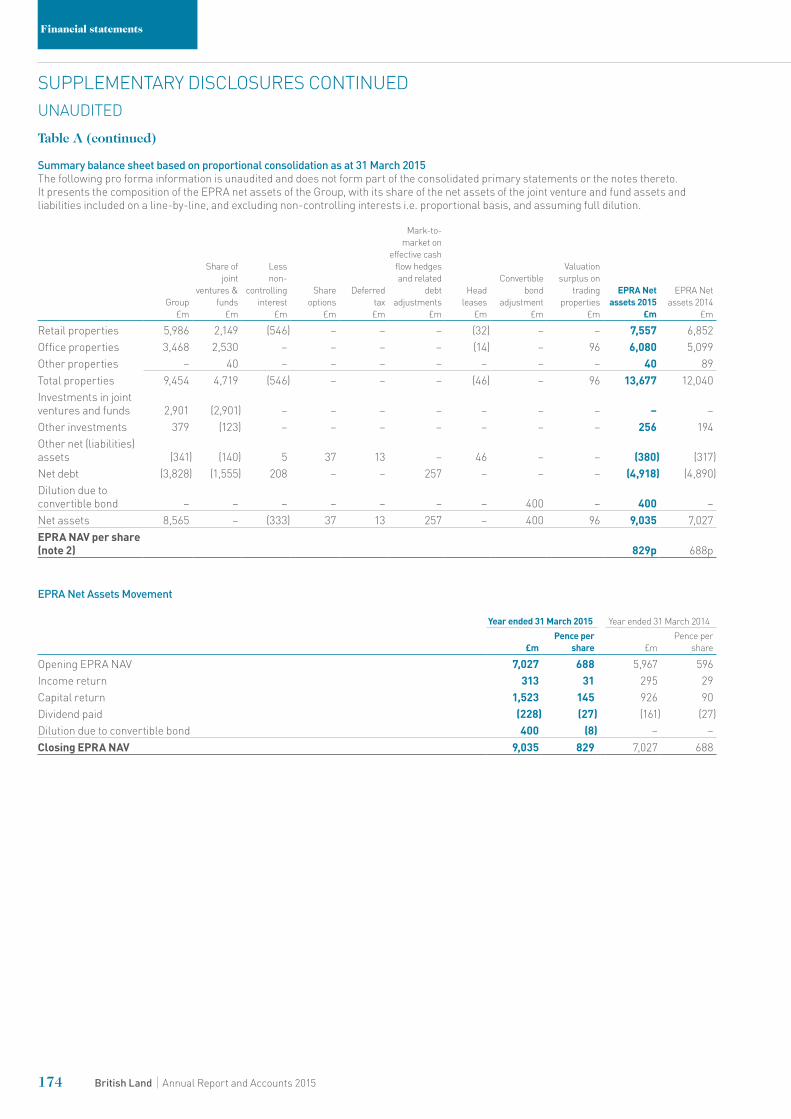
Table A (continued)
Summary balance sheet based on proportional consolidation as at 31 March 2015The following pro forma information is unaudited and does not form part of the consolidated primary statements or the notes thereto. It presents the composition of the EPRA net assets of the Group, with its share of the net assets of the joint venture and fund assets and liabilities included on a line-by-line, and excluding non-controlling interests i.e. proportional basis, and assuming full dilution.
Group£m
Share of joint
ventures & funds
£m
Less non-
controlling interest
£m
Share options
£m
Deferred tax£m
Mark-to-market on
effective cash flow hedges and related
debt adjustments
£m
Head leases
£m
Convertible bond
adjustment£m
Valuation surplus on
trading properties
£m
EPRA Net assets 2015
£m
EPRA Net assets 2014
£m
Retail properties 5,986 2,149 (546) – – – (32) – – 7,557 6,852Office properties 3,468 2,530 – – – – (14) – 96 6,080 5,099Other properties – 40 – – – – – – – 40 89Total properties 9,454 4,719 (546) – – – (46) – 96 13,677 12,040Investments in joint ventures and funds 2,901 (2,901) – – – – – – – – –Other investments 379 (123) – – – – – – – 256 194Other net (liabilities) assets (341) (140) 5 37 13 – 46 – – (380) (317)Net debt (3,828) (1,555) 208 – – 257 – – – (4,918) (4,890)Dilution due to convertible bond – – – – – – – 400 – 400 –Net assets 8,565 – (333) 37 13 257 – 400 96 9,035 7,027EPRA NAV per share (note 2) 829p 688p
EPRA Net Assets Movement
Year ended 31 March 2015 Year ended 31 March 2014
£mPence per
share £mPence per
share
Opening EPRA NAV 7,027 688 5,967 596 Income return 313 31 295 29 Capital return 1,523 145 926 90 Dividend paid (228) (27) (161) (27)Dilution due to convertible bond 400 (8) – –Closing EPRA NAV 9,035 829 7,027 688
174 British Land Annual Report and Accounts 2015
Financial statements
SUPPLEMENTARY DISCLOSURES CONTINUEDUNAUDITED
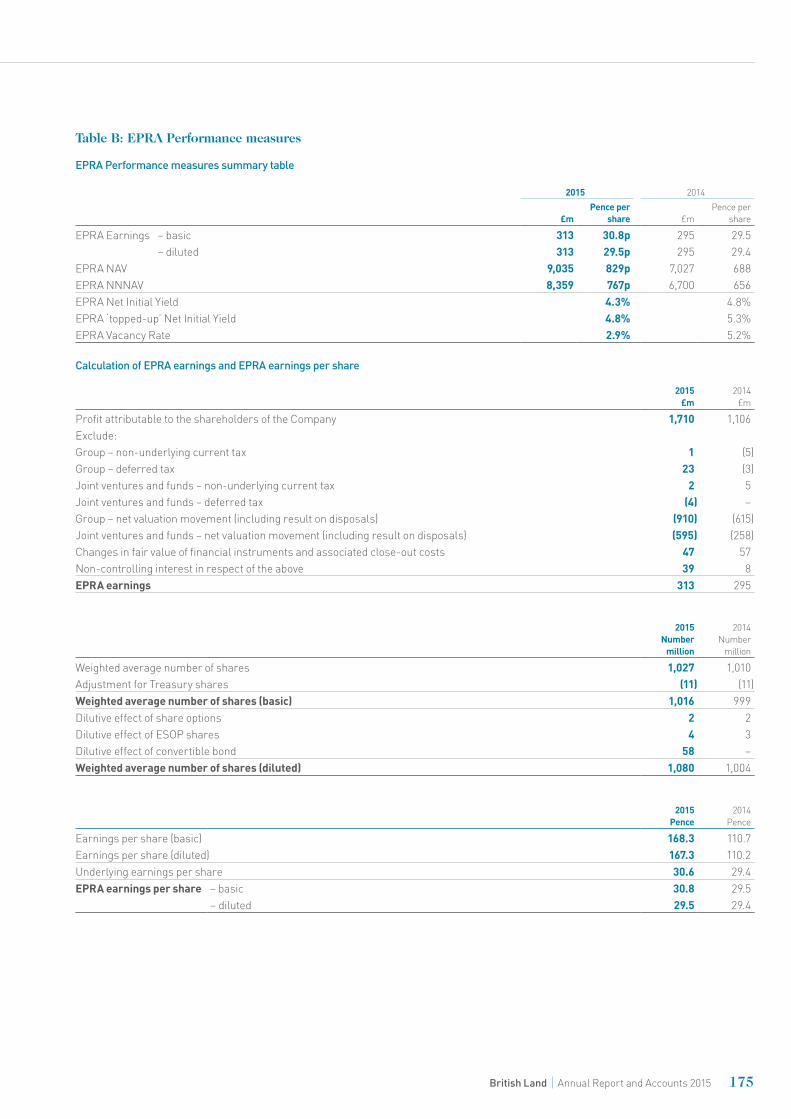
Table B: EPRA Performance measures
EPRA Performance measures summary table
2015 2014
£mPence per
share £mPence per
share
EPRA Earnings – basic 313 30.8p 295 29.5 – diluted 313 29.5p 295 29.4
EPRA NAV 9,035 829p 7,027 688 EPRA NNNAV 8,359 767p 6,700 656 EPRA Net Initial Yield 4.3% 4.8%EPRA ‘topped-up’ Net Initial Yield 4.8% 5.3%EPRA Vacancy Rate 2.9% 5.2%
Calculation of EPRA earnings and EPRA earnings per share
2015£m
2014£m
Profit attributable to the shareholders of the Company 1,710 1,106Exclude:Group – non-underlying current tax 1 (5)Group – deferred tax 23 (3)Joint ventures and funds – non-underlying current tax 2 5Joint ventures and funds – deferred tax (4) –Group – net valuation movement (including result on disposals) (910) (615)Joint ventures and funds – net valuation movement (including result on disposals) (595) (258)Changes in fair value of financial instruments and associated close-out costs 47 57Non-controlling interest in respect of the above 39 8EPRA earnings 313 295
2015Number
million
2014Number
million
Weighted average number of shares 1,027 1,010Adjustment for Treasury shares (11) (11)Weighted average number of shares (basic) 1,016 999Dilutive effect of share options 2 2Dilutive effect of ESOP shares 4 3Dilutive effect of convertible bond 58 –Weighted average number of shares (diluted) 1,080 1,004
2015Pence
2014Pence
Earnings per share (basic) 168.3 110.7Earnings per share (diluted) 167.3 110.2Underlying earnings per share 30.6 29.4EPRA earnings per share – basic 30.8 29.5
– diluted 29.5 29.4
175British Land Annual Report and Accounts 2015
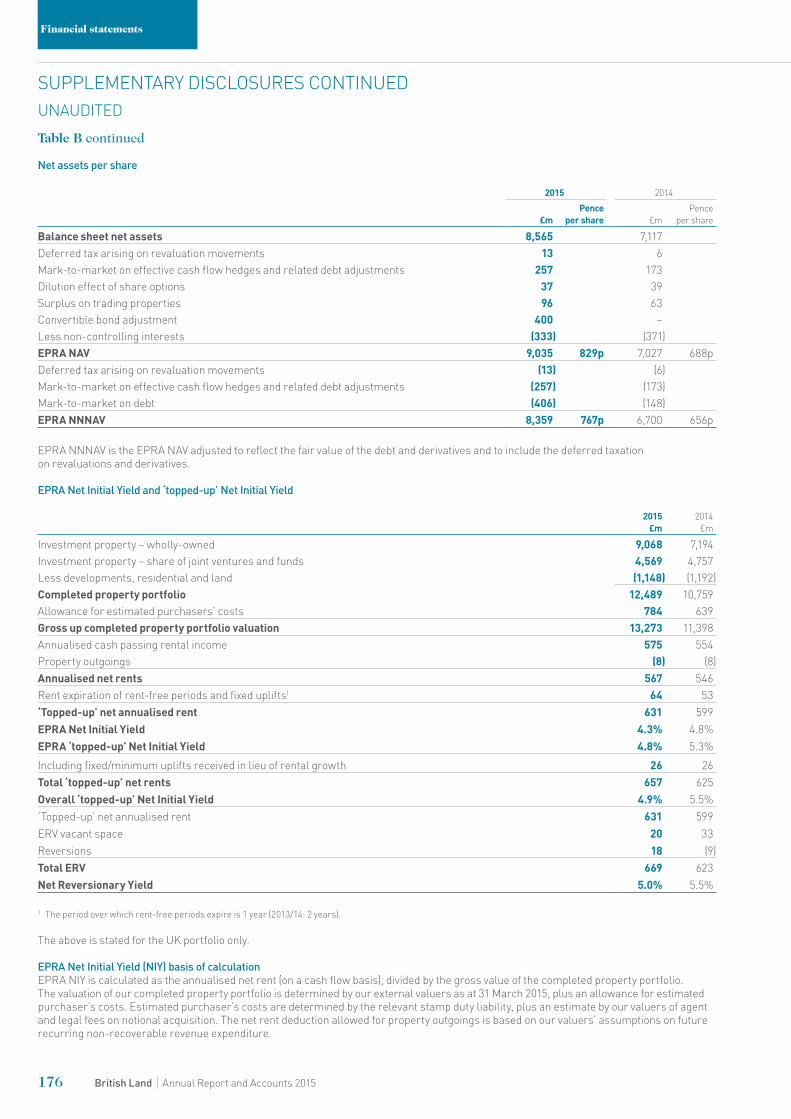
Table B continued
Net assets per share
2015 2014
£mPence
per share £mPence
per share
Balance sheet net assets 8,565 7,117 Deferred tax arising on revaluation movements 13 6 Mark-to-market on effective cash flow hedges and related debt adjustments 257 173 Dilution effect of share options 37 39 Surplus on trading properties 96 63 Convertible bond adjustment 400 –Less non-controlling interests (333) (371)EPRA NAV 9,035 829p 7,027 688pDeferred tax arising on revaluation movements (13) (6)Mark-to-market on effective cash flow hedges and related debt adjustments (257) (173)Mark-to-market on debt (406) (148)EPRA NNNAV 8,359 767p 6,700 656p
EPRA NNNAV is the EPRA NAV adjusted to reflect the fair value of the debt and derivatives and to include the deferred taxation on revaluations and derivatives.
EPRA Net Initial Yield and ‘topped-up’ Net Initial Yield
2015 £m
2014 £m
Investment property – wholly-owned 9,068 7,194 Investment property – share of joint ventures and funds 4,569 4,757 Less developments, residential and land (1,148) (1,192)Completed property portfolio 12,489 10,759 Allowance for estimated purchasers’ costs 784 639 Gross up completed property portfolio valuation 13,273 11,398 Annualised cash passing rental income 575 554 Property outgoings (8) (8)Annualised net rents 567 546 Rent expiration of rent-free periods and fixed uplifts1 64 53 ‘Topped-up’ net annualised rent 631 599 EPRA Net Initial Yield 4.3% 4.8% EPRA ‘topped-up’ Net Initial Yield 4.8% 5.3% Including fixed/minimum uplifts received in lieu of rental growth 26 26 Total ‘topped-up’ net rents 657 625 Overall ‘topped-up’ Net Initial Yield 4.9% 5.5% ‘Topped-up’ net annualised rent 631 599 ERV vacant space 20 33 Reversions 18 (9)Total ERV 669 623 Net Reversionary Yield 5.0% 5.5%
1 The period over which rent-free periods expire is 1 year (2013/14: 2 years).
The above is stated for the UK portfolio only.
EPRA Net Initial Yield (NIY) basis of calculationEPRA NIY is calculated as the annualised net rent (on a cash flow basis), divided by the gross value of the completed property portfolio. The valuation of our completed property portfolio is determined by our external valuers as at 31 March 2015, plus an allowance for estimated purchaser’s costs. Estimated purchaser’s costs are determined by the relevant stamp duty liability, plus an estimate by our valuers of agent and legal fees on notional acquisition. The net rent deduction allowed for property outgoings is based on our valuers’ assumptions on future recurring non-recoverable revenue expenditure.
176 British Land Annual Report and Accounts 2015
Financial statements
SUPPLEMENTARY DISCLOSURES CONTINUEDUNAUDITED
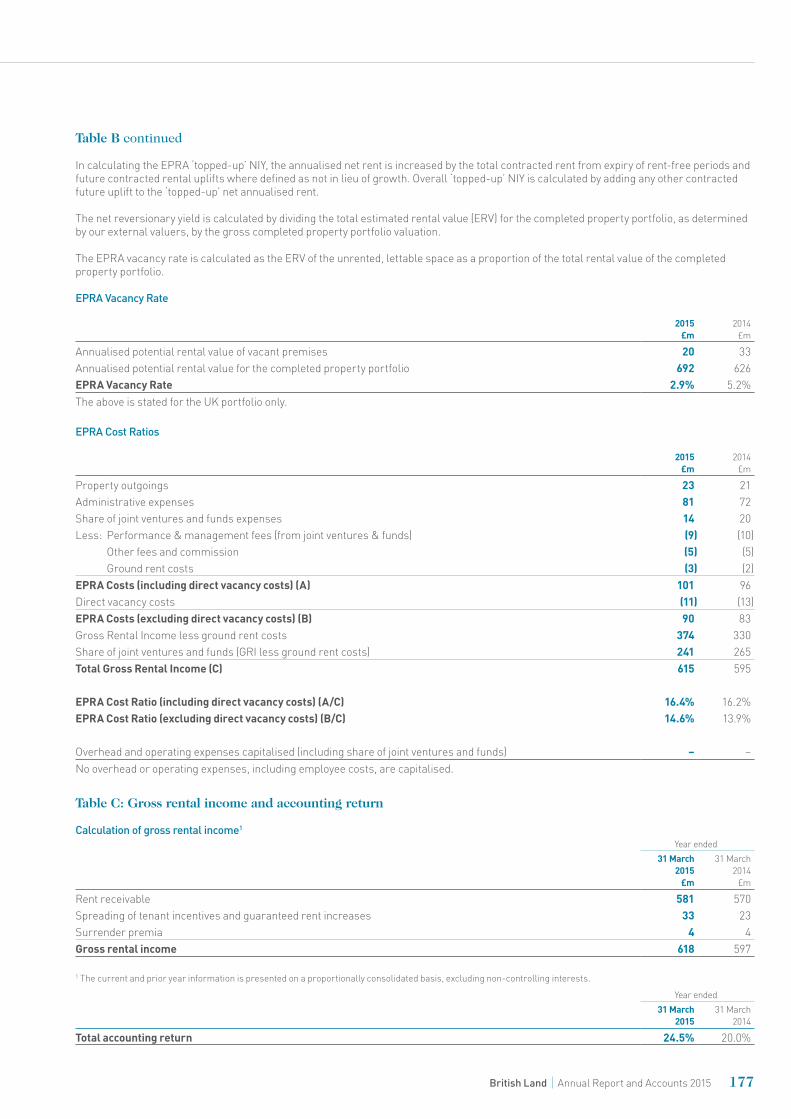
Table B continued
In calculating the EPRA ‘topped-up’ NIY, the annualised net rent is increased by the total contracted rent from expiry of rent-free periods and future contracted rental uplifts where defined as not in lieu of growth. Overall ‘topped-up’ NIY is calculated by adding any other contracted future uplift to the ‘topped-up’ net annualised rent.
The net reversionary yield is calculated by dividing the total estimated rental value (ERV) for the completed property portfolio, as determined by our external valuers, by the gross completed property portfolio valuation.
The EPRA vacancy rate is calculated as the ERV of the unrented, lettable space as a proportion of the total rental value of the completed property portfolio.
EPRA Vacancy Rate
2015£m
2014£m
Annualised potential rental value of vacant premises 20 33 Annualised potential rental value for the completed property portfolio 692 626 EPRA Vacancy Rate 2.9% 5.2%The above is stated for the UK portfolio only.
EPRA Cost Ratios
2015£m
2014£m
Property outgoings 23 21Administrative expenses 81 72Share of joint ventures and funds expenses 14 20Less: Performance & management fees (from joint ventures & funds) (9) (10)
Other fees and commission (5) (5)Ground rent costs (3) (2)
EPRA Costs (including direct vacancy costs) (A) 101 96Direct vacancy costs (11) (13)EPRA Costs (excluding direct vacancy costs) (B) 90 83Gross Rental Income less ground rent costs 374 330Share of joint ventures and funds (GRI less ground rent costs) 241 265Total Gross Rental Income (C) 615 595
EPRA Cost Ratio (including direct vacancy costs) (A/C) 16.4% 16.2%EPRA Cost Ratio (excluding direct vacancy costs) (B/C) 14.6% 13.9%
Overhead and operating expenses capitalised (including share of joint ventures and funds) – –No overhead or operating expenses, including employee costs, are capitalised.
Table C: Gross rental income and accounting return
Calculation of gross rental income1 Year ended
31 March2015
£m
31 March2014
£m
Rent receivable 581 570Spreading of tenant incentives and guaranteed rent increases 33 23 Surrender premia 4 4 Gross rental income 618 597
1 The current and prior year information is presented on a proportionally consolidated basis, excluding non-controlling interests.
Year ended31 March
201531 March
2014
Total accounting return 24.5% 20.0%
177British Land Annual Report and Accounts 2015
Other Information UnauditedPortfolio valuation 180Portfolio yield and ERV movements 180Total property return 181Property weighting 181Portfolio net yields 182Annualised rent and estimated rental value (ERV ) 182Gross rental income 183Lease length and occupancy 183Rent subject to lease break or expiry 184Rent subject to open market rent review 184Major holdings 185Occupiers representing over 0.5% of total contracted rent 185Acquisitions and disposals 186Development: Recently completed and committed developments 187 Near-term pipeline 187 Medium-term pipeline 188 Residential development programme 188Superstores 188Environmental performance measures 189Ten year record 190Shareholder information 191Glossary 193
178 British Land Annual Report and Accounts 2015
Other information

Photo taken by Tim DownesThe Leadenhall Building
179British Land Annual Report and Accounts 2015

Portfolio valuation
At 31 March 2015
Change2
Group £m
JVs & Funds1
£mTotal1
£mH1%
H2%
FY%
Shopping parks 2,161 1,169 3,330 7.2 1.1 7.5 Shopping centres 1,106 1,079 2,185 5.8 3.2 8.7 Superstores 233 701 934 3.1 (1.0) 1.9 Department stores 592 1 593 6.5 10.1 17.3 Leisure 511 4 515 7.1 2.0 7.1 Retail & Leisure3 4,603 2,954 7,557 6.0 2.0 7.5 West End 3,251 – 3,251 9.0 9.0 18.6 City 77 2,490 2,567 9.0 11.3 20.6 Provincial 3 – 3 6.5 12.2 18.7 All Offices 3,331 2,490 5,821 8.9 10.0 19.4 Residential4 220 39 259 4.9 2.8 7.4 All Offices & Residential3 3,551 2,529 6,080 8.7 9.7 18.8 Total 8,154 5,483 13,637 7.2 5.2 12.1
Table shows UK total, excluding assets held in Europe. Total portfolio valuation including Europe of £13.7bn at year end, +12.1% valuation movement.1 Group’s share of properties in joint ventures and funds including HUT at share.2 Valuation movement during the period (after taking account of capital expenditure) of properties held at the balance sheet date, including developments
(classified by end use), purchases and sales.³ Including committed developments.4 Stand-alone residential.
Portfolio yield and ERV movements
At 31 March 2015
ERV growth1 NEY yield compression2
ERV £m
NEY%
H1%
H2%
FY%
H1bps
H2bps
FYbps
Shopping parks 184 5.1 0.9 2.1 3.0 45 7 52 Shopping centres 125 5.1 0.3 1.8 2.1 38 13 48 Superstores 51 5.2 0.1 (0.1) (0.1) 12 (11) 3 Department stores 24 4.5 8.6 0.0 8.7 19 42 56 Leisure 23 5.4 0.7 0.3 1.1 57 21 86 Retail & Leisure 407 5.2 1.1 1.5 2.5 35 10 47West End 145 4.6 2.6 3.6 6.3 21 24 46 City3 128 4.7 5.9 4.4 10.6 34 30 59 Offices 273 4.6 3.9 4.0 8.0 26 27 51Total4 680 4.9 2.1 2.4 4.6 32 17 48
Table shows UK total, excluding assets held in Europe.1 As calculated by IPD.2 Including notional purchaser’s costs.3 City ERV growth 6.7% on a like-for-like basis.4 Table excludes Residential ERV of £3m.
180 British Land Annual Report and Accounts 2015
Other information
UNAUDITED
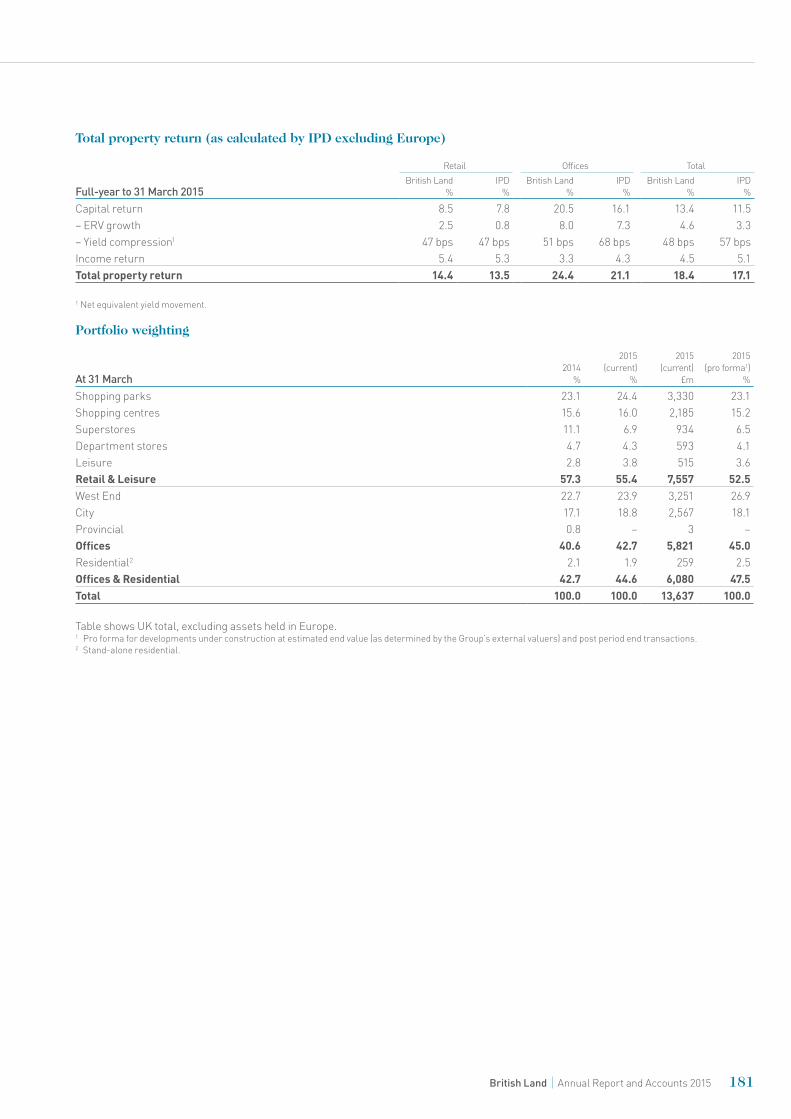
Total property return (as calculated by IPD excluding Europe)
Full-year to 31 March 2015
Retail Offices TotalBritish Land
%IPD
%British Land
%IPD
%British Land
%IPD
%
Capital return 8.5 7.8 20.5 16.1 13.4 11.5 – ERV growth 2.5 0.8 8.0 7.3 4.6 3.3 – Yield compression1 47 bps 47 bps 51 bps 68 bps 48 bps 57 bpsIncome return 5.4 5.3 3.3 4.3 4.5 5.1 Total property return 14.4 13.5 24.4 21.1 18.4 17.1
1 Net equivalent yield movement.
Portfolio weighting
At 31 March2014
%
2015(current)
%
2015(current)
£m
2015 (pro forma1)
%
Shopping parks 23.1 24.4 3,330 23.1 Shopping centres 15.6 16.0 2,185 15.2 Superstores 11.1 6.9 934 6.5 Department stores 4.7 4.3 593 4.1 Leisure 2.8 3.8 515 3.6 Retail & Leisure 57.3 55.4 7,557 52.5 West End 22.7 23.9 3,251 26.9 City 17.1 18.8 2,567 18.1 Provincial 0.8 – 3 –Offices 40.6 42.7 5,821 45.0 Residential2 2.1 1.9 259 2.5 Offices & Residential 42.7 44.6 6,080 47.5 Total 100.0 100.0 13,637 100.0
Table shows UK total, excluding assets held in Europe.1 Pro forma for developments under construction at estimated end value (as determined by the Group’s external valuers) and post period end transactions.2 Stand-alone residential.
181British Land Annual Report and Accounts 2015
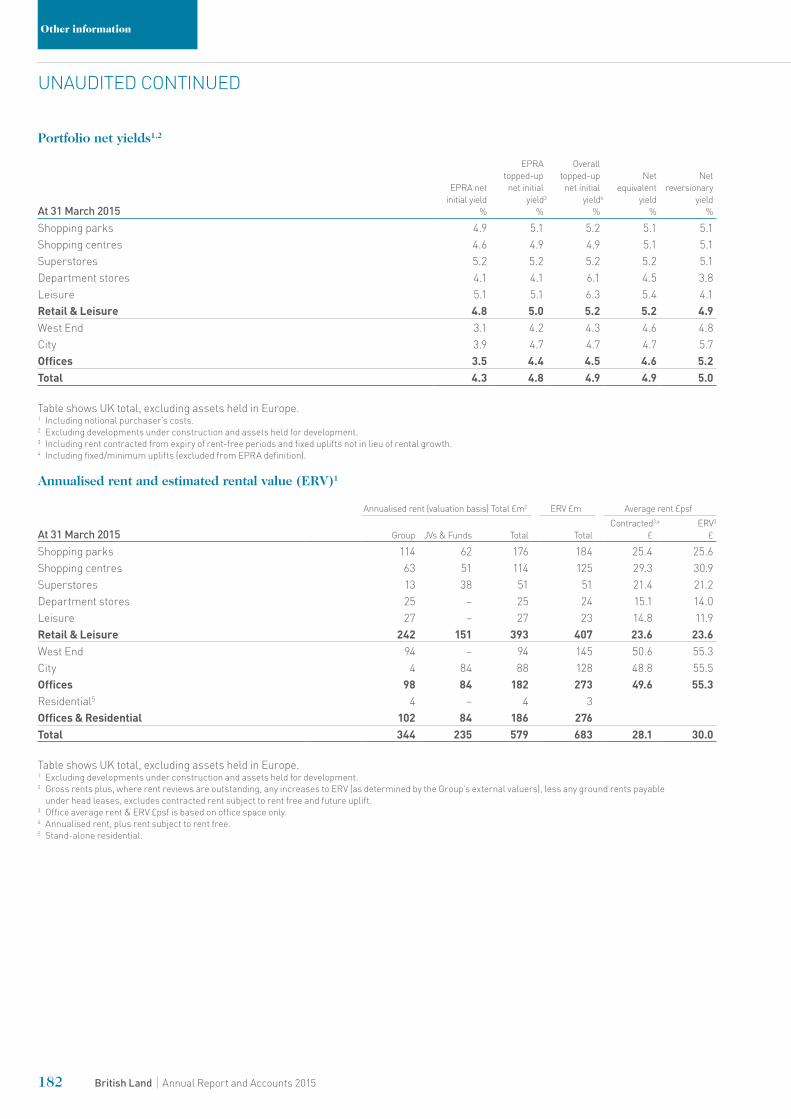
Portfolio net yields1,2
At 31 March 2015
EPRA net initial yield
%
EPRA topped-up net initial
yield3 %
Overall topped-up net initial
yield4
%
Net equivalent
yield%
Net reversionary
yield%
Shopping parks 4.9 5.1 5.2 5.1 5.1 Shopping centres 4.6 4.9 4.9 5.1 5.1 Superstores 5.2 5.2 5.2 5.2 5.1 Department stores 4.1 4.1 6.1 4.5 3.8 Leisure 5.1 5.1 6.3 5.4 4.1 Retail & Leisure 4.8 5.0 5.2 5.2 4.9 West End 3.1 4.2 4.3 4.6 4.8 City 3.9 4.7 4.7 4.7 5.7 Offices 3.5 4.4 4.5 4.6 5.2 Total 4.3 4.8 4.9 4.9 5.0
Table shows UK total, excluding assets held in Europe.1 Including notional purchaser’s costs.2 Excluding developments under construction and assets held for development.3 Including rent contracted from expiry of rent-free periods and fixed uplifts not in lieu of rental growth.4 Including fixed/minimum uplifts (excluded from EPRA definition).
Annualised rent and estimated rental value (ERV)1
Annualised rent (valuation basis) Total £m2 ERV £m Average rent £psf
At 31 March 2015 Group JVs & Funds Total TotalContracted3,4
£ERV3
£
Shopping parks 114 62 176 184 25.4 25.6Shopping centres 63 51 114 125 29.3 30.9Superstores 13 38 51 51 21.4 21.2Department stores 25 – 25 24 15.1 14.0Leisure 27 – 27 23 14.8 11.9Retail & Leisure 242 151 393 407 23.6 23.6West End 94 – 94 145 50.6 55.3City 4 84 88 128 48.8 55.5Offices 98 84 182 273 49.6 55.3Residential5 4 – 4 3 Offices & Residential 102 84 186 276 Total 344 235 579 683 28.1 30.0
Table shows UK total, excluding assets held in Europe.1 Excluding developments under construction and assets held for development.2 Gross rents plus, where rent reviews are outstanding, any increases to ERV (as determined by the Group’s external valuers), less any ground rents payable
under head leases, excludes contracted rent subject to rent free and future uplift.3 Office average rent & ERV £psf is based on office space only.4 Annualised rent, plus rent subject to rent free.5 Stand-alone residential.
182 British Land Annual Report and Accounts 2015
Other information
UNAUDITED CONTINUED
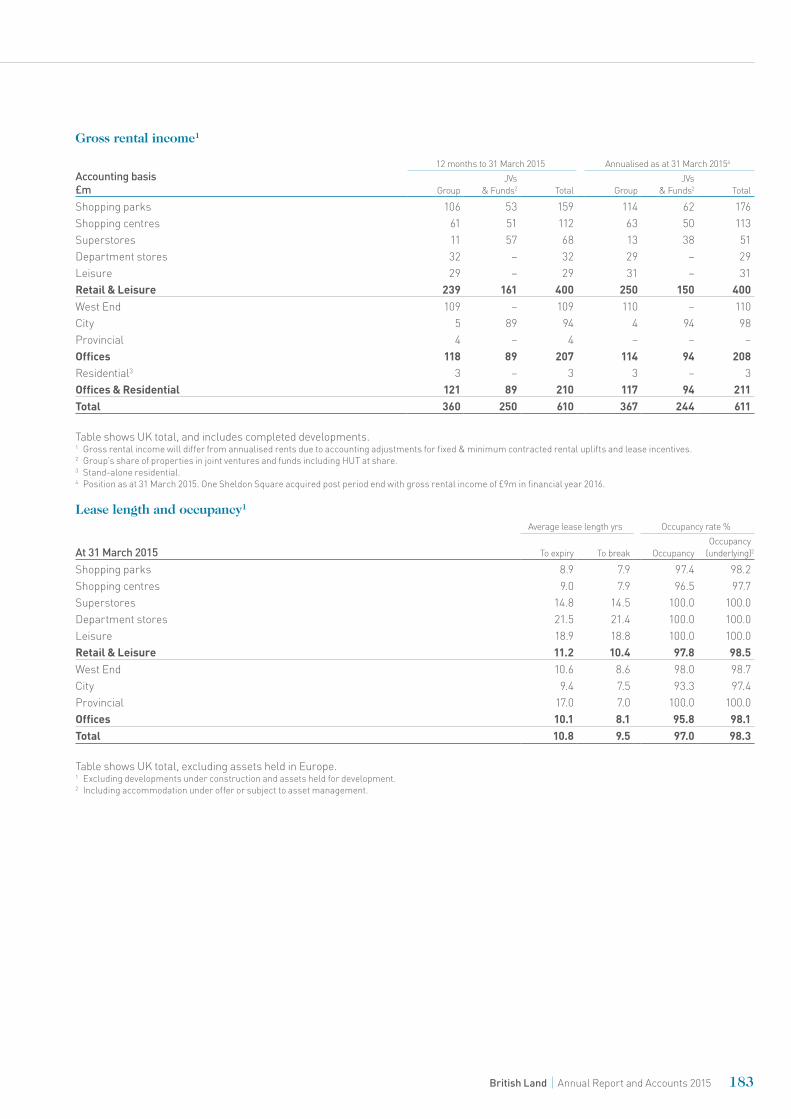
Gross rental income1
Accounting basis £m
12 months to 31 March 2015 Annualised as at 31 March 20154
GroupJVs
& Funds2 Total GroupJVs
& Funds2 Total
Shopping parks 106 53 159 114 62 176Shopping centres 61 51 112 63 50 113Superstores 11 57 68 13 38 51Department stores 32 – 32 29 – 29Leisure 29 – 29 31 – 31Retail & Leisure 239 161 400 250 150 400West End 109 – 109 110 – 110City 5 89 94 4 94 98Provincial 4 – 4 – – –Offices 118 89 207 114 94 208Residential3 3 – 3 3 – 3Offices & Residential 121 89 210 117 94 211Total 360 250 610 367 244 611
Table shows UK total, and includes completed developments.1 Gross rental income will differ from annualised rents due to accounting adjustments for fixed & minimum contracted rental uplifts and lease incentives.2 Group’s share of properties in joint ventures and funds including HUT at share.3 Stand-alone residential.4 Position as at 31 March 2015. One Sheldon Square acquired post period end with gross rental income of £9m in financial year 2016.
Lease length and occupancy1
Average lease length yrs Occupancy rate %
At 31 March 2015 To expiry To break OccupancyOccupancy
(underlying)2
Shopping parks 8.9 7.9 97.4 98.2 Shopping centres 9.0 7.9 96.5 97.7 Superstores 14.8 14.5 100.0 100.0 Department stores 21.5 21.4 100.0 100.0 Leisure 18.9 18.8 100.0 100.0 Retail & Leisure 11.2 10.4 97.8 98.5 West End 10.6 8.6 98.0 98.7 City 9.4 7.5 93.3 97.4 Provincial 17.0 7.0 100.0 100.0 Offices 10.1 8.1 95.8 98.1 Total 10.8 9.5 97.0 98.3
Table shows UK total, excluding assets held in Europe.1 Excluding developments under construction and assets held for development.2 Including accommodation under offer or subject to asset management.
183British Land Annual Report and Accounts 2015
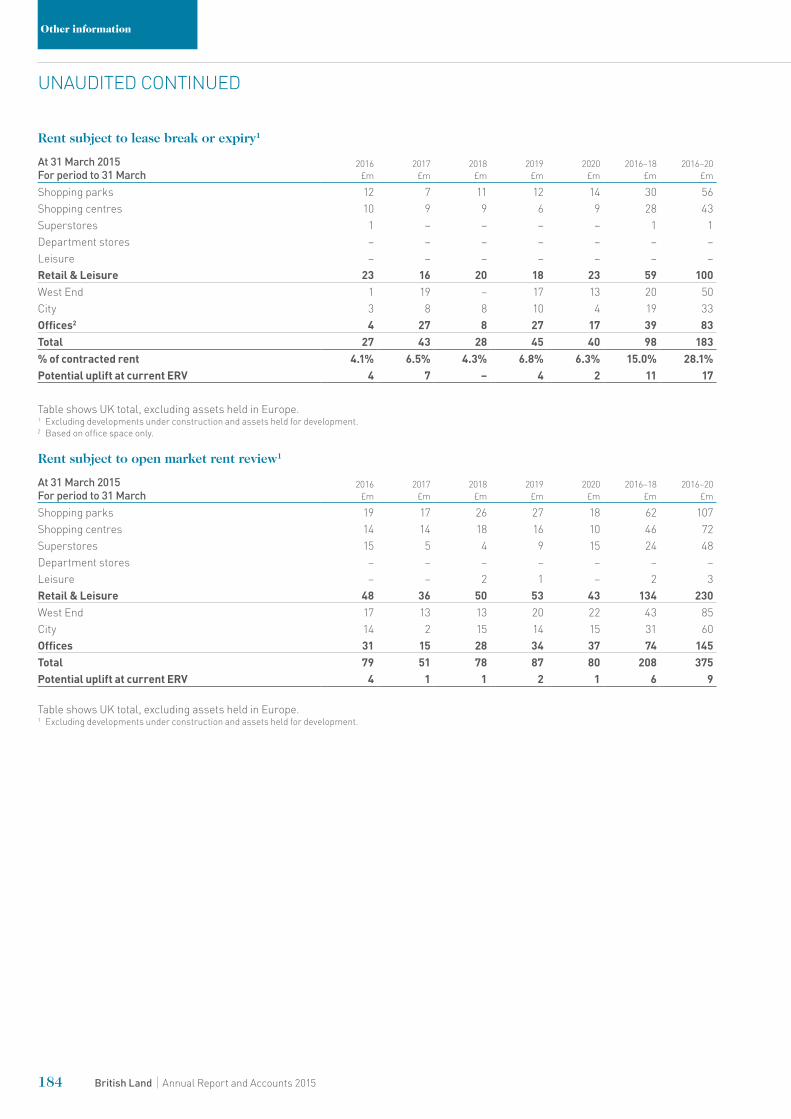
Rent subject to lease break or expiry1
At 31 March 2015For period to 31 March
2016£m
2017£m
2018£m
2019£m
2020£m
2016–18£m
2016–20£m
Shopping parks 12 7 11 12 14 30 56 Shopping centres 10 9 9 6 9 28 43 Superstores 1 – – – – 1 1 Department stores – – – – – – – Leisure – – – – – – – Retail & Leisure 23 16 20 18 23 59 100 West End 1 19 – 17 13 20 50 City 3 8 8 10 4 19 33 Offices2 4 27 8 27 17 39 83 Total 27 43 28 45 40 98 183 % of contracted rent 4.1% 6.5% 4.3% 6.8% 6.3% 15.0% 28.1%Potential uplift at current ERV 4 7 – 4 2 11 17
Table shows UK total, excluding assets held in Europe.1 Excluding developments under construction and assets held for development.2 Based on office space only.
Rent subject to open market rent review1
At 31 March 2015For period to 31 March
2016£m
2017£m
2018£m
2019£m
2020£m
2016–18£m
2016–20£m
Shopping parks 19 17 26 27 18 62 107 Shopping centres 14 14 18 16 10 46 72 Superstores 15 5 4 9 15 24 48 Department stores – – – – – – –Leisure – – 2 1 – 2 3 Retail & Leisure 48 36 50 53 43 134 230 West End 17 13 13 20 22 43 85 City 14 2 15 14 15 31 60 Offices 31 15 28 34 37 74 145 Total 79 51 78 87 80 208 375 Potential uplift at current ERV 4 1 1 2 1 6 9
Table shows UK total, excluding assets held in Europe.1 Excluding developments under construction and assets held for development.
184 British Land Annual Report and Accounts 2015
Other information
UNAUDITED CONTINUED
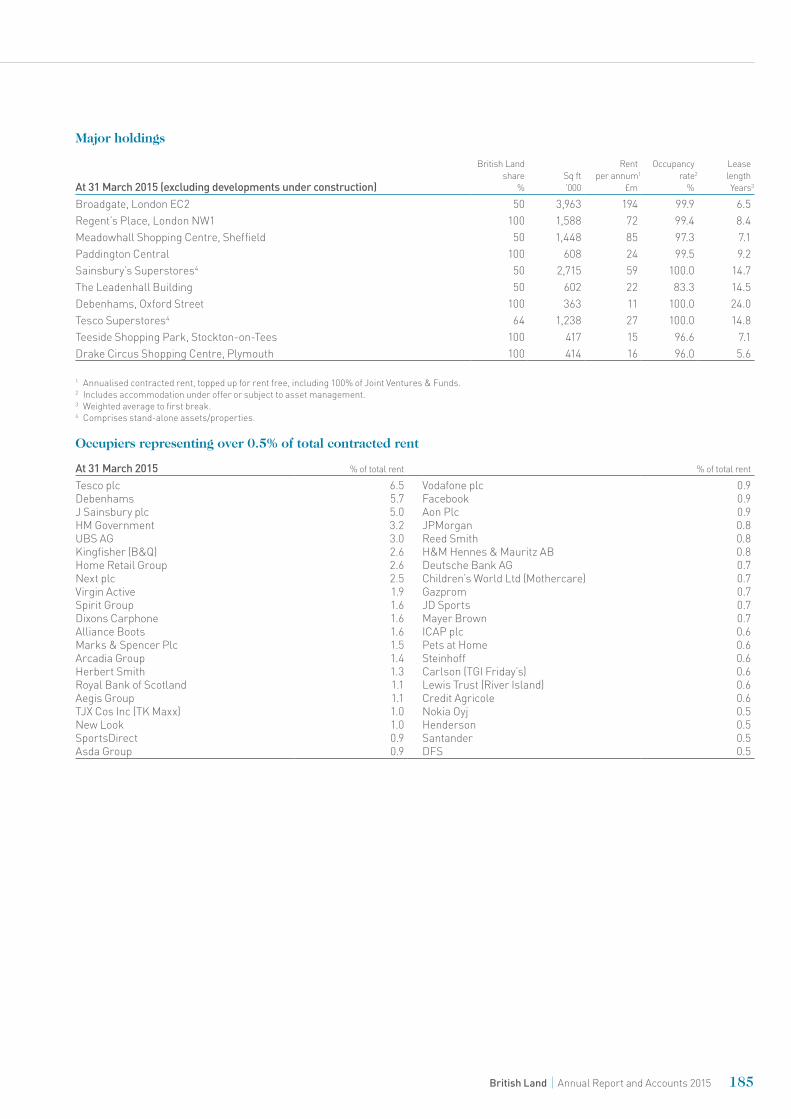
Major holdings
At 31 March 2015 (excluding developments under construction)
British Land share
%Sq ft’000
Rentper annum1
£m
Occupancyrate2
%
Lease lengthYears3
Broadgate, London EC2 50 3,963 194 99.9 6.5Regent’s Place, London NW1 100 1,588 72 99.4 8.4Meadowhall Shopping Centre, Sheffield 50 1,448 85 97.3 7.1Paddington Central 100 608 24 99.5 9.2Sainsbury’s Superstores4 50 2,715 59 100.0 14.7 The Leadenhall Building 50 602 22 83.3 14.5 Debenhams, Oxford Street 100 363 11 100.0 24.0 Tesco Superstores4 64 1,238 27 100.0 14.8 Teeside Shopping Park, Stockton-on-Tees 100 417 15 96.6 7.1 Drake Circus Shopping Centre, Plymouth 100 414 16 96.0 5.6
1 Annualised contracted rent, topped up for rent free, including 100% of Joint Ventures & Funds.2 Includes accommodation under offer or subject to asset management.3 Weighted average to first break.4 Comprises stand-alone assets/properties.
Occupiers representing over 0.5% of total contracted rent
At 31 March 2015 % of total rent % of total rent
Tesco plcDebenhamsJ Sainsbury plcHM GovernmentUBS AGKingfisher (B&Q)Home Retail GroupNext plcVirgin ActiveSpirit GroupDixons CarphoneAlliance BootsMarks & Spencer PlcArcadia GroupHerbert SmithRoyal Bank of ScotlandAegis GroupTJX Cos Inc (TK Maxx)New LookSportsDirectAsda Group
6.5 5.7 5.0 3.2 3.0 2.6 2.6 2.5 1.9 1.6 1.6 1.6 1.5 1.4 1.3 1.1 1.1 1.0 1.0 0.9 0.9
Vodafone plcFacebookAon PlcJPMorganReed SmithH&M Hennes & Mauritz ABDeutsche Bank AGChildren’s World Ltd (Mothercare)GazpromJD SportsMayer BrownICAP plcPets at HomeSteinhoffCarlson (TGI Friday’s)Lewis Trust (River Island)Credit AgricoleNokia OyjHendersonSantanderDFS
0.9 0.9 0.9 0.8 0.8 0.8 0.7 0.7 0.7 0.7 0.7 0.6 0.6 0.6 0.6 0.6 0.6 0.5 0.5 0.5 0.5
185British Land Annual Report and Accounts 2015
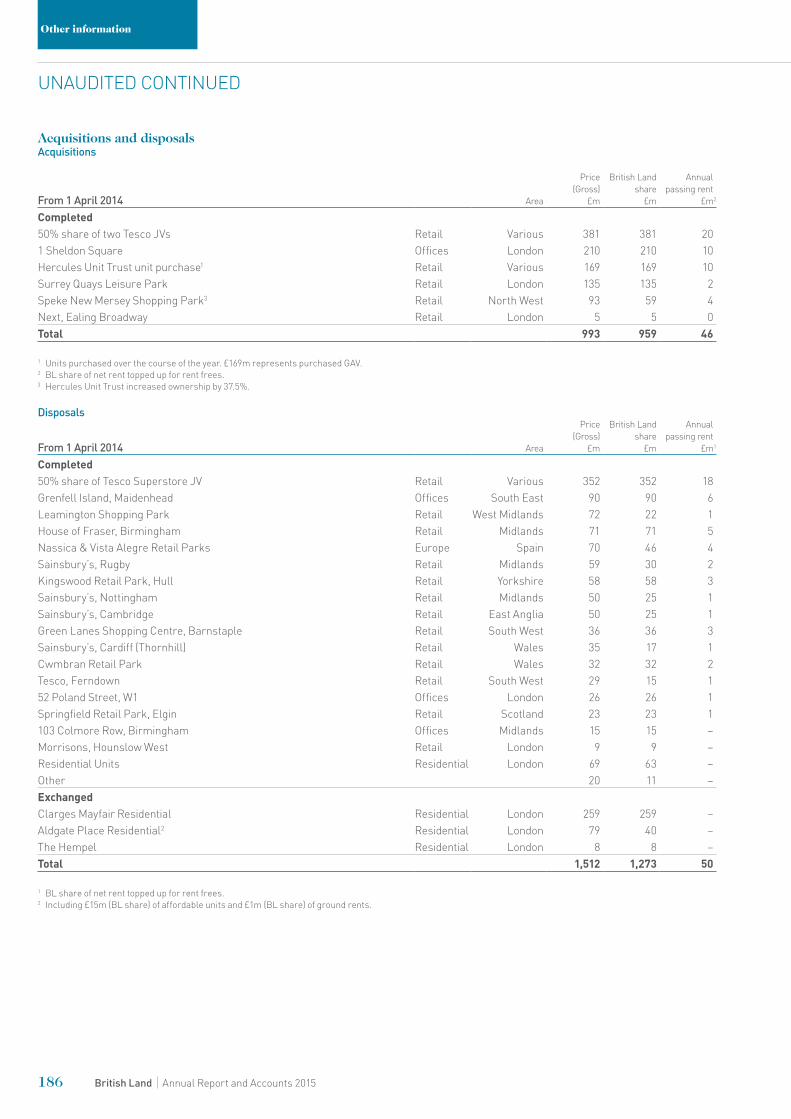
Acquisitions and disposals Acquisitions
From 1 April 2014 Area
Price (Gross)
£m
British Land share
£m
Annual passing rent
£m2
Completed 50% share of two Tesco JVs Retail Various 381 381 201 Sheldon Square Offices London 210 210 10Hercules Unit Trust unit purchase1 Retail Various 169 169 10Surrey Quays Leisure Park Retail London 135 135 2Speke New Mersey Shopping Park3 Retail North West 93 59 4Next, Ealing Broadway Retail London 5 5 0Total 993 959 46
1 Units purchased over the course of the year. £169m represents purchased GAV.2 BL share of net rent topped up for rent frees.3 Hercules Unit Trust increased ownership by 37.5%.
Disposals
From 1 April 2014 Area
Price (Gross)
£m
British Land share
£m
Annual passing rent
£m1
Completed 50% share of Tesco Superstore JV Retail Various 352 352 18Grenfell Island, Maidenhead Offices South East 90 90 6Leamington Shopping Park Retail West Midlands 72 22 1House of Fraser, Birmingham Retail Midlands 71 71 5Nassica & Vista Alegre Retail Parks Europe Spain 70 46 4Sainsbury’s, Rugby Retail Midlands 59 30 2Kingswood Retail Park, Hull Retail Yorkshire 58 58 3Sainsbury’s, Nottingham Retail Midlands 50 25 1Sainsbury’s, Cambridge Retail East Anglia 50 25 1Green Lanes Shopping Centre, Barnstaple Retail South West 36 36 3Sainsbury’s, Cardiff (Thornhill) Retail Wales 35 17 1Cwmbran Retail Park Retail Wales 32 32 2Tesco, Ferndown Retail South West 29 15 152 Poland Street, W1 Offices London 26 26 1Springfield Retail Park, Elgin Retail Scotland 23 23 1103 Colmore Row, Birmingham Offices Midlands 15 15 –Morrisons, Hounslow West Retail London 9 9 –Residential Units Residential London 69 63 –Other 20 11 –Exchanged Clarges Mayfair Residential Residential London 259 259 –Aldgate Place Residential2 Residential London 79 40 –The Hempel Residential London 8 8 –Total 1,512 1,273 50
1 BL share of net rent topped up for rent frees.2 Including £15m (BL share) of affordable units and £1m (BL share) of ground rents.
186 British Land Annual Report and Accounts 2015
Other information
UNAUDITED CONTINUED
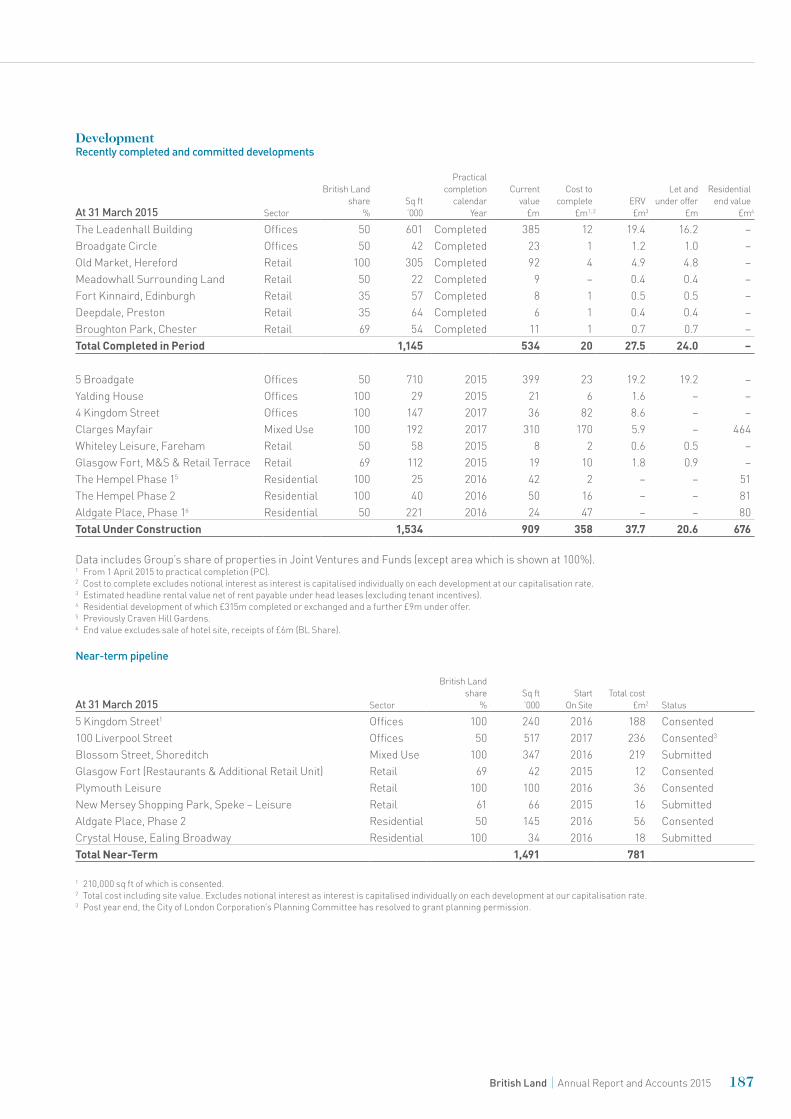
DevelopmentRecently completed and committed developments
At 31 March 2015 Sector
British Land share
%Sq ft’000
Practical completion
calendarYear
Current value
£m
Cost to complete
£m1, 2ERV£m3
Let and under offer
£m
Residentialend value
£m4
The Leadenhall Building Offices 50 601 Completed 385 12 19.4 16.2 – Broadgate Circle Offices 50 42 Completed 23 1 1.2 1.0 – Old Market, Hereford Retail 100 305 Completed 92 4 4.9 4.8 – Meadowhall Surrounding Land Retail 50 22 Completed 9 – 0.4 0.4 – Fort Kinnaird, Edinburgh Retail 35 57 Completed 8 1 0.5 0.5 – Deepdale, Preston Retail 35 64 Completed 6 1 0.4 0.4 – Broughton Park, Chester Retail 69 54 Completed 11 1 0.7 0.7 – Total Completed in Period 1,145 534 20 27.5 24.0 –
5 Broadgate Offices 50 710 2015 399 23 19.2 19.2 – Yalding House Offices 100 29 2015 21 6 1.6 – – 4 Kingdom Street Offices 100 147 2017 36 82 8.6 – – Clarges Mayfair Mixed Use 100 192 2017 310 170 5.9 – 464Whiteley Leisure, Fareham Retail 50 58 2015 8 2 0.6 0.5 – Glasgow Fort, M&S & Retail Terrace Retail 69 112 2015 19 10 1.8 0.9 – The Hempel Phase 15 Residential 100 25 2016 42 2 – – 51The Hempel Phase 2 Residential 100 40 2016 50 16 – – 81Aldgate Place, Phase 16 Residential 50 221 2016 24 47 – – 80Total Under Construction 1,534 909 358 37.7 20.6 676
Data includes Group’s share of properties in Joint Ventures and Funds (except area which is shown at 100%).1 From 1 April 2015 to practical completion (PC).2 Cost to complete excludes notional interest as interest is capitalised individually on each development at our capitalisation rate.3 Estimated headline rental value net of rent payable under head leases (excluding tenant incentives).4 Residential development of which £315m completed or exchanged and a further £9m under offer.5 Previously Craven Hill Gardens.6 End value excludes sale of hotel site, receipts of £6m (BL Share).
Near-term pipeline
At 31 March 2015 Sector
British Land share
%Sq ft’000
Start On Site
Total cost£m2 Status
5 Kingdom Street1 Offices 100 240 2016 188 Consented100 Liverpool Street Offices 50 517 2017 236 Consented3
Blossom Street, Shoreditch Mixed Use 100 347 2016 219 SubmittedGlasgow Fort (Restaurants & Additional Retail Unit) Retail 69 42 2015 12 ConsentedPlymouth Leisure Retail 100 100 2016 36 ConsentedNew Mersey Shopping Park, Speke – Leisure Retail 61 66 2015 16 SubmittedAldgate Place, Phase 2 Residential 50 145 2016 56 ConsentedCrystal House, Ealing Broadway Residential 100 34 2016 18 SubmittedTotal Near-Term 1,491 781
1 210,000 sq ft of which is consented.2 Total cost including site value. Excludes notional interest as interest is capitalised individually on each development at our capitalisation rate.3 Post year end, the City of London Corporation’s Planning Committee has resolved to grant planning permission.
187British Land Annual Report and Accounts 2015

DevelopmentMedium-term pipeline
At 31 March 2015 Sector
British Land share
%Sq ft’000 Status
Eden Walk Shopping Centre, Kingston Mixed Use 50 545 Pre-submissionCanada Water Masterplan1 Mixed Use 100 5,500 Pre-submission1 – 3 Finsbury Avenue2 Offices 50 460 Pre-submissionForster Retail Park, Bradford, Phase 3 Retail 100 60 Pre-submissionMeadowhall Land Retail 50 350 Pre-submissionTotal Medium-Term 6,915
1 Assumed net area based on gross area of up to 7m sq ft.2 Existing net areas, scheme in early design stages.
Residential development programme
At 31 March 2015Sq Ft‘000
No. Market Units
PC Date/ Status
BL Share%
Mar 15Value1
£m
Cost Tocome2
£mEnd Value
£m
Sales Exchanged &
Completed£m
Clarges Mayfair3 103 34 2017 100 228 137 464 259Mixed use 103 34 228 137 464 259Bedford Street4 28 17 Completed 100 18 – 28 24The Hempel Phase 1 25 15 2016 100 42 2 51 18The Hempel Phase 2 40 19 2016 100 50 16 81 –Aldgate Place Phase 1 221 154 2016 50 24 47 80 38Residential-led 314 205 134 65 240 80Aldgate Place Phase 2 145 Consented 50 Ealing, Crystal House 34 Submitted 100 Near Term prospective 179 Total Committed Residential 417 239 362 202 704 339
Data includes Group’s share of properties in Joint Ventures & Funds (except area which is shown at 100%)1 Excluding completed sales.2 From 1 April 2015 to practical completion (PC). Cost to complete excludes notional interest as interest is capitalised individually on each development
at our capitalisation rate.3 Includes 9,500 sq ft of affordable housing (11 units).4 Includes 14,000 sq ft of retail space.
Superstores
Stand-alone Superstores1 In Shopping Centres & Shopping Parks2 Total Exposure1,2,3
Store Size ‘000 SQ FT
№ of Stores
Valuation (BL share)
£m
Capital Value
psfWALL to
FB yrs№ of
Stores
Valuation (BL share)
£m
Capital Value
psfWALL to
FB yrs№ of
Stores
Valuation (BL share)
£m
Capital Value
psfWALL to
FB yrs
>100 9 242 377 13.6 5 366 552 13.8 14 608 466 13.7 75-100 14 294 470 18.7 1 41 483 12.9 15 335 471 17.9 50-75 17 296 443 13.2 1 12 190 12.1 18 308 421 13.1 25-50 9 64 244 9.4 3 31 437 15.5 12 95 285 11.3 0-25 8 28 200 13.3 19 79 405 11.6 27 107 321 12.1 March 2015 57 924 395 14.5 29 529 491 13.9 86 1,453 426 14.4 Sept 2014 81 1,286 423 14.5 26 337 479 13.9 107 1,623 433 14.4
Geographical Spread Gross Rent (BL Share) Lease Structure
London & South 59% Tesco £4m RPI and Fixed 11%Rest of UK 41% Sainsburys £3m OMRR 89% Other £7m
1 Excludes £10m non-foodstore occupiers in superstore led assets.2 Excludes non food-format stores e.g. Asda Living.3 Excludes £99m of investments held for trading comprising freehold reversions in a pool of Sainsbury’s Superstores.
188 British Land Annual Report and Accounts 2015
Other information
UNAUDITED CONTINUED
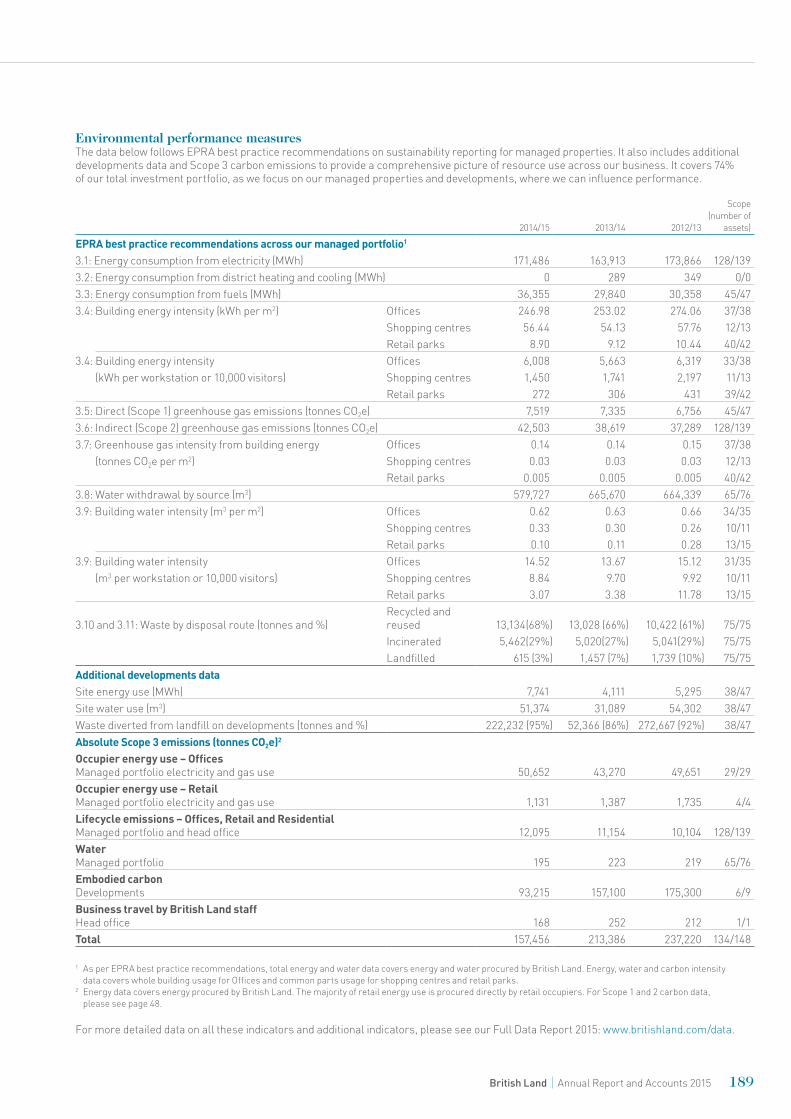
Environmental performance measuresThe data below follows EPRA best practice recommendations on sustainability reporting for managed properties. It also includes additional developments data and Scope 3 carbon emissions to provide a comprehensive picture of resource use across our business. It covers 74% of our total investment portfolio, as we focus on our managed properties and developments, where we can influence performance.
2014/15 2013/14 2012/13
Scope (number of
assets)
EPRA best practice recommendations across our managed portfolio1
3.1: Energy consumption from electricity (MWh) 171,486 163,913 173,866 128/1393.2: Energy consumption from district heating and cooling (MWh) 0 289 349 0/03.3: Energy consumption from fuels (MWh) 36,355 29,840 30,358 45/473.4: Building energy intensity (kWh per m2) Offices 246.98 253.02 274.06 37/38
Shopping centres 56.44 54.13 57.76 12/13Retail parks 8.90 9.12 10.44 40/42
3.4: Building energy intensity Offices 6,008 5,663 6,319 33/38(kWh per workstation or 10,000 visitors) Shopping centres 1,450 1,741 2,197 11/13
Retail parks 272 306 431 39/423.5: Direct (Scope 1) greenhouse gas emissions (tonnes CO2e) 7,519 7,335 6,756 45/473.6: Indirect (Scope 2) greenhouse gas emissions (tonnes CO2e) 42,503 38,619 37,289 128/1393.7: Greenhouse gas intensity from building energy Offices 0.14 0.14 0.15 37/38
(tonnes CO2e per m2) Shopping centres 0.03 0.03 0.03 12/13Retail parks 0.005 0.005 0.005 40/42
3.8: Water withdrawal by source (m3) 579,727 665,670 664,339 65/763.9: Building water intensity (m3 per m2) Offices 0.62 0.63 0.66 34/35
Shopping centres 0.33 0.30 0.26 10/11Retail parks 0.10 0.11 0.28 13/15
3.9: Building water intensity Offices 14.52 13.67 15.12 31/35(m3 per workstation or 10,000 visitors) Shopping centres 8.84 9.70 9.92 10/11
Retail parks 3.07 3.38 11.78 13/15
3.10 and 3.11: Waste by disposal route (tonnes and %)Recycled and reused 13,134(68%) 13,028 (66%) 10,422 (61%) 75/75Incinerated 5,462(29%) 5,020(27%) 5,041(29%) 75/75Landfilled 615 (3%) 1,457 (7%) 1,739 (10%) 75/75
Additional developments data Site energy use (MWh) 7,741 4,111 5,295 38/47Site water use (m3) 51,374 31,089 54,302 38/47Waste diverted from landfill on developments (tonnes and %) 222,232 (95%) 52,366 (86%) 272,667 (92%) 38/47Absolute Scope 3 emissions (tonnes CO2e)2 Occupier energy use – Offices Managed portfolio electricity and gas use 50,652 43,270 49,651 29/29 Occupier energy use – Retail Managed portfolio electricity and gas use 1,131 1,387 1,735 4/4Lifecycle emissions – Offices, Retail and Residential Managed portfolio and head office 12,095 11,154 10,104 128/139Water Managed portfolio 195 223 219 65/76Embodied carbon Developments 93,215 157,100 175,300 6/9 Business travel by British Land staff Head office 168 252 212 1/1 Total 157,456 213,386 237,220 134/148
1 As per EPRA best practice recommendations, total energy and water data covers energy and water procured by British Land. Energy, water and carbon intensity data covers whole building usage for Offices and common parts usage for shopping centres and retail parks.
2 Energy data covers energy procured by British Land. The majority of retail energy use is procured directly by retail occupiers. For Scope 1 and 2 carbon data, please see page 48.
For more detailed data on all these indicators and additional indicators, please see our Full Data Report 2015: www.britishland.com/data.
189British Land Annual Report and Accounts 2015
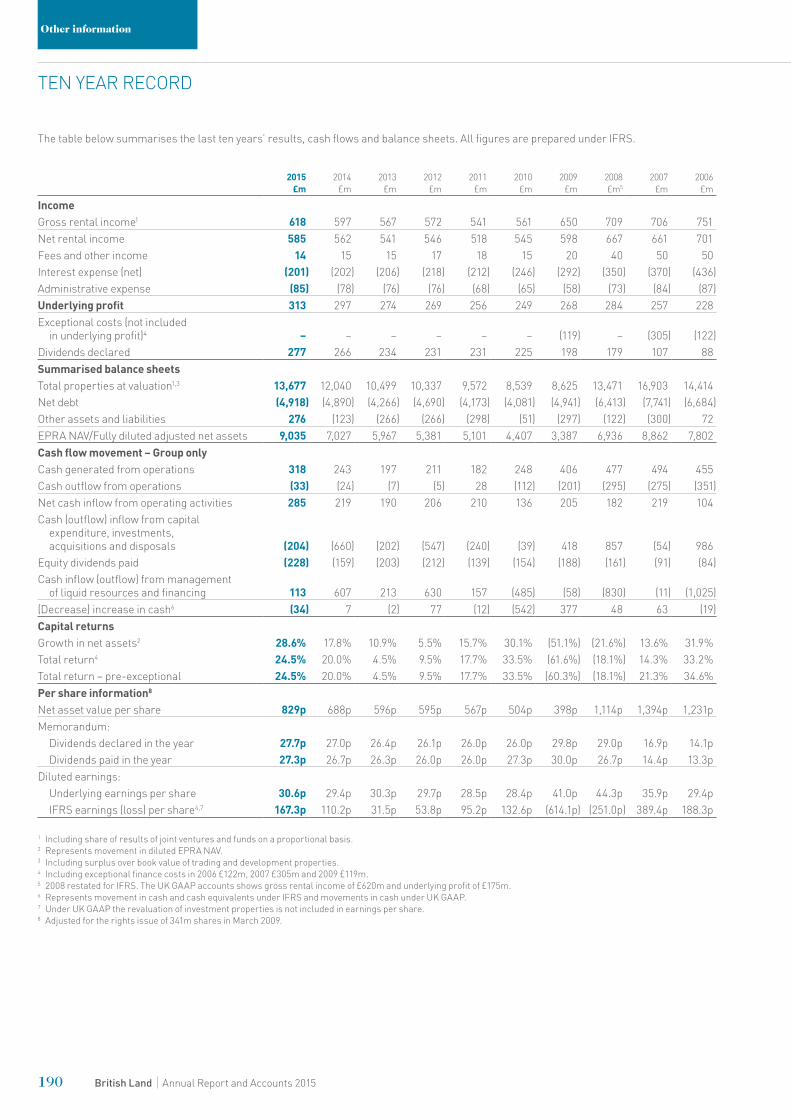
The table below summarises the last ten years’ results, cash flows and balance sheets. All figures are prepared under IFRS.
2015 £m
2014£m
2013£m
2012£m
2011£m
2010£m
2009£m
2008£m5
2007£m
2006£m
IncomeGross rental income1 618 597 567 572 541 561 650 709 706 751 Net rental income 585 562 541 546 518 545 598 667 661 701 Fees and other income 14 15 15 17 18 15 20 40 50 50 Interest expense (net) (201) (202) (206) (218) (212) (246) (292) (350) (370) (436)Administrative expense (85) (78) (76) (76) (68) (65) (58) (73) (84) (87)Underlying profit 313 297 274 269 256 249 268 284 257 228 Exceptional costs (not included
in underlying profit)4 – – – – – – (119) – (305) (122)Dividends declared 277 266 234 231 231 225 198 179 107 88 Summarised balance sheetsTotal properties at valuation1,3 13,677 12,040 10,499 10,337 9,572 8,539 8,625 13,471 16,903 14,414 Net debt (4,918) (4,890) (4,266) (4,690) (4,173) (4,081) (4,941) (6,413) (7,741) (6,684)Other assets and liabilities 276 (123) (266) (266) (298) (51) (297) (122) (300) 72 EPRA NAV/Fully diluted adjusted net assets 9,035 7,027 5,967 5,381 5,101 4,407 3,387 6,936 8,862 7,802 Cash flow movement – Group only Cash generated from operations 318 243 197 211 182 248 406 477 494 455 Cash outflow from operations (33) (24) (7) (5) 28 (112) (201) (295) (275) (351)Net cash inflow from operating activities 285 219 190 206 210 136 205 182 219 104 Cash (outflow) inflow from capital
expenditure, investments, acquisitions and disposals (204) (660) (202) (547) (240) (39) 418 857 (54) 986
Equity dividends paid (228) (159) (203) (212) (139) (154) (188) (161) (91) (84)Cash inflow (outflow) from management
of liquid resources and financing 113 607 213 630 157 (485) (58) (830) (11) (1,025)(Decrease) increase in cash6 (34) 7 (2) 77 (12) (542) 377 48 63 (19)Capital returnsGrowth in net assets2 28.6% 17.8% 10.9% 5.5% 15.7% 30.1% (51.1%) (21.6%) 13.6% 31.9%Total return4 24.5% 20.0% 4.5% 9.5% 17.7% 33.5% (61.6%) (18.1%) 14.3% 33.2%Total return – pre-exceptional 24.5% 20.0% 4.5% 9.5% 17.7% 33.5% (60.3%) (18.1%) 21.3% 34.6%Per share information8
Net asset value per share 829p 688p 596p 595p 567p 504p 398p 1,114p 1,394p 1,231pMemorandum:
Dividends declared in the year 27.7p 27.0p 26.4p 26.1p 26.0p 26.0p 29.8p 29.0p 16.9p 14.1pDividends paid in the year 27.3p 26.7p 26.3p 26.0p 26.0p 27.3p 30.0p 26.7p 14.4p 13.3p
Diluted earnings:Underlying earnings per share 30.6p 29.4p 30.3p 29.7p 28.5p 28.4p 41.0p 44.3p 35.9p 29.4pIFRS earnings (loss) per share4,7 167.3p 110.2p 31.5p 53.8p 95.2p 132.6p (614.1p) (251.0p) 389.4p 188.3p
1 Including share of results of joint ventures and funds on a proportional basis.2 Represents movement in diluted EPRA NAV.3 Including surplus over book value of trading and development properties.4 Including exceptional finance costs in 2006 £122m, 2007 £305m and 2009 £119m.5 2008 restated for IFRS. The UK GAAP accounts shows gross rental income of £620m and underlying profit of £175m.6 Represents movement in cash and cash equivalents under IFRS and movements in cash under UK GAAP.7 Under UK GAAP the revaluation of investment properties is not included in earnings per share.8 Adjusted for the rights issue of 341m shares in March 2009.
190 British Land Annual Report and Accounts 2015
Other information
TEN YEAR RECORD
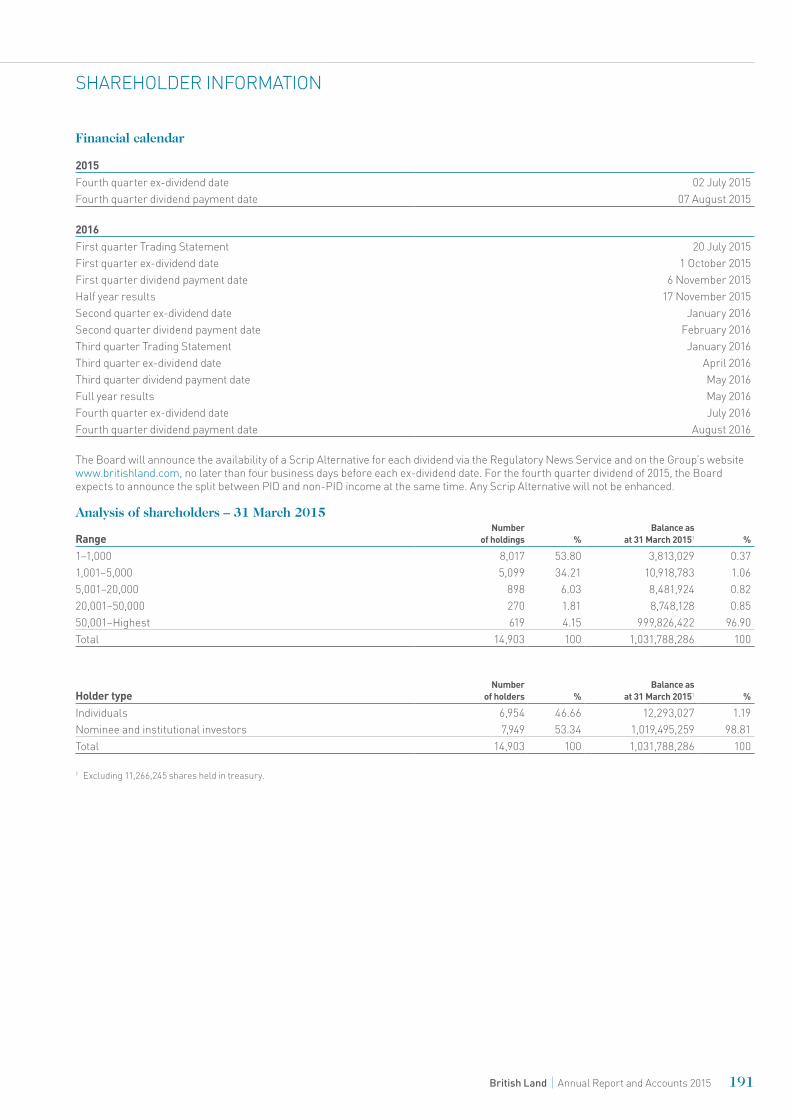
Financial calendar
2015Fourth quarter ex-dividend date 02 July 2015 Fourth quarter dividend payment date 07 August 2015
2016First quarter Trading Statement 20 July 2015 First quarter ex-dividend date 1 October 2015First quarter dividend payment date 6 November 2015Half year results 17 November 2015Second quarter ex-dividend date January 2016Second quarter dividend payment date February 2016Third quarter Trading Statement January 2016Third quarter ex-dividend date April 2016Third quarter dividend payment date May 2016Full year results May 2016Fourth quarter ex-dividend date July 2016Fourth quarter dividend payment date August 2016
The Board will announce the availability of a Scrip Alternative for each dividend via the Regulatory News Service and on the Group’s website www.britishland.com, no later than four business days before each ex-dividend date. For the fourth quarter dividend of 2015, the Board expects to announce the split between PID and non-PID income at the same time. Any Scrip Alternative will not be enhanced.
Analysis of shareholders – 31 March 2015
Range Number
of holdings %Balance as
at 31 March 20151 %
1–1,000 8,017 53.80 3,813,029 0.371,001–5,000 5,099 34.21 10,918,783 1.065,001–20,000 898 6.03 8,481,924 0.8220,001–50,000 270 1.81 8,748,128 0.8550,001–Highest 619 4.15 999,826,422 96.90Total 14,903 100 1,031,788,286 100
Holder type Number
of holders %Balance as
at 31 March 20151 %
Individuals 6,954 46.66 12,293,027 1.19Nominee and institutional investors 7,949 53.34 1,019,495,259 98.81Total 14,903 100 1,031,788,286 100
1 Excluding 11,266,245 shares held in treasury.
191British Land Annual Report and Accounts 2015
SHAREHOLDER INFORMATION
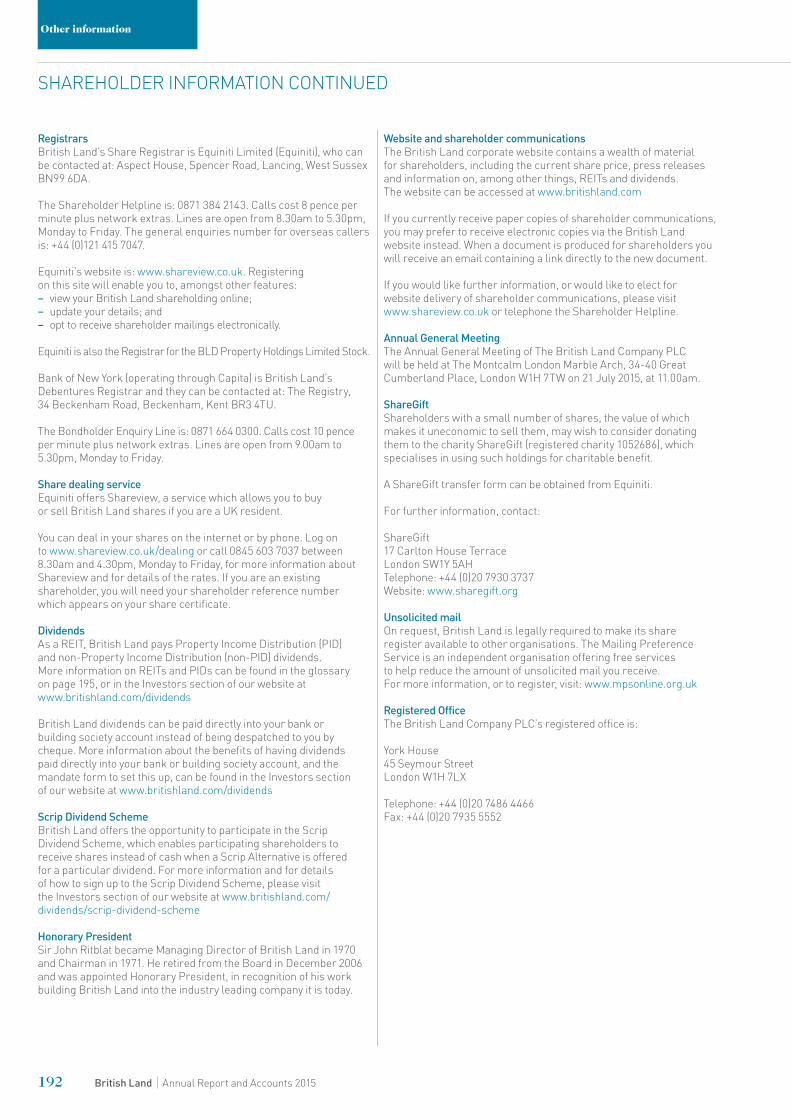
RegistrarsBritish Land’s Share Registrar is Equiniti Limited (Equiniti), who can be contacted at: Aspect House, Spencer Road, Lancing, West Sussex BN99 6DA.
The Shareholder Helpline is: 0871 384 2143. Calls cost 8 pence per minute plus network extras. Lines are open from 8.30am to 5.30pm, Monday to Friday. The general enquiries number for overseas callers is: +44 (0)121 415 7047.
Equiniti’s website is: www.shareview.co.uk. Registering on this site will enable you to, amongst other features: – view your British Land shareholding online; – update your details; and – opt to receive shareholder mailings electronically.
Equiniti is also the Registrar for the BLD Property Holdings Limited Stock.
Bank of New York (operating through Capita) is British Land’s Debentures Registrar and they can be contacted at: The Registry, 34 Beckenham Road, Beckenham, Kent BR3 4TU.
The Bondholder Enquiry Line is: 0871 664 0300. Calls cost 10 pence per minute plus network extras. Lines are open from 9.00am to 5.30pm, Monday to Friday.
Share dealing serviceEquiniti offers Shareview, a service which allows you to buy or sell British Land shares if you are a UK resident.
You can deal in your shares on the internet or by phone. Log on to www.shareview.co.uk/dealing or call 0845 603 7037 between 8.30am and 4.30pm, Monday to Friday, for more information about Shareview and for details of the rates. If you are an existing shareholder, you will need your shareholder reference number which appears on your share certificate.
DividendsAs a REIT, British Land pays Property Income Distribution (PID) and non-Property Income Distribution (non-PID) dividends. More information on REITs and PIDs can be found in the glossary on page 195, or in the Investors section of our website at www.britishland.com/dividends
British Land dividends can be paid directly into your bank or building society account instead of being despatched to you by cheque. More information about the benefits of having dividends paid directly into your bank or building society account, and the mandate form to set this up, can be found in the Investors section of our website at www.britishland.com/dividends
Scrip Dividend SchemeBritish Land offers the opportunity to participate in the Scrip Dividend Scheme, which enables participating shareholders to receive shares instead of cash when a Scrip Alternative is offered for a particular dividend. For more information and for details of how to sign up to the Scrip Dividend Scheme, please visit the Investors section of our website at www.britishland.com/ dividends/scrip-dividend-scheme
Honorary PresidentSir John Ritblat became Managing Director of British Land in 1970 and Chairman in 1971. He retired from the Board in December 2006 and was appointed Honorary President, in recognition of his work building British Land into the industry leading company it is today.
Website and shareholder communicationsThe British Land corporate website contains a wealth of material for shareholders, including the current share price, press releases and information on, among other things, REITs and dividends. The website can be accessed at www.britishland.com
If you currently receive paper copies of shareholder communications, you may prefer to receive electronic copies via the British Land website instead. When a document is produced for shareholders you will receive an email containing a link directly to the new document.
If you would like further information, or would like to elect for website delivery of shareholder communications, please visit www.shareview.co.uk or telephone the Shareholder Helpline.
Annual General MeetingThe Annual General Meeting of The British Land Company PLC will be held at The Montcalm London Marble Arch, 34-40 Great Cumberland Place, London W1H 7TW on 21 July 2015, at 11.00am.
ShareGiftShareholders with a small number of shares, the value of which makes it uneconomic to sell them, may wish to consider donating them to the charity ShareGift (registered charity 1052686), which specialises in using such holdings for charitable benefit.
A ShareGift transfer form can be obtained from Equiniti.
For further information, contact:
ShareGift 17 Carlton House Terrace London SW1Y 5AH Telephone: +44 (0)20 7930 3737 Website: www.sharegift.org
Unsolicited mailOn request, British Land is legally required to make its share register available to other organisations. The Mailing Preference Service is an independent organisation offering free services to help reduce the amount of unsolicited mail you receive. For more information, or to register, visit: www.mpsonline.org.uk
Registered OfficeThe British Land Company PLC’s registered office is:
York House 45 Seymour Street London W1H 7LX
Telephone: +44 (0)20 7486 4466 Fax: +44 (0)20 7935 5552
192 British Land Annual Report and Accounts 2015
Other information
SHAREHOLDER INFORMATION CONTINUED
Annualised rent is the gross property rent receivable on a cash basis as at the reporting date. Additionally, it includes the external valuers’ estimate of additional rent in respect of unsettled rent review, turnover rent and sundry income such as that from car parks and commercialisation, less any ground rents payable under head leases.
Assets under management is the full value of all assets managed by British Land and includes 100% of the value of all joint ventures and funds.
BREEAM (Building Research Establishment Environmental Assessment Method) assesses the sustainability of buildings against a range of social and environmental criteria.
Capital return is calculated as the change in capital value of the UK portfolio, less any capital expenditure incurred, expressed as a percentage of capital employed over the period, as calculated by IPD. Capital returns are calculated monthly and indexed to provide a return over the relevant period.
Capped rents are rents subject to a maximum level of uplift at the specified rent reviews as agreed at the time of letting.
Collar rents are rents subject to a minimum level of uplift at the specified rent reviews as agreed at the time of letting.
Contracted rent is the annualised rent adjusting for the inclusion of rent subject to rent free periods.
Customer satisfaction our definition of customer satisfaction has this year been expanded to include consumers as well as occupiers, to better relate to our focus on creating Places People Prefer. This year we have included exit survey data for consumer satisfaction in the retail business (FY2014-15 vs FY2013-14), as well as office and retail occupier satisfaction scores, and in future we aim to be able to further expand to include consumer satisfaction for other sectors.
Developer’s profit is the profit on cost estimated by the valuers that a developer would expect. The developer’s profit is typically calculated by the valuers to be a percentage of the estimated total development costs, including land and notional finance costs.
Development uplift is the total increase in the value (after taking account of capital expenditure and capitalised interest) of properties held for development during the period. It also includes any developer’s profit recognised by valuers in the period.
Development cost is the total cost of construction of a project to completion, excluding site values and finance costs (finance costs are assumed by the valuers at a notional rate of 5.5% per annum).
EPRA is the European Public Real Estate Association, the industry body for European REITs.
EPRA Cost Ratio (including direct vacancy costs) is the ratio of net overheads and operating expenses against gross rental income (with both amounts excluding ground rents payable). Net overheads and operating expenses relate to all administrative and operating expenses including the share of joint ventures’ overheads and operating expenses, net of any service fees, recharges or other income specifically intended to cover overhead and property expenses.
EPRA Cost Ratio (excluding direct vacancy costs) is the ratio calculated above, but with direct vacancy costs removed from net overheads and operating expenses balance.
EPRA earnings is the profit after taxation excluding investment and development property revaluations and gains/losses on disposals, changes in the fair value of financial instruments and associated close-out costs and their related taxation.
EPRA NAV per share is EPRA NAV divided by the diluted number of shares at the period end.
EPRA net assets (EPRA NAV) are the balance sheet net assets excluding the mark-to-market on effective cash flow hedges and related debt adjustments and deferred taxation on revaluations.
EPRA net initial yield is the annualised rents generated by the portfolio, after the deduction of an estimate of annual recurring irrecoverable property outgoings, expressed as a percentage of the portfolio valuation (adding notional purchaser’s costs), excluding development and residential properties.
EPRA NNNAV is the EPRA NAV adjusted to reflect the fair value of debt and derivatives and to include deferred taxation on revaluations.
EPRA Topped-Up Net Initial Yield is the current annualised rent, net of costs, topped-up for contracted uplifts, where these are not in lieu of rental growth, expressed as a percentage of capital value, after allowing for notional purchaser’s costs.
EPRA vacancy rate is the estimated market rental value (ERV) of vacant space divided by ERV of the whole portfolio, excluding developments and residential property. This is the inverse of the occupancy rate.
Estimated Rental Value (ERV) is the external valuers’ opinion as to the open market rent which, on the date of valuation, could reasonably be expected to be obtained on a new letting or rent review of a property.
193British Land Annual Report and Accounts 2015
GLOSSARY
Fair value movement is accounting adjustment to change the book value of an asset or liability to its market value.
Footfall is the annualised number of visitors entering our assets (calculated on a weighted basis).
Gross investment activity as measured by our share of acquisitions, sales and investment in committed development.
Gross rental income is the gross accounting rent receivable (quoted either for the period or on an annualised basis) prepared under IFRS which requires that rental income from fixed / minimum guaranteed rent reviews and tenant incentives is spread on a straight-line basis over the entire lease to first break. This can result in income being recognised ahead of cash flow.
Group is The British Land Company PLC and its subsidiaries and excludes its share of joint ventures and funds (where not treated as a subsidiary) on a line-by-line basis (i.e. not proportionally consolidated).
Headline rent is the contracted gross rent receivable which becomes payable after all the tenant incentives in the letting have expired.
IFRS are the International Financial Reporting Standards as adopted by the European Union.
Income return is calculated as net income expressed as a percentage of capital employed over the period, as calculated by IPD. Income returns are calculated monthly and indexed to provide a return over the relevant period.
Interest cover is the number of times net interest payable is covered by underlying profit before net interest payable and taxation.
IPD is Investment Property Databank Ltd which produces an independent benchmark of property returns and British Land UK portfolio returns.
Lettings and lease renewals are compared both to the previous passing rent as at the start of the financial year and the ERV immediately prior to letting. Both comparisons are made on a net effective basis.
Leverage see loan to value (LTV).
Like-for-like ERV growth is the change in ERV over a period on the standing investment properties expressed as a percentage of the ERV at the start of the period. Like-for-like ERV growth is calculated monthly and compounded for the period subject to measurement, as calculated by IPD.
Like-for-like rental income growth is the growth in net rental income on properties owned throughout the current and previous periods under review. This growth rate includes revenue recognition and lease accounting adjustments but excludes properties held for development in either period and properties with guaranteed rent reviews.
Loan to value (LTV) is the ratio of principal value of gross debt less cash, short term deposits and liquid investments to the aggregate value of properties and investments.
Mark-to-market is the difference between the book value of an asset or liability and its market value.
Multi-channel retailing is the use of a variety of channels in a customer’s shopping experience, including research, before a purchase. Such channels include: retail stores, online stores, mobile stores, mobile app stores, telephone sales and any other method of transacting with a customer. Transacting includes browsing, buying, returning as well as pre- and post-sale service.
Net Development Value is the estimated end value of a development project as determined by the external valuers for when the building is completed and fully let (taking into account tenant incentives and notional purchaser’s costs). It is based on the valuers view on ERVs, yields, letting voids and rent-frees.
Net effective rent is the contracted gross rent receivable taking into account any rent-free period or other tenant incentives. The incentives are treated as a cost-to-rent and spread over the lease to the earliest termination date.
Net equivalent yield is the weighted average income return (after allowing for notional purchaser’s costs) a property will produce based upon the timing of the income received. In accordance with usual practice, the equivalent yields (as determined by the external valuers) assume rent is received annually in arrears.
Net Initial Yield is the current annualised rent, net of costs, expressed as a percentage of capital value, after allowing for notional purchaser’s costs.
Net rental income is the rental income receivable in the period after payment of direct property outgoings which typically comprise ground rents payable under head leases, void costs, net service charge expenses and other direct irrecoverable property expenses. Net rental income is quoted on an accounting basis. Net rental income will differ from annualised net cash rents and passing rent due to the effects of income from rent reviews, net property outgoings and accounting adjustments for fixed and minimum contracted rent reviews and lease incentives.
Net reversionary yield is the anticipated yield to which the initial yield will rise (or fall) once the rent reaches the estimated rental value.
Occupancy rate is the estimated rental value of let units as a percentage of the total estimated rental value of the portfolio, excluding development properties. It includes accommodation under offer or subject to asset management (where they have been taken back for refurbishment and are not available to let as at the balance sheet date).
Omni-channel retailing is the evolution of multi-channel retailing, but is concentrated more on a seamless approach to the consumer experience through all available shopping channels i.e. mobile internet devices, computers, bricks and mortar, television, radio, direct mail, catalogue, etc.
Over rented is the term used to describe when the contracted rent is above the estimated rental value (ERV).
Overall ‘topped-up’ net initial yield is the EPRA Net ‘topped-up’ Initial Yield, adding all contracted uplifts to the annualised rents.
194 British Land Annual Report and Accounts 2015
Other information
GLOSSARY CONTINUED
Passing rent is the gross rent, less any ground rent payable under head leases.
Portfolio valuation movement is the increase in value of the portfolio of properties held at the balance sheet date and net sales receipts of those sold during the period, expressed as a percentage of the capital value at the start of the period plus net capital expenditure, capitalised interest and transaction costs.
Property Income Distributions (PIDs) are profits distributed to shareholders which are subject to tax in the hands of the shareholders as property income. PIDs are normally paid net of withholding tax currently at 20% which the REIT pays to the tax authorities on behalf of the shareholder. Certain types of shareholder (i.e. pension funds) are tax exempt and receive PIDs without withholding tax. Property companies also pay out normal dividends, called non-PIDs, which are treated as normal dividends and are not subject to withholding tax.
Property valuation is reported by the Group’s external valuers. In accordance with usual practice, they report valuations net, after the deduction of the notional purchaser’s costs, including stamp duty land tax, agent and legal fees.
Rack rented is the term used to describe when the contracted rent is in line with the estimated rental value (ERV), implying a nil reversion.
Rent-free period see Tenant (or lease) incentives.
REITs are property companies that allow people and organisations to invest in commercial property and receive benefits as if they directly owned the properties themselves. The rental income, after costs, is passed directly to shareholders in the form of dividends. In the UK REITs are required to distribute at least 90% of their tax exempt property income to shareholders as dividends. As a result, over time, a significant proportion of the total return for shareholders is likely to come from dividends. The effect is that taxation is moved from the corporate level to the investor level as investors are liable for tax as if they owned the property directly. British Land became a REIT in January 2007
Rent reviews take place at intervals agreed in the lease (typically every five years) and their purpose is usually to adjust the rent to the current market level at the review date. For upwards-only rent reviews, the rent will either remain at the same level or increase (if market rents have increased) at the review date.
Rents with fixed and minimum uplifts are either where rents are subject to contracted uplifts at a level agreed at the time of letting; or where the rent is subject to an agreed minimum level of uplift at the specified rent review.
Retail planning consents are separated between A1, A2 and A3 – as set out in The Town and Country Planning (Use Classes) Order. Within the A1 category, Open A1 permission allows for any type of retail to be accommodated, while Restricted A1 permission places limits on the types of retail that can operate (for example, a restriction that only bulky goods operators are allowed to trade at that site).
Class Description Use for all/any of the following purposes
A1 Shops Shops, retail warehouses, hairdressers, undertakers, travel and ticket agencies, post offices, pet shops, sandwich bars, showrooms, domestic hire shops, dry cleaners, funeral directors and internet cafes.
A2 Financial and professional services
Financial services such as banks and building societies, professional services (other than health and medical services) and including estate and employment agencies. It does not include betting offices or pay day loan shops - these are now classed as “sui generis” uses.
A3 Restaurants and cafes
For the sale of food and drink for consumption on the premises - restaurants, snack bars and cafes.
D2 Assembly and leisure
Cinemas, music and concert halls,bingo and dance halls (but not nightclubs), swimming baths, skating rinks,gymnasiums or areas for indoor oroutdoor sports and recreations.
Reversion is the increase in rent estimated by the external valuers, where the passing rent is below the estimated rental value. The increases to rent arises on rent reviews and lettings.
Scrip dividend British Land offers its shareholders the opportunity to receive dividends in the form of shares instead of cash. This is known as a Scrip dividend.
Standing investments are assets which are directly held and not in the course of development.
195British Land Annual Report and Accounts 2015
Tenant (or lease) incentives are incentives offered to occupiers to enter into a lease. Typically this will be an initial rent-free period, or a cash contribution to fit-out. Under accounting rules the value of lease incentives is amortised through the income statement on a straight-line basis to the earliest lease termination date.
TMT stands for technology, media and telecommunications.
The residual site value of a development is calculated as the estimated (net) development value, less development profit, all development construction costs, finance costs (assumed at a notional rate) of a project to completion and notional site acquisition costs. The residual is determined to be the current site value.
Topping out is a traditional construction ceremony to mark the occasion when the structure of the building reaches the highest point.
Total property return is calculated as the change in capital value, less any capital expenditure incurred, plus net income, expressed as a percentage of capital employed over the period, as calculated by IPD. Total property returns are calculated monthly and indexed to provide a return over the relevant period.
Total return (total accounting return) is the growth in EPRA NAV plus dividends paid, and this can be expressed as a percentage of EPRA NAV per share at the beginning of the period.
Total Shareholder Return is the growth in value of a shareholding over a specified period, assuming dividends are reinvested to purchase additional units of stock.
Total tax contribution is a more comprehensive view of tax contributions than the accountancy-defined tax figure quoted in most financial statements. It comprises taxes and levies paid directly, as well as taxes collected from others which we administered.
Turnover rents is where all or a portion of the rent is linked to the sales or turnover of the occupier.
Under rented is the term used to describe when the contracted rent is below the estimated rental value (ERV), implying a positive reversion.
Underlying earnings per share (EPS) consists of underlying profit after tax divided by the diluted weighted average number of shares in issue during the period.
Underlying profit before tax is the pre-tax EPRA earnings measure with additional Company adjustments. Adjustments include mark-to-market adjustments on, or profits on disposal of, held for trading assets, mark-to-market adjustments on the convertible bond and issue costs of the convertible bond.
Virtual freehold represents a long leasehold tenure for a period of up to 999 years. A ‘peppercorn’, or nominal, rent is paid annually.
Weighted average debt maturity – each tranche of Group debt is multiplied by the remaining period to its maturity and the result is divided by total Group debt in issue at the period end.
Weighted average interest rate is the Group loan interest and derivative costs per annum at the period end, divided by total Group debt in issue at the period end.
Weighted average unexpired lease term is the average lease term remaining to first break, or expiry, across the portfolio weighted by contracted rental income (including rent-frees). The calculation excludes residential leases and properties allocated as developments.
Yield compression occurs when the net equivalent yield of a property decreases, measured in basis points.
Yield on cost is the estimated annual rent of the completed development divided by the total cost of development including site value and notional finance costs to the point of assumed rent commencement, expressed as a percentage return.
Yield shift is a movement (usually expressed in bps) in the yield of a property asset, or like-for-like portfolio, over a given period. Yield compression is a commonly-used term for a reduction in yields.
196 British Land Annual Report and Accounts 2015
Other information
GLOSSARY CONTINUED