Embed Size (px)
Citation preview
Page 1 of 54
FDA Executive Summary
Prepared for the March 29, 2018 meeting of the
Clinical Chemistry and Clinical Toxicology Devices Panel P160048
Eversense Continuous Glucose Monitoring System Senseonics, Inc.
I. Introduction This document is the FDA Executive Summary for the meeting of the Clinical Chemistry and Clinical Toxicology Devices Advisory Panel meeting on the Eversense Continuous Glucose Monitoring System (hereafter known as Eversense CGM) from Senseonics, Inc. The sponsor (Senseonics) has submitted an original premarket approval application (PMA number P160048) to obtain marketing approval for the Eversense CGM. The Eversense CGM sensor is a fluorescence-based glucose sensor that is implanted subcutaneously by a physician during a minor office based surgical procedure. The sensor lasts for up to 90 days, after which it must be removed by a physician during another minor office based surgical procedure. The submission is under review by the Division of Chemistry and Toxicology Devices (DCTD), Office of In vitro Diagnostics and Radiological Health (OIR), within the Center for Devices and Radiological Health (CDRH) of the Food and Drug Administration (FDA). This document will provide background on continuous glucose monitoring systems (CGMs) and the clinical studies and other information Senseonics has submitted in support of this new device. FDA is seeking the panel’s opinion on whether Senseonics has provided adequate information to support the safe and effective use of the Eversense CGM by people living with diabetes.
FDA Executive Summary – Senseonics Eversense Continuous Glucose Monitoring System
Page 2 of 54
II. Contents
I. Introduction ............................................................................................. 1
II. Contents .................................................................................................... 2
III. Background on Continuous Glucose Monitors .................................... 3
IV. Senseonics Eversense Continuous Glucose Monitoring System ......... 6
V. Bench Testing.........................................................................................15
VI. Clinical Data ..........................................................................................18
i. Eversense CGM Pivotal Clinical Study (PRECISE II study) ............................ 18
ii. Eversense CGM Supplementary Clinical Study (PRECISION study)............... 24
VII. Design Changes after US Clinical Studies ..........................................29
i. New System Algorithm ......................................................................................... 29
ii. Sensor Insertion Tools ......................................................................................... 44
iii. Sensor End Cap .................................................................................................... 46
iv. New Transmitter ................................................................................................... 47
VIII. Data available from the European market .........................................49
IX. Postmarket Data and Proposed Post-Approval Study ......................52
X. Summary ................................................................................................53
XI. Questions for the Panel .........................................................................53
XII. Appendices: ............................................................................................54
XIII. References ..............................................................................................54
FDA Executive Summary – Senseonics Eversense Continuous Glucose Monitoring System
Page 3 of 54
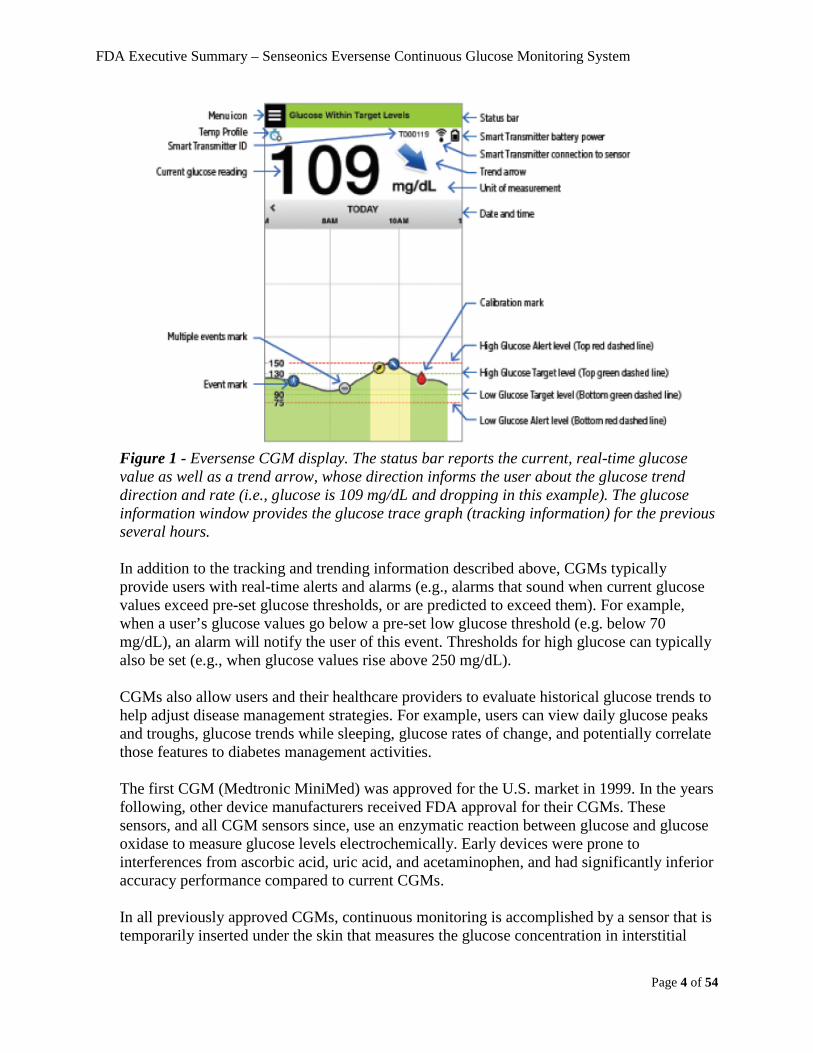
III. Background on Continuous Glucose Monitors Diabetes mellitus is a group of metabolic disorders characterized by poor physiological glucose control. Two major classes of diabetes, which differ in etiology, are prevalent in the population: Type I and Type II diabetes. Type I diabetes is predominantly characterized by loss of function of the insulin-producing beta cells of the islets of Langerhans in the pancreas, due to T-cell-mediated autoimmune destruction. Type II diabetes is characterized by the inability of an individual to respond adequately to normal levels of insulin (insulin resistance) and beta cell dysfunction (decreased insulin production). Acute complications of diabetes include hyperglycemia, which when untreated can lead to hyperglycemic emergency, including diabetic ketoacidosis (DKA) and hyperglycemic hyperosmolar syndrome (HHS), as well as severe hypoglycemia, which can lead to loss of consciousness, seizures, or death. Long-term complications of diabetes include cardiovascular disease, cerebrovascular disease, peripheral vascular disease, nephropathy, neuropathy, and retinopathy. Long-term prognosis varies according to individual factors, including disease duration and glycemic control. Most people with diabetes need to monitor their glucose levels on a frequent basis: typically several times a day. These measurements are a means to monitor the user’s glucose levels when they are experiencing potential side effects of low or high glucose concentrations, but also when they are asymptomatic, since maintaining glucose levels near optimal levels is essential to prevention of complications. For example, one would test blood glucose, and if the value is too low, they would treat hypoglycemia to raise their blood sugar. For patients with insulin-dependent diabetes, a high blood glucose concentration is used to calculate the insulin dose needed to bring them into a more optimal range (euglycemia). The high frequency of daily glucose determinations can practically only be conducted with devices intended for home-use. There are currently two types of devices intended to help people with diabetes monitor their blood glucose values at home: Self-monitoring blood glucose meters (SMBG) and continuous glucose monitors (CGMs). SMBGs directly measure blood glucose concentrations in capillary blood collected from the finger. People with insulin dependent diabetes typically monitor by SMBG 3-10 times per day, and in addition to regular monitoring, are advised to do so prior to calculating an insulin bolus (e.g., to correct hyperglycemia, and/or to account for meal carbohydrates). People with Type II diabetes typically perform fewer SMBG measurements per day. CGMs provide a “continuous” series of glucose readings (typically a new glucose reading is determined every few minutes). Though CGMs have lower point accuracy than SMBG, CGMs have other features which provide additional information to the user. Real-time glucose results may be displayed along with a trend line graph for recent past glucose level readings. Trend information provides the direction of the current glucose trend and approximate rate of change (see Figure 1 below depicting the Eversense Continuous Glucose Monitoring System mobile app display).
FDA Executive Summary – Senseonics Eversense Continuous Glucose Monitoring System
Page 4 of 54
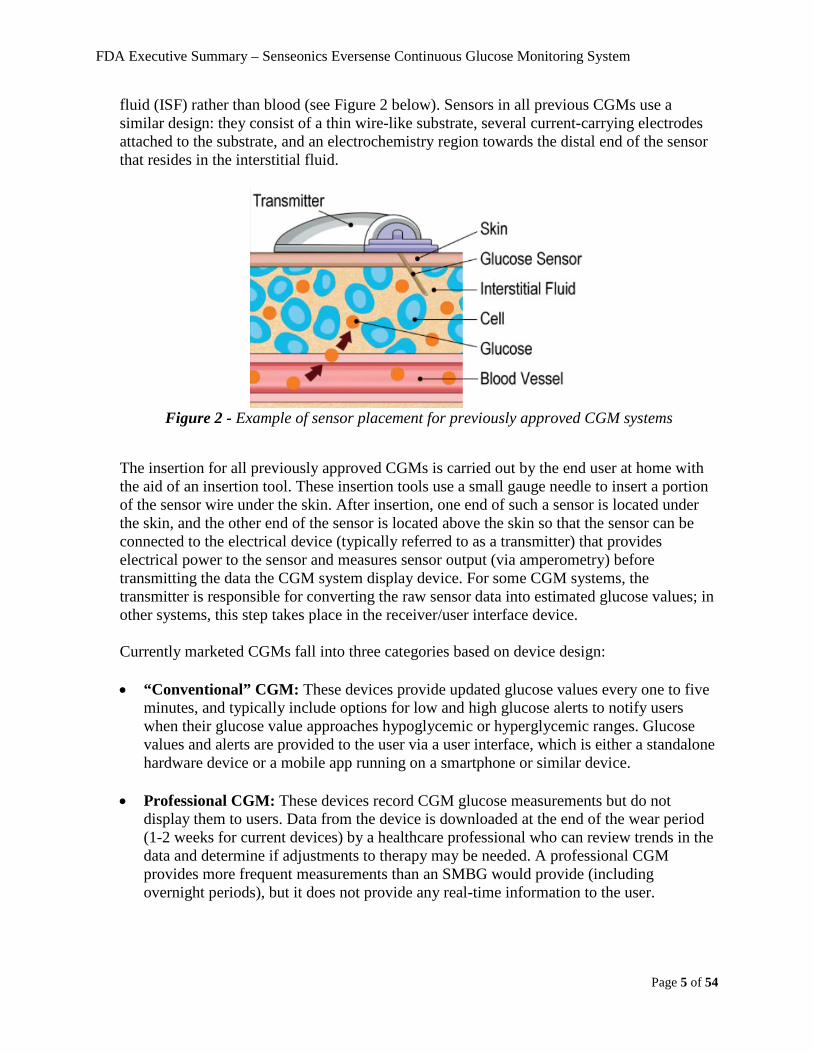
Figure 1 - Eversense CGM display. The status bar reports the current, real-time glucose value as well as a trend arrow, whose direction informs the user about the glucose trend direction and rate (i.e., glucose is 109 mg/dL and dropping in this example). The glucose information window provides the glucose trace graph (tracking information) for the previous several hours. In addition to the tracking and trending information described above, CGMs typically provide users with real-time alerts and alarms (e.g., alarms that sound when current glucose values exceed pre-set glucose thresholds, or are predicted to exceed them). For example, when a user’s glucose values go below a pre-set low glucose threshold (e.g. below 70 mg/dL), an alarm will notify the user of this event. Thresholds for high glucose can typically also be set (e.g., when glucose values rise above 250 mg/dL). CGMs also allow users and their healthcare providers to evaluate historical glucose trends to help adjust disease management strategies. For example, users can view daily glucose peaks and troughs, glucose trends while sleeping, glucose rates of change, and potentially correlate those features to diabetes management activities. The first CGM (Medtronic MiniMed) was approved for the U.S. market in 1999. In the years following, other device manufacturers received FDA approval for their CGMs. These sensors, and all CGM sensors since, use an enzymatic reaction between glucose and glucose oxidase to measure glucose levels electrochemically. Early devices were prone to interferences from ascorbic acid, uric acid, and acetaminophen, and had significantly inferior accuracy performance compared to current CGMs. In all previously approved CGMs, continuous monitoring is accomplished by a sensor that is temporarily inserted under the skin that measures the glucose concentration in interstitial
FDA Executive Summary – Senseonics Eversense Continuous Glucose Monitoring System
Page 5 of 54
fluid (ISF) rather than blood (see Figure 2 below). Sensors in all previous CGMs use a similar design: they consist of a thin wire-like substrate, several current-carrying electrodes attached to the substrate, and an electrochemistry region towards the distal end of the sensor that resides in the interstitial fluid.
Figure 2 - Example of sensor placement for previously approved CGM systems
The insertion for all previously approved CGMs is carried out by the end user at home with the aid of an insertion tool. These insertion tools use a small gauge needle to insert a portion of the sensor wire under the skin. After insertion, one end of such a sensor is located under the skin, and the other end of the sensor is located above the skin so that the sensor can be connected to the electrical device (typically referred to as a transmitter) that provides electrical power to the sensor and measures sensor output (via amperometry) before transmitting the data the CGM system display device. For some CGM systems, the transmitter is responsible for converting the raw sensor data into estimated glucose values; in other systems, this step takes place in the receiver/user interface device. Currently marketed CGMs fall into three categories based on device design: • “Conventional” CGM: These devices provide updated glucose values every one to five
minutes, and typically include options for low and high glucose alerts to notify users when their glucose value approaches hypoglycemic or hyperglycemic ranges. Glucose values and alerts are provided to the user via a user interface, which is either a standalone hardware device or a mobile app running on a smartphone or similar device.
• Professional CGM: These devices record CGM glucose measurements but do not display them to users. Data from the device is downloaded at the end of the wear period (1-2 weeks for current devices) by a healthcare professional who can review trends in the data and determine if adjustments to therapy may be needed. A professional CGM provides more frequent measurements than an SMBG would provide (including overnight periods), but it does not provide any real-time information to the user.

FDA Executive Summary – Senseonics Eversense Continuous Glucose Monitoring System
Page 6 of 54
• “Flash” CGM: There is currently one device, the Abbott FreeStyle Libre CGM System, which does not fit into either of the above two classes of CGM. This device is similar to a tracking and trending CGM in how it is generally designed to detect glucose in interstitial fluid, however it does not automatically send these measurements to a display device and it cannot provide automated alerts like a “conventional” CGM. Instead, a user must bring the display device in very close proximity to the sensor (e.g., “scan” the sensor) when they wish to see their current CGM glucose measurement. With each “scan”, the prior eight hours of retrospective CGM data, collected every 15 minutes, can also be retrieved and viewed for glucose trends.
The Eversense CGM system has some important differences compared to currently approved CGMs that are described below. However, the Eversense CGM is most similar in data output to a “conventional” CGM as described above. Currently marketed CGMs can also be distinguished based on their intended use. There are two classes of intended use that current CGMs fall into: • Adjunctive Use: The information provided by these devices is not intended to be used to
make therapy decisions. For example, the CGM value should not be used to calculate an insulin dose. For a user of an adjunctive CGM, an SMBG measurement should be used to confirm the blood glucose value prior to any therapy decisions.
• Non-Adjunctive Use: The information provided by these devices may be used for without confirmation by SMBG measurements. A non-adjunctive claim carries a higher risk because inaccurate CGM values can lead directly to incorrect therapy decisions which can have serious and immediate health consequences.
Senseonics is requesting approval for an adjunctive use claim for the Eversense CGM system. This should be considered when evaluating the risk profile of the system.
IV. Senseonics Eversense Continuous Glucose Monitoring System i. Indications for Use Senseonics has proposed the following Indications for Use for the Eversense CGM system:
The Eversense Continuous Glucose Monitoring System is indicated for continually measuring interstitial fluid glucose levels in adults (age 18 and older) with diabetes for the operating life of the sensor. The system is intended to:
• Provide real-time glucose readings. • Provide glucose trend information. • Provide alerts for the detection and prediction of episodes of low blood
glucose (hypoglycemia) and high blood glucose (hyperglycemia).
FDA Executive Summary – Senseonics Eversense Continuous Glucose Monitoring System
Page 7 of 54
The system is a prescription device. Historical data from the system can be interpreted to aid in providing therapy adjustments. These adjustments should be based on patterns seen over time. The system is indicated for use as an adjunctive device to complement, not replace, information obtained from standard home blood glucose monitoring devices.
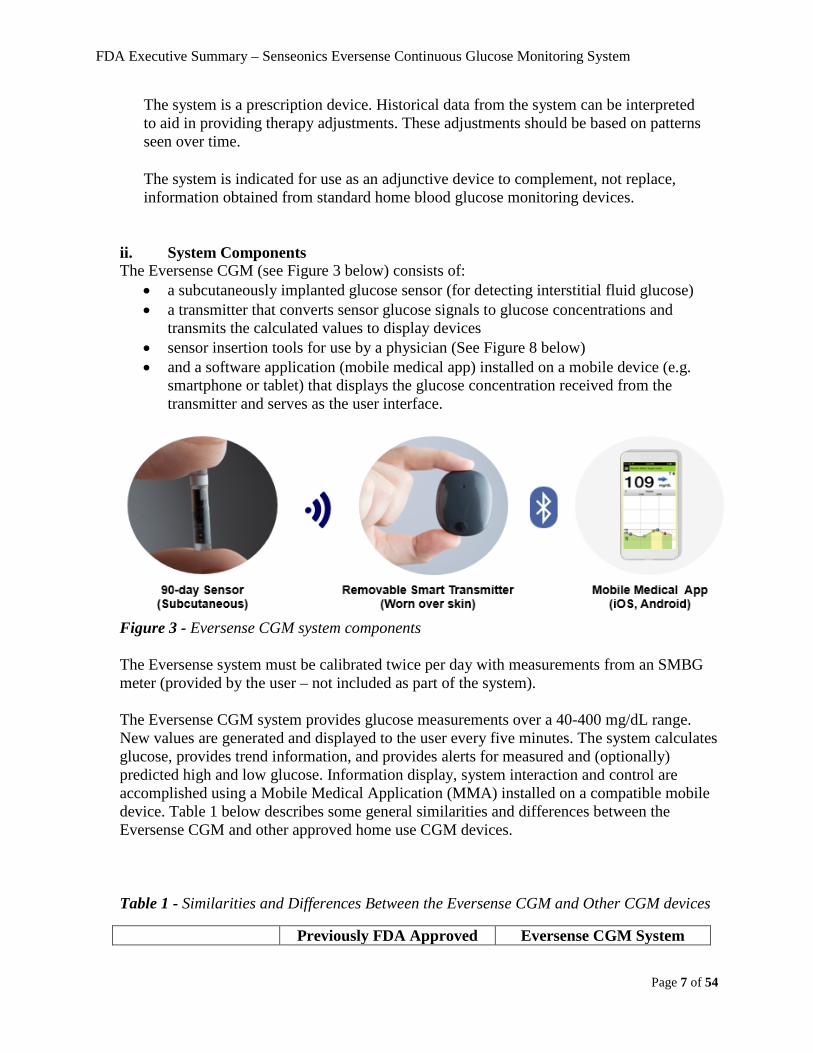
ii. System Components The Eversense CGM (see Figure 3 below) consists of:
• a subcutaneously implanted glucose sensor (for detecting interstitial fluid glucose) • a transmitter that converts sensor glucose signals to glucose concentrations and
transmits the calculated values to display devices • sensor insertion tools for use by a physician (See Figure 8 below) • and a software application (mobile medical app) installed on a mobile device (e.g.
smartphone or tablet) that displays the glucose concentration received from the transmitter and serves as the user interface.
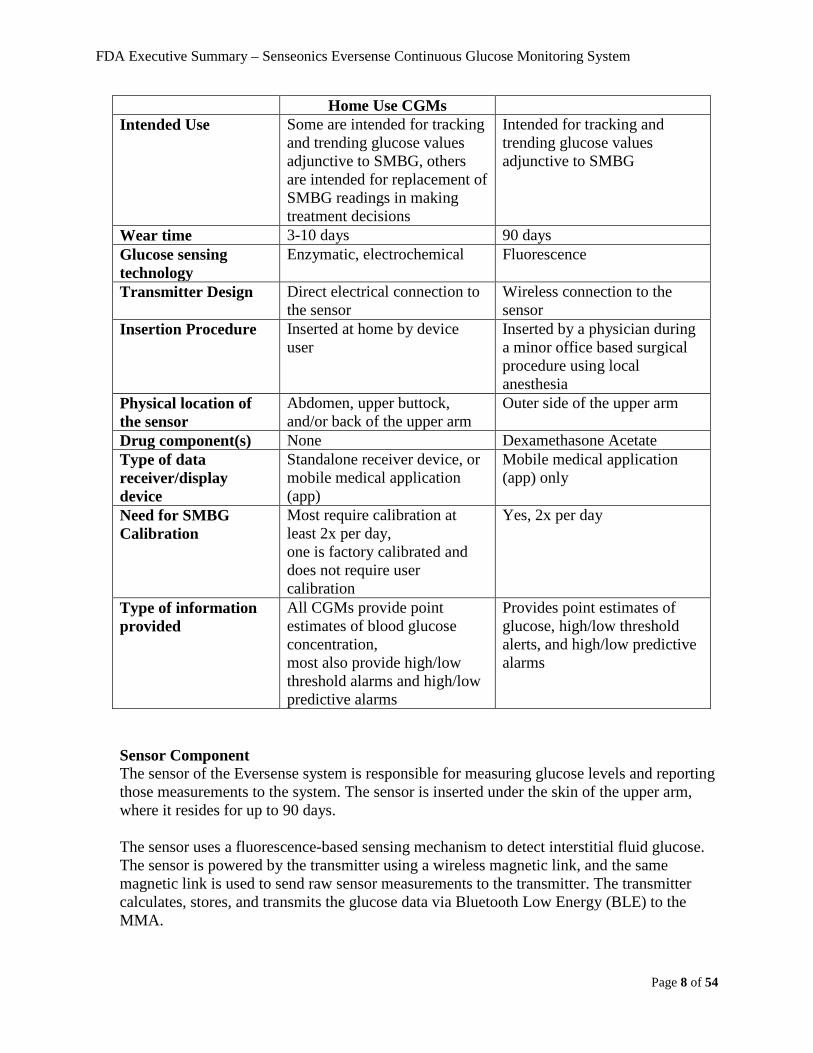
Figure 3 - Eversense CGM system components The Eversense system must be calibrated twice per day with measurements from an SMBG meter (provided by the user – not included as part of the system). The Eversense CGM system provides glucose measurements over a 40-400 mg/dL range. New values are generated and displayed to the user every five minutes. The system calculates glucose, provides trend information, and provides alerts for measured and (optionally) predicted high and low glucose. Information display, system interaction and control are accomplished using a Mobile Medical Application (MMA) installed on a compatible mobile device. Table 1 below describes some general similarities and differences between the Eversense CGM and other approved home use CGM devices. Table 1 - Similarities and Differences Between the Eversense CGM and Other CGM devices
Previously FDA Approved Eversense CGM System
FDA Executive Summary – Senseonics Eversense Continuous Glucose Monitoring System
Page 8 of 54
Home Use CGMs Intended Use Some are intended for tracking
and trending glucose values adjunctive to SMBG, others are intended for replacement of SMBG readings in making treatment decisions
Intended for tracking and trending glucose values adjunctive to SMBG
Wear time 3-10 days 90 days Glucose sensing technology
Enzymatic, electrochemical Fluorescence
Transmitter Design Direct electrical connection to the sensor
Wireless connection to the sensor
Insertion Procedure Inserted at home by device user
Inserted by a physician during a minor office based surgical procedure using local anesthesia
Physical location of the sensor
Abdomen, upper buttock, and/or back of the upper arm
Outer side of the upper arm
Drug component(s) None Dexamethasone Acetate Type of data receiver/display device
Standalone receiver device, or mobile medical application (app)
Mobile medical application (app) only
Need for SMBG Calibration
Most require calibration at least 2x per day, one is factory calibrated and does not require user calibration
Yes, 2x per day
Type of information provided
All CGMs provide point estimates of blood glucose concentration, most also provide high/low threshold alarms and high/low predictive alarms
Provides point estimates of glucose, high/low threshold alerts, and high/low predictive alarms
Sensor Component The sensor of the Eversense system is responsible for measuring glucose levels and reporting those measurements to the system. The sensor is inserted under the skin of the upper arm, where it resides for up to 90 days. The sensor uses a fluorescence-based sensing mechanism to detect interstitial fluid glucose. The sensor is powered by the transmitter using a wireless magnetic link, and the same magnetic link is used to send raw sensor measurements to the transmitter. The transmitter calculates, stores, and transmits the glucose data via Bluetooth Low Energy (BLE) to the MMA.
FDA Executive Summary – Senseonics Eversense Continuous Glucose Monitoring System
Page 9 of 54
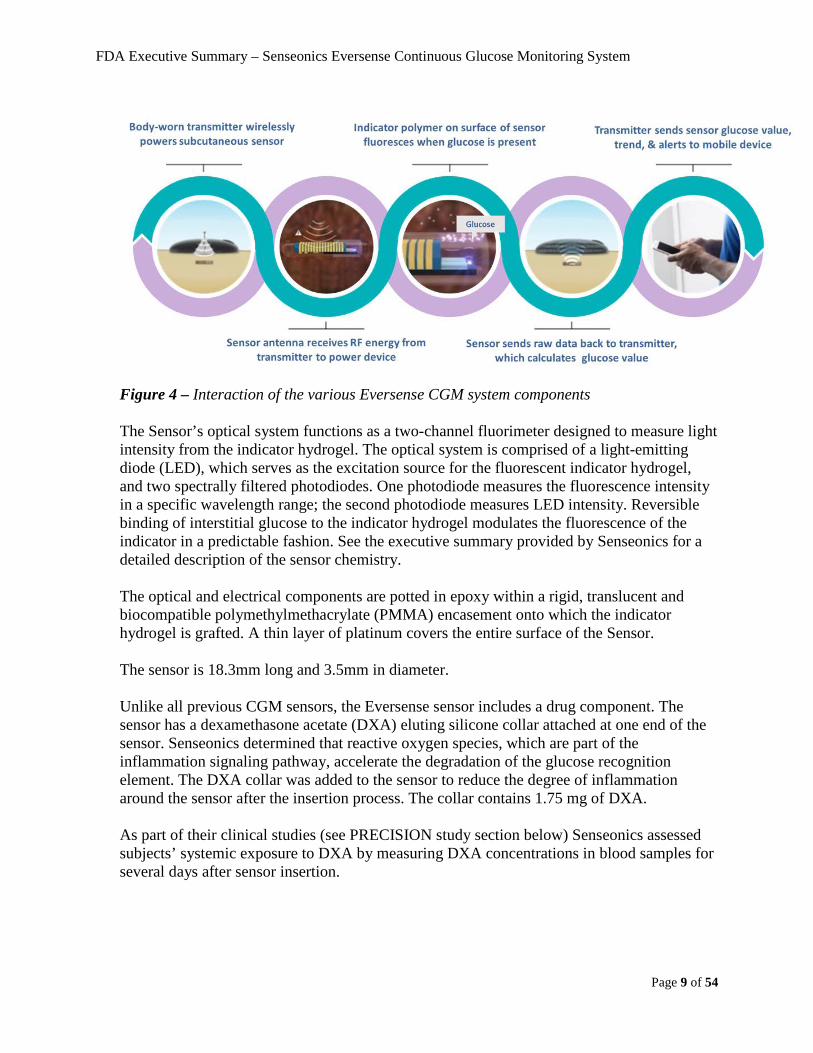
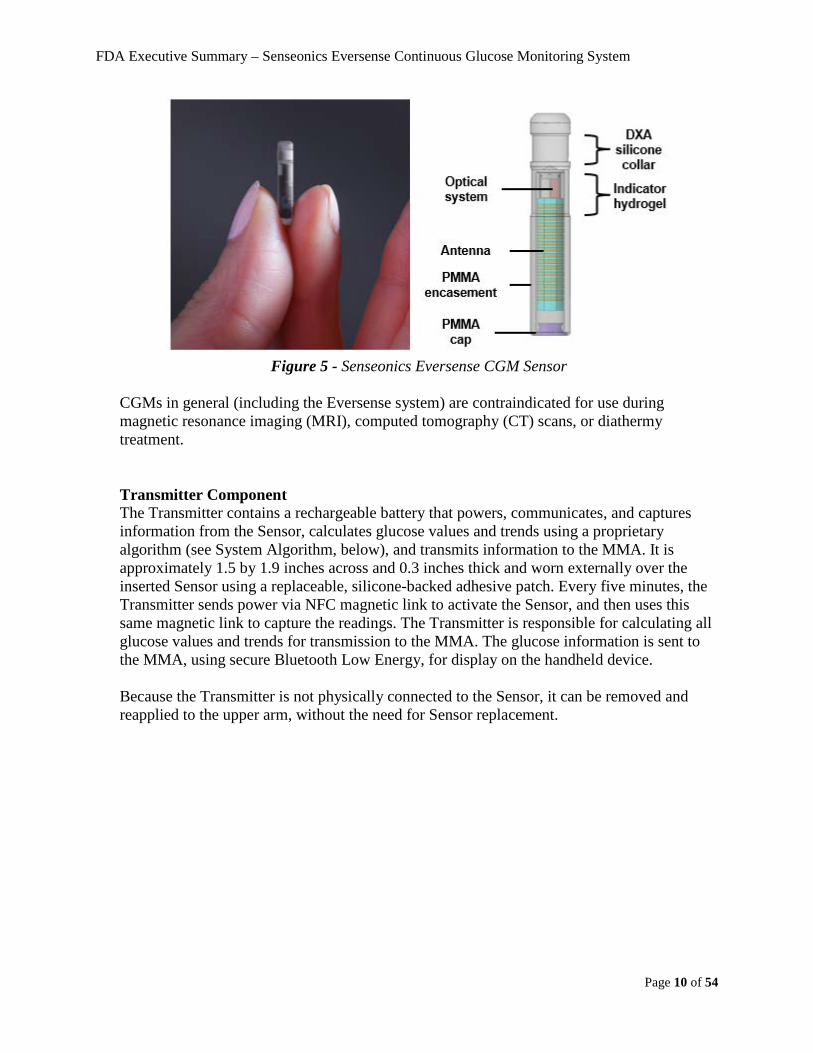
Figure 4 – Interaction of the various Eversense CGM system components The Sensor’s optical system functions as a two-channel fluorimeter designed to measure light intensity from the indicator hydrogel. The optical system is comprised of a light-emitting diode (LED), which serves as the excitation source for the fluorescent indicator hydrogel, and two spectrally filtered photodiodes. One photodiode measures the fluorescence intensity in a specific wavelength range; the second photodiode measures LED intensity. Reversible binding of interstitial glucose to the indicator hydrogel modulates the fluorescence of the indicator in a predictable fashion. See the executive summary provided by Senseonics for a detailed description of the sensor chemistry. The optical and electrical components are potted in epoxy within a rigid, translucent and biocompatible polymethylmethacrylate (PMMA) encasement onto which the indicator hydrogel is grafted. A thin layer of platinum covers the entire surface of the Sensor. The sensor is 18.3mm long and 3.5mm in diameter. Unlike all previous CGM sensors, the Eversense sensor includes a drug component. The sensor has a dexamethasone acetate (DXA) eluting silicone collar attached at one end of the sensor. Senseonics determined that reactive oxygen species, which are part of the inflammation signaling pathway, accelerate the degradation of the glucose recognition element. The DXA collar was added to the sensor to reduce the degree of inflammation around the sensor after the insertion process. The collar contains 1.75 mg of DXA. As part of their clinical studies (see PRECISION study section below) Senseonics assessed subjects’ systemic exposure to DXA by measuring DXA concentrations in blood samples for several days after sensor insertion.
FDA Executive Summary – Senseonics Eversense Continuous Glucose Monitoring System
Page 10 of 54
Figure 5 - Senseonics Eversense CGM Sensor
CGMs in general (including the Eversense system) are contraindicated for use during magnetic resonance imaging (MRI), computed tomography (CT) scans, or diathermy treatment. Transmitter Component The Transmitter contains a rechargeable battery that powers, communicates, and captures information from the Sensor, calculates glucose values and trends using a proprietary algorithm (see System Algorithm, below), and transmits information to the MMA. It is approximately 1.5 by 1.9 inches across and 0.3 inches thick and worn externally over the inserted Sensor using a replaceable, silicone-backed adhesive patch. Every five minutes, the Transmitter sends power via NFC magnetic link to activate the Sensor, and then uses this same magnetic link to capture the readings. The Transmitter is responsible for calculating all glucose values and trends for transmission to the MMA. The glucose information is sent to the MMA, using secure Bluetooth Low Energy, for display on the handheld device. Because the Transmitter is not physically connected to the Sensor, it can be removed and reapplied to the upper arm, without the need for Sensor replacement.
FDA Executive Summary – Senseonics Eversense Continuous Glucose Monitoring System
Page 11 of 54
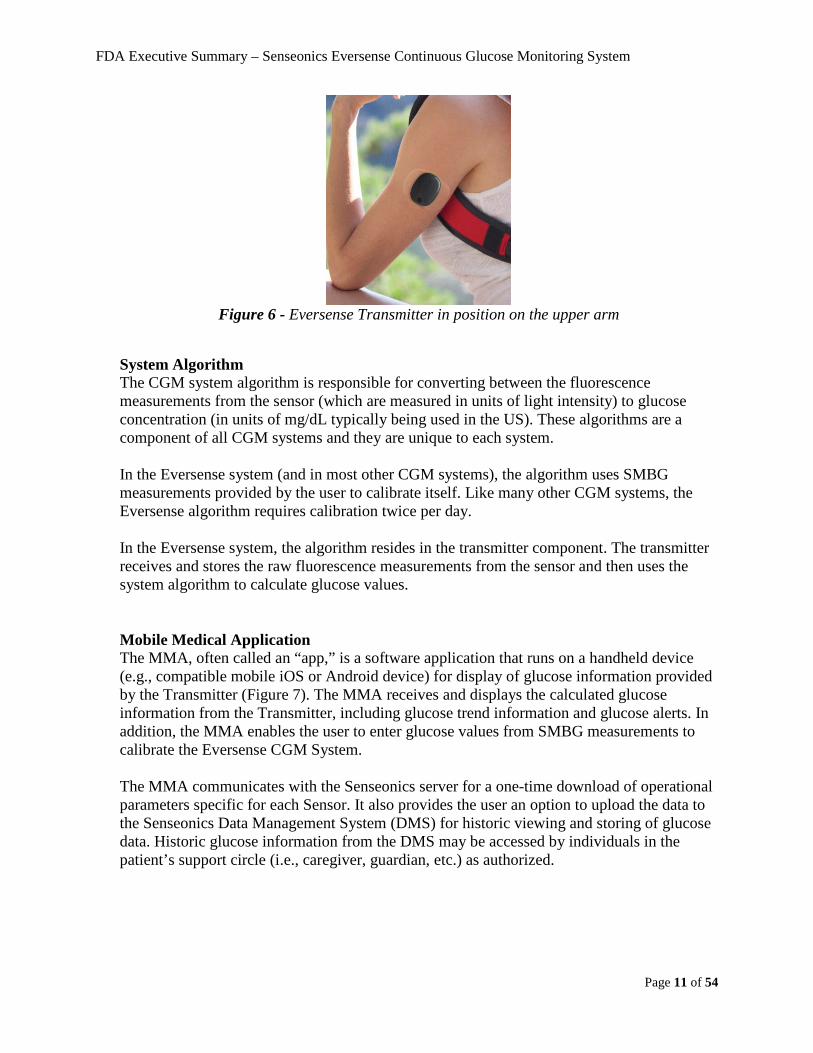
Figure 6 - Eversense Transmitter in position on the upper arm
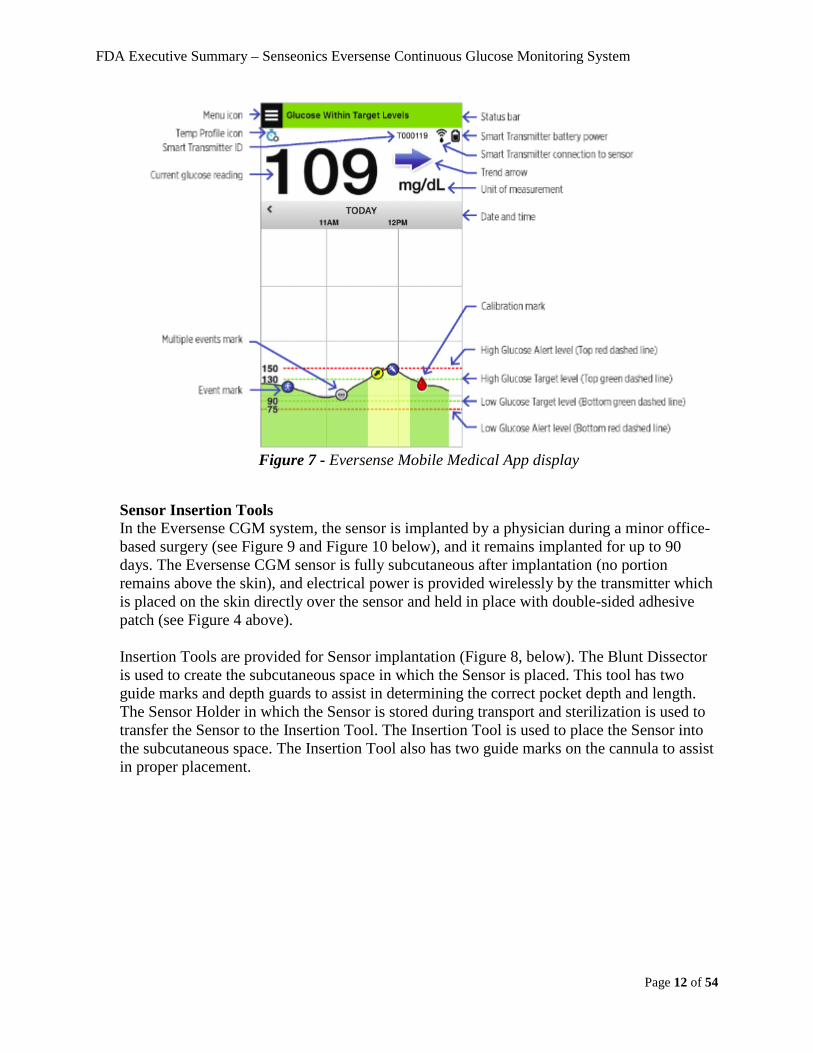
System Algorithm The CGM system algorithm is responsible for converting between the fluorescence measurements from the sensor (which are measured in units of light intensity) to glucose concentration (in units of mg/dL typically being used in the US). These algorithms are a component of all CGM systems and they are unique to each system. In the Eversense system (and in most other CGM systems), the algorithm uses SMBG measurements provided by the user to calibrate itself. Like many other CGM systems, the Eversense algorithm requires calibration twice per day. In the Eversense system, the algorithm resides in the transmitter component. The transmitter receives and stores the raw fluorescence measurements from the sensor and then uses the system algorithm to calculate glucose values. Mobile Medical Application The MMA, often called an “app,” is a software application that runs on a handheld device (e.g., compatible mobile iOS or Android device) for display of glucose information provided by the Transmitter (Figure 7). The MMA receives and displays the calculated glucose information from the Transmitter, including glucose trend information and glucose alerts. In addition, the MMA enables the user to enter glucose values from SMBG measurements to calibrate the Eversense CGM System. The MMA communicates with the Senseonics server for a one-time download of operational parameters specific for each Sensor. It also provides the user an option to upload the data to the Senseonics Data Management System (DMS) for historic viewing and storing of glucose data. Historic glucose information from the DMS may be accessed by individuals in the patient’s support circle (i.e., caregiver, guardian, etc.) as authorized.
FDA Executive Summary – Senseonics Eversense Continuous Glucose Monitoring System
Page 12 of 54
Figure 7 - Eversense Mobile Medical App display
Sensor Insertion Tools In the Eversense CGM system, the sensor is implanted by a physician during a minor office-based surgery (see Figure 9 and Figure 10 below), and it remains implanted for up to 90 days. The Eversense CGM sensor is fully subcutaneous after implantation (no portion remains above the skin), and electrical power is provided wirelessly by the transmitter which is placed on the skin directly over the sensor and held in place with double-sided adhesive patch (see Figure 4 above). Insertion Tools are provided for Sensor implantation (Figure 8, below). The Blunt Dissector is used to create the subcutaneous space in which the Sensor is placed. This tool has two guide marks and depth guards to assist in determining the correct pocket depth and length. The Sensor Holder in which the Sensor is stored during transport and sterilization is used to transfer the Sensor to the Insertion Tool. The Insertion Tool is used to place the Sensor into the subcutaneous space. The Insertion Tool also has two guide marks on the cannula to assist in proper placement.
FDA Executive Summary – Senseonics Eversense Continuous Glucose Monitoring System
Page 13 of 54
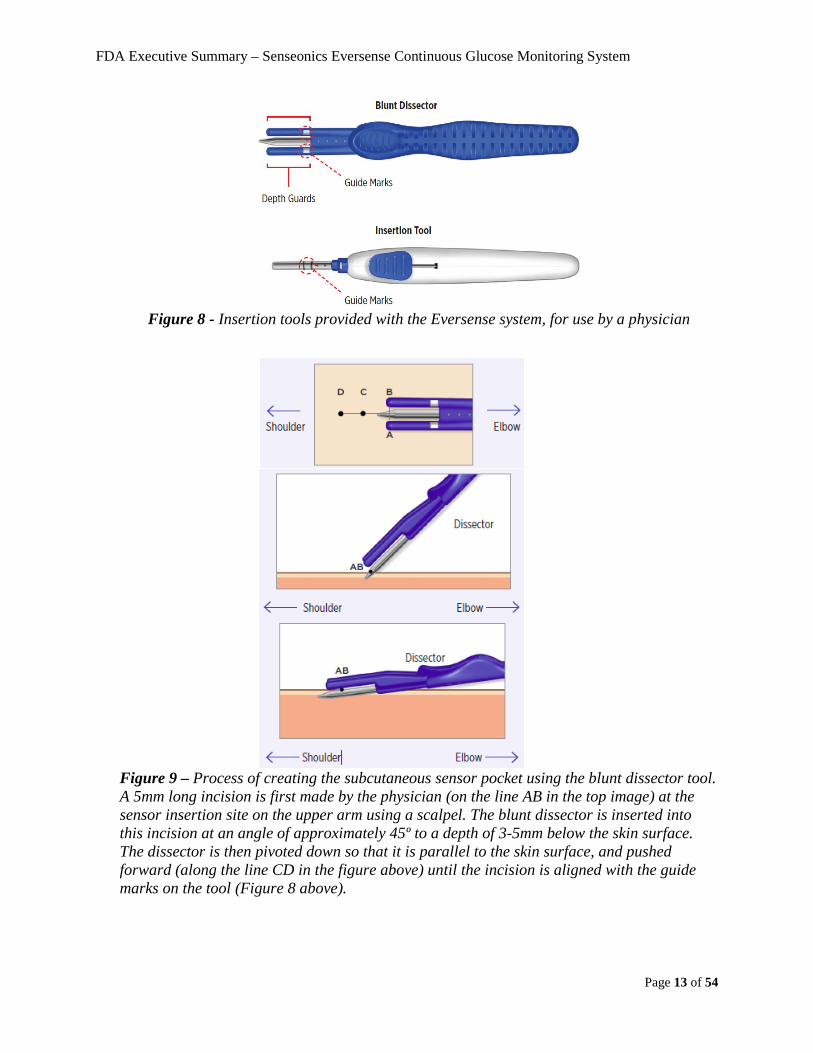
Figure 8 - Insertion tools provided with the Eversense system, for use by a physician
Figure 9 – Process of creating the subcutaneous sensor pocket using the blunt dissector tool. A 5mm long incision is first made by the physician (on the line AB in the top image) at the sensor insertion site on the upper arm using a scalpel. The blunt dissector is inserted into this incision at an angle of approximately 45º to a depth of 3-5mm below the skin surface. The dissector is then pivoted down so that it is parallel to the skin surface, and pushed forward (along the line CD in the figure above) until the incision is aligned with the guide marks on the tool (Figure 8 above).
FDA Executive Summary – Senseonics Eversense Continuous Glucose Monitoring System
Page 14 of 54
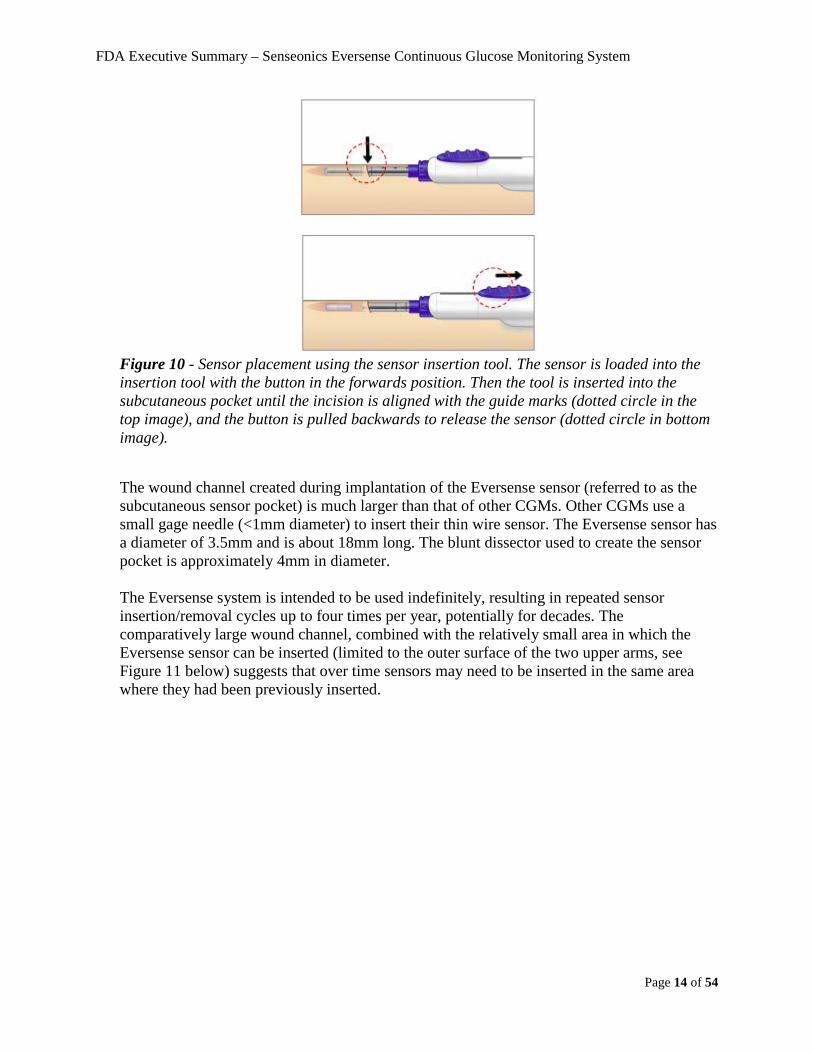
Figure 10 - Sensor placement using the sensor insertion tool. The sensor is loaded into the insertion tool with the button in the forwards position. Then the tool is inserted into the subcutaneous pocket until the incision is aligned with the guide marks (dotted circle in the top image), and the button is pulled backwards to release the sensor (dotted circle in bottom image).
The wound channel created during implantation of the Eversense sensor (referred to as the subcutaneous sensor pocket) is much larger than that of other CGMs. Other CGMs use a small gage needle (<1mm diameter) to insert their thin wire sensor. The Eversense sensor has a diameter of 3.5mm and is about 18mm long. The blunt dissector used to create the sensor pocket is approximately 4mm in diameter. The Eversense system is intended to be used indefinitely, resulting in repeated sensor insertion/removal cycles up to four times per year, potentially for decades. The comparatively large wound channel, combined with the relatively small area in which the Eversense sensor can be inserted (limited to the outer surface of the two upper arms, see Figure 11 below) suggests that over time sensors may need to be inserted in the same area where they had been previously inserted.
FDA Executive Summary – Senseonics Eversense Continuous Glucose Monitoring System
Page 15 of 54
Figure 11 - Suggested insertion area for the Eversense sensor, as presented in the proposed device labeling.
V. Bench Testing
Interference in the Eversense CGM system was assessed using in vitro testing. During in vitro testing, sensors were placed into glucose solutions to which potentially interfering substances were then added. Concentrations of potential interferents were either based on recommendations from interference testing standards/guidelines (e.g. Clinical & Laboratory Standards Institute (CLSI) EP7A2), FDA guidance documents for other glucose
FDA Executive Summary – Senseonics Eversense Continuous Glucose Monitoring System
Page 16 of 54
measurement devices (e.g. “Self-Monitoring blood glucose test systems for over-the-counter use” issued October, 2016), or based on information available in literature. In some cases, information on ISF concentration of potential interferants was not available. In these situations, plasma concentrations were used to assess interference. This should represent a worst-case scenario, as ISF concentrations should not be higher than plasma concentrations. Most tested substances occur in ISF due to diffusion of the substance into ISF from the bloodstream. Substances were tested at 2 glucose concentrations – a low concentration of 72 mg/dL and a high concentration of 324 mg/dL. The glucose level measured by the sensors was recorded before and after the addition of the potential interferant, and the degree of bias was calculated. Senseonics defined significant interference as a bias greater than 10 mg/dL for glucose levels below 100 mg/dL, or greater than 10% for glucose levels above 100 mg/dL. See the table below for test results: Table 2 - Substances tested for potential interference with the Senseonics sensor
Substances Tested with No Interfering Effect Substances Tested with Interfering Effect
Acetaminophen Galactose, D- Xylitol Mannitol
Amoxicillin trihydrate Gentisic acid Naproxen Tetracycline
Ascorbic acid Glutathione Piroxicam
Caffeine L-Dopa Pralidoxime iodide (PAM)
Creatinine Lactate Quinidine
Dopamine Lactose Ribose
EDTA Levofloxacin Salicylic acid
Ephedrine Maltose, D-(+) Tolazamide
Fructose, D- Mannose, D-(+) Tolbutamide
Glyburide (glibenclamide) Metformin Urea
Heparin Methyl-DOPA Xylose, D-(+)
Ibuprofen Maltitol Erythritol
Lactitol Sorbitol Isomalt Of the 41 substances tested, two showed an interfering effect at concentrations associated with therapeutic doses (mannitol and tetracycline). At the concentrations tested (0.09 mg/dL), Sorbitol did not exhibit an interfering effect. However, it was later identified as a potential interferent under certain conditions of use. Senseonics identified the following substances as potential interferents:
FDA Executive Summary – Senseonics Eversense Continuous Glucose Monitoring System
Page 17 of 54
• Mannitol, when administered intravenously or in irrigation solution, may afford
concentrations that could produce a positive bias in Eversense glucose readings. The magnitude of the positive bias increases as the concentration of mannitol increases. For a glucose concentration of 76 mg/dL, it was found that a concentration of >5.6 mg/dL of mannitol would produce a bias greater than 10 mg/dL (concentrations of mannitol above 5.6 mg/dL would produce positive bias of greater magnitude). For a glucose concentration of 321 mg/dL, a concentration of >23 mg/dL of mannitol was necessary to produce a bias greater than 10% (concentrations of mannitol above 23 mg/dL would produce positive bias of greater magnitude). Plasma concentrations of mannitol for patients undergoing a procedure where irrigation with a mannitol was used were reported to be as high as 32.8 mg/dL (Renner, Schmitz, & Gehring, 1998). This concentration of mannitol would result in a positive bias of approximately 62 mg/dL for a sample with true glucose concentration of 76 mg/dL, and a positive bias of 42 mg/dL for a sample with true glucose concentration of 321 mg/dL, based on the in vitro results obtained by Senseonics. A positive bias may have negative clinical consequences if used to influence treatment strategy. The sponsor has proposed a statement regarding the potential for mannitol or sorbitol to cause falsely elevated readings when administered intravenously, or as a component of an irrigation solution or peritoneal dialysis solution be included in the Eversense labeling.
• Sorbitol was tested at 0.09 mg/dL, per the FDA guidance document listed above, and did not demonstrate an interfering effect. Sorbitol was not tested at higher concentrations. Senseonics concluded that given the bias observed with very high concentrations of mannitol, it was likely that sorbitol would have a similar degree of bias at very high concentrations. Based on a review of literature, they concluded that the only way the Eversense Sensor could be exposed to such high concentrations of sorbitol would be through IV administration or the use of sorbitol in an irrigation solution. Based on this assessment, Senseonics has proposed to include a warning against the use of sorbitol in these administration routes while using the Eversense system.
• Tetracycline introduced a negative bias in glucose reading from the Eversense CGM System. At low glucose concentrations, 0.5 mg/dL of tetracycline was shown to produce a bias of -46 mg/dL. At high glucose concentrations, the same amount of tetracycline produced a bias of -31%. A plasma concentration of 0.5 mg/dL was the highest reported for tetracycline based on a literature review conducted by Senseonics. ISF concentration measurements for tetracycline could not be found, so the plasma concentration was assumed to be the worst case. An animal study (minipig) was conducted by Senseonics, and confirmed that plasma concentrations of tetracycline near 0.5 mg/dL could cause a significant negative bias in sensor glucose measurements. A negative bias may have negative clinical consequences if used to influence treatment strategy. The sponsor has proposed that the Eversense labeling inform users that the use of tetracycline may falsely lower Sensor glucose readings and that they should not rely on their CGM system while using tetracycline.

FDA Executive Summary – Senseonics Eversense Continuous Glucose Monitoring System
Page 18 of 54
VI. Clinical Data Senseonics performed two clinical studies to assess safety and effectiveness of the Eversense CGM System: the PRECISE II study consisting of 90 subjects, and the PRECISION study consisting of 35 subjects. These clinical studies were performed in the United States. i. Eversense CGM Pivotal Clinical Study (PRECISE II study) The PRECISE II study was a non-randomized, blinded, prospective, single-arm, multi-center study, evaluating 90 adult subjects with diabetes mellitus in the United States at 8 sites. The investigation included both clinic visits and home use of the Senseonics CGM System. The majority of subjects had one sensor inserted in the upper arm by trained investigators. A subset of 15 subjects, at one clinical site, had two Sensors inserted (one in each arm). The accuracy of the Senseonics CGM System was evaluated during clinic visits by comparing sensor values to laboratory plasma glucose value drawn every 5 to 15 minutes. Clinic sessions were performed on days 1, 30, 60 and 90 for a period of approximately 4 ½ to 12 ½ hours. During Sensor accuracy clinic visits, qualifying subjects participated in hyperglycemia and hypoglycemia challenges, as well as upper arm exercise sessions for duration of 30 minutes. For subjects inserted with two Sensors, in addition to glucose challenges, the effects of compression (e.g., caused due to sleeping on the arm with transmitter) were also evaluated.
* Glycemic, exercise, and compression challenges
Figure 12 - PRECISE II Study Design
PRECISE II Safety Results The primary safety endpoint in PRECISE II was the incidence of device-related or insertion/removal procedure-related serious adverse events (SAEs) in the clinic and during home use through 10 days after Sensor removal. Adverse events in the study were reviewed and adjudicated by an independent medical monitor. The adverse events the sponsor reported for this study are summarized in the table below:
FDA Executive Summary – Senseonics Eversense Continuous Glucose Monitoring System
Page 19 of 54
Table 3 - Summary of adverse events during the PRECISE II study
Patient Adverse Event (Severity) Time of Onset Outcome Intervention
A
Bruising, Left Arm (mild) 3 days after removal Resolved None
Bruising, RightArm (mild) 3 days after removal Resolved None
Erythema, Left Arm (mild) 3 days after removal Resolved Hydrocortisone cream
Erythema, RightArm (mild) 3 days after removal Resolved Hydrocortisone cream
B Pinpoint tenderness (mild) 2 days after insertion Resolved None
C
Device fragmenta not recovered (mild)
Day of removal Resolved None
Insertion site pain (mild) Day of removal Resolved None
Discomfort (mild) 18 days after removal Resolvedb None
D Musculoskeletal pain (mild) 45 days after insertion (patient had performed heavy lifting)
Resolved None
E
Intermittent burning and tingling (mild)
9 days after insertion Resolved None
Unsuccessful removal of Sensor (moderate, SAE)
9 days prior to successful removal of Sensor on second attempt
Resolved
Removal by general surgeon using general anesthesia and fluoroscopy
Pain (moderate) 1 day after unsuccessful removal Resolved Pain medication
F Device fragmenta not recovered (mild)
Day of removal Resolved None
G Syncope (mild) Day of insertion Resolved Lying down with feet elevated
a Sensor cap b Resolved, per telephone contact post-database lock There was one SAE related to device removal, in which an initial attempt to remove the Sensor was unsuccessful. At the planned removal visit, two incisions were made, and an
FDA Executive Summary – Senseonics Eversense Continuous Glucose Monitoring System
Page 20 of 54
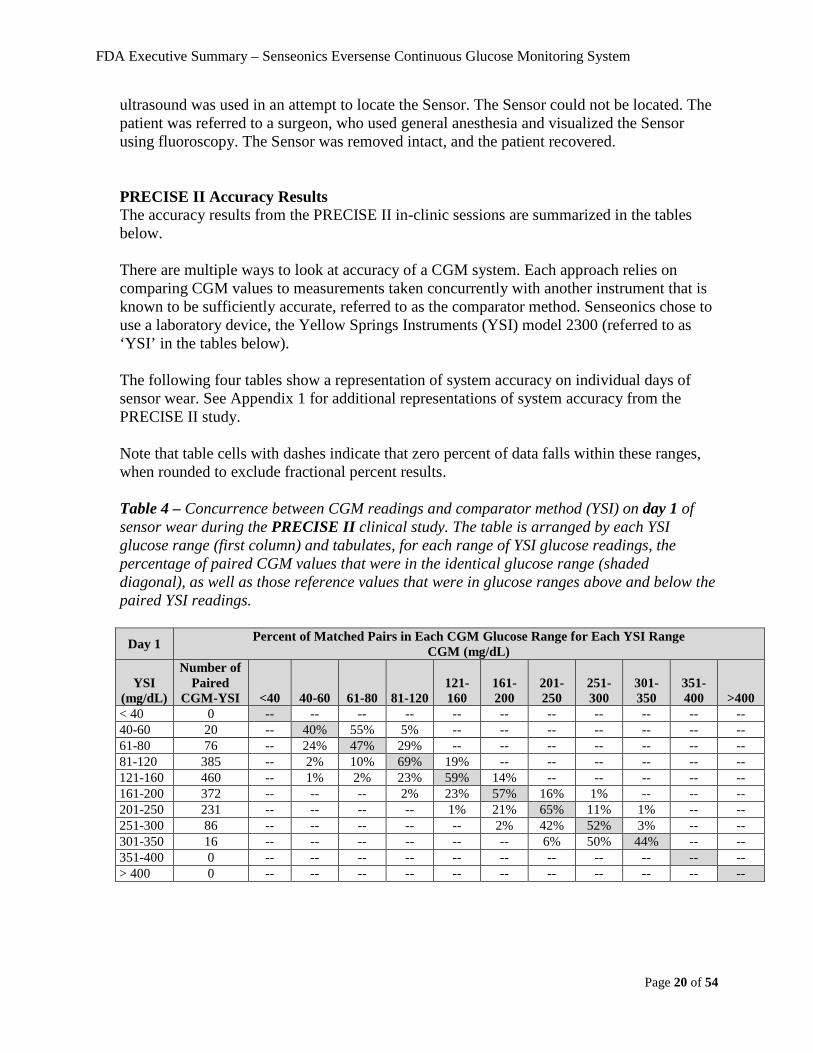
ultrasound was used in an attempt to locate the Sensor. The Sensor could not be located. The patient was referred to a surgeon, who used general anesthesia and visualized the Sensor using fluoroscopy. The Sensor was removed intact, and the patient recovered. PRECISE II Accuracy Results The accuracy results from the PRECISE II in-clinic sessions are summarized in the tables below. There are multiple ways to look at accuracy of a CGM system. Each approach relies on comparing CGM values to measurements taken concurrently with another instrument that is known to be sufficiently accurate, referred to as the comparator method. Senseonics chose to use a laboratory device, the Yellow Springs Instruments (YSI) model 2300 (referred to as ‘YSI’ in the tables below). The following four tables show a representation of system accuracy on individual days of sensor wear. See Appendix 1 for additional representations of system accuracy from the PRECISE II study. Note that table cells with dashes indicate that zero percent of data falls within these ranges, when rounded to exclude fractional percent results. Table 4 – Concurrence between CGM readings and comparator method (YSI) on day 1 of sensor wear during the PRECISE II clinical study. The table is arranged by each YSI glucose range (first column) and tabulates, for each range of YSI glucose readings, the percentage of paired CGM values that were in the identical glucose range (shaded diagonal), as well as those reference values that were in glucose ranges above and below the paired YSI readings.
Day 1 Percent of Matched Pairs in Each CGM Glucose Range for Each YSI Range CGM (mg/dL)
YSI (mg/dL)
Number of Paired
CGM-YSI <40 40-60 61-80 81-120 121-160
161-200
201-250
251-300
301-350
351-400 >400
< 40 0 -- -- -- -- -- -- -- -- -- -- -- 40-60 20 -- 40% 55% 5% -- -- -- -- -- -- -- 61-80 76 -- 24% 47% 29% -- -- -- -- -- -- -- 81-120 385 -- 2% 10% 69% 19% -- -- -- -- -- -- 121-160 460 -- 1% 2% 23% 59% 14% -- -- -- -- -- 161-200 372 -- -- -- 2% 23% 57% 16% 1% -- -- -- 201-250 231 -- -- -- -- 1% 21% 65% 11% 1% -- -- 251-300 86 -- -- -- -- -- 2% 42% 52% 3% -- -- 301-350 16 -- -- -- -- -- -- 6% 50% 44% -- -- 351-400 0 -- -- -- -- -- -- -- -- -- -- -- > 400 0 -- -- -- -- -- -- -- -- -- -- --

FDA Executive Summary – Senseonics Eversense Continuous Glucose Monitoring System
Page 21 of 54
Table 5 - CGM concurrence to YSI on Day 30 of the PRECISE II study
Day 30 Percent of Matched Pairs in Each CGM Glucose Range for Each YSI Range CGM (mg/dL)
YSI (mg/dL)
Number of Paired
CGM-YSI <40 40-60 61-80 81-120 121-160
161-200
201-250
251-300
301-350
351-400 >400
< 40 4 100% -- -- -- -- -- -- -- -- -- -- 40-60 180 -- 61% 38% 1% -- -- -- -- -- -- -- 61-80 512 -- 17% 67% 16% 1% -- -- -- -- -- -- 81-120 1169 -- 1% 9% 79% 11% -- -- -- -- -- -- 121-160 1165 -- -- -- 14% 77% 9% -- -- -- -- -- 161-200 804 -- -- -- -- 16% 75% 9% -- -- -- -- 201-250 704 -- -- -- -- 1% 20% 73% 7% -- -- -- 251-300 343 -- -- -- -- -- -- 23% 67% 9% -- -- 301-350 141 -- -- -- -- -- -- 1% 41% 46% 11% -- 351-400 60 -- -- -- -- -- -- -- 5% 32% 63% -- > 400 4 -- -- -- -- -- -- -- -- -- 100% -- Table 6 - CGM concurrence to YSI on Day 60 of the PRECISE II study
Day 60 Percent of Matched Pairs in Each CGM Glucose Range for Each YSI Range CGM (mg/dL)
YSI (mg/dL)
Number of Paired
CGM-YSI <40 40-60 61-80 81-120 121-160
161-200
201-250
251-300
301-350
351-400 >400
<40 0 -- -- -- -- -- -- -- -- -- -- -- 40-60 139 -- 62% 33% 5% -- -- -- -- -- -- -- 61-80 291 -- 21% 56% 22% -- -- -- -- -- -- --
81-120 797 -- -- 8% 82% 10% -- -- -- -- -- -- 121-160 826 -- -- -- 13% 72% 15% -- -- -- -- -- 161-200 759 -- -- -- -- 18% 65% 17% -- -- -- -- 201-250 889 -- -- -- -- -- 16% 72% 12% 1% -- -- 251-300 514 -- -- -- -- -- 1% 28% 62% 9% -- -- 301-350 348 -- -- -- -- -- -- 1% 42% 53% 4% -- 351-400 139 -- -- -- -- -- -- -- 11% 50% 40% --
> 400 9 -- -- -- -- -- -- -- -- -- 100% --
FDA Executive Summary – Senseonics Eversense Continuous Glucose Monitoring System
Page 22 of 54
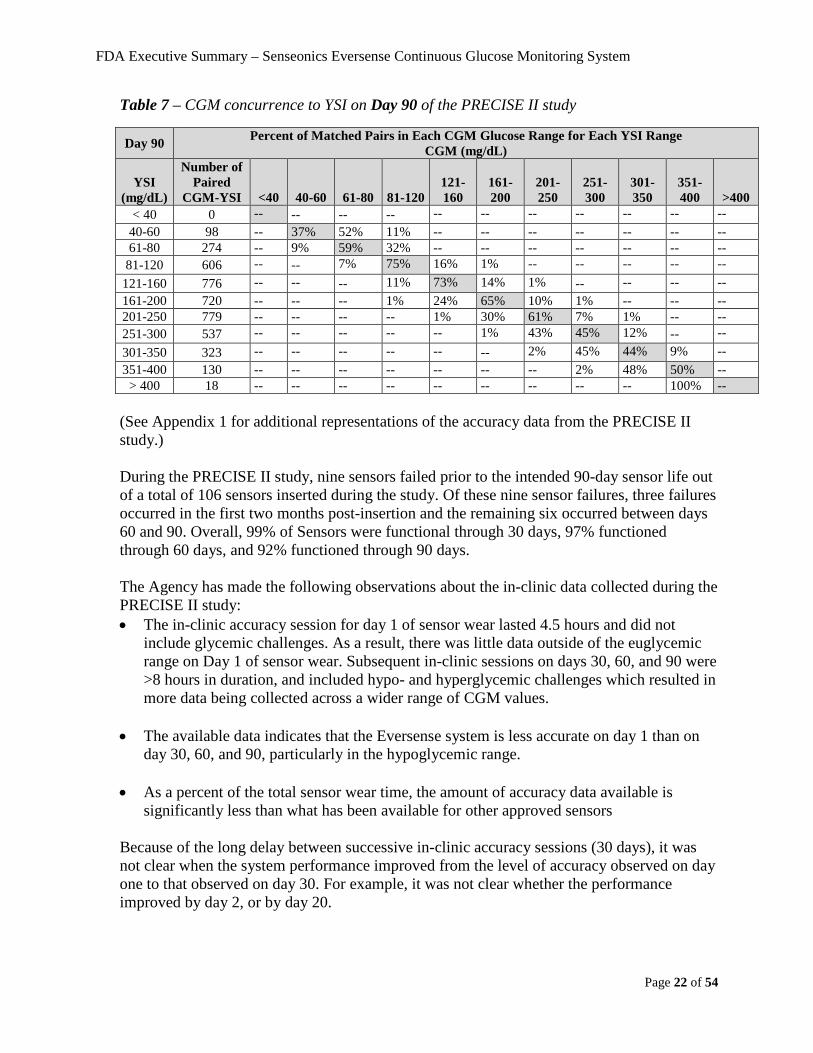
Table 7 – CGM concurrence to YSI on Day 90 of the PRECISE II study
Day 90 Percent of Matched Pairs in Each CGM Glucose Range for Each YSI Range CGM (mg/dL)
YSI (mg/dL)
Number of Paired
CGM-YSI <40 40-60 61-80 81-120 121-160
161-200
201-250
251-300
301-350
351-400 >400
< 40 0 -- -- -- -- -- -- -- -- -- -- -- 40-60 98 -- 37% 52% 11% -- -- -- -- -- -- -- 61-80 274 -- 9% 59% 32% -- -- -- -- -- -- --
81-120 606 -- -- 7% 75% 16% 1% -- -- -- -- -- 121-160 776 -- -- -- 11% 73% 14% 1% -- -- -- -- 161-200 720 -- -- -- 1% 24% 65% 10% 1% -- -- -- 201-250 779 -- -- -- -- 1% 30% 61% 7% 1% -- -- 251-300 537 -- -- -- -- -- 1% 43% 45% 12% -- -- 301-350 323 -- -- -- -- -- -- 2% 45% 44% 9% -- 351-400 130 -- -- -- -- -- -- -- 2% 48% 50% --
> 400 18 -- -- -- -- -- -- -- -- -- 100% -- (See Appendix 1 for additional representations of the accuracy data from the PRECISE II study.) During the PRECISE II study, nine sensors failed prior to the intended 90-day sensor life out of a total of 106 sensors inserted during the study. Of these nine sensor failures, three failures occurred in the first two months post-insertion and the remaining six occurred between days 60 and 90. Overall, 99% of Sensors were functional through 30 days, 97% functioned through 60 days, and 92% functioned through 90 days. The Agency has made the following observations about the in-clinic data collected during the PRECISE II study: • The in-clinic accuracy session for day 1 of sensor wear lasted 4.5 hours and did not
include glycemic challenges. As a result, there was little data outside of the euglycemic range on Day 1 of sensor wear. Subsequent in-clinic sessions on days 30, 60, and 90 were >8 hours in duration, and included hypo- and hyperglycemic challenges which resulted in more data being collected across a wider range of CGM values.
• The available data indicates that the Eversense system is less accurate on day 1 than on day 30, 60, and 90, particularly in the hypoglycemic range.
• As a percent of the total sensor wear time, the amount of accuracy data available is significantly less than what has been available for other approved sensors
Because of the long delay between successive in-clinic accuracy sessions (30 days), it was not clear when the system performance improved from the level of accuracy observed on day one to that observed on day 30. For example, it was not clear whether the performance improved by day 2, or by day 20.
FDA Executive Summary – Senseonics Eversense Continuous Glucose Monitoring System
Page 23 of 54
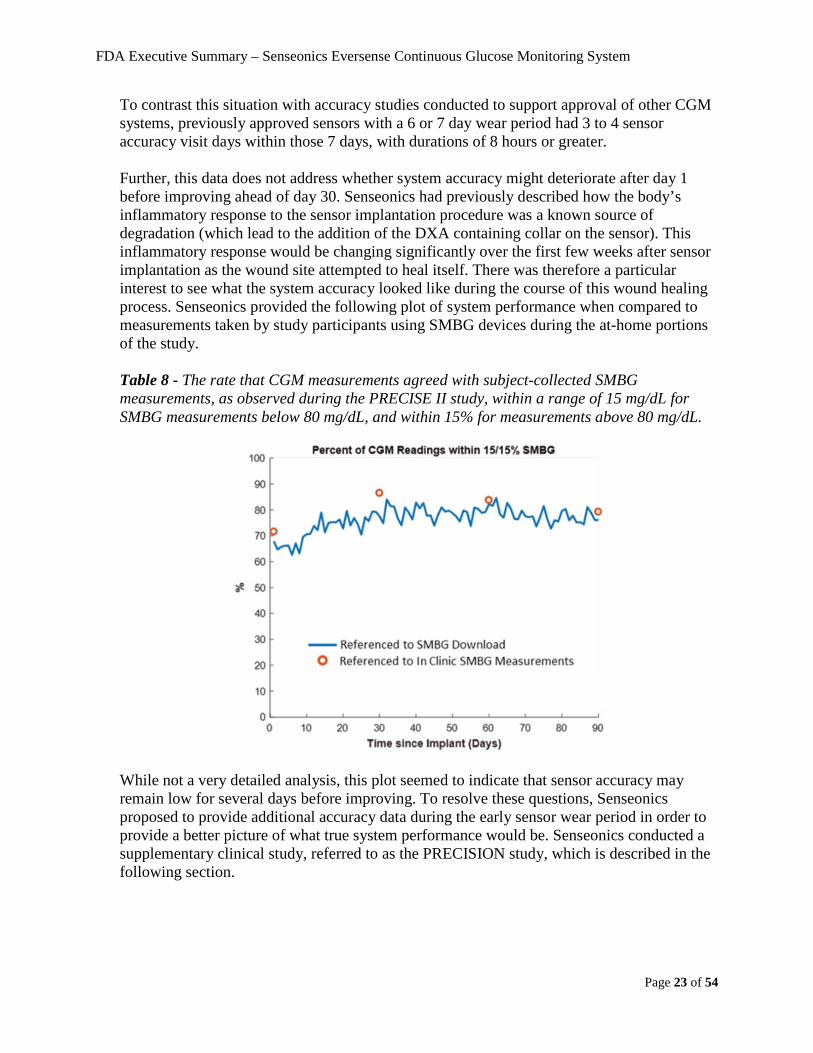
To contrast this situation with accuracy studies conducted to support approval of other CGM systems, previously approved sensors with a 6 or 7 day wear period had 3 to 4 sensor accuracy visit days within those 7 days, with durations of 8 hours or greater. Further, this data does not address whether system accuracy might deteriorate after day 1 before improving ahead of day 30. Senseonics had previously described how the body’s inflammatory response to the sensor implantation procedure was a known source of degradation (which lead to the addition of the DXA containing collar on the sensor). This inflammatory response would be changing significantly over the first few weeks after sensor implantation as the wound site attempted to heal itself. There was therefore a particular interest to see what the system accuracy looked like during the course of this wound healing process. Senseonics provided the following plot of system performance when compared to measurements taken by study participants using SMBG devices during the at-home portions of the study. Table 8 - The rate that CGM measurements agreed with subject-collected SMBG measurements, as observed during the PRECISE II study, within a range of 15 mg/dL for SMBG measurements below 80 mg/dL, and within 15% for measurements above 80 mg/dL.
While not a very detailed analysis, this plot seemed to indicate that sensor accuracy may remain low for several days before improving. To resolve these questions, Senseonics proposed to provide additional accuracy data during the early sensor wear period in order to provide a better picture of what true system performance would be. Senseonics conducted a supplementary clinical study, referred to as the PRECISION study, which is described in the following section.
FDA Executive Summary – Senseonics Eversense Continuous Glucose Monitoring System
Page 24 of 54
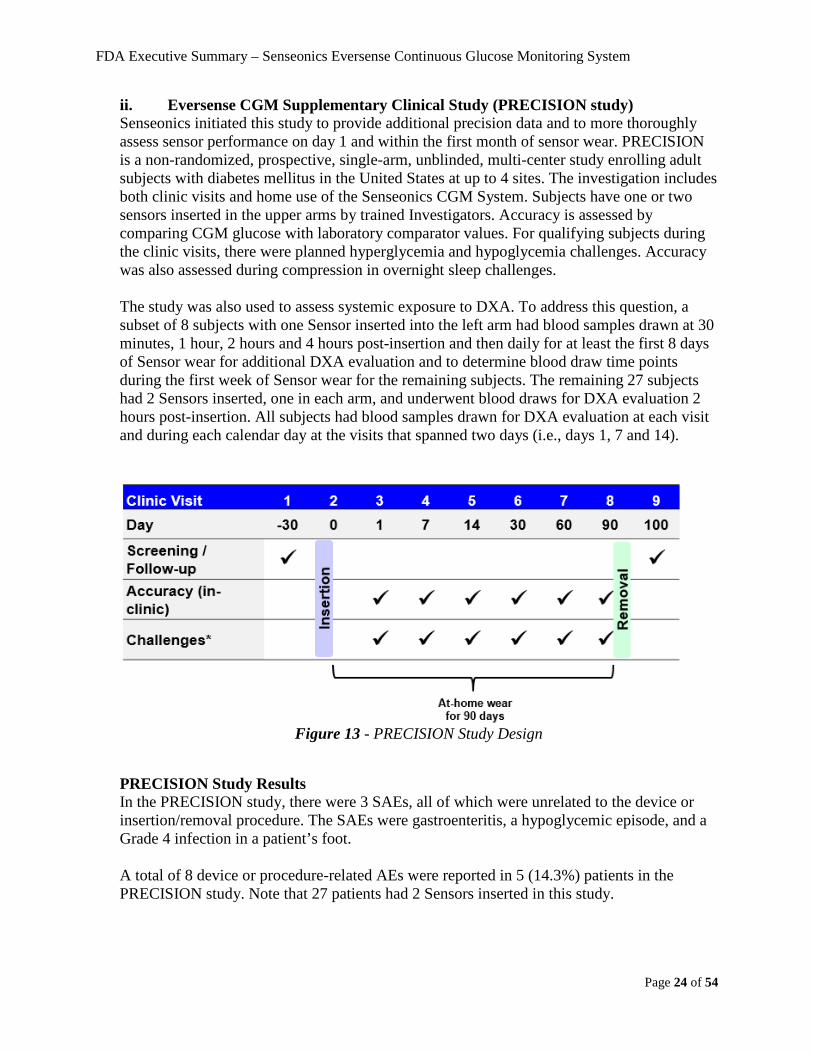
ii. Eversense CGM Supplementary Clinical Study (PRECISION study) Senseonics initiated this study to provide additional precision data and to more thoroughly assess sensor performance on day 1 and within the first month of sensor wear. PRECISION is a non-randomized, prospective, single-arm, unblinded, multi-center study enrolling adult subjects with diabetes mellitus in the United States at up to 4 sites. The investigation includes both clinic visits and home use of the Senseonics CGM System. Subjects have one or two sensors inserted in the upper arms by trained Investigators. Accuracy is assessed by comparing CGM glucose with laboratory comparator values. For qualifying subjects during the clinic visits, there were planned hyperglycemia and hypoglycemia challenges. Accuracy was also assessed during compression in overnight sleep challenges. The study was also used to assess systemic exposure to DXA. To address this question, a subset of 8 subjects with one Sensor inserted into the left arm had blood samples drawn at 30 minutes, 1 hour, 2 hours and 4 hours post-insertion and then daily for at least the first 8 days of Sensor wear for additional DXA evaluation and to determine blood draw time points during the first week of Sensor wear for the remaining subjects. The remaining 27 subjects had 2 Sensors inserted, one in each arm, and underwent blood draws for DXA evaluation 2 hours post-insertion. All subjects had blood samples drawn for DXA evaluation at each visit and during each calendar day at the visits that spanned two days (i.e., days 1, 7 and 14).
Figure 13 - PRECISION Study Design
PRECISION Study Results In the PRECISION study, there were 3 SAEs, all of which were unrelated to the device or insertion/removal procedure. The SAEs were gastroenteritis, a hypoglycemic episode, and a Grade 4 infection in a patient’s foot. A total of 8 device or procedure-related AEs were reported in 5 (14.3%) patients in the PRECISION study. Note that 27 patients had 2 Sensors inserted in this study.
FDA Executive Summary – Senseonics Eversense Continuous Glucose Monitoring System
Page 25 of 54
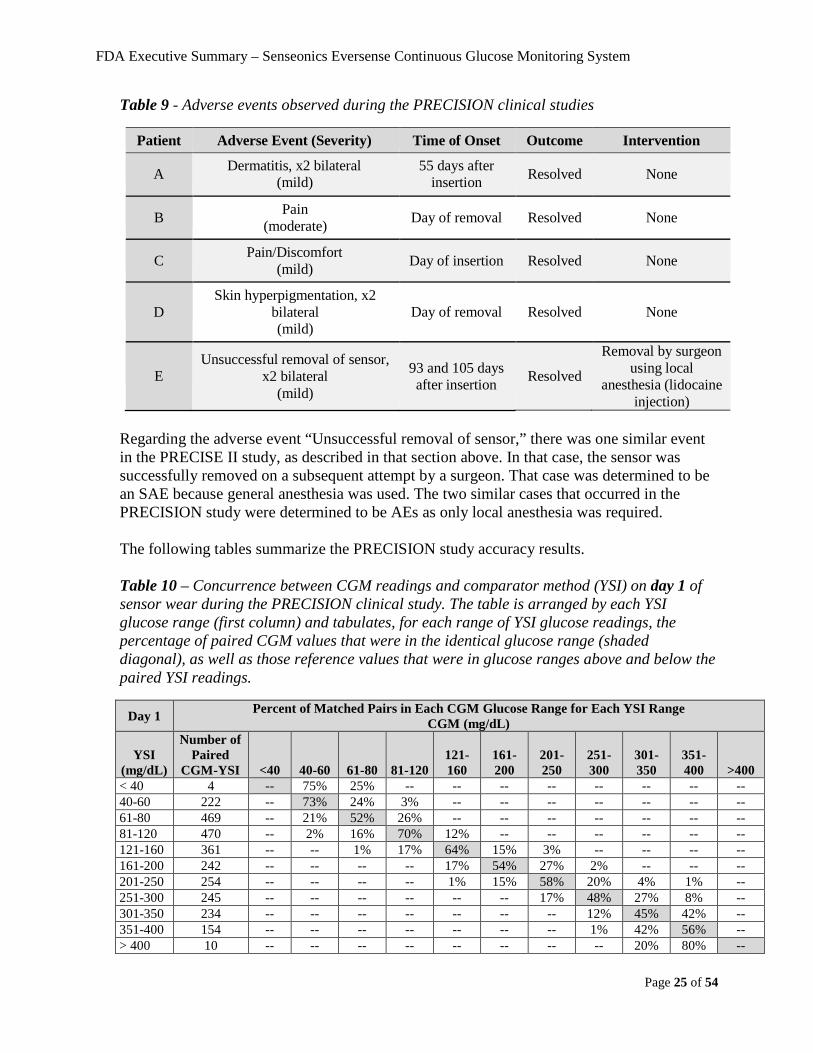
Table 9 - Adverse events observed during the PRECISION clinical studies
Patient Adverse Event (Severity) Time of Onset Outcome Intervention
A Dermatitis, x2 bilateral (mild)
55 days after insertion Resolved None
B Pain (moderate) Day of removal Resolved None
C Pain/Discomfort (mild) Day of insertion Resolved None
D
Skin hyperpigmentation, x2 bilateral (mild)
Day of removal
Resolved
None
E
Unsuccessful removal of sensor, x2 bilateral
(mild)
93 and 105 days after insertion
Resolved
Removal by surgeon using local
anesthesia (lidocaine injection)
Regarding the adverse event “Unsuccessful removal of sensor,” there was one similar event in the PRECISE II study, as described in that section above. In that case, the sensor was successfully removed on a subsequent attempt by a surgeon. That case was determined to be an SAE because general anesthesia was used. The two similar cases that occurred in the PRECISION study were determined to be AEs as only local anesthesia was required. The following tables summarize the PRECISION study accuracy results. Table 10 – Concurrence between CGM readings and comparator method (YSI) on day 1 of sensor wear during the PRECISION clinical study. The table is arranged by each YSI glucose range (first column) and tabulates, for each range of YSI glucose readings, the percentage of paired CGM values that were in the identical glucose range (shaded diagonal), as well as those reference values that were in glucose ranges above and below the paired YSI readings.
Day 1 Percent of Matched Pairs in Each CGM Glucose Range for Each YSI Range CGM (mg/dL)
YSI (mg/dL)
Number of Paired
CGM-YSI <40 40-60 61-80 81-120 121-160
161-200
201-250
251-300
301-350
351-400 >400
< 40 4 -- 75% 25% -- -- -- -- -- -- -- -- 40-60 222 -- 73% 24% 3% -- -- -- -- -- -- -- 61-80 469 -- 21% 52% 26% -- -- -- -- -- -- -- 81-120 470 -- 2% 16% 70% 12% -- -- -- -- -- -- 121-160 361 -- -- 1% 17% 64% 15% 3% -- -- -- -- 161-200 242 -- -- -- -- 17% 54% 27% 2% -- -- -- 201-250 254 -- -- -- -- 1% 15% 58% 20% 4% 1% -- 251-300 245 -- -- -- -- -- -- 17% 48% 27% 8% -- 301-350 234 -- -- -- -- -- -- -- 12% 45% 42% -- 351-400 154 -- -- -- -- -- -- -- 1% 42% 56% -- > 400 10 -- -- -- -- -- -- -- -- 20% 80% --
FDA Executive Summary – Senseonics Eversense Continuous Glucose Monitoring System
Page 26 of 54
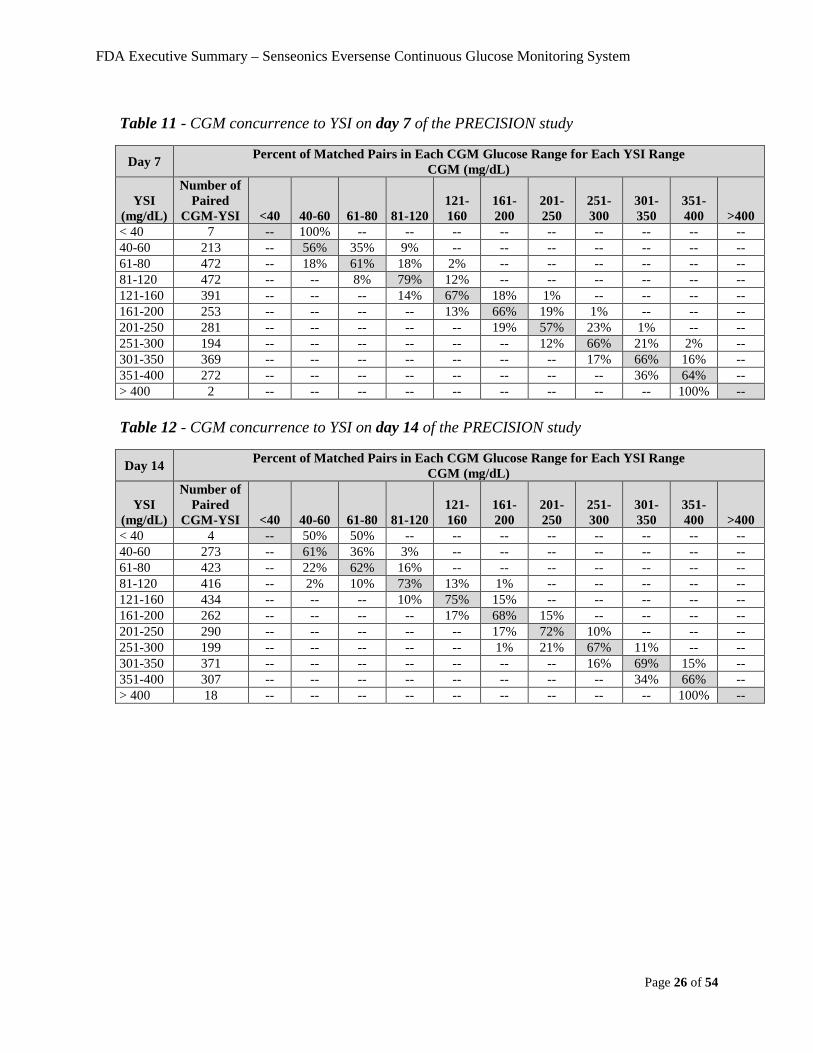
Table 11 - CGM concurrence to YSI on day 7 of the PRECISION study
Day 7 Percent of Matched Pairs in Each CGM Glucose Range for Each YSI Range CGM (mg/dL)
YSI (mg/dL)
Number of Paired
CGM-YSI <40 40-60 61-80 81-120 121-160
161-200
201-250
251-300
301-350
351-400 >400
< 40 7 -- 100% -- -- -- -- -- -- -- -- -- 40-60 213 -- 56% 35% 9% -- -- -- -- -- -- -- 61-80 472 -- 18% 61% 18% 2% -- -- -- -- -- -- 81-120 472 -- -- 8% 79% 12% -- -- -- -- -- -- 121-160 391 -- -- -- 14% 67% 18% 1% -- -- -- -- 161-200 253 -- -- -- -- 13% 66% 19% 1% -- -- -- 201-250 281 -- -- -- -- -- 19% 57% 23% 1% -- -- 251-300 194 -- -- -- -- -- -- 12% 66% 21% 2% -- 301-350 369 -- -- -- -- -- -- -- 17% 66% 16% -- 351-400 272 -- -- -- -- -- -- -- -- 36% 64% -- > 400 2 -- -- -- -- -- -- -- -- -- 100% -- Table 12 - CGM concurrence to YSI on day 14 of the PRECISION study
Day 14 Percent of Matched Pairs in Each CGM Glucose Range for Each YSI Range CGM (mg/dL)
YSI (mg/dL)
Number of Paired
CGM-YSI <40 40-60 61-80 81-120 121-160
161-200
201-250
251-300
301-350
351-400 >400
< 40 4 -- 50% 50% -- -- -- -- -- -- -- -- 40-60 273 -- 61% 36% 3% -- -- -- -- -- -- -- 61-80 423 -- 22% 62% 16% -- -- -- -- -- -- -- 81-120 416 -- 2% 10% 73% 13% 1% -- -- -- -- -- 121-160 434 -- -- -- 10% 75% 15% -- -- -- -- -- 161-200 262 -- -- -- -- 17% 68% 15% -- -- -- -- 201-250 290 -- -- -- -- -- 17% 72% 10% -- -- -- 251-300 199 -- -- -- -- -- 1% 21% 67% 11% -- -- 301-350 371 -- -- -- -- -- -- -- 16% 69% 15% -- 351-400 307 -- -- -- -- -- -- -- -- 34% 66% -- > 400 18 -- -- -- -- -- -- -- -- -- 100% --
FDA Executive Summary – Senseonics Eversense Continuous Glucose Monitoring System
Page 27 of 54
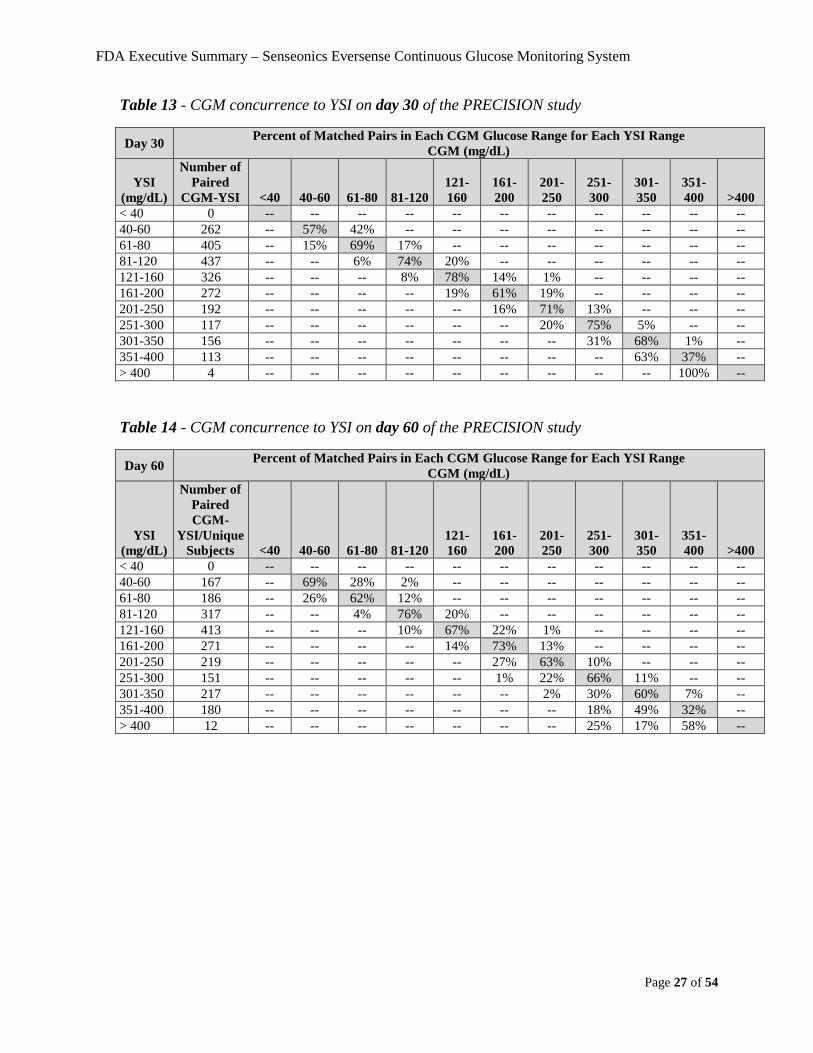
Table 13 - CGM concurrence to YSI on day 30 of the PRECISION study
Day 30 Percent of Matched Pairs in Each CGM Glucose Range for Each YSI Range CGM (mg/dL)
YSI (mg/dL)
Number of Paired
CGM-YSI <40 40-60 61-80 81-120 121-160
161-200
201-250
251-300
301-350
351-400 >400
< 40 0 -- -- -- -- -- -- -- -- -- -- -- 40-60 262 -- 57% 42% -- -- -- -- -- -- -- -- 61-80 405 -- 15% 69% 17% -- -- -- -- -- -- -- 81-120 437 -- -- 6% 74% 20% -- -- -- -- -- -- 121-160 326 -- -- -- 8% 78% 14% 1% -- -- -- -- 161-200 272 -- -- -- -- 19% 61% 19% -- -- -- -- 201-250 192 -- -- -- -- -- 16% 71% 13% -- -- -- 251-300 117 -- -- -- -- -- -- 20% 75% 5% -- -- 301-350 156 -- -- -- -- -- -- -- 31% 68% 1% -- 351-400 113 -- -- -- -- -- -- -- -- 63% 37% -- > 400 4 -- -- -- -- -- -- -- -- -- 100% -- Table 14 - CGM concurrence to YSI on day 60 of the PRECISION study
Day 60 Percent of Matched Pairs in Each CGM Glucose Range for Each YSI Range CGM (mg/dL)
YSI (mg/dL)
Number of Paired CGM-
YSI/Unique Subjects <40 40-60 61-80 81-120
121-160
161-200
201-250
251-300
301-350
351-400 >400
< 40 0 -- -- -- -- -- -- -- -- -- -- -- 40-60 167 -- 69% 28% 2% -- -- -- -- -- -- -- 61-80 186 -- 26% 62% 12% -- -- -- -- -- -- -- 81-120 317 -- -- 4% 76% 20% -- -- -- -- -- -- 121-160 413 -- -- -- 10% 67% 22% 1% -- -- -- -- 161-200 271 -- -- -- -- 14% 73% 13% -- -- -- -- 201-250 219 -- -- -- -- -- 27% 63% 10% -- -- -- 251-300 151 -- -- -- -- -- 1% 22% 66% 11% -- -- 301-350 217 -- -- -- -- -- -- 2% 30% 60% 7% -- 351-400 180 -- -- -- -- -- -- -- 18% 49% 32% -- > 400 12 -- -- -- -- -- -- -- 25% 17% 58% --
FDA Executive Summary – Senseonics Eversense Continuous Glucose Monitoring System
Page 28 of 54
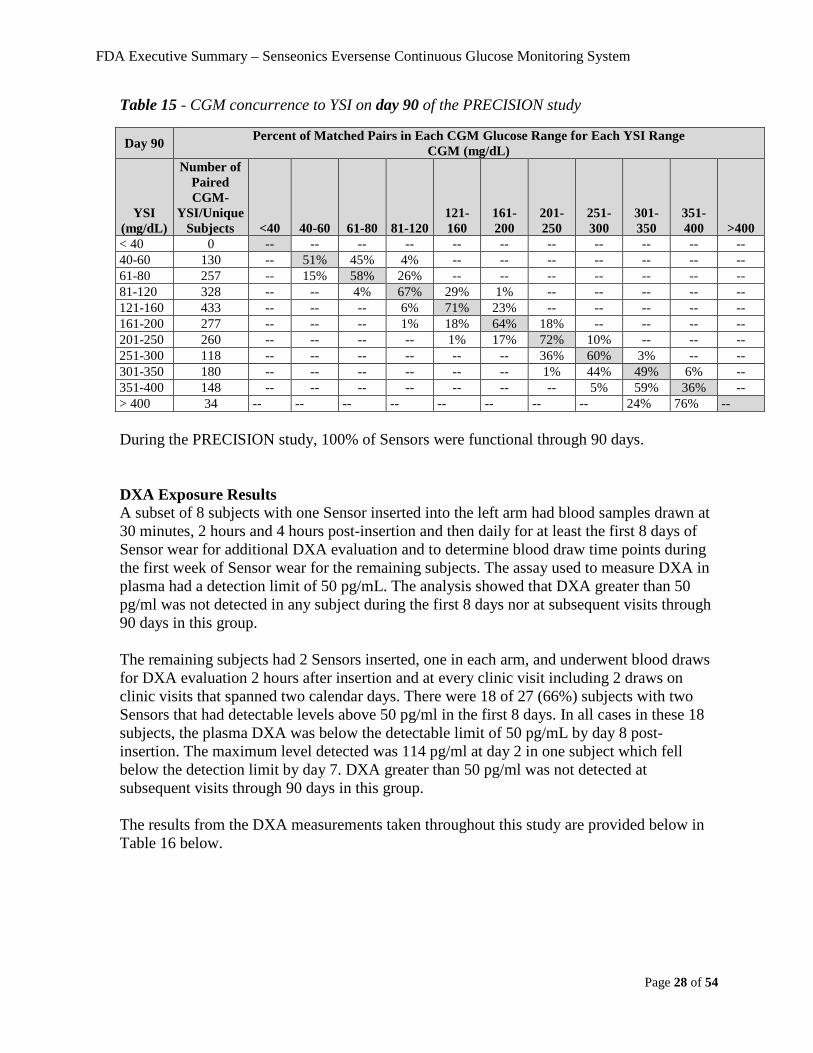
Table 15 - CGM concurrence to YSI on day 90 of the PRECISION study
Day 90 Percent of Matched Pairs in Each CGM Glucose Range for Each YSI Range CGM (mg/dL)
YSI (mg/dL)
Number of Paired CGM-
YSI/Unique Subjects <40 40-60 61-80 81-120
121-160
161-200
201-250
251-300
301-350
351-400 >400
< 40 0 -- -- -- -- -- -- -- -- -- -- -- 40-60 130 -- 51% 45% 4% -- -- -- -- -- -- -- 61-80 257 -- 15% 58% 26% -- -- -- -- -- -- -- 81-120 328 -- -- 4% 67% 29% 1% -- -- -- -- -- 121-160 433 -- -- -- 6% 71% 23% -- -- -- -- -- 161-200 277 -- -- -- 1% 18% 64% 18% -- -- -- -- 201-250 260 -- -- -- -- 1% 17% 72% 10% -- -- -- 251-300 118 -- -- -- -- -- -- 36% 60% 3% -- -- 301-350 180 -- -- -- -- -- -- 1% 44% 49% 6% -- 351-400 148 -- -- -- -- -- -- -- 5% 59% 36% -- > 400 34 -- -- -- -- -- -- -- -- 24% 76% -- During the PRECISION study, 100% of Sensors were functional through 90 days. DXA Exposure Results A subset of 8 subjects with one Sensor inserted into the left arm had blood samples drawn at 30 minutes, 2 hours and 4 hours post-insertion and then daily for at least the first 8 days of Sensor wear for additional DXA evaluation and to determine blood draw time points during the first week of Sensor wear for the remaining subjects. The assay used to measure DXA in plasma had a detection limit of 50 pg/mL. The analysis showed that DXA greater than 50 pg/ml was not detected in any subject during the first 8 days nor at subsequent visits through 90 days in this group. The remaining subjects had 2 Sensors inserted, one in each arm, and underwent blood draws for DXA evaluation 2 hours after insertion and at every clinic visit including 2 draws on clinic visits that spanned two calendar days. There were 18 of 27 (66%) subjects with two Sensors that had detectable levels above 50 pg/ml in the first 8 days. In all cases in these 18 subjects, the plasma DXA was below the detectable limit of 50 pg/mL by day 8 post-insertion. The maximum level detected was 114 pg/ml at day 2 in one subject which fell below the detection limit by day 7. DXA greater than 50 pg/ml was not detected at subsequent visits through 90 days in this group. The results from the DXA measurements taken throughout this study are provided below in Table 16 below.
FDA Executive Summary – Senseonics Eversense Continuous Glucose Monitoring System
Page 29 of 54
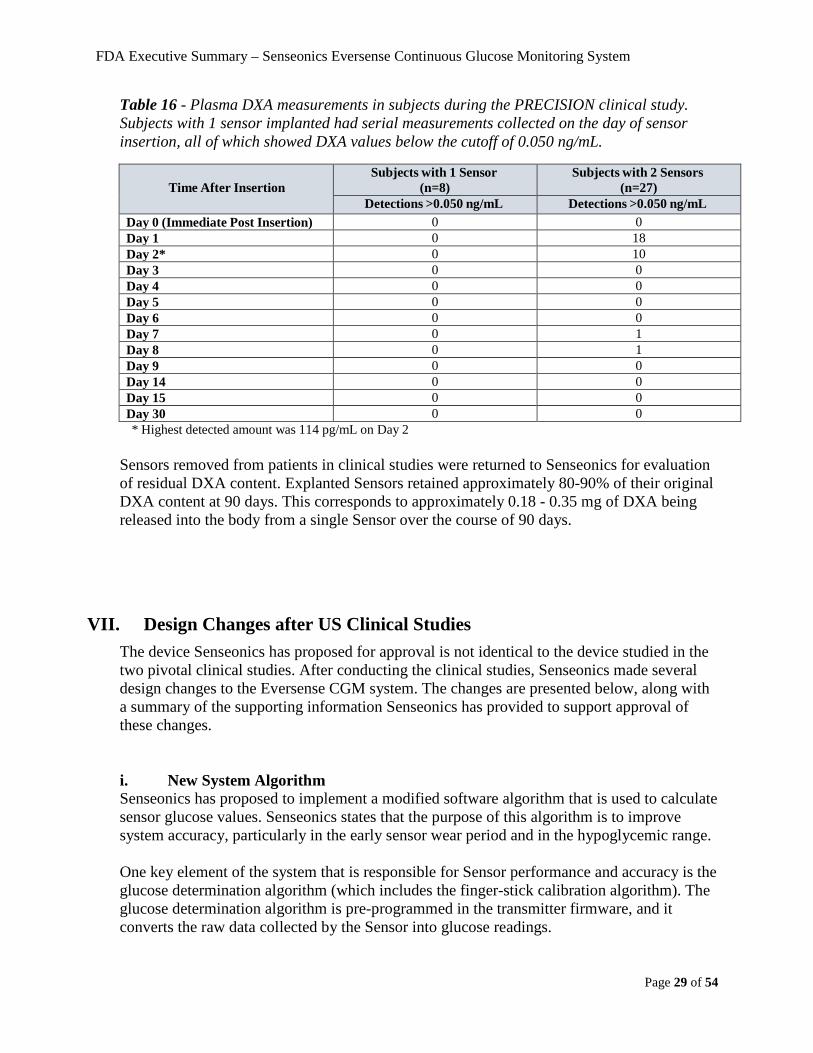
Table 16 - Plasma DXA measurements in subjects during the PRECISION clinical study. Subjects with 1 sensor implanted had serial measurements collected on the day of sensor insertion, all of which showed DXA values below the cutoff of 0.050 ng/mL.
Time After Insertion
Subjects with 1 Sensor (n=8)
Subjects with 2 Sensors (n=27)
Detections >0.050 ng/mL Detections >0.050 ng/mL Day 0 (Immediate Post Insertion) 0 0 Day 1 0 18 Day 2* 0 10 Day 3 0 0 Day 4 0 0 Day 5 0 0 Day 6 0 0 Day 7 0 1 Day 8 0 1 Day 9 0 0 Day 14 0 0 Day 15 0 0 Day 30 0 0 * Highest detected amount was 114 pg/mL on Day 2
Sensors removed from patients in clinical studies were returned to Senseonics for evaluation of residual DXA content. Explanted Sensors retained approximately 80-90% of their original DXA content at 90 days. This corresponds to approximately 0.18 - 0.35 mg of DXA being released into the body from a single Sensor over the course of 90 days.
VII. Design Changes after US Clinical Studies
The device Senseonics has proposed for approval is not identical to the device studied in the two pivotal clinical studies. After conducting the clinical studies, Senseonics made several design changes to the Eversense CGM system. The changes are presented below, along with a summary of the supporting information Senseonics has provided to support approval of these changes. i. New System Algorithm Senseonics has proposed to implement a modified software algorithm that is used to calculate sensor glucose values. Senseonics states that the purpose of this algorithm is to improve system accuracy, particularly in the early sensor wear period and in the hypoglycemic range. One key element of the system that is responsible for Sensor performance and accuracy is the glucose determination algorithm (which includes the finger-stick calibration algorithm). The glucose determination algorithm is pre-programmed in the transmitter firmware, and it converts the raw data collected by the Sensor into glucose readings.

FDA Executive Summary – Senseonics Eversense Continuous Glucose Monitoring System
Page 30 of 54
The version of this algorithm that was used during the US clinical studies is referred to as the “study software” and is abbreviated “study SW.” The proposed new version of this algorithm is referred to as “software version 602” and is abbreviated “SW 602.” The algorithm changes within the SW 602 algorithm version targeted accuracy improvement in: 1) the early Sensor life, and 2) the hypoglycemic range throughout the Sensor life. The clinical accuracy data from a 71-subject European pivotal study, PRECISE (Kropff, Choudhary, Neupane, & Barnard, 2017), was used for as a training set for this new algorithm. Data from the PRECISE II study and PRECISION study were not used to develop the new algorithm (SW 602). Senseonics has not studied this new algorithm (SW 602) in real-time in a clinical trial. Rather, they have post hoc processed the raw sensor data from the PRECISE II and PRECISION studies using the new algorithm. Senseonics stated that the raw sensor data is independent of this algorithm, so performing this processing post-hoc should yield the same final glucose values as if the algorithm had been used during the study. This type of post hoc processing of raw sensor data has been used previously by CGM companies to validate new system algorithms. The Agency has accepted this approach in the past when the algorithm has been validated using valid clinical datasets which are independent of the dataset(s) used to develop and train the algorithm. Tables 17-20 provide examples of the performance changes due to the change to SW 602. Tables 17 and 18 are the day 1 data from PRECISE II with study SW and SW 602, respectively. Tables 19 and 20 are the day 1 data from PRECISION with study SW and SW 602, respectively. Table 17 - PRECISE II study results for day 1 of sensors wear, as measured during the study using the original algorithm (Study-SW)
YSI Glucose Range (mg/dL)
Number of Paired Senseonics CGM
and YSI Reference
Percent of CGM System Readings Within
Percent 15/15% of Reference
Percent 20/20% of Reference
Percent 30/30% of Reference
Percent 40/40% of Reference
Percent Greater
than 40/40% of Reference
Overall (40-400) 1646 74.7% 84.9% 94.4% 97.9% 2.1% <40 0 0% 0% 0% 0% 0%
40 - 60 20 60.0% 85.0% 95.0% 95.0% 5.0% 61 - 80 76 69.7% 78.9% 94.7% 100.0% 0%
81 - 180 1048 71.6% 82.7% 92.8% 97.2% 2.8% 181 - 300 486 82.3% 90.1% 97.5% 99.0% 1.0% 301 - 350 16 93.8% 100.0% 100.0% 100.0% 0% 351 - 400 0 0% 0% 0% 0% 0%
> 400 0 0% 0% 0% 0% 0%

FDA Executive Summary – Senseonics Eversense Continuous Glucose Monitoring System
Page 31 of 54
Table 18 - PRECISE II study results for day 1 of sensor wear, obtained after re-analyzing the raw sensor data using the new algorithm (SW-602)
YSI Glucose Range (mg/dL)
Number of Paired Senseonics CGM
and YSI Reference
Percent of CGM System Readings Within
Percent 15/15% of Reference
Percent 20/20% of Reference
Percent 30/30% of Reference
Percent 40/40% of Reference
Percent Greater
than 40/40% of Reference
Overall (40-400) 1708 76.8% 87.1% 96.3% 98.5% 1.5% < 40 0 0% 0% 0% 0% 0%
40 - 60 39 59.0% 76.9% 87.2% 94.9% 5.1% 61 - 80 107 59.8% 67.3% 83.2% 91.6% 8.4%
81 - 180 1024 77.1% 88.5% 97.4% 99.0% 1.0% 181 - 300 519 80.9% 88.8% 97.3% 99.0% 1.0% 301 - 350 19 84.2% 100.0% 100.0% 100.0% 0% 351 - 400 0 0% 0% 0% 0% 0%
> 400 0 0% 0% 0% 0% 0% Table 19 - In-clinic accuracy results from day 1 of the PRECISION study, as measured during the study using the original algorithm (Study-SW)
YSI Glucose Range
(mg/dL)
Number of Paired CGM
and YSI Reference
Percent of CGM System Readings Within
Percent 15/15% of Reference
Percent 20/20% of Reference
Percent 30/30% of Reference
Percent 40/40% of Reference
Percent Greater
than 40/40% of Reference
Overall 2450 65.8% 78.9% 91.3% 95.9% 4.1% < 40 4 0% 0% 50.0% 75.0% 25.0%
40 - 60 196 48.0% 71.9% 92.9% 98.0% 2.0% 61 - 80 426 57.5% 75.1% 92.7% 96.0% 4.0%
81 - 180 898 60.2% 72.0% 85.7% 92.9% 7.1% 181 - 300 527 70.0% 82.4% 93.0% 97.2% 2.8% 301 - 350 222 83.8% 96.4% 100.0% 100.0% 0% 351 - 400 170 100.0% 100.0% 100.0% 100.0% 0%
> 400 7 100.0% 100.0% 100.0% 100.0% 0%
FDA Executive Summary – Senseonics Eversense Continuous Glucose Monitoring System
Page 32 of 54
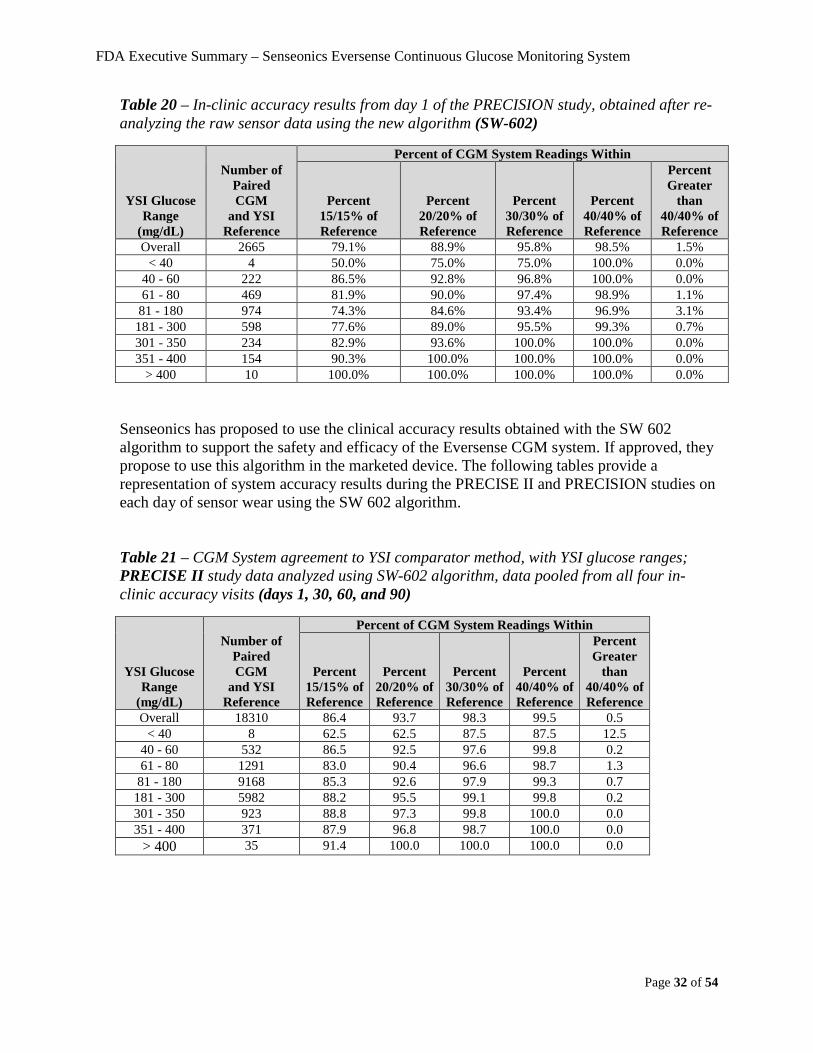
Table 20 – In-clinic accuracy results from day 1 of the PRECISION study, obtained after re-analyzing the raw sensor data using the new algorithm (SW-602)
YSI Glucose Range
(mg/dL)
Number of Paired CGM
and YSI Reference
Percent of CGM System Readings Within
Percent 15/15% of Reference
Percent 20/20% of Reference
Percent 30/30% of Reference
Percent 40/40% of Reference
Percent Greater
than 40/40% of Reference
Overall 2665 79.1% 88.9% 95.8% 98.5% 1.5% < 40 4 50.0% 75.0% 75.0% 100.0% 0.0%
40 - 60 222 86.5% 92.8% 96.8% 100.0% 0.0% 61 - 80 469 81.9% 90.0% 97.4% 98.9% 1.1%
81 - 180 974 74.3% 84.6% 93.4% 96.9% 3.1% 181 - 300 598 77.6% 89.0% 95.5% 99.3% 0.7% 301 - 350 234 82.9% 93.6% 100.0% 100.0% 0.0% 351 - 400 154 90.3% 100.0% 100.0% 100.0% 0.0%
> 400 10 100.0% 100.0% 100.0% 100.0% 0.0% Senseonics has proposed to use the clinical accuracy results obtained with the SW 602 algorithm to support the safety and efficacy of the Eversense CGM system. If approved, they propose to use this algorithm in the marketed device. The following tables provide a representation of system accuracy results during the PRECISE II and PRECISION studies on each day of sensor wear using the SW 602 algorithm. Table 21 – CGM System agreement to YSI comparator method, with YSI glucose ranges; PRECISE II study data analyzed using SW-602 algorithm, data pooled from all four in-clinic accuracy visits (days 1, 30, 60, and 90)
YSI Glucose Range
(mg/dL)
Number of Paired CGM
and YSI Reference
Percent of CGM System Readings Within
Percent 15/15% of Reference
Percent 20/20% of Reference
Percent 30/30% of Reference
Percent 40/40% of Reference
Percent Greater
than 40/40% of Reference
Overall 18310 86.4 93.7 98.3 99.5 0.5 < 40 8 62.5 62.5 87.5 87.5 12.5
40 - 60 532 86.5 92.5 97.6 99.8 0.2 61 - 80 1291 83.0 90.4 96.6 98.7 1.3
81 - 180 9168 85.3 92.6 97.9 99.3 0.7 181 - 300 5982 88.2 95.5 99.1 99.8 0.2 301 - 350 923 88.8 97.3 99.8 100.0 0.0 351 - 400 371 87.9 96.8 98.7 100.0 0.0
> 400 35 91.4 100.0 100.0 100.0 0.0
FDA Executive Summary – Senseonics Eversense Continuous Glucose Monitoring System
Page 33 of 54
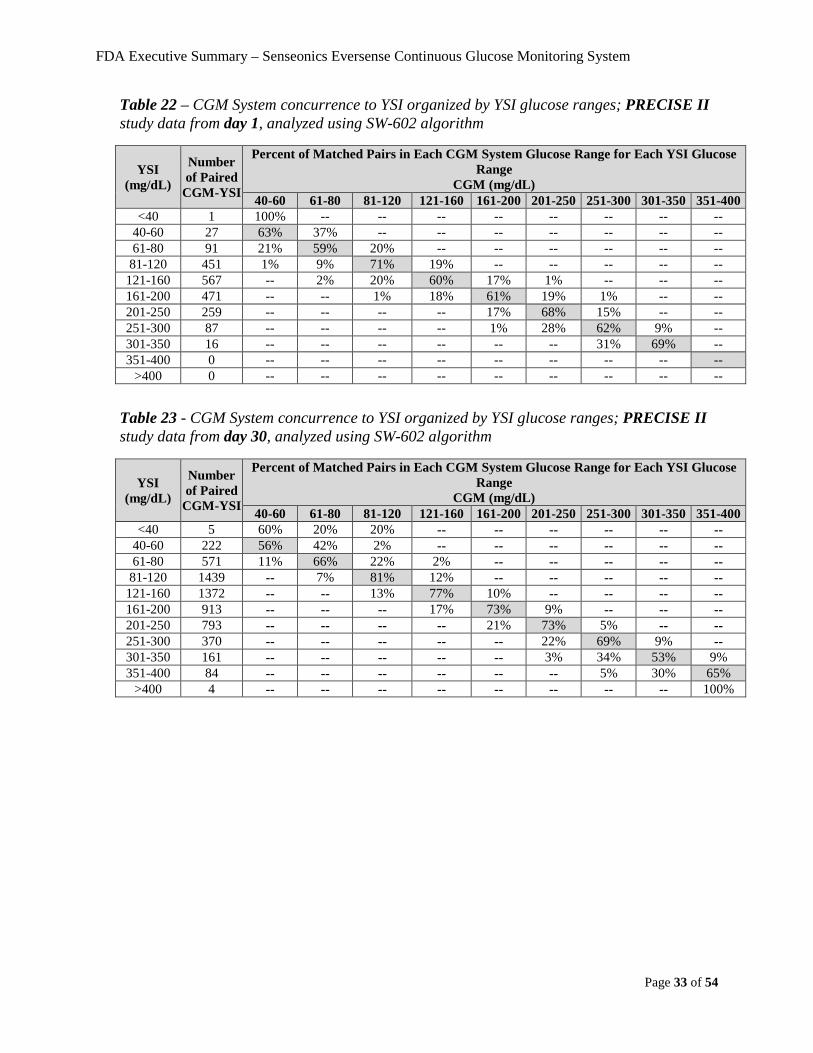
Table 22 – CGM System concurrence to YSI organized by YSI glucose ranges; PRECISE II study data from day 1, analyzed using SW-602 algorithm
YSI (mg/dL)
Number of Paired
CGM-YSI
Percent of Matched Pairs in Each CGM System Glucose Range for Each YSI Glucose Range
CGM (mg/dL) 40-60 61-80 81-120 121-160 161-200 201-250 251-300 301-350 351-400
<40 1 100% -- -- -- -- -- -- -- -- 40-60 27 63% 37% -- -- -- -- -- -- -- 61-80 91 21% 59% 20% -- -- -- -- -- --
81-120 451 1% 9% 71% 19% -- -- -- -- -- 121-160 567 -- 2% 20% 60% 17% 1% -- -- -- 161-200 471 -- -- 1% 18% 61% 19% 1% -- -- 201-250 259 -- -- -- -- 17% 68% 15% -- -- 251-300 87 -- -- -- -- 1% 28% 62% 9% -- 301-350 16 -- -- -- -- -- -- 31% 69% -- 351-400 0 -- -- -- -- -- -- -- -- --
>400 0 -- -- -- -- -- -- -- -- --
Table 23 - CGM System concurrence to YSI organized by YSI glucose ranges; PRECISE II study data from day 30, analyzed using SW-602 algorithm
YSI (mg/dL)
Number of Paired
CGM-YSI
Percent of Matched Pairs in Each CGM System Glucose Range for Each YSI Glucose Range
CGM (mg/dL) 40-60 61-80 81-120 121-160 161-200 201-250 251-300 301-350 351-400
<40 5 60% 20% 20% -- -- -- -- -- -- 40-60 222 56% 42% 2% -- -- -- -- -- -- 61-80 571 11% 66% 22% 2% -- -- -- -- --
81-120 1439 -- 7% 81% 12% -- -- -- -- -- 121-160 1372 -- -- 13% 77% 10% -- -- -- -- 161-200 913 -- -- -- 17% 73% 9% -- -- -- 201-250 793 -- -- -- -- 21% 73% 5% -- -- 251-300 370 -- -- -- -- -- 22% 69% 9% -- 301-350 161 -- -- -- -- -- 3% 34% 53% 9% 351-400 84 -- -- -- -- -- -- 5% 30% 65%
>400 4 -- -- -- -- -- -- -- -- 100%
FDA Executive Summary – Senseonics Eversense Continuous Glucose Monitoring System
Page 34 of 54
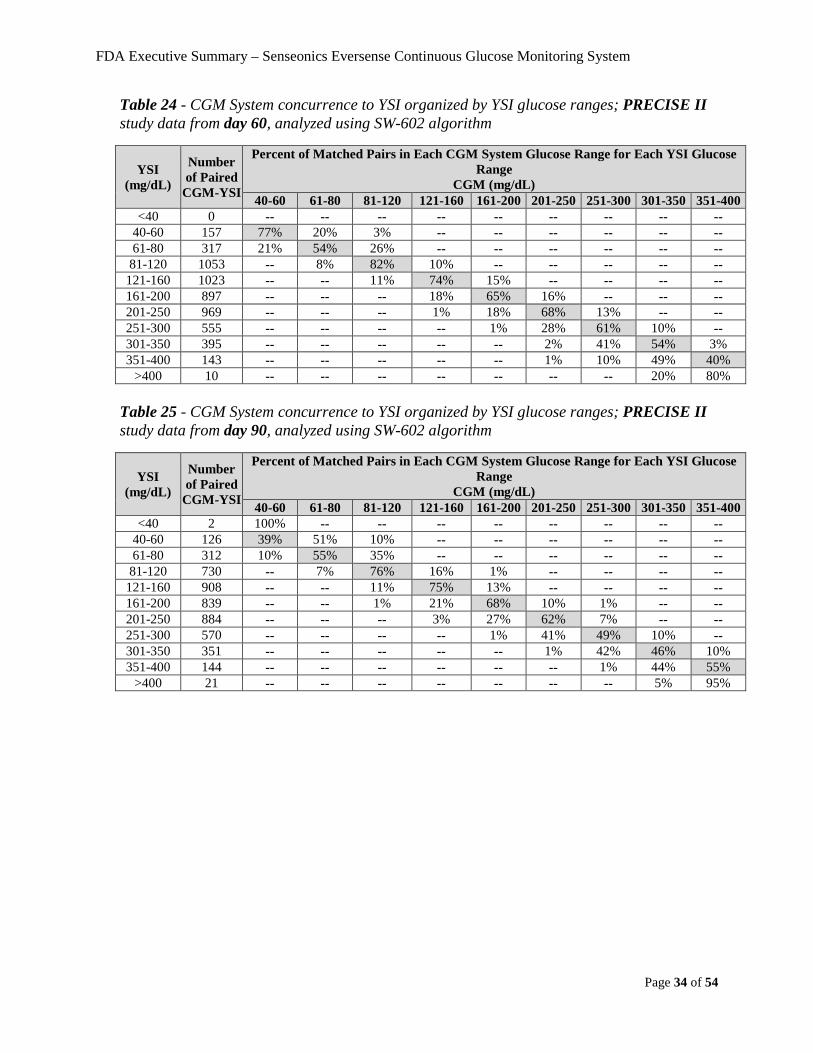
Table 24 - CGM System concurrence to YSI organized by YSI glucose ranges; PRECISE II study data from day 60, analyzed using SW-602 algorithm
YSI (mg/dL)
Number of Paired
CGM-YSI
Percent of Matched Pairs in Each CGM System Glucose Range for Each YSI Glucose Range
CGM (mg/dL) 40-60 61-80 81-120 121-160 161-200 201-250 251-300 301-350 351-400
<40 0 -- -- -- -- -- -- -- -- -- 40-60 157 77% 20% 3% -- -- -- -- -- -- 61-80 317 21% 54% 26% -- -- -- -- -- --
81-120 1053 -- 8% 82% 10% -- -- -- -- -- 121-160 1023 -- -- 11% 74% 15% -- -- -- -- 161-200 897 -- -- -- 18% 65% 16% -- -- -- 201-250 969 -- -- -- 1% 18% 68% 13% -- -- 251-300 555 -- -- -- -- 1% 28% 61% 10% -- 301-350 395 -- -- -- -- -- 2% 41% 54% 3% 351-400 143 -- -- -- -- -- 1% 10% 49% 40%
>400 10 -- -- -- -- -- -- -- 20% 80%
Table 25 - CGM System concurrence to YSI organized by YSI glucose ranges; PRECISE II study data from day 90, analyzed using SW-602 algorithm
YSI (mg/dL)
Number of Paired
CGM-YSI
Percent of Matched Pairs in Each CGM System Glucose Range for Each YSI Glucose Range
CGM (mg/dL) 40-60 61-80 81-120 121-160 161-200 201-250 251-300 301-350 351-400
<40 2 100% -- -- -- -- -- -- -- -- 40-60 126 39% 51% 10% -- -- -- -- -- -- 61-80 312 10% 55% 35% -- -- -- -- -- --
81-120 730 -- 7% 76% 16% 1% -- -- -- -- 121-160 908 -- -- 11% 75% 13% -- -- -- -- 161-200 839 -- -- 1% 21% 68% 10% 1% -- -- 201-250 884 -- -- -- 3% 27% 62% 7% -- -- 251-300 570 -- -- -- -- 1% 41% 49% 10% -- 301-350 351 -- -- -- -- -- 1% 42% 46% 10% 351-400 144 -- -- -- -- -- -- 1% 44% 55%
>400 21 -- -- -- -- -- -- -- 5% 95%
FDA Executive Summary – Senseonics Eversense Continuous Glucose Monitoring System
Page 35 of 54
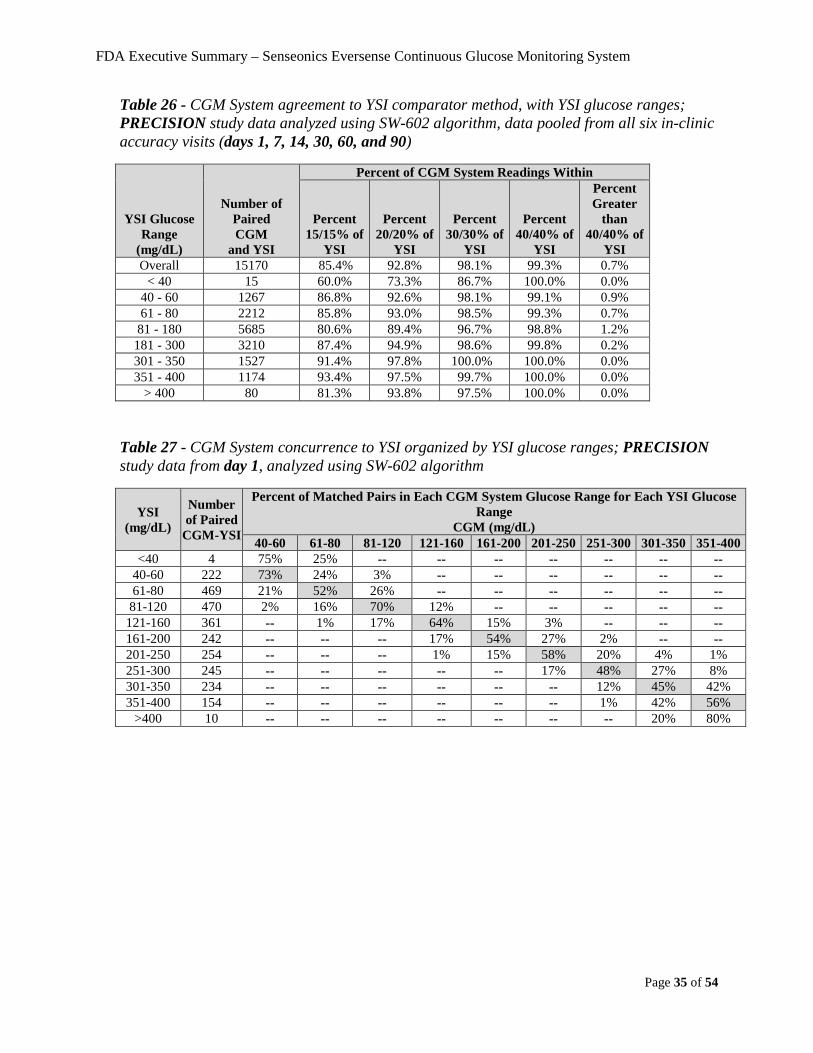
Table 26 - CGM System agreement to YSI comparator method, with YSI glucose ranges; PRECISION study data analyzed using SW-602 algorithm, data pooled from all six in-clinic accuracy visits (days 1, 7, 14, 30, 60, and 90)
YSI Glucose Range
(mg/dL)
Number of Paired CGM
and YSI
Percent of CGM System Readings Within
Percent 15/15% of
YSI
Percent 20/20% of
YSI
Percent 30/30% of
YSI
Percent 40/40% of
YSI
Percent Greater
than 40/40% of
YSI Overall 15170 85.4% 92.8% 98.1% 99.3% 0.7%
< 40 15 60.0% 73.3% 86.7% 100.0% 0.0% 40 - 60 1267 86.8% 92.6% 98.1% 99.1% 0.9% 61 - 80 2212 85.8% 93.0% 98.5% 99.3% 0.7%
81 - 180 5685 80.6% 89.4% 96.7% 98.8% 1.2% 181 - 300 3210 87.4% 94.9% 98.6% 99.8% 0.2% 301 - 350 1527 91.4% 97.8% 100.0% 100.0% 0.0% 351 - 400 1174 93.4% 97.5% 99.7% 100.0% 0.0%
> 400 80 81.3% 93.8% 97.5% 100.0% 0.0% Table 27 - CGM System concurrence to YSI organized by YSI glucose ranges; PRECISION study data from day 1, analyzed using SW-602 algorithm
YSI (mg/dL)
Number of Paired
CGM-YSI
Percent of Matched Pairs in Each CGM System Glucose Range for Each YSI Glucose Range
CGM (mg/dL) 40-60 61-80 81-120 121-160 161-200 201-250 251-300 301-350 351-400
<40 4 75% 25% -- -- -- -- -- -- -- 40-60 222 73% 24% 3% -- -- -- -- -- -- 61-80 469 21% 52% 26% -- -- -- -- -- --
81-120 470 2% 16% 70% 12% -- -- -- -- -- 121-160 361 -- 1% 17% 64% 15% 3% -- -- -- 161-200 242 -- -- -- 17% 54% 27% 2% -- -- 201-250 254 -- -- -- 1% 15% 58% 20% 4% 1% 251-300 245 -- -- -- -- -- 17% 48% 27% 8% 301-350 234 -- -- -- -- -- -- 12% 45% 42% 351-400 154 -- -- -- -- -- -- 1% 42% 56%
>400 10 -- -- -- -- -- -- -- 20% 80%
FDA Executive Summary – Senseonics Eversense Continuous Glucose Monitoring System
Page 36 of 54
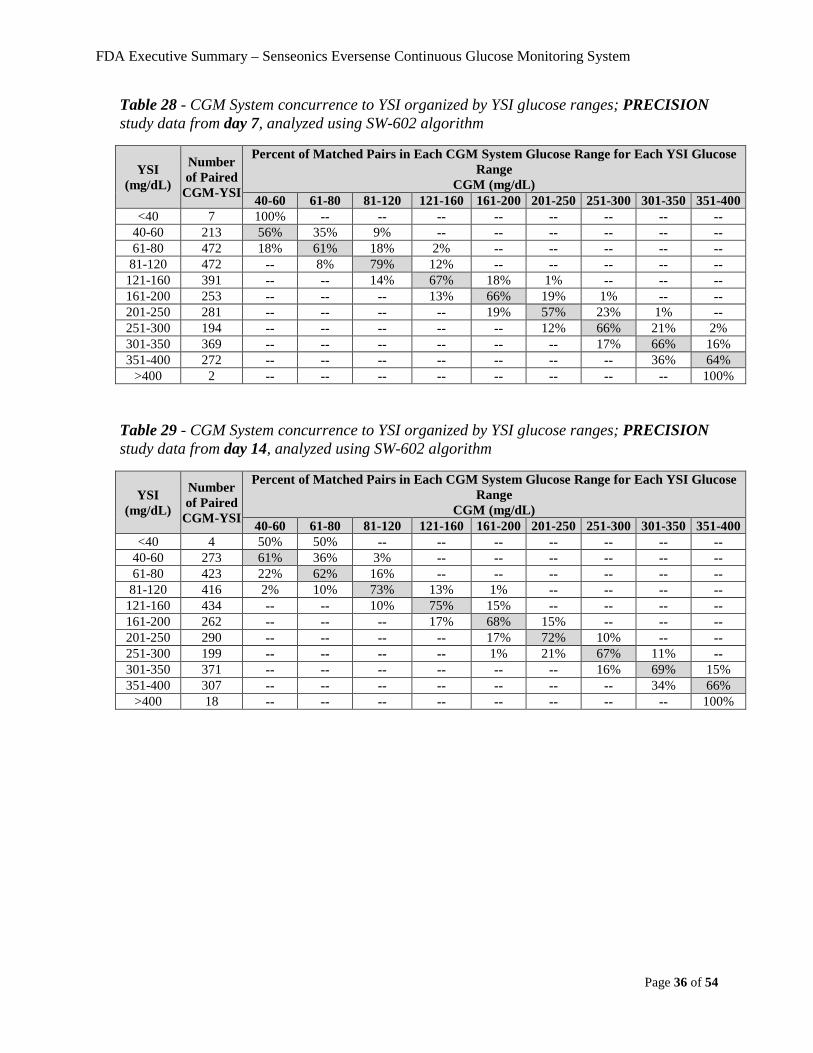
Table 28 - CGM System concurrence to YSI organized by YSI glucose ranges; PRECISION study data from day 7, analyzed using SW-602 algorithm
YSI (mg/dL)
Number of Paired
CGM-YSI
Percent of Matched Pairs in Each CGM System Glucose Range for Each YSI Glucose Range
CGM (mg/dL) 40-60 61-80 81-120 121-160 161-200 201-250 251-300 301-350 351-400
<40 7 100% -- -- -- -- -- -- -- -- 40-60 213 56% 35% 9% -- -- -- -- -- -- 61-80 472 18% 61% 18% 2% -- -- -- -- --
81-120 472 -- 8% 79% 12% -- -- -- -- -- 121-160 391 -- -- 14% 67% 18% 1% -- -- -- 161-200 253 -- -- -- 13% 66% 19% 1% -- -- 201-250 281 -- -- -- -- 19% 57% 23% 1% -- 251-300 194 -- -- -- -- -- 12% 66% 21% 2% 301-350 369 -- -- -- -- -- -- 17% 66% 16% 351-400 272 -- -- -- -- -- -- -- 36% 64%
>400 2 -- -- -- -- -- -- -- -- 100%
Table 29 - CGM System concurrence to YSI organized by YSI glucose ranges; PRECISION study data from day 14, analyzed using SW-602 algorithm
YSI (mg/dL)
Number of Paired
CGM-YSI
Percent of Matched Pairs in Each CGM System Glucose Range for Each YSI Glucose Range
CGM (mg/dL) 40-60 61-80 81-120 121-160 161-200 201-250 251-300 301-350 351-400
<40 4 50% 50% -- -- -- -- -- -- -- 40-60 273 61% 36% 3% -- -- -- -- -- -- 61-80 423 22% 62% 16% -- -- -- -- -- --
81-120 416 2% 10% 73% 13% 1% -- -- -- -- 121-160 434 -- -- 10% 75% 15% -- -- -- -- 161-200 262 -- -- -- 17% 68% 15% -- -- -- 201-250 290 -- -- -- -- 17% 72% 10% -- -- 251-300 199 -- -- -- -- 1% 21% 67% 11% -- 301-350 371 -- -- -- -- -- -- 16% 69% 15% 351-400 307 -- -- -- -- -- -- -- 34% 66%
>400 18 -- -- -- -- -- -- -- -- 100%
FDA Executive Summary – Senseonics Eversense Continuous Glucose Monitoring System
Page 37 of 54
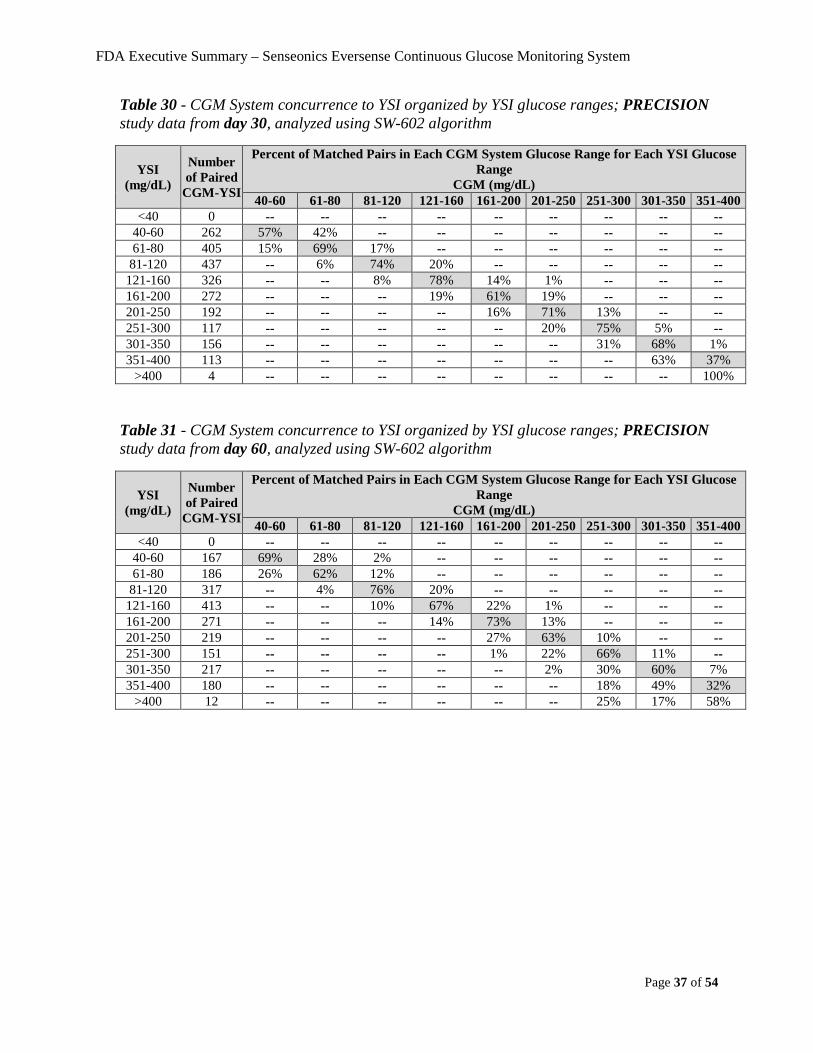
Table 30 - CGM System concurrence to YSI organized by YSI glucose ranges; PRECISION study data from day 30, analyzed using SW-602 algorithm
YSI (mg/dL)
Number of Paired
CGM-YSI
Percent of Matched Pairs in Each CGM System Glucose Range for Each YSI Glucose Range
CGM (mg/dL) 40-60 61-80 81-120 121-160 161-200 201-250 251-300 301-350 351-400
<40 0 -- -- -- -- -- -- -- -- -- 40-60 262 57% 42% -- -- -- -- -- -- -- 61-80 405 15% 69% 17% -- -- -- -- -- --
81-120 437 -- 6% 74% 20% -- -- -- -- -- 121-160 326 -- -- 8% 78% 14% 1% -- -- -- 161-200 272 -- -- -- 19% 61% 19% -- -- -- 201-250 192 -- -- -- -- 16% 71% 13% -- -- 251-300 117 -- -- -- -- -- 20% 75% 5% -- 301-350 156 -- -- -- -- -- -- 31% 68% 1% 351-400 113 -- -- -- -- -- -- -- 63% 37%
>400 4 -- -- -- -- -- -- -- -- 100%
Table 31 - CGM System concurrence to YSI organized by YSI glucose ranges; PRECISION study data from day 60, analyzed using SW-602 algorithm
YSI (mg/dL)
Number of Paired
CGM-YSI
Percent of Matched Pairs in Each CGM System Glucose Range for Each YSI Glucose Range
CGM (mg/dL) 40-60 61-80 81-120 121-160 161-200 201-250 251-300 301-350 351-400
<40 0 -- -- -- -- -- -- -- -- -- 40-60 167 69% 28% 2% -- -- -- -- -- -- 61-80 186 26% 62% 12% -- -- -- -- -- --
81-120 317 -- 4% 76% 20% -- -- -- -- -- 121-160 413 -- -- 10% 67% 22% 1% -- -- -- 161-200 271 -- -- -- 14% 73% 13% -- -- -- 201-250 219 -- -- -- -- 27% 63% 10% -- -- 251-300 151 -- -- -- -- 1% 22% 66% 11% -- 301-350 217 -- -- -- -- -- 2% 30% 60% 7% 351-400 180 -- -- -- -- -- -- 18% 49% 32%
>400 12 -- -- -- -- -- -- 25% 17% 58%
FDA Executive Summary – Senseonics Eversense Continuous Glucose Monitoring System
Page 38 of 54
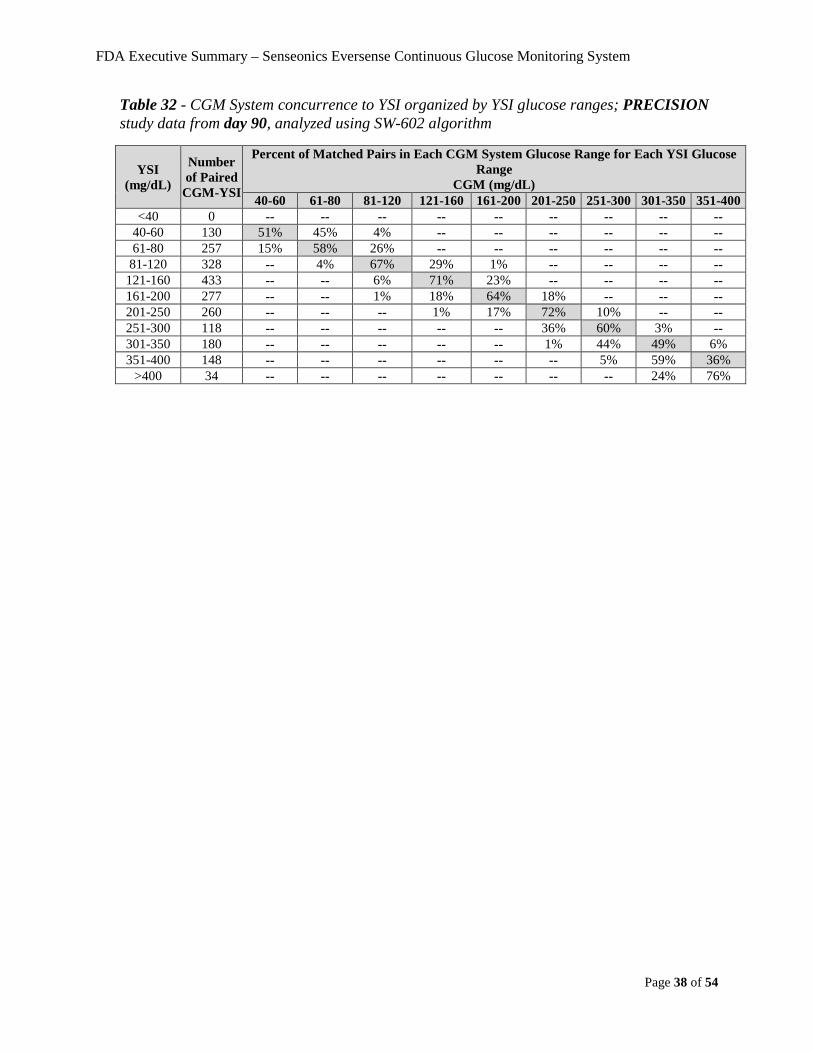
Table 32 - CGM System concurrence to YSI organized by YSI glucose ranges; PRECISION study data from day 90, analyzed using SW-602 algorithm
YSI (mg/dL)
Number of Paired
CGM-YSI
Percent of Matched Pairs in Each CGM System Glucose Range for Each YSI Glucose Range
CGM (mg/dL) 40-60 61-80 81-120 121-160 161-200 201-250 251-300 301-350 351-400
<40 0 -- -- -- -- -- -- -- -- -- 40-60 130 51% 45% 4% -- -- -- -- -- -- 61-80 257 15% 58% 26% -- -- -- -- -- --
81-120 328 -- 4% 67% 29% 1% -- -- -- -- 121-160 433 -- -- 6% 71% 23% -- -- -- -- 161-200 277 -- -- 1% 18% 64% 18% -- -- -- 201-250 260 -- -- -- 1% 17% 72% 10% -- -- 251-300 118 -- -- -- -- -- 36% 60% 3% -- 301-350 180 -- -- -- -- -- 1% 44% 49% 6% 351-400 148 -- -- -- -- -- -- 5% 59% 36%
>400 34 -- -- -- -- -- -- -- 24% 76%
FDA Executive Summary – Senseonics Eversense Continuous Glucose Monitoring System
Page 39 of 54
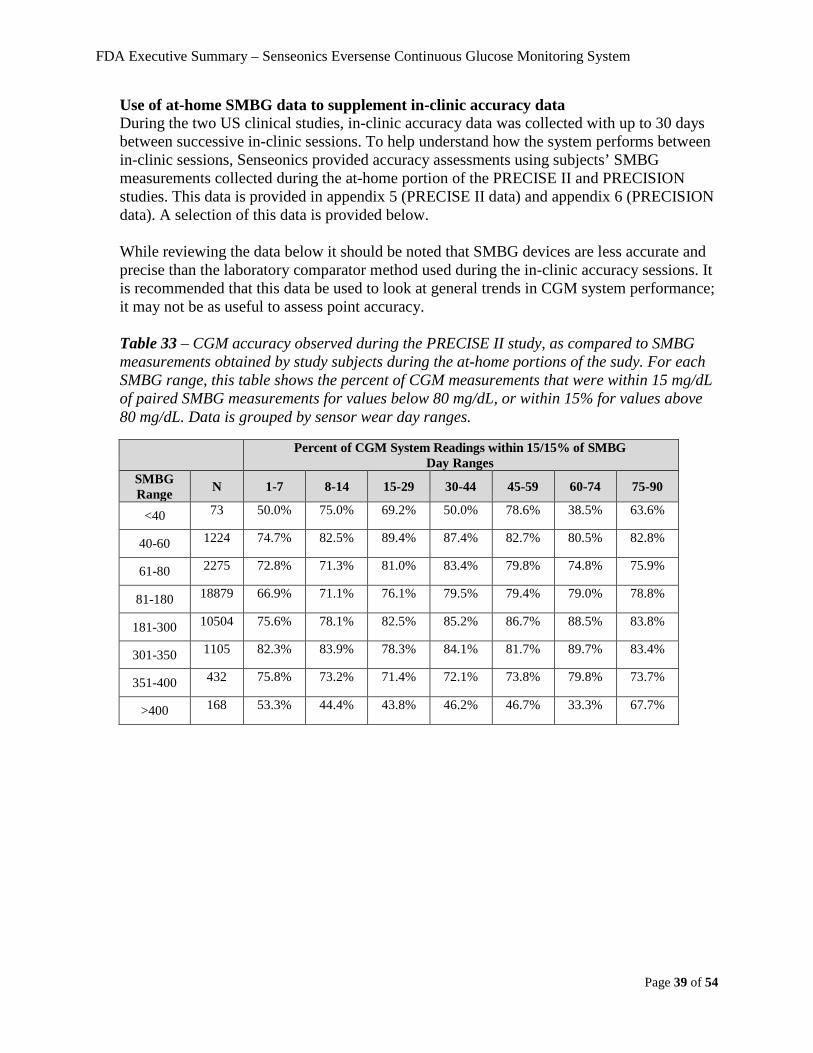
Use of at-home SMBG data to supplement in-clinic accuracy data During the two US clinical studies, in-clinic accuracy data was collected with up to 30 days between successive in-clinic sessions. To help understand how the system performs between in-clinic sessions, Senseonics provided accuracy assessments using subjects’ SMBG measurements collected during the at-home portion of the PRECISE II and PRECISION studies. This data is provided in appendix 5 (PRECISE II data) and appendix 6 (PRECISION data). A selection of this data is provided below. While reviewing the data below it should be noted that SMBG devices are less accurate and precise than the laboratory comparator method used during the in-clinic accuracy sessions. It is recommended that this data be used to look at general trends in CGM system performance; it may not be as useful to assess point accuracy. Table 33 – CGM accuracy observed during the PRECISE II study, as compared to SMBG measurements obtained by study subjects during the at-home portions of the sudy. For each SMBG range, this table shows the percent of CGM measurements that were within 15 mg/dL of paired SMBG measurements for values below 80 mg/dL, or within 15% for values above 80 mg/dL. Data is grouped by sensor wear day ranges.
Percent of CGM System Readings within 15/15% of SMBG Day Ranges
SMBG Range N 1-7 8-14 15-29 30-44 45-59 60-74 75-90
<40 73 50.0% 75.0% 69.2% 50.0% 78.6% 38.5% 63.6%
40-60 1224 74.7% 82.5% 89.4% 87.4% 82.7% 80.5% 82.8%
61-80 2275 72.8% 71.3% 81.0% 83.4% 79.8% 74.8% 75.9%
81-180 18879 66.9% 71.1% 76.1% 79.5% 79.4% 79.0% 78.8%
181-300 10504 75.6% 78.1% 82.5% 85.2% 86.7% 88.5% 83.8%
301-350 1105 82.3% 83.9% 78.3% 84.1% 81.7% 89.7% 83.4%
351-400 432 75.8% 73.2% 71.4% 72.1% 73.8% 79.8% 73.7%
>400 168 53.3% 44.4% 43.8% 46.2% 46.7% 33.3% 67.7%
FDA Executive Summary – Senseonics Eversense Continuous Glucose Monitoring System
Page 40 of 54
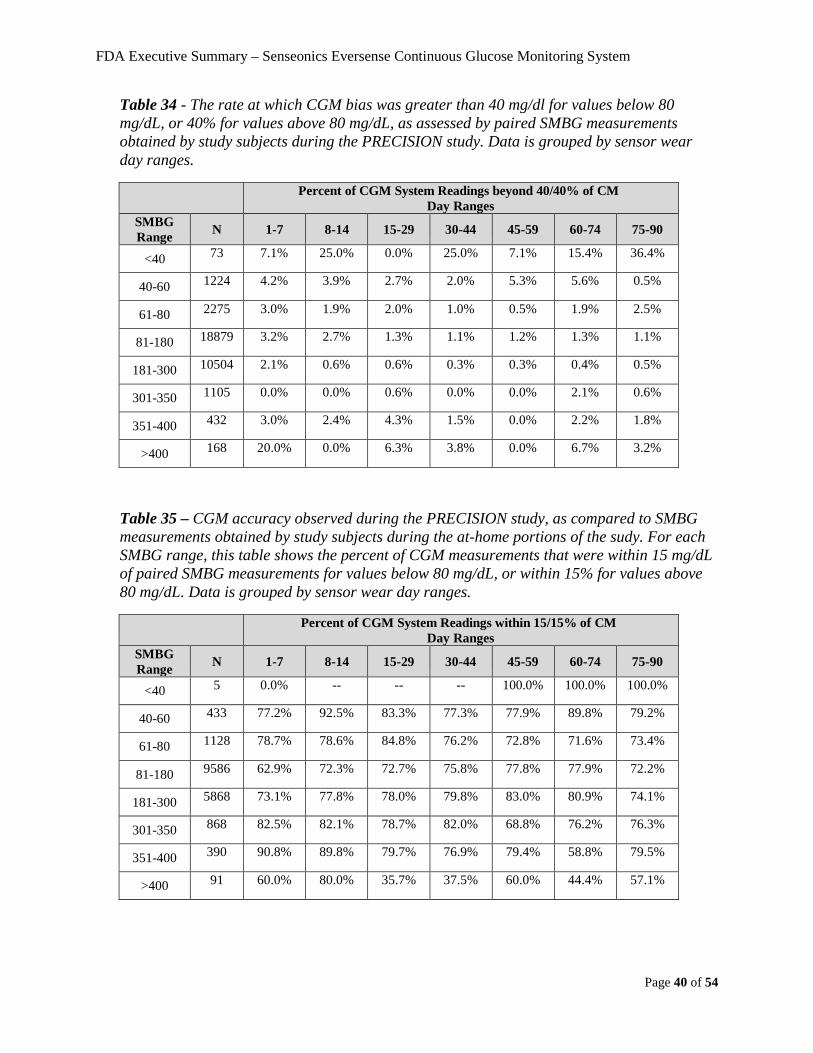
Table 34 - The rate at which CGM bias was greater than 40 mg/dl for values below 80 mg/dL, or 40% for values above 80 mg/dL, as assessed by paired SMBG measurements obtained by study subjects during the PRECISION study. Data is grouped by sensor wear day ranges.
Percent of CGM System Readings beyond 40/40% of CM Day Ranges
SMBG Range N 1-7 8-14 15-29 30-44 45-59 60-74 75-90
<40 73 7.1% 25.0% 0.0% 25.0% 7.1% 15.4% 36.4%
40-60 1224 4.2% 3.9% 2.7% 2.0% 5.3% 5.6% 0.5%
61-80 2275 3.0% 1.9% 2.0% 1.0% 0.5% 1.9% 2.5%
81-180 18879 3.2% 2.7% 1.3% 1.1% 1.2% 1.3% 1.1%
181-300 10504 2.1% 0.6% 0.6% 0.3% 0.3% 0.4% 0.5%
301-350 1105 0.0% 0.0% 0.6% 0.0% 0.0% 2.1% 0.6%
351-400 432 3.0% 2.4% 4.3% 1.5% 0.0% 2.2% 1.8%
>400 168 20.0% 0.0% 6.3% 3.8% 0.0% 6.7% 3.2%
Table 35 – CGM accuracy observed during the PRECISION study, as compared to SMBG measurements obtained by study subjects during the at-home portions of the sudy. For each SMBG range, this table shows the percent of CGM measurements that were within 15 mg/dL of paired SMBG measurements for values below 80 mg/dL, or within 15% for values above 80 mg/dL. Data is grouped by sensor wear day ranges.
Percent of CGM System Readings within 15/15% of CM Day Ranges
SMBG Range N 1-7 8-14 15-29 30-44 45-59 60-74 75-90
<40 5 0.0% -- -- -- 100.0% 100.0% 100.0%
40-60 433 77.2% 92.5% 83.3% 77.3% 77.9% 89.8% 79.2%
61-80 1128 78.7% 78.6% 84.8% 76.2% 72.8% 71.6% 73.4%
81-180 9586 62.9% 72.3% 72.7% 75.8% 77.8% 77.9% 72.2%
181-300 5868 73.1% 77.8% 78.0% 79.8% 83.0% 80.9% 74.1%
301-350 868 82.5% 82.1% 78.7% 82.0% 68.8% 76.2% 76.3%
351-400 390 90.8% 89.8% 79.7% 76.9% 79.4% 58.8% 79.5%
>400 91 60.0% 80.0% 35.7% 37.5% 60.0% 44.4% 57.1%
FDA Executive Summary – Senseonics Eversense Continuous Glucose Monitoring System
Page 41 of 54
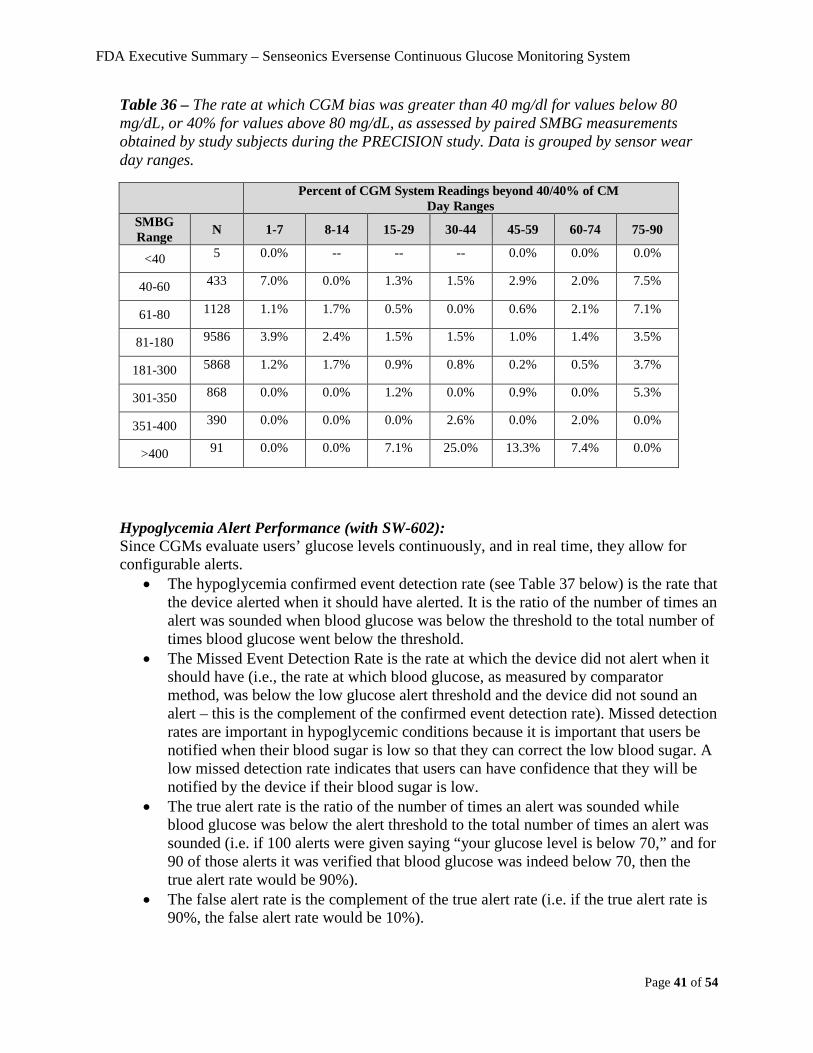
Table 36 – The rate at which CGM bias was greater than 40 mg/dl for values below 80 mg/dL, or 40% for values above 80 mg/dL, as assessed by paired SMBG measurements obtained by study subjects during the PRECISION study. Data is grouped by sensor wear day ranges.
Percent of CGM System Readings beyond 40/40% of CM Day Ranges
SMBG Range N 1-7 8-14 15-29 30-44 45-59 60-74 75-90
<40 5 0.0% -- -- -- 0.0% 0.0% 0.0%
40-60 433 7.0% 0.0% 1.3% 1.5% 2.9% 2.0% 7.5%
61-80 1128 1.1% 1.7% 0.5% 0.0% 0.6% 2.1% 7.1%
81-180 9586 3.9% 2.4% 1.5% 1.5% 1.0% 1.4% 3.5%
181-300 5868 1.2% 1.7% 0.9% 0.8% 0.2% 0.5% 3.7%
301-350 868 0.0% 0.0% 1.2% 0.0% 0.9% 0.0% 5.3%
351-400 390 0.0% 0.0% 0.0% 2.6% 0.0% 2.0% 0.0%
>400 91 0.0% 0.0% 7.1% 25.0% 13.3% 7.4% 0.0%
Hypoglycemia Alert Performance (with SW-602): Since CGMs evaluate users’ glucose levels continuously, and in real time, they allow for configurable alerts.
• The hypoglycemia confirmed event detection rate (see Table 37 below) is the rate that the device alerted when it should have alerted. It is the ratio of the number of times an alert was sounded when blood glucose was below the threshold to the total number of times blood glucose went below the threshold.
• The Missed Event Detection Rate is the rate at which the device did not alert when it should have (i.e., the rate at which blood glucose, as measured by comparator method, was below the low glucose alert threshold and the device did not sound an alert – this is the complement of the confirmed event detection rate). Missed detection rates are important in hypoglycemic conditions because it is important that users be notified when their blood sugar is low so that they can correct the low blood sugar. A low missed detection rate indicates that users can have confidence that they will be notified by the device if their blood sugar is low.
• The true alert rate is the ratio of the number of times an alert was sounded while blood glucose was below the alert threshold to the total number of times an alert was sounded (i.e. if 100 alerts were given saying “your glucose level is below 70,” and for 90 of those alerts it was verified that blood glucose was indeed below 70, then the true alert rate would be 90%).
• The false alert rate is the complement of the true alert rate (i.e. if the true alert rate is 90%, the false alert rate would be 10%).

FDA Executive Summary – Senseonics Eversense Continuous Glucose Monitoring System
Page 42 of 54
Table 37 - The Hypoglycemia alert performance for various alert thresholds as observed in the PRECISE II study, using the new SW-602 algorithm, with data pooled for all four in-clinic accuracy visits (days 1, 30, 60, and 90)
Low Alert Setting (mg/dL)
Confirmed Event Detection Rate
Missed Event Detection Rate
True Alert Rate
False Alert Rate
60 89% 11% 72% 28% 70 96% 4% 84% 16% 80 96% 4% 85% 15% 90 98% 2% 85% 15%
Table 38 - The Hypoglycemia alert performance for various alert thresholds as observed in the PRECISION study, using the new SW-602 algorithm, with data pooled for all six in-clinic accuracy visits (days 1, 7, 14 30, 60, and 90)
Low Alert Setting (mg/dL)
Confirmed Event Detection Rate
Missed Event Detection Rate
True Alert Rate
False Alert Rate
60 89% 11% 77% 23% 70 95% 5% 92% 8% 80 97% 3% 93% 7% 90 98% 2% 93% 7%
For additional assessment of hypoglycemia alert performance using the SW-602 algorithm, see appendix 3 (PRECISE II study) and appendix 4 (PRECISION study). These appendices include alert accuracy by day. In general, these data show that the alert accuracy during the early sensor wear period (e.g. day 1) is worse than subsequent in-clinic assessment days.
Hyperglycemia Alert Performance with New Algorithm: Likewise, users can set Eversense CGM alerts to indicate when blood glucose rises to high set thresholds (hyperglycemia alerts).
• The hyperglycemia confirmed event detection rate (see Table 39 below) is the rate that the device alerted when it should have alerted. It is the ratio of the number of times an alert was sounded when blood glucose was above the threshold to the total number of times blood glucose went above the threshold.
• The Missed Event Detection Rate is the rate at which the device did not alert when it should have (i.e., the rate at which blood glucose, as measured by comparator method, was above the high glucose alert threshold and the device did not sound an alert – this is the complement of the confirmed event detection rate).
• The true alert rate is the ratio of the number of times an alert was sounded while blood glucose was above the alert threshold to the total number of times an alert was sounded (i.e. if 100 alerts were given saying “your glucose level is above 300,” and for 90 of those alerts it was verified that blood glucose was indeed above 300, then the true alert rate would be 90%).
• The False Alert Rate (see Table 40 below) is the ratio of the number of times that the alarm incorrectly alerted when the users’ glucose was actually below the high threshold to the total number of times it alerted. False alert rates are important in hyperglycemic conditions because if a user is falsely notified that their blood sugar is high, they might treat themselves based on this false high result inappropriately. A
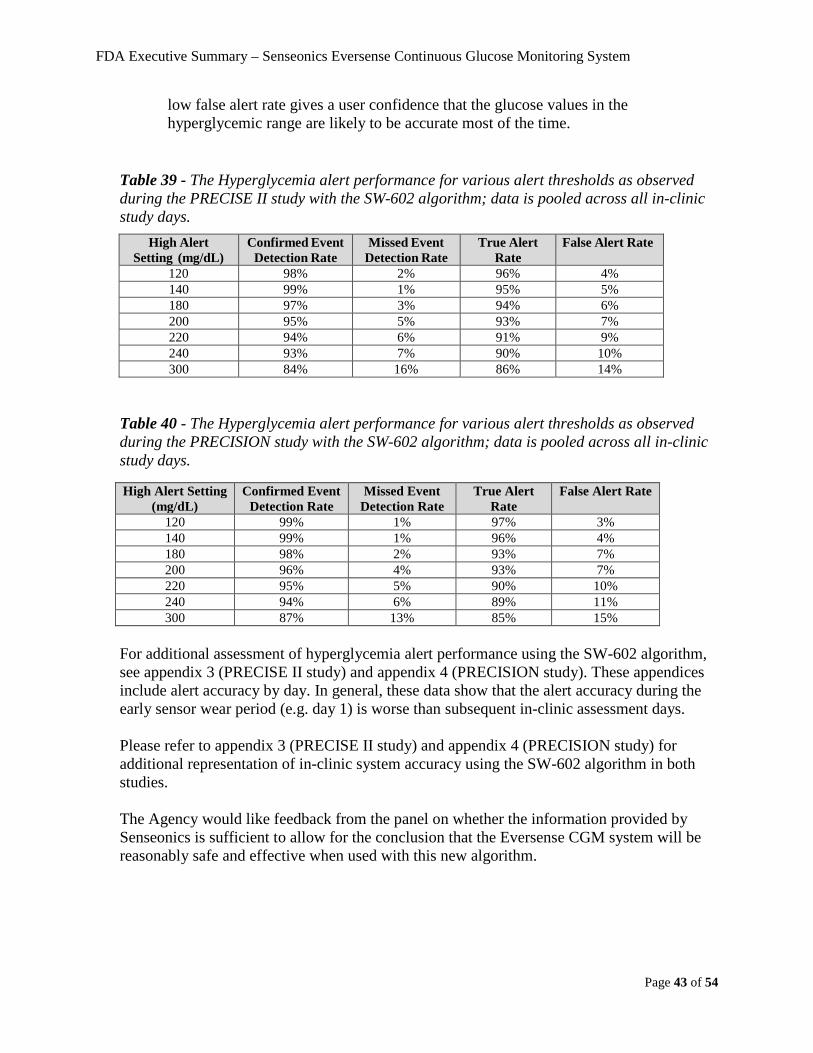
FDA Executive Summary – Senseonics Eversense Continuous Glucose Monitoring System
Page 43 of 54
low false alert rate gives a user confidence that the glucose values in the hyperglycemic range are likely to be accurate most of the time.
Table 39 - The Hyperglycemia alert performance for various alert thresholds as observed during the PRECISE II study with the SW-602 algorithm; data is pooled across all in-clinic study days.
High Alert Setting (mg/dL)
Confirmed Event Detection Rate
Missed Event Detection Rate
True Alert Rate
False Alert Rate
120 98% 2% 96% 4% 140 99% 1% 95% 5% 180 97% 3% 94% 6% 200 95% 5% 93% 7% 220 94% 6% 91% 9% 240 93% 7% 90% 10% 300 84% 16% 86% 14%
Table 40 - The Hyperglycemia alert performance for various alert thresholds as observed during the PRECISION study with the SW-602 algorithm; data is pooled across all in-clinic study days.
High Alert Setting (mg/dL)
Confirmed Event Detection Rate
Missed Event Detection Rate
True Alert Rate
False Alert Rate
120 99% 1% 97% 3% 140 99% 1% 96% 4% 180 98% 2% 93% 7% 200 96% 4% 93% 7% 220 95% 5% 90% 10% 240 94% 6% 89% 11% 300 87% 13% 85% 15%
For additional assessment of hyperglycemia alert performance using the SW-602 algorithm, see appendix 3 (PRECISE II study) and appendix 4 (PRECISION study). These appendices include alert accuracy by day. In general, these data show that the alert accuracy during the early sensor wear period (e.g. day 1) is worse than subsequent in-clinic assessment days. Please refer to appendix 3 (PRECISE II study) and appendix 4 (PRECISION study) for additional representation of in-clinic system accuracy using the SW-602 algorithm in both studies. The Agency would like feedback from the panel on whether the information provided by Senseonics is sufficient to allow for the conclusion that the Eversense CGM system will be reasonably safe and effective when used with this new algorithm.
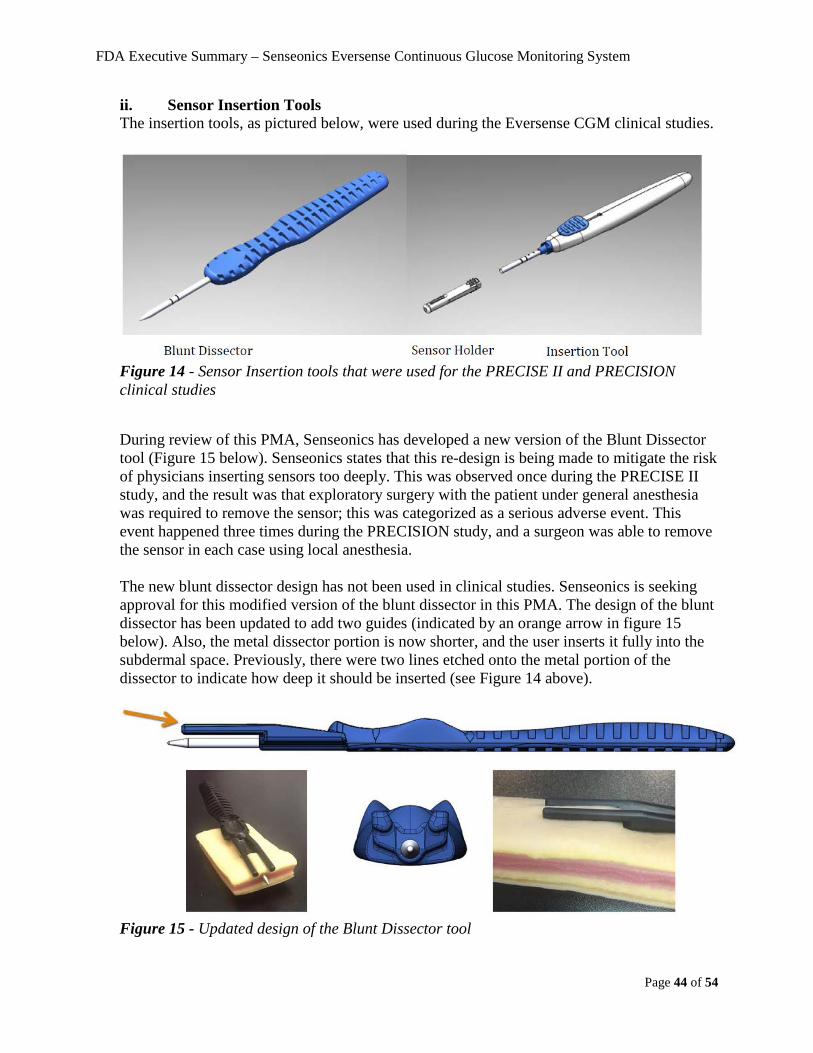
FDA Executive Summary – Senseonics Eversense Continuous Glucose Monitoring System
Page 44 of 54
ii. Sensor Insertion Tools The insertion tools, as pictured below, were used during the Eversense CGM clinical studies.
Figure 14 - Sensor Insertion tools that were used for the PRECISE II and PRECISION clinical studies During review of this PMA, Senseonics has developed a new version of the Blunt Dissector tool (Figure 15 below). Senseonics states that this re-design is being made to mitigate the risk of physicians inserting sensors too deeply. This was observed once during the PRECISE II study, and the result was that exploratory surgery with the patient under general anesthesia was required to remove the sensor; this was categorized as a serious adverse event. This event happened three times during the PRECISION study, and a surgeon was able to remove the sensor in each case using local anesthesia. The new blunt dissector design has not been used in clinical studies. Senseonics is seeking approval for this modified version of the blunt dissector in this PMA. The design of the blunt dissector has been updated to add two guides (indicated by an orange arrow in figure 15 below). Also, the metal dissector portion is now shorter, and the user inserts it fully into the subdermal space. Previously, there were two lines etched onto the metal portion of the dissector to indicate how deep it should be inserted (see Figure 14 above).
Figure 15 - Updated design of the Blunt Dissector tool

FDA Executive Summary – Senseonics Eversense Continuous Glucose Monitoring System
Page 45 of 54
To validate the new blunt dissector tool, Senseonics performed a human factors study. The human factors study participants included 16 healthcare providers who treat patients with diabetes. Participants completed sessions that included a system overview, watching a training video, a discussion of the package insert, and product training using simulated skin and the insertion tools. The synthetic tissue used for this process was a commercially available product sold by Syndaver. This was followed by a decay period of at least one hour before participants completed a usability testing scenario. This usability test involved participants performing a complete sensor insertion procedure on simulated skin installed in a model human arm (to mimic realistic arm position). Participants had an assistant available to assist with ancillary tasks (i.e. handling materials so sterility could be maintained). Successful use of the blunt dissector was judged based on the final insertion depth of the sensor in the simulated skin. Correct sensor depth was judged based on whether the sensor could be palpated after implantation. A selection of these synthetic tissue specimens (four of the fifteen) were dissected later and the actual sensor depth was measured and found to be within the intended insertion depth of 3-5mm (actual depths ranged from 3.3 to 3.9 mm). Senseonics concluded that all participants were able to use the tool successfully to create a satisfactory sensor pocket in synthetic tissue. The one error scenario reported was when a participant failed to load a sensor into the insertion tool before inserting the tool into the sensor pocket in the artificial tissue. The Agency would like feedback from the panel on whether the approach taken by Senseonics to validate this change in insertion tool design (i.e. the use of non-clinical Human Factors testing) is sufficient to allow for the conclusion that the Eversense CGM system will be reasonably safe and effective when used with this new insertion tool. As described above, during the PRECISE II and PRECISION clinical studies, there were a total of three adverse events where the Eversense sensor could not be removed at the first attempt. In all three cases the device was removed by a surgeon. In the one instance in the PRECISE II study, general anesthesia was used during the procedure. In the two instanced that occurred during the PRECISION study, the sensor was removed using local anesthesia. To mitigate the risk of unsuccessful removal requiring additional interventions, Senseonics has updated the physician training so that it now emphasizes proper depth of placement to facilitate removal and includes instructions for management of difficult to remove Sensors. The Agency would like feedback from the Panel on whether the information provided about the validation and use of the new blunt dissector design is adequate to demonstrate safe and effective use as part of the Eversense CGM system.
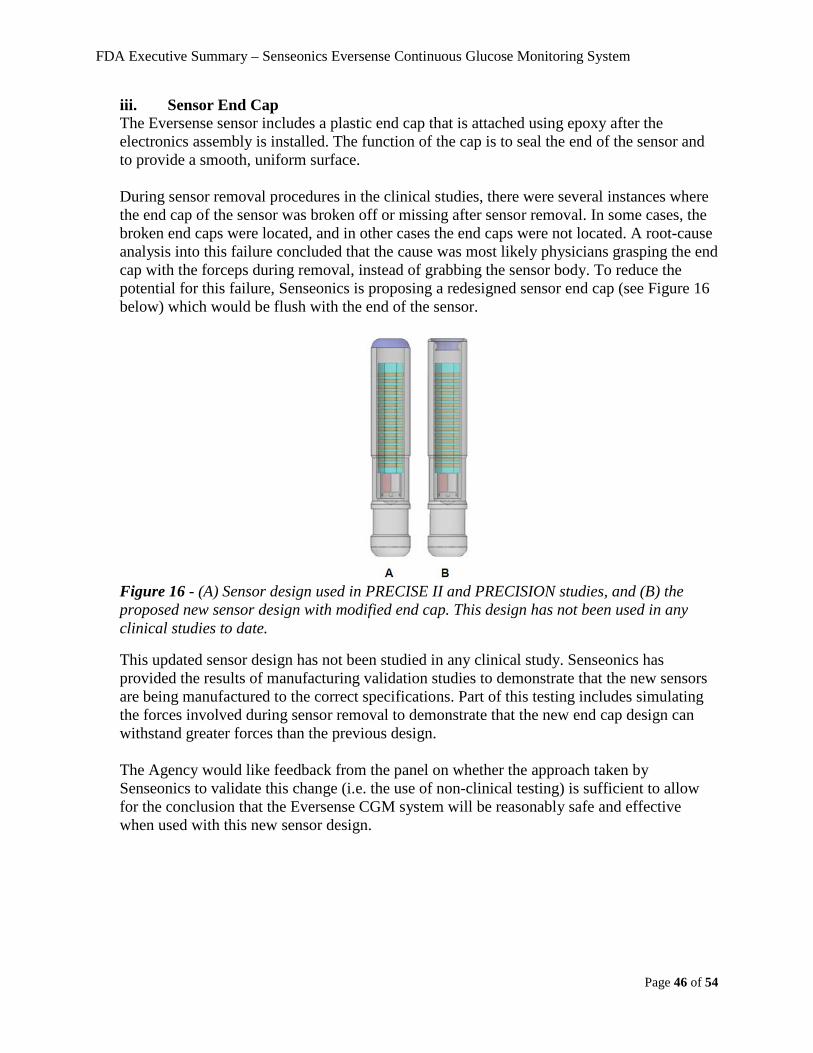
FDA Executive Summary – Senseonics Eversense Continuous Glucose Monitoring System
Page 46 of 54
iii. Sensor End Cap The Eversense sensor includes a plastic end cap that is attached using epoxy after the electronics assembly is installed. The function of the cap is to seal the end of the sensor and to provide a smooth, uniform surface. During sensor removal procedures in the clinical studies, there were several instances where the end cap of the sensor was broken off or missing after sensor removal. In some cases, the broken end caps were located, and in other cases the end caps were not located. A root-cause analysis into this failure concluded that the cause was most likely physicians grasping the end cap with the forceps during removal, instead of grabbing the sensor body. To reduce the potential for this failure, Senseonics is proposing a redesigned sensor end cap (see Figure 16 below) which would be flush with the end of the sensor.
Figure 16 - (A) Sensor design used in PRECISE II and PRECISION studies, and (B) the proposed new sensor design with modified end cap. This design has not been used in any clinical studies to date. This updated sensor design has not been studied in any clinical study. Senseonics has provided the results of manufacturing validation studies to demonstrate that the new sensors are being manufactured to the correct specifications. Part of this testing includes simulating the forces involved during sensor removal to demonstrate that the new end cap design can withstand greater forces than the previous design. The Agency would like feedback from the panel on whether the approach taken by Senseonics to validate this change (i.e. the use of non-clinical testing) is sufficient to allow for the conclusion that the Eversense CGM system will be reasonably safe and effective when used with this new sensor design.
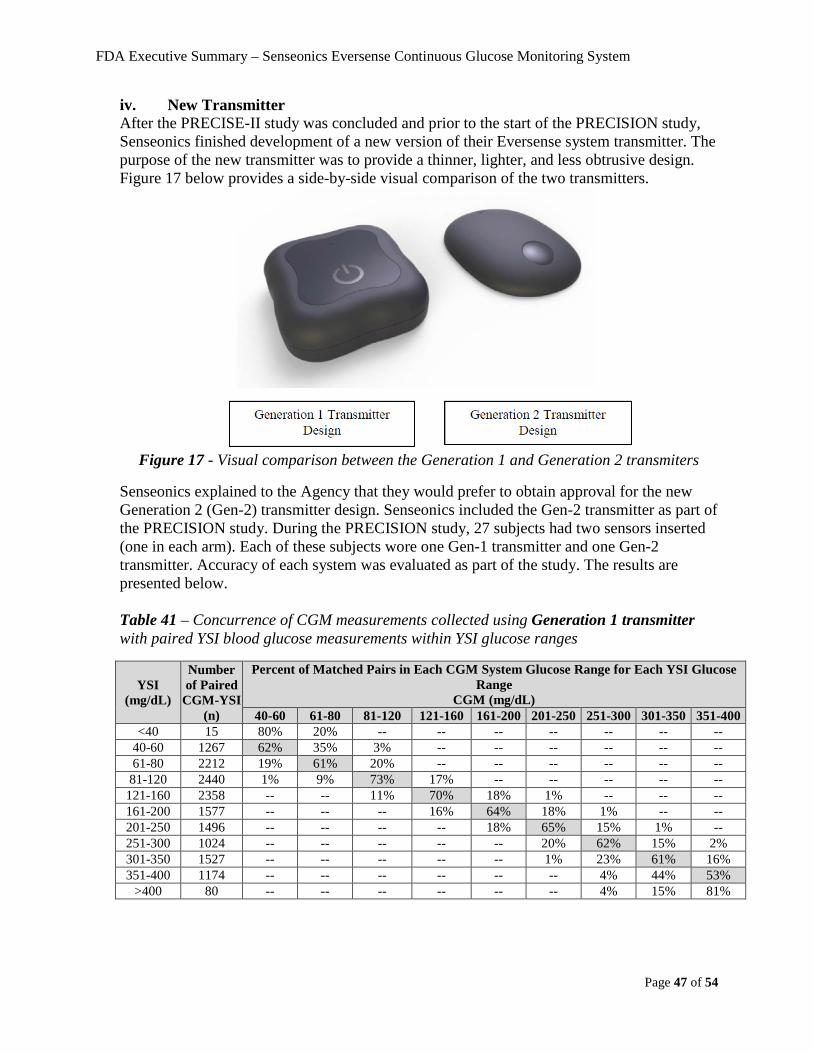
FDA Executive Summary – Senseonics Eversense Continuous Glucose Monitoring System
Page 47 of 54
iv. New Transmitter After the PRECISE-II study was concluded and prior to the start of the PRECISION study, Senseonics finished development of a new version of their Eversense system transmitter. The purpose of the new transmitter was to provide a thinner, lighter, and less obtrusive design. Figure 17 below provides a side-by-side visual comparison of the two transmitters.
Figure 17 - Visual comparison between the Generation 1 and Generation 2 transmiters
Senseonics explained to the Agency that they would prefer to obtain approval for the new Generation 2 (Gen-2) transmitter design. Senseonics included the Gen-2 transmitter as part of the PRECISION study. During the PRECISION study, 27 subjects had two sensors inserted (one in each arm). Each of these subjects wore one Gen-1 transmitter and one Gen-2 transmitter. Accuracy of each system was evaluated as part of the study. The results are presented below. Table 41 – Concurrence of CGM measurements collected using Generation 1 transmitter with paired YSI blood glucose measurements within YSI glucose ranges
YSI (mg/dL)
Number of Paired
CGM-YSI (n)
Percent of Matched Pairs in Each CGM System Glucose Range for Each YSI Glucose Range
CGM (mg/dL) 40-60 61-80 81-120 121-160 161-200 201-250 251-300 301-350 351-400
<40 15 80% 20% -- -- -- -- -- -- -- 40-60 1267 62% 35% 3% -- -- -- -- -- -- 61-80 2212 19% 61% 20% -- -- -- -- -- --
81-120 2440 1% 9% 73% 17% -- -- -- -- -- 121-160 2358 -- -- 11% 70% 18% 1% -- -- -- 161-200 1577 -- -- -- 16% 64% 18% 1% -- -- 201-250 1496 -- -- -- -- 18% 65% 15% 1% -- 251-300 1024 -- -- -- -- -- 20% 62% 15% 2% 301-350 1527 -- -- -- -- -- 1% 23% 61% 16% 351-400 1174 -- -- -- -- -- -- 4% 44% 53%
>400 80 -- -- -- -- -- -- 4% 15% 81%
FDA Executive Summary – Senseonics Eversense Continuous Glucose Monitoring System
Page 48 of 54
Table 42 - Concurrence of CGM measurements collected using Generation 2 transmitter with paired YSI blood glucose measurements within YSI glucose ranges
YSI (mg/dL)
Number of Paired
CGM-YSI (n)
Percent of Matched Pairs in Each CGM System Glucose Range for Each YSI Glucose Range
CGM (mg/dL) 40-60 61-80 81-120 121-160 161-200 201-250 251-300 301-350 351-400
<40 15 73% 20% 7% -- -- -- -- -- -- 40-60 938 63% 35% 2% -- -- -- -- -- -- 61-80 1631 16% 64% 19% -- -- -- -- -- --
81-120 1733 1% 8% 74% 16% 1% -- -- -- -- 121-160 1527 -- -- 11% 70% 17% 1% -- -- -- 161-200 1031 -- -- -- 16% 65% 18% 1% -- -- 201-250 974 -- -- -- 1% 18% 63% 16% 2% -- 251-300 729 -- -- -- -- 2% 18% 54% 21% 5% 301-350 1154 -- -- -- -- -- 2% 18% 57% 23% 351-400 946 -- -- -- -- -- -- 2% 35% 63%
>400 37 -- -- -- -- -- -- -- 8% 92% Senseonics also assessed system availability to demonstrate that the new transmitter had a similar degree of reliability. System availability is assessed as the percentage of time the system provides glucose values, compared to the total time the sensor is inserted and active. For example, if the sensor is inserted for 24 hours, with a new glucose value being presented every 5 minutes this would be a total of 288 CGM values. If there were 270 CGM values recorded during that period, this would be an availability of 94%. System availability in the PRECISE II study (which used Gen-1 transmitters only), and the PRECISION study (with both Gen-1 and Gen-2 transmitters) is presented below. Table 43 - System availability observed during the PRECISE II study over time, which includes only Gen-1 transmitters
Days 1-7 Days 8-14 Days 15-30 Days 31-60 Days 61-90 All Days
Mean 96% 97% 96% 96% 96% 96%
Median 98% 100% 100% 99% 99% 99%
STD 8% 9% 10% 7% 10% 7%
Table 44 - System availability for the Gen-2 transmitter observed during the PRECISION study
Days 1-7 Days 8-14 Days 15-30 Days 31-60 Days 61-90 All Days
Mean 97% 97% 96% 95% 95% 96%
Median 99% 98% 98% 96% 97% 97%
STD 4% 5% 4% 4% 4% 4%
FDA Executive Summary – Senseonics Eversense Continuous Glucose Monitoring System
Page 49 of 54
In addition to this clinical data, Senseonics has provided the results of bench testing to show that the new transmitter design meets requirements related to functionality and durability. These requirements are similar to the requirements established for the previous transmitter, and are related to such features as battery life, functionality after drop/vibration, functionality during and after exposure to electromagnetic fields and static discharge, as well as other similar assessments. The Agency would like feedback from the panel on whether the clinical data presented here is sufficient to allow for the conclusion that the Eversense CGM system will be reasonably safe and effective when used with this new transmitter design.
VIII. Data available from the European market A previous version of the Eversense CGM system became commercially available in Europe in June, 2016 and has been modified since initial approval. The currently-approved version of the device in Europe uses the same sensor that was studied in the PRECISE II and PRECISION studies in the US, it uses the Gen-2 transmitter, and it uses the original software algorithm. As part of the CE mark authorization, Senseonics agreed to conduct a Post Market Clinical Follow-up (PMCF) registry to collect safety data on long term use of the Eversense CGM System, specifically repeat Sensor insertions. Fourteen (14) countries with 350 centers are currently enrolling patients into the registry. For simplicity, this study is referred to as the European Patient Registry. In these countries, every patient who receives an Eversense CGM System is enrolled. The European Patient Registry as of February 2, 2018 remains open and is enrolling all inserted patients. The registry will remain open and continue to follow all patients until 100 patients have completed 4 insertion/removal cycles. As a prospective study, follow-up visits are scheduled according to standard medical practice every 3 to 6 months, when the Sensor requires replacement. The Eversense sensor initially approved in Europe had a different design (see Figure 18 below). The sensor design was later updated before the start of the PRECISE II study in the US.
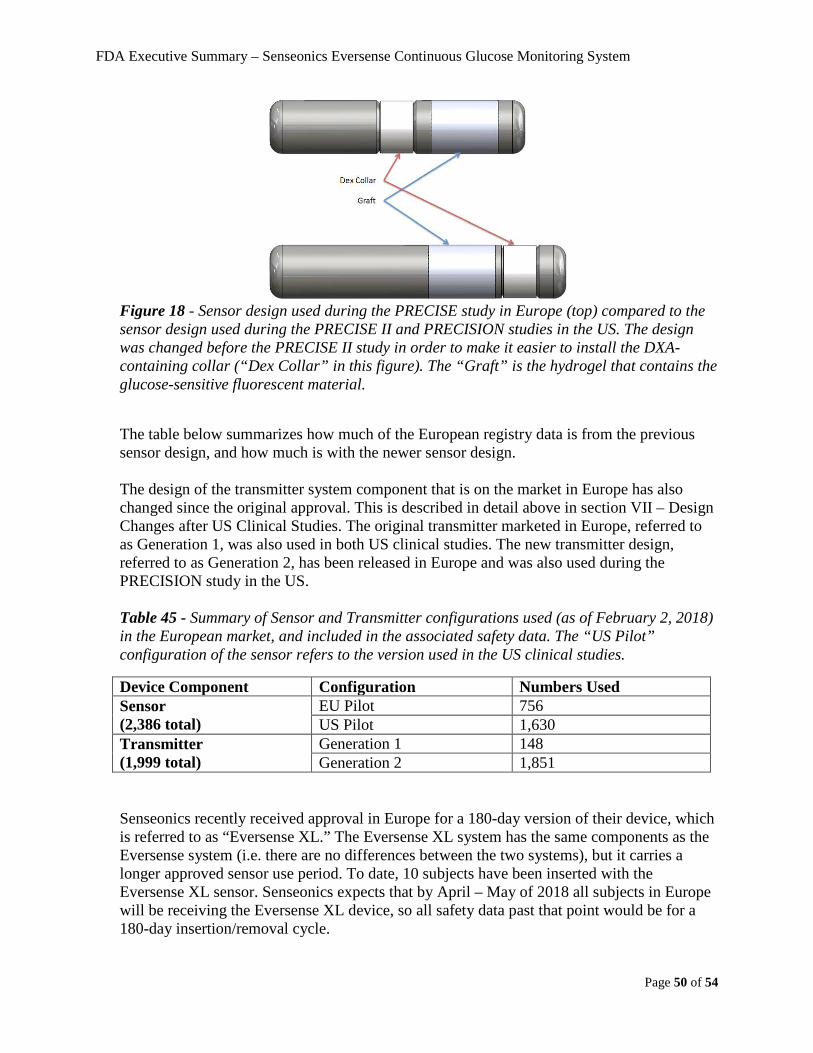
FDA Executive Summary – Senseonics Eversense Continuous Glucose Monitoring System
Page 50 of 54
Figure 18 - Sensor design used during the PRECISE study in Europe (top) compared to the sensor design used during the PRECISE II and PRECISION studies in the US. The design was changed before the PRECISE II study in order to make it easier to install the DXA-containing collar (“Dex Collar” in this figure). The “Graft” is the hydrogel that contains the glucose-sensitive fluorescent material. The table below summarizes how much of the European registry data is from the previous sensor design, and how much is with the newer sensor design. The design of the transmitter system component that is on the market in Europe has also changed since the original approval. This is described in detail above in section VII – Design Changes after US Clinical Studies. The original transmitter marketed in Europe, referred to as Generation 1, was also used in both US clinical studies. The new transmitter design, referred to as Generation 2, has been released in Europe and was also used during the PRECISION study in the US. Table 45 - Summary of Sensor and Transmitter configurations used (as of February 2, 2018) in the European market, and included in the associated safety data. The “US Pilot” configuration of the sensor refers to the version used in the US clinical studies.
Device Component Configuration Numbers Used Sensor (2,386 total)
EU Pilot 756 US Pilot 1,630
Transmitter (1,999 total)
Generation 1 148 Generation 2 1,851
Senseonics recently received approval in Europe for a 180-day version of their device, which is referred to as “Eversense XL.” The Eversense XL system has the same components as the Eversense system (i.e. there are no differences between the two systems), but it carries a longer approved sensor use period. To date, 10 subjects have been inserted with the Eversense XL sensor. Senseonics expects that by April – May of 2018 all subjects in Europe will be receiving the Eversense XL device, so all safety data past that point would be for a 180-day insertion/removal cycle.

FDA Executive Summary – Senseonics Eversense Continuous Glucose Monitoring System
Page 51 of 54
The system approved for use in Europe uses a different version of the blunt dissector than what Senseonics is seeking approval for in the US. This difference is explained above in section VII – Design Changes after US Clinical Studies. The insertion tools used in Europe are the same ones used during the US clinical studies. As of February 2, 2018, 1,686 patients have enrolled in the registry. These patients have received 2,386 insertions under real-world use conditions. One-hundred and fifty-one (151) patients have discontinued use of the system. The sponsor states that eighty-five (85) of these patients discontinued use after the first insertion cycle due to reimbursement issues. Table 46 provides a summary of the current enrollment status.
Table 46 - European Patient Registry enrollment summary
Number of Patients
1st Insertion Cycle
2nd Insertion Cycle
3rd Insertion Cycle
4th
Insertion Cycle
5th Insertion Cycle
6th Insertion Cycle
7th Insertion Cycle
Total inserted 1686 443 143 58 39 14 3
Currently wearing
1114 285 78 19 25 11 3
Continued to next insertion
443 143 58 39 14 3 0
Discontinued 129 15 7 0 0 0 0
Sixty-six (66) adverse events have been reported as of February 2, 2018. There have been no serious adverse events related to the device or the insertion/removal procedure and no unanticipated adverse events. Table 47 provides a summary of the adverse events considered potentially related to the device and/or insertion/removal procedure.
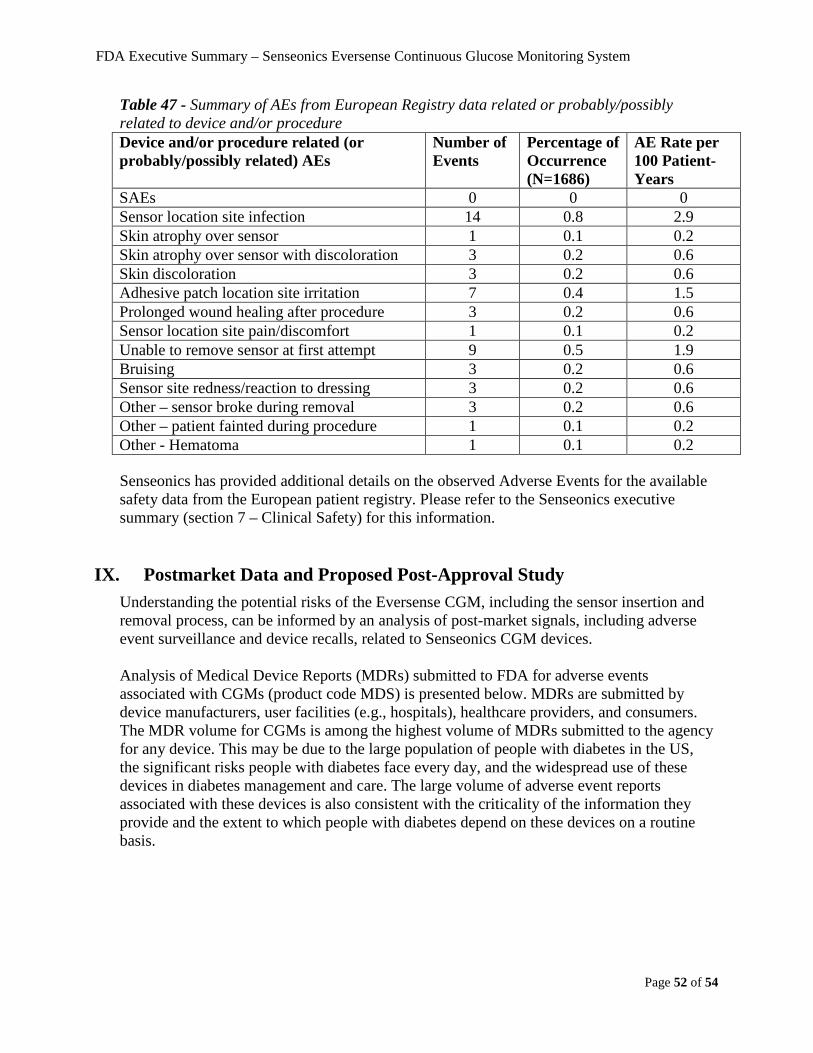
FDA Executive Summary – Senseonics Eversense Continuous Glucose Monitoring System
Page 52 of 54
Table 47 - Summary of AEs from European Registry data related or probably/possibly related to device and/or procedure Device and/or procedure related (or probably/possibly related) AEs
Number of Events
Percentage of Occurrence (N=1686)
AE Rate per 100 Patient-Years
SAEs 0 0 0 Sensor location site infection 14 0.8 2.9 Skin atrophy over sensor 1 0.1 0.2 Skin atrophy over sensor with discoloration 3 0.2 0.6 Skin discoloration 3 0.2 0.6 Adhesive patch location site irritation 7 0.4 1.5 Prolonged wound healing after procedure 3 0.2 0.6 Sensor location site pain/discomfort 1 0.1 0.2 Unable to remove sensor at first attempt 9 0.5 1.9 Bruising 3 0.2 0.6 Sensor site redness/reaction to dressing 3 0.2 0.6 Other – sensor broke during removal 3 0.2 0.6 Other – patient fainted during procedure 1 0.1 0.2 Other - Hematoma 1 0.1 0.2
Senseonics has provided additional details on the observed Adverse Events for the available safety data from the European patient registry. Please refer to the Senseonics executive summary (section 7 – Clinical Safety) for this information.
IX. Postmarket Data and Proposed Post-Approval Study Understanding the potential risks of the Eversense CGM, including the sensor insertion and removal process, can be informed by an analysis of post-market signals, including adverse event surveillance and device recalls, related to Senseonics CGM devices. Analysis of Medical Device Reports (MDRs) submitted to FDA for adverse events associated with CGMs (product code MDS) is presented below. MDRs are submitted by device manufacturers, user facilities (e.g., hospitals), healthcare providers, and consumers. The MDR volume for CGMs is among the highest volume of MDRs submitted to the agency for any device. This may be due to the large population of people with diabetes in the US, the significant risks people with diabetes face every day, and the widespread use of these devices in diabetes management and care. The large volume of adverse event reports associated with these devices is also consistent with the criticality of the information they provide and the extent to which people with diabetes depend on these devices on a routine basis.
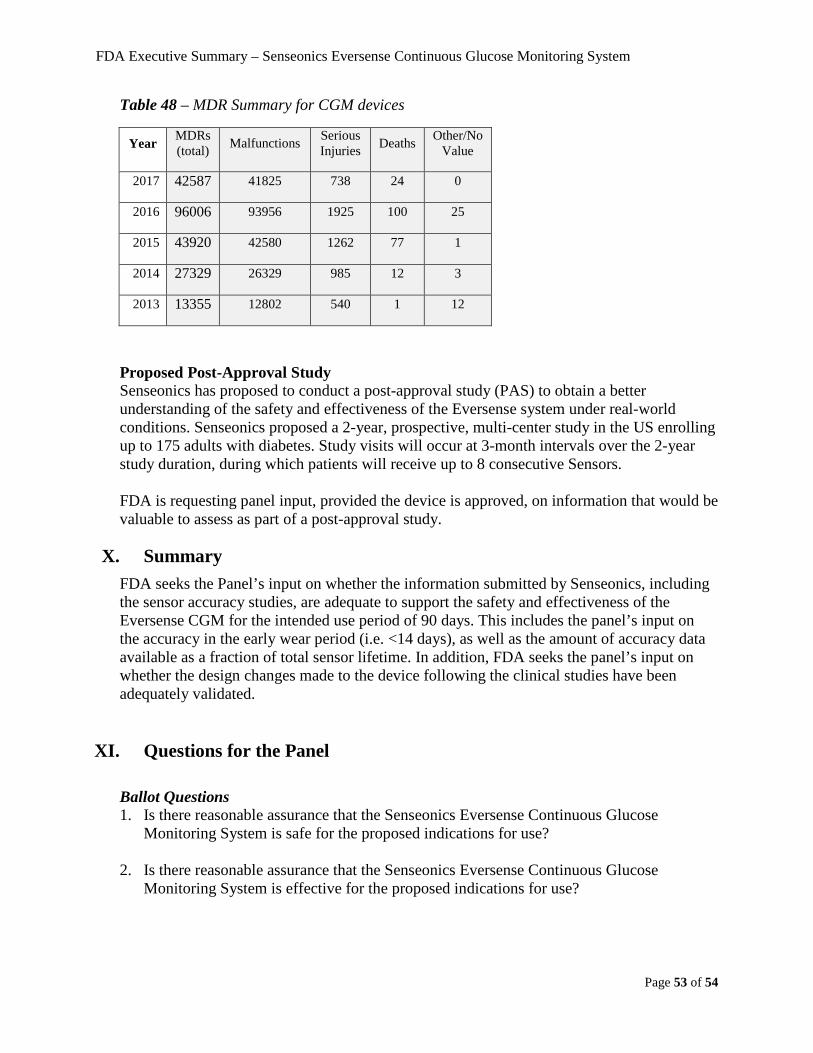
FDA Executive Summary – Senseonics Eversense Continuous Glucose Monitoring System
Page 53 of 54
Table 48 – MDR Summary for CGM devices
Year MDRs (total) Malfunctions Serious
Injuries Deaths Other/No Value
2017 42587 41825 738 24 0
2016 96006 93956 1925 100 25
2015 43920 42580 1262 77 1
2014 27329 26329 985 12 3
2013 13355 12802 540 1 12
Proposed Post-Approval Study Senseonics has proposed to conduct a post-approval study (PAS) to obtain a better understanding of the safety and effectiveness of the Eversense system under real-world conditions. Senseonics proposed a 2-year, prospective, multi-center study in the US enrolling up to 175 adults with diabetes. Study visits will occur at 3-month intervals over the 2-year study duration, during which patients will receive up to 8 consecutive Sensors. FDA is requesting panel input, provided the device is approved, on information that would be valuable to assess as part of a post-approval study.
X. Summary
FDA seeks the Panel’s input on whether the information submitted by Senseonics, including the sensor accuracy studies, are adequate to support the safety and effectiveness of the Eversense CGM for the intended use period of 90 days. This includes the panel’s input on the accuracy in the early wear period (i.e. <14 days), as well as the amount of accuracy data available as a fraction of total sensor lifetime. In addition, FDA seeks the panel’s input on whether the design changes made to the device following the clinical studies have been adequately validated.
XI. Questions for the Panel
Ballot Questions 1. Is there reasonable assurance that the Senseonics Eversense Continuous Glucose
Monitoring System is safe for the proposed indications for use?
2. Is there reasonable assurance that the Senseonics Eversense Continuous Glucose Monitoring System is effective for the proposed indications for use?
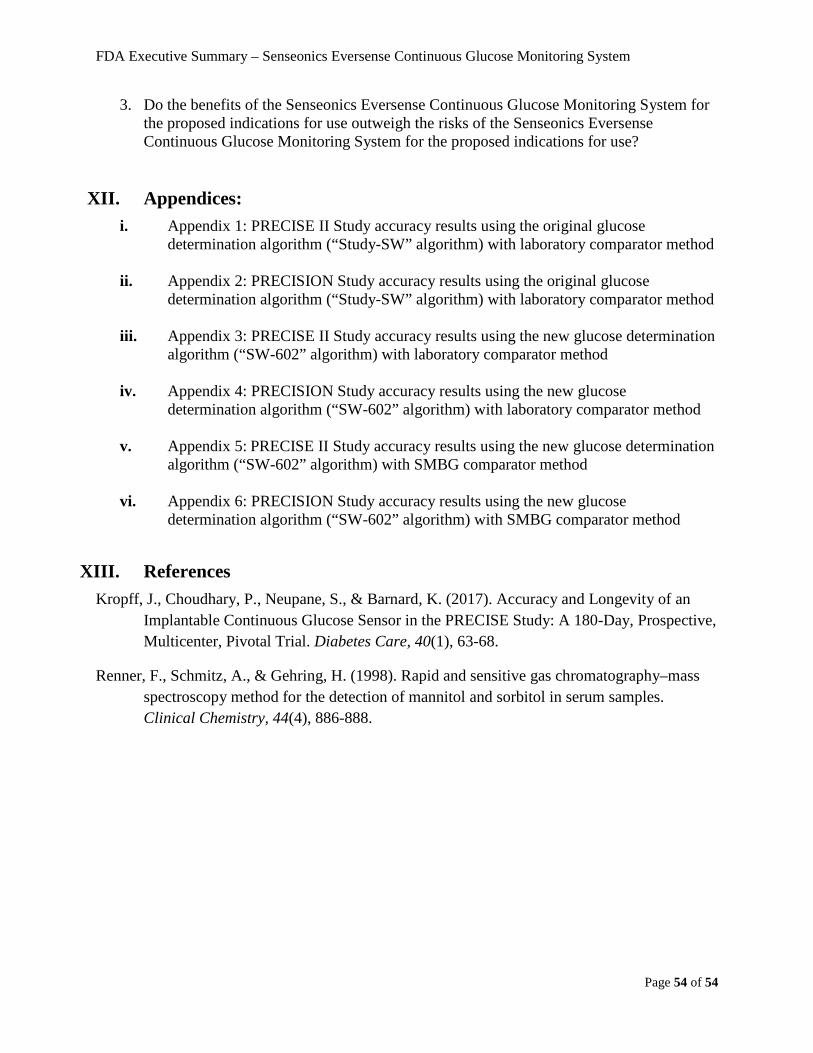
FDA Executive Summary – Senseonics Eversense Continuous Glucose Monitoring System
Page 54 of 54
3. Do the benefits of the Senseonics Eversense Continuous Glucose Monitoring System for the proposed indications for use outweigh the risks of the Senseonics Eversense Continuous Glucose Monitoring System for the proposed indications for use?
XII. Appendices: i. Appendix 1: PRECISE II Study accuracy results using the original glucose
determination algorithm (“Study-SW” algorithm) with laboratory comparator method
ii. Appendix 2: PRECISION Study accuracy results using the original glucose determination algorithm (“Study-SW” algorithm) with laboratory comparator method
iii. Appendix 3: PRECISE II Study accuracy results using the new glucose determination
algorithm (“SW-602” algorithm) with laboratory comparator method
iv. Appendix 4: PRECISION Study accuracy results using the new glucose determination algorithm (“SW-602” algorithm) with laboratory comparator method
v. Appendix 5: PRECISE II Study accuracy results using the new glucose determination
algorithm (“SW-602” algorithm) with SMBG comparator method
vi. Appendix 6: PRECISION Study accuracy results using the new glucose determination algorithm (“SW-602” algorithm) with SMBG comparator method
XIII. References Kropff, J., Choudhary, P., Neupane, S., & Barnard, K. (2017). Accuracy and Longevity of an
Implantable Continuous Glucose Sensor in the PRECISE Study: A 180-Day, Prospective, Multicenter, Pivotal Trial. Diabetes Care, 40(1), 63-68.
Renner, F., Schmitz, A., & Gehring, H. (1998). Rapid and sensitive gas chromatography–mass spectroscopy method for the detection of mannitol and sorbitol in serum samples. Clinical Chemistry, 44(4), 886-888.