Embed Size (px)
Citation preview

9
Q /L S
2009
Quality/Level of Service
2009 Handbook2009 Handbook
2009State of Florida
Department of Transportation

EXECUTIVE SUMMARY |
2009 FDOT QUALITY/LEVEL OF SERVICE HANDBOOK | 2
Florida Department of Transportation
Systems Planning Office
605 Suwannee Street, Mail Station 19
Tallahassee, FL 32399-0450
Multimodal Level of Service Resources are at our website:
http://www.dot.state.fl.us/planning/systems/sm/los/default.shtm

EXECUTIVE SUMMARY |
2009 FDOT QUALITY/LEVEL OF SERVICE HANDBOOK | 3
EXECUTIVE SUMMARY
Handbook used for roadway planning and
preliminary engineering analyses
This Handbook combines the nation’s leading automobile, bicycle, pedestrian, and bus evaluation techniques into a common analysis process.
This Quality/Level of Service Handbook and its accompanying software are intended to be used by engineers, planners, and decision-makers in the development and review of roadway users’ quality/level of service (Q/LOS) and capacity at planning and preliminary engineering levels. This Handbook provides tools to quantify multimodal transportation service inside the roadway environment (essentially inside the right-of-way).
This edition of the Handbook improves on guidance, providing a foundation for high quality, consistent capacity and LOS analyses and review. It includes updates in analytical techniques from recent research in Florida, updated generalized service volumes, more cost effective methods for gathering key input data, and FDOT’s updated Minimum LOS Standards rule. With these professionally accepted techniques, analysts can easily evaluate roadways from a multimodal perspective, which result in better multimodal decisions for projects in planning and preliminary engineering phases.
Levels of analysis
Two levels of analysis are included in this Handbook: (1) “generalized planning” and (2) “preliminary engineering” (also known as “conceptual planning”). Generalized planning makes extensive use of statewide default values and is intended for broad applications such as statewide analyses, initial problem identification, and future year analyses. Preliminary engineering is increasingly more detailed and accurate than generalized planning, but does not involve comprehensive operational analyses.
Generalized planning
Generalized planning is most appropriate when a quick service volume, “in the ball park” determination of LOS is needed or for future long range estimates. Florida’s Generalized Tables found at the end of this Handbook are the primary tools for conducting this type of planning analysis. The default values used for the Generalized Tables have been extensively researched and represent the most appropriate statewide values.
Preliminary engineering Preliminary engineering is best suited for obtaining a more solid determination of the LOS of a facility. Examples of preliminary engineering applications are determining the design concept and scope for a facility (e.g., 4 thru lanes with a raised median and bicycle lane), conducting alternatives analyses (e.g., 4 thru lanes undivided versus 2 thru lanes with a two-way left turn lane), and determining needs when a generalized planning approach is simply not accurate enough. Florida’s LOS software (LOSPLAN), which includes ARTPLAN, FREEPLAN, and HIGHPLAN, is the easy to use tool for conducting these types of evaluations.
Implementation schedule
The techniques contained in this Handbook and the accompanying software are to be implemented immediately. After December 31, 2009, FDOT will not accept analyses using methods, techniques, volumes, or generalized tables from previous versions of this Handbook unless a project has a previously agreed on methodology.
See www.dot.state.fl.us/planning/systems/sm/los/default.shtm to download the software and documentation, as well as provide your comments and suggestions.

INTRODUCTION | 1.1
2009 FDOT QUALITY/LEVEL OF SERVICE HANDBOOK | 4
TABLE OF CONTENTS
EXECUTIVE SUMMARY 3
1 INTRODUCTION 8 1.1 Purpose/Applications ............................................................................................................................................................ 8
Levels of analysis ...................................................................................................................................................................... 9 Statewide acceptable tools .................................................................................................................................................... 11 Implementation schedule ....................................................................................................................................................... 12
1.2 Quality and Level of Service (Q/LOS) and Capacity Concepts ............................................................................................... 12 QOS misconceptions ............................................................................................................................................................... 13 LOS across modes ................................................................................................................................................................... 16
1.3 Transportation System Structure .......................................................................................................................................... 1 1.4 Multimodal Structure ......................................................................................................................................................... 22 1.5 Major Revisions to This Edition of the Handbook and Software......................................................................................... 23 1.6 Anticipated Future Updates of Q/LOS Handbook ............................................................................................................... 25
2 PRIMARY Q/LOS EVALUATION TECHNIQUES 26 2.1 Highway Capacity Manual .................................................................................................................................................. 26 2.2 Bicycle LOS Model ............................................................................................................................................................... 26 2.3 Pedestrian LOS Model ......................................................................................................................................................... 28 2.4 Transit Capacity and Quality of Service Manual.................................................................................................................. 29 2.5 Simplifying Assumptions to Primary Q/LOS Evaluation Techniques ................................................................................... 30
Simplifying assumptions to the HCM ..................................................................................................................................... 31 Simplifying assumptions to the Bicycle LOS Model ................................................................................................................ 32 Simplifying assumptions to the Pedestrian LOS Model .......................................................................................................... 32 Simplifying assumptions to the TCQSM ................................................................................................................................. 33
2.6 Planning Extensions to Primary Q/LOS Resource Techniques ............................................................................................ 33 Extensions to the HCM ........................................................................................................................................................... 33 Extensions to the Bicycle LOS Model ...................................................................................................................................... 36 Extensions to the Pedestrian LOS Model ............................................................................................................................... 38 Extensions to the TCQSM ....................................................................................................................................................... 39
3 INPUT VARIABLES 42 3.1 Input Variable Types ........................................................................................................................................................... 42
General roadway variables ..................................................................................................................................................... 42 Traffic variables ...................................................................................................................................................................... 44 Control (signalization) variables ............................................................................................................................................. 44
3.2 Key Input Variables ............................................................................................................................................................. 44 Most important arterial variables .......................................................................................................................................... 44 Most important freeway variables ......................................................................................................................................... 46 Most important highway variables ......................................................................................................................................... 46 Consistent use of important variables .................................................................................................................................... 46
3.3 Minimum/Maximum Acceptable Key Input Values (K, D, g/C) ............................................................................................ 46 3.4 Site Specific Field Data Collection ....................................................................................................................................... 48 3.5 Roadway Variables .............................................................................................................................................................. 50
Roadway type ......................................................................................................................................................................... 50 Area type ................................................................................................................................................................................ 50 Number of thru lanes ............................................................................................................................................................. 53 Roadway Class ........................................................................................................................................................................ 55 Posted speed .......................................................................................................................................................................... 55 Free flow speed ...................................................................................................................................................................... 56
INTRODUCTION | 1.1
2009 FDOT QUALITY/LEVEL OF SERVICE HANDBOOK | 5
Roadway lengths .................................................................................................................................................................... 56 Exclusive left turn lanes .......................................................................................................................................................... 58 Exclusive left turn lane storage length ................................................................................................................................... 58 Exclusive right turn lanes ........................................................................................................................................................ 58 Median type ........................................................................................................................................................................... 59 Freeway segments .................................................................................................................................................................. 59 Auxiliary lanes ......................................................................................................................................................................... 60 Freeway acceleration/ deceleration lanes at least 1500 feet ............................................................................................... 60 Terrain .................................................................................................................................................................................... 60 Passing lanes ........................................................................................................................................................................... 61 Passing lane spacing ............................................................................................................................................................... 61 Percent no passing zone ......................................................................................................................................................... 61 Bicycle pavement condition ................................................................................................................................................... 62 Paved shoulder/ bicycle lane .................................................................................................................................................. 62 Auto outside lane width ......................................................................................................................................................... 62 Sidewalk .................................................................................................................................................................................. 63 Sidewalk/roadway separation ................................................................................................................................................ 63 Sidewalk/roadway protective barrier ..................................................................................................................................... 64 Obstacle to bus stop ............................................................................................................................................................... 64
3.6 Traffic Variables ................................................................................................................................................................... 65 Annual Average Daily Traffic (AADT) ...................................................................................................................................... 65 Planning analysis hour factor (K) ............................................................................................................................................ 67 Directional distribution factor (D) .......................................................................................................................................... 69 Peak hour factor (PHF) ........................................................................................................................................................... 69 Base saturation flow rate/ base capacity ............................................................................................................................... 70 Percent heavy vehicles ........................................................................................................................................................... 71 Local adjustment factor (driver population factor) ................................................................................................................ 71 Percent turns from exclusive turn lanes ................................................................................................................................. 71 Percent left turns .................................................................................................................................................................... 72 Percent right turns.................................................................................................................................................................. 72 Bus frequency ......................................................................................................................................................................... 73 Bus span of service ................................................................................................................................................................. 73
3.7 Control Variables ................................................................................................................................................................. 74 Number of signalized intersections ........................................................................................................................................ 74 Arrival type ............................................................................................................................................................................. 76 Signal type .............................................................................................................................................................................. 76 Cycle length (C) ....................................................................................................................................................................... 77 Effective green ratio (g/C) ...................................................................................................................................................... 78
4 FUTURE YEAR ANALYSES 81 4.1 Change in Traffic Variables ................................................................................................................................................... 81
Annual Average Daily Traffic .................................................................................................................................................. 81 Planning analysis hour factor (K100) ........................................................................................................................................ 81 Directional distribution factor (D) .......................................................................................................................................... 82
4.2 Change in Control Variables .................................................................................................................................................. 82 Thru movement effective green to cycle length ratio (g/C) ................................................................................................... 82 Signal density .......................................................................................................................................................................... 83
4.3 Evaluation Tools .................................................................................................................................................................... 84
5 GENERALIZED PLANNING ANALYSIS (Generalized Service Volume Tables) 85 5.1 Introduction ....................................................................................................................................................................... 85
Applications ............................................................................................................................................................................ 85 Caution in applying tables ...................................................................................................................................................... 85 Calculation of service volumes ............................................................................................................................................... 87
INTRODUCTION | 1.1
2009 FDOT QUALITY/LEVEL OF SERVICE HANDBOOK | 6
Florida’s Generalized Service Volume Tables ......................................................................................................................... 88 5.2 Special Aspects of the Generalized Tables .......................................................................................................................... 88
Varying traffic volumes along a facility................................................................................................................................... 88 Mid-block considerations ....................................................................................................................................................... 88 Non-state signalized roadways ............................................................................................................................................... 88 Unachievable levels of service ................................................................................................................................................ 89 Not applicable levels of service .............................................................................................................................................. 89 Divided/undivided & turn lane adjustments .......................................................................................................................... 90 One-way facility adjustment .................................................................................................................................................. 90 Auxiliary lane adjustment ....................................................................................................................................................... 91 Ramp metering adjustment.................................................................................................................................................... 91 Off-peak directional volumes ................................................................................................................................................. 91 Bicycle LOS and motorized vehicle thresholds ....................................................................................................................... 91 Pedestrian LOS and motorized vehicle thresholds ................................................................................................................. 92 Bus LOS and hourly directional bus frequency ....................................................................................................................... 93
6 PRELIMINARY ENGINEERING ANALYSIS (LOSPLAN Software) 94 6.1 Introduction ........................................................................................................................................................................ 94
Running LOSPLAN ................................................................................................................................................................... 95 Calculation results .................................................................................................................................................................. 96 Off peak directional analyses ................................................................................................................................................. 98
6.2 ARTPLAN .............................................................................................................................................................................. 98 6.3 FREEPLAN .......................................................................................................................................................................... 102 6.4 HIGHPLAN ......................................................................................................................................................................... 104 6.5 Service Volume Calculation Process ................................................................................................................................. 106
ARTPLAN ............................................................................................................................................................................... 106 FREEPLAN ............................................................................................................................................................................. 107 HIGHPLAN ............................................................................................................................................................................. 107
7 MAXIMUM ACCEPTABLE CAPACITY VOLUMES 108 7.1 Maximum Acceptable Capacity Volumes for Facilities ..................................................................................................... 108 7.2 Other Capacity Considerations .......................................................................................................................................... 109
Special arterial and highway considerations ........................................................................................................................ 109 Special freeway considerations ............................................................................................................................................ 109 Compatibility of software results with maximum acceptable capacity volumes ................................................................. 110 Approval of volumes higher than typical Florida maximum acceptable capacity volumes ................................................. 110 Inappropriate use of volume to capacity (v/c) ratios for LOS .............................................................................................. 110
8 FLORIDA’S PLANNING LOS STANDARDS 111 8.1 Applicability of Standards ................................................................................................................................................. 111 8.2 Concepts of Underlying Standards .................................................................................................................................... 114
9 SOURCES FOR ADDITIONAL INFORMATION 115 District LOS Coordinators ..................................................................................................................................................... 115 FDOT’s Q/LOS Website ......................................................................................................................................................... 116 FDOT consultants ................................................................................................................................................................. 116
10 GLOSSARY 117
11 REFERENCES 132

INTRODUCTION | 1.1
2009 FDOT QUALITY/LEVEL OF SERVICE HANDBOOK | 7
12 GENERALIZED SERVICE VOLUME TABLES End of Handbook
Table 1 Daily – Urbanized Areas Table 2 Daily – Transitioning and Urban Areas Table 3 Daily – Rural Undeveloped and Rural Developed Areas Table 4 Peak Hour Two-Way – Urbanized Areas Table 5 Peak Hour Two-Way – Transitioning and Urban Areas Table 6 Peak Hour Two-Way – Rural Undeveloped and Rural Developed Areas Table 7 Peak Hour Directional – Urbanized Areas Table 8 Peak Hour Directional – Transitioning and Urban Areas Table 9 Peak Hour Directional – Rural Undeveloped and Rural Developed Areas
List of Figures 1–1 Capacity/LOS Analyses and Sample Evaluation Tools ............................................................................................ 9 1–2 Examples of LOS By Mode for Urban Roadways .................................................................................................... 15
1–3 Generalized HCM Highway System Structure ........................................................................................................ 17 1–4 Relationship of Inputs to Quality of Service Measures .......................................................................................... 22 3–1 Arterial Data Collection Worksheet........................................................................................................................ 49
3–2 Example Signal Timing Plan and g/C Calculation .................................................................................................... 80 6–1 Freeway LOS and Service Volume Calculation Process .......................................................................................... 97
6–2 Simplified Multimodal Flow chart .......................................................................................................................... 99 6–3 ARTPLAN Input Screens .......................................................................................................................................... 100 6–4 ARTPLAN Output Screens ....................................................................................................................................... 101
6–5 FREEPLAN Input and Output Screens ..................................................................................................................... 103 6–6 HIGHPLAN Input and Output Screens .................................................................................................................... 105
List of Tables 2–1 Bicycle and Pedestrian LOS Categories .................................................................................................................. 27 2–2 Service Frequency LOS Thresholds ......................................................................................................................... 30 2–3 Pedestrian LOS Adjustment Factors on Bus LOS .................................................................................................... 39
2–4 Roadway Crossing Adjustment Factors .................................................................................................................. 40 2–5 Bus Span Of Service Adjustment Factors................................................................................................................ 41
3–1 Input Requirements ................................................................................................................................................ 43 3–2 Sensitivity of Variables on Service Volumes ........................................................................................................... 45 3–3 Effectiveness of Auxiliary Lanes ............................................................................................................................. 60
3–4 Statewide Average K100s ......................................................................................................................................... 67 3–5 Minimum Acceptable K100s ..................................................................................................................................... 68
3–6 Impact Of Bus Span Service – Daily Reporting ....................................................................................................... 73 8–1 Statewide Minimum LOS Standards ....................................................................................................................... 111
INTRODUCTION | 1.1 Purpose/Applications
2009 FDOT QUALITY/LEVEL OF SERVICE HANDBOOK | 8
1 INTRODUCTION
1.1 Purpose/Applications
Handbook uses
Quality of service defined
Level of service defined
Capacity defined
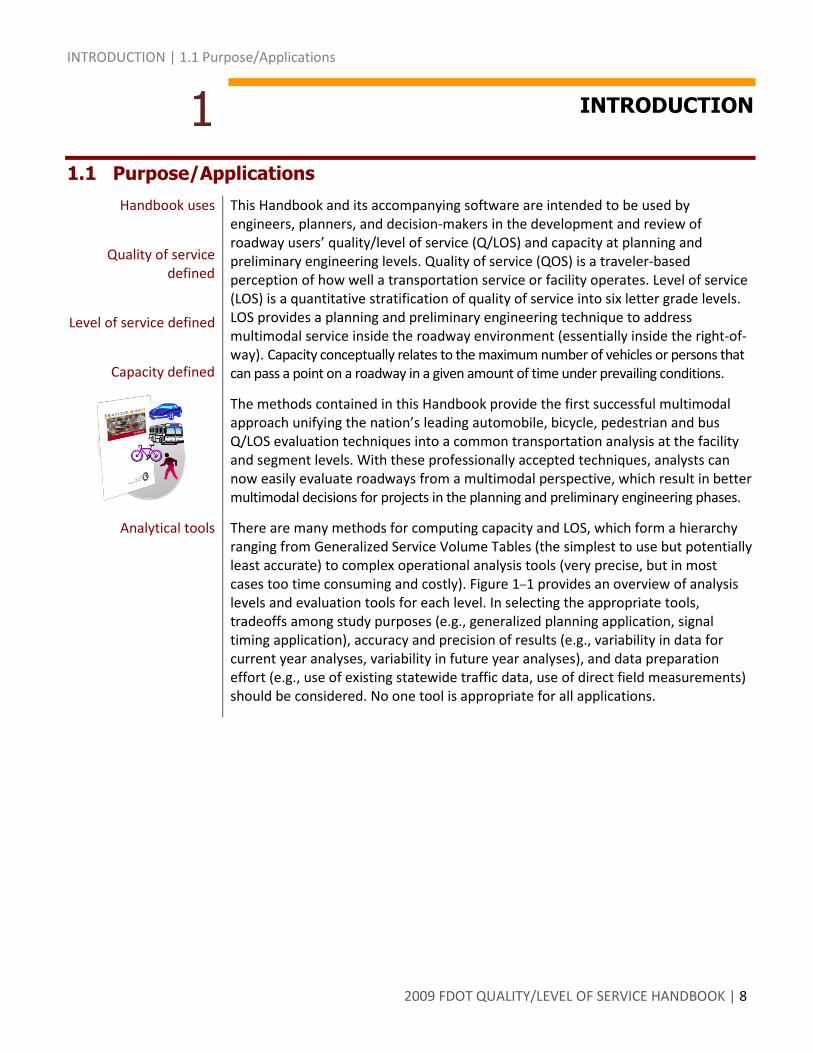
This Handbook and its accompanying software are intended to be used by engineers, planners, and decision-makers in the development and review of roadway users’ quality/level of service (Q/LOS) and capacity at planning and preliminary engineering levels. Quality of service (QOS) is a traveler-based perception of how well a transportation service or facility operates. Level of service (LOS) is a quantitative stratification of quality of service into six letter grade levels. LOS provides a planning and preliminary engineering technique to address multimodal service inside the roadway environment (essentially inside the right-of-way). Capacity conceptually relates to the maximum number of vehicles or persons that can pass a point on a roadway in a given amount of time under prevailing conditions.
The methods contained in this Handbook provide the first successful multimodal approach unifying the nation’s leading automobile, bicycle, pedestrian and bus Q/LOS evaluation techniques into a common transportation analysis at the facility and segment levels. With these professionally accepted techniques, analysts can now easily evaluate roadways from a multimodal perspective, which result in better multimodal decisions for projects in the planning and preliminary engineering phases.
Analytical tools There are many methods for computing capacity and LOS, which form a hierarchy ranging from Generalized Service Volume Tables (the simplest to use but potentially least accurate) to complex operational analysis tools (very precise, but in most cases too time consuming and costly). Figure 1–1 provides an overview of analysis levels and evaluation tools for each level. In selecting the appropriate tools, tradeoffs among study purposes (e.g., generalized planning application, signal timing application), accuracy and precision of results (e.g., variability in data for current year analyses, variability in future year analyses), and data preparation effort (e.g., use of existing statewide traffic data, use of direct field measurements) should be considered. No one tool is appropriate for all applications.

INTRODUCTION | 1.1 Purpose/Applications
2009 FDOT QUALITY/LEVEL OF SERVICE HANDBOOK | 9
Figure 1–1 Capacity/LOS Analyses and Sample Evaluation Tools
Levels of analysis Two levels of analysis are included in this Handbook: (1) “generalized planning” and (2) “preliminary engineering” (also known as “conceptual planning”). Generalized planning makes extensive use of statewide default values and is intended for broad applications such as initial problem identification (e.g., deficiency and needs analyses, geographic influence areas) statewide analyses (e.g., statewide calculation of delay), and future year analyses (e.g., ten-year planning horizon). Preliminary engineering is increasingly more detailed than generalized planning, but does not involve comprehensive operational analyses.
Generalized planning Generalized planning is most appropriate when a quick, “in the ball park” determination of capacity or LOS is needed. Florida’s Generalized Tables found in this Handbook are the primary tools for conducting this type of planning analysis. The tables are the most extensively researched in the nation and provide the most representative statewide service volumes and capacities for the State of Florida.
Preliminary engineering Preliminary engineering is best suited for obtaining a more solid determination of the capacity and LOS of a facility. Preliminary engineering analyses are performed to support decisions related to design concept and scope (e.g., 4 thru lanes with a raised median and bicycle lane), conducting alternatives analyses (e.g., 4 thru lanes undivided versus 2 thru lanes with a two-way left turn lane), assessing development impacts, and determining needs when a generalized planning approach is simply not accurate enough. The tools in Florida’s LOS planning software (LOSPLAN), including ARTPLAN, FREEPLAN, and HIGHPLAN, are appropriate tools for this type of planning analysis [Prassas, 1999b, Prassas, 2003, Washburn, 2002]. They are specifically developed to address preliminary engineering issues in Florida, are easy to use, and are based on the nation’s leading operational tools. These are the Highway Capacity Manual (HCM) [TRB, 2000], Transit Capacity and Quality of Service Manual (TCQSM) [TRB, 2003], Bicycle LOS Model [Landis, 1997], and Pedestrian LOS Model [Landis, 2001].
Generalized Tables
ARTPLAN FREEPLAN HIGHPLAN
HCM | TCQSM BLOS | PLOS
TRANSYT-7F
CORSIM
(Generalized Planning)
(Preliminary Engineering)
(Simple Operational Analysis)
(Microsimulation)
Effort/Complexity
Pote
ntia
l Acc
urac
y

INTRODUCTION | 1.1 Purpose/Applications
2009 FDOT QUALITY/LEVEL OF SERVICE HANDBOOK | 10
Operational analysis Operational tools range from “simple” to “complex”. The analytical methods found in the Highway Capacity Manual (HCM) methodology chapters and the Highway Capacity Software (HCS) [McTrans, 2009a], which replicates the HCM methodologies, are representative of “simple” operational tools. They are deterministic (i.e., provide a single, consistent answer), macroscopic (i.e., addresses vehicles as a group, not individually), and descriptive (e.g., replicates system behavior given the inputs – does not optimize). Traffic engineering practitioners typically work at this level. Simulation techniques (e.g., CORSIM, [McTrans, 2009b]) are typically even more complex requiring specialists, but can overcome some of the limitations of simple operational tools (e.g., evaluation of LOS F conditions).
Handbook does not contain tools for operational analyses or design.
While operational analyses, such as intersection signal timing and interchange justification reports, are sometimes conducted at the planning level, the Handbook does not contain the necessary tools for these types of detailed evaluations. As a planning document, the precision of operational, design, or pavement documents such as the AASHTO Policy on Geometric Design for Highways and Streets [AASHTO, 2004]or FDOT’s Plans Preparation Manual [FDOT, 2009c] is not included. For example, this Handbook’s simplifying planning level assumptions are applied to vehicle turning movements, lane widths, bicycle striping, sidewalk widths, bus stops and many other transportation characteristics. Therefore, it must not be used for actual design or operation of facilities or services where more appropriate resource documents and/or analysis methods are available.
Intermixing tools is inappropriate
Precision of inputs and outputs
The intermixing of generalized planning tools, preliminary engineering tools and operational tools should be avoided whether developing and implementing a concurrency management system, applying them to other planning applications, or conducting a traffic operations analysis. Using very precise data appropriate for a more detailed analysis as input to a less detailed analysis does not necessarily make the less detailed analysis more accurate. The precision of the inputs should be appropriate for the precision of the output. Similarly, the precision of the output is usually no better than the worst of the inputs. For example, the generalized service volume tables were structured to yield reasonable service volumes for typical roadways in the state. Typical roadway, traffic, and control (signalization) inputs from the state of Florida were used. Inserting specific traffic inputs for a preliminary engineering analysis (e.g., K and D factors) without simultaneously addressing key roadway and control inputs (e.g., effective green time ratios) is inappropriate, and also potentially leads to misuse of the tools as analysts can “cherry pick” which variables to alter for a desired result. “Typical” values for roadways are the most appropriate inputs when the Generalized Tables are applied to analyze roadways.
FDOT’s planning tools were designed to provide the most accurate results for the appropriate application. For example, a statewide summary of LOSPLAN results should have about the same service volumes as the generalized service volume tables. Many analysts believe the Generalized Tables were constructed to be conservative in terms of service volumes; however, that is not the case. An analyst should expect more accurate roadway specific values, but not necessarily higher or lower values when performing a detailed analysis for a typical state road.

INTRODUCTION | 1.1 Purpose/Applications
2009 FDOT QUALITY/LEVEL OF SERVICE HANDBOOK | 11
Statewide acceptable tools
There are two FDOT supported and statewide acceptable highway capacity and LOS analysis tools for planning and preliminary engineering (conceptual planning): FDOT’s Generalized Service Volume Tables and FDOT’s LOSPLAN software which includes ARTPLAN, FREEPLAN and HIGHPLAN. These two tools form the core for all FDOT’s highway capacity and LOS analyses and reviews in planning stages. Through detailed research and review these planning and preliminary engineering tools can frequently result in more accurate analyses than more detailed unadjusted national operational tools. Each may be supplemented by other analyses, but they form the basis for all highway capacity and LOS analyses and determinations in Florida. To ensure that an analysis is consistent with Florida conditions and research, the inputs and volumes must be within the ranges specified in Chapter 3.3 and 4 of this Handbook.
If there is conflicting guidance on the application of highway capacity or LOS analyses in other FDOT planning handbooks (e.g., Site Impact Handbook [FDOT, 1997]), the guidance above takes precedence while these other handbooks are being updated.
Supplements to statewide planning and
preliminary engineering tools
The misuse of level of analysis tools and the intermixing of level of analysis tools, especially at a conceptual planning level, has increased in Florida in recent years. According to Rule 14-94 F.A.C. [FDOT, 2006], FDOT’s roadway (auto) LOS analyses must be based on the HCM methodologies or a methodology determined by FDOT as having comparable reliability. If an operational tool is needed to supplement an LOSPLAN analysis, that tool should be the HCM/HCS. There are numerous reasons for this position including:
• State and national recognition of the HCM as the nation’s leading resource on highway capacity and LOS analysis;
• The HCS is a faithful replication of the HCM methodology chapters and is the leading software implementing the HCM in Florida and the nation;
• FDOT staff cannot be responsible for acquiring and reviewing all of the currently available software programs in the market;
• Although other methodologies may be more accurate than the HCM in specific applications, they have not received the international acceptance based on national research conducted through the National Academies of Science Transportation Research Board; and
• Requiring operational analyses be based on the HCM/HCS offers statewide consistency in approach for the benefit of both the reviewers and analysts submitting analyses.
Primary analytical techniques
The methodologies in this Handbook are planning and preliminary engineering applications from the following primary resource documents and analytical techniques using actual Florida roadway, traffic and signalization data:
• 2000 Highway Capacity Manual (HCM) methodologies for automobiles and trucks [TRB, 2000];
• 2003 Transit Capacity and Quality of Service Manual (TCQSM) for buses [TRB, 2003];
INTRODUCTION | 1.1 Purpose/Applications
2009 FDOT QUALITY/LEVEL OF SERVICE HANDBOOK | 12
• Bicycle LOS Model, the most used technique in the U.S. to evaluate LOS for bicyclists [Landis, 1997]; and
• Pedestrian LOS Model, the most advanced technique in the U.S. to evaluate LOS for pedestrians [Landis, 2001].
Extensions of these operational techniques are presented in Section 2.6.
Implementation schedule
The techniques contained in this Handbook and the accompanying software are to be implemented immediately. After December 31, 2009, FDOT will not accept analyses using methods, techniques, volumes, or Generalized Tables from previous versions of this Handbook unless a project has a previously agreed on methodology.
1.2 Quality and Level of Service (Q/LOS) and Capacity Concepts
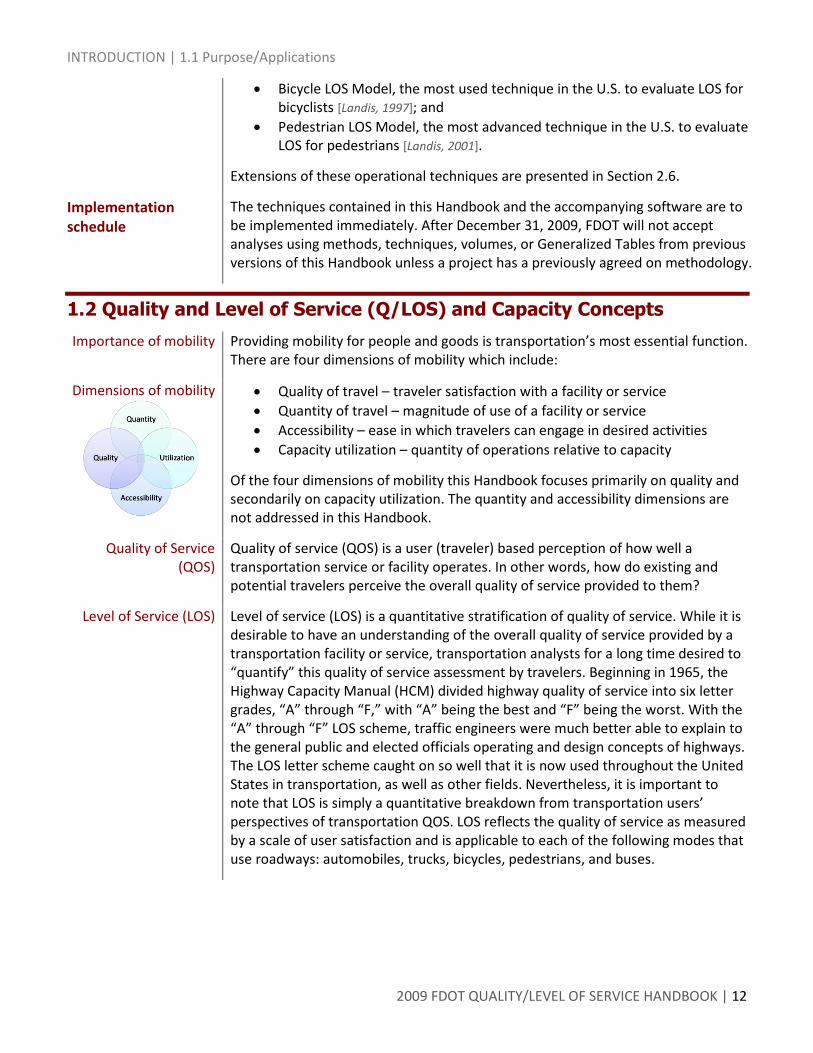
Importance of mobility Providing mobility for people and goods is transportation’s most essential function. There are four dimensions of mobility which include:
Dimensions of mobility
• Quality of travel – traveler satisfaction with a facility or service • Quantity of travel – magnitude of use of a facility or service • Accessibility – ease in which travelers can engage in desired activities • Capacity utilization – quantity of operations relative to capacity
Of the four dimensions of mobility this Handbook focuses primarily on quality and secondarily on capacity utilization. The quantity and accessibility dimensions are not addressed in this Handbook.
Quality of Service (QOS)
Quality of service (QOS) is a user (traveler) based perception of how well a transportation service or facility operates. In other words, how do existing and potential travelers perceive the overall quality of service provided to them?
Level of Service (LOS) Level of service (LOS) is a quantitative stratification of quality of service. While it is desirable to have an understanding of the overall quality of service provided by a transportation facility or service, transportation analysts for a long time desired to “quantify” this quality of service assessment by travelers. Beginning in 1965, the Highway Capacity Manual (HCM) divided highway quality of service into six letter grades, “A” through “F,” with “A” being the best and “F” being the worst. With the “A” through “F” LOS scheme, traffic engineers were much better able to explain to the general public and elected officials operating and design concepts of highways. The LOS letter scheme caught on so well that it is now used throughout the United States in transportation, as well as other fields. Nevertheless, it is important to note that LOS is simply a quantitative breakdown from transportation users’ perspectives of transportation QOS. LOS reflects the quality of service as measured by a scale of user satisfaction and is applicable to each of the following modes that use roadways: automobiles, trucks, bicycles, pedestrians, and buses.

INTRODUCTION | 1.2 Q/LOS and Capacity Concepts
2009 FDOT QUALITY/LEVEL OF SERVICE HANDBOOK | 13
QOS & LOS issues addressed in this Q/LOS Handbook
Because this Handbook deals with the overall quality of user satisfaction and its quantitative breakdown, it is labeled as the Quality/Level of Service Handbook, although it is frequently simply called “LOS analysis”. Specifically, this Handbook deals with both the quality of service (QOS) and the level of service (LOS) roadways provide to roadway users (i.e., automobile, bicyclists, pedestrians and bus riders) inside the roadway environment and provides planning tools to assist transportation planners and engineers address these issues. This Handbook does not deal with the overall “quality of trip experience” such as neighborhood safety and appearance, and social and aesthetic amenities that transportation planners and engineers do not directly affect.
The automobile mode includes all motorized vehicles except for buses.
In this Handbook the automobile mode includes all motor vehicle traffic using a roadway, except for buses. Thus, trucks, recreational vehicles, and motorcycles are all considered part of the automobile mode. Certain vehicle types, (e.g., trucks) have different operating characteristics than private automobiles; these characteristics are taken into account by the analytical methodologies where needed. The LOS thresholds for the automobile mode are based on the perspective of the automobile drivers. Therefore, the automobile LOS measures may not necessarily reflect the perspectives of drivers of other types of motorized vehicles, particularly trucks.
Capacity analysis Although frequently considered to be the same, “highway capacity analysis” and “LOS analysis” are two distinct, although closely related, analyses. Whereas, “capacity” in general relates to the maximum number of vehicles or persons that can pass a point, LOS relates to the stratification of quality provided to travelers. For the auto mode the two concepts typically merge with LOS E also defined as capacity.
In 2008 the Transportation Research Board committee that oversees the HCM updated its capacity definition to “the maximum sustainable flow rate at which persons or vehicles reasonably can be expected to traverse a point of a uniform section of a lane or roadway during a given time period, under prevailing conditions; prevailing conditions include roadway, traffic and control conditions, but may also include weather, construction, incidents, lighting and area type”. As used in Florida, motorized vehicle capacity may be thought of as the maximum hourly volume that can be reasonably be expected to pass a point under prevailing conditions.
Frequently the question is asked about what the capacity of a roadway is. For most planning and preliminary engineering applications associated with motorized vehicles, the maximum service volumes for LOS E shown in this Handbook and accompanying software can be considered the capacity of the roadway.
QOS misconceptions Four major common misconceptions about Q/LOS analyses include the following:
• The relationship between quality and other dimensions of mobility; • LOS is applicable only to automobile analysis, while QOS is related to the
non-automobile modes; • Q/LOS analysis is sufficient to assess traffic impacts; and • LOS letter A-F grades are comparable to American school letter grades.

INTRODUCTION | 1.2 Q/LOS and Capacity Concepts
2009 FDOT QUALITY/LEVEL OF SERVICE HANDBOOK | 14
Quality is only one dimension of mobility.
The first common misconception exists on the relationship between the quality and the other dimensions of mobility. Frequently they are related, but not necessarily. For example, Q/LOS for automobile drivers is usually closely linked to how many other motorized vehicles are on the road. However, even for automobile drivers, that relationship is not perfect.
Arterial speeds are more closely tied to signalization conditions than the number of other motorized vehicles on the roadway. A higher quality LOS grade may exist on a 4-lane arterial with twice the volume of another arterial because of better signal progression. For the non-automobile modes there is usually an even smaller relationship between how many other similar modal users there are on the facility and the corresponding Q/LOS. In fact, the relationship is weak, except in limited cases. For example, for most situations in Florida, bicycle and pedestrian Q/LOS has little relationship to the number of other bicyclists and pedestrians on a facility; other factors are more important. Similarly, in most of Florida bus frequency is usually much more important to potential transit users than how many people are on the bus.
Quality is being addressed not quantity.
Again, it is important to note that quality and quantity are two distinct dimensions of mobility and may or may not be directly correlated. Frequently, especially for the non-automobile modes, an analysis addressing the quantity (demand) of potential users is more important in the decision making process than the quality of service provided to the users. However, this Handbook only addresses the Q/LOS to transportation users and not the demand aspects, including such topics as: if a bicycle lane is built, how many bicyclists will use the facility?, or how many automobile trips will be diverted to bicycling trips? Other tools, such as logit models, are more appropriate for those types of analyses.
The concepts of quality of service and level of service apply to all modes.
The second common misconception is that LOS applies only to automobiles and QOS applies to the other modes; automobile analysis is more “quantitative” while analysis of the other modes is “softer” or more “qualitative”. As described later, the bicycle, pedestrian and transit techniques are as quantitative and rigorously developed and tested as those for automobiles and trucks. The techniques developed for this Handbook assess only the quality of the actual trip itself, which transportation professionals can directly affect, and not the overall “quality of the trip experience.” The LOS for each mode for urban roadways is illustrated in Figure 1–2.

INTRODUCTION | 1.2 Q/LOS and Capacity Concepts
2009 FDOT QUALITY/LEVEL OF SERVICE HANDBOOK | 15
Figure 1–2 Examples of LOS By Mode for Urban Roadways
PedestrianAutomobile Bicycle Bus
A/B
Level ofService
2 to 4 buses/hour
< 1 bus/hour
E/F
C/D
>4 buses/hour
Q/LOS analysis is not sufficient to assess development impacts.
The third common misconception is that Q/LOS analysis is sufficient to assess impacts from proposed developments and mitigation effects. Consider the following two examples in which capacity utilization, one of the four dimensions of mobility, should also be considered: (1) LOS standards and maximum service volumes and (2) capacity at a specific signalized intersection.
Suppose a local government has a LOS standard of D for a 4-lane arterial and the corresponding maximum hourly directional volume that can be served is 1490 (the value that appears for a Class III arterial in the Generalized Tables). The roadway’s current volume is 1,400; thus, 90 vehicles could be added and remain within the standard. However, by changing two inputs not directly associated with capacity (i.e., signal type to pretimed and arrival type to 6 from the Generalized Tables default assumptions), the maximum service volume becomes 1700. Additional vehicles added by development may or may not meet community criteria based upon the inputs used in the analysis.

INTRODUCTION | 1.2 Q/LOS and Capacity Concepts
2009 FDOT QUALITY/LEVEL OF SERVICE HANDBOOK | 16
Suppose that the existing condition at a signalized intersection has a volume to capacity ratio of 0.75, but the signalization is so poor that the LOS is D. A development is proposed which would increase the volume to capacity ratio of the intersection to 0.95, but improved timing and coordination of the existing signalization system could keep the intersection operating at a LOS D. In this situation 80 percent of the remaining capacity (0.20 out of 0.25) is used by a development while adhering to a LOS D criterion. Clearly, both Q/LOS and utilization (volume to maximum service volume ratio or volume to capacity ratio) criteria are appropriate to determine development impacts.
LOS A-F should not be thought of as school grades.
A fourth common misconception about LOS letter grades A-F is that they are comparable to school grades A-F. Although there are a couple of similarities there are important differences. They are similar in the sense that A is best and F is worst; however, this is strictly from a traveler perspective. LOS A should in all probability not be considered a desirable goal to achieve from an overall transportation or societal perspective. In fact, LOS A in a peak travel hour is probably an inefficient and frequently undesirable objective to achieve. Unlike in school in which it is desired for children to receive A’s, it is not cost effective for the state’s roadways to operate at A. FDOT’s LOS standards appearing in Chapter 8 should be more thought of as “desirable” from a public point of view with significant variance from those standards, either higher or lower, as undesirable.
Another similarity is LOS F may be thought of as a “failing” condition. Essentially, LOS F either means travel demand exceeds capacity and the roadway is operating in oversaturated back-up conditions, or some other very undesirable condition(s) exists. However, from a transportation LOS point of view, the oversaturated condition may only exist for a 15-minute or hour period. That does not necessarily mean from a societal point of view such a condition is unacceptable for these relatively short time periods.
LOS across modes
LOS grades are not comparable across modes.
Although each of methodologies for automobiles/trucks, bicycles, pedestrians, and buses make use of the LOS A-F scales, the meaning of A-F is probably not consistent across the modes. Transportation professionals widely consider LOS D for the automobile mode as “acceptable,” or as a design level in urbanized areas. Committees of transportation professionals, with common understanding of the LOS grading scale, collectively developed the LOS thresholds for the automobile and bus modes. Conversely, members of the general public whose understanding of LOS D more closely correlates to the school grading system, determined the derivation of the bicycle and pedestrian LOS thresholds. Thus, LOS D does not have a common meaning across modes and probably represents a worse condition for the bicycle and pedestrian modes than the automobile and bus modes. FDOT and its research team evaluated and considered various methods to make the LOS thresholds more consistent across modes, but found no scientific basis to adjust individual mode’s LOS scales. Users should be cautious about comparing the same LOS letter grade across modes.

INTRODUCTION | 1.3 Transportation System Structure
2009 FDOT QUALITY/LEVEL OF SERVICE HANDBOOK | 17
1.3 Transportation System Structure
Users should be cautious about comparing LOS grades across modes.
FDOT’s Q/LOS techniques generally incorporate the primary highway system structure of the HCM, consisting of points, segments, sections, facilities, corridors and areas, although the HCM occasionally includes other structural units (e.g., section). A generalized characterization of the HCM structure is shown in Figure 1–3.
FIGURE 1 – 3 Generalized HCM Highway System Structure
The analysis techniques contained in this Handbook and accompanying software are focused at the HCM “facility” level. Points and segments are the primary building blocks of facilities. It is useful to use roadway sections (groups of segments having common characteristics) as the analysis unit depending on the mode or facility-type being analyzed. In fact, when analyzing impacts to specific roadways, it is commonplace to evaluate them at point and section levels. Point analyses are primarily used for capacity analyses such as analyzing signalized intersections so traffic volumes can be handled.
Depending on the mode or facility type being analyzed, it is sometimes useful to use roadway subsegments. Although future editions of this Handbook may include corridor and areawide analysis methods, they are currently beyond the scope of this Handbook. Points, segments, facilities, subsegments and sections are discussed further below.
A boundary between segments,usually a signalized intersection
A portion of roadway extending from one point to another
A length of roadway consisting of groupsof segments having common characteristics
A length of roadway consisting of points and segments
A combination of generally parallel facilities
A combination of facilities in an area
+Point
+ +Segment
+ + + +
Facility
Corridor
AreawideAnalysis
+ + + + ++ + + + ++ + + + ++ + + + + + + +
Section
+ + + + + +
+ + + + + ++ + + + +
INTRODUCTION | 1.3 Transportation System Structure
2009 FDOT QUALITY/LEVEL OF SERVICE HANDBOOK | 18
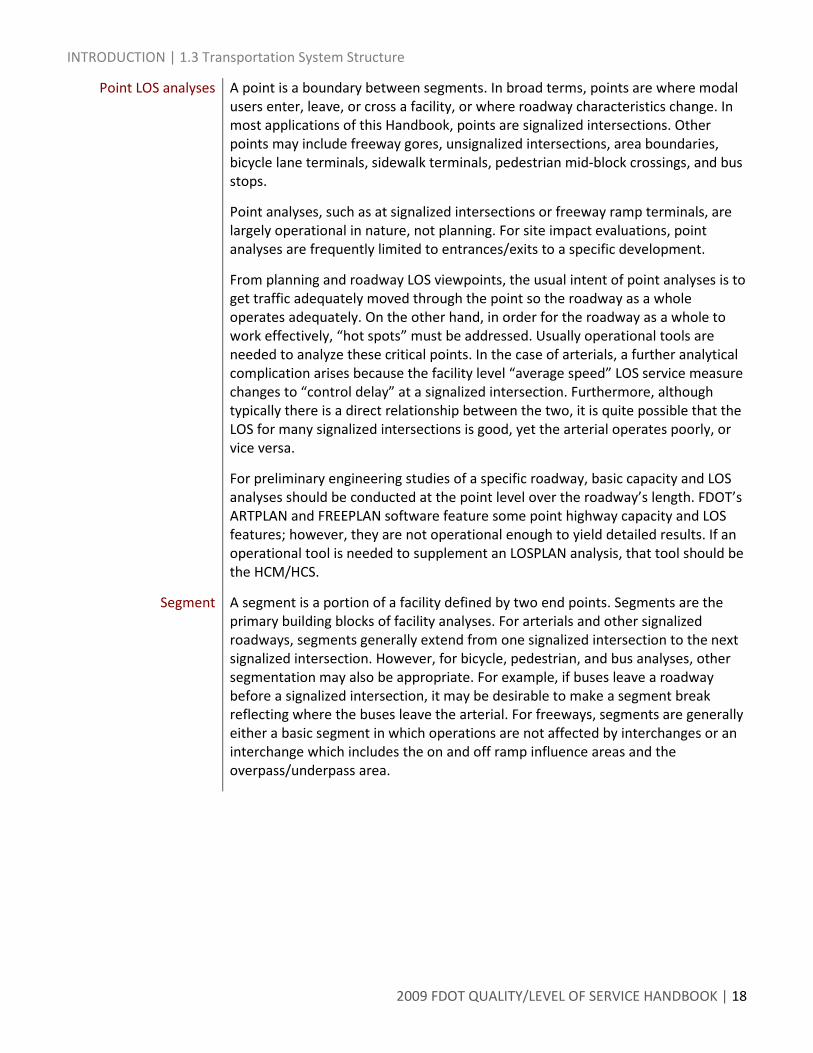
Point LOS analyses A point is a boundary between segments. In broad terms, points are where modal users enter, leave, or cross a facility, or where roadway characteristics change. In most applications of this Handbook, points are signalized intersections. Other points may include freeway gores, unsignalized intersections, area boundaries, bicycle lane terminals, sidewalk terminals, pedestrian mid-block crossings, and bus stops.
Point analyses, such as at signalized intersections or freeway ramp terminals, are largely operational in nature, not planning. For site impact evaluations, point analyses are frequently limited to entrances/exits to a specific development.
From planning and roadway LOS viewpoints, the usual intent of point analyses is to get traffic adequately moved through the point so the roadway as a whole operates adequately. On the other hand, in order for the roadway as a whole to work effectively, “hot spots” must be addressed. Usually operational tools are needed to analyze these critical points. In the case of arterials, a further analytical complication arises because the facility level “average speed” LOS service measure changes to “control delay” at a signalized intersection. Furthermore, although typically there is a direct relationship between the two, it is quite possible that the LOS for many signalized intersections is good, yet the arterial operates poorly, or vice versa.
For preliminary engineering studies of a specific roadway, basic capacity and LOS analyses should be conducted at the point level over the roadway’s length. FDOT’s ARTPLAN and FREEPLAN software feature some point highway capacity and LOS features; however, they are not operational enough to yield detailed results. If an operational tool is needed to supplement an LOSPLAN analysis, that tool should be the HCM/HCS.
Segment A segment is a portion of a facility defined by two end points. Segments are the primary building blocks of facility analyses. For arterials and other signalized roadways, segments generally extend from one signalized intersection to the next signalized intersection. However, for bicycle, pedestrian, and bus analyses, other segmentation may also be appropriate. For example, if buses leave a roadway before a signalized intersection, it may be desirable to make a segment break reflecting where the buses leave the arterial. For freeways, segments are generally either a basic segment in which operations are not affected by interchanges or an interchange which includes the on and off ramp influence areas and the overpass/underpass area.

INTRODUCTION | 1.3 Transportation System Structure
2009 FDOT QUALITY/LEVEL OF SERVICE HANDBOOK | 19
The interchange influence area segment is illustrated below:
Freeway Section Structure
Section A section is a group of consecutive segments that have similar roadway, traffic, and, as appropriate, control characteristics for a mode of travel. When determining roadway LOS and implementing FDOT’s LOS standards, most FDOT districts partition roadways at points were volume significantly change or the number of thru lanes change. For LOS analysis purposes, individual segments (point to point) are usually grouped together as long as traffic and roadway characteristics do not vary appreciably. Because of typically shorter travel distances by the bus, pedestrian, and bicycle modes on individual roadways, a section level analysis is more appropriate for those modes than a facility-level analysis.
For LOS analysis, the term “section” is used to describe or encompass the following:
• A segment or group of segments that have similar traffic and roadway characteristics, and
• “Links” as used in travel demand forecasting models.
Typical section lengths
Typical section lengths are: • Freeways : interchange to interchange • Arterials: 0.25 mi. to 2.0 mi. • Highways: highly variable in length and may include
o uninterrupted flow two-lane segments o uninterrupted flow multilane segments o isolated intersection influence areas
Off rampinfluence area1500’
On rampinfluence area
1500’
Basic Segment> 200’
Basic Segment
Overpass/underpassArea+ 2280’
Interchange Influence Area (1 mi )+
Overpass/underpassInterchangeapproacharea
Decelerationlane area
Off rampgore
Interchangedeparturearea
Accelerationlane area
On rampgore
INTRODUCTION | 1.3 Transportation System Structure
2009 FDOT QUALITY/LEVEL OF SERVICE HANDBOOK | 20
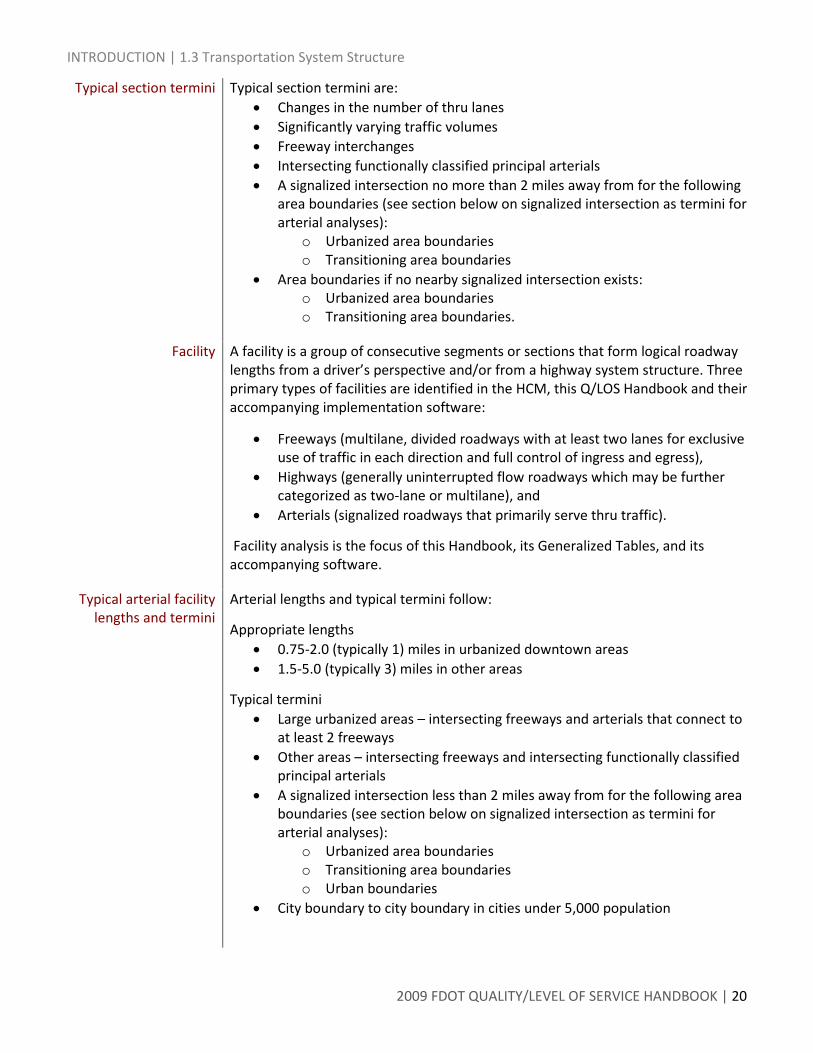
Typical section termini Typical section termini are: • Changes in the number of thru lanes • Significantly varying traffic volumes • Freeway interchanges • Intersecting functionally classified principal arterials • A signalized intersection no more than 2 miles away from for the following
area boundaries (see section below on signalized intersection as termini for arterial analyses):
o Urbanized area boundaries o Transitioning area boundaries
• Area boundaries if no nearby signalized intersection exists: o Urbanized area boundaries o Transitioning area boundaries.
Facility
A facility is a group of consecutive segments or sections that form logical roadway lengths from a driver’s perspective and/or from a highway system structure. Three primary types of facilities are identified in the HCM, this Q/LOS Handbook and their accompanying implementation software:
• Freeways (multilane, divided roadways with at least two lanes for exclusive use of traffic in each direction and full control of ingress and egress),
• Highways (generally uninterrupted flow roadways which may be further categorized as two-lane or multilane), and
• Arterials (signalized roadways that primarily serve thru traffic).
Facility analysis is the focus of this Handbook, its Generalized Tables, and its accompanying software.
Typical arterial facility lengths and termini
Arterial lengths and typical termini follow:
Appropriate lengths • 0.75-2.0 (typically 1) miles in urbanized downtown areas • 1.5-5.0 (typically 3) miles in other areas
Typical termini • Large urbanized areas – intersecting freeways and arterials that connect to
at least 2 freeways • Other areas – intersecting freeways and intersecting functionally classified
principal arterials • A signalized intersection less than 2 miles away from for the following area
boundaries (see section below on signalized intersection as termini for arterial analyses):
o Urbanized area boundaries o Transitioning area boundaries o Urban boundaries
• City boundary to city boundary in cities under 5,000 population

INTRODUCTION | 1.3 Transportation System Structure
2009 FDOT QUALITY/LEVEL OF SERVICE HANDBOOK | 21
Typical freeway facility lengths and termini
Freeway facility lengths and typical termini follow:
Appropriate lengths • 4-15 miles in urbanized and transitioning areas • 10-50 miles in rural areas
Typical termini • Intersecting Florida Intrastate Highway System (FIHS), and Strategic
Intermodal System (SIS) routes • Urbanized area boundaries • Transitioning area boundaries
Typical highway lengths and termini
Highway lengths and typical termini follow:
Lengths • At least 3 miles
Typical termini • Large urbanized areas – intersecting freeways and arterials that connect to
at least 2 freeways • Other areas – intersecting functionally classified principal arterials • Urbanized area boundaries for nearby jurisdictions • Transitioning area boundaries • Urban boundaries • City boundary to city boundary in cities under 5,000 population
Subsegment A subsegment is a further breakdown of a segment. Although segments are the primary building blocks of facility analyses, at times it is desirable to subdivide them into smaller units. For example, pedestrian conditions frequently vary between signalized intersections (e.g., discontinuous sidewalks, sidewalk proximity to roadways) and it is desirable to analyze these conditions. However, the entire roadway analysis for other modes should not be based on these special conditions.
System analyses involve a combination of facilities.
System analyses involve a combination of facilities. Corridors involve a combination of generally parallel facilities and areawide analyses involve a combination of all facilities
It’s difficult to develop an integrated structure.
Transit system structure
Bicycle & pedestrian
structure
Because the system structure is different for each mode, an integrated multimodal approach becomes more difficult. The transit system structure of the Transit Capacity and Quality of Service Manual (TCQSM) consists of transit stops, route segments, and system. The two national document system structures (HCM, TCQSM) are conceptually equivalent when comparing points and transit stops, and areawide and system. Route segments are portions of a transit route where, in general, bus service is provided at constant headways. The Bicycle and Pedestrian LOS Models are based on segments in which roadway characteristics are the same. Usually these segments are not consistent in length with either roadway “segments” or bus “segments”. After discussions with the primary authors of the operational models for each of the four modes, a consensus was reached that for multimodal analyses of highways, the system structure presented in Figure 1– 3 works best.

INTRODUCTION | 1.3 Transportation System Structure
2009 FDOT QUALITY/LEVEL OF SERVICE HANDBOOK | 22
Even within the HCM highway system structure, occasional inconsistencies can arise when determining the LOS of a roadway because of different service measures being applied. For example, if percent time spent following another vehicle is used as the service measure to evaluate the LOS on an uninterrupted flow two-lane road, with certain input assumptions such as adding a traffic signal (or even multiple signals), the reported LOS may improve. This improvement occurs because the service measure for a signalized intersection is based on control delay and the service measure for roadways with multiple signals is average travel speed. Thus, anomalies are possible when changing from one facility type to another.
Applicable to nearly all roads in Florida
The primary purpose of this Handbook is to compute the LOS for state facilities. Nevertheless, the analysis techniques contained in this Handbook are applicable to nearly all roads in Florida. The two exceptions are unsignalized local streets and unpaved roads.
1.4 Multimodal Structure
Quality of service improvements in one mode may have positive, neutral or negative effects on other modes.
The 2002 version of this Handbook received national recognition for its methodology linking and simultaneously calculating LOS for the primary highway modes: automobiles, trucks, bicycles pedestrians and buses. As quality of service of one mode improves, it may have a positive, neutral or negative effect on the other modes. For example, as running speed of automobiles increases, the LOS may improve for automobiles, but the LOS for bicyclists may decrease. Figure 1– 4 provides an overview of how the modes and their levels of service are linked in FDOT’s multimodal arterial planning software program, ARTPLAN. No changes to the 2002 multimodal process appear in this edition of the Handbook.
Figure 1–4 Relationship of Inputs to Quality of Service Measures
LOSDetermination
PedestrianAutomobile Bicycle BusSidewalk
Control Characteristics
Control Delay
Volume & Lanes
HCM LOS Criteria
Major Inputs
Service Measure
Bicycle Lane Bus Frequency
Other Traffic & Roadway Characteristics
Volume & Lanes
Arterial Running Speed
Sidewalk
FDOT LOS Criteria
FDOT LOS Criteria
TCQSM LOS Criteria
Arterial Running Time
Pedestrian LOS Score
Average Travel Speed
Bicycle LOS Score
Adjusted Bus Frequency

INTRODUCTION | 1.4 Multimodal Structure
2009 FDOT QUALITY/LEVEL OF SERVICE HANDBOOK | 23
The LOS for each mode is linked to the LOS of other modes.
As shown in Figure 1–4, the vehicular volume and number of lanes significantly affect the automobile, bicycle and pedestrian levels of service. Other roadway and traffic variables, plus control (signalization) variables, determine the automobile LOS. The motorized vehicle running speed (calculated as part of the automobile LOS) is also an important determinant of bicycle and pedestrian LOS. Together with the presence of bicycle lanes and sidewalks, motorized vehicles volume and speed are the main determinants of bicycle and pedestrian LOS. Bus LOS is primarily determined by bus frequency, but is also affected by pedestrian LOS. In summary, all the roadway modes are linked together.
FDOT does not recommend one overall roadway LOS.
Noteworthy, FDOT does not recommend combining the LOS for each of the modes into one overall LOS for a roadway for many reasons. Four major cautions about combining the LOS for each of the modes into one overall LOS grade exist.
Cautions about a combined multimodal LOS for roadways
The first concern is there is no professionally accepted or scientifically valid technique for combining the LOS for the various modes.
The second concern is the issue of applying a weight to each of the modes. Various scenarios exist of weighting the modes equally, by relative importance, policy goals or other criteria. For example, it would be inappropriate to average the LOS for bicycles and pedestrians equally with that of automobiles and trucks on freeways. However, simply weighting each of the modes by the number of users would, in most cases, result in using the LOS for the automobile.
The third issue is the functional classification/purposes of roadways. For example, pedestrian considerations should have greater importance on local streets serving schools than on highways serving freight transfer facilities.
The last major concern is that the purpose and travel patterns of each of the modes are generally distinct. Combining the LOS of each mode is like mixing “apples and oranges”.
1.5 Major Revisions to This Edition of the Handbook and Software
In general this edition of the Handbook primarily reflects an update of the 2002 edition. The Handbook and accompanying LOSPLAN software maintain their roles as the primary planning and preliminary engineering applications of the HCM and the premier tools for multimodal analyses. User input indicated a general satisfaction with the 2002 Handbook, its maximum service volume tables and the LOSPLAN software.

INTRODUCTION | 1.6 Anticipated Future Applications
2009 FDOT QUALITY/LEVEL OF SERVICE HANDBOOK | 24
General changes
Most major changes are indicative of desires to: • Address clarifications so as to achieve greater consistency across the state;
o There are two FDOT supported and statewide acceptable highway capacity and LOS analysis tools for planning and preliminary engineering: FDOT’s Generalized Tables and FDOT’s LOSPLAN software
o More guidance on section and facility lengths and typical termini o Recognition of section LOS analyses o Listing of maximum acceptable capacity volumes for facilities o Listing of minimum and maximum acceptable input values for key
variables (K, D, g/C) • Simplify site specific data gathering efforts, especially for K, D, and g/C; • Improve the user interface of the LOSPLAN software; • Provide warnings to software users when inputs or outputs are beyond
normally acceptable ranges; • Incorporate recent analytical research efforts; • Address future year analyses; and • Include updated traffic data.
Analytical improvements
Analytical improvements include: • Improved two-lane highway analyses and compatibility with the updated
chapter of the 2000 HCM; • Better accounting for the effects of passing lanes on two-lane highways; • Improved linkages between area types and saturation flow rates; • Improved analyses of the effects of turning movements on arterials; • Inclusion of the effects of arterial traffic pressure; • Greater emphasis on the effects of area type as a variable; • Updated LOS density threshold criteria for freeways reflecting the effects of
interchanges; • Incorporation of the capacity and LOS effects of freeway auxiliary lanes,
acceleration/deceleration lane extensions, ramp metering, off-ramp queuing, and oversaturation; and
• Inclusion of recent national research on freeway weaving analysis.
Generalized Tables Changes to the Generalized Tables include: • Relatively small service volume changes at most relevant service levels
(with the exception of two-lane highways as a result of issues associated with the 2000 HCM);
• Simplification of the tables; o Deletion of LOS A service volumes (such volumes are usually irrelevant) o Combining of Class III and IV arterials into one class o Treatment of non-state signalized roadways o Combining of freeway groupings into one group in urbanized areas
• Inclusion of important adjustment factors o Exclusive right turn lanes on arterials o Auxiliary lanes and ramp metering on freeways o Oversaturation effects on freeways.

INTRODUCTION | 1.6 Anticipated Future Applications
2009 FDOT QUALITY/LEVEL OF SERVICE HANDBOOK | 25
LOS rule This Handbook also contains recent changes to FDOT’s Rule Chapter 14-94 on Statewide Minimum LOS Standards.
1.6 Anticipated Future Updates of Q/LOS Handbook
2010 HCM update At both the national and state levels considerable research and project-related work is ongoing and will likely be incorporated into the next edition of this Q/LOS Handbook, preliminarily scheduled for implementation at the beginning of 2012. The HCM is scheduled for a major update and release at the end of 2010. Perhaps its biggest change will be the new integrated multimodal LOS approach for arterials and intersections. However, to users of this Q/LOS Handbook and accompanying software, the change will not be that noticeable because FDOT’s current approach and the draft national approach are so similar. Another major change to the HCM will be its inclusion of generalized service volume tables for facilities. Although appreciably different in format, it is anticipated that FDOT’s generalized service volume tables will be compatible within the ranges of the HCM tables. The HCM will also include about 10 recent national research projects and will be reformatted.
From a technical perspective, impacts from state activities are anticipated to be relatively minor. The possibility exists that growth management legislation and possible changes to FDOT’s statewide minimum LOS standards and K factor (ratio of peak hour to AADT) process could change appreciably which in turn may affect the daily generalized service tables, but not most of the analytical techniques in this Handbook.

Q/LOS EVALUATION TECHNIQUES | 2.1 Highway Capacity Manual
2009 FDOT QUALITY/LEVEL OF SERVICE HANDBOOK | 26
2 PRIMARY Q/LOS EVALUATION TECHNIQUES
2.1 Highway Capacity Manual
Clearly, the 2000 Highway Capacity Manual (HCM) [TRB, 2000] is the foremost recognized and accepted analysis tool for automobile capacity and quality/level of service analysis. FDOT’s Q/LOS Handbook and software are nationally recognized as the leading planning application of HCM for the evaluation of automobile LOS.
2.2 Bicycle LOS Model
For bicycle Q/LOS, the FDOT has concluded that the Bicycle LOS Model [Landis, 1997], is the best analytical methodology. It is technically sound, superior for Florida applications compared with other approaches including the one appearing in the HCM, and has been successfully applied to over 200,000 miles of roadways in the U.S. (including Florida) and Canada. Because it is an operational model, FDOT, in cooperation with the model developers, have made some simplifying assumptions for incorporation into this Handbook and accompanying software.
In the Bicycle LOS Model, bicycle levels of service are based on five variables with relative importance (T statistic) ordered in the following list:
• average effective width of the outside thru lane • motorized vehicle volumes • motorized vehicle speeds • heavy vehicle (truck) volumes • pavement condition
Average effective width is largely determined by the width of the outside travel lane and striping for bicyclists, but also includes other factors such as the effects of street parking and drainage grates. Each of the variables is weighted by coefficients derived by stepwise regression modeling importance. A numerical LOS score, generally ranging from 0.5 to 6.5, is determined and stratified to a LOS letter grade. Thus, unlike the determination of automobile LOS in the HCM, in which there is usually only one service measure (e.g., average travel speed), bicycle LOS is determined based on multiple factors. In the Bicycle LOS Model, bicycle levels of service are determined using the following equation and then applying the LOS thresholds (see Table 2-1) to the calculated scores.
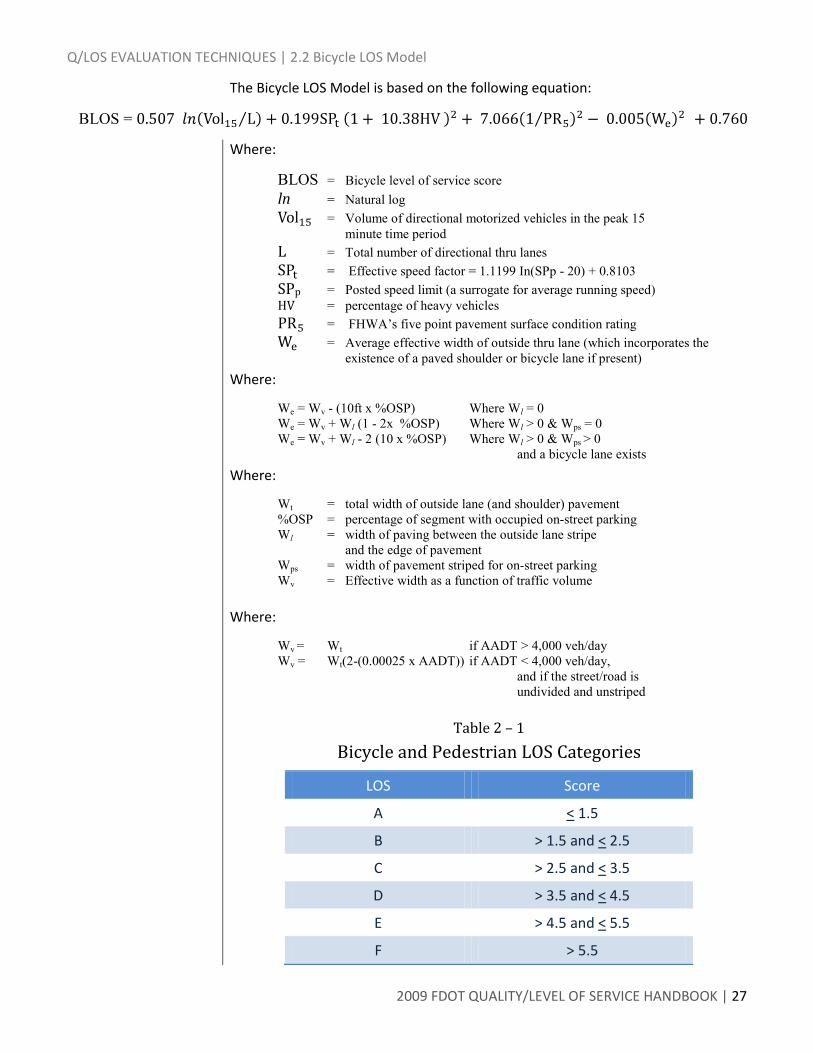
Q/LOS EVALUATION TECHNIQUES | 2.2 Bicycle LOS Model
2009 FDOT QUALITY/LEVEL OF SERVICE HANDBOOK | 27
The Bicycle LOS Model is based on the following equation:
BLOS =
Where:
BLOS = Bicycle level of service score ln = Natural log
= Volume of directional motorized vehicles in the peak 15 minute time period L = Total number of directional thru lanes
= Effective speed factor = 1.1199 In(SPp - 20) + 0.8103 SPp = Posted speed limit (a surrogate for average running speed) HV = percentage of heavy vehicles
= FHWA’s five point pavement surface condition rating = Average effective width of outside thru lane (which incorporates the
existence of a paved shoulder or bicycle lane if present) Where:
We = Wv - (10ft x %OSP) Where Wl = 0 We = Wv + Wl (1 - 2x %OSP) Where Wl > 0 & Wps = 0 We = Wv + Wl - 2 (10 x %OSP) Where Wl > 0 & Wps > 0 and a bicycle lane exists
Where:
Wt = total width of outside lane (and shoulder) pavement %OSP = percentage of segment with occupied on-street parking Wl = width of paving between the outside lane stripe and the edge of pavement Wps = width of pavement striped for on-street parking Wv = Effective width as a function of traffic volume
Where:
Wv = Wt if AADT > 4,000 veh/day Wv = Wt(2-(0.00025 x AADT)) if AADT < 4,000 veh/day, and if the street/road is undivided and unstriped
Table 2 – 1 Bicycle and Pedestrian LOS Categories
LOS Score
A < 1.5
B > 1.5 and < 2.5
C > 2.5 and < 3.5
D > 3.5 and < 4.5
E > 4.5 and < 5.5
F > 5.5
Q/LOS EVALUATION TECHNIQUES | 2.3 Pedestrian LOS Model
2009 FDOT QUALITY/LEVEL OF SERVICE HANDBOOK | 28
Many Bicycle LOS Model mathematical terms are also HCM motorized vehicle terms.
Noteworthy, many of the factors in the Bicycle LOS Model equation are also used to determine automobile LOS in the HCM methodology, and are either logarithmic or exponential functions. Logarithmic and exponential functions make the importance of the variables differ significantly depending on the precise value. For example, the bicycle LOS drops dramatically as motorized vehicle volumes initially rise, but then tends to deteriorate more slowly at higher volumes. Another example is the effect of motorized vehicle speed. At low speeds, the variable is not as significant in determining bicycle LOS; however at higher speeds it plays an ever increasing role.
Bicycle LOS Model is not applicable to off-street facilities.
Bicycle Q/LOS is based on bicyclists’ perceptions in the roadway environment, specifically on the roadway cross section. The model is not applicable to off-street facilities, such as shared use paths or sidewalks. Analysts are encouraged to use discretion when assigning a bicycle LOS to a roadway when shared use paths exist. For example, if an outstanding path with few intersection conflicts (e.g. Pinellas Trail, a facility along a causeway) exists immediately adjacent to a roadway whose on-street bicycle LOS is D, it is appropriate for the analyst to acknowledge a better quality of service for bicyclists than ARTPLAN produces.
2.3 Pedestrian LOS Model
For pedestrian Q/LOS, the FDOT has developed the Pedestrian LOS Model as the best analytical methodology [Landis, 2001]. It is technically sound, superior to the approach appearing in the HCM, and has been successfully applied to cities in Florida and the U.S. Because it is an operational model, FDOT, in cooperation with the model developers, have made some simplifying assumptions for incorporation into this Handbook and accompanying software.
In the Pedestrian LOS Model, pedestrian levels of service are based on four variables with relative importance (T statistic) ordered in the following list:
• existence of a sidewalk • lateral separation of pedestrians from motorized vehicles • motorized vehicle volumes • motorized vehicle speeds
Each of the variables is weighted by relative importance (determined by stepwise regression modeling): A numerical LOS score, generally ranging from 0.5 to 6.5, is determined along with the corresponding LOS letter grade. Thus, like the bicycle LOS approach (but unlike the automobile approach), pedestrian LOS is determined based on multiple factors.
In developing the Pedestrian LOS Model, the researchers, under contract with FDOT, conducted step-wise regression analyses using 1315 real-time observations from a research effort conducted in 2000 in Pensacola. In the Pedestrian LOS Model, pedestrian levels of service are determined using the following equation and then applying LOS thresholds (see Table 2-1) to the calculated scores.

Q/LOS EVALUATION TECHNIQUES | 2.3 Pedestrian LOS Model
2009 FDOT QUALITY/LEVEL OF SERVICE HANDBOOK | 29
The Pedestrian LOS Model is based on the following equation:
Where:
PLOS = Pedestrian level of service score = Natural log
Wol = Width of outside lane Wl = Width of shoulder or bicycle lane fp = On-street parking effect coefficient (=0.20) %OSP = Percent of segment with occupied on-street parking fb = Buffer area barrier coefficient (=5.37 for trees spaced 20 feet on center) Wb = Buffer width (distance between edge of pavement and sidewalk, feet)
fsw = Sidewalk presence coefficient (= 6 – 0.3Ws) Ws = Width of sidewalk
= Volume of motorized vehicles in the peak 15 minute period L = Total number of directional thru lanes SPD = Average running speed of motorized vehicles traffic (mi/hr)
Pedestrian LOS Model is applicable to nearby shared use paths.
Many of the terms in the Pedestrian LOS Model equation are also used to determine automobile LOS in the HCM methodology and bicycle LOS in the Bicycle LOS Model. The logarithmic and exponential functions make the importance of the variables differ significantly depending on the precise value.
Pedestrian Q/LOS is based on pedestrians’ perceptions in the roadway or nearby roadside environment – either along the roadway lanes, on a sidewalk or nearby shared use path, or on a nearby exclusive pedestrian facility. Applying the model to pedestrian facilities significantly greater than 100 feet from a roadway may exceed the validated range of the model.
2.4 Transit Capacity and Quality of Service Manual
The Transit Capacity and Quality of Service Manual (TCQSM) is the nation’s leading document for transit and quality/level of service analysis [TRB, 2003]. Part 5 of the TCQSM deals specifically with QOS and includes LOS thresholds. Transit related text in the HCM comes from applicable text in the TCQSM dealing with transit operating on roadways. As used in this Handbook, “transit” or “bus” is limited to scheduled fixed route bus transit. The TCQSM techniques, supplemented by FDOT’s Transit Level of Service (TLOS) software, should be used to evaluate bus Q/LOS at an operational level.
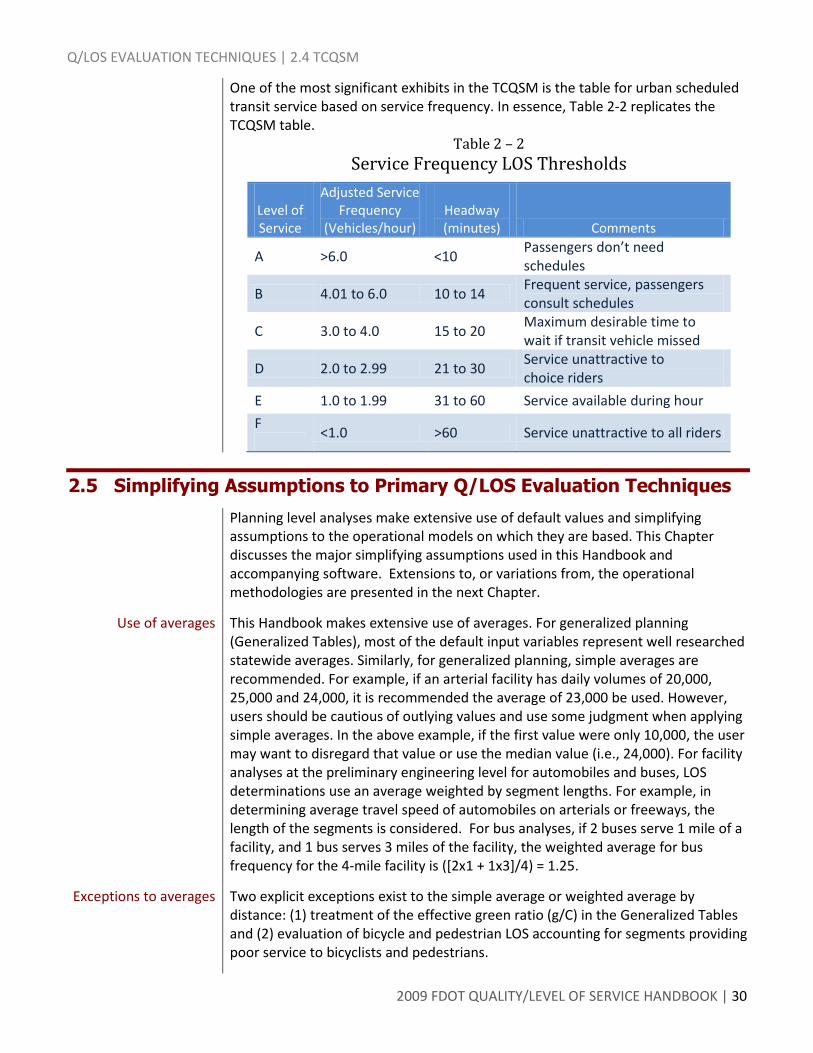
Q/LOS EVALUATION TECHNIQUES | 2.4 TCQSM
2009 FDOT QUALITY/LEVEL OF SERVICE HANDBOOK | 30
One of the most significant exhibits in the TCQSM is the table for urban scheduled transit service based on service frequency. In essence, Table 2-2 replicates the TCQSM table.
Table 2 – 2 Service Frequency LOS Thresholds
Level of Service
Adjusted Service Frequency
(Vehicles/hour)
Headway (minutes) Comments
A >6.0 <10 Passengers don’t need schedules
B 4.01 to 6.0 10 to 14 Frequent service, passengers consult schedules
C 3.0 to 4.0 15 to 20 Maximum desirable time to wait if transit vehicle missed
D 2.0 to 2.99 21 to 30 Service unattractive to choice riders
E 1.0 to 1.99 31 to 60 Service available during hour
F
<1.0 >60 Service unattractive to all riders
2.5 Simplifying Assumptions to Primary Q/LOS Evaluation Techniques
Planning level analyses make extensive use of default values and simplifying assumptions to the operational models on which they are based. This Chapter discusses the major simplifying assumptions used in this Handbook and accompanying software. Extensions to, or variations from, the operational methodologies are presented in the next Chapter.
Use of averages This Handbook makes extensive use of averages. For generalized planning (Generalized Tables), most of the default input variables represent well researched statewide averages. Similarly, for generalized planning, simple averages are recommended. For example, if an arterial facility has daily volumes of 20,000, 25,000 and 24,000, it is recommended the average of 23,000 be used. However, users should be cautious of outlying values and use some judgment when applying simple averages. In the above example, if the first value were only 10,000, the user may want to disregard that value or use the median value (i.e., 24,000). For facility analyses at the preliminary engineering level for automobiles and buses, LOS determinations use an average weighted by segment lengths. For example, in determining average travel speed of automobiles on arterials or freeways, the length of the segments is considered. For bus analyses, if 2 buses serve 1 mile of a facility, and 1 bus serves 3 miles of the facility, the weighted average for bus frequency for the 4-mile facility is ([2x1 + 1x3]/4) = 1.25.
Exceptions to averages Two explicit exceptions exist to the simple average or weighted average by distance: (1) treatment of the effective green ratio (g/C) in the Generalized Tables and (2) evaluation of bicycle and pedestrian LOS accounting for segments providing poor service to bicyclists and pedestrians.

Q/LOS EVALUATION TECHNIQUES | 2.5 Simplifying Assumptions
2009 FDOT QUALITY/LEVEL OF SERVICE HANDBOOK | 31
Weighted effective green time
For generalized planning use a weighted effective green ratio.
For conceptual planning use actual effective green ratios.
Clearly, the amount of green time that traffic movements receive at signalized intersections is one of the most significant variables in automobile Q/LOS and capacity analyses. A major simplifying assumption, essential to the development of the Generalized Tables, is the selection of a single effective green ratio (g/C) for all the intersections of the arterial. A fundamental question arises as to what green time value to assume, given that intersections frequently have widely varying green times. The average green time thru movements receive along the arterial, or the green time at the critical intersection where the greatest delay is likely to occur, or some other value could be used. FDOT has determined that for generalized planning analyses, the “weighted effective green ratio” yielded the closest results to actual conditions. The weighted effective g/C of an arterial is the average of the critical intersection thru g/C and the average of the other intersections’ thru g/Cs. Essentially, the worst intersection is given equal weight to all the other intersections combined. For preliminary engineering, there is rarely a need to use weighted effective green ratios. The weighted g/C approach is probably only needed when it is desired to develop a generalized table.
Bicycle and pedestrian LOS weighting
To determine bicycle and pedestrian LOS for a facility, FDOT used a weighted average approach in which each segment is weighted by its distance and the severity of the scores. Essentially, FDOT is taking the position that bicyclists and pedestrians do not simply evaluate a roadway by its average conditions. Rather they put extra weight on poor conditions.
Simplifying assumptions to the HCM
Emphasis on thru movement
The most significant planning assumption is that mainline non-thru movements are adequately accommodated.
Probably the most significant planning assumption is that mainline non-thru movements are adequately accommodated. As used in this Handbook, the thru movement is defined as the traffic stream with the greatest number of vehicles passing directly through a point. Typically, that movement is straight ahead, but occasionally the “thru” movement is a right or left turning movement, with the straight ahead movement being considered a non-thru movement. Most analyses of thru movements in the HCM are relatively straightforward. Complications arise with the treatment of turning/merging movements, especially for signalized intersections and arterials. By handling non-thru arterial movements (i.e., turns from the arterial, side street movements) in a general way, Q/LOS analyses are greatly simplified. Similarly, capacity calculations are also greatly simplified, primarily for arterials but also possibly for some two-lane uninterrupted flow highways in which mid-block turning movements may affect capacity. Similarly, off and on ramp movements along freeways are handled in a general way and are assumed to be adequately accommodated. Most importantly, it is assumed that off ramp movements do not back up on the thru lanes of the freeway. Regardless, where mainline non-thru movements are not adequately accommodated, the planning techniques found in this Handbook and accompanying software are not appropriate. Although the arterial analysis in this Handbook includes all vehicles on the arterial, it focuses on the thru movement. For example, only the green time for the thru movement is included and penalties are assigned if there are no left turn lanes at signalized intersections and no medians exist mid-block.
Another major assumption is that turning movements are not backing up on to thru lanes. Essentially, adequate storage is available for left turning vehicles on arterials and for vehicles exiting freeways. Both of FDOT’s preliminary engineering

Q/LOS EVALUATION TECHNIQUES | 2.5 Simplifying Assumptions
2009 FDOT QUALITY/LEVEL OF SERVICE HANDBOOK | 32
programs ARTPLAN and FREEPLAN have been enhanced to conduct elementary capacity checks to see if backups on to thru lanes are likely to occur and to give warnings to software users; however, analyses are allowed to proceed as if the backups do not occur. Regardless, where mainline non-thru movements are not adequately accommodated, the planning techniques found in this Handbook and accompanying software are not appropriate.
Capacity and free flow speed
For consistency this Handbook assumes all roadway, traffic and control variables are capacity adjustments, not free flow speed adjustments.
Free flow speed is assumed to be 5 mph over the posted speed.
For HCM analyses of uninterrupted flow facilities, capacity is set in terms of passenger cars per hour per lane. Free flow speed is estimated based on other variables such as percent heavy vehicles, driver population, median type and lateral clearance. In the HCM, those variables affect free flow speed, not capacity.
For HCM analyses of interrupted flow facilities, capacity represents the maximum number of vehicles that can pass a point during a specified time period under prevailing roadway, traffic, and control (signalization) conditions. Variables affect capacity, not free flow speed. This capacity approach also predominates in the traffic engineering literature and general understanding. Largely for consistency across both uninterrupted flow facilities and interrupted flow facilities, this Handbook and accompanying software primarily rely on and report capacity values based on the interrupted flow concept of capacity, with free flow speed being considered a roadway variable input. For planning purposes, the assumed free flow speed is 5 mph over the posted speed limit (although in the software analysts may override this planning assumption). Regardless, ARTPLAN, FREEPLAN and HIGHPLAN software all follow the HCM calculation processes.
Simplifying assumptions to the Bicycle LOS Model
To reduce the complexity of the Bicycle LOS Model, simplifying assumptions have been made in FDOT’s software (ARTPLAN) and the Generalized Tables. In the software three input variables have been simplified and include:
• Existence of paved shoulder/bicycle lane – width of these facilities are assigned default values;
• Outside lane width – the outside travel lane for motorized vehicles is categorized as wide, typical, or narrow with default values assigned; and
• Pavement condition – the surface on which bicyclists ride is categorized as desirable, typical, or undesirable with default values assigned.
These variables are discussed in detail in Chapter 3.5. For a generalized planning analysis using the Generalized Tables, the process is simplified further by only requiring the analyst to use the existence of a paved shoulder/bicycle lane and the number of motorized vehicles, which are the two most important variables in the Bicycle LOS Model.
Simplifying assumptions to the Pedestrian LOS Model
To reduce the complexity of the Pedestrian LOS Model, simplifying assumptions have been made in FDOT’s software (ARTPLAN) and the Generalized Tables. In the software four input variables have been simplified and are discussed in Chapter 3.5. These variables include:
• Sidewalk/roadway separation – the lateral distance from the sidewalk to the outside travel lane is categorized as adjacent, typical, or wide with default values assigned;

Q/LOS EVALUATION TECHNIQUES | 2.5 Simplifying Assumptions
2009 FDOT QUALITY/LEVEL OF SERVICE HANDBOOK | 33
• Existence of sidewalk/roadway protective barrier – on-street parking, trees and other such barriers are treated in a general way with a multiplicative factor applied to the sidewalk/roadway separation distance;
• Outside lane width – the outside travel lane for motorized vehicles is categorized as wide, typical, or narrow with default values assigned; and
• Existence of paved shoulder/bicycle lane – widths of these facilities are set at a default value.
For a generalized planning analysis using the Generalized Tables, the process is simplified further by only requiring the analyst to use the existence of sidewalks and the number of motorized vehicles, which are the two most important variables in the Pedestrian LOS Model.
Simplifying assumptions to the TCQSM
For transit analysis planning purposes, the most significant assumption is that bus frequency is the single most important factor in determining the Q/LOS to transit users along a transit route segment or roadway facility. FDOT, in cooperation with the TCQSM authors and others, has incorporated that concept. Certainly, LOS varies for bus riders inside a bus along a facility, but in the determination of bus LOS along a transit route segment or roadway facility, the existence or availability of buses is usually the more relevant performance measure.
2.6 Planning Extensions to Primary Q/LOS Resource Techniques
In general, the methodologies used in this Handbook are consistent with those found in the 2000 HCM), the Transit Capacity and Quality of Service Manual (TCQSM), and the Bicycle and Pedestrian LOS Models. However, three circumstances result in some deviation from those methodologies. First, all four methodologies are detailed operational models and none of those sources is complete for planning applications. Thus, FDOT needed to develop some planning applications of the methodologies. In all cases, the extensions or variations were coordinated with leaders of those source documents to be as consistent as possible with the methodologies. Second, frequently techniques in this Handbook are being developed simultaneously with, or in advance of, published updates of the operational methodologies and documents. Leaders of those sources are seriously considering incorporating FDOT’s planning applications in subsequent updates. Third, there is the need to address specific aspects not found in those source documents.
Extensions to the HCM
Freeway planning
Prior to the 2000 edition of the HCM, it did not have a chapter on freeway facilities. The current HCM chapter is a detailed operational methodology combining the analyses of basic freeway segments, weaving areas, off ramp areas and on ramp areas. The chapter neither contains any guidance or examples for planning applications, nor does it include any LOS threshold criteria. Because of these limitations, FDOT contracted with Polytechnic University to jointly develop a freeway facility planning application [Prassas, 2003].

Q/LOS EVALUATION TECHNIQUES | 2.6 Planning Extensions
2009 FDOT QUALITY/LEVEL OF SERVICE HANDBOOK | 34
Major features of FREEPLAN
Major features of FDOT’s freeway planning application and software (FREEPLAN) are:
• Use of the HCM as the primary resource document for the methodology such that the FREEPLAN methodology should “not be inconsistent” with the HCM, but, as appropriate, extend the HCM for planning and preliminary engineering purposes;
• Concentration on the thru vehicle, while being sensitive to the analysis of other vehicles on the freeway and on segments of the freeway;
• The approach is structured towards combining segments (e.g., interchange areas, toll plaza influence areas), rather than combining point analyses (e.g., ramps);
• LOS thresholds based on density; • Capacity reductions in interchange areas; • Capacity considerations associated with auxiliary lanes, ramp metering,
length of acceleration and deceleration lanes, and ramp terminals; • Use of a “local adjustment factor” or driver population factor based
primarily on area type; • Use of the most recent national research on weaving areas which will
appear in the 2010 HCM; and • Resulting volumes matching reasonably well with actual Florida traffic
counts.
Base saturation flow rates for interchange
influence areas
Within interchange influence areas, the base saturation flow rate for the two outside lanes are reduced by:
• 200 passenger cars per hour per lane for off ramp influence area; and • 100 passenger cars per hour per lane for on ramp influence area.
Although similar reductions for ramp areas appeared in drafts of the 2000 HCM, the wording was not included in the final version. FDOT has included the reductions because (1) they are logical, (2) contemporary national research by the developers [May, 2001] of the HCM freeway facility chapter indicated the 2000 HCM capacities were 4 to 10 percent too high (applying the reductions virtually eliminates that bias), and (3) applying the reductions result in an extremely good fit with actual Florida freeway volumes.
Consistency with measured freeway
volumes
With regard to actual Florida traffic volumes, these volumes seldom exceed an average of 2100 vehicles per lane per hour in urbanized areas and 1750 vehicles per hour per lane in rural areas. By applying the interchange capacity reductions, and the statewide defaults for the peak hour factor, heavy vehicle percentage, and “local adjustment factor,” the calculated volumes match very well with actual volumes.
Freeway LOS thresholds
The 2000 HCM has a service measure and LOS criteria for basic freeway segments; however, it does not contain a service measure or LOS threshold criteria for freeway facilities. For freeway facility LOS threshold criteria, FDOT uses density (pc/mi/ln), the same service measure as the HCM basic segment. Because of the effects of interchanges, FDOT lowers slightly the HCM basic segment criteria when applied to freeway facilities.

Q/LOS EVALUATION TECHNIQUES | 2.6 Planning Extensions
2009 FDOT QUALITY/LEVEL OF SERVICE HANDBOOK | 35
Freeway auxiliary lanes Auxiliary lanes are additional lanes on freeways that connect on ramps and off ramps of adjacent interchanges. For preliminary engineering analyses FREEPLAN uses the following values for the effectiveness of auxiliary lanes.
Ramp metering
Freeway ramp metering has the positive benefit of smoothing out traffic demand on to a freeway during peak travel times. This positive benefit is reflected by increasing the volumes shown on the tables by 5 percent.
Treating interchanges as segments
Freeways are considered by FDOT to have two primary segments. These primary segments are:
• A basic segment, which is the length of a freeway where operations are unaffected by interchanges;
• An interchange, which is the influence area associated with the off ramp influence area, overpass/underpass, and on ramp influence area.
With this type of system structure, freeways are primarily broken down into segments affected by interchanges and those that are not. Conceptually, and for presentations to the public, this breakdown is more feasible than the HCM structure in which the off ramp and on ramp influence areas and the overpass/underpass are treated as distinct segments. Analytically, there is no difference in these two freeway structures.
Two-lane uninterrupted flow
highway analyses
The HCM does not adequately address the effectiveness of passing lanes with regards to the length of facility being analyzed. After discussions with key members of the committee overseeing the HCM, FDOT has established their effectiveness based on the proportion of passing lane coverage.
FDOT’s procedures make use of “ percent of free flow speed” as the service measure for two-lane uninterrupted flow highways in developed areas.
The HCM does not address two-lane uninterrupted flow highways in developed areas; however, the chapter has been updated and recognizes the approach developed by FDOT and the University of Florida as viable for those areas [Washburn, 2002]. That approach makes use of the concept of maintaining a reasonable speed with the percent of free flow speed being the service measure to determine LOS.
Arterial planning The segment running time calculations in the HCM do not include traffic volume as a variable. Based on research conducted for FDOT [Prassas,1999a], changes to the HCM exhibit were approved by the national subcommittee overseeing the chapter, but unfortunately due to time considerations, were not included in the HCM. This research effort and resulting equation is included in this Handbook and accompanying software. Specifically, FDOT’s running speeds include traffic volume as a variable and better reflects thru vehicle running speeds, as opposed to the total mix of thru and turning vehicles.
Recent research in Florida indicates that an area’s population size, number of lanes, and speed limit have effects on adjusted saturation flow rates [Bonneson, 2006]. Furthermore, as traffic queues get longer “traffic pressure” affects capacity. Although not currently in the HCM, these effects are included in FDOT’s planning and preliminary engineering software program ARTPLAN.

Q/LOS EVALUATION TECHNIQUES | 2.6 Planning Extensions
2009 FDOT QUALITY/LEVEL OF SERVICE HANDBOOK | 36
LOS for other signalized roadways
The HCM LOS measure of effectiveness and thresholds for urban streets are essentially for arterials. LOS is based on their average travel speed. Generally, on major non-state roadways, motorists also evaluate quality based on average travel speed. However, most local streets are not signalized and some have only one signal for the purpose of allowing motorists access to an arterial. The HCM does not provide LOS criteria for these streets. It is generally assumed that the LOS for local unsignalized roadways is acceptable. However, for roads that have one signalized intersection, the methodology in this Handbook recommends that the HCM intersection LOS criteria (delay at the intersection) be used to set the LOS for those roadways. In using this procedure, these facilities are being evaluated by delay at the signal and not the average travel speed of the roadway. In FDOT’s Generalized Tables, these roadways are labeled “other signalized roadways”. These facilities can now be evaluated using ARTPLAN by selecting “Isolated Signal Only” under ”Type of Analysis”.
Add-on /drop-off lanes (expanded
intersections)
The HCM does not directly address the situation where lanes that carry thru traffic are added before a signalized intersection and dropped after the intersection. The add-on/drop-off lane (or expanded intersection) will contribute to intersection capacity, but probably not to the extent of a full thru lane. Guidance on this topic is provided in Chapter 3.6.
One-way streets For simplicity, the Generalized Tables have an intuitive factor that has been approved by the LOS Task Team, but not contained in the HCM, for the effects of one-way streets on motorized vehicles. Essentially, one-way pairs are assumed to have a 20 percent higher service volumes than corresponding two-way roadways with the same number of lanes.
Rural LOS criteria The LOS service thresholds found in the HCM are primarily determined by urbanized area conditions. For example, the maximum control delay at a signalized intersection for LOS D is 55 seconds. While that value may be reasonable based on user perception in an urbanized area, in a small town, or at an isolated intersection on a rural highway, that delay would surely be considered F. To overcome this difference in user perception, FDOT has adopted different control delay criteria in rural undeveloped and rural developed areas. The criteria are one-half, rounded up, of the urbanized area criteria. For arterials in rural developed areas, arterial Class I LOS thresholds apply. These revised LOS criteria are directly imbedded in FDOT’s rural undeveloped and rural developed Generalized Tables and software. The LOS criteria appear on the back of the tables.
Extensions to the Bicycle LOS Model
Facility LOS
One extension was made to the Bicycle LOS Model to meet Florida’s needs: calculation of bicycle LOS at a facility level as opposed to a segment level. The Bicycle LOS Model was developed and calibrated at a roadway segment level. From the beginning of FDOT’s planning LOS program, facilities (e.g., 4 miles of an arterial or freeway) not segments or points (e.g., signalized intersections) have been emphasized. For example, the Generalized Tables are applicable for automobile LOS at a facility level, not for a given segment or intersection/interchange along those facilities.

Q/LOS EVALUATION TECHNIQUES | 2.6 Planning Extensions
2009 FDOT QUALITY/LEVEL OF SERVICE HANDBOOK | 37
Continuity of paved shoulders/ bicycle lanes is important to bicyclists.
For consistency, a method was needed to aggregate the individual segment bicycle analyses into a facility analysis. The aggregation method is especially important when one considers the continuity of a paved shoulder/bicycle lane existence over some segments, but not over the whole facility. Portions of a facility may offer reasonably good quality of service, but other portions may be so poor that many bicyclists are discouraged from riding on the facility altogether.
Facility approach in Generalized Tables
The Generalized Tables use three broad ranges of the percent of paved shoulder/bicycle lane coverage. If a facility has less than 50% coverage, it is treated as having no paved shoulder/bicycle lane coverage. If it has from 50-84% coverage, it is actually evaluated as if it has 50% coverage. If a facility has a wide outside lane over its whole length, it may also be considered as having between 50-84% paved shoulder/bicycle lane coverage when using the Generalized Tables. If a facility has from 85-100% coverage, it is evaluated as having a paved shoulder/bicycle lane over its full length.
Facility approach at a conceptual level
At the preliminary engineering level, each segment is weighted by its distance and the severity of its bicycle LOS score to determine the facility LOS for bicyclists. Specifically, the bicycle LOS for a facility is given by the following equation:
Where:
= Bicycle level of service for the facility = Length of the first segment
= Bicycle level of service score for the first segment = Length of the last segment
= Bicycle level of service score for the last segment
The equation represents a weighting combination of distance and LOS score severity, primarily reflecting paved shoulder/bicycle lane continuity.
When generating maximum service volume tables a unique calculation process is made when bicycle lanes partially exist. The need for a unique calculation is caused by the mathematical form of the BLOS equation (i.e., the ln(Vol15/L) term) and the need to solve for motorized vehicle volumes. In the service volume calculation process the following conditions apply:
• 0-49 % bicycle lane coverage is considered to have no bicycle lane; • 50-84 % bicycle lane coverage is considered to have a wide (i.e., 14’)
outside roadway lane; and • 85-100 % bicycle lane coverage is considered to have a full bicycle lane.
For example, if 70 % of a facility contains a bicycle lane and 30 % does not, a wide outside lane for the facility is used in the calculation of maximum service volumes.

Q/LOS EVALUATION TECHNIQUES | 2.6 Planning Extensions
2009 FDOT QUALITY/LEVEL OF SERVICE HANDBOOK | 38
Number of heavy vehicles
Bicyclists are affected by the windblast effect of heavy vehicles. To bicyclists, it is primarily the number of heavy vehicles that is important, not the percentage of heavy vehicles. In developing the Bicycle LOS Model, the percent of heavy vehicles proved to be a useful factor largely because traffic and heavy vehicle volumes were in typical ranges. When traffic or heavy vehicle volumes are extremely low or high, distortions in the results from using the percent of heavy vehicles may occur. Working with the developers of the Bicycle LOS Model, FDOT developed some calculation techniques in ARTPLAN to better account for the number of heavy vehicles, as opposed to strictly the percent of heavy vehicles in these atypical ranges.
Extensions to the Pedestrian LOS Model
Facility LOS
One extension to the Pedestrian LOS Model to meet Florida’s needs was made: calculation of pedestrian LOS at facility level as opposed to a segment level. The Pedestrian LOS Model was developed and calibrated at a roadway segment level. From the beginning of FDOT’s planning LOS program, facilities (e.g., 4 miles of an arterial or freeway) not segments or points (e.g., signalized intersections) have been emphasized. For example, the Generalized Tables are applicable for automobile LOS at a facility level, not for a given segment or intersection/interchange along those facilities.
Continuity of sidewalks is important to pedestrians.
For consistency, a method was needed to aggregate the individual segment pedestrian analyses into a facility analysis. The aggregation method is especially important when the continuity of sidewalk existence over some segments, but not over the whole facility, is considered. Portions of facility may offer reasonably good quality of service, but other portions may be so poor that many pedestrians are discouraged from walking along the facility altogether.
Facility approach in Generalized Tables
The generalized level the Generalized Tables use three broad ranges of the percent of sidewalk coverage. If a facility has less than 50% coverage, it is treated as having no sidewalk coverage. If it has from 50-84% coverage, it is evaluated as if it has 50% coverage. If a facility has from 85-100% coverage, it is evaluated as having a sidewalk over its full length.
Facility approach at a preliminary
engineering level
At the preliminary engineering level, each segment is weighted by its distance and the severity of its pedestrian LOS score to determine the facility LOS for pedestrians. Specifically, the pedestrian LOS for a facility is given by the following equation:
= Where:
= Pedestrian level of service for the facility = Length of the first segment
= Pedestrian level of service score for the first segment = Length of the last segment
= Pedestrian level of service score for the last segment
The equation represents a weighting combination of distance and LOS score severity, primarily reflecting sidewalk continuity.

Q/LOS EVALUATION TECHNIQUES | 2.6 Planning Extensions
2009 FDOT QUALITY/LEVEL OF SERVICE HANDBOOK | 39
Extensions to the TCQSM
Pedestrian access to buses
Although pedestrian access to transit is recognized as important in the TCQSM, it did not provide guidance on how to incorporate pedestrian aspects. The methodology in this Handbook makes use of pedestrian considerations as the second most important determinant of bus LOS along a transit route segment or facility. The Generalized Tables use sidewalk coverage along a facility as the factor for pedestrian access to transit. At the preliminary engineering level and built into FDOT’s software (ARTPLAN), three important pedestrian considerations are included to determine an “adjusted bus frequency” and bus LOS. These considerations are: pedestrian LOS, roadway crossing difficulty, and obstacles to bus stops. Favorable pedestrian conditions have multiplicative factors greater than 1.0 and unfavorable conditions have values less than 1.0 and are applied to bus frequency to determine the “adjusted bus frequency”.
Pedestrian LOS as a factor to bus LOS
Pedestrian LOS is determined by the methodology contained in this Handbook and accompanying software (ARTPLAN). The pedestrian LOS factors as they relate to bus LOS are shown in Table 2-3.
Table 2 – 3 Pedestrian LOS Adjustment Factors on Bus LOS
Pedestrian Los Adjustment Factor
Pedestrian LOS A 1.15
Pedestrian LOS B 1.10
Pedestrian LOS C 1.05
Pedestrian LOS D 1.00
Pedestrian LOS E 0.80
Pedestrian LOS F 0.55

Q/LOS EVALUATION TECHNIQUES | 2.6 Planning Extensions
2009 FDOT QUALITY/LEVEL OF SERVICE HANDBOOK | 40
Roadway crossing difficulty as an
adjustment factor to bus LOS
When catching a bus, transit users frequently have to cross a road. Crossing difficulty is increased largely based on three broad factors: traffic signal density, crossing length, and motorized vehicle volume. It is more difficult to cross under lower signal densities than higher densities. For example, it is relatively harder to cross a Class I arterial with few signalized intersections than a Class IV arterial with closely spaced signalized intersections. Mid-block crossing difficulty increases with road width and lack of pedestrian refuges (i.e., restrictive (raised) medians). Mid-block crossing difficulty also increases as the number of motorized vehicles increase, which results in fewer gaps. These three broad factors and others, such as motorized vehicle speed, are interrelated. To account for crossing difficulty in a general way, FDOT’s preliminary engineering approach includes the factors in Table 2-4, which are applied to help determine an “adjusted bus frequency”. Relatively favorable conditions have a 1.05 factor, typical conditions a 1.0 factor, and relatively unfavorable conditions have a 0.80 factor.
Table 2 – 4 Roadway Crossing Adjustment Factors
Conditions that must be met:
Arterial Class
Median
Number of Mid-Block Thru lanes
Automobile LOS
Crossing Adjustment
Factor
I All situations 2 A or B 1.05
II All situations 2 A, B or C
III All situations <=4 A or B
IV All situations <=4 All levels of service
I None or Nonrestrictive
>=4 B, C, D, E or F 0.80
Restrictive >=8 All levels of service
II None or Nonrestrictive
>=4 C, D, E or F
Restrictive >=8 All levels of service
III None or Nonrestrictive
>=4 D, E, or F
Restrictive >=8 All levels of service
All cases not included in conditions for factor 1.05 and 0.80 =
1.00

Q/LOS EVALUATION TECHNIQUES | 2.6 Planning Extensions
2009 FDOT QUALITY/LEVEL OF SERVICE HANDBOOK | 41
Obstacles between sidewalks and bus
stops as a factor to bus LOS
In some suburban situations, obstacles exist between sidewalks and bus stops. Examples of such physical barriers are swales and fences. When such obstacles occur, FDOT’s conceptual analysis incorporates a 0.90 factor.
Bus span of service as a factor to bus LOS
The methodologies contained in this Handbook are based on hourly analyses. Frequently in planning applications, these hourly analyses are reported on a daily basis. For example, the motorized vehicle volumes appearing in the daily Generalized Tables are based on a peak hour analysis, but are converted to Annual Average Daily Traffic (AADT) for reporting purposes. When reporting bus LOS on a daily basis, FDOT’s preliminary engineering methodology incorporates the bus span of service concept found in the TCQSM. Adjustment factors were developed to address that, regardless of the bus frequency during the analysis hour, users can either benefit from extended hours, or be adversely affected if only very limited service is provided. FDOT’s factors for adjusting hourly frequency are inserted into the TCQSM’s span of service exhibit in Table 2-5.
Table 2 – 5 Bus Span Of Service Adjustment Factors
Level of Service
Hours of Service per Day
FDOT Adjustment Factor
Comments
A 19-24 1.15 Night or owl service provided
B 17-18 1.05 Late evening service provided
C 14-16 1.0 Early evening service provided
D 12-13 0.90 Daytime service provided
E 4-11 0.75 Peak hour service/limited mid-day service
F 0-3 0.55 Very limited or no service
Factors used to determine an adjusted
bus frequency
In summary, FDOT’s preliminary engineering methodology allows the adjustment of bus frequency with four factors: pedestrian LOS, pedestrian crossing difficulty, obstacles between sidewalks and bus stops, and bus span of service.
Reporting Bus LOS The TCQSM structure for Q/LOS analysis consists of points (e.g., bus stops), route segments and system. It does not include a “facility” analysis. Nevertheless, since the focus of this Handbook and accompanying software is at the facility level, a method of aggregating segment level bus frequency to a facility level is needed. FDOT recommends the following procedure. At the conceptual level, ARTPLAN shows the LOS for each roadway segment and for the facility as a whole, based on bus frequency weighted by the distance of the segment lengths. At the generalized level, a simple average, with no weighting by distance, is acceptable. For example, if on a 3-mile facility, 4 buses serve the first 2 miles and 2 buses serve the last mile, then using a value of 3 buses [(4+2)/2] is acceptable for a generalized level analysis, while a value of 3.3 buses [(4*2+2*1)/3] should be used for a preliminary engineering analysis.

INPUT VARIABLES | 3.1 Input Variable Types
2009 FDOT QUALITY/LEVEL OF SERVICE HANDBOOK | 42
3 INPUT VARIABLES
Generalized Tables frequently are not sufficient to analyze specific roadways.
Florida’s Generalized Service Volume Tables and the preliminary engineering software that produces them are based on the 2000 Highway Capacity Manual (HCM), Transit Capacity and Quality Service Manual (TCQSM), Pedestrian LOS Model, Bicycle LOS Model, and Florida roadway, traffic, and control (signalization) data. The resulting tables and programs are valid in Florida, and their use for general and conceptual planning and preliminary engineering applications is encouraged by FDOT. Recognizing varying characteristics with the state and differing roadway, traffic and control characteristics, the Generalized Tables are not adequate for all analysis needs. Therefore, to either recognize these variations or to analyze specific roadways, a description of input variables needed to use the LOS software is provided in this chapter.
Each variable is defined and discussed in this chapter. Depending upon the roadway and mode being analyzed, the variables may or may not be applicable. Input requirements needed to use the various computational tools are provided in Table.
3.1 Input Variable Types
Quality/level of service analyses are based on three types of characteristics: roadway, traffic, and control (signalization).
Roadway variables include: General roadway variables
• Roadway type • Area type • Number of thru lanes • Roadway class • Posted speed • Free flow speed • Length • Exclusive left turn lanes • Exclusive left turn lane storage
length
• Exclusive right turn lanes • Median type • Freeway segments • Auxiliary lanes • Acceleration/deceleration lanes
at least 1500 feet • Terrain • Passing lanes • Passing lane spacing • Percent no passing zones
Unique bicycle/ pedestrian/bus
roadway variables
Roadway variables specifically related to bicycle, pedestrian and bus considerations include:
• Auto outside lane width • Bicycle pavement condition • Paved shoulder/bicycle lane • Sidewalk • Sidewalk/roadway separation • Sidewalk/roadway protective barrier • Obstacle to bus stop

INPUT VARIABLES | 3.1 Input Variable Types
2009 FDOT QUALITY/LEVEL OF SERVICE HANDBOOK | 43
Table 3 – 1 Input
Requirements
LEGEND
R Required table input
S Segment/point specific
D Default cannot be altered
- Not applicable
F Facility specific
Input Variable
Generalized
Tables ART PLAN
FREE PLAN
HIGHPLAN 2-Lane Multilane
ROA
DW
AY
Roadway Type R F F F F Area Type R F F F F
Number of Thru lanes R S S F F
Roadway Class R F - - -
Posted Speed D S F F F
Free Flow Speed D S S F F Length D S S F F Exclusive left turn lanes D S - - - Exclusive left turn lane storage length
D S - - -
Exclusive right turn lanes D S - - -
Median Type D S - - F
Freeway segments D - F - -
Auxiliary lanes D - S - - Acceleration/Deceleration lanes at least 1500 feet
D - S - -
Terrain D D S F F
Passing lanes D - - F -
Passing lane spacing D - - F -
Percent no passing zones D - - F -
Auto outside Lane Width D S - - -
Bicycle Pavement Condition D S - - -
Paved shoulder/bicycle lane R S - - -
Sidewalk R S - - -
Sidewalk/roadway Separation D S - - - Sidewalk/Roadway Protective Barrier
D S - - -
Obstacle to Bus Stop D S - - -
AFF
I
Annual Average Daily Traffic (AADT)
R S S F F
TRA
FFIC
Planning Analysis Hour Factor (K) D F F F F
Directional Distribution Factor (D) D F F F F
Peak Hour Factor (PHF) D F F F F Base Saturation Flow Rate/ Base Capacity
D F F F F
Percent Heavy Vehicles D F F F F
Percent left turns D S - - -
Percent right turns D S - - -
Local Adjustment Factor D - F F F
Bus Frequency R S - - -
Bus Span of Service D S - - -
CON
TRO
L
Number of signalized intersections
R F - - -
Cycle Length (C) D S - - -
Control type D F - - -
Arrival Type D S - - -
Thru effective green ratio (g/C) D S - - - Exclusive left effective green ratio
D S - - -
Ramp metering D - S - -

INPUT VARIABLES | 3.1 Input Variable Types
2009 FDOT QUALITY/LEVEL OF SERVICE HANDBOOK | 44
Traffic variables Traffic variables include:
• Annual average daily traffic (AADT)
• Planning analysis hour factor (K)
• Directional distribution factor (D)
• Peak hour factor (PHF) • Base saturation flow rate /
base capacity
• Percent heavy vehicles • Percent left turns • Percent right turns • Local adjustment factor • Bus frequency • Bus span of service
Control (signalization) variables
Control variables include:
• Number of signalized intersections • Cycle length (C) • Control type • Arrival type • Thru effective green ratio (g/C) • Exclusive left effective green ratio • Ramp metering
3.2 Key Input Variables
Variables for which default values should
not be used in a preliminary
engineering analysis.
The effects that individual variables have on the computational process vary. Table 3-2 indicates the sensitivity of the variables on highway capacity and LOS. Variables which have a high degree of sensitivity on service volumes should not be defaulted when a preliminary engineering analysis is being conducted. The updated LOSPLAN programs highlight these variables and require analysts to provide specific values before the programs calculate capacity and LOS.
Most important arterial variables
Variable which have a significant impact on calculated volumes in a multimodal LOS analysis of an arterial are shown below. At a minimum, these variables should be evaluated and appropriate changes made for a preliminary engineering (ARTPLAN) analysis. These variables are:
• Area type • Number of thru lanes • Left turn lanes • Paved shoulder/bicycle lane • Sidewalk • Annual average daily traffic (AADT) • Planning analysis hour factor (K) • Directional distribution factor (D) • Bus frequency • Signalized intersection spacing (length divided by number of signalized
intersections) • Thru effective green ratio (g/C)

INPUT VARIABLES | 3.2 Relative Importance of Input Variables
2009 FDOT QUALITY/LEVEL OF SERVICE HANDBOOK | 45
Sensitivity of variables
Table 3 – 2 Sensitivity of Variables on Service Volumes
Roadway/Traffic/Control Variables Sensitivity on
Service Volumes
ROAD
WA
Y
Roadway Type high Area Type high
Number of Thru lanes high
Roadway Class medium
Posted Speed medium
Free Flow Speed medium Length low Exclusive left turn lanes high Exclusive left turn lane storage length medium Exclusive right turn lanes medium
Median Type low
Freeway segments low
Auxiliary lanes medium
Acceleration/Deceleration lanes at least 1500 feet low
Terrain low
Passing lanes low
Passing lane spacing low
Percent no passing zones low
Auto outside Lane Width low
Bicycle Pavement Condition low Paved shoulder/bicycle lane high
Sidewalk high
Sidewalk/roadway Separation medium
Sidewalk/Roadway Protective Barrier medium Obstacle to Bus Stop low
Annual Average Daily Traffic (AADT) high
TRAF
FIC
Planning Analysis Hour Factor (K) high
Directional Distribution Factor (D) high
Peak Hour Factor (PHF) low
Base Saturation Flow Rate/ Base Capacity medium
Percent Heavy Vehicles low
Percent left turns high
Percent right turns medium
Local Adjustment Factor medium
Bus Frequency high
Bus Span of Service low
CON
TRO
L
Number of signalized intersections high
Cycle Length (C) medium Control type low
Arrival Type medium
Thru effective green ratio (g/C) high
Exclusive left effective green ratio medium
Ramp metering low

INPUT VARIABLES | 3.2 Relative Importance of Input Variables
2009 FDOT QUALITY/LEVEL OF SERVICE HANDBOOK | 46
Most important freeway variables
The most important freeway variables are:
• Number of thru lanes • Annual average daily traffic (AADT) • Planning analysis hour factor (K) • Directional distribution factor (D)
Most important highway variables
The most important uninterrupted flow highway variables are:
• Area type • Number of thru lanes • Annual average daily traffic (AADT) • Planning analysis hour factor (K) • Directional distribution factor (D)
Consistent use of important variables
Refine all the important variables when moving from a generalized to a preliminary engineering analysis.
Be sensitive to falsely implied precision.
In general, analysts should not selectively choose from these key variables when moving from a generalized planning analysis to a preliminary engineering analysis. For example, it is usually inappropriate to use only refined K and D factors to a roadway without also addressing the other important variables. The level of precision should stay relatively constant across these variables. By applying only one or two of these variables, a level of LOS accuracy is implied, but probably not appropriate, given the lack in precision of the other variables. Furthermore, the default values in the Generalized Tables are representative of statewide averages and one or more variables can be selectively chosen to help improve a desired outcome while ignoring the other factors.
Avoid mixing evaluation techniques.
Similarly FDOT does not regard the mixing of different evaluation techniques as an acceptable practice. For example, if ARTPLAN is being used in a local government comprehensive plan, it should generally be used for all arterials and the Generalized Tables should not be used except as an initial low cost screening tool to determine if roadways may be operating at or below LOS standards.
Multimodal preliminary engineering studies, at a minimum, must use the eleven most important arterial variables listed on page 44. Typically multimodal studies will also use site specific data for many of the other traffic, roadway, and signalization variables.
3.3 Minimum/Maximum Acceptable Key Input Values (K, D, g/C)
As stated in the previous Chapter key variables have a significant impact on calculated volumes in capacity and LOS analyses along an urban. Although statewide default values may be reasonable to use for most input variables in a preliminary engineering analysis, site specific values for those key variables should be used for a specific roadway analyses.

INPUT VARIABLES | 3.3 Minimum/Maximum K,D, g/C
2009 FDOT QUALITY/LEVEL OF SERVICE HANDBOOK | 47
Frequent inappropriate key input values
Based on statewide applications of LOSPLAN, inappropriate input values appear most frequently for the following three variables:
• Planning analysis hour factor (K) • Directional distribution factor (D) • Effective green ratio (g/C)
In order to help analysts avoid input mistakes and to help reviewers of LOS analyses, the updated LOSPLAN programs now provide warnings and messages if values for these variables lie outside the normally acceptable ranges that occur using FDOT’s K100 study period analysis option.
FDOT continues to recommend the use of demand K100 and D100 values (Minimum K100 and D100 factors are not default values. They should only be used in an LOS analysis if adequate justification is provided for the specific roadway.)
Minimum acceptable K100 input values
Minimum acceptable K100 input values follow:
• Large urbanized and other urbanized areas o Freeways – 0.085 o Arterials – 0.09 o Highways – 0.09
• Transitioning and urban areas (all facility types) – 0.09 • Rural developed and rural undeveloped areas (all facility types) – 0.095
Minimum acceptable D100 input values
Minimum acceptable D100 input value:
• D100 (all area and facility types) – 0.52
Joint K100 and D100 considerations
The use of both the minimum K100 and D100 values in a single analysis is not an acceptable practice and should raise a “red flag” to reviewers about the reasonableness of a study.
Maximum acceptable thru movement g/C
input values
The maximum acceptable “facility” thru movement effective green ratios (g/C) during the peak hour typically should not exceed:
• State principal arterials o Current year – 0.50 o Long term (>= 10 years out) – 0.47
• Other roadways – 0.44
Under most circumstances arterial “facility” lengths are 1.5-5.0 miles and include principal arterials as termini. The g/C value of 0.50 approximates FDOT’s maximum allowable arterial capacity volumes of 1,000 vphpl and 950 vphpl in large urbanized areas and other urbanized areas, respectively. Thru movement g/Cs vary widely for individual intersections and different hours of the day. Therefore, ARTPLAN’s acceptable g/C range for individual intersections is 0.1 to 1.0. Along principal arterials it is not unusual for the arterial to have g/C ratios in the 0.5 to 0.7 range at many intersections. However, as the analysis length is increased from an individual intersection, to a segment, to a section, and on to a facility, the probability the arterial intersects other arterials increases.

INPUT VARIABLES | 3.4 Field Data Collection
2009 FDOT QUALITY/LEVEL OF SERVICE HANDBOOK | 48
3.4 Site Specific Field Data Collection
Traffic and signalization data collection
Use FTDOT’s traffic DVD for AADT, K, D, and g/C, but not T.
If FDOT’s preferred processes for determining AADT, K100, D100, and g/C values are followed, there will be no need for extensive field data collection for preliminary engineering capacity/LOS analyses. AADT, K100, D100 data should be obtained from FDOT’s Florida Traffic Information DVD [FDOT, 2009b]. The truck or heavy vehicle factor appearing on the traffic DVD should not be used for preliminary engineering capacity/LOS analyses; use the default values appearing on the back of the Generalized Tables (see discussion in Chapter 3.6 on percent heavy vehicles).
Arterial data collection sheet
The following “Arterial Data Collection Worksheet” (Figure 3-1) has proved helpful in FDOT sponsored LOS training courses. Analysts probably will find it useful to record collected auto and multimodal data on this sheet. Up-to-date imagery found on the internet and other sources can be sufficient for most of the data entry items. Signalization information is primarily obtained from the applicable traffic operations agency's signal timing plans. The transit agency should be considered as the primary source for transit data.
Consideration should be given to the collection of turning movement counts at key intersections which may involve a substantial data collection effort. Discussions on these traffic and control variables are presented in the next section. FDOT does not recommend the use of travel time studies for LOS planning applications.
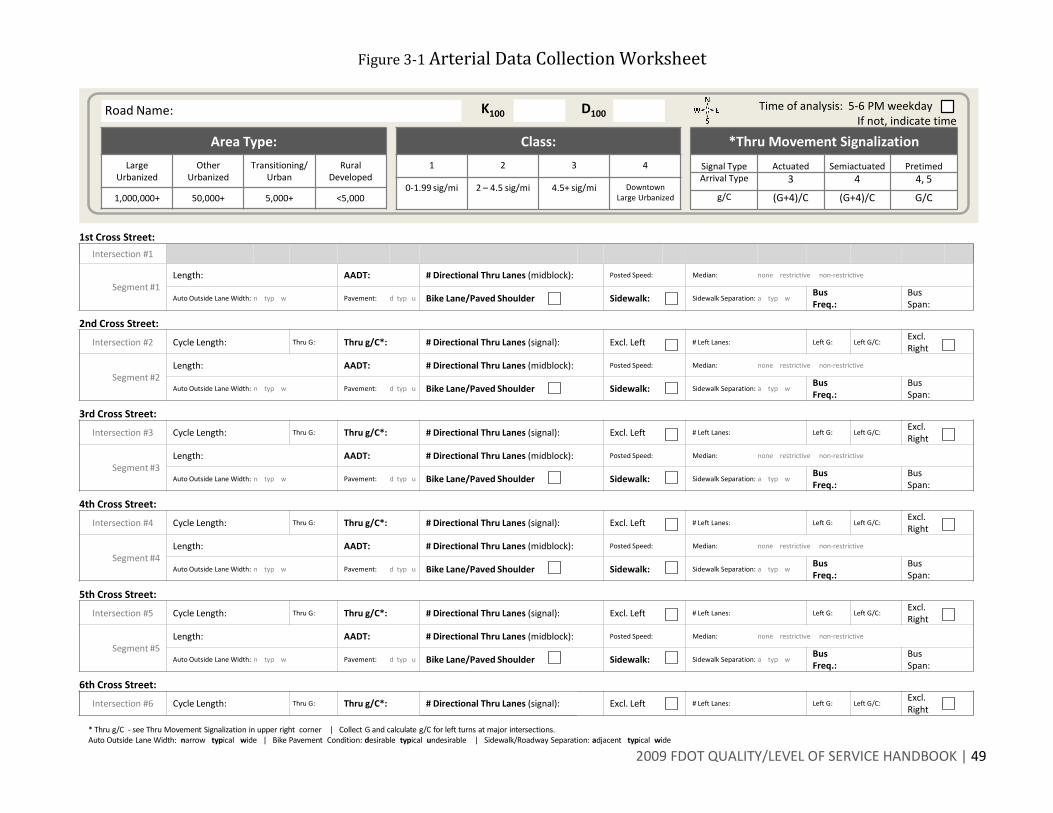
Figure 3-1 Arterial Data Collection Worksheet
2009 FDOT QUALITY/LEVEL OF SERVICE HANDBOOK | 49
1st Cross Street:
Intersection #1
Segment #1Length: AADT: # Directional Thru Lanes (midblock): Posted Speed: Median: none restrictive non-restrictive
Auto Outside Lane Width: n typ w Pavement: d typ u Bike Lane/Paved Shoulder Sidewalk: Sidewalk Separation: a typ wBus Freq.:
Bus Span:
2nd Cross Street:
Intersection #2 Cycle Length: Thru G: Thru g/C*: # Directional Thru Lanes (signal): Excl. Left # Left Lanes: Left G: Left G/C:Excl. Right
Segment #2Length: AADT: # Directional Thru Lanes (midblock): Posted Speed: Median: none restrictive non-restrictive
Auto Outside Lane Width: n typ w Pavement: d typ u Bike Lane/Paved Shoulder Sidewalk: Sidewalk Separation: a typ wBus Freq.:
Bus Span:
3rd Cross Street:
Intersection #3 Cycle Length: Thru G: Thru g/C*: # Directional Thru Lanes (signal): Excl. Left # Left Lanes: Left G: Left G/C:Excl. Right
Segment #3Length: AADT: # Directional Thru Lanes (midblock): Posted Speed: Median: none restrictive non-restrictive
Auto Outside Lane Width: n typ w Pavement: d typ u Bike Lane/Paved Shoulder Sidewalk: Sidewalk Separation: a typ wBus Freq.:
Bus Span:
4th Cross Street:
Intersection #4 Cycle Length: Thru G: Thru g/C*: # Directional Thru Lanes (signal): Excl. Left # Left Lanes: Left G: Left G/C:Excl. Right
Segment #4Length: AADT: # Directional Thru Lanes (midblock): Posted Speed: Median: none restrictive non-restrictive
Auto Outside Lane Width: n typ w Pavement: d typ u Bike Lane/Paved Shoulder Sidewalk: Sidewalk Separation: a typ wBus Freq.:
Bus Span:
5th Cross Street:
Intersection #5 Cycle Length: Thru G: Thru g/C*: # Directional Thru Lanes (signal): Excl. Left # Left Lanes: Left G: Left G/C:Excl. Right
Segment #5Length: AADT: # Directional Thru Lanes (midblock): Posted Speed: Median: none restrictive non-restrictive
Auto Outside Lane Width: n typ w Pavement: d typ u Bike Lane/Paved Shoulder Sidewalk: Sidewalk Separation: a typ wBus Freq.:
Bus Span:
6th Cross Street:
Intersection #6 Cycle Length: Thru G: Thru g/C*: # Directional Thru Lanes (signal): Excl. Left # Left Lanes: Left G: Left G/C:Excl. Right
`Area Type:
Large Urbanized
Other Urbanized
Transitioning/Urban
Rural Developed
1,000,000+ 50,000+ 5,000+ <5,000
Class:
1 2 3 4
0-1.99 sig/mi 2 – 4.5 sig/mi 4.5+ sig/mi DowntownLarge Urbanized
* Thru g/C - see Thru Movement Signalization in upper right corner | Collect G and calculate g/C for left turns at major intersections. Auto Outside Lane Width: narrow typical wide | Bike Pavement Condition: desirable typical undesirable | Sidewalk/Roadway Separation: adjacent typical wide
K100 D100Time of analysis: 5-6 PM weekday
If not, indicate time
*Thru Movement Signalization
Signal Type Actuated Semiactuated PretimedArrival Type 3 4 4, 5
g/C (G+4)/C (G+4)/C G/C
Road Name:

INPUT VARIABLES | 3.5 Roadway Variables
2009 FDOT QUALITY/LEVEL OF SERVICE HANDBOOK | 50
3.5 Roadway Variables
Roadway type
Compatible with the terminology of the Highway Capacity Manual, this Handbook and accompanying software are based on three major roadway types:
• Freeways • Uninterrupted flow highways • Interrupted flow roadways
Freeways are multilane, divided highways with at least 2 lanes for exclusive use of traffic in each direction and full control of ingress and egress.
Uninterrupted flow highways are roadways with a combination of roadway segments which have average signalized intersection spacing greater than 2.0 miles and are not freeways. Because of the significantly different operating characteristics, these types of roadways are frequently also distinguished as “two-lane highways” and “multilane highways”.
Interrupted flow roadways are characterized by signals with average signalized intersection spacing less than or equal to 2.0 miles. In this Handbook and accompanying software, “signalized arterials” are the predominant type of interrupted flow roadway. They primarily are operated by the state and serve thru traffic. Also included in this category are signalized non-state roadways, but not local streets. As used here “signalized intersections” are actually fixed causes of interruption to the traffic stream and may occasionally include stop signs or other fixed causes.
Area type
Three broad area type groupings are used in this Handbook and accompanying software:
• Urbanized areas; • Transitioning/urban areas (transitioning into urbanized/urban areas or areas
over 5,000 population not in urbanized areas); and • Rural areas (rural undeveloped areas and cities or developed areas less than
5,000 population).
Urbanized Area
Transitioning Area
Rural Area
Urban Area

INPUT VARIABLES | 3.5 Roadway Variables
2009 FDOT QUALITY/LEVEL OF SERVICE HANDBOOK | 51
The area types in the Generalized Tables and software match well with FDOT’s LOS standards; however, a few points are noteworthy. FDOT District LOS Coordinators (Chapter 9) should be consulted for applicable boundaries within their districts.
Urbanized areas
Urbanized areas are defined by the Federal Highway Administration (FHWA) approved boundary, which encompasses the entire Census Urbanized Area, as well as a surrounding geographic area as agreed upon by FDOT, FHWA and the Metropolitan Planning Organization (MPO). The minimum population for an urbanized area is 50,000.
All urbanized areas are combined in the Generalized Tables, regardless of size. However, in the software, area types are distinguished by whether an urbanized area is greater than or less than 1,000,000 population. Currently, the over 1,000,000 grouping applies to the MPO areas that include central cities: Ft. Lauderdale, Jacksonville, Miami, Orlando, St. Petersburg, Tampa, and West Palm Beach. In the software, these are referred to as “Large Urbanized.” The “Large Urbanized” category does not extend to adjacent MPO areas. The urbanized areas less than 1,000,000 population are referred to as “Other Urbanized”. Florida research has shown driver aggressiveness increases with area population. This increases the saturation flow rate, yielding higher service volumes.
Note: The LOS standards in Rule 14-94, F.A.C. use a breakpoint of 500,000 population. Thus, the LOS standards for urbanized areas between 500,000 and 1,000,000 are the same as those over 1,000,000; however, for analyses using the LOSPLAN software the “Other Urbanized” category should be used.
Transitioning areas Transitioning areas are “fringe” areas that exhibit characteristics between rural and urbanized/urban. Transitioning areas are intended to include areas that, based on their growth characteristics, are anticipated to become urbanized or urban in the next 20 years.
Frequently the “Metropolitan Planning Area” is used for the transitioning area adjacent to an “FHWA Urbanized Area” (Adjusted Census Urbanized Area Boundary) (see FDOT’s MPO Handbook coordinated by the Office of Policy Planning, 2009). The definition of Metropolitan Planning Area specifically mentions the “contiguous area expected to become urbanized with the 20-year forecast period.” It is that “contiguous area” that should be considered the “transitioning area”. However, in practice, most MPOs have not specifically delineated those “contiguous” or “transitioning” areas and many of the Metropolitan Planning Areas extend to remote rural areas of counties. In situations where the MPO does not identify these “transitioning areas”, or areas adjacent to urban (but not urbanized) areas, FDOT Districts, in cooperation with local governments, may delineate transitioning areas for LOS purposes.
There is no established statewide process for designating transitioning areas. For example, some districts may prefer having signatures of approval for the boundaries while other districts may designate the areas less formally. For understanding by all potential parties involved, keeping the boundaries relatively consistent over time is desirable. The transitioning boundary should be reviewed and adjusted as a part of the census cycle update consistent with the setting of the “FHWA Urbanized Area

INPUT VARIABLES | 3.5 Roadway Variables
2009 FDOT QUALITY/LEVEL OF SERVICE HANDBOOK | 52
boundaries”. It may also be appropriate to review the transitioning boundary in conjunction with a Long Range Transportation Plan update. Regardless, short time frame updates to respond to individual development projects or political desires should be avoided. For these reasons FDOT District LOS Coordinators should be consulted for transitioning boundaries within their districts. It is recommended thatboundaries for transitioning areas be based on the location of major roadways or at interchanges. This avoids portions of a freeway changing from transitioning to urbanized or rural between interchanges. It is desirable for an arterial to have the same designation between major roadways and not change mid-block. In cases where aligning the boundary with major roads is impractical, see the text below on treatment of small lengths of roadways.
Urban areas
An urban area is a place with a population between 5,000 and 50,000 and not within an urbanized area. Boundaries for cities over 5,000 population and not within urbanized areas are primarily set by existing city limits and must be agreed upon by FDOT, the local government, and FHWA. However, the 5,000 population threshold is primarily a surrogate for areas that exhibit urban traffic characteristics. In situations where a city has less than 5,000 population (e.g., 3,000), but the surrounding area has more than 5,000 population (e.g., 10,000), and the city has an urban character, then it is reasonable to use the over 5,000 population classification in the Generalized Tables and “urban” classification in the software.
Other situations exist where an area has over 5,000 population (e.g., 10,000) and yet, the area is more characteristic of a “rural developed area.” In this situation, it is reasonable to use the developed area less than 5,000 population sections of Generalized Tables 4-3, 4-6, and 4-9, and the “rural developed” classification in the software. In both of these situations, FDOT district planning offices, after consultation with the central office, should make a determination as to the appropriate area type designation to use.
Rural areas
Rural areas consist of two types:
• “Rural undeveloped” – areas in which there is no or minimal population or development
• “Rural developed” – areas consisting of cities and other population areas with less than 5,000 population or along coastal roadways.
Generally, the cities or developed areas portion of the Generalized Tables should be applied to areas with a population between 500 and 5,000, and not immediately adjacent to urbanized, urban or transitioning areas. This portion of the tables also should be generally applied to coastal roads not in urbanized, urban or transitioning areas.
Note: the “rural undeveloped area” in Tables 4-3, 4-6, and 4-9 corresponds to the “rural area” in the LOS standards. The “cities or developed areas less than 5,000 population” portion of Tables 4-3, 4-6, and 4-9 corresponds to different LOS standards under the “communities” category in the standards.

INPUT VARIABLES | 3.5 Roadway Variables
2009 FDOT QUALITY/LEVEL OF SERVICE HANDBOOK | 53
Treatment of small lengths of roadways
There may be small lengths of roadways (e.g., approximately 6 miles for freeways, 3 miles for non-freeways) between area types or adjacent to an area type which from a logical and analytical sense should be combined into one area type or another. These situations typically occur with adjacent interchanges or in transitioning areas, but may also occur elsewhere. FDOT districts have the flexibility to adjust the area type boundaries or designate a roadway with a certain area type under these circumstances.
Future year considerations
As Florida’s population grows, area types may change for a specific location or roadway in future years. FDOT’s district offices (Chapter 9) should be consulted if analysts believe different area types are appropriate for a future study period.
Number of thru lanes
Example of 2 thru lanes
The number of thru lanes is clearly one of the most important variables to analyze a roadway’s capacity and LOS. Emphasis is placed on “thru” lanes, lanes that directly accommodate thru traffic. The number does include shared lanes (e.g., thru/right), but does not include exclusive turn lanes or two-way left turn lanes on arterials, auxiliary lanes on freeways, or passing lanes on two-lane highways. Arterials are often described as having an odd number of lanes when two-way left turn lanes are present. However, for highway capacity and LOS analyses that is not correct. The two-way left turn lane does not accommodate thru vehicles and is more appropriately characterized as an even lane facility with a non-restrictive median.
Usually the total number of thru lanes in both directions is used to describe roadways. However, this Handbook bases analyses upon a single direction, as is a traffic engineering evaluation. As an example, a LOS analysis for a 6-lane freeway is based upon 3 lanes, using the higher directional traffic volume. Similarly, a LOS analysis for a 4-lane arterial would be based upon 2 directional lanes. When using FDOT’s software, the sum of the directional number of thru lanes should be entered to describe the roadway facility. When calculating LOS, the software will automatically take one-half of the total number of thru lanes, unless overridden by the analyst.
“Thru” lanes accommodate the greatest traffic movement.
Throughout this Handbook it is assumed that the predominant traffic movement is straight ahead. Occasionally, however, more vehicles turn in a certain direction than go straight ahead. Under those circumstances the turning lanes accommodating the predominant movement should be considered the “thru” lanes. As an example, consider this illustration. If 55 percent of the vehicles are turning left from 2 lanes, 20 percent are going straight ahead from 1 lane, and 25 percent are turning right from 1 lane, then the 2 lanes accommodating the left turning movement should be considered the thru lanes. Further discussion of special use of “thru lanes” and turning movements are covered under percent turns from exclusive turn lanes (special turning cases) in Chapter 3.5.
Arterials
An important aspect of this Handbook is the methodology for determining an arterial’s “number of thru lanes”. Since the ultimate result of the LOS analysis is a facility estimation of LOS, and it is widely recognized that signalized intersections are the arterial’s primary capacity constraint, it is appropriate to place more emphasis on the intersections’ characteristics than mid-block characteristics.
550 200 250“Thru” “Left” Right

INPUT VARIABLES | 3.5 Roadway Variables
2009 FDOT QUALITY/LEVEL OF SERVICE HANDBOOK | 54
Generally, mid-block segments have capacities far exceeding those of major intersections and it is rare for significant delays to occur mid-block. By weighting the effects of intersections more heavily, a more accurate aggregate estimation is possible.
Add-on / drop-off lanes (expanded
intersections)
Site-specific characteristics (e.g., intensity and type of land use, driver behavior, speed, etc.) can dramatically affect the viability of add-on/drop-off pairs as thru lanes; therefore, each application should be examined on a case-by-case manner. Analysts are strongly cautioned to review all pertinent characteristics prior to adjusting the number of thru lanes used. The reviews should be conducted during peak travel conditions. Analysts are encouraged to consult with FDOT District LOS Coordinators prior to application of this concept. The following guidelines are offered as a capacity estimating tool only. This process should never be used for the design or redesign of an expanded intersection.
For any capacity benefit to be considered two conditions should be met:
• both the add lane and drop lane must each be at least 800 feet in length, and
• the add-on/drop-off pair combined must be at least one-third mile (1760 feet)
If either of these conditions is not met, then no additional capacity is assumed.
A + B = Usable Length
If the add-on/drop-off pair is at least one-third mile (1760 feet – roughly divided equally between approach and departure and exclusive of tapers and cross-street width, i.e., A + B in the accompanying diagram), it may be reasonable to consider an additional one-half lane for capacity purposes. For example, in the accompanying diagram if A = 1,000’ and B = 1,000’, then it would be reasonable to consider that the intersection approach has 2.5 effective thru lanes.
With a length of at least one-half mile (roughly divided equally between add lane and drop lane) then it may be reasonable to consider the add-on/drop-off pair as adding up to one fully effective thru lane.
Generalized planning
For arterials, the number of thru lanes is calculated at intersections, not mid-block.
When using the Generalized Tables, the number of thru lanes on a facility is typically determined by the thru and shared thru/right lanes at major intersections rather than mid-block. In the illustration below, the mid-block segments have 4 lanes, with 2 lanes in each direction. The major intersections each have 6 lanes, with 2 thru and 1 shared thru/right add-on/drop-off lane with tapers adequate for safe merging. In this illustration, as in many cases, minor signalized intersections have green times so heavily weighted to the arterial that they do not cause significant
AB

INPUT VARIABLES | 3.5 Roadway Variables
2009 FDOT QUALITY/LEVEL OF SERVICE HANDBOOK | 55
delays to thru traffic. When this is the case, it is sometimes acceptable to disregard the number of lanes at these minor intersections; instead, the determination should be based on the lanes at major intersections. So in terms of LOS, this particular facility has 6 lanes.
For generalized planning this road should be considered as 6-laned due to expanded major intersections.
Preliminary engineering
Analysis of add-on/drop-off lanes
(expanded intersections)
At a preliminary engineering level it is appropriate to evaluate in more detail the effects of add-on/drop-off lanes. When lanes carry thru traffic are added before the intersection and dropped after the intersection, the add-on/drop-off lane, or expanded intersection, will contribute to intersection capacity, but probably not to the extent of a full thru lane. To accommodate this consideration ARTPLAN allows the analyst to enter a fractional number of directional lanes (e.g., 2.5) at the signalized intersection. Under this situation the number of lanes should more appropriately be considered the number of directional effective lanes.
Uninterrupted flow highways
For uninterrupted flow highway facilities, the number of lanes is the basic segment or “mid-block” laneage, Thus, for example, a two-lane highway, which is widened to 4 lanes at major intersections, should be considered a two-lane highway.
Roadway Class Roadway class is a categorization of arterials involving signalized intersection spacing, free flow speed, and location.
Arterials General characteristics of arterial classes are:
Class I – Arterials in non-rural areas with speed limits of at least 45 mph and an average signal density of less than 2 signals per mile, or arterials in rural developed areas.
Class II – Arterials with speed limits of 35 to 45 mph and an average signal density from 2 to 4.5 signals per mile.
Class III – Arterials with speed limits of 30 to 40 mph and an average signal density of at least 4.5 signals per mile.
Class IV – Arterials in the downtowns of core cities in urbanized areas at least 1,000,000.
For simplification purposes, Classes III and IV are combined in the urbanized area Generalized Tables (1, 4 and 7). For a preliminary engineering analysis the ARTPLAN software allows the distinction between Classes III and IV.
Posted speed Posted speed is the posted speed limit.

INPUT VARIABLES | 3.5 Roadway Variables
2009 FDOT QUALITY/LEVEL OF SERVICE HANDBOOK | 56
Free flow speed
Posted speed + 5 mph
Free flow speed is the average speed of vehicles not operating under the influence of speed reduction conditions. In general, free flow is the speed under low flow conditions and not influenced by control conditions, such as signalized intersections. The assumption used in this Handbook is that the free flow speed is 5 mph above the posted speed. As an example, if an arterial is posted 40 mph, the default free flow speed used in this Handbook and accompanying software is 45 mph; however, if a more accurate free flow speed is available, it should be used.
Roadway lengths
In order to properly apply the Generalized Tables or the LOSPLAN software, it is necessary to partition roadways into appropriate lengths for analysis. Setting lengths too short may not adequately capture traffic flow characteristics. Vehicles will not achieve the same average running speed on a segment as over a longer facility length. Short lengths would also be subject to bias caused by signal control delay. Furthermore, analysis results would not conform to the concept of LOS that is based on driver perception of the operation of roadways and may not show where the most significant impact of proposed development traffic will occur. Conversely, setting lengths too long may dilute the impact of “hot spots” by averaging them into other portions that operate better.
Roadway segmentation
FDOT District LOS Coordinators have primary responsibility for segmentation of the State Highway System for LOS purposes. FDOT Central Office may combine smaller segmentation lengths of a facility for statewide reporting and other purposes.
In general, the partitioning of roadways for facility analyses should be based on the following considerations, ranked in order:
• highway system structure • area type boundaries • lengths
At times, section termini may also aid in the delineation of facility termini and lengths. In all cases, the beginning and ending points for a facility analysis should coincide with the beginning and ending points of sections that make up the facility. For freeways the termini are interchanges.
Arterials For an arterial facility analysis, the general recommendation is that the facility be at least 2 miles in length in order to use the service measure of average travel speed. Major intersecting arterials frequently serve as logical breaks in segmenting the arterial facility. In downtown areas, the general recommended length is at least 1 mile.
Freeways For urbanized freeway facility analyses, the general recommendation is that the freeway facility length be between 4 and 15 miles. For rural freeway analyses, the length is expected to be considerably longer. For example, I-75 across the Everglades extends for 87 miles.

INPUT VARIABLES | 3.5 Roadway Variables
2009 FDOT QUALITY/LEVEL OF SERVICE HANDBOOK | 57
Freeway segments
Interchange influence areas
Basic segments
The planning and preliminary engineering analysis facility method makes use of two freeway segments: interchange influence areas and basic segments. As illustrated below, a typical interchange influence area is 1 mile in length and consists of an off ramp influence area 1500 feet long, an overpass/underpass area 2280 feet in length, and an on ramp influence area 1500 feet long. For most interchanges, this interchange influence area is approximately 1 mile in length centered on the midpoint of the crossing facility. The actual length of an interchange influence may vary from a typical 1-mile length, depending upon the type of interchange and ramp geometry. Parts of freeways outside these interchange influence areas are basic freeway segments. Their lengths vary significantly based on interchange locations, but should be at least 500 feet in length.
Two-lane and multilane highways
The analysis length of uninterrupted flow two-lane and multilane highways varies considerably (e.g., 2 to 60 miles), and may or may not include interrupted flow conditions (e.g., signalized intersections, stop signs). Any given uninterrupted segment should be greater than 2 miles. Segments with spacings greater than 3.5 miles between interrupted flow conditions should be considered uninterrupted. Between 2- and 3.5-mile spacings, analysts have the discretion to group the segment into an uninterrupted facility or into an interrupted facility.
Highway analysis The HCM does not contain a “facility” level analysis for generally uninterrupted flow facilities (highways). The HCM two-lane and multilane highway chapters are “segment” chapters. They deal with uninterrupted flow segments, but there is no guidance on how to combine segments, how to deal with isolated signalized intersections, or a combination of two-lane and multilane segments. FDOT is in the process of developing such LOS techniques; however, in the interim FDOT will follow the HCM and analyze such roadways on a “segment” basis.
Isolated intersections To perform a specific roadway analysis, FDOT recommends breaking the “highway” into uninterrupted and interrupted flow segments. For example (illustrated below), if a two-lane highway facility in a rural area extends 15 miles with an isolated intersection at the 10-mile point: (1) the LOS for the first 9.75 miles would be based on the two-lane highway segment LOS, (2) the 0.5 mile intersection influence area would be based on the LOS for that intersection, and (3) the last 4.75 miles would be based on the two-lane highway segment LOS.
Highway LOS Highway LOSIntersection LOS
0.25 miles 0.25 miles9.75 miles 4.75 miles

INPUT VARIABLES | 3.5 Roadway Variables
2009 FDOT QUALITY/LEVEL OF SERVICE HANDBOOK | 58
Signalized intersections as
termini for arterial analyses
When evaluating arterial section or facility LOS at a preliminary engineering level, the roadway should begin and end at a signalized intersection. The following guidance is provided for some special cases:
(1) Interchanges along an arterial – Although at a generalized planning level it is typically appropriate to make a break at an interchange (highway system structure criterion) that does not include a signalized intersection, at a conceptual planning level it is appropriate to extend the analysis to the next signalized intersection if within 2 miles of the interchange; and
(2) Boundaries, especially urbanized area boundaries – When a signalized intersection lies just outside the boundary, it is proper to extend an analysis to the next signalized intersection if within 2 miles of a boundary for a preliminary engineering analysis. For example, if a signalized intersection lies 1 mile beyond the existing urbanized boundary in a transitioning area, it is appropriate to include that signalized intersection and the 1 mile of transitioning area as part of an urbanized area analysis.
Local government segmentation of
roadways
At the local level, government agencies frequently make highway capacity and LOS termini at their own jurisdictional boundaries, regardless of the appropriate facility length and termini considerations described above. Jurisdictional boundaries by themselves are usually not appropriate termini for capacity and LOS analyses. Local governments are encouraged to consult with FDOT District LOS Coordinators for applicable segmentation within their jurisdictional boundaries.
Exclusive left turn lanes
Exclusive left turn lanes are storage areas designated to exclusively accommodate left turning vehicles. The length of these lanes must be able to accommodate turning demand such that left turn traffic (1) is able to enter the turn lanes behind thru queues, or (2) can be stored in the turn lane to ensure the thru lane traffic is not blocked. When left turn lanes are not present, a shared lane exists.
The use of Generalized Tables and ARTPLAN when analyzing arterials without left turn lanes is discouraged.
The use of the Generalized Tables and ARTPLAN when analyzing arterials without left turn lanes is discouraged in all but the most basic analyses. If used, the Generalized Tables have intuitive factors, which have been approved by the LOS Task Team but are not contained in the HCM, to adjust for the lack of left turn lanes. To account for the absence of left turns lanes, adjustment factors, found in the turn lane adjustments of the tables, must be manually applied to the service volumes contained in the table. Likewise, if an ARTPLAN analysis is performed, the resulting service volume is internally reduced by the same factor. However, the user is cautioned that research indicates that the true value of the reduction is highly dependent on the distribution of traffic volumes among all the various movements, and a constant reduction factor, as used in the tables and ARTPLAN, is not accurate.
Exclusive left turn lane storage length
The total amount of storage available for left turning vehicles, in feet. Default values are based on the FDOT design standards.
Exclusive right turn lanes
Exclusive right turn lanes are storage areas designated to exclusively accommodate right turning vehicles. The length of these lanes must be able to accommodate turning demand to allow for the free flow of the thru movement.

INPUT VARIABLES | 3.5 Roadway Variables
2009 FDOT QUALITY/LEVEL OF SERVICE HANDBOOK | 59
Median type As used in this document, medians may be classified in one of three ways:
• restrictive median (r) • non-restrictive median (nr) • no median (n)
A restrictive median is a raised or grassed area normally at least 10 feet in width separating opposing mid-block traffic lanes and includes left turn lanes.
A non-restrictive median is a painted at-grade area normally at least 10 feet in width separating opposing mid-block traffic lanes, and for arterials, accommodates mid-block left-turning vehicles to exit from thru lanes. Continuous two-way left turn lanes are considered as a non-restrictive median under this definition. Situations in which restrictive or non-restrictive medians are less than 10 feet wide are considered as having no median.
Median factor Although a median factor does not exist in the HCM, FDOT included it to account for a lowering of mid-block average travel speeds when no median is present. From the aspect of getting left-turning vehicles out of the traffic stream, the difference between a restrictive and a non-restrictive median is relatively inconsequential. Thus, in determining automobile LOS, restrictive and non-restrictive medians are treated the same.
Pedestrian crossing factor
From a pedestrian point of view, there is a significant difference between non-restrictive medians and restrictive medians. Restrictive medians give pedestrians a much safer mid-block crossing. Thus, this type of median is a consideration in determining the “pedestrian crossing” factor that enters the transit LOS analysis.
A pedestrian refuge is a raised or grassed area at least 5 feet but less than 10 feet in width (not a full raised median) separating opposing mid-block traffic lanes, and allowing pedestrians to cross the roadway more safely and comfortably. From a pedestrian point of view, a pedestrian refuge has nearly the same benefit as a restrictive median. From the aspect of pedestrian crossing difficulty, the difference between a restrictive median and pedestrian refuge is relatively small; therefore, in determining “pedestrian crossing difficulty,” the two may be treated the same. Pedestrian refuges are occasionally seen along beach roads or other roads where development is almost exclusively on one side of the road.
Because pedestrian refuges do not appear frequently in Florida, FDOT’s LOS software does not include them as a distinct category. If an analyst wants to evaluate the effects of a pedestrian refuge, it should be treated as a restricted median for transit analysis, but as no median for automobile analysis.
Freeway segments As used in this document and in FREEPLAN, freeway segments are either basic segments, interchanges, or toll plazas. For a freeway facility analysis using FREEPLAN the number of segments is an input.

INPUT VARIABLES | 3.5 Roadway Variables
2009 FDOT QUALITY/LEVEL OF SERVICE HANDBOOK | 60
Auxiliary lanes
Applications to freeways
An additional lane on a freeway connecting an on ramp of one interchange to the off ramp of the downstream interchange. Auxiliary lanes are widely considered one of the most cost effective ways to increase the capacity and LOS of a freeway. Their effectiveness is largely dependent upon their length as vehicles weave and make use of the lane between the ramps.
For preliminary engineering analyses FREEPLAN calculates the capacity increase of an auxiliary lane based on the most recent national weaving analysis research for weaving distances, usually about a mile or less. For lengths greater than weaving distances, FREEPLAN uses fixed values for the effectiveness of auxiliary lanes as shown in Table 3-3.
Table 3-3 Effectiveness of Auxiliary Lanes
Length (mi.) Capacity increase (lanes)
<1.0 ~ 0.5
>=1.0 and <2.0 ~ 0.6
>=2.0 and <3.0 0.8
>=3.0 1.0
Freeway acceleration/ deceleration lanes at least 1500 feet
As used in this Handbook and accompanying software, acceleration and deceleration lanes are considered in the capacity of a freeway. An acceleration lane extends from the on ramp gore to where its taper ends. A deceleration lane extends from the taper begins to the off ramp gore. Vehicular turbulence occurs as vehicles enter and exit freeways. On and off ramp influence areas extend 1500 feet from the interchange gores. Typically in Florida acceleration and deceleration lanes are 1000 feet and 450 feet, respectively. In FREEPLAN some additional capacity can usually be obtained by extending these types of lanes to 1500 feet.
Terrain Terrain is a general classification used for analyses in lieu of specific grades. Level terrain is a combination of horizontal and vertical alignments that permits heavy vehicles to maintain approximately the same speed as passenger cars, usually short grades of no more than 1 to 2 percent. Level terrain is assumed throughout Florida.
Auxiliary Lane

INPUT VARIABLES | 3.5 Roadway Variables
2009 FDOT QUALITY/LEVEL OF SERVICE HANDBOOK | 61
Passing lanes
Passing lanes improve the operation of two-lane highways, but do not affect their capacities.
Passing lanes generally result in higher percentages of no passing zones.
A passing lane is a short lane (approximately 1 mile) added to provide passing opportunities in one direction of travel on a two-lane highway. Continuous two-way left turn lanes are not considered passing lanes.
Passing lanes have not been shown to affect the capacity of a two-lane highway. However, the operation of two-lane highways is improved with the addition of passing lanes. In the rural undeveloped portions of the Generalized Tables, the benefit of passing lanes is handled as an adjustment to the service volumes for LOS B through D and varies by the proportion of coverage of the lanes (i.e., total length of passing lanes relative to the total length of the analysis segment). When analyzing two-lane highways in rural undeveloped areas, HIGHPLAN adjusts the percent time spent following and average travel speed by the same proportion as the proportion of passing lane coverage. For example, if there are 2 miles of passing lanes within a 10-mile segment, the percent time spent following will be decreased by 20% and the average travel speed will be increased by 20% relative to their values without any passing lanes present. When analyzing the potential of passing lanes, analysts should routinely alter the percent no passing zone value as well, because passing lanes generally result in higher percentages of no passing zones.
Passing lane spacing As used in HIGHPLAN, passing lane spacing is the distance in miles between passing lanes on two-lane highways.
Percent no passing zone
Percent no passing zone refers to the percent of a two-lane highway where passing is prohibited in the analysis direction.
Passing Lane
Lane addition taper Lane drop taper

INPUT VARIABLES | 3.5 Roadway Variables
2009 FDOT QUALITY/LEVEL OF SERVICE HANDBOOK | 62
Roadway variables specifically related to bicycle, pedestrian and bus considerations are presented below.
Bicycle pavement condition
Used only for bicycle LOS analysis
Pavement condition relates to where bicyclists, not motorized vehicles, would ride.
Pavement condition is a general classification of the roadway surface where bicycling usually occurs, and is not necessarily that which drivers of motorized vehicles experience. This variable is used only for bicycle LOS analysis. Three general classifications are used: desirable, typical and undesirable. These general classifications are used in lieu of detailed pavement surface grades found in the operational model on which this planning technique is based.
Desirable pavement condition is new or recently resurfaced pavement. The pavement still maintains a dark black color, is free of cracks, and rides smoothly.
Typical pavement condition is the most common type of pavement condition of Florida’s roadways. Generally, the pavement has a light gray color, the surface appears worn, and may have some cracks; however, the ride for the bicyclist and motorist is fairly smooth.
Undesirable pavement condition consists of pavement with noticeable cracks, broken pavement and/or ruts in it. There may be existing or partially filled potholes, or it may have drainage grates hazardous to bicycles. Alternatively, even though the roadway surface is typical or desirable, if the bicycle riding surface contains loose dirt/gravel or debris, then it would also be considered undesirable.
In general, FDOT recommends the use of a “typical” pavement condition for most analyses, especially those involving future years.
For analysts familiar with FHWA’s PAVECON factors, “desirable” would equate to a 4.5 or 5.0 rating; “typical” would equate to 3.0 to 4.0 ratings, and “undesirable” would equate to 2.5 or less. The ARTPLAN software assumes a 4.5 rating for desirable, 3.5 for typical, and 2.5 for undesirable.
Paved shoulder/ bicycle lane
As used in this Handbook, a bicycle lane is a designated or undesignated (paved shoulder) portion of a roadway for bicycles adjacent to motorized vehicle lanes. Painted lines separate paved shoulders/bicycle lanes from motorized vehicle lanes.
The dimensions indicated below are for planning analyses and not for design purposes. A designated bicycle lane is usually 4 to 5 feet in width and has a bicycle logo and a directional arrow painted on it. An undesignated bicycle lane is usually 4 feet in width and does not contain a bicycle logo. To be considered a paved shoulder/bicycle lane, at least 3 feet of paved shoulder must exist outside the painted line. For facilities with striped shoulders between 1 and 3 feet, they should be considered to have wide outside lane widths. In ARTPLAN the assumed width of paved shoulders/bicycle lanes is 5 feet.
Auto outside lane width
As used in this Handbook, outside lane width is the width, in feet, of a roadway’s outside motorized vehicle thru lane. The lane width does not include the gutter. This factor is usually important in the determination of a roadway’s bicycle LOS. The majority of the State Highway System lane widths are 12 feet. Many local roads and
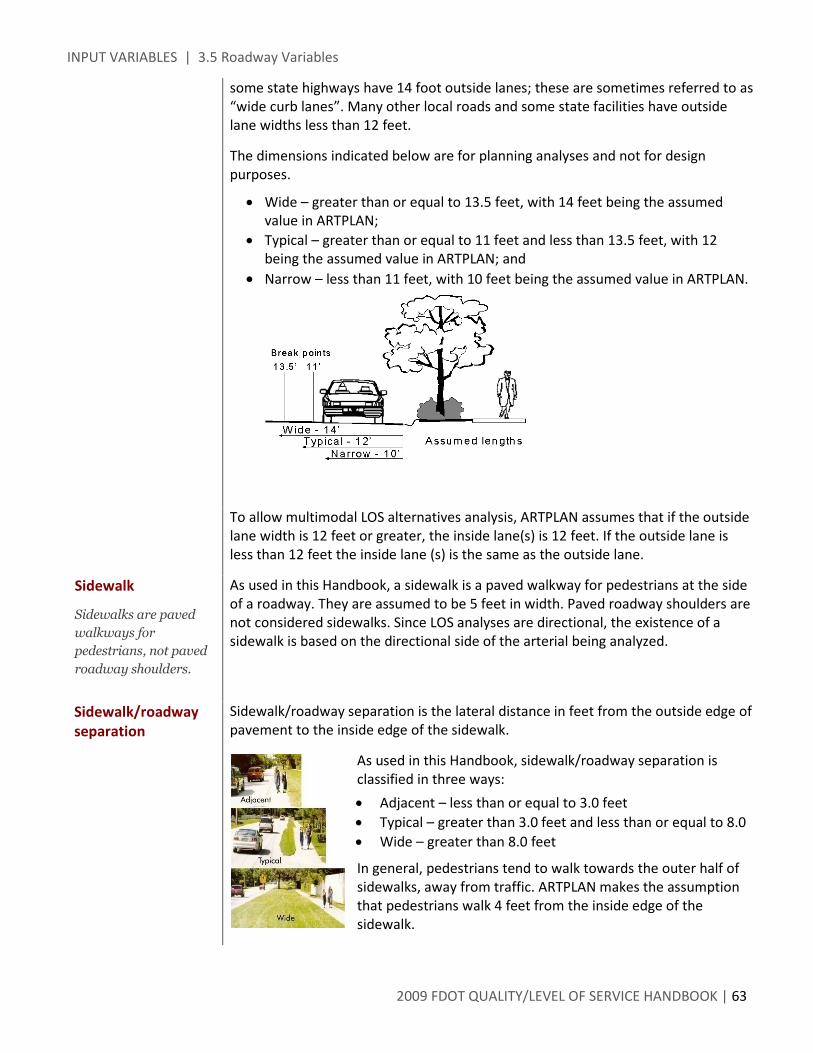
INPUT VARIABLES | 3.5 Roadway Variables
2009 FDOT QUALITY/LEVEL OF SERVICE HANDBOOK | 63
some state highways have 14 foot outside lanes; these are sometimes referred to as “wide curb lanes”. Many other local roads and some state facilities have outside lane widths less than 12 feet.
The dimensions indicated below are for planning analyses and not for design purposes.
• Wide – greater than or equal to 13.5 feet, with 14 feet being the assumed value in ARTPLAN;
• Typical – greater than or equal to 11 feet and less than 13.5 feet, with 12 being the assumed value in ARTPLAN; and
• Narrow – less than 11 feet, with 10 feet being the assumed value in ARTPLAN.
To allow multimodal LOS alternatives analysis, ARTPLAN assumes that if the outside lane width is 12 feet or greater, the inside lane(s) is 12 feet. If the outside lane is less than 12 feet the inside lane (s) is the same as the outside lane.
Sidewalk
Sidewalks are paved walkways for pedestrians, not paved roadway shoulders.
As used in this Handbook, a sidewalk is a paved walkway for pedestrians at the side of a roadway. They are assumed to be 5 feet in width. Paved roadway shoulders are not considered sidewalks. Since LOS analyses are directional, the existence of a sidewalk is based on the directional side of the arterial being analyzed.
Sidewalk/roadway separation
Sidewalk/roadway separation is the lateral distance in feet from the outside edge of pavement to the inside edge of the sidewalk.
As used in this Handbook, sidewalk/roadway separation is classified in three ways:
• Adjacent – less than or equal to 3.0 feet • Typical – greater than 3.0 feet and less than or equal to 8.0 • Wide – greater than 8.0 feet
In general, pedestrians tend to walk towards the outer half of sidewalks, away from traffic. ARTPLAN makes the assumption that pedestrians walk 4 feet from the inside edge of the sidewalk.

INPUT VARIABLES | 3.5 Roadway Variables
2009 FDOT QUALITY/LEVEL OF SERVICE HANDBOOK | 64
Pedestrian/roadway separation distances
Based on the above sidewalk/roadway separation ranges, the assumed ARTPLAN separation distances for pedestrians walking on sidewalks (pedestrian/sidewalk/roadway separation) are:
Pedestrian/Sidewalk/Roadway Separation Distances
Sidewalk/Roadway Separation Classification
6 feet Adjacent
10 feet Typical
15 feet Wide
Frequently, in downtown situations, sidewalks extend at least 8 feet from the curb. In situations where there are no tree plantings or other sidewalk/roadway protective barrier, these sidewalks should be classified as “adjacent’. In situations where there are tree plantings, or some other barrier between where people walk and the outside edge of the travel lane, these sidewalks should be considered as having “typical” separation.
In situations where on-street parking and sidewalks both exist, the sidewalk/roadway separation should be considered “wide,” regardless of how close the sidewalk is to the edge of pavement. Essentially, on-street parking adds approximately 8 additional feet between pedestrians and motorized vehicles.
Sidewalk/roadway protective barrier
In many urban situations, there are physical barriers separating motorized vehicles and pedestrians. Primary examples include planted trees and on-street parking. In the Pedestrian LOS Model, from which this planning application is based, each of these barriers has a separate impact on pedestrian LOS; however, as used in this Handbook, these barriers are consolidated into one overall protective barrier factor. In ARTPLAN, the analyst simply states whether the barrier exists or not. ARTPLAN assumes that these barriers have the equivalent of a 1.5-fold impact on sidewalk/roadway separation. For example, if a row of trees exists along a roadway in which the sidewalk/roadway separation is typical (sidewalk distance from the outside edge of pavement is 6 feet), then the effect of the trees is the equivalent separation distance of 9 feet from the edge of the outside lane.
Obstacle to bus stop
An obstacle to bus stop refers to a situation where there is a physical barrier such as a swale, fence or guard rail between the sidewalk and the bus stop (i.e., boarding area). This is a factor related to transit LOS, not pedestrian LOS. The presence of a sidewalk and pedestrian LOS does not indicate the existence of a physical obstacle between a bus stop and a sidewalk. The explicit inclusion of this obstacle to the bus stop addresses directly the ease of pedestrian access to transit. If an obstacle exists, a multiplicative factor of 0.90 is applied in FDOT’s ARTPLAN program.

INPUT VARIABLES | 3.6 Traffic Variables
2009 FDOT QUALITY/LEVEL OF SERVICE HANDBOOK | 65
3.6 Traffic Variables
Traffic volume data
Traffic volume is the most basic of all traffic parameters and is generally defined as the number of vehicles passing a point on a highway during a specified time period. Traffic volumes typically are developed separately from capacity/LOS analyses and provide input to those analyses. Various sources include:
• FDOT’s Florida Traffic Information DVD [FDOT, 2009b] • FDOT’s Project Traffic Forecasting Handbook [FDOT, 2008] • Extrapolation of historical growth trends • FDOT’s travel demand forecasting models • ITE’s Trip Generation Handbook [ITE, 2008]
Traffic demand volumes
Volume is the parameter most often used to quantify traffic demand. Traffic demand is the number of vehicles that desire to traverse a particular highway during a specified time period. While traffic demand expresses a desire, volume typically represents actual measurement.
Misuse of measured volumes often occurs in capacity/LOS analyses. Traffic studies result in the observation and measurement of conditions as they presently exist. Current observations do not reflect constraints in the existing highway system that may prevent vehicles from accessing a desired segment of the system at any given point in time. Observed volumes on congested facilities are more a reflection of capacity constraints than of true demand.
Demand versus measured volumes
Traffic volume cannot theoretically exceed roadway capacity, but traffic demand can. An example of a common misinterpretation of these two distinct terms typically occurs while collecting traffic data at an oversaturated intersection. The traffic volume that can physically be processed through a traffic signal is a measure of the capacity (or supply). When traffic volumes approach roadway capacity, the transportation system may experience abnormally long vehicle queues and excess vehicular delay. The length of the vehicle queue upstream of a traffic signal is a more accurate measure of the traffic demand that cannot be processed in the one-hour analysis period.
The impact of bottlenecks, alternative routes, latent demand, and future growth further complicate the relationship between measured traffic volume and traffic demand. If questions arise as to the appropriateness of using “measured volumes” or “demand volumes” for capacity and LOS analyses, it is clear “demand volumes” should be used.
Annual Average Daily Traffic (AADT)
Annual average daily traffic (AADT) is the total volume on a highway segment/section for one year divided by the number of days in the year. Most planning and preliminary engineering applications begin with AADT volumes. Determining AADT values is a separate process and distinct from capacity/LOS analyses. FDOT routinely provides AADT values for state roads.

INPUT VARIABLES | 3.6 Traffic Variables
2009 FDOT QUALITY/LEVEL OF SERVICE HANDBOOK | 66
AADT relationship to average daily traffic
(ADT)
AADT values are easy to confuse with two other traffic count numbers that are used to estimate AADT. The average daily traffic (ADT) is the total traffic volume during a given time period, more than a day and less than a year, divided by the number of days in that time period. ADT is generated from a short-term traffic count and can be used to estimate AADT. Ensuring that ADT counts are reflective of the normal average traffic is an important consideration when using them to estimate the annual traffic (AADT) on the roadways. Traffic taken during a 4-day holiday, long weekend, or Saturday night when 50,000 to 70,000 football fans gather is not a normal occurrence.
Peak Season Weekday Average Daily Traffic
(PSWADT)
Peak Season Weekday Average Daily Traffic (PSWADT) numbers are normally generated by travel demand forecasting planning models, such as FSUTMS. Like ADT, they can be converted to AADT by an adjustment factor.
FDOT monitoring programs
FDOT operates two types of traffic monitoring programs: (1) continuous monitoring at selected locations using permanently installed equipment, and (2) coverage counts at many temporary sites using portable equipment. Permanent counters that continuously monitor traffic are referred to as telemetry traffic monitoring sites (TTMS), and are sometimes called permanent traffic recorders (PTR). They are permanently placed at specific locations throughout the state to record the distribution and variation of traffic flow by hour of the day, day of the week, and month of the year, from year to year. Coverage counters at temporary sites are called portable traffic monitoring site (PTMS) counters. Short-term traffic surveys, usually 24-48 hours in duration, are collected using portable equipment at 5,000 – 6,000 locations, from one to four times a year. These PTMS surveys are used to provide the volume estimates for each segment of highway on the State Highway System.
Traffic adjustment factors
Axle corrections and seasonal adjustment
Two count adjustment factors are used to calculate AADT. The first, axle correction factors, are used to compensate for an axle counter’s tendency to count more vehicles than are actually present. An axle counter, for example, would show a count of two when a 4-axle truck runs over the sensor, even though only one vehicle is present. The second, seasonal adjustment factors, have been developed to adjust for the variation in traffic over the course of a year. The peak season is the 13 consecutive weeks with the highest volumes. The weekly seasonal factors for those weeks will be the lowest and the factors will be the highest for the weeks with the lowest volumes. The seasonal factor is used as follows: AADT = short-term traffic count seasonal factor.
Peak hour directional volumes
Other tables are based upon the hourly directional tables.
Although for planning and preliminary engineering purposes AADT is usually used, actual capacity and LOS analyses are conducted on an hourly or subhourly directional basis. For example, all FDOT’s Generalized Tables are based on peak hour (100th highest) directional roadway, traffic, and control characteristics. FDOT’s “daily” tables are probably the most widely used in the U.S. Nevertheless, it should be recognized that they are based on hourly directional analyses. FDOT’s hourly directional tables may be viewed as the most fundamental of the tables because the daily tables are created by dividing the peak hour directional values by the directional distribution factor (D) and the planning analysis hour factor (K). Although determination of AADTs is outside the capacity/LOS analyses, determination of K

INPUT VARIABLES | 3.6 Traffic Variables
2009 FDOT QUALITY/LEVEL OF SERVICE HANDBOOK | 67
and D is a fundamental part of capacity/LOS analyses in planning and preliminary engineering stages because of the need to convert AADT to peak hour directional volumes.
Planning analysis hour factor (K)
The Planning Analysis Hour Factor, or K Factor, is the ratio of the traffic volume in the study hour to the annual average daily traffic (AADT). There are numerous potential study hours and K factors depending upon the applications. Frequently used K factors include the 30th highest volume hour of the year (K30), 100th highest volume hour of the year (K100), highest hourly volume to daily volume (Kp/d), 5-6 p.m. weekday volume to AADT (K5-6pm), average p.m. weekday peak volume to AADT (Kpm), average a.m. peak weekday volume to AADT (Kam), and noon weekday volume to AADT (Knoon). In general, K factors are used for peak hour traffic analyses, but analyses can also be based on low volume conditions, such as the analysis of truck travel in early morning hours. Roadway, traffic and control conditions vary considerably during the day, potentially affecting capacity values and service volume thresholds. A few of the most commonly used K factors are briefly discussed below.
K100 is Florida’s primary planning analysis hour factor.
For planning purposes, the primary planning analysis hour factor used in Florida is the K100, which is the ratio of the 100th highest traffic volume hour of the year to the AADT. The 100th highest traffic hour of the year is used in FDOT’s LOS rule (see Chapter 8) and is the hour that the daily Generalized Tables are based. Unless otherwise noted, all references in this Handbook and accompanying LOSPLAN software to an hour or K factor are the 100th highest hour or K100. The software, however, does allow the selection of a different time period by choosing the Kother option or to enter the directional hourly demand volume directly. If the directional hourly demand volume option is selected the software will do an initial check to ensure the demand volume is reasonable for a K100 situation. The software is fully valid if either of these options is selected.
In developed areas, the 100th highest volume hour of the year is representative of a typical weekday peak traffic hour during the peak travel season. In Florida’s developed areas, the peak hour usually occurs in the late afternoon for most state roads. Thus, in developed areas of the state, the 100th highest hour of the year is representative of the typical “rush” hour during the peak traffic season.
The K100 factor is used to convert a peak hour volume to an AADT and vice-versa. The K100 factors used in the Generalized Tables (see Table 3-4) were obtained from unconstrained, continuous count stations throughout the state. Actual 100th highest hourly volumes and AADTs were used to determine the K100s.
Table 3 – 4 Statewide Average K100s
Urbanized
Transitioning/ Urban
Rural Developed
Rural Undeveloped
Freeways 9.2% 9.4% 10.3% 10.3%
Highways 9.4% 9.7% 9.7% 9.8%
Arterials 9.7% 9.7% 9.7% N.A.
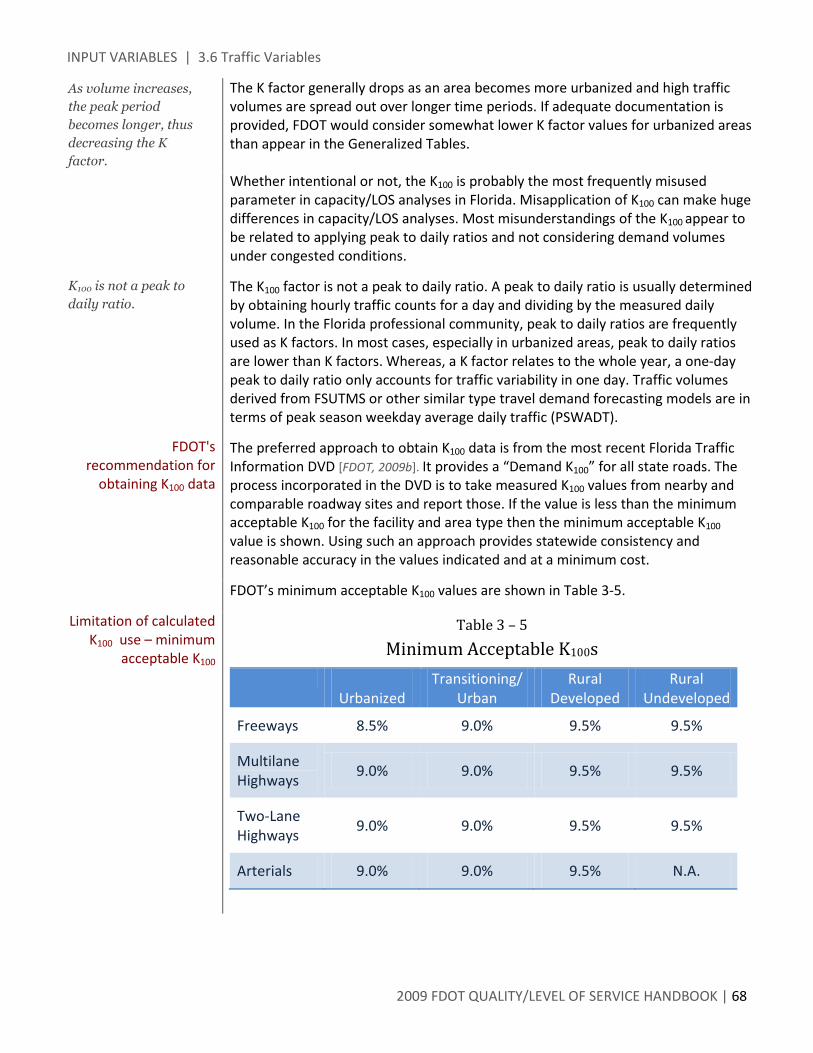
INPUT VARIABLES | 3.6 Traffic Variables
2009 FDOT QUALITY/LEVEL OF SERVICE HANDBOOK | 68
As volume increases, the peak period becomes longer, thus decreasing the K factor.
The K factor generally drops as an area becomes more urbanized and high traffic volumes are spread out over longer time periods. If adequate documentation is provided, FDOT would consider somewhat lower K factor values for urbanized areas than appear in the Generalized Tables.
K100 is not a peak to daily ratio.
FDOT's recommendation for
obtaining K100 data
Whether intentional or not, the K100 is probably the most frequently misused parameter in capacity/LOS analyses in Florida. Misapplication of K100 can make huge differences in capacity/LOS analyses. Most misunderstandings of the K100 appear to be related to applying peak to daily ratios and not considering demand volumes under congested conditions.
The K100 factor is not a peak to daily ratio. A peak to daily ratio is usually determined by obtaining hourly traffic counts for a day and dividing by the measured daily volume. In the Florida professional community, peak to daily ratios are frequently used as K factors. In most cases, especially in urbanized areas, peak to daily ratios are lower than K factors. Whereas, a K factor relates to the whole year, a one-day peak to daily ratio only accounts for traffic variability in one day. Traffic volumes derived from FSUTMS or other similar type travel demand forecasting models are in terms of peak season weekday average daily traffic (PSWADT).
The preferred approach to obtain K100 data is from the most recent Florida Traffic Information DVD [FDOT, 2009b]. It provides a “Demand K100” for all state roads. The process incorporated in the DVD is to take measured K100 values from nearby and comparable roadway sites and report those. If the value is less than the minimum acceptable K100 for the facility and area type then the minimum acceptable K100 value is shown. Using such an approach provides statewide consistency and reasonable accuracy in the values indicated and at a minimum cost.
FDOT’s minimum acceptable K100 values are shown in Table 3-5.
Limitation of calculated K100 use – minimum
acceptable K100
Table 3 – 5 Minimum Acceptable K100s
Urbanized
Transitioning/ Urban
Rural Developed
Rural Undeveloped
Freeways 8.5% 9.0% 9.5% 9.5%
Multilane Highways
9.0% 9.0% 9.5% 9.5%
Two-Lane Highways
9.0% 9.0% 9.5% 9.5%
Arterials 9.0% 9.0% 9.5% N.A.

INPUT VARIABLES | 3.6 Traffic Variables
2009 FDOT QUALITY/LEVEL OF SERVICE HANDBOOK | 69
K30 is frequently used in design.
K5-6PM is frequently used in reporting mobility.
K30 is used by FDOT for design purposes. It is the proportion of the AADT occurring during the 30th highest hour of the design year and is commonly known as the Design Hour Factor.
The greatest amount of total highway (automobile, bicycle, bus, and pedestrian) trips occur between 5 and 6 p.m. While that hour is not necessarily the highest hour for each of those modes, collectively it is the highest. K5-6pm for weekdays is useful to assess the state’s travel and capacity under peak conditions. FDOT’s statewide reporting of mobility performance measures to the Legislature and others is based on that time period.
Directional distribution factor (D)
The D, or Directional Distribution Factor, is used to convert AADT to directional peak traffic. The peak hour D factor is the proportion of an hour’s total volume occurring in the higher volume direction.
FDOT's recommendation for
obtaining D100 data
The preferred approach to obtain D100 data is from the Florida Traffic Information DVD [FDOT, 2009b]. It provides a “Demand D100” for all state roads. The process incorporated in the DVD is to take the average of measured D values around the 100th highest hour from nearby and comparable roadway sites and report those. The statewide minimum acceptable D100 is 0.52. If the calculated value is less than that value then 0.52 is shown. Using such an approach provides statewide consistency and reasonable accuracy in the values indicated and at a minimum cost.
Peak hour factor (PHF)
The PHF or Peak Hour Factor is the hourly volume divided by the peak 15-minute rate of flow within the peak hour; specifically
PHF = hourly volume ÷ (4 peak 15-minute volume).
All service volumes in this Handbook are for an hour; however, consideration of subhour traffic peaks may also become important. The most notable example is on freeways. If traffic demand on a freeway exceeds its capacity, the operation of the freeway breaks down. Subsequently, the freeway queue discharge rate is lower than the maximum flow rate under non-breakdown conditions. Another example is that, although FDOT’s Generalized Tables and arterial planning model (ARTPLAN) account for queues building up and dissipating over an hour, good arterial progression becomes irrelevant in oversaturated conditions.
The maximum PHF normally accepted by FDOT is 0.95. However, if adequate justification is provided by the applicant that a higher PHF is appropriate and represents an unconstrained situation, FDOT may accept a somewhat higher value.
For a preliminary engineering analysis, FDOT considers the calculation of PHF as optional because it is usually not one of the most important LOS input variables. However, when gathering data to calculate the K and D factors, PHF can be easily derived. To calculate the PHF from a 3 or 7 day count, calculate the average PHF from the 3 highest measured peak hour volumes.

INPUT VARIABLES | 3.6 Traffic Variables
2009 FDOT QUALITY/LEVEL OF SERVICE HANDBOOK | 70
Calculating PHF
The process shown below is an example of obtaining the estimated PHF from a 3-day count.
Measured Day
Peak Hour
Peak Hour Volumes
15 Minute Volumes Peak Hour
Factor 1st 2nd 3rd 4th
1/22 4-5 PM 1700 400 400 450 450 0.944
1/23 5-6 PM 1800 400 500 450 450 0.900
1/24 5-6 PM 1900 450 500 500 450 0.950
Average NA NA NA NA NA NA 0.931
Calculated PHF = 0.931.
If a roadway’s traffic is constrained, the PHF will generally increase. Thus, consideration should be given to lowering the PHF if a roadway is constrained.
Base saturation flow rate/ base capacity
Note, these are base flow rates, not “capacity” values; they are values from which capacity is calculated.
The HCM uses the term base saturation flow rate for interrupted flow roadways and capacity, or base capacity, for uninterrupted flow roadways to describe the maximum steady flow. These are not the same as “capacity” as normally used to define how many vehicles a roadway can reasonably accommodate. These rates are expressed in passenger cars per hour per lane (pcphpl), at which passenger cars can cross a point on given types of roadways. The base saturation flow rates/capacities for Florida’s roadway facilities are shown below.
• Arterials and other interrupted flow facilities – 1,950 pcphpl (assuming 100 percent green time)
• Basic freeway segment (70 mph posted speed) – 2,400 pcphpl • Freeway interchange influence areas (70 mph posted speed) –
o 2,200 pcphpl for the two outside lanes for the off ramp influence area o 2,300 pcphpl for the two outside lanes for the on ramp influence area o 2,400 pcphpl for additional inside lanes
• Uninterrupted flow multilane highway segments – 2,200 pcphpl • Uninterrupted flow two-lane highway segments – 1,700 pcphpl
Adjusted saturation flow rate/capacity
Previous editions of this Handbook made use of the term “adjusted saturation flow rate” as an input value instead of base saturation flow rate. Essentially, it accounted for the effects of the driver population factor, heavy vehicles, and other adjustment factors on the base saturation flow rate. However, primarily related to the greater emphasis on truck movements, those factors are now broken into two broad categories: (1) heavy vehicle percent and (2) “local adjustment factor”. To aid users understanding the impacts of many of the roadway and traffic variables, the terms “adjusted saturation flow rate” and “adjusted capacity” appear in the current preliminary engineering software for freeways and multilane highways as outputs.

INPUT VARIABLES | 3.6 Traffic Variables
2009 FDOT QUALITY/LEVEL OF SERVICE HANDBOOK | 71
Percent heavy vehicles
T values in FDOT’s traffic DVD should not be used for capacity/LOS analyses.
FHWA has a vehicle classification scheme in which vehicles larger than a pick-up truck, which includes vehicles with more than four wheels or classification group 4 or higher, are considered heavy vehicles. The percentage of these heavy vehicles in a given hour is frequently referred to as a truck factor (T). However, to be more consistent with HCM terminology and to overcome some definitional problems with the common understanding of the meaning of a “truck,” this Handbook uses the term “heavy vehicle” and makes use of the percent of heavy vehicles (classification group 4 or higher) in a given hour.
The heavy vehicle percentage varies dramatically by time of day, day of week, roadway type, and by adjacent land uses. Operational characteristics of heavy vehicles also vary dramatically by type of heavy vehicle (e.g., a relatively small delivery truck versus a fully loaded 18-wheel semi-truck) and whether they are operating on an uncongested freeway or on signalized roadways. The “blast” effect of heavy vehicles on bicyclists also varies significantly based on the type and speed of heavy vehicles.
Currently FDOT is recommending use of the HCM heavy vehicle factors and statewide average percentages which appear on the back of the Generalized Tables for capacity/LOS analyses. Use of the “T” factor in FDOT’s Florida Traffic Information DVD is not recommended for use. That factor is properly used for roadway pavement design. Rules of thumb have been applied to that factor to convert to a design hour; however, it is believed the factors appearing on the back of the tables are more realistic for the 100th highest traffic hours. Although surprising to many analysts, the heavy vehicle percentage typically has a relatively minor role in determining capacity and LOS. Consistent with previous guidance in this Handbook a more refined value for this factor is usually not needed. If it is deemed desirable to use a roadway specific heavy vehicle percentage it should be based on a field study oriented to the 100th highest traffic hour, and not based on the Traffic DVD.
Local adjustment factor (driver population factor)
The local adjustment factor is used by FDOT to adjust base saturation flow rates and base capacities to better match actual Florida traffic volumes based on Florida research [Bonneson, 2006; USF, 1999]. Conceptually it may be thought of as a driver population factor that accounts for driver characteristics and their effects on traffic. It is used in FREEPLAN and the multilane portion of HIGHPLAN to reflect lower capacities by different area types. It is not used as a separate input in ARTPLAN or the two-lane portion of HIGHPLAN, as the concept is directly incorporated by the selection of the area type.
Percent turns from exclusive turn lanes
Percent turns from exclusive turn lanes is the percent of vehicles approaching an intersection served by an exclusive turn lane(s). In the typical Florida situation the percent turns from exclusive lanes is the percent using exclusive left turn lanes with the predominant traffic movement being straight ahead.
FDOT’s planning tools assume there is no blockage of thru lanes by turning vehicles.
Most of the complicated aspects of the HCM chapter on signalized intersections deal with accommodating left turn movements. The Generalized Tables and ARTPLAN assume that left turns are adequately accommodated; there is no backing up of left turning traffic into thru lanes. If this assumption cannot be made, results obtained from the planning analysis tools are doubtful. Similarly, FDOT’s preliminary engineering software tool, ARTPLAN, loses some accuracy when turning movements
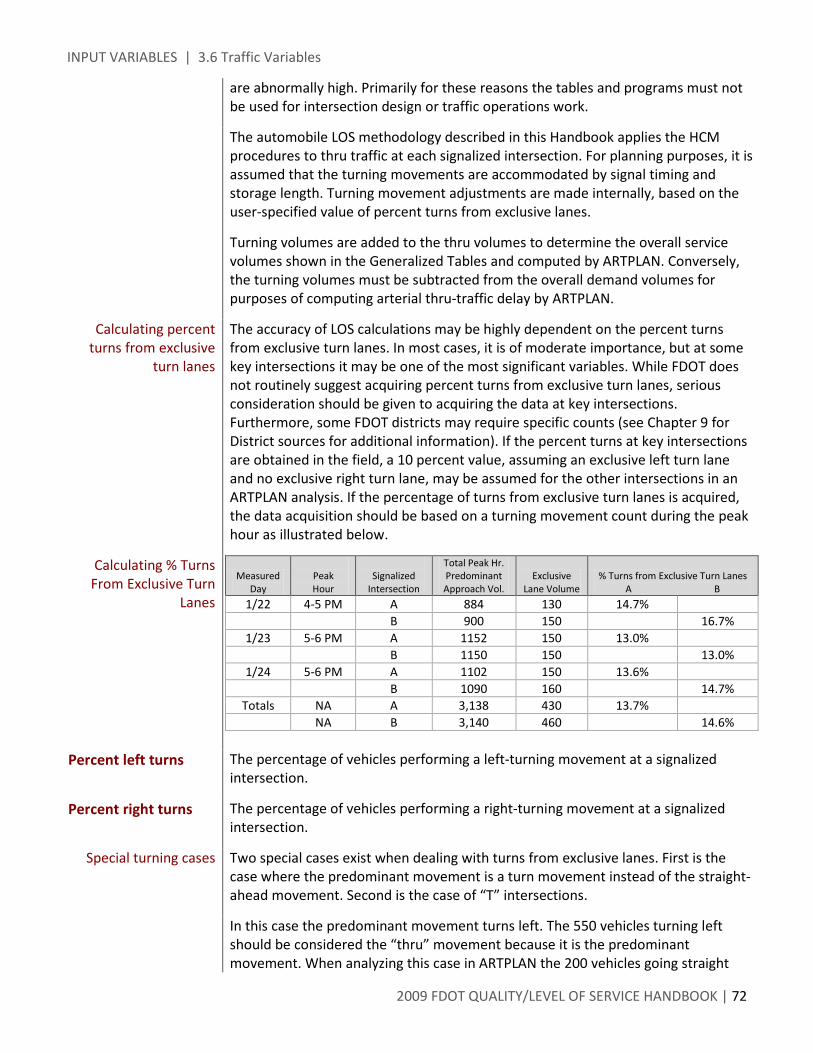
INPUT VARIABLES | 3.6 Traffic Variables
2009 FDOT QUALITY/LEVEL OF SERVICE HANDBOOK | 72
are abnormally high. Primarily for these reasons the tables and programs must not be used for intersection design or traffic operations work.
The automobile LOS methodology described in this Handbook applies the HCM procedures to thru traffic at each signalized intersection. For planning purposes, it is assumed that the turning movements are accommodated by signal timing and storage length. Turning movement adjustments are made internally, based on the user-specified value of percent turns from exclusive lanes.
Turning volumes are added to the thru volumes to determine the overall service volumes shown in the Generalized Tables and computed by ARTPLAN. Conversely, the turning volumes must be subtracted from the overall demand volumes for purposes of computing arterial thru-traffic delay by ARTPLAN.
Calculating percent turns from exclusive
turn lanes
The accuracy of LOS calculations may be highly dependent on the percent turns from exclusive turn lanes. In most cases, it is of moderate importance, but at some key intersections it may be one of the most significant variables. While FDOT does not routinely suggest acquiring percent turns from exclusive turn lanes, serious consideration should be given to acquiring the data at key intersections. Furthermore, some FDOT districts may require specific counts (see Chapter 9 for District sources for additional information). If the percent turns at key intersections are obtained in the field, a 10 percent value, assuming an exclusive left turn lane and no exclusive right turn lane, may be assumed for the other intersections in an ARTPLAN analysis. If the percentage of turns from exclusive turn lanes is acquired, the data acquisition should be based on a turning movement count during the peak hour as illustrated below.
Calculating % Turns From Exclusive Turn
Lanes
Measured Day
Peak Hour
Signalized
Intersection
Total Peak Hr. Predominant Approach Vol.
Exclusive Lane Volume
% Turns from Exclusive Turn Lanes A B
1/22 4-5 PM A 884 130 14.7% B 900 150 16.7%
1/23 5-6 PM A 1152 150 13.0% B 1150 150 13.0%
1/24 5-6 PM A 1102 150 13.6% B 1090 160 14.7%
Totals NA A 3,138 430 13.7% NA B 3,140 460 14.6%
Percent left turns The percentage of vehicles performing a left-turning movement at a signalized
intersection.
Percent right turns The percentage of vehicles performing a right-turning movement at a signalized intersection.
Special turning cases
Two special cases exist when dealing with turns from exclusive lanes. First is the case where the predominant movement is a turn movement instead of the straight-ahead movement. Second is the case of “T” intersections.
In this case the predominant movement turns left. The 550 vehicles turning left should be considered the “thru” movement because it is the predominant movement. When analyzing this case in ARTPLAN the 200 vehicles going straight

INPUT VARIABLES | 3.6 Traffic Variables
2009 FDOT QUALITY/LEVEL OF SERVICE HANDBOOK | 73
ahead should be treated as left turning vehicles with “20 percent left turns” ((200/(550 + 200 + 250)) from an “exclusive left turn lane”. The 250 vehicles turning right should be treated normally with 25 percent right turns ((250 / (550 + 200 + 250)) from an exclusive right turn lane.
In this “T” intersection case, although all vehicles are turning from exclusive turn lanes. The 600 vehicles turning right is the predominant movement and should be considered as “thru” vehicles. The 400 vehicles should be treated normally as 40 percent left turns (400 / (400 + 600)) from an exclusive left turn lane.
Another “T” intersection scenario is shown in the third illustration. It features a “shared left/thru” lane in addition to the predominant movement being served by the exclusive right lane. Normally a shared left/thru lanes does not have the same capacity as a thru lane because of the effect of opposing vehicles blocking permitted left turns for the main movement. However, in this case the left turning vehicles are not being opposed and therefore, the capacity of this shared lane is virtually the same as a typical thru lane. In this situation use 2 thru lanes with one considered a shared thru lane, and 20 percent left turning movement ((200/(200+200+600)) and 0 percent right turning movement.
Bus frequency As used in this Handbook, bus frequency refers to the number of scheduled fixed route buses which have a potential to stop on a given roadway segment in one direction of flow in a one hour time period. Express buses with no potential of stopping along a roadway are not included.
Bus span of service Bus span of service refers to the number of hours in a day of scheduled fixed route bus service. This factor becomes relevant when reporting on a daily basis. Although the Generalized Tables are based on hourly directional values, span of service becomes a relevant factor for any given hour if the transit service is not available for the return, or originating, trip. In the following table, the LOS letter grade, hours of service thresholds, and comments were obtained from the TCQSM. The factors are FDOT’s and are applied as multiplicative factors in ARTPLAN daily analyses of buses.
Table 3 – 6 Impact Of Bus Span Service – Daily Reporting
Hours of Service Per Day LOS Factor Comments
19-24 A 1.15 Night or owl service provided
17-18 B 1.05 Late evening service provided
14-16 C 1.00 Early evening service provided
12-13 D 0.90 Daytime serviced provided
4-11 E 0.75 Peak hour service/ limited midday service
0-3 F 0.55 Very limited or no service
550 200 250“Thru” “Left” Right
400 600
400 600
“Thru”Left

INPUT VARIABLES | 3.7 Control Variables
2009 FDOT QUALITY/LEVEL OF SERVICE HANDBOOK | 74
3.7 Control Variables
In general, control variables refer to roadway or area traffic controls and regulations in effect for a roadway point or segment, including the type, phasing, and timing of traffic signals, stop signs, lane use and turn controls, and other similar measures. In this Handbook, control variables refer to those regularly occurring at signalized intersections, unless otherwise noted.
For uninterrupted flow facilities, such as freeways and rural multilane highways, LOS can readily be derived from the volume of vehicles and roadway capacity. For signalized roadways, control conditions must also be considered. Traditional volume to capacity ratios (v/c) are simply not adequate to determine LOS for these signalized roadways and the effects of the traffic signals must also be included.
Number of signalized intersections
Importance of signalized intersections
Signalized intersection spacing
Frequently, it is the cumulative effect of numerous traffic signals, lack of green time, and lack of good progression that lower the LOS of arterials. A major feature of FDOT’s Generalized Tables is the importance of the number of signalized intersections on the determination of LOS.
The distance between signalized intersections is required to determine specific service volumes for a roadway. FDOT’s Generalized Tables use signalized intersections per mile as a variable and assume uniform spacing. While this spacing may be acceptable for an areawide analysis, precise distances between signalized intersections should be determined when an individual roadway is being analyzed at a preliminary engineering level.
For analysis purposes 100 feet between signalized intersections is considered the minimum distance. In situations where the actual distance is less than 100 feet (e.g., side streets with wide medians), it is proper to consider these as one signalized intersection.
Future conditions Generally, over time, roadway and traffic characteristics change. The number of signalized intersections per mile is frequently the most significant change. As development takes place and an area urbanizes, the number of signals is likely to increase. The LOS analysis for the future should take into account changes in roadway and signalization characteristics.
Determining number of signalized intersections
When determining the number of signalized intersections, to avoid double counting, the signalized intersections at the ends of the facility should not both be counted. In general, FDOT recommends not counting the roadway’s first signalized intersection and counting the last one, so as to determine the delay, backup and LOS of the intersection and for the overall facility under study.
Count the last intersection, but not the first.
Facility Length2 miles
#1 #3#2Don't count the first signal

INPUT VARIABLES | 3.7 Control Variables
2009 FDOT QUALITY/LEVEL OF SERVICE HANDBOOK | 75
For example, often in southeast Florida, principal arterials are spaced 1 mile apart with other signalized intersections between them. In this situation, only one of the signalized intersections at the end of the roadway, plus the signals in between should be counted when determining the number of signalized intersections per mile. In general, the first intersection in the peak flow direction would not be counted and the last one would be included.
Unsignalized intersection as a
terminus for arterials
As stated earlier in the roadway variables / roadway lengths / signalized intersection as termini section of the Handbook, the arterial should begin and end at a signalized intersection. In those unusual situations (e.g., lane drops, ramp junctions) where that cannot feasibly be done the following guidance is provided. For
• the Generalized Tables, do not count the unsignalized terminus as a signalized intersection
• a preliminary engineering analysis using ARTPLAN, treat the terminus as a signalized intersection with a g/C ratio of 1.00.
For example, a four-lane arterial leads eastward out of an urbanized area. The western terminal is A Street. There are 3 signalized intersections east of A Street. However, the analysis extends 2.5 miles past the last signal as a four-lane road. At that point, the road tapers and becomes a two-lane facility.
If using the generalized tables this roadway should be considered as having 3 signalized intersections. In an ARTPLAN analysis, the g/C of the eastbound terminus should be assumed to have a signalized intersection g/C of 1.00 (ARTPLAN needs to end at a signalized intersection).
Use only fixed, periodic interruptions.
In general, only fixed, periodic interruptions should be considered in determining the number of signalized intersections. In general, draw bridges, at-grade railroad crossings, school zones, pedestrian crossings and median openings should not be counted. Depending on site specific conditions or analysis desired, there may be exceptions to this general guidance.
Consideration of two-way and all-way stop
signs in Generalized Tables
When using the Generalized Tables, an intersection with a stop sign for the thru movement is considered a “signalized intersection” for a state signalized arterial or a major city/county roadway. When analyzing a non-state “other signalized roadway” the roadway must have at least one signalized intersection. When using ARTPLAN the unsignalized intersection should be treated as a signalized intersection with a thru g/C no greater than 0.40.
Facility Analysis
Eastbound
#1 #3#2

INPUT VARIABLES | 3.7 Control Variables
2009 FDOT QUALITY/LEVEL OF SERVICE HANDBOOK | 76
Arrival type
Quality of progression
Arrival type is a general categorization of quality of signal progression. The HCM defines six arrival types, with 1 representing the worst progression quality and 6 representing the best. Uncoordinated operation, or random arrivals, is represented by 3 and is appropriate for actuated signals. Arrival type 4 is FDOT’s default for coordinated signal systems. More favorable progression (5 or 6) for a Class III or IV facility may be appropriate when progression design strongly favors the peak direction of travel, signals are pretimed, and all the signals are coordinated for the length of the facility. One-way facilities tend to have better quality progression than two-way facilities. Around freeway interchanges where signals are typically highly coordinated a higher level of progression may also be appropriate. Arrival type also may vary significantly from one signal to the next, even in coordinated signal systems. Semiactuated signals have varying g/C ratios and there are breaks between groups of coordinated signals.
A good arrival type in one direction may result in a low arrival type in the other.
The assumption of very good progression in one direction does not imply a positive in the other direction. Even with less traffic volume off peak direction speeds could be lower if favorable progression has been established for the peak direction.
Signal type The signal type indicates the degree to which a traffic signal’s cycle length, phase plan, and phase times are preset or actuated. Three main types are:
• Actuated • Semiactuated • Pretimed
It should be noted that modern traffic signals can be programmed with different settings and can be varied by time of day. Consequently, a traffic signal’s operation (actuated, semiactuated, or pretimed) can change by time of day to best meet traffic demands.
Actuated
Actuated, also referred to as “fully actuated”, signals use vehicle detection for all signal phases present at the intersection. At a typical four-leg intersection these phases generally include the main and side street thru phases and left turn main and side street thru phases. Each phase is subject to a minimum and maximum green time and some phases may be skipped if there is no demand for the phase. The length of green time observed in the field generally depends on the amount of vehicular demand for the phase. The length of the green time observed in the field generally depends upon the amount of vehicular demand for the phase. If there is little demand, then a relatively short green time will be allocated to the respective phase. If there is much demand, a relatively long green time will be allocated subject to the maximum green time for that phase. The minimum and maximum green times for each phase can be easily changed by simply entering new values into the traffic signal controller.

INPUT VARIABLES | 3.7 Control Variables
2009 FDOT QUALITY/LEVEL OF SERVICE HANDBOOK | 77
Since phases can be skipped and since the amount of green time for each phase generally depends upon demand, the cycle length will often vary substantially from cycle to cycle . The exception occurs during periods of heavy vehicular demand when all phases are used to their maximum values. During these periods, the cycle length may appear to be fixed. Actuated signal operations are most frequently used when the signalized intersection is isolated or when the desire is to minimize delay without concern about progression.
Semiactuated
Semiactuated, also referred to as “coordinated actuated”, signals use vehicle detection provided for all signal phases present at the intersection, except the main street thru phases. Each phase, except the main street thru phase, is subject to a minimum and maximum green time and these phases may be skipped if there is no demand for the phase. The length of the green time observed in the field for these minor (non-main-street-thru) phases generally depends upon the amount of vehicular demand for the phase. If there is little demand, a relatively short green time will be recorded for the phase. If there is much demand, a relatively long green time will be recorded. The minimum and maximum green times for each minor phase can be easily changed by simply entering new values into the traffic signal controller.
In this type of signal operation, the cycle length is typically fixed. The amount of green time for the main street thru phase of a semiactuated signal varies. It consists of a minimum amount of green time plus any unused time from the minor phases. Holding the main street green in this manner at all of the signals along a facility allows platoons of vehicles to move relatively unimpeded along the main street with decent progression. Semiactuated signal operations are typically used in Florida’s developed areas, especially during peak travel times. This type of operation typically offers the best balance of capacity and progression for the main street thru movement.
Pretimed Pretimed signals use a preset sequence of phase times in a repetitive order and make no use of vehicle detection. Each phase is green for a fixed period of time, irrespective of vehicular demand, and none of the phases can be skipped. Thus, cycle length is also fixed. This type of signal operation is most frequently used in downtown areas with high signal density and when the desire is to maximize progression without extensive concern about maximizing capacity for the thru movement.
Generalized Tables assumptions
In the General Tables, actuated signals are assumed when the number of signalized intersections per mile is less than 2. Semiactuated signals are assumed when the number of signalized intersections per mile is at least 2.
Cycle length (C)
Cycle length (C) is the total time for a signal to complete a sequence of signal indications for all traffic movements. For actuated and possibly semiactuated signals, the cycle length may vary depending on side street traffic. Usually these signals have a maximum cycle length, which is defined by the sum of the maximum indication times for each phase. As used in the Generalized Tables, the cycle length represents this maximum cycle length.

INPUT VARIABLES | 3.7 Control Variables
2009 FDOT QUALITY/LEVEL OF SERVICE HANDBOOK | 78
Effective green ratio (g/C)
g/C is one of the most important variables in determining LOS and capacity of arterials.
One of the most critical inputs to calculating highway capacity and LOS on a signalized roadway is the thru movement’s effective green time to signal cycle length ratio (g/C). g/C is the amount of time allocated for the thru movement (typically calculated as the green plus yellow plus all red indication times less the lost time) divided by the cycle length. Along with the number of thru lanes, it is usually one of the two most important factors for determining the capacity of a roadway’s thru movement at any given intersection and for the roadway as a whole. Yet, for planning and preliminary engineering analyses g/C is seldom addressed. There are many reasons for this lack of consideration:
• g/Cs typically vary from intersection to intersection along an arterial;
• g/Cs typically vary by time of day; and
• Planning staff typically ignores signal operations and choose to avoid it.
However, ignoring g/C makes any arterial LOS analysis at a generalized planning or preliminary engineering level suspect. Essentially, guidance is needed providing default g/Cs for generalized planning arterial analyses and for determining g/Cs at a conceptual planning/preliminary engineering level.
Weighted effective green ratio
For preliminary engineering use signal specific g/Cs.
A major simplifying assumption, essential to the development of the Generalized Tables, is the selection of a single g/C for all the intersections of the arterial. A fundamental question arises as to what green time value to assume, given that intersections frequently have widely varying green times. FDOT has determined that for generalized planning analyses, the “weighted effective green ratio” yielded the closest results to actual conditions. As a matter of information, the weighted g/C of an arterial is the average of the sum of the critical intersection’s thru g/C with the average of the other intersections’ thru g/Cs. Essentially the worst intersection is given equal weight to all the other intersections combined. In addition to being used to develop the Generalized Tables, the weighted g/C approach is also used in ARTPLAN to give an analyst or reviewer a warning whether or not accurate g/Cs are being used for the arterial. In preliminary engineering applications signal specific g/Cs should be used, not a weighted g/C approach.
In the discussions below, for the thru movement phase, “G” is the green displayed time, “Y” the yellow displayed time (typically 3 or 4 seconds), and “R” the “all red” indication (typically 1 or 2 seconds). “C” is the cycle length. The most representative situation in Florida is for cycles to consist of 4 phases and 12 indications: one phase each to accommodate the main road thru movement, the side road left movement, the side road thru movement, and the main road left movement, with G, Y and R indications for each of the 4 phases. “g” refers to the effective green time which includes consideration of vehicular start up and clearance lost times (l1, l2).

INPUT VARIABLES | 3.7 Control Variables
2009 FDOT QUALITY/LEVEL OF SERVICE HANDBOOK | 79
FDOT recommends using: (1) the signal timing plan, and (2) g/C = (G + 4 ) / C
FDOT's
recommendation for obtaining g/C data
Left g/C
FDOT’s preferred approach for g/C determination for current year analyses is to use the actual signal timing plan from the traffic operations agency for the 5-6 p.m. weekday time period for each signalized intersection. This approach offers outstanding consistency and cost effectiveness in implementation, as well as providing reasonable accuracy. If the signal is semi-actuated or actuated, use (G+4)/C for the thru movement. By doing so, this assumes the typical Y+R time of 4 seconds equals additional time allocated to the thru movement as a result of unused time from the other movements. If the signal is pretimed, then use the G/C for the thru movement.
For consistency and ease in review, FDOT recommends the use of signal timing plans from the applicable traffic operations agency. The process of determining g/C for both the thru movement and the left turn movement is illustrated in Figure 3–2. Entering this data could be done in Figure 3-1 "Arterial Data Collection Worksheet" (page 49) or directly into ARTPLAN.
Analysts should be aware that traffic operations agencies' signal timing plans come in many forms, use many notations, and are not designed to directly address determining g/C. Coordination with the operating agency will likely be needed to interpret outputs. When requesting the signal timing plan, the analyst should specify that only the 5-6 p.m. weekday time period is desired.
Analysts should calculate and input g/C for the thru movement at all intersections. g/C for left turning movements need only be collected at any major intersections. A 10% value can be assumed as the left g/C for other intersections.
In previous FDOT 2007 interim guidance, FDOT offered two other methods for determining g/C:
• “actual signal timings” from the traffic operations agency • “field studies”
Both approaches have some merit; however, after FDOT analyzed and tested both approaches the preferred approach of using signal timing plans in general offers the best combination of consistency, accuracy and cost effectiveness. Many analysts use field studies for g/C determination. Continued practice is discouraged unless early agreement by affected parties is reached.

INPUT VARIABLES | 3.7 Control Variables
2009 FDOT QUALITY/LEVEL OF SERVICE HANDBOOK | 80
Figure 3-2 Example Signal Timing Plan and g/C Calculation
Maximum acceptable facility thru movement
g/C
Individual intersection g/Cs vary; however a facility’s g/C should be reasonable.
The maximum acceptable “facility” thru movement effective green ratios (g/C) during the peak hour typically should not exceed:
• State principal arterials o Current year – 0.50 o Long term (>= 10 years out) – 0.47
• Other roadways– 0.44
Under most circumstances arterial “facility” lengths are 1.5-5.0 miles and include principal arterials as termini. The g/C value of 0.50 approximates FDOT’s maximum allowable arterial capacity volumes of 1,000 vphpl and 950 vphpl in large urbanized areas and other urbanized areas, respectively.
Thru movement g/Cs vary widely for individual intersections and different hours of the day. Therefore, ARTPLAN’s acceptable g/C range for individual intersections is 0.1 to 1.0. Along principal arterials it is not unusual for the arterial to have g/C ratios in the 0.5 to 0.7 range at many intersections. However, as the analysis length is increased from an individual intersection, to a segment, to a section, and on to a facility, the probability that the arterial intersects other arterials increases. Furthermore, when two principal arterials intersect, the g/Cs for the thru movements are in the range of about 0.40. To reflect these wide ranges in g/C values and upper limits of a “facility” g/C ratio, the updated ARTPLAN allows individual intersections to have a g/C ratio of up to a 1.0, but it provides warnings and messages if the 0.50 facility g/C ratio is exceeded.
75Magnolia
Example Completion of g/C Documentation Worksheet
(75 + 4 )/160 = 0.4930/160 = 0.19
Control Primary Road Cycle Primary RoadType Thru Left Length Thru Left
Intersection Name (a,s,p) * G G C
(a,s)
(G+4)/C
(p)
G/C G/C
30 160 0.49 0.19N.A.

INPUT VARIABLES | 4 Future Year Analyses
2009 FDOT QUALITY/LEVEL OF SERVICE HANDBOOK | 81
4 FUTURE YEAR ANALYSES
Traffic and development conditions change on roadways over time. This raises questions as to what input values, analysis tools and LOS standards should be used for capacity/LOS analyses in future years. Analysis years and planning horizons vary appreciably in transportation planning. To aid in understanding and for simplification in this text the terms “long term” means 10 or more years from the current year and “short term” means less than 10 years from the current year. However, for a specific application FDOT District LOS Coordinators (Chapter 9) should be consulted for more specific guidance.
Consistency in application of LOS
standards and area types
For development reviews, FDOT’s LOS standards and area types remain effective throughout the project's planning horizon. For example, in FDOT’s review of a proposed multi-phase development the same standards and area types would be used regardless of the amount of development anticipated over time. The only time the applicable standards may change is when the development order conditions provide for a reevaluation of transportation impacts for subsequent phases of development. The change in LOS standards may result from an official change in designation (e.g., Census update, rule change, variance).
Change in roadway, traffic, and control
characteristics
For future year analyses it is also important to consider changes in appropriate roadway, traffic and control (signalization) characteristics, as discussed in the following sections. For example, currently in a transitioning area, signalization may be very infrequent; however, as development occurs more signalized intersections can be anticipated and should be accounted for in future year capacity/LOS analyses.
4.1 Change in Traffic Variables
Annual Average Daily Traffic
Historical growth trends and the state’s travel demand forecasting models are typically used for long term traffic projections. Analysts and reviewers of capacity and LOS analyses need to agree on what future AADT values to use.
Other traffic volume data
For site impact analyses volumes are frequently presented in terms of trips generated during peak hours and daily rather than by using roadway-specific AADT, K and D values. ITE’s Trip Generation Handbook [ITE, 2008] is typically used for trip generation for site impact analyses; however, FDOT should be consulted about supplemental material. When using such sources and conducting an analysis care should be given to ensure final values are compatible with statewide minimum K100 and D100 factors.
Planning analysis hour factor (K100)
As areas become more developed and/or development occurs along roadways, measured K100 values drop primarily for two reasons. The first is that more urban situations typically are not subject to highly volatile volumes like holiday traffic in rural areas. Generally, more developed areas are subject to frequent recurring volumes such as weekday commuter traffic. The second is that as congestion develops, spreading of the peak travel hour traffic also occurs.

INPUT VARIABLES | 4.1 Change in Traffic Variables
2009 FDOT QUALITY/LEVEL OF SERVICE HANDBOOK | 82
For future year capacity/LOS analyses the first consideration is appropriate to include while the second is not. The second consideration should not be included because capacity/LOS analyses make use of traffic demand volumes, not necessarily measured volumes which may be subject to capacity constraints.
For future year generalized planning analyses the typical demand K100 values for various area and facility types found on the back of FDOT’s Generalized Tables are appropriate. If a site specific analysis is being conducted in the short term, FDOT’s preferred approach is to use the “Demand K100” from the Florida Traffic Information DVD [FDOT, 2009b]. In the longer term some lowering of the K100 factor may be appropriate, but in no circumstance should it fall below the statewide minimums found in Chapter 3.3.
Directional distribution factor (D)
For future year generalized planning analyses the typical demand D value for all area and facility types is 0.55. If a site specific analysis is being conducted in the short term FDOT’s preferred approach is to use the “Demand D100” from the Florida Traffic Information DVD. In the longer term some lowering of the D100 factor may be appropriate, but in no circumstance should it fall below the statewide minimum of 0.52.
4.2 Change in Control Variables
Making traffic and roadway projections into the future is well accepted practice for planning and preliminary engineering analyses. However, seldom is the making of control (signalization) projections performed. For reasonable planning and preliminary engineering analyses of signalized roadways, control variables must be addressed both in the short term and in the long term. Typically the two most important control variables are the thru movement effective green to cycle length ratio (g/C) and signal density.
Thru movement effective green to cycle length ratio (g/C)
Determining current and future g/Cs for a roadway is complicated and judgments must be made. The following general guidance is provided:
In the short and long terms: • For arterial Classes II, III, and IV, continued use of existing g/Cs is
appropriate; • For Class I arterials with low speeds in small towns or Class I arterials not
subject to significant development pressure, continued use of existing g/Cs is appropriate;
• For relatively high speed (posted 45 mph) Class I arterials incurring significant new development pressure, it is appropriate to lower thru movement g/Cs; and
• For new individual signals, thru movement g/Cs will vary greatly; however, for planning purposes none should be assumed to be higher than 0.55.

INPUT VARIABLES | 4.2 Change in Control Variables
2009 FDOT QUALITY/LEVEL OF SERVICE HANDBOOK | 83
g/C in future years Using ARTPLAN, an acceptable way to project g/C ratios in the long term is by assuming a thru g/C of 0.40 at all major intersections (typically state arterials) and 0.55 at other intersections. This is based on an assumption that each of the major arterial facilities gets an equal amount of green time for their approaches, minus the green time for accommodating left turning vehicles. Corresponding left and right turn percentages for each are 15% at major intersections, and 5% at other intersections.
Using HCS an acceptable way to estimate future g/C ratios is by conducting intersection capacity analyses. HCS will determine the required g/C ratios to progress thru traffic movements on the major street, while simultaneously minimizing delay to the minor street approaches.
Signal density
As areas grow in population, additional traffic signals are frequently installed. Usually these new signals do not significantly affect the capacity of roadways unless they are in a previously undeveloped area or are so closely spaced that queue spillback blockage occurs. They can play a major role in the determination of LOS if stops occur more frequently and average travel speeds drop.
New traffic signals In both short and long term analyses, it is appropriate to consider the probability of new traffic signals, especially based on proposed new developments. In the absence of specific development plans or intersecting traffic volume cross-product signalization criteria, the following offers generalized guidance for use in developed areas.
In the short term: • For arterial Classes II, III, and IV, continued use of existing signalized
intersection locations is appropriate; • For Class I arterials with low speeds in small towns or not subject to
significant development pressure, continued use of existing signalized intersection locations is appropriate; and
• For relatively high speed (posted 45 mph) Class I arterials incurring significant new development pressure, one additional signalized intersection per mile may be assumed.
In the long term: • For arterial Classes III and IV, continued use of existing signalized
intersections is appropriate; • For Class II, one additional signalized intersection per mile may be assumed; • For Class I arterials with low speeds in small towns one additional signalized
intersection per mile may be assumed; and • For relatively high speed (posted 45 mph) Class I arterials incurring more
than minimal development pressure, it is appropriate to assume they become Class II arterials with at least 2 signalized intersections per mile.

INPUT VARIABLES | 4.2 Change in Control Variables
2009 FDOT QUALITY/LEVEL OF SERVICE HANDBOOK | 84
Because of the wide variety of circumstances along generally uninterrupted flow highways in rural areas, no specific guidance can be given on future signal locations. However, for capacity/LOS purposes the possibility of new signalized intersections should be considered.
Because of the importance of signal density on LOS on state roadways, for site impact applications the number of new signals should be reviewed and approved by the FDOT district prior to use in an analysis.
Other roadway, traffic, and control input variables are usually not as important.
Typically, other roadway, traffic and control variables do not have as large of an effect on capacity/LOS as the ones addressed above. If some of these other inputs (i.e., turning movement percentages) were determined in a current year analysis, they can usually be applied to future year analyses. If these other variables were not determined for a current year analysis, the statewide default values appearing on the back of the Generalized Tables may be assumed.
4.3 Evaluation Tools
Travel demand forecasting models, the HCM [TRB, 2000] and accompanying HCS software [McTrans, 2009], and simulation tools are widely used for future year analyses. FDOT’s LOSPLAN software programs were also developed to address LOS in future years and are appropriate for use. Recent discussions have occurred in Florida about the use or misuse of capacity/LOS software for planning applications in future years. In most situations the basis for concern is not the tools themselves, but the assumptions and subsequent input values used in application of the tools.
Generalized Tables
In Florida, FDOT’s Generalized Tables are almost universally accepted for generalized planning purposes. Because of uncertainty in traffic and signal control conditions in future years they become more applicable as they do not imply a great deal of numerical precision.
LOSPLAN are appropriate for future year analyses.
FDOT’s LOSPLAN software programs are specifically applicable and are typically the most appropriate tool to conduct preliminary engineering capacity/LOS analyses in future years. It is imperative that appropriate assumptions and input values be used in the programs (as it is for travel demand forecasting models, the HCS, and simulation programs), and should comply with the guidance provided in the previous sections this Handbook.

GENERALIZED PLANNNING ANALYSIS | 5.1 Introduction
2009 FDOT QUALITY/LEVEL OF SERVICE HANDBOOK | 85
5 GENERALIZED PLANNING ANALYSIS (Generalized Service Volume Tables)
5.1 Introduction
Applications Generalized planning is a broad type of planning application such as statewide analyses, initial problem identification, and future year analyses. Generalized planning is applicable when the desire is for a quick, “in the ball park” estimate of LOS, and makes extensive use of default values. Florida’s Generalized Tables found at the end of this Handbook are the major analysis tool in conducting this type of planning analysis.
Specific applications of the Generalized Tables (Service Volume Tables 1 through 9) include:
• Generalized comprehensive plan amendment analyses; • Statewide highway system deficiencies and needs; • Statewide mobility performance measure (e.g., delay) reporting; • Areawide (e.g., MPO boundaries) baseline capacity and service volume
values for travel demand forecasting models; • Areawide (e.g., impact areas) influence areas for major developments; • Future year analyses (e.g., 10 year planning horizon); • Threshold evaluations for roadway concurrency management programs
(e.g., 85% of a roadway’s applicable LOS standard service volume) and; • Baseline capacity and service volumes for concurrency management
systems
Caution in applying tables
Generalized Tables must be appropriately applied (e.g., using the right area type and facility type designations) and interpreted (e.g., selecting the right values from the tables).
Perhaps no single roadway has all the default input values of the tables.
It is quite possible that no single roadway has the exact values for all the roadway, traffic and control variables used in the Generalized Tables. The tables must be applied with care to roadway facilities and in the determination of the LOS grade.
Depending upon the application, such generalized analyses may be appropriately supplemented with documentation by an LOSPLAN analysis. For example, in Gainesville, roadways where 85% or more of a roadway’s LOS standard service volume is exceeded based on the Generalized Tables, those roadways are analyzed with a supplemental LOSPLAN analysis. However, no operational tool (e.g., HCM) should be used as part of a generalized planning analysis because of falsely implied precision and to avoid “cherry picking” of desired input or output values.

GENERALIZED PLANNNING ANALYSIS | 5.1 Introduction
2009 FDOT QUALITY/LEVEL OF SERVICE HANDBOOK | 86
FDOT’s Generalized Tables are based on nationally accepted techniques.
The automobile parts of the Generalized Tables were developed based on the definitions and methodology of the HCM [TRB, 2000]. The values shown in the Generalized Tables for bicycles, pedestrians and buses are based on the latest national and state research for those modes. Nationally, for bus analyses, the Transit Capacity and Quality of Service Manual (TCQSM) [TRB, 2003] is the comparable document to the HCM. FDOT has found the Bicycle and Pedestrian LOS Models [Landis, 1997; Landis, 2001] to be the most appropriate for those modes. Besides their positive technical merits, these models have become the leading techniques used in the U.S. Noteworthy, the bicycle, pedestrian and bus techniques being used are as technically sound as the HCM auto techniques. The Generalized Tables are believed to be the most thoroughly researched and state-of-the-art generalized service volume tables in use nationwide.
The tables were developed from data collected around the state.
FDOT personnel conducted numerous traffic and signalization studies and developed values to reflect typical conditions in Florida. Daily and directional data were derived from FDOT’s continuous traffic count stations throughout Florida. Signal timing data were obtained from analyses of traffic signal timings in Miami, Tampa, Tallahassee, Gainesville, DeLand and Lake City. FDOT’s intent has been to develop the most realistic numbers based on actual roadway, traffic and control data. Bicycle, pedestrian and bus components of the tables were developed through a significant research project with the University of Florida and the developers of the TCQSM and Bicycle LOS and Pedestrian LOS Models. Major bicycle data and calibration was conducted in Tampa and major pedestrian data and calibration was conducted in Pensacola. All roadway, traffic and control default values, as well as LOS thresholds, appear on the back of the Generalized Tables.
Types of Areas & Tables
Types of areas
Florida’s Generalized Tables consist of five area types grouped into three tables:
• Urbanized areas • Areas transitioning into urbanized/urban areas, or cities over 5,000
population not in urbanized areas • Rural undeveloped areas, or cities and developed areas less than 5,000
population
Types of Tables
Daily tables
Peak hour two-way tables
Peak hour directional
tables
Most planning and preliminary engineering applications begin with annual average daily traffic (AADT) volumes given as an input, or end with AADT as a calculated output. Therefore, the Generalized Daily Tables shown in Tables 1 through 3, depict the AADT based on the 100th highest traffic hour of the year. Some local and regional entities have adopted two-direction peak hour standards. Table 4 through 6 provide generalized peak hour two-way volumes. Generalized Peak Hour Directional Tables (Tables 7 through 9) are provided because traffic engineering analyses are conducted on an hourly or subhourly directional basis. These hourly directional tables may be viewed as the most fundamental of the tables because the two-way tables are simply the peak hour directional values divided by the directional distribution factor (D), and the daily tables are simply the peak hour directional values divided by both the D factor and the planning analysis hour factor (K).

GENERALIZED PLANNNING ANALYSIS | 5.1 Introduction
2009 FDOT QUALITY/LEVEL OF SERVICE HANDBOOK | 87
All tables are based on peak hour directional variables.
All three sets of tables are internally consistent. More specifically, all of the volumes are based on the higher directional flow of traffic for the 100th highest hour of the year and account for traffic fluctuations within the hour. The 100th highest hour is approximately equivalent to the typical peak hour of a day during a peak season in a developed area. Again, it is stressed that the daily, peak hour two-way, and peak hour directional tables are internally consistent, and are based on the same time period and directional flow of traffic.
Calculation of service volumes
FDOT’s preliminary engineering LOSPLAN software programs (ARTPLAN, FREEPLAN, HIGHPLAN) were used to generate the Generalized Tables. They feature the capability of calculating service volumes. Applying the input values on the backs of Tables 1 through 9 in the LOSPLAN programs yield the results on the front of the tables.
Maximum service volumes
The Generalized Tables present maximum service volumes, the highest numbers of vehicles for a given LOS. Any number greater than the value shown in a table for a roadway with a given number of lanes would drop the LOS to the next letter grade. For example, if the volume shown in a table for a 4-lane arterial at LOS C is 26,000 then 26,100 would represent LOS D. Some special aspects to the tables exist and are discussed in Chapter 5.2.
The tables are not capacity tables.
The Generalized Service Volume Tables should not be referred to as capacity tables. In general, the values shown are the maximum service volumes for a given LOS based on roadway, traffic and control conditions during the peak hour in the peak travel direction. Whereas, maximum service volume deals with the highest number of vehicles for a given LOS, capacity deals with the maximum number of vehicles or persons that can pass a point during a specified time period under prevailing roadway, traffic and control conditions. Many of the LOS E maximum service volumes in the hourly directional tables also represent the capacity of the roadway, but in general, most of the values do not reflect a roadway’s capacity.
A clear case of not representing capacity values is the “daily” tables. Roadway capacities for the day far exceed the volumes shown in the daily tables. All roadways are under utilized in the early morning hours and many heavily congested roads will have volumes higher than the highest volumes shown in the daily tables because traffic is backed up for more than a 1 hour period.
Another case of not representing capacity is the arterial LOS E service volumes. The primary criterion for LOS on arterials is average travel speed, not the capacity of the roadway. Average travel speed along arterials is made of many control variables (e.g., progression, cycle length), not just the capacity (i.e., volume to capacity ratios) of signalized intersections. Only in the special case when the capacity of signalized intersections control how many vehicles can pass through the intersections does capacity essentially dictate the lowest acceptable average travel speeds along arterials.

GENERALIZED PLANNNING ANALYSIS | 5.1 Introduction
2009 FDOT QUALITY/LEVEL OF SERVICE HANDBOOK | 88
Florida’s Generalized Service Volume Tables
Florida’s Generalized Service Volume Tables appear at the end of this Handbook.
Daily Service Volume Tables
• Table 1 – Urbanized Areas • Table 2 – Transitioning and Urban Areas • Table 3 – Rural Undeveloped and Rural Developed Areas
Peak Hour Two-Way Service Volume Tables
• Table 4 – Urbanized Areas • Table 5 – Transitioning and Urban Areas • Table 6 – Rural Undeveloped and Rural Developed Areas
Peak Hour Directional Service Volume Tables
• Table 7 – Urbanized Areas • Table 8 – Transitioning and Urban Areas • Table 9 – Rural Undeveloped and Rural Developed Areas
5.2 Special Aspects of the Generalized Tables
Varying traffic volumes along a facility
The volumes in the Generalized Tables should be considered as average volumes over the facility under analysis. For example, if a 4-mile facility has AADT counts of 23,000, 22,000, 25,000, 23,000, and 27,000 for segments over its length, FDOT recommends the use of the average value 24,000 for comparison to the tables to determine the LOS. Use of the average volume works reasonably well unless there is one segment that has a widely disparate value, in which case a median value may be more appropriate.
Mid-block considerations
The number of lanes for an arterial is determined at major intersections, not mid-block.
In general, Q/LOS analyses for interrupted flow facilities primarily center on the signalized intersections. The majority of motorist aggravation, generally attributable to delays, occurs at signalized intersections on arterials. Therefore, when using the Generalized Tables, the number of lanes for arterials and other interrupted flow facilities should be determined at major intersections, rather than mid-block.
For uninterrupted flow facilities and non-automobile modes, travelers place a greater emphasis on mid-block considerations. For example, on two-lane highways in rural undeveloped areas, LOS is largely determined by the ability to pass. For freeways, most travelers are concerned about the operation of the whole facility and not the operation of particular interchanges. For bicycle and pedestrian movements, the Bicycle LOS and Pedestrian LOS Models are calibrated for mid-block conditions. For bus LOS, the emphasis is on the ability to get on the bus over the length of facility with less importance placed on intersections. Therefore, in general, the number of lanes for these situations concentrate on mid-block considerations.
Non-state signalized roadways
The primary purpose of this Handbook is to compute the LOS for state facilities. However, because the techniques have great potential use by local governments, the Generalized Tables and LOSPLAN software also have been structured for their needs. The Generalized Tables are reasonably well suited to local governments who desire to use them to evaluate roads under local jurisdiction. A feature of the urbanized and transitioning/urban Generalized Tables is that two types of non-state

GENERALIZED PLANNNING ANALYSIS | 5.2 Special Aspects of the Generalized Tables
2009 FDOT QUALITY/LEVEL OF SERVICE HANDBOOK | 89
roadways are addressed: major city/county roadways and other signalized roadways. The only types of roadways not addressed in the tables are unsignalized local streets and unpaved roads.
The mere fact that roadways are operated and maintained by different governmental entities has no effect in the capacity or LOS of the roadways. The ARTPLAN software reflects that concept that ownership has no effect, only a facility’s roadway, traffic and control characteristics. However, in general, non-state roadways have lower capacities and service volumes than state facilities because they have lower green times at signalized intersections and that concept is reflected in the Generalized Tables.
Major city/county roadways
Major city/county roadways are streets not on the State Highway System that would be classified as an arterial roadway on a city/county major thoroughfare plan or similar planning document. These roadways have roadway, traffic and control characteristics similar to state roads classified as urban minor arterials.
The Generalized Tables contain a -10% adjustment factor for these roadways compared to state signalized arterials. This adjustment primarily reflects a difference in green time these facilities have compared to more typical state signalized roadways.
Other signalized roadways
A signalized roadway not on the State Highway System and also considered by the local government not to be a major city/county roadway is considered an “other signalized roadway”. Typically these roadways have appreciably lower green times accounting for the -35% adjustment factor appearing on the Generalized Tables.
HCM LOS criteria address arterials, rather than collectors or local streets. FDOT considers it appropriate for local governments to decide whether to analyze collectors as “major city/county roadways” or “other signalized roadways.”
Non-state uninterrupted flow
roadways
Uninterrupted flow facilities are analyzed the same, regardless of whether they are state facilities or not.
Unachievable levels of service
Higher quality levels of service for the automobile, bicycle and pedestrian modes may not be achieved, even with extremely low traffic volumes given the default values use in the Generalized Tables. In the case of automobiles, the higher quality levels of service cannot be achieved primarily because the control, or signalization, characteristics simply will not allow vehicles to attain relatively high average travel speeds. In the case of bicycles and pedestrians, it is primarily caused by the lack of facilities serving those modes. The “**” symbol and corresponding footnote reflect this “unachievable” concept. The “unachievable” concept and “**” symbol also apply to service volume tables generated in ARTPLAN.
Not applicable levels of service
Lower quality levels of service for the automobile, bicycle and pedestrian modes may not be applicable, even with extremely high traffic volumes given the default values used in the Generalized Tables. In the case of automobiles, the lower quality levels of service are not applicable primarily because the control characteristics simply do not allow enough vehicles to pass through an intersection in an hour. If vehicles could get through the intersection, they could obtain the applicable LOS

GENERALIZED PLANNNING ANALYSIS | 5.2 Special Aspects of the Generalized Tables
2009 FDOT QUALITY/LEVEL OF SERVICE HANDBOOK | 90
speed threshold, but there is not enough capacity at the intersection to let them pass through.
In the case of bicycles and pedestrians, it is primarily caused by the existence of facilities adequately serving those modes. For example, if a sidewalk exists, it is very difficult to establish a set of conditions in which the LOS to the pedestrian is F.
Essentially, once the maximum service volume is reached, the next LOS grade is F. For example, in Service Volume Table 1 for multilane Class I arterials, if demand volumes are greater than the LOS D threshold, then the LOS is F, and if the volume is at the LOS D threshold, the LOS is D; essentially LOS E does not exist. The “***” symbol and corresponding footnote reflect this “not applicable” concept. The “not applicable” concept and “***” symbol also apply to service volume tables generated in ARTPLAN. Alternatively, for the automobile mode it is acceptable to view the maximum service volume in a “***” cell as having the same value as the previous volume appearing on the service volume table.
Divided/undivided & turn lane adjustments
For simplicity, the Generalized Tables have intuitive factors that have been approved by the LOS Task Team, but not contained in the HCM, for the effects of mid-block medians and exclusive turn lanes at intersections on motorized vehicles. The cumulative effects of medians and exclusive turn lanes from common occurrences are shown in the Generalized Tables.
A median has the effect of changing the adjusted saturation flow rate or service volume by 5 percent. In Florida, most two-lane roadways do not have a median (e.g., a two-way left turn lane), so the tables assume no median for those facilities. However, if there is a median, appropriate volumes should be increased 5 percent. Most multilane arterials and highways in Florida have medians, so the tables are set up to assume medians for those facilities. However, if there is no median, appropriate volumes should be decreased 5 percent.
Most major roadways in Florida have exclusive left turn lanes at nearly all streets except those with very low volumes. If a roadway does not have left turn lanes at major intersections, its service volume drops appreciably as indicated in the table. Common design practice in Florida is to use shared thru/right turn lanes to accommodate right turning vehicles. However, exclusive right turn lanes have large capacity and service volume impacts for motorized vehicles at major intersections.
One-way facility adjustment
For simplicity, the urbanized and transitioning and urban Generalized Tables have an intuitive factor that has been approved by the LOS Task Team, but not contained in the HCM, for the effects of one-way streets on motorized vehicles. Essentially, one-way pairs are assumed to have a 20 percent higher service volumes than corresponding two-way roadways with the same number of lanes. However, the Generalized Tables treat each facility of a one-way pair as a separate facility. To account for that the volumes in the daily and hourly two-way Generalized Tables (1, 2, 4 and 5) should be multiplied by 0.6, while the volumes in the hourly directional tables (Tables 7 and 8) should be multiplied by 1.2.

GENERALIZED PLANNNING ANALYSIS | 5.2 Special Aspects of the Generalized Tables
2009 FDOT QUALITY/LEVEL OF SERVICE HANDBOOK | 91
Auxiliary lane adjustment
Freeway auxiliary lanes (lanes connecting on ramps and off ramps) usually have significant capacity and LOS benefits. The values contained in the tables indicate their importance in a general way. To apply the adjustment simply add the volume shown in the adjustment to the maximum service volume shown in the table.
Ramp metering adjustment
Freeway ramp metering has the positive benefit of smoothing out traffic demand entering a freeway during peak travel times. This positive benefit is reflected by increasing the volumes shown on the tables by 5 percent.
Off-peak directional volumes
Highway capacity and LOS analyses are typically based on an hourly peak directional analysis and it is generally incorrect to apply peak direction results to the off-peak direction. This is caused by the fact that some significant off-peak inputs (e.g., signal progression, g/C) may vary from the peak direction.
Bicycle LOS and motorized vehicle thresholds
Bicycle lanes and motorized vehicles primarily determine bicycle LOS, not the number of bicyclists.
The bicycle portions of the Generalized Tables make primary use of the two most important factors in determining the LOS for bicyclists: the existence of paved shoulders/bicycle lanes and motorized vehicle volumes. It is important to note that the volumes shown in the tables are not the number of bicyclists; rather they are the number of motorized vehicles in the outside lane. Unlike automobile LOS that is highly dependent on the number of other motorized vehicles on the roadway, bicycle LOS is not determined by how many other bicyclists are on road; rather, it is primarily determined by the bicycle accommodations on the roadway and volume of motorized vehicles. Default values are assumed for the other important factors such as speed of motorized vehicles, outside lane width, and pavement conditions, in establishing the bicycle LOS thresholds.
Three broad ranges of paved shoulder/bicycle lane percent coverage are provided: 0-49%, 50-84%, and 85-100%. The position reflected in the tables is that if a bicycle lane exists for less than 50% of the roadway facility, then no benefit is given to bicyclists. The interpretation of the 85-100% coverage is that a bicycle lane exists for the whole facility. Bicycle lane coverage of 50-84% is treated as if a bicycle lane exists over 50% of the facility. If a facility has a wide outside lane, the 50-84% category may be used because the benefit of a wide outside lane is approximately equal to 50% bicycle lane coverage. If the roadway does not have a wide outside lane over its whole length, no bicycle accommodation credit should be given.
The other factor used in the Generalized Tables is the volume of motorized vehicles in the outside lane. For analysis purposes, motorized vehicle volumes are assumed to be equally spread across the number of directional roadway lanes. Unlike the automobile entries on the table, in which the number of lanes is an entry into the tables, a step of multiplying the motorized volume by the number of lanes is needed in order to use the volume (hourly directional, hourly two-way, or daily) of motorized vehicles. For example, in Table 7, the LOS C threshold for 0% bicycle lane coverage is 170 vehicles for the outside lane. If the roadway has 4 lanes, then the 170 vehicles would be multiplied by 2 (number of directional lanes) in order to determine the maximum volume of motorized vehicles for bicycle LOS C in one direction of flow. The additional step was included to simplify the appearance of the tables and to save space.

GENERALIZED PLANNNING ANALYSIS | 5.2 Special Aspects of the Generalized Tables
2009 FDOT QUALITY/LEVEL OF SERVICE HANDBOOK | 92
Pedestrian LOS and motorized vehicle thresholds
Sidewalks and motorized vehicles primarily determine pedestrian LOS, not the number of pedestrians.
The pedestrian portions of the Generalized Tables make primary use of the two most important factors in determining the LOS for pedestrians: the existence of a sidewalk and motorized vehicle volumes. It is important to note that the volumes shown in the tables are not the number of pedestrians; rather, they are the number of motorized vehicles in the outside lane. Unlike automobile LOS that is highly dependent on the number of other motorized vehicles on the roadway, pedestrian LOS is not determined by how many other pedestrians use the facility; rather, it is primarily determined by the presence of sidewalks and the volume of motorized vehicles. Default values are assumed for the other important factors, such as sidewalk/ roadway separation, sidewalk/roadway protective barrier, and speed of motorized vehicles, in establishing the pedestrian LOS thresholds.
Three broad ranges of sidewalk coverage are provided: 0-49%, 50-84%, 85–100%. The position reflected in the tables is that if a sidewalk exists in the peak direction of traffic flow for less than 50% of the roadway facility, then no benefit is given to pedestrians. The interpretation of the 85-100% coverage is that a sidewalk exists for the whole facility. Sidewalk coverage of 50-84% is treated as if the facility has 50% coverage.
The other factor used in these tables is the volume of motorized vehicles in the outside lane. For analysis purposes, motorized vehicle volumes are assumed to be equally spread across the number of directional roadway lanes. Unlike the automobile entries on the table, in which the number of lanes is an entry into the tables, a step of multiplying the motorized volume by the number of lanes is needed in order to use the volume (hourly directional, hourly non-directional, or daily) of motorized vehicles. For example, in Table 7, the LOS C threshold for 100% sidewalk coverage is 590 vehicles for the outside lane. If the roadway has 4 lanes, then the 590 vehicles would be multiplied by 2 (number of directional lanes) in order to determine the maximum volume of motorized vehicles for pedestrian LOS C in one direction of flow. The additional step was included to simplify the appearance of the tables and to save space.
Sidewalk on only one side of a roadway
A two LOS grade difference is typical if the sidewalk is or is not on the same side as the peak traffic flow.
All of the techniques contained in this Handbook and accompanying software are based on a directional analysis. For example, in the case of evaluating the automobile LOS on arterials, the LOS is for the peak directional flow, and the off peak direction could have a higher, lower, or the same LOS. This directional technique results in some unique perspectives when evaluating pedestrian LOS. Unlike facilities (and buses) for the other modes, sidewalks, whether on one side or both sides of a road, serve pedestrians in both directions. Furthermore, analysts should be especially careful when using the Generalized Tables for determining pedestrian LOS when there is a sidewalk only on one side of the roadway. Because all the Generalized Tables are based on peak hour directional analyses, pedestrian LOS based on the tables should be considered applicable only to the direction of the peak flow of traffic. When using the tables, there is typically a difference of two LOS grades if the sidewalk is, or is not, on the same side of roadway as the peak flow of traffic. Generally, having sidewalks on both sides of arterials in developed areas is considered desirable; yet, the Generalized Tables do not adequately reflect that concept.
GENERALIZED PLANNNING ANALYSIS | 5.2 Special Aspects of the Generalized Tables
2009 FDOT QUALITY/LEVEL OF SERVICE HANDBOOK | 93
Bus LOS
Bus frequency and pedestrian accessibility determine bus LOS.
The bus portions of the Generalized Tables are primarily dependent on bus frequency, which is the number of scheduled fixed route buses that have a potential to stop in a given segment in the peak direction of flow in a 1 hour time period. That measure is supplemented by pedestrian accessibility. In the Generalized Tables, pedestrian accessibility is represented by two broad ranges of sidewalk coverage.
Unique aspects of bus values in tables
Volumes shown are the number of buses per hour in the peak direction.
There are three unique aspects of bus mode entries of the Generalized Tables.
First, it is important to note that the volumes shown in the tables are the number of buses per hour. Unlike automobile, bicycle and pedestrian LOS thresholds, the bus mode LOS thresholds are not related to the number of motorized vehicles on the roadway.
Second, regardless of the table used, all numbers are shown in terms of buses per hour only for the peak hour in the single direction of higher traffic flow. Thus, even in the daily urbanized table (Table 1), the threshold values shown are still in terms of peak hour directional buses.
Third, the daily urbanized table (Table 1) is the only table that incorporates the daily variable of bus span of service and excludes a planning analysis hour factor (K) and a directional distribution factor (D). Span of service becomes relevant when reporting on a daily basis because availability of transit becomes important if a passenger cannot use a bus for the return, or originating, trip.

PRELIMINARY ENGINEERING ANALYSIS | 6.1 Introduction
2009 FDOT QUALITY/LEVEL OF SERVICE HANDBOOK | 94
6 PRELIMINARY ENGINEERING ANALYSIS (LOSPLAN Software)
6.1 Introduction
Preliminary engineering (conceptual planning) is a type of application detailed enough to reach a decision on design concept and scope (e.g., 4 thru lanes with a raised median), conducting alternatives analyses (e.g., 4 thru lanes undivided versus 2 thru lanes with a two-way left turn lane), and performing other technical analyses. Preliminary engineering is applicable when there is a desire for a good determination of the LOS of a facility without doing detailed, comprehensive operational analyses, and for determining needs when a generalized planning evaluation is simply not accurate enough. Florida’s LOS planning software, which includes ARTPLAN, FREEPLAN, and HIGHPLAN, is the major tool in conducting this type of analysis. Although considered outstanding planning and preliminary engineering tools, the software programs are not detailed enough for final design or operational analysis work and should not be used for those purposes.
FDOT’s LOSPLAN software contains the core tools for site and project specific analyses in planning stages. Input and output documentation must be verifiable and approved by Districts and reviewing agencies. Guidance on obtaining acceptable data is contained in Chapter 3. In general, the software is based on the Highway Capacity Manual (HCM) [TRB, 2000] techniques, with ARTPLAN also based on the Transit Capacity and Quality of Service Manual (TCQSM) [TRB, 2002], Bicycle LOS Model [Landis, 1997], and Pedestrian LOS Model [Landis, 2001].
Specific applications of the LOSPLAN software include:
• Assessing capacity and LOS impacts from a development along a specific roadway;
• Assessing the existing LOS, deficiencies, and needs for the highway component of the Strategic Intermodal System (or other roadways);
• Assessing the existing LOS, deficiencies, and needs for multimodal facilities (e.g., routes leading to elementary schools);
• Conducting alternatives analysis for a specific roadway; and • Conducting project development and environmental studies (e.g., LOS,
vehicular operating speeds) for location and preliminary design approval.
To support these applications:
• Appropriate traffic, roadway and control (i.e., signalization) variables must be entered in the LOSPLAN software. The key software input variables are highlighted in blue, while many other inputs are defaulted to statewide values;
• The software must be appropriately applied (e.g., applying the right area type and facility type); and
• The analysis must be appropriately interpreted (i.e., using the results correctly).

PRELIMINARY ENGINEERING ANALYSIS | 6.1 Introduction
2009 FDOT QUALITY/LEVEL OF SERVICE HANDBOOK | 95
FDOT generally will accept outside analyses that utilize these accepted practices. Only at the discretion of the FDOT reviewer, will supplemental methods be allowed and only on a case by case basis. Reasons for such exceptions must be fully documented and justified.
Supplemental analyses Intermixing of generalized planning tools (Generalized Tables), preliminary engineering tools (LOSPLAN) and operational tools in a single analysis should be avoided. This also applies to congestion management systems. The level of analysis for a specific application (e.g., preliminary engineering) should be determined and then the appropriate tool (e.g., ARTPLAN) should be applied. However, depending upon the application it may be appropriate to supplement a level of analysis tool with another type of tool. For example, in assessing the impact of a proposed development along an arterial, ARTPLAN is usually the most appropriate tool; however, if it is desired to also analyze the signalized intersection leading directly into the development, it may be appropriate to use an operational tool (e.g., HCM/HCS). In this case, an HCS analysis may be provided for the signalized intersection leading into the development; however, it cannot substitute for or be used as input to the overall ARTPLAN analysis.
Rule 14-94 F.A.C. regarding Statewide Minimum LOS Standards (Chapter 8) states that when calculating LOS, all calculations and evaluations are to be based on those included in this Handbook, the HCM, or a methodology determined by FDOT as having comparable reliability. The only tools FDOT will officially accept and support for roadway analysis (auto) are the Generalized Service Volume Tables, LOSPLAN, and the HCM/HCS, each applied at the proper level of analysis. Operational analyses based on other tools (e.g., Synchro, CORSIM) may be submitted to FDOT for consideration, but FDOT reviewers are under no obligation to consider, review, or comment on such analyses. For transit, pedestrian, and bicycle capacity and LOS analyses, the only operational tools FDOT fully recognizes for planning applications are, respectively, the:
• Transit Capacity and Quality of Service Manual • Pedestrian LOS Model • Bicycle LOS Model
The Department also recognizes software applications which support these tools. Simplifying assumptions and planning extensions to these primary Q/LOS evaluation techniques are presented in Chapters 2.5 and 2.6.
Running LOSPLAN
Minimum requirements
The minimum requirements for running ARTPLAN, as well as the other LOSPLAN programs are the following:
• Pentium class processor (133 MHz or above) • 32 MB RAM • 10 MB of available hard drive space • Monitor capable of displaying 1024x768 resolution • Windows 98 or higher • Internet Explorer 5.0 or higher

PRELIMINARY ENGINEERING ANALYSIS | 6.1 Introduction
2009 FDOT QUALITY/LEVEL OF SERVICE HANDBOOK | 96
After the installation process, an ARTPLAN, FREEPLAN and/or HIGHPLAN icon should be present under the “Programs” or “All Programs” folder of the “Start” menu. Select the icon that corresponds to the program you wish to start.
Use of statewide defaults
A base situation with a set of defaults will appear when opening a program. For example, when FREEPLAN is opened, a Class III facility in an urbanized area and its statewide defaults appears. For the benefit of users, the programs have been structured so that changing area types and roadway classes will automatically call up a new set of statewide defaults. For example, if the analysis changes from an urbanized Class II arterial to a rural developed Class I facility, a new set of defaults reflecting that area and roadway type will automatically appear.
Getting help Each of the programs has a complete Help feature. Context sensitive help can be obtained by pressing the F1 key. A help topic will pop up corresponding to the input field that is currently selected. Additional help information can also be found under the Help dropdown menu found on the menu bar.
If additional help is needed, contact the applicable FDOT district or central office person listed in Chapter 9.
Printing results Printing operations utilize a technique that takes advantage of the capabilities of Microsoft’s Internet Explorer. For the printing capabilities to work properly within the programs, version 5.0 or higher of Internet Explorer must be installed on your computer. If version 5.0 or higher of Internet Explorer is not installed on your computer, you can obtain the most recent version from Microsoft (for free) at :
http://www.microsoft.com/windows/internet-explorer/download-ie.aspx
Reporting software bugs
Although FDOT is comfortable with the current level of performance and reliability of the programs, as with any new software release, it is expected that some “bugs” will be discovered once the programs experience extensive use. A software “bug” report form is on FDOT’s Quality/Level of Service website. Software users are encouraged to report any “bugs” to the FDOT personnel listed on the form.
Software patches FDOT intends to provide major “bug” fix updates, such as calculation errors, soon after they discovered. Minor “bug” fix updates and enhancements are planned to be done by June 2010. FDOT does not plan to provide any major changes to the software prior to 2012.
Calculation results
LOS and service volume
tables
The three software programs (ARTPLAN, FREEPLAN, HIGHPLAN) have two major LOS calculating features. First, each calculates the LOS for the facility being analyzed and also shows the calculated service measure (e.g., average travel speed, adjusted bus frequency) or score (e.g., bicycle LOS score). Second, each calculates three service volume tables: hourly volumes in the peak direction, hourly volumes in both directions, and annual average daily traffic volumes. It should be noted that all the service volume tables are actually based on the hourly volumes in the peak direction, with the other two tables presented in a different form for the benefit of users who work on an hourly two-way or daily basis.

PRELIMINARY ENGINEERING ANALYSIS | 6.1 Introduction
2009 FDOT QUALITY/LEVEL OF SERVICE HANDBOOK | 97
Screen layout In general the programs have:
• an opening screen; • a project properties screen, where items such as analysis period and analyst
name are specified; • an intersection and/or segment data input screen in which inputs applicable
to each intersection and/or segment are placed; • a LOS results screen in which LOS results for the facility and each segment
are shown; and • a service volume table screen in which maximum service volume tables
based on the previous input values are shown.
Depending upon the complexity of the specific programs, some screens may be combined (e.g., HIGHPLAN combines the input and LOS results screens) and some screens may be expanded (e.g., ARTPLAN includes a pedestrian subsegment screen). Tool buttons and tabs allow the analyst to proceed from one screen to another.
Calculation process
Statewide defaults automatically appear.
The programs use facility specific roadway, traffic and, in the case of ARTPLAN, control or signalization data. The programs apply the HCM, TCQSM, Bicycle LOS Model, and Pedestrian LOS Model calculation techniques to determine the LOS. After completing a couple of key project properties the programs implement a typical set of statewide defaults which appear on many subsequent screens. In general, the programs automatically calculate results upon entering input data. The calculation processes are illustrated in Figure 6–1, with FREEPLAN used in the example.
Figure 6–1 Freeway LOS and Service Volume Calculation Process
Volumes are outputs instead of inputs when developing service volume tables.
The general process of calculating maximum service volumes is to use all inputs, except for AADT, K, and D to determine LOS, the applicable service measure criteria, and then calculate volume instead of LOS. In other words, rather than solving for the LOS criterion given volume, the programs solve for volume given the LOS criterion. More detailed information on the service volume calculation process is provided in Chapter 6.5.

PRELIMINARY ENGINEERING ANALYSIS | 6.1 Introduction
2009 FDOT QUALITY/LEVEL OF SERVICE HANDBOOK | 98
Off peak directional analyses
Users are cautioned about making off peak directional analyses with the tools and software provided in this Handbook. All analyses are based on an hourly peak directional analysis. Therefore, it is usually incorrect to directly apply results to the off peak direction. For example, the service volumes produced for one direction are likely not applicable in the other direction. Nevertheless, if used carefully, the current programs can be used for hourly off peak directional analyses.
Current editions of ARTPLAN and FREEPLAN allow direct calculation of off-peak directional analyses. Nevertheless, users of ARTPLAN are cautioned about making off-peak directional analyses. Realistic inputs should be used in the off-peak direction and may be quite different than for the peak direction. For example, , good progression in the peak direction probably implies that progression is not good in the off peak direction; effective green ratios are likely to be less in the off-peak direction; and presence of a sidewalk on one side of the facility, but not the other.
HIGPHLAN does not include an off peak directional analysis. Especially problematic is the capacity of two-lane highways. According to the HCM the base saturation flow rate in the peak direction is 1700 pcphpl while the off peak direction is 1500 pcphpl. Furthermore, varying directional volumes have different effects on the ability to pass and time spent following other vehicles.
6.2 ARTPLAN
ARTPLAN was developed specifically for arterial planning and preliminary engineering applications.
ARTPLAN is FDOT’s multimodal planning and preliminary engineering software for signalized roadways. For the automobile mode, ARTPLAN is primarily used to analyze signalized roadways in which average travel speed is the service measure used to determine LOS. It is widely recognized as the primary planning software program implementing the HCM urban streets methodology (HCM Chapter 15). For the automobile mode, it may also be used for a simplified LOS analysis of the thru movement at a signalized intersection. For the bicycle mode, ARTPLAN is the preliminary engineering application of the Bicycle LOS Model methodology applied to roadway sections and facilities. For the pedestrian mode, ARTPLAN is the preliminary engineering application of the Pedestrian LOS Model methodology applied to roadway segments and facilities. For the bus mode, ARTPLAN is the preliminary engineering application of the TCQSM methodology applied to bus route segments and roadway facilities.
ARTPLAN is multimodal in structure.
ARTPLAN is multimodal in structure with the facility’s roadway, traffic and control characteristics calculated simultaneously to determine the LOS for the automobile, bicycle, pedestrian and bus modes. As quality of service of one mode improves, a positive, neutral or negative effect on the other modes may occur. For example, as running speed of automobiles increases, the LOS may improve for automobiles, but the LOS for bicyclists may decrease. Figure 6–2 provides an overview of how the modes and their levels of service are linked.

PRELIMINARY ENGINEERING ANALYSIS | 6.2 ARTPLAN
2009 FDOT QUALITY/LEVEL OF SERVICE HANDBOOK | 99
Figure 6–2 Simplified Multimodal Flow chart
LOSDetermination
PedestrianAutomobile Bicycle BusSidewalk
Control Characteristics
Control Delay
Volume & Lanes
HCM LOS Criteria
Major Inputs
Service Measure
Bicycle Lane Bus Frequency
Other Traffic & Roadway Characteristics
Volume & Lanes
Arterial Running Speed
Sidewalk
FDOT LOS Criteria
FDOT LOS Criteria
TCQSM LOS Criteria
Arterial Running Time
Pedestrian LOS Score
Average Travel Speed
Bicycle LOS Score
Adjusted Bus Frequency
As shown in the figure, the vehicular volume and number of lanes significantly
affect the automobile, bicycle and pedestrian levels of service. Other roadway and traffic variables, plus control or signalization variables, determine the automobile LOS. The motorized vehicle running speed, which is calculated as part of the automobile LOS, is also an important determinant of bicycle and pedestrian LOS. Together with the presence of bicycle lanes and sidewalks, motorized vehicle volume and speed are the main determinants of bicycle and pedestrian LOS. Bus LOS is primarily determined by bus frequency, but is also largely tied to pedestrian LOS.
LOS is calculated for each mode and not combined.
Noteworthy, ARTPLAN does not combine the LOS for each of the modes into one overall LOS for the facility because there is no professionally acceptable or scientifically valid technique for combining the LOS (see Chapter 1.4).
Pedestrian subsegments
Because many sidewalks are discontinuous or treatment may vary over a roadway segment, ARTPLAN features a more detailed pedestrian subsegment analysis. Up to 3 pedestrian subsegments are allowed for a given roadway segment. The percent of the segment’s length of each subsegment is entered. The program assumes there are no subsegments, so 100% appears until the analyst changes the value.
ARTPLAN input and output screens
ARTPLAN input and output screens appear in Figures 6–3 and 6–4.

PRELIMINARY ENGINEERING ANALYSIS | 6.2 ARTPLAN
2009 FDOT QUALITY/LEVEL OF SERVICE HANDBOOK | 100
Figure 6–3 ARTPLAN Input Screens
Project Properties
Pedestrian Subsegment Data
Auto Segment Data
Intersection Data
Multimodal Segment Data
INPUT SCREENS

PRELIMINARY ENGINEERING ANALYSIS | 6.2 ARTPLAN
2009 FDOT QUALITY/LEVEL OF SERVICE HANDBOOK | 101
Figure 6–4 ARTPLAN Output Screens
Maximum Service Volumes for Each Mode
Auto LOS
Bicycle, Pedestrian & Bus LOS

PRELIMINARY ENGINEERING ANALYSIS | 6.3 FREEPLAN
2009 FDOT QUALITY/LEVEL OF SERVICE HANDBOOK | 102
6.3 FREEPLAN
FREEPLAN was developed specifically for freeway planning and preliminary engineering applications.
FREEPLAN is FDOT’s planning and preliminary engineering software for freeways, multilane divided roadways with at least two lanes for exclusive use of traffic in each direction and full control of ingress and egress.
FREEPLAN features
LOS is based on density.
Capacity is reduced in interchange areas.
Results match well with Florida data.
Major features of FREEPLAN are:
• Use of the HCM (Chapter 22) as the primary resource document for the methodology, such that the FREEPLAN methodology should “not be inconsistent” with the HCM, but, as appropriate, extend the HCM for planning and preliminary engineering purposes;
• Concentration on the thru vehicle while being sensitive to the analysis of other vehicles on the freeway and on segments of the freeway;
• Rather than combining point analyses (e.g., ramps), the approach is structured towards combining segments (e.g., interchange areas, toll plaza influence areas);
• LOS density thresholds slightly lower than HCM basic segment criteria because of the effects of interchanges;
• Capacity reductions in interchange areas; • Analysis of auxiliary lanes at a preliminary engineering level; • A generalized treatment of ramp metering; • A simplified interchange ramp terminal capacity check; • Consideration of acceleration and deceleration lanes at least 1500 feet in
length; • Use of a “local adjustment factor” or driver population factor based
primarily on area type; and • Resulting volumes matching reasonably well with actual Florida traffic
counts.
Special aspects about operating FREEPLAN
Some special aspects about operating FREEPLAN are listed below:
• The interchange influence area consists of the length from the off ramp gore to on ramp gore, plus 1,500 feet extending from each gore. As a default, the typical interchange influence area is 1 mile consisting of 1,500 feet prior to the off ramp gore, 2,280 feet from gore to gore, and 1,500 feet past the on ramp gore;
• Basic segment influence areas are the same as the basic segment length; and
• AADT is entered into FREEPLAN for the first segment.
FREEPLAN input and output screens
FREEPLAN input and output screens appear in Figure 6–5.

PRELIMINARY ENGINEERING ANALYSIS | 6.3 FREEPLAN
2009 FDOT QUALITY/LEVEL OF SERVICE HANDBOOK | 103
Figure 6–5 FREEPLAN Input and Output Screens
Project Properties Segment Data
Level of Service Service Volume Table
OUTPUT SCREENS
INPUT SCREENS

PRELIMINARY ENGINEERING ANALYSIS | 6.4 HIGHPLAN
2009 FDOT QUALITY/LEVEL OF SERVICE HANDBOOK | 104
6.4 HIGHPLAN
HIGHPLAN is FDOT’s planning and preliminary engineering software for two-lane and multilane uninterrupted flow highways with points of access not fully controlled.
Two-lane or multilane selection
• Selection of the total number of lanes in both directions determines whether the facility will be analyzed as a two-lane or a multilane highway. The selection of either choice makes some variables irrelevant, such as % no passing zones for multilane highways.
• Embedded in the two-lane highway portion of HIGHPLAN are two different classes of two-lane highways, one for rural undeveloped areas and one for developed areas.
PTSF and ATS are used in rural undeveloped areas.
• In rural undeveloped areas, HIGHPLAN uses the HCM Class I LOS criteria, which is based upon percent time spent following (PTSF) and average travel speed (ATS) service measures
Percent of free flow speed is used in developed areas to determine LOS.
• In developed areas (urbanized, transitioning/urban, rural developed area types), HIGHPLAN implements LOS thresholds based on percent of free flow speed. FDOT’s position is that the most relevant service measure for motorists on two-lane highways in developed areas is to maintain a “reasonable” speed, instead of the HCM’s primary service measure of percent time spent following. Drivers in developed areas primarily base their LOS on how close their travel speed is relative to the free flow speed and not so much based on the ability to pass.
All performance measures are shown.
• After pressing the LOS calculation button, the results are shown with six performance measures: percent time spent following, average travel speed, percent free flow speed, free flow delay, LOS threshold delay, and v/c.
Bicycle, pedestrian and bus analyses along uninterrupted flow highways should be based on ARTPLAN.
When conducting a bicycle, pedestrian, or bus LOS analysis along an uninterrupted flow highway, ARTPLAN should be used instead of HIGHPLAN. In its present form, HIGHPLAN only addresses the LOS of motorized vehicles. Primarily by using very low signal densities, ARTPLAN can approximate multimodal results as if HIGHPLAN had multimodal features. The bicycle service volumes in the rural undeveloped portions of Tables 3, 6 and 9 were generated in that manner.
HIGHPLAN input and output screens
HIGHPLAN input and output screens appear in Figure 6–6.

PRELIMINARY ENGINEERING ANALYSIS | 6.4 HIGHPLAN
2009 FDOT QUALITY/LEVEL OF SERVICE HANDBOOK | 105
Figure 6–6 HIGHPLAN Input and Output Screens
Project Properties
Service Volume Table
Highway Data & LOS Results

PRELIMINARY ENGINEERING ANALYSIS | 6.5 Service Volume Calculation
2009 FDOT QUALITY/LEVEL OF SERVICE HANDBOOK | 106
6.5 Service Volume Calculation Process
All service volumes and resulting tables are first calculated for the peak hour peak direction. The peak hour two-way values are obtained by dividing the peak hour peak direction service volumes by the directional distribution factor (D). The daily volumes are obtained by dividing the peak hour two-way service volumes by the planning analysis hour factor (K).
Peak hour directional and peak hour two-way service volumes are rounded to the nearest 10 vehicles. Daily service volumes are rounded to the nearest 100 vehicles.
ARTPLAN
For the automobile mode ARTPLAN starts with a volume of 10 vph and then calculates the demand to capacity ratio (v/c) at each intersection. Then it finds the speed on each segment and the overall average speed for the facility Then it checks that average speed against the average speed criterion for LOS A. If the speed is below the LOS A threshold speed, the volume is incremented by either 50 vph (if the difference in actual speed and LOS threshold speed is large) or 10 vph (if the difference in actual speed and LOS threshold speed is small). This process is repeated until the average facility speed is approximately equal to the LOS A threshold. The volume level at which this occurs is then the service volume for LOS A. The volume (i.e., LOS A service volume) is then incremented by 10 vph and incrementally increased until the average facility speed is approximately equal to the LOS B threshold speed. This process repeats for LOS C, D, and E. If at any point during this process the v/c ratio exceeds 1.0 for the full hour (i.e., v/c > 1/PHF), the calculation stops. If that condition is met, this volume becomes the service volume for whichever LOS letter grade was being evaluated at the time, and also for the lower quality LOS grades as well.
For the bicycle and pedestrian modes ARTPLAN starts with a volume of 25 motorized vehicles per hour and then calculates bicycle/pedestrian LOS scores based on the Bicycle and Pedestrian LOS Models. Then it checks that score against the LOS A criterion. If the score is below the LOS A threshold value, the volume is incremented by 10 vph. This process is repeated until the facility score is approximately equal to the LOS A threshold. The volume level at which this occurs is then the service volume for LOS A. The volume (i.e., LOS A service volume) is then incremented by 10 vph and incrementally increased until the average facility score is approximately equal to the LOS B threshold volume. This process repeats for LOS C, D, and E. If at any point during this process the motorized vehicle v/c ratio exceeds 1.0 for the full hour (i.e., v/c > 1/PHF), the calculation stops. If that condition is met, this volume becomes the service volume for whichever LOS letter grade was being evaluated at the time, and also for the lower quality LOS grades as well.
For the bus mode ARTPLAN uses the LOS service frequency criteria that appear in the Transit Capacity and Quality of Service Manual (Exhibit 6-5) modified by pedestrian LOS, roadway crossing and bus span of service adjustment factors appearing in Chapter 2.6 of this Q/LOS Handbook.
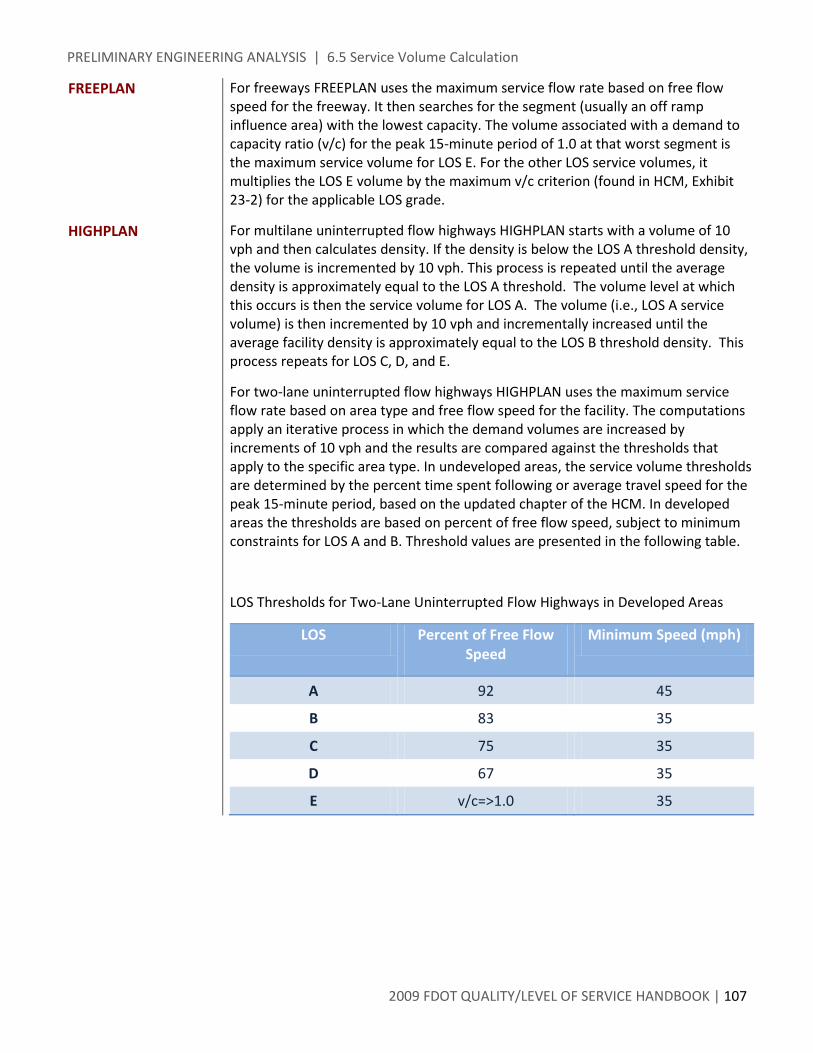
PRELIMINARY ENGINEERING ANALYSIS | 6.5 Service Volume Calculation
2009 FDOT QUALITY/LEVEL OF SERVICE HANDBOOK | 107
FREEPLAN For freeways FREEPLAN uses the maximum service flow rate based on free flow speed for the freeway. It then searches for the segment (usually an off ramp influence area) with the lowest capacity. The volume associated with a demand to capacity ratio (v/c) for the peak 15-minute period of 1.0 at that worst segment is the maximum service volume for LOS E. For the other LOS service volumes, it multiplies the LOS E volume by the maximum v/c criterion (found in HCM, Exhibit 23-2) for the applicable LOS grade.
HIGHPLAN For multilane uninterrupted flow highways HIGHPLAN starts with a volume of 10 vph and then calculates density. If the density is below the LOS A threshold density, the volume is incremented by 10 vph. This process is repeated until the average density is approximately equal to the LOS A threshold. The volume level at which this occurs is then the service volume for LOS A. The volume (i.e., LOS A service volume) is then incremented by 10 vph and incrementally increased until the average facility density is approximately equal to the LOS B threshold density. This process repeats for LOS C, D, and E.
For two-lane uninterrupted flow highways HIGHPLAN uses the maximum service flow rate based on area type and free flow speed for the facility. The computations apply an iterative process in which the demand volumes are increased by increments of 10 vph and the results are compared against the thresholds that apply to the specific area type. In undeveloped areas, the service volume thresholds are determined by the percent time spent following or average travel speed for the peak 15-minute period, based on the updated chapter of the HCM. In developed areas the thresholds are based on percent of free flow speed, subject to minimum constraints for LOS A and B. Threshold values are presented in the following table.
LOS Thresholds for Two-Lane Uninterrupted Flow Highways in Developed Areas
LOS Percent of Free Flow Speed
Minimum Speed (mph)
A 92 45
B 83 35
C 75 35
D 67 35
E v/c=>1.0 35

MAXIMUM ACCEPTABLE CAPACITY VOLUMES | 7.1 Maximum acceptable capacity
2009 FDOT QUALITY/LEVEL OF SERVICE HANDBOOK | 108
7 MAXIMUM ACCEPTABLE CAPACITY VOLUMES
Use of highway capacity and LOS tools, whether applied appropriately or not, has resulted in projected traffic volumes beyond normal capacity ranges found on Florida facilities. The causes are many-fold, but to aid analysts and reviewers on what capacity values will normally be acceptable, FDOT the following guidance. These values are based on site specific freeway studies and counts, and arterial maximum acceptable thru movement effective green ratios (g/C). For the benefit of users conducting LOS analyses, FDOT’s updated LOSPLAN programs will automatically check capacity and provide warnings and messages if acceptable capacities are exceeded. (Note: Under most circumstances the maximum service volume for LOS E equals capacity.)
7.1 Maximum Acceptable Capacity Volumes for Facilities
For arterial facilities the maximum generally acceptable per lane approach volumes are as follows:
• Large urbanized – 1,000 vehicles per hour per lane (vphpl) • Other urbanized – 950 vphpl • Transitioning – 920 vphpl • Urban – 920 vphpl • Rural – 850 vphpl
Note: arterial segments and sections may have higher values.
For freeway facilities and sections, the maximum generally acceptable volumes are as follows:
• Large urbanized – 2,100 vphpl (1900 vphpl if oversaturated) • Other urbanized – 2,000 vphpl (1900 vphpl if oversaturated) • Transitioning – 1,900 vphpl • Urban – 1,800 vphpl • Rural – 1,800 vphpl
For highway (generally uninterrupted flow highways) segments, the maximum generally acceptable per lane approach volumes are as follows:
• Two-lane o Developed – 1,600 vphpl o Undeveloped – 1,500 vphpl
• Multilane o Developed – 1,850 vphpl o Undeveloped – 1,600 vphpl

MAXIMUM ACCEPTABLE CAPACITY VOLUMES | 8 Florida’s Planning LOS Standards
2009 FDOT QUALITY/LEVEL OF SERVICE HANDBOOK | 109
7.2 Other Capacity Considerations
Special arterial and highway considerations
Maximum volumes for arterial and highway segments may vary due to widely varying effective green to cycle length ratios (g/C), turning movements at intersections, and the segmentation of roadways.
For arterials, the maximum volumes shown represent a weighted g/C of approximately 0.50, which is the average of the critical g/C and the average of all other g/Cs along an arterial facility. Typically there will be at least one principal arterial intersecting an arterial being analyzed. Such intersections are usually the critical intersections (“hot spots”) for an arterial analysis and g/C ratios for the thru movements are in the range of about 0.40. Although these intersections are frequently flared out to achieve greater capacity, the thru movement g/C ratios cannot increase appreciably if all intersection movements are included. Therefore, the use of a 0.50 g/C ratio for determining the capacity of an arterial should represent the upper bounds of what can be reasonably expected.
Arterial facility analyses typically involve intersecting principal arterials, but section analyses may not. Under these circumstances, arterial thru movements during peak travel hours may feature g/C ratios in the 0.50 to 0.60 range. Such values may be appropriate for segment or section analyses; however, use of such high g/C ratios is not normally acceptable for a facility analysis and may represent inappropriate segmentation of roadways.
Another situation in which g/C ratios may be above 0.50 is in the outlying parts of urbanized areas or in transitioning areas for both arterials and generally uninterrupted flow highways. Typically signals have been recently installed and side traffic hasn’t reached the high levels that it will in future years. Therefore, although current maximum volumes per lane may be higher than those shown above, in the future such values will likely not be sustained and should be avoided in the arterial analysis.
Special freeway considerations
FDOT’s preliminary engineering software for freeway analyses (FREEPLAN) features 3 new operational freeway characteristics that may result in volumes higher than those shown above: auxiliary lanes, ramp metering, and extension of acceleration/ deceleration lanes,
Auxiliary lanes (lanes connecting on ramps and off ramps) can have significant LOS and capacity benefits for freeways. The benefit depends primarily on the volumes entering/exiting the freeway facility and also upon the length of the lanes. The values shown above apply only to the thru lanes. The capacity of the auxiliary lanes and their volumes should be treated separately.
In general, implementation of ramp metering and extension of acceleration/ deceleration lanes will have a 5% or less improvement on capacity. No special consideration is given to those two types of possible improvements in the maximum generally acceptable volume per lane values shown above.

MAXIMUM ACCEPTABLE CAPACITY VOLUMES | 8 Florida’s Planning LOS Standards
2009 FDOT QUALITY/LEVEL OF SERVICE HANDBOOK | 110
Compatibility of software results with maximum acceptable capacity volumes
The FDOT supported and statewide acceptable capacity and LOS analysis tool for conceptual planning (preliminary engineering) is FDOT’s LOSPLAN software (ARTPLAN, FREEPLAN, HIGHPLAN). Reflecting the importance of Florida’s capacity volumes, the LOSPLAN programs have been updated to feature warnings and messages about exceeding these volumes.
FDOT will accept Highway Capacity Software (HCS) [McTrans, 2009a] operational analyses if they are appropriate to supplement LOSPLAN analyses. However, a separate check of HCS results to insure they do not exceed the maximum volumes must be conducted. The HCS capacity results and other LOS threshold values should be adjusted to meet Florida’s maximum acceptable capacity volumes. Of special note, is the HCS’s analysis of freeways. Applying the HCM directly results in higher volumes than typically seen on Florida and other U.S. freeways. If FDOT allows a different analytical tool to supplement LOSPLAN analyses, the results of those tools also should be checked to insure they do not exceed the Florida maximum acceptable capacity volumes.
Approval of volumes higher than typical Florida maximum acceptable capacity volumes
FDOT Districts and Central Office are expected to routinely reject analyses with higher facility volumes than shown above. Nevertheless, properly conducted highway capacity and LOS analyses may occasionally indicate capacities higher than the maximum acceptable capacity values. Under such circumstances the following approval processes apply.
If the facility being analyzed is not part of the Strategic Intermodal System (SIS), a SIS connector, part of the Florida Intrastate Highway System (FIHS) or a Transportation Regional Incentive Program (TRIP) roadway, FDOT District LOS Coordinators have the authority to approve higher volumes if they believe such volumes are representative of specific roadway conditions. However, they are under no obligation to do so, and may routinely submit these analyses to the FDOT’s Central Office LOS Unit for review. If the analysis is for a SIS or other facility listed above, FDOT districts are expected to seek concurrence with the Central Office LOS Unit before approving such high capacity volumes. Only an FDOT district may submit a request to the Central Office LOS unit for approval of higher volumes.
Inappropriate use of volume to capacity (v/c) ratios for LOS
As discussed in Chapter 3.6 (volumes and AADT) demand volumes should be used, not necessarily measured volumes, to determine volume to capacity (v/c)ratios for LOS calculation for concurrency and other growth management topics. Furthermore, capacity analysis is based on hourly or sub-hourly time periods, such that “daily volume to capacity ratios” are meaningless. Volume to capacity ratios are only appropriate during hourly or sub-hourly periods.

FLORIDA'S PLANNING LOS STANDARDS | 8 Florida’s Planning LOS Standards
2009 FDOT QUALITY/LEVEL OF SERVICE HANDBOOK | 111
8 FLORIDA’S PLANNING LOS STANDARDS
For planning purposes, FDOT has adopted statewide minimum LOS standards for roadway facilities in Rule 14-94.003, F.A.C. as shown in Table 8-1. In 2009 state legislation passed altering some of the requirements for local governments to establish LOS standards for state transportation facilities. Note, where FDOT’s current Rule Chapter 14-94 requirements conflict with state law, the provisions of law supersede.
Table 8-1 Statewide Minimum LOS Standards
SIS and FIHS facilities TRIP funded facilities and other State roads
Limited Access Highway (Freeway)
Controlled Access Highway Other Multilane Two-Lane
Rural Areas B B1 B C
Transitioning Urbanized Areas, Urban Areas, or Communities
C C C C
Urbanized Areas under 500,000 C(D) C D D
Urbanized Areas over 500,000 D(E) D D D
Roadways parallel to exclusive transit facilities E E E E
Inside TCMAs D(E) 2 E2 –2 –2
Inside TCEAs2 and MMTDs2 –2 –2 –2 –2
Level of service standards inside of parentheses apply to general use lanes only when exclusive thru lanes exist. 1. For rural two-lane facilities, the standard is C. 2. Means the Department must be consulted as provided by Section 163.3180(5), (7), or (15), Florida Statutes, regarding level of
service standards set on SIS or TRIP facilities impacted by TCMAs, MMTDs, or TCEAs respectively.
NOTE: Level of service letter designations are defined in the Department’s latest Quality/Level of Service Handbook.
Specific assumptions and restrictions that apply to these minimum LOS standards are: (a) The minimum LOS standards represent the lowest acceptable operating conditions in the peak hour. (b) Definitions and measurement criteria used for the minimum LOS standards can be found in the latest Transportation Research
Board's Highway Capacity Manual. (c) When calculating or evaluating level of service pursuant to this rule, all calculations and evaluations shall be based on the
methodology contained in the latest Transportation Research Board's Highway Capacity Manual, the Department's latest Quality/Level of Service Handbook, or a methodology determined by the Department to be of comparable reliability. Any methodology superseded by the Highway Capacity Manual, such as a methodology based on the 1997 Highway Capacity Manual or Circular 212, shall not be used.
Minimum LOS Standards for SIS Connectors and TRIP Funded Facilities are:
(a) Minimum LOS Standards for SIS Highways. 1. Limited access SIS highways shall adhere to the limited access FIHS LOS standards. 2. Controlled access SIS highways shall adhere to the controlled access FIHS LOS standards. 3. These standards shall apply regardless whether the facility is FIHS, SHS, or under other jurisdiction.
(b) Minimum LOS Standards for SIS Connectors. The minimum LOS standard for SIS connectors shall be LOS D.

FLORIDA'S PLANNING LOS STANDARDS | 8.1 Applicability of Standards
2009 FDOT QUALITY/LEVEL OF SERVICE HANDBOOK | 112
8.1 Applicability of Standards
Applicable to FDOT planning
The LOS standards were recently updated in April 2009. The rule is intended to promote public safety and general welfare, ensure the mobility of people and goods, and preserve the facilities on the State Highway System (SHS) SIS, and facilities funded by the TRIP. The standards are to be applied to FDOT’s planning activities. Unless otherwise provided by law, the minimum LOS standards for the SIS, FIHS, and facilities funded by the TRIP will be used by FDOT in review of local government comprehensive plans, assessing impacts related to developments of regional impact (DRI), and assessing other developments affecting the SIS, FIHS, and roadways funded by the TRIP.
Chapter 2009-96, Laws of Florida, amended the requirements for local governments to establish and maintain LOS standards for transportation facilities in certain designated areas. Local governments must adopt and maintain the FDOT LOS standards for the Strategic Intermodal System (SIS) outside Transportation Concurrency Exception Areas (TCEAs), regardless of the type of funding used for the SIS or its designation as a Transportation Regional Incentive Program (TRIP) funded roadway. For all other FIHS and TRIP funded roadways that are not part of the SIS, local governments may establish their own standards for these transportation facilities.
The new law also relieves local government’s from the requirement to achieve and maintain level of service standards for transportation in TCEAs, s. 163.3177(3)(f), F.S. In TCEAs created by s. 163.3180(5)(b), F.S., local governments no longer have to consult with FDOT on impacts to the SIS and TRIP funded roadways. In TCEAs designated under s. 163.3180(5)(b)7., F.S., local governments must continue to consult with the state land planning agency and FDOT to assess impacts on adopted level of service standards established for regional transportation facilities identified in the Strategic Regional Policy Plan, including SIS and TRIP funded roadways, and provide a plan for mitigation of impacts to the SIS.
The LOS standards designate the lowest quality operating conditions acceptable for the 100th highest volume hour of the year, from the present through the planning horizon, generally up to 20 years. The 100th highest hour approximates the typical weekday peak hour during the peak season in developed areas. Thus, it can be thought of as the typical drive during “rush” hour in an area’s peak season. The LOS standards in this Handbook are based on the 100th highest hour for planning purposes. The 30th highest hour, or design hour, remains effective for design purposes.
The standards require all LOS determinations be based on the latest edition of the Highway Capacity Manual (HCM) [TRB, 2000], this FDOT Q/LOS Handbook or a methodology determined by FDOT as having comparable reliability. There are only two FDOT supported highway capacity and LOS analysis tools for planning and preliminary engineering: FDOT’s Generalized Service Volume Tables and FDOT’s LOSPLAN software. These two tools form the core for all FDOT’s highway capacity and LOS analyses and reviews in planning stages.
FLORIDA'S PLANNING LOS STANDARDS | 8.1 Applicability of Standards
2009 FDOT QUALITY/LEVEL OF SERVICE HANDBOOK | 113
Area types
Area boundary
smoothing
The area and roadway types in the LOS standards match well with FDOT’s Generalized Tables appearing at the end of this Handbook; however, subtleties exist on delineation of areas. The first part of Chapter 3.5 of this Handbook addresses area types.
While the standards are applicable at the facility and section levels, there may be small lengths of roadways (e.g., 2 miles) between area types which from a logical and analytical perspective should be combined into one area type or another. This situation typically happens in transitioning areas, but may also occur elsewhere. FDOT District LOS Coordinators (Chapter 9) should be consulted for applicable boundaries within their districts.
Future years For development reviews, FDOT’s LOS standards and area types remain effective throughout the project's planning horizon. For example, in FDOT’s review of a proposed multi-phase development the same standards and area types would be used regardless of the amount of development anticipated over time. The only time the applicable standards may change is when the development order conditions provide for a reevaluation of transportation impacts for subsequent phases of development. The change in LOS standards may result from an official change in designation (e.g., Census update, rule change, variance).
Signalized intersection analyses
The logical extension of applying the LOS standards to point analyses is to apply the applicable standards to the thru movement of the roadway. For example, for a site impact analysis if the LOS standard for an arterial is “D”, then the thru movement at the intersection should also be “D”. However, while sound in concept, it is usually possible to acheive a desired LOS for an intersection approach if the other approaches are ignored. Therefore, if an operational analysis of a signalized intersection is part of a planning study, the operational analysis should be conducted with HCS for the entire intersection with appropriate traffic volumes and other inputs for each approach. No intersection approach should fall below its established LOS standard. If there is no LOS standard, the approach should not have a volume to capacity ratio in excess of 1.0 for the full hour. The segment and the relevant intersection approaches must operate at acceptable levels of service. Other techniques exist for analyzing signalized intersections in planning studies, so District LOS Coordinators (Chapter 9) should be consulted for specific techniques and acceptable values in their districts.
If a detailed point analysis is performed, the applicant must demonstrate ample left turn storage. Any actual turning movement counts can only be used to determine the percentage of the approach turning left, not the actual number of turning vehicles as this number can be constrained and not representative of a demand volume.

FLORIDA'S PLANNING LOS STANDARDS | 8.1 Applicability of Standards
2009 FDOT QUALITY/LEVEL OF SERVICE HANDBOOK | 114
SIS connectors FDOT’s LOS standard for SIS connectors is D. From a highway system structure these connectors cover a full range of roadway types varying from points (intersection movements), individual subsegments (ramps), segments, sections, and facilities, and frequently involve more than one roadway. FDOT does not routinely monitor or report LOS for SIS connectors unless they conform to appropriate facility or section length criteria for a roadway. In these cases LOSPLAN is an appropriate measurement tool. To evaluate the LOS of a SIS connector at a point level, the Highway Capacity Software (HCS) is the recommended tool. If a signalized intersection of a SIS connector is being evaluated, the LOS D standard applies to the applicable movement, with the recommendation that all other movements are adequately addressed for the operation of the intersection.
8.2 Concepts of Underlying Standards
The standards include the following major concepts:
• the different level of importance of the Florida Intrastate Highway System and other state roads;
• the different roles (i.e., mobility versus access) provided by state facilities (i.e., Florida Intrastate Highway System versus other state roads);
• the direct correlation between urban size and acceptance of some highway congestion as a tradeoff for other urban amenities;
• encouraging growth in existing developed areas; and • recognition of the interaction between highways and exclusive transit
systems serving commuters.

SOURCES FOR ADDITIONAL INFORMATION
2009 FDOT QUALITY/LEVEL OF SERVICE HANDBOOK | 115
9 SOURCES FOR ADDITIONAL INFORMATION
Initial contacts should be made with FDOT district planning personnel.
FDOT welcomes questions and comments on the content and concepts of this Handbook and accompanying software. FDOT can provide assistance in interpretations, answering questions, providing advice, and training. Initial contacts should be made with FDOT district planning personnel.
District LOS Coordinators
District 1 – Bartow Carl Metz 863-519-2343 [email protected] District 2 – Jacksonville Urban Office Thomas Hill (904) 360-5647 [email protected] District 3 – Chipley Glenda Duncan (850) 638-0250 [email protected] District 4 – Ft. Lauderdale Chon Wong (954) 777-4659 [email protected] District 5 – DeLand Terry Rains (386) 943-5320 [email protected] District 6 – Miami Ken Jeffries (305) 470-6736 [email protected] District 7 – Tampa Waddah Farah (813) 975-6440 [email protected] Turnpike Kim Samson (954) 934-1106 [email protected]

SOURCES FOR ADDITIONAL INFORMATION
2009 FDOT QUALITY/LEVEL OF SERVICE HANDBOOK | 116
Central Office Contact For Central Office coordination contact: Gina Bonyani, [email protected] (850) 414-4707
FDOT’s Q/LOS Website
For further information also see FDOT’s planning LOS website at:
http://www.dot.state.fl.us/planning/systems/sm/los/default.shtm
FDOT consultants FDOT makes extensive use of consultants for development and review of capacity and LOS analyses. In order to assure consistent application and review of capacity and LOS analyses across the state, the following guidance is provided:
FDOT consultant training
Consultants working for FDOT, who perform LOSPLAN analyses or reviews for the Department, must attend a FDOT training class on the use of LOSPLAN. In extenuating circumstances, these consultants can be trained in-house on a one-to-one basis, but their work must be carefully checked to ensure that they have mastered the program. Those trained in this manner should attend a training class at the earliest possible opportunity.
If consultants are working with LOSPLAN for non-FDOT clients, it is highly recommended their firms have at least one person in each office attend an FDOT training class. They in turn can make sure that those in their office are trained in its use. These additional users can either attend a training class or be taught in house.
Training schedules can be found on the FDOT Systems Planning LOS website.
In addition anyone who downloads LOSPLAN is entered into the FDOT Contact Database. Training announcements will be periodically e-mailed to those who download the software.
Although no certification process is proposed, FDOT District LOS Coordinators have the authority to determine whether consultants have met this training requirement.

GLOSSARY
2009 FDOT QUALITY/LEVEL OF SERVICE HANDBOOK | 117
10 GLOSSARY
Note: Italicized words and phrases are defined in this glossary.
Acceleration lane – A freeway lane extending from the on ramp gore to where it’s taper ends.
Acceptable range – The limits of input values for use in FDOT’s preliminary engineering software.
Accessibility – The dimension of mobility that addresses the ease in which travelers can engage in desired activities.
Accuracy – The degree of a measure’s conformity to a true value.
Actuated – Same as actuated control.
Actuated control – All approaches to the signalized intersection have vehicle detectors with each phase subject to a minimum and maximum green time and some phases may be skipped if no vehicle is detected.
Add-on/drop-off lanes – Roadway lanes added before an intersection and dropped after the intersection.
Adjacent – In this Handbook a categorization of sidewalk/roadway separation less than or equal to 3.0 feet.
Adjusted bus frequency – In this Handbook the bus frequency times adjustment factors that account for pedestrian LOS, pedestrian crossing difficulty, obstacles to bus stops, and span of service.
Adjusted capacity – In this Handbook the base capacity times the effect of many roadway variables and traffic variables.
Adjusted frequency – Same as adjusted bus frequency.
Adjusted saturation flow rate
–
In this Handbook the base saturation flow rate times the effect of many roadway variables and traffic variables.
Adjustment factor – In the software a multiplicative factor applied to the base saturation flow rate to represent a prevailing condition.
In the Generalized Tables additive or multiplicative factors to adjust service volumes.
All way stop control – An intersection with stop sign at all approaches.
Analysis type – In HIGHPLAN a choice between a facility analysis or a segment analysis.
Annual average daily traffic (AADT)
–
The volume passing a point or segment of a roadway in both directions for 1 year divided by the number of days in the year.
Approach – The set of lanes comprising one leg of an intersection or interchange.
Approach delay – The sum of stopped-time delay and the time lost in decelerating to a stop and accelerating to a steady speed.
Area type – In this Handbook a general categorization of an extent of surface based primarily on the degree of urbanization.
Areawide analysis – An evaluation within a geographic boundary.
Arrival type – A general categorization of the quality of signal progression.
Arterial – 1) A signalized roadway that primarily serves thru traffic with average signalized intersection spacing of 2.0 miles or less.
A state facility that is not on freeway.
A type of roadway based on FDOT functional classification.
ARTPLAN – FDOT’s arterial planning software for calculating level of service and service volume tables for interrupted flow roadways.
ATS – Same as average travel speed.

GLOSSARY
2009 FDOT QUALITY/LEVEL OF SERVICE HANDBOOK | 118
Auto – Same as automobile.
Auto outside lane width – Same as outside lane width.
Automobile
– 1) A motorized vehicle with 4 or less wheels touching the pavement during normal operation.
2) In this Handbook, all motorized vehicle traffic using a roadway, except for buses.
Auxiliary lane – An additional lane on a freeway connecting an on ramp of one interchange to the off ramp of the downstream interchange.
Average daily traffic – The total traffic volume during a given time period (more than a day and less than a year) divided by the number of days in that time period.
Average travel speed (ATS)
–
The facility length divided by the average travel time of all vehicles traversing the facility, including all stopped delay times.
Base capacity – Same as base saturation flow rate for uninterrupted flow roadways.
Base conditions – The best possible characteristic in terms of capacity for a given type of facility.
Base saturation flow rate – The maximum steady flow rate, expressed in passenger cars per hour per lane, at which passenger cars can cross a point on interrupted flow roadways.
Basic segment – In this Handbook the length of a freeway in which operations are unaffected by interchanges.
Bicycle – A mode of travel with two wheels in tandem, propelled by human power.
Bicycle lane – In this Handbook a designated or undesignated portion of roadway for bicycles adjacent to motorized vehicle lanes.
Bicycle LOS Model – The operational methodology from which this Handbook’s bicycle quality/level of service analyses are based.
Bicycle level of service score
– A numerical value calculated by the Bicycle LOS Model that corresponds to a bicycle level of service.
Bicycle pavement condition
– Same as pavement condition.
BLOS – Same as bicycle level of service score.
Boundaries – In this Handbook the geographical limits associated with FDOT’s Statewide Minimum Level of Service Standards for the State Highway System or its MPO Administrative Manual.
Bus – In this Handbook a self-propelled, rubber-tired roadway vehicle designed to carry a substantial number of passengers and traveling on a scheduled fixed route.
Bus frequency – The number of buses which have a potential to stop on a given segment in one direction of flow in a one hour time period.
Bus span of service – The number of hours in a day of bus service along a route segment.
Bus stop – An area where bus passengers wait for, board, alight, and transfer.
Capacity – The maximum sustainable flow rate at which persons or vehicles reasonably can be expected to traverse a point or a uniform section of roadway during a given time period under prevailing conditions.
As typically used in this Handbook, the maximum number of vehicles that can pass a point in a one hour time period under prevailing roadway, traffic and control conditions.
Capacity analysis – Same as highway capacity analysis.
Capacity constrained – A condition in which traffic demand exceeds the capacity of a roadway.
Class – Same as roadway class.

GLOSSARY
2009 FDOT QUALITY/LEVEL OF SERVICE HANDBOOK | 119
Collector – A roadway providing land access and traffic circulation with residential, commercial and industrial areas.
Community – In this Handbook outside of an urban or urbanized area, an incorporated place or a developed but unincorporated area with a population of 500 or more identified in the appropriate local government comprehensive plan.
Conceptual planning – Same as preliminary engineering.
Concurrency – A systematic process utilized by local governments to ensure that new development does not occur unless adequate infrastructure is in place to support growth.
Congestion – Condition in which traffic demand approaches or exceeds the available capacity of the transportation facility(ies).
Constrained – Same as capacity constrained.
Constrained roadway – A roadway on the State Highway System that FDOT will not expand by 2 or more thru lanes because of physical, environmental, or policy constraints.
Continuous left turn lane – Same as two-way left-turn lane.
Control – A variable or characteristic typically associated with a traffic signal.
A variable or characteristic associated with a stop sign, yield sign, flashing device and other similar measures.
Control characteristics – Same as control.
Control delay – The component of delay that results when a signal causes traffic to reduce speed or to stop.
Control type – Same as signal type.
Control variables – Parameters associated with roadway controls.
Controlled access highway
–
A non-limited access highway whose access connections, median openings, and traffic signals are highly regulated.
Corridor – A set of essentially parallel transportation facilities for moving people and goods between two points.
Critical intersection – Same as critical signalized intersection.
Critical signalized intersection
– The signalized intersection with the lowest volume to capacity ratio (v/c), typically the one with the lowest effective green ratio (g/C) for the thru movement.
Cycle length (C) – The time it takes a traffic signal to go through one complete sequence of signal indications.
D factor – Same as directional distribution factor.
Daily tables – In this Handbook, Service Volume Tables presented in terms of annual average daily traffic.
Deceleration lane – A freeway lane extending from the taper to the off ramp gore.
Delay – The additional travel time experienced by a traveler.
Demand – The number of persons or vehicles desiring service on a roadway.
Demand traffic – Same as demand.
Density – The number of vehicles, averaged over time, occupying a given length of lane or roadway; usually expressed as vehicles per mile or vehicles per mile per lane.
Design hour factor – In this Handbook the proportion of annual average daily traffic occurring during the 30th highest hour of the design year.
Designated – A type of bicycle lane at least 5 feet in width and having a bicycle logo and a direction arrow painted on it.
Desirable – In this Handbook a categorization of pavement condition that is new or recently resurfaced pavement.

GLOSSARY
2009 FDOT QUALITY/LEVEL OF SERVICE HANDBOOK | 120
Developed areas – All areas not rural undeveloped.
Same as rural developed areas.
Development of regional impact (DRI)
– A development which, because of its character, magnitude, or location, would substantially affect the health, safety, or welfare of citizens of more than one county in Florida, as defined in Section 380.06(1), Florida Statutes, implemented by Rule 9J-2, Florida Administrative Code, and coordinated by the regional planning agency.
Directional distribution factor (D)
–
The proportion of an hour’s total volume occurring in the higher volume direction.
Diverge area – Same as off ramp influence area.
Divided – As used in the Generalized Tables, a roadway with a median.
Driver population – A traffic variable included as part of the local adjustment factor that describes driver familiarity with a roadway and accounts for such differences in driving habits as those between commuters and other drivers.
Driver population factor – The factor associated with driver population.
Dual left-turn lanes – Two lanes designated exclusively for left turns at a signalized intersection.
Effective green ratio (g/C) – Typically in this Handbook the ratio of the effective green time (g) for the thru movement at a signal intersection to its cycle length (C).
The ratio of the effective green time (g) for a movement at a signal intersection to its cycle length (C).
Effective green time (g) – The time allocated for the thru movement to proceed; calculated as the thru movement green plus yellow plus all red indication times less the lost time.
Effective lanes – Same as number of effective lanes.
Exclusive left effective green ratio
–
The ratio of the effective green time (g) from an exclusive left turn lane for the peak traffic flow direction at a signal intersection to its cycle length (C).
Exclusive left turn lanes – Same as left turn lanes.
Exclusive left turn storage length
–
The total amount of storage length in feet for exclusive left turn lanes.
Exclusive right turn lanes – Storage area designated to only accommodate right turning vehicles.
Exclusive thru lane – Any Intrastate highway lane that is designated exclusively for intrastate travel, is physically separated from any general-use lane, and the access to which is highway regulated. These lanes may be used for high occupancy vehicles (HOVs), and express buses during peak travel hours if the level of service standards can be maintained.
Exclusive turn lane – A storage area designated to only accommodate left or right turning vehicles; in this Handbook the turn lane must be long enough to accommodate enough turning vehicles to allow the free flow of the thru movement.
Expanded intersections – Same as add-on/drop-off lanes.
Facility – A length of roadway composed of points and segments.
A generic term including points, segments or roadways.
Factor – A value by which a given quantity is multiplied, divided, added or subtracted in order to indicate a difference in measurement.
FDOT – Florida Department of Transportation.
FHWA – Federal Highway Administration.
Five-lane section – A roadway with 4 thru lanes, 2 in each direction separated by a two-way left-turn lane; in the Generalized Tables, a five-lane section is treated as a roadway with 4 lanes and a median.

GLOSSARY
2009 FDOT QUALITY/LEVEL OF SERVICE HANDBOOK | 121
Florida Intrastate Highway System (FIHS)
–
An interconnected statewide system of limited access facilities and controlled access facilities developed and managed by FDOT to meet standards and criteria established for the FIHS. It is part of the State Highway System, and is developed for high-speed and high-volume traffic movements. The FIHS also accommodates high occupancy vehicles (HOVs), express bus transit and in some corridors, interregional, and high-speed intercity passenger rail service. Access to abutting land is subordinate to movement of traffic and such access must be prohibited or highly regulated.
Flow rate – In this Handbook the equivalent hourly rate at which vehicles pass a point on a roadway for a 15-minute time period.
Free flow delay
– The additional travel time represented by the difference between the time associated with a roadway’s free flow speed and average travel speed.
Free flow speed (FFS) – In this Handbook the average speed of vehicles under low flow traffic conditions and not under the influence of signals, stops signs or other fixed causes of interruption, generally assumed to be 5 mph over the posted speed limit.
FREEPLAN – FDOT’s freeway planning software for calculating level of service and service volume tables.
Freeway – A multilane, divided highway with at least 2 lanes for exclusive use of traffic in each direction and full control of ingress and egress.
Freeway interchange influence area
–
Same as interchange.
Freeway segment – In this Handbook a basic segment, interchange or toll plaza.
FSUTMS – Florida Standard Urban Transportation Modeling System; Florida’s software that forecasts travel demand.
Fully actuated control – Same as actuated control.
Functional classification – The assignment of roads into systems according to the character of service they provide in relation to the total road network.
g/C – Same as effective green ratio.
Generalized Service Volume Tables
–
Maximum service volumes based on areawide roadway, traffic and control variables and presented in tabular form.
Generalized planning – A broad type of planning application such as statewide analyses, initial problem identification, and future year analyses; in this Handbook typically performed by use of the Generalized Tables.
Generalized Tables – Same as Generalized Service Volume Tables.
General-use lane – Any Intrastate highway lane not exclusively designated for long distance, high-speed travel. In urbanized areas these lanes include high occupancy vehicle (HOV) lanes that are not physically separated from other travel lanes.
Gore – The point located immediately between the left edge of a ramp pavement and the right edge of the roadway pavement at a merge or diverge area.
Green time (G) – The duration in seconds of the green indication for a given movement at a signalized intersection.
Growth management concepts
–
The ideas necessary for use in careful planning for urban growth so as to responsibly balance the growth of the infrastructure required to support a community’s residential and commercial growth with the protection of its natural systems (land, air, water).
Guideline – Based on FDOT’s Standard Operating System (Topic No: 025-020-002-d), a recommended process intended to provide efficiency and uniformity to the implementation of policies, procedures, and standards; a guideline is intended to provide general program direction with maximum flexibility.
Handbook – Based on FDOT’s Standard Operating System (Topic No: 025-020-002-d), technical instructions or techniques used to assist or train users in performing specific functions.
HCM – Same as Highway Capacity Manual.

GLOSSARY
2009 FDOT QUALITY/LEVEL OF SERVICE HANDBOOK | 122
Headway - The time, in seconds, between two successive vehicles as they pass a point on a roadway.
Heavily congested – Same as congestion.
Heavy vehicle – A FHWA vehicle classification of 4 or higher, essentially vehicles with more than 4 wheels touching the pavement during normal operation.
Heavy vehicle factor (HV) – The adjustment factor for heavy vehicles.
High-occupancy vehicle (HOV) lane
–
A freeway lane reserved for the use of vehicles with a preset minimum number occupants; such vehicles often include buses, taxis, and carpools.
HIGHPLAN – FDOT’s software for calculating levels of service and service volume tables for two-lane highways and multilane highways.
Highway – 1) An uninterrupted flow roadway that is not a freeway.
2) A generic term meaning the same as roadway.
3) A roadway with all the transportation elements within the right-of-way.
Highway capacity analysis
– An examination of the maximum of vehicles or persons that can reasonably be expected to pass a point on a roadway during a specified time period under prevailing roadway, traffic, and control conditions.
Highway Capacity Manual (HCM)
– The Transportation Research Board document on highway capacity and quality of service.
Highway Capacity Software (HCS)
–
A software package faithfully replicating the Highway Capacity Manual.
Highway mode – In this Handbook, either automobile, bicycle, bus, or pedestrian.
HIGHPLAN – FDOT’s uninterrupted flow highway planning software for calculating level of service and service volume tables.
Highway system structure – Same as transportation system structure.
Indication – In this Handbook, the green, yellow or red appearance of a signal to a motorist.
Interchange – In this Handbook the influence area associated with the off ramp influence area, overpass/underpass, and on ramp influence area of a connection to a freeway.
Interchange influence area
–
Same as interchange.
Interchange spacing – The distance between the centerlines of freeway interchanges.
Interrupted flow – A category of roadways characterized by signals, stop signs or other fixed causes of periodic delay or interruption to the traffic stream with average spacing less than or equal to 2.0 miles apart.
Intersection – The same as signalized intersection, unless specifically noted.
Intersection influence area
–
In this Handbook a segment of an uninterrupted flow highway influenced by an isolated intersection.
Interval – A period of time in which all traffic signal indications remain constant.
Intrastate highways – Highways on the Florida Intrastate Highway System (FIHS).
Isolated intersection – An intersection occurring along an uninterrupted flow highway.
K factor (K) – Same as planning analysis hour factor.
K100 – The ratio of the 100th highest traffic volume hour of the year to the annual average daily traffic.
Lanes – Same as number of thru lanes, unless specifically noted.

GLOSSARY
2009 FDOT QUALITY/LEVEL OF SERVICE HANDBOOK | 123
Large urbanized area – An MPO urbanized area greater than 1,000,000 population; in Florida these 7 areas consist of the following central cities: Ft. Lauderdale, Jacksonville, Miami, Orlando, St. Petersburg, Tampa, and West Palm Beach.
Lateral clearance – Clearance distance from edges of outside lanes to fixed obstructions.
Left turn lanes – In this Handbook storage areas designated to only accommodate left turning vehicles; a left turn lane must be long enough to accommodate enough left turning vehicles to allow the free flow of the thru movement.
Level of service (LOS) – A quantitative stratification of the quality of service to a typical traveler of a service or facility into six letter grade levels, with “A” describing the highest quality and “F” describing the lowest quality; a discrete stratification of a quality of service continuum.
Level of service (LOS) analysis
–
A quantitative examination of traveler quality of service provided by a transportation facility or service.
Level of Service Standards – Same as Statewide Minimum Level of Service Standards for the State Highway System.
LOS threshold delay – Same as threshold delay.
Level terrain – A combination of horizontal and vertical alignments that permits heavy vehicles to maintain approximately the same running speed as passenger cars; this generally includes short grades of no more than 1 to 2 percent.
Limited access highway – Same as freeway.
Link – Same as section; for quality/level of service analyses this term is discouraged for use.
Load factor – The ratio of passengers actually carried to the total passenger capacity of a bus.
Local adjustment factor – In this Handbook an adjustment factor FDOT uses to adjust base saturation flow rates or base capacities to better match actual Florida traffic volumes; mostly consists of a driver population factor and an area type factor.
Local Government Comprehensive Plan
(LGCP)
–
Any county or municipal plan that meets the requirements of subsections 163.3177 and 163.3178 of the Florida Statues.
LOS – Same as level of service.
LOS standards – Same as Statewide Minimum Level of Service Standards for the State Highway System.
Maintain – Continuing operating conditions at a level that prevents significant degradation.
Major city/county roadway
– A roadway not on the State Highway System whose roadway, traffic and control characteristics are similar to those classified as state minor arterials.
Maximum acceptable value
–
The highest value for a traffic variable FDOT will accept when developing, reviewing or approving a LOS analysis.
Maximum service volume – The highest number of vehicles for a given level of service.
Measure of effectiveness – A quantitative parameter indicating the performance of a transportation facility or service.
Median – Areas at least 10 feet wide that are restrictive or non-restrictive that separate opposing-direction mid-block traffic lanes and that, on arterials, contain turn lanes that allow left turning vehicles to exit from the thru traffic lanes.
A mathematical measure of central tendency in which the value selected in an ordered set of values below and above which there is an equal number of values.
Median factor – A factor by which a service volume is multiplied to account for the effects of the existence of a median.
Median type – A classification of roadway medians as restrictive, non-restrictive, or no median.
Merge area – Same as on ramp influence area.

GLOSSARY
2009 FDOT QUALITY/LEVEL OF SERVICE HANDBOOK | 124
Mid-block – In this Handbook the part of a roadway between two signalized intersections.
Minimum acceptable speed
–
In this Handbook the lowest average travel speed criterion for a given level of service as applied to two-lane highways in developed areas.
Minimum acceptable value
– The lowest value for a traffic variable FDOT will accept when developing, reviewing or approving a LOS analysis.
Mobility – The movement of people and goods.
Mode – A method of travel; in this Handbook a highway mode.
Motorized mode – A method of travel by automobile or bus.
Motorized vehicle – Same as vehicle.
Movement – A flow of vehicles or people in a given direction.
MPO – Metropolitan Planning Organization.
Multilane – Having more than one thru lane in the analysis direction.
Multilane highway – A non-freeway roadway with 2 or more lanes in each direction and, although occasional interruptions to flow at signalized intersections may exist, is generally uninterrupted flow.
Multimodal – In this Handbook more than one highway mode.
Multimodal Transportation District
–
An area in which secondary priority is given to vehicle mobility and primary priority is given to assuring a safe, comfortable, and attractive pedestrian environment, with convenient interconnection to transit (F.S. 163.3180(15)).
Narrow – In this Handbook a categorization of outside lane width less 11.0 feet.
No passing zone – In this Handbook a segment of a two-lane highway along which passing is prohibited in the analysis direction.
Non-restrictive median – A type of median (i.e., painted) that provides no pedestrian refuge.
Non-state roadway – A roadway not on the State Highway System.
Not Achievable – In this Handbook a situation in which a given level of service cannot be obtained because of the roadway, traffic and control variables and level of service thresholds used.
Not Applicable – In this Handbook a situation in which a given level of service is not relevant because of the roadway, traffic and control variables and level of service thresholds used.
Number of directional thru lanes
–
The number of thru lanes in a single direction.
Number of effective lanes – In terms of capacity the equivalent number of thru lanes. Typically the number is expressed as a fraction (e.g., 2.7) to reflect the partial beneficial effects of freeway auxiliary lanes or arterial add-on/drop-off lanes.
Number of thru lanes – The number of lanes relevant to an analysis of a roadway’s level of service.
Usually two-directional (the software will convert to one direction for analysis purposes).
For arterials: • usually at the signalized intersection, not mid-block. • usually thru and shared-right-turn lanes. • may be a fractional number reflecting add-on/drop-off lanes or other special lane
utilization considerations. • using the Generalized Tables the number at major signalized intersections.
For freeways and uninterrupted flow highways: • does not include auxiliary lanes between 2 points. • usually the predominant number of thru lanes between 2 points.
Obstacle to bus stop – A physical barrier between a sidewalk and a bus stop.

GLOSSARY
2009 FDOT QUALITY/LEVEL OF SERVICE HANDBOOK | 125
Off peak – The course of the lower flow of traffic.
A time period not representing a peak hour.
Off ramp influence area – The geographic limits affecting the capacity of a freeway associated with traffic exiting a freeway.
On ramp influence area – The geographic limits affecting the capacity of a freeway associated with traffic entering a freeway.
One-way – A type of roadway in which vehicles are allowed to move in only one direction.
Operational analysis – A detailed analysis of a roadway’s present or future level of service, as opposed to a generalized planning analysis or preliminary engineering analysis.
Operational model – In this Handbook the use of the full methodologies contained in the 2000 Highway Capacity Manual, Bicycle LOS Model, Pedestrian LOS Model, Transit Capacity and Quality of Service Manual or other source to conduct an operational analysis.
Other signalized roadway – A signalized roadway not on the State Highway System and also considered by the local government of jurisdiction not to be a major city/county roadway.
Other state roads – Roads on the State Highway System, which are not part of the Florida Intrastate Highway System.
Other urbanized area – An MPO urbanized area less than 1,000,000 population.
Outside lane – A roadway’s motorized vehicle thru lane closest to the edge of pavement.
Outside lane width
– In this Handbook the width in feet of a roadway’s motorized vehicle thru lane closest to the edge of pavement.
Oversaturated – A traffic condition in which demand exceeds capacity.
Passing lane – A lane added to provide passing opportunities in one direction of travel on a two-lane highway. Two-way left-turn lanes are not considered passing lanes.
Paved shoulder/bicycle lane
– In this Handbook pavement at least 3 feet in width separated by a solid pavement marking from the outside motorized vehicle thru lane to the edge of pavement.
Pavement condition – In this Handbook the general classification of the roadway surface where bicycling generally occurs.
Peak direction – The course of the higher flow of traffic.
Peak hour – In this Handbook a 1 hour time period with high volume.
Peak hour factor (PHF) – The ratio of the hourly volume to the peak 15-minute flow rate for that hour; specifically hourly volume / (4 x peak 15-minute volume).
Peak season – The 13 consecutive weeks with the highest daily volumes for an area.
Peak Season Weekday Average Daily Traffic
(PSWADT)
–
The average daily traffic for Monday through Friday during the peak season.
Peak to daily ratio – The ratio of the highest 1 hour volume of a day to the daily volume.
Pedestrian – An individual traveling on foot.
Pedestrian accessibility – In this Handbook the ease in which a pedestrian can reach a bus stop.
Pedestrian crossing difficulty
–
In this Handbook a generalization of how hard it is for a pedestrian to go from one side of a roadway to the other side.
Pedestrian LOS Model – The operational methodology from which this Handbook’s pedestrian quality/level of service analyses are based.
Pedestrian level of service score
–
A numerical value calculated by the Pedestrian LOS Model that corresponds to a pedestrian level of service.

GLOSSARY
2009 FDOT QUALITY/LEVEL OF SERVICE HANDBOOK | 126
Pedestrian refuge – In this Handbook a raised or grassed area at least 5 feet but less than 10 feet in width that separates opposing mid-block traffic lanes, and allows pedestrians to cross a roadway.
Pedestrian/Sidewalk/ Roadway separation
–
The lateral distance in feet from the outer edge of pavement to where a pedestrian walks on a sidewalk.
Percent free flow speed – The percentage of vehicle average travel speed to free flow speed.
%FFS – Same as percent free flow speed.
Percent left turns – The percentage of vehicles performing a left-turning movement at a signalized intersection.
Percent no passing zone – In this Handbook the percentage of a two-lane highway along which passing is prohibited in the analysis direction.
Percent right turns – The percentage of vehicles performing a right-turning movement at a signalized intersection. Percent time spent
following – The average percent of total travel time that vehicles must travel in platoons behind slower
vehicles due to inability to pass on a two-lane highway.
Percent turns from exclusive turn lanes
– The percentage of vehicles approaching an intersection served by exclusive turn lanes and not part of the thru movement.
Performance measure – A qualitative or quantitative factor used to evaluate a particular aspect of travel quality.
Phase – The part of a traffic signal’s cycle allocated to any combination of traffic movements receiving the right-of-way simultaneously during one or more intervals.
PHF – Same as peak hour factor.
Planning analysis hour factor (K)
–
The ratio of the traffic volume in the study hour to the annual average daily traffic.
Planning application – In this Handbook the use of default values and simplifying assumptions to an operational model to address a roadway’s present or future level of service.
Planning horizon – A time period, typically 20 years, applicable to the analysis of a project, roadway or service.
Platoon – A group of vehicles traveling together as a group, either voluntarily or involuntarily because of signal control, geometrics or other factors.
PLOS – Same as pedestrian level of service score.
Point – A boundary between segments; in this Handbook usually a signalized intersection, but may be other places where modal users enter, leave, or cross a facility, or roadway characteristics change.
Posted speed – The maximum speed at which vehicles are legally allowed to travel over a roadway segment.
Precision – The range of accurate and acceptable numerical answers.
Preliminary engineering – Engineering analyses performed to support decisions related to design concept and scope, e.g., need for improvement, design controls and standards, traffic, alternative alignment, preliminary design, conceptual design plans.
Preliminary engineering software
–
A type of planning application detailed enough to reach a decision on design concept and scope, conducting alternatives analyses, and performing other technical analyses; in this Handbook typically performed by use of accompanying planning software
Pretimed – Same as pretimed control.
Pretimed control – Traffic signal control in which the cycle length, phase plan, and phase times are preset and repeated continuously according to a preset plan.
Prevailiing conditions – Existing circumstances that primarily include roadway, traffic, and control conditions, but may also include weather, construction, incidents, lighting and area type.
QOS – Same as quality of service.
Quality of service (QOS) – A user based perception of how well a service or facility is operating.

GLOSSARY
2009 FDOT QUALITY/LEVEL OF SERVICE HANDBOOK | 127
Quality of travel – The dimension of mobility that addresses traveler satisfaction with a facility or service.
Quality/level of service (Q/LOS)
– A combination of the broad quality of service and more detailed level of service concepts.
Quantity of travel – The dimension of mobility that addresses the magnitude of use of a facility or service.
Restrictive median – A type of median that is not painted (e.g., grassed, raised).
Roadway – A general categorization of an open way for persons and vehicles to traverse; in this Handbook it encompasses streets, arterials, freeways, highways and other facilities.
Roadway characteristics – Same as roadway variables.
Roadway class – Categories of arterials and two-lane highways; arterials are primarily grouped by signal density; two-lane highways are primarily grouped by area type.
Roadway variables – Parameters associated with roadways.
Rolling terrain – A combination of horizontal and vertical alignments causing heavy vehicles to reduce their running speed substantially below that of passenger cars, but not to operate at crawl speeds for a significant amount of time.
Route – As used in the Transit Capacity and Quality of Service Manual, a designated, specified path to which a bus is assigned.
Route segment – As used in the Transit Capacity and Quality of Service Manual, a portion of a bus route ranging from 2 stops to the entire length of the route.
Running speed – The distance a vehicle travels divided by the travel time the vehicle is in motion.
Running time – The portion of travel time during which a vehicle is in motion.
Rural – Same as rural area.
Rural area – 1) In the Generalized Tables and software, areas that are not urbanized areas, transitioning areas, or urban areas.
2) In FDOT’s Statewide Minimum Level of Service Standards for the State Highway System, areas not included in transportation concurrency management areas, urbanized areas, transitioning areas, urban areas, or communities.
Rural developed areas – Portions of rural areas that are generally cities and other population areas with less than 5,000 population or along coastal roadways.
Rural undeveloped areas – Portions of rural areas with no or minimal population or development.
Scheduled fixed route – In this Handbook bus service provided on a repetitive, fixed-schedule basis along a specific route with buses stopping to pick up and deliver passengers to specific locations.
Seasonal factor – A factor used to adjust for the variation in traffic over the course of a year.
Section – A group of consecutive segments that have similar roadway characteristics, traffic characteristics and, as appropriate, control characteristics for a mode of travel.
A characteristic describing laneage (i.e., three-lane section, five-lane section, seven-lane section).
Segment – A portion of a facility defined by 2 end points; usually the length of roadway from one signalized intersection to the next signalized intersection.
Segmentation – The partitioning of roadways for analysis purposes.
Semiactuated – Same as semiactuated control.
Semiactuated control – Signal control of an intersection in which the thru movement on the designated main roadway gets the unused green time from side movements because of limited or no vehicle activation from side movements.
Service measure – A specific performance measure used to assign a level of service to a set of operating conditions for a transportation facility or service.

GLOSSARY
2009 FDOT QUALITY/LEVEL OF SERVICE HANDBOOK | 128
Service volume – Same as maximum service volume.
Service Volume Table – Maximum service volumes based on roadway, traffic and control variables and presented in tabular form.
Seven-lane section – A roadway with 6 thru lanes, 3 in each direction separated by a two-way left-turn lane; in the Generalized Tables, a seven-lane section is treated as a roadway with 6 lanes and a median.
Shared lane – A roadway lane shared by 2 or 3 traffic movements; in Florida a shared lane usually serves thru and right turning traffic movements.
Sidewalk – A paved walkway for pedestrians at the side of a roadway.
Sidewalk/roadway protective barrier
–
Physical barriers separating pedestrians on sidewalks and motorized vehicles.
Sidewalk/roadway separation
–
The lateral distance in feet from the outside edge of pavement to the inside edge of the sidewalk.
Signal – In this Handbook:
A traffic control device regulating the flow of traffic with green, yellow and red indications.
A traffic control device that routinely stops vehicles during the study period; excluded from this definition are flashing yellow lights, railroad crossings, draw bridges, yield signs, and other control devices.
Signal density – The number of signalized intersections per mile.
Signal type – The kind of traffic signal (actuated, pretimed or semiactuated) with respect to the way its cycle length, phase plan, and phase times are operated.
Signalization characteristics
–
Same as control.
Signalized intersection – A place where 2 roadways cross and have a signal controlling traffic movements.
Signalized intersection spacing
–
The distance between signalized intersections.
Software – FDOT’s ARTPLAN, FREEPLAN, and HIGHPLAN preliminary engineering computer programs.
Span of service – Same as bus span of service.
Speed – In this Handbook the same as average travel speed, unless specifically noted.
Speed limit – Same as posted speed.
Standard – A Florida Department of Transportation formally established criterion for a specific or special activity to achieve a desired level of quality.
Standards – Same as Statewide Minimum Level of Service Standards for the State Highway System.
State Highway System (SHS)
– All roadways that the Florida Department of Transportation operates and maintains; the State Highway System consists of the Florida Intrastate Highway System and other state roads.
Statewide Minimum Level of Service Standards for
the State Highway System
– FDOT’s Rule Chapter No. 14-94 to be used in the planning and operation of the State Highway System.
Strategic Intermodal System (SIS)
– Florida’s system of transportation facilities and serves of statewide and interregional significance.
Study hour – An hour period on which to base quality/level of service analyses of a facility or service.
Study period – Same as study hour.
A length in time including a future year of analysis.
Subsegment – A further breakdown of segments; in this Handbook primarily used for pedestrian level of service analysis where pedestrian roadway elements change between signalized intersections.
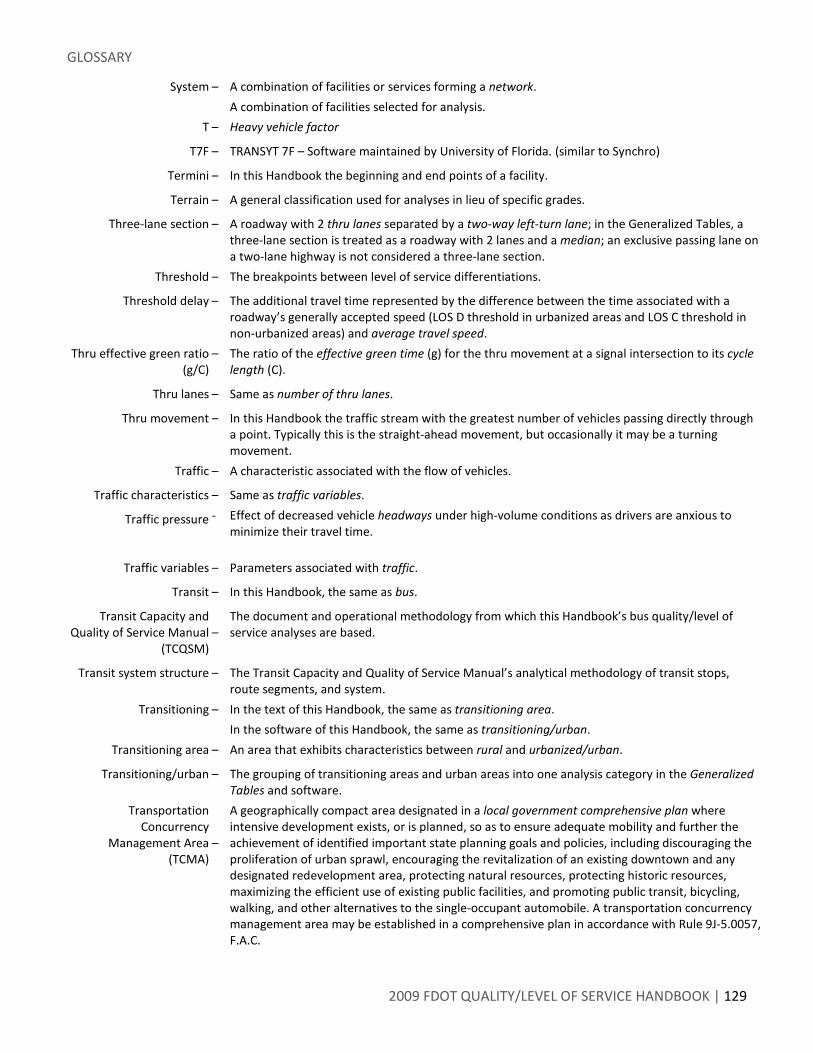
GLOSSARY
2009 FDOT QUALITY/LEVEL OF SERVICE HANDBOOK | 129
System – A combination of facilities or services forming a network.
A combination of facilities selected for analysis.
T – Heavy vehicle factor
T7F – TRANSYT 7F – Software maintained by University of Florida. (similar to Synchro)
Termini – In this Handbook the beginning and end points of a facility.
Terrain – A general classification used for analyses in lieu of specific grades.
Three-lane section – A roadway with 2 thru lanes separated by a two-way left-turn lane; in the Generalized Tables, a three-lane section is treated as a roadway with 2 lanes and a median; an exclusive passing lane on a two-lane highway is not considered a three-lane section.
Threshold – The breakpoints between level of service differentiations.
Threshold delay – The additional travel time represented by the difference between the time associated with a roadway’s generally accepted speed (LOS D threshold in urbanized areas and LOS C threshold in non-urbanized areas) and average travel speed.
Thru effective green ratio (g/C)
– The ratio of the effective green time (g) for the thru movement at a signal intersection to its cycle length (C).
Thru lanes – Same as number of thru lanes.
Thru movement – In this Handbook the traffic stream with the greatest number of vehicles passing directly through a point. Typically this is the straight-ahead movement, but occasionally it may be a turning movement.
Traffic – A characteristic associated with the flow of vehicles.
Traffic characteristics
Traffic pressure
–
-
Same as traffic variables.
Effect of decreased vehicle headways under high-volume conditions as drivers are anxious to minimize their travel time.
Traffic variables – Parameters associated with traffic.
Transit – In this Handbook, the same as bus.
Transit Capacity and Quality of Service Manual
(TCQSM)
–
The document and operational methodology from which this Handbook’s bus quality/level of service analyses are based.
Transit system structure – The Transit Capacity and Quality of Service Manual’s analytical methodology of transit stops, route segments, and system.
Transitioning – In the text of this Handbook, the same as transitioning area.
In the software of this Handbook, the same as transitioning/urban.
Transitioning area – An area that exhibits characteristics between rural and urbanized/urban.
Transitioning/urban – The grouping of transitioning areas and urban areas into one analysis category in the Generalized Tables and software.
Transportation Concurrency
Management Area (TCMA)
–
A geographically compact area designated in a local government comprehensive plan where intensive development exists, or is planned, so as to ensure adequate mobility and further the achievement of identified important state planning goals and policies, including discouraging the proliferation of urban sprawl, encouraging the revitalization of an existing downtown and any designated redevelopment area, protecting natural resources, protecting historic resources, maximizing the efficient use of existing public facilities, and promoting public transit, bicycling, walking, and other alternatives to the single-occupant automobile. A transportation concurrency management area may be established in a comprehensive plan in accordance with Rule 9J-5.0057, F.A.C.
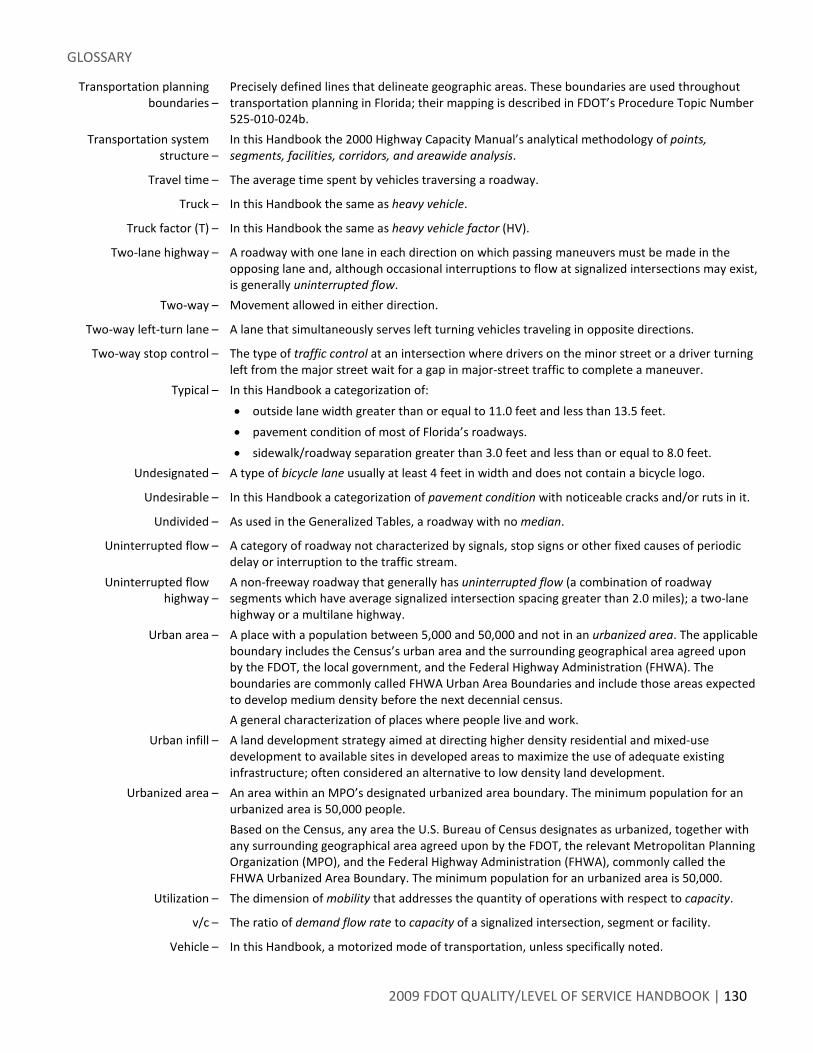
GLOSSARY
2009 FDOT QUALITY/LEVEL OF SERVICE HANDBOOK | 130
Transportation planning boundaries
–
Precisely defined lines that delineate geographic areas. These boundaries are used throughout transportation planning in Florida; their mapping is described in FDOT’s Procedure Topic Number 525-010-024b.
Transportation system structure
–
In this Handbook the 2000 Highway Capacity Manual’s analytical methodology of points, segments, facilities, corridors, and areawide analysis.
Travel time – The average time spent by vehicles traversing a roadway.
Truck – In this Handbook the same as heavy vehicle.
Truck factor (T) – In this Handbook the same as heavy vehicle factor (HV).
Two-lane highway – A roadway with one lane in each direction on which passing maneuvers must be made in the opposing lane and, although occasional interruptions to flow at signalized intersections may exist, is generally uninterrupted flow.
Two-way – Movement allowed in either direction.
Two-way left-turn lane – A lane that simultaneously serves left turning vehicles traveling in opposite directions.
Two-way stop control – The type of traffic control at an intersection where drivers on the minor street or a driver turning left from the major street wait for a gap in major-street traffic to complete a maneuver.
Typical – In this Handbook a categorization of:
• outside lane width greater than or equal to 11.0 feet and less than 13.5 feet.
• pavement condition of most of Florida’s roadways.
• sidewalk/roadway separation greater than 3.0 feet and less than or equal to 8.0 feet.
Undesignated – A type of bicycle lane usually at least 4 feet in width and does not contain a bicycle logo.
Undesirable – In this Handbook a categorization of pavement condition with noticeable cracks and/or ruts in it.
Undivided – As used in the Generalized Tables, a roadway with no median.
Uninterrupted flow – A category of roadway not characterized by signals, stop signs or other fixed causes of periodic delay or interruption to the traffic stream.
Uninterrupted flow highway
–
A non-freeway roadway that generally has uninterrupted flow (a combination of roadway segments which have average signalized intersection spacing greater than 2.0 miles); a two-lane highway or a multilane highway.
Urban area – A place with a population between 5,000 and 50,000 and not in an urbanized area. The applicable boundary includes the Census’s urban area and the surrounding geographical area agreed upon by the FDOT, the local government, and the Federal Highway Administration (FHWA). The boundaries are commonly called FHWA Urban Area Boundaries and include those areas expected to develop medium density before the next decennial census.
A general characterization of places where people live and work.
Urban infill – A land development strategy aimed at directing higher density residential and mixed-use development to available sites in developed areas to maximize the use of adequate existing infrastructure; often considered an alternative to low density land development.
Urbanized area – An area within an MPO’s designated urbanized area boundary. The minimum population for an urbanized area is 50,000 people.
Based on the Census, any area the U.S. Bureau of Census designates as urbanized, together with any surrounding geographical area agreed upon by the FDOT, the relevant Metropolitan Planning Organization (MPO), and the Federal Highway Administration (FHWA), commonly called the FHWA Urbanized Area Boundary. The minimum population for an urbanized area is 50,000.
Utilization – The dimension of mobility that addresses the quantity of operations with respect to capacity.
v/c – The ratio of demand flow rate to capacity of a signalized intersection, segment or facility.
Vehicle – In this Handbook, a motorized mode of transportation, unless specifically noted.

GLOSSARY
2009 FDOT QUALITY/LEVEL OF SERVICE HANDBOOK | 131
Volume – In this Handbook usually the number of vehicles, and occasionally persons, passing a point on a roadway during a specified time period, often 1 hour; a volume may be measured or estimated, either of which could be a constrained value or a hypothetical demand volume.
Weaving distance – A length of freeway over which traffic streams cross paths through lane changing maneuvers.
Weighted effective green ratio
–
In this Handbook the average of the critical intersection’s thru g/C and the average of all the other signalized intersections’ thru g/Cs along the arterial facility.
Weighted g/C – Same as weighted effective green ratio.
Wide – In this Handbook a categorization of:
• outside lane width greater than or equal to 13.5 feet.
• sidewalk/roadway separation greater than 8.0 feet.
Worst case – In this Handbook for:
• arterials, the critical intersection.
• freeways, usually the off ramp influence area of an interchange.

REFERENCES
2009 FDOT QUALITY/LEVEL OF SERVICE HANDBOOK | 132
11 REFERENCES
[AASHTO, 2004] American Association of State Highway and Transportation Officials, A Policy on Geometric Design of Highways and Streets, Washington, D.C., 2004.
[Bonneson, 2006] Bonneson, et.al., “Influence of Area Population, Number of Lanes, and Speed Limits on Saturation Flow Rate,” in Transportation Research Record 1988, Transportation Research Board, Washington, D.C., 2006.
[FDOT, 1997] Florida Department of Transportation, Site Impact Handbook, Tallahassee, Florida, 1997.
[FDOT, 2006] Florida Department of Transportation, Rule Chapter 14-94, Statewide Minimum Level of Service Standards for the State Highway System, Tallahassee, Florida, 2006.
[FDOT, 2008] Florida Department of Transportation, Project Traffic Forecasting Handbook, Tallahassee, Florida, 2008.
[FDOT, 2009a] Florida Department of Transportation, MPO Handbook, Tallahassee, Florida, 2009.
[FDOT, 2009b] Florida Department of Transportation, Florida Traffic Information DVD, Tallahassee, Florida, 2009.
[FDOT, 2009c] Florida Department of Transportation, Plans Preparation Manual, Tallahassee, Florida, 2009.
[ITE, 2008] Institute of Transportation Engineers, Trip Generation Handbook, 2008.
[Landis,1997] Landis, et. al., “Real-time Human Perceptions: Toward a Bicycle Level of Service” in Transportation Research Record 1578, Transportation Research Board, Washington, D.C., 1997, as modified and appearing in this Handbook.
[Landis, 2001] Landis, et. al., “Modeling the Roadside Walking Environment: A Pedestrian Level of Service” in Transportation Research Record 1773, Transportation Research Board, Washington, D.C., 2001.
[May, 2001] May, et. al., “Freeway Systems Research Beyond the HCM2000,” in Transportation Research Record 1776, Transportation Research Board, Washington, D.C., 2001.
[McTrans, 2009a] McTrans Center. Highway Capacity Software (HCS) version 5.4, University of Florida, Gainesville, Florida, 2009.
[McTrans, 2009b] McTrans Center. Traffic Simulation Integration Package (TSIS) version 6.1, University of Florida, Gainesville, Florida, 2009.
[Prassas,1999a] Prassas, Elena S., “Improved Running Times for HCM Table 11-4 and Related Observations on Average Travel Speed” in Transportation Research Record 1678, Transportation Research Board, Washington, D.C., 1999.

REFERENCES
2009 FDOT QUALITY/LEVEL OF SERVICE HANDBOOK | 133
[Prassas, 1999b] Prassas, Elena S., and McLeod, Douglas S., “Arterial Planning Methodology: Concept, Implementation, and Experience” in Transportation Research Record 1678, Transportation Research Board, Washington, D.C., 1999.
[Prassas, 2003] Prassas, Elena S., and McLeod, Douglas S. – “Freeway Facility Planning Methodology: Concept and Implementation,” in Transportation Research Record 1852, Transportation Research Board, Washington, D.C., 2003.
[TRB, 2000] Transportation Research Board, Highway Capacity Manual, Washington, D.C., 2000.
[TRB, 2003] Transportation Research Board, Transit Capacity and Quality of Service Manual, Washington, D.C., 2003.
[UF, 2001] University of Florida for the Florida Department of Transportation, Multimodal Quality of Service Project, Gainesville, Florida, 2001.
[USF, 1997] University of South Florida for the Florida Department of Transportation, Driver Population Factors in Freeway Capacity, Tampa, Florida, 1997.
[USF, 1999] University of South Florida for the Florida Department of Transportation, Impact of Non-Local Drivers on the Capacity at Signalized Intersections, Tampa, Florida, 1999.
[Washburn, 2002] Washburn, Scott S., McLeod, Douglas S., and Courage, Kenneth G., “Adaptation of the HCM2000 for Planning Level Analysis of Two-Lane and Multilane Highways in Florida” in Journal of the Transportation Research Board, Transportation Research Board, Washington, D.C., 2002.

REFERENCES
2009 FDOT QUALITY/LEVEL OF SERVICE HANDBOOK | 134
This page is deliberately left blank.

www.dot.state.fl.us/planning/systems/sm/los/default.shtm 2009 FDOT QUALITY/LEVEL OF SERVICE HANDBOOK
TABLE 1 Generalized Annual Average Daily Volumes for Florida’s
Urbanized Areas1
10/4/10
STATE SIGNALIZED ARTERIALS Class I (>0.00 to 1.99 signalized intersections per mile)
Lanes Median B C D E 2 Undivided 9,600 15,400 16,500 *** 4 Divided 29,300 35,500 36,700 *** 6 Divided 45,000 53,700 55,300 *** 8 Divided 60,800 71,800 73,800 ***
Class II (2.00 to 4.50 signalized intersections per mile) Lanes Median B C D E
2 Undivided ** 10,500 15,200 16,200 4 Divided ** 25,000 33,200 35,100 6 Divided ** 39,000 50,300 53,100 8 Divided ** 53,100 67,300 70,900
Class III/IV (more than 4.5 signalized intersections per mile) Lanes Median B C D E
2 Undivided ** 5,100 11,900 14,900 4 Divided ** 12,600 28,200 31,900 6 Divided ** 19,700 43,700 48,200 8 Divided ** 27,000 59,500 64,700
FREEWAYS Lanes B C D E
4 43,500 59,800 73,600 79,400 6 65,300 90,500 110,300 122,700 8 87,000 120,100 146,500 166,000
10 108,700 151,700 184,000 209,200 12 149,300 202,100 238,600 252,500
Freeway Adjustments Auxiliary
Lanes Ramp
Metering
+ 20,000 + 5%
Uninterrupted Flow Highway Adjustments Lanes Median Exclusive left lanes Adjustment factors
2 Divided Yes +5% Multi Undivided Yes -5% Multi Undivided No -25%
UNINTERRUPTED FLOW HIGHWAYS Lanes Median B C D E
2 Undivided 7,800 15,600 22,200 27,900 4 Divided 34,300 49,600 64,300 72,800 6 Divided 51,500 74,400 96,400 109,400
Non-State Signalized Roadway Adjustments (Alter corresponding state volumes by the indicated percent.)
Major City/County Roadways - 10%
Other Signalized Roadways - 35%
BICYCLE MODE2 (Multiply motorized vehicle volumes shown below by number of directional
roadway lanes to determine two-way maximum service volumes.) Paved Shoulder/ Bicycle Lane
C D E Coverage B 0-49% ** 3,200 12,100 >12,100
50-84% 2,400 3,700 >3,700 *** 85-100% 6,300 >6,300 *** ***
PEDESTRIAN MODE2
(Multiply motorized vehicle volumes shown below by number of directional roadway lanes to determine two-way maximum service volumes.)
Sidewalk Coverage B C D E 0-49% ** ** 5,000 14,400
50-84% ** ** 11,300 18,800 85-100% ** 11,400 18,800 >18,800
BUS MODE (Scheduled Fixed Route)3 (Buses in peak hour in peak direction)
Sidewalk Coverage B C D E 0-84% >5 >4 >3 >2
85-100% >4 >3 >2 >1
State & Non-State Signalized Roadway Adjustments (Alter corresponding state volumes by the indicated percent.) Divided/Undivided & Turn Lane Adjustments
Lanes Median Exclusive Left Lanes
Exclusive Right Lanes
Adjustment Factors
2 Divided Yes No +5% 2 Undivided No No -20%
Multi Undivided Yes No -5% Multi Undivided No No -25%
– – – Yes + 5%
One-Way Facility Adjustment Multiply the corresponding two-directional volumes in this table by 0.6.
1 Values shown are presented as two-way annual average daily volumes for levels of service and are for the automobile/truck modes unless specifically stated. Although presented as daily volumes, they actually represent peak hour direction conditions with applicable K and D factors applied. This table does not constitute a standard and should be used only for general planning applications. The computer models from which this table is derived should be used for more specific planning applications. The table and deriving computer models should not be used for corridor or intersection design, where more refined techniques exist. Calculations are based on planning applications of the Highway Capacity Manual, Bicycle LOS Model, Pedestrian LOS Model and Transit Capacity and Quality of Service Manual, respectively for the automobile/truck, bicycle, pedestrian and bus modes.
2 Level of service for the bicycle and pedestrian modes in this table is based on number of motorized vehicles, not number of bicyclists or pedestrians using the facility.
3 Buses per hour shown are only for the peak hour in the single direction of the higher traffic flow. ** Cannot be achieved using table input value defaults.
*** Not applicable for that level of service letter grade. For the automobile mode, volumes greater than level of service D become F because intersection capacities have been reached. For the bicycle mode, the level of service letter grade (including F) is not achievable because there is no maximum vehicle volume threshold using table input value defaults.
Source: Florida Department of Transportation Systems Planning Office 605 Suwannee Street, MS 19 Tallahassee, FL 32399-0450

2009 FDOT QUALITY/LEVEL OF SERVICE HANDBOOK
TABLE 1 (continued)
Generalized Annual Average Daily Volumes for Florida’s
Urbanized Areas
9/4/09
INPUT VALUE ASSUMPTIONS Uninterrupted Flow Facilities
Interrupted Flow Facilities State Arterials Class II
Freeways
Highw
ays
Class I
Class II
Class III
Bicycle
Pedestrian
Bus
ROADWAY CHARACTERISTICS Area type (l,o) l l l l l l l l l l l l Number of through lanes 4-12 2 4-6 2 4-8 2 4-8 2 4-8 4 4 Posted speed (mph) 65 50 50 45 50 45 45 35 35 45 45 Free flow speed (mph) 70 55 55 50 55 50 50 40 40 50 50 Aux, meter, or accel/decel >1500 (n,y) n Median (n, nr, r) n r n r n r n r r r Terrain (l,r) l l l % no passing zone 80 Exclusive left turn lanes /[impact](n, y) [n] y y y y y y y y y Exclusive right turn lanes (n, y) n n n n n n n n Paved shoulder/bicycle lane (n, y) n, 50%,y n Outside lane width t t Pavement condition t Sidewalk (n, y) n, 50%,y n,y Sidewalk/roadway separation (a, t, w) t Sidewalk protective barrier (n, y) n Obstacle to bus stop (n, y) n Facility length (mi) 4 5 5 2 2 2 2 2 2 2 2 2 Number of segments 4
TRAFFIC CHARACTERISTICS Planning analysis hour factor (K) 0.092 0.094 0.094 0.097 0.097 0.097 0.097 0.097 0.097 0.097 0.097 Directional distribution factor (D) 0.55 0.55 0.55 0.55 0.55 0.55 0.55 0.55 0.55 0.55 0.55 Peak hour factor (PHF) 0.95 0.925 0.925 0.925 0.925 0.925 0.925 0.925 0.925 0.925 0.925 Base saturation flow rate (pcphpl) 1700 2100 1950 1950 1950 1950 1950 1950 1950 1950 Heavy vehicle percent 4.0 2.0 2.0 2.0 2.0 2.0 2.0 1.5 1.5 2.0 2.0 Local adjustment factor 0.98 1.0 0.98 % left turns 12 12 12 12 12 12 12 12 % right turns 12 12 12 12 12 12 12 12 Bus span of service 15
CONTROL CHARACTERISTICS Number of signals 2 2 6 6 10 10 6 6 Arrival type (1-6) 3 3 4 4 4 4 4 4 Signal type (a, s, p) a a s s s s s s Cycle length (C) 120 120 120 120 120 120 120 120 Effective green ratio (g/C) 0.44 0.44 0.44 0.44 0.44 0.44 0.44 0.44
LEVEL OF SERVICE THRESHOLDS
Level of Service
Freeways Highway Segments State & Non-State Signalized Arterials
Bicycle Pedestrian Bus
Density Two-Lane Multilane Class I Class II Class III
Score Score Buses per hr. %ffs Density ats ats ats B ≤17 >0.833 ≤18 > 34 mph > 28 mph > 24 mph ≤2.5 ≤2.5 ≥4 C ≤24 >0.750 ≤26 > 27 mph > 22 mph > 18 mph ≤3.5 ≤3.5 ≥3 D ≤31 >0.667 ≤35 > 21 mph > 17 mph > 14 mph ≤4.5 ≤4.5 ≥2 E ≤39 >0.583 ≤41 > 16 mph > 13 mph > 10 mph ≤5.5 ≤5.5 ≥1
% ffs = Percent free flow speed ats = Average travel speed

www.dot.state.fl.us/planning/systems/sm/los/default.shtm 2009 FDOT QUALITY/LEVEL OF SERVICE HANDBOOK
TABLE 2 Generalized Annual Average Daily Volumes for Florida’s
Areas Transitioning into Urbanized Areas OR Areas Over 5,000 Not In Urbanized Areas1 10/4/10
STATE SIGNALIZED ARTERIALS Class I (>0.00 to 1.99 signalized intersections per mile)
Lanes Median B C D E 2 Undivided 8,900 14,100 15,200 *** 4 Divided 26,900 32,100 33,800 *** 6 Divided 41,500 48,600 51,000 ***
Class II (2.00 to 4.50 signalized intersections per mile) Lanes Median B C D E
2 Undivided ** 9,400 13,700 14,700 4 Divided ** 22,700 30,000 31,700 6 Divided ** 35,700 45,400 47,800
Class III (more than 4.5 signalized intersections per mile) Lanes Median B C D E
2 Undivided ** 4,700 10,700 13,400 4 Divided ** 11,500 25,500 28,900 6 Divided ** 18,000 39,800 43,900
FREEWAYS Lanes B C D E
4 42,600 57,600 68,700 73,600 6 63,900 86,600 103,300 113,700 8 85,200 115,600 137,600 153,700
10 106,400 145,600 172,400 192,800
Freeway Adjustments Auxiliary
Lanes Ramp
Metering + 20,000 +5%
Uninterrupted Flow Highway Adjustments Lanes Median Exclusive left lanes Adjustment factors
2 Divided Yes +5% Multi Undivided Yes -5% Multi Undivided No -25%
UNINTERRUPTED FLOW HIGHWAYS Lanes Median B C D E
2 Undivided 8,000 15,100 21,100 26,800 4 Divided 31,400 45,400 58,800 66,600 6 Divided 47,200 68,100 88,200 100,000
Non-State Signalized Roadway Adjustments (Alter corresponding state volumes by the indicated percent.)
Major City/County Roadways - 10%
Other Signalized Roadways - 35%
BICYCLE MODE2
(Multiply motorized vehicle volumes shown below by number of directional
roadway lanes to determine two-way maximum service volumes. Paved Shoulder/
Bicycle Lane Coverage B C D E
0-49% ** 2,800 7,300 >7,300 50-84% 2,200 3,400 13,100 >13,100 85-100% 4,100 >4,100 *** ***
PEDESTRIAN MODE2
(Multiply motorized vehicle volumes shown below by number of directional roadway lanes to determine two-way maximum service volumes.)
Sidewalk Coverage B C D E 0-49% ** ** 5,000 14,400
50-84% ** ** 11,300 18,800 85-100% ** 11,400 18,800 >18,800
State & Non-State Signalized Roadway Adjustments (Alter corresponding volume by the indicated percent.)
Divided/Undivided & Turn Lane Adjustments
Lanes Median Exclusive Left Lanes
Exclusive Right Lanes
Adjustment Factors
2 Divided Yes No +5% 2 Undivided No No -20%
Multi Undivided Yes No -5% Multi Undivided No No -25%
– – – Yes + 5%
One-Way Facility Adjustment Multiply the corresponding two-directional volumes in this table by 0.6.
1 Values shown are presented as two-way annual average daily volumes for levels of service and are for the automobile/truck modes unless specifically stated. Although presented as daily volumes, they actually represent peak hour direction conditions with applicable K and D factors applied. This table does not constitute a standard and should be used only for general planning applications. The computer models from which this table is derived should be used for more specific planning applications. The table and deriving computer models should not be used for corridor or intersection design, where more refined techniques exist. Calculations are based on planning applications of the Highway Capacity Manual, Bicycle LOS Model, Pedestrian LOS Model and Transit Capacity and Quality of Service Manual, respectively for the automobile/truck, bicycle, pedestrian and bus modes.
2 Level of service for the bicycle and pedestrian modes in this table is based on number of motorized vehicles, not number of bicyclists or pedestrians using the facility.
** Cannot be achieved using table input value defaults. *** Not applicable for that level of service letter grade. For the automobile mode, volumes greater than level of service D
become F because intersection capacities have been reached. For the bicycle mode, the level of service letter grade (including F) is not achievable because there is no maximum vehicle volume threshold using table input value defaults.
Source: Florida Department of Transportation Systems Planning Office 605 Suwannee Street, MS 19 Tallahassee, FL 32399-0450

2009 FDOT QUALITY/LEVEL OF SERVICE HANDBOOK
TABLE 2 (continued)
Generalized Annual Average Daily Volumes for Florida’s
Areas Transitioning Into Urbanized Areas OR Areas over 5,000 Not in Urbanized Areas 9/4/09
INPUT VALUE ASSUMPTIONS Uninterrupted Flow
Facilities Interrupted Flow Facilities
State Arterials Class II
Freeways
Highways
Class I
Class II
Class III
Bicycle
Pedestrian
ROADWAY CHARACATERISTICS Number of through lanes 4-10 2 4-6 2 4-6 2 4-6 2 4-6 4 4 Posted speed (mph) 70 50 50 45 50 45 45 35 35 45 45 Free flow speed (mph) 75 55 55 50 55 50 50 40 40 50 50 Aux, meter, or accel/decel >1500 (n,y) n n n Median (n, nr, r) n r n r n r n r r r Terrain (l, r) l l l % no passing zone 60 Exclusive left turn lanes/[impact] (n, y) [n] y y y y y y y y y Exclusive right turn lanes (n, y) n n n n n n n n Paved shoulder/bicycle lane (n, y) n,50%,y n Outside lane width t t Pavement condition t Sidewalk (n, y) n,50%,y
Sidewalk/roadway separation (a, t, w) t Sidewalk protective barrier (n, y) n Facility length (m) 8 5 5 2 2 2 2 2 2 2 2 Number of segments 4
TRAFFIC CHARACTERISTICS Planning analysis hour factor (K) 0.094 0.097 0.097 0.097 0.097 0.097 0.097 0.097 0.097 0.097 0.097 Directional distribution factor (D) 0.55 0.55 0.55 0.55 0.55 0.55 0.55 0.55 0.55 0.55 0.55 Peak hour factor (PHF) 0.950 0.910 0.910 0.910 0.910 0.910 0.910 0.910 0.910 0.910 0.910 Base capacity (pcphpl) 1700 2100 1950 1950 1950 1950 1950 1950 1950 1950 Heavy vehicle percent 9.0 4.0 4.0 3.0 3.0 3.0 3.0 2.0 2.0 3.0 3.0 Local adjustment factor 0.95 1.00 0.95 % left turns 12 12 12 12 12 12 12 12 % right turns 12 12 12 12 12 12 12 12
CONTROL CHARACTERISTICS Number of Signals 2 2 6 6 10 10 6 6 Arrival type (1-6) 3 3 4 4 4 4 4 4 Signal type (a, s, p) a a s s s s s s Cycle length (C) 120 120 120 120 120 120 120 120 Effective green ratio (g/C) 0.44 0.44 0.44 0.44 0.44 0.44 0.44 0.44
LEVEL OF SERVICE THRESHOLDS
Level of Service
Freeways Highway Segments State & Non-State Two-Way Arterials Bicycle Pedestrian
Density Two-Lane Multilane Class I Class II Class III
Score Score %ffs Density ats ats ats B ≤17 >0.833 ≤18 > 34 mph > 28 mph > 24 mph ≤2.5 ≤2.5 C ≤24 >0.750 ≤26 > 27 mph > 22 mph > 18 mph ≤3.5 ≤3.5 D ≤31 >0.667 ≤35 > 21 mph > 17 mph > 14 mph ≤4.5 ≤4.5 E ≤39 >0.583 ≤41 > 16 mph > 13 mph > 10 mph ≤5.5 ≤5.5
% ffs = Percent free flow speed ats = Average travel speed

www.dot.state.fl.us/planning/systems/sm/los/default.shtm 2009 FDOT QUALITY/LEVEL OF SERVICE HANDBOOK
TABLE 3 Generalized Annual Average Daily Volumes for Florida’s
Rural Undeveloped Areas and Cities OR Developed Areas Less than 5,000 Population1 10/4/10
Rural Undeveloped Areas Cities or Rural Developed Areas Less Than 5000
Freeway Adjustments Auxiliary Lanes
+18,000
FREEWAYS Lanes B C D E
4 37,100 50,800 59,900 63,700 6 56,500 76,400 89,900 98,300 8 75,100 101,100 119,900 132,900
Freeway Adjustments Auxiliary Lanes
+18,000
FREEWAYS Lanes B C D E
4 37,100 49,900 59,400 63,700 6 54,800 74,600 89,000 98,300 8 73,300 100,200 118,700 132,700
UNINTERRUPTED FLOW TWO-LANE HIGHWAYS Lanes Median B C D E
2 Undivided 4,500 8,100 13,800 27,600 Passing Lane Adjustment
Alter LOS B-D volumes in proportion to passing lane length to the highway segment length.
UNINTERRUPTED FLOW MULTILANE HIGHWAYS Lanes Median B C D E
4 Divided 26,300 41,100 52,100 59,100 6 Divided 39,400 61,700 78,000 88,600
Uninterrupted Flow Highway Adjustments Lanes Median Exclusive left lanes Adjustment factors
2 Divided Yes +5% Multi Undivided Yes -5% Multi Undivided No -25%
UNINTERRUPTED FLOW HIGHWAYS Lanes Median B C D E
2 Undivided 7,800 14,200 20,000 25,600 4 Divided 23,800 37,200 48,000 54,600 6 Divided 35,600 55,800 72,000 82,000
ISOLATED STATE SIGNALIZED INTERSECTIONS Lanes B C D E
2 ** 4,700 10,400 12,300 4 ** 10,300 23,200 25,500 6 ** 15,800 36,000 38,500
STATE SIGNALIZED ARTERIALS Lanes Median B C D E
2 Undivided ** 9,800 13,000 13,900 4 Divided ** 23,300 28,000 29,900 6 Divided ** 36,400 42,400 45,000
Non-State Signalized Roadway Adjustments (Alter corresponding state volumes by the indicated percent.)
Major City/County Roadways - 10% Other Signalized Roadways - 35%
State & Non-State Signalized Roadway Adjustments (Alter corresponding volume by the indicated percent.)
Divided/Undivided & Turn Lane Adjustments
Lanes Median
Exclusive Left Turn
Lanes
Exclusive Right Turn
Lanes Adjustment
Factors 2 Divided Yes No +5% 2 Undivided No No -20%
Multi Undivided Yes No -5% Multi Undivided No No -25%
– – – Yes + 5%
BICYCLE MODE2 (Multiply motorized vehicle volumes shown below by number of directional
roadway lanes to determine two-way maximum service volumes.) Paved Shoulder/
Bicycle Lane Coverage B C D E
0-49% ** ** ** 7,800 50-84% ** ** ** 14,000 85-100% ** 4,200 >4,200 ***
1 Values shown are presented as two-way annual average daily volumes for levels of service and are for the automobile/truck modes unless specifically stated. Although presented as daily volumes, they actually represent peak hour direction conditions with applicable K and D factors applied. This table does not constitute a standard and should be used only for general planning applications. The computer models from which this table is derived should be used for more specific planning applications. The table and deriving computer models should not be used for corridor or intersection design, where more refined techniques exist. Calculations are based on planning applications of the Highway Capacity Manual, Bicycle LOS Model and Pedestrian LOS Model, respectively for the automobile/truck, bicycle, and pedestrian modes. 2 Level of service for the bicycle and pedestrian modes in this table is based on number of motorized vehicles, not number of bicyclists or pedestrians using the facility. ** Cannot be achieved using table input value defaults.
*** Not applicable for that level of service letter grade. For the automobile mode, volumes greater than level of service D become F because intersection capacities have been reached. For the bicycle mode, the level of service letter grade (including F) is not achievable because there is no maximum vehicle volume threshold using table input value defaults.
Source: Florida Department of Transportation Systems Planning Office 605 Suwannee Street, MS 19 Tallahassee, FL 32399-0450
BICYCLE MODE2 (Multiply motorized vehicle volumes shown below by number of directional
roadway lanes to determine two-way maximum service volumes.) Paved Shoulder/
Bicycle Lane Coverage B C D E
0-49% ** 2,800 7,300 >7,300 50-84% 2,200 3,400 13,100 >13,100 85-100% 4,100 >4,100 *** ***
PEDESTRIAN MODE2
(Multiply motorized vehicle volumes shown below by number of directional roadway lanes to determine two-way maximum service volumes.)
Sidewalk Coverage B C D E
0-49% ** ** 5,000 14,400 50-84% ** ** 11,300 18,800
85-100% ** 11,400 18,800 >18,800

2009 FDOT QUALITY/LEVEL OF SERVICE HANDBOOK
TABLE 3 (continued)
Generalized Annual Average Daily Volumes for Florida’s
Rural Undeveloped Areas and Cities OR Developed Areas Less than 5,000 Population
9/4/09
INPUT VALUE ASSUMPTIONS Uninterrupted Flow Facilities Interrupted Flow Facilities
Freeways
Highways
Isolated Signalized Intersections
Arterials Class I
Bicycle Class I
Pedestrian Class I
ROADWAY CHARACTERISTICS Area type (ru, rd) ru/rd ru ru rd rd ru rd rd ru rd rd Number of through lanes 4-8 2 4-6 2 4-6 2-6 2 4-6 2 2 2 Posted speed (mph) 70 55 65 50 55 45 45 55 45 45 Free flow speed (mph) 75 60 70 55 60 50 50 60 50 50 Aux, meter, or accel/decel >1500 (n,y) n Median (n, nr, r) n r n r n n r n n n
Terrain (l,r) l l l l l % no passing zone 20 60 Exclusive left turn lanes/[impact] (n, y) [n] y [n] y y y y [n] y y Exclusive right turn lanes (n, y) Paved shoulder/bicycle lane (n, y) n,50%,y n,50%,y n,50%,y Outside lane width Pavement condition Sidewalk (n, y) Sidewalk/roadway separation (a, t, w) Sidewalk protective barrier (n, y) Obstacle to bus stop (n, y) Facility length (mi) 14 10 10 5 5 2 2 4 2 2 Number of segments 4
TRAFFIC CHARACTERISTICS Planning analysis hour factor (K) 0.103 0.098 0.098 0.100 0.100 0.098 0.097 0.097 0.098 0.097 0.097 Directional distribution factor (D) 0.55 0.55 0.55 0.55 0.55 0.55 0.55 0.55 0.55 0.55 0.55 Peak hour factor (PHF) 0.95 0.88 0.88 0.895 0.895 0.88 0.895 0.895 0.88 0.895 0.895 Base saturation flow rate (pcphpl) 1700 2300 1700 2200 1950 1950 1950 1950 1950 1950 Heavy vehicle percent 9.0 5.0 9.0 4.0 4.0 5.0 3.0 3.0 6.0 3.0 3.0 Local adjustment factor 0.90 1.00 0.86 1.00 0.93 % left turns 12 12 12 12 12 % right turns 12 12 12 12 12 12
CONTROL CHARACTERISTICS Number of signals 4 4 2 4 4 Arrival type (1-6) 3 3 3 3 3 3 Signal type (a, s, p) a s s a s s Cycle length (C) 60 90 90 60 90 90 Effective green ratio (g/C) 0.44 0.44 0.44 0.44 0.44 0.44
LEVEL OF SERVICE THRESHOLDS
Level of Service
Freeways Highway Segments Isolated
Intersections Arterials Bicycle Pedestrian
Density
Two-Lane ru
Two-Lane rd
Multilane ru
Multilane rd
Other (Control delay)
Major City/Co.
Score Score %tsf %ffs ats ats ats ats B ≤17 ≤50 >0.833 ≤14 ≤14 ≤10 sec > 34 mph ≤2.5 ≤2.5 C ≤24 ≤65 >0.750 ≤22 ≤22 ≤15 sec > 27 mph ≤3.5 ≤3.5 D ≤31 ≤80 >0.667 ≤29 ≤29 ≤20 sec > 21 mph ≤4.5 ≤4.5 E ≤39 >80 >0.583 ≤34 ≤34 ≤40 sec > 16 mph ≤5.5 ≤5.5
% tsf = Percent time spent following % ffs = Percent free flow speed ats = Average travel speed ru = Rural undeveloped rd = Rural developed
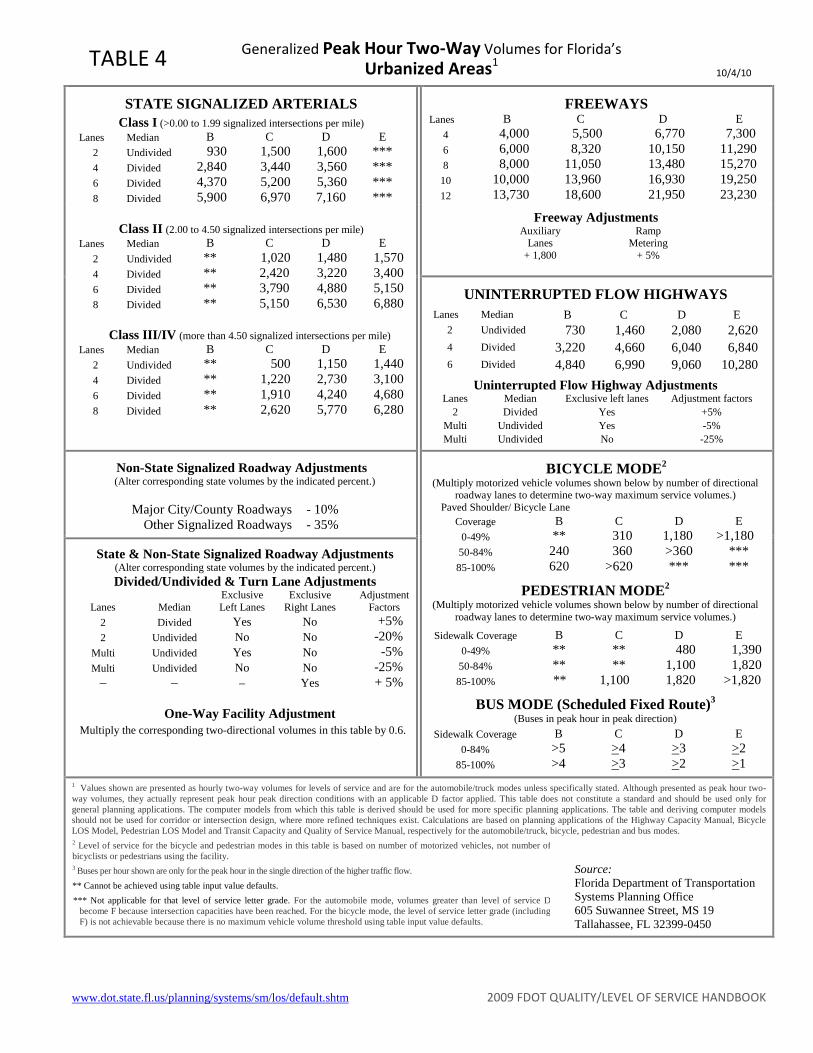
www.dot.state.fl.us/planning/systems/sm/los/default.shtm 2009 FDOT QUALITY/LEVEL OF SERVICE HANDBOOK
TABLE 4 Generalized Peak Hour Two-Way Volumes for Florida’s Urbanized Areas1
10/4/10
STATE SIGNALIZED ARTERIALS Class I (>0.00 to 1.99 signalized intersections per mile)
Lanes Median B C D E 2 Undivided 930 1,500 1,600 *** 4 Divided 2,840 3,440 3,560 *** 6 Divided 4,370 5,200 5,360 *** 8 Divided 5,900 6,970 7,160 ***
Class II (2.00 to 4.50 signalized intersections per mile) Lanes Median B C D E
2 Undivided ** 1,020 1,480 1,570 4 Divided ** 2,420 3,220 3,400 6 Divided ** 3,790 4,880 5,150 8 Divided ** 5,150 6,530 6,880
Class III/IV (more than 4.50 signalized intersections per mile) Lanes Median B C D E
2 Undivided ** 500 1,150 1,440 4 Divided ** 1,220 2,730 3,100 6 Divided ** 1,910 4,240 4,680 8 Divided ** 2,620 5,770 6,280
FREEWAYS Lanes B C D E
4 4,000 5,500 6,770 7,300 6 6,000 8,320 10,150 11,290 8 8,000 11,050 13,480 15,270
10 10,000 13,960 16,930 19,250 12 13,730 18,600 21,950 23,230
Freeway Adjustments Auxiliary
Lanes Ramp
Metering
+ 1,800 + 5%
Uninterrupted Flow Highway Adjustments Lanes Median Exclusive left lanes Adjustment factors
2 Divided Yes +5% Multi Undivided Yes -5% Multi Undivided No -25%
UNINTERRUPTED FLOW HIGHWAYS Lanes Median B C D E
2 Undivided 730 1,460 2,080 2,620 4 Divided 3,220 4,660 6,040 6,840 6 Divided 4,840 6,990 9,060 10,280
Non-State Signalized Roadway Adjustments (Alter corresponding state volumes by the indicated percent.)
Major City/County Roadways - 10%
Other Signalized Roadways - 35%
BICYCLE MODE2 (Multiply motorized vehicle volumes shown below by number of directional
roadway lanes to determine two-way maximum service volumes.) Paved Shoulder/ Bicycle Lane
C D E Coverage B 0-49% ** 310 1,180 >1,180
50-84% 240 360 >360 *** 85-100% 620 >620 *** ***
PEDESTRIAN MODE2
(Multiply motorized vehicle volumes shown below by number of directional roadway lanes to determine two-way maximum service volumes.)
Sidewalk Coverage B C D E 0-49% ** ** 480 1,390
50-84% ** ** 1,100 1,820 85-100% ** 1,100 1,820 >1,820
BUS MODE (Scheduled Fixed Route)3 (Buses in peak hour in peak direction)
Sidewalk Coverage B C D E 0-84% >5 >4 >3 >2
85-100% >4 >3 >2 >1
State & Non-State Signalized Roadway Adjustments (Alter corresponding state volumes by the indicated percent.) Divided/Undivided & Turn Lane Adjustments
Lanes Median Exclusive Left Lanes
Exclusive Right Lanes
Adjustment Factors
2 Divided Yes No +5% 2 Undivided No No -20%
Multi Undivided Yes No -5% Multi Undivided No No -25%
– – – Yes + 5%
One-Way Facility Adjustment Multiply the corresponding two-directional volumes in this table by 0.6.
1 Values shown are presented as hourly two-way volumes for levels of service and are for the automobile/truck modes unless specifically stated. Although presented as peak hour two-way volumes, they actually represent peak hour peak direction conditions with an applicable D factor applied. This table does not constitute a standard and should be used only for general planning applications. The computer models from which this table is derived should be used for more specific planning applications. The table and deriving computer models should not be used for corridor or intersection design, where more refined techniques exist. Calculations are based on planning applications of the Highway Capacity Manual, Bicycle LOS Model, Pedestrian LOS Model and Transit Capacity and Quality of Service Manual, respectively for the automobile/truck, bicycle, pedestrian and bus modes. 2 Level of service for the bicycle and pedestrian modes in this table is based on number of motorized vehicles, not number of bicyclists or pedestrians using the facility. 3 Buses per hour shown are only for the peak hour in the single direction of the higher traffic flow. ** Cannot be achieved using table input value defaults.
*** Not applicable for that level of service letter grade. For the automobile mode, volumes greater than level of service D become F because intersection capacities have been reached. For the bicycle mode, the level of service letter grade (including F) is not achievable because there is no maximum vehicle volume threshold using table input value defaults.
Source: Florida Department of Transportation Systems Planning Office 605 Suwannee Street, MS 19 Tallahassee, FL 32399-0450

2009 FDOT QUALITY/LEVEL OF SERVICE HANDBOOK
TABLE 4 (continued)
Generalized Peak Hour Two-Way Volumes for Florida’s
Urbanized Areas 9/4/09
INPUT VALUE ASSUMPTIONS Uninterrupted Flow Facilities
Interrupted Flow Facilities State Arterials Class II
Freeways
Highw
ays
Class I
Class II
Class III
Bicycle
Pedestrian
Bus
ROADWAY CHARACTERISTICS Area type (l,o) l l l l l l l l l l l l Number of through lanes 4-12 2 4-6 2 4-8 2 4-8 2 4-8 4 4 Posted speed (mph) 65 50 50 45 50 45 45 35 35 45 45 Free flow speed (mph) 70 55 55 50 55 50 50 40 40 50 50 Aux, meter, or accel/decel >1500 (n,y) n Median (n, nr, r) n r n r n r n r r r Terrain (l,r) l l l % no passing zone 80 Exclusive left turn lanes /[impact](n, y) [n] y y y y y y y y y Exclusive right turn lanes (n, y) n n n n n n n n Paved shoulder/bicycle lane (n, y) n, 50%,y n Outside lane width t t Pavement condition t Sidewalk (n, y) n, 50%,y n,y Sidewalk/roadway separation (a, t, w) t Sidewalk protective barrier (n, y) n Obstacle to bus stop (n, y) n Facility length (mi) 4 5 5 2 2 2 2 2 2 2 2 2 Number of segments 4
TRAFFIC CHARACTERISTICS Planning analysis hour factor (K) 0.092 0.094 0.094 0.097 0.097 0.097 0.097 0.097 0.097 0.097 0.097 Directional distribution factor (D) 0.55 0.55 0.55 0.55 0.55 0.55 0.55 0.55 0.55 0.55 0.55 Peak hour factor (PHF) 0.95 0.925 0.925 0.925 0.925 0.925 0.925 0.925 0.925 0.925 0.925 Base saturation flow rate (pcphpl) 1700 2100 1950 1950 1950 1950 1950 1950 1950 1950 Heavy vehicle percent 4.0 2.0 2.0 2.0 2.0 2.0 2.0 1.5 1.5 2.0 2.0 Local adjustment factor 0.98 1.0 0.98 % left turns 12 12 12 12 12 12 12 12 % right turns 12 12 12 12 12 12 12 12 Bus span of service 15
CONTROL CHARACTERISTICS Number of signals 2 2 6 6 10 10 6 6 Arrival type (1-6) 3 3 4 4 4 4 4 4 Signal type (a, s, p) a a s s s s s s Cycle length (C) 120 120 120 120 120 120 120 120 Effective green ratio (g/C) 0.44 0.44 0.44 0.44 0.44 0.44 0.44 0.44
LEVEL OF SERVICE THRESHOLDS
Level of Service
Freeways Highway Segments State & Non-State Signalized Arterials
Bicycle Pedestrian Bus
Density Two-Lane Multilane Class I Class II Class III
Score Score Buses per hr. %ffs Density ats ats ats B ≤17 >0.833 ≤18 > 34 mph > 28 mph > 24 mph ≤2.5 ≤2.5 ≥4 C ≤24 >0.750 ≤26 > 27 mph > 22 mph > 18 mph ≤3.5 ≤3.5 ≥3 D ≤31 >0.667 ≤35 > 21 mph > 17 mph > 14 mph ≤4.5 ≤4.5 ≥2 E ≤39 >0.583 ≤41 > 16 mph > 13 mph > 10 mph ≤5.5 ≤5.5 ≥1
% ffs = Percent free flow speed ats = Average travel speed

www.dot.state.fl.us/planning/systems/sm/los/default.shtm 2009 FDOT QUALITY/LEVEL OF SERVICE HANDBOOK
TABLE 5 Generalized Peak Hour Two-Way Volumes for Florida’s
Areas Transitioning into Urbanized Areas OR Areas Over 5,000 Not In Urbanized Areas1 10/4/10
STATE SIGNALIZED ARTERIALS Class I (>0.00 to 1.99 signalized intersections per mile)
Lanes Median B C D E 2 Undivided 860 1,370 1,480 *** 4 Divided 2,600 3,110 3,280 *** 6 Divided 4,020 4,710 4,950 ***
Class II (2.00 to 4.50 signalized intersections per mile) Lanes Median B C D E
2 Undivided ** 910 1,330 1,420 4 Divided ** 2,200 2,910 3,080 6 Divided ** 3,460 4,400 4,640
Class III/IV(more than 4.50 signalized intersections per mile) Lanes Median B C D E
2 Undivided ** 460 1,040 1,300 4 Divided ** 1,110 2,480 2,800 6 Divided ** 1,750 3,860 4,260
FREEWAYS Lanes B C D E
4 4,000 5,410 6,460 6,920 6 6,000 8,140 9,710 10,690 8 8,000 10,870 12,930 14,450
10 10,000 13,690 16,200 18,120
Freeway Adjustments Auxiliary
Lanes Ramp
Metering + 1,800 + 5%
Uninterrupted Flow Highway Adjustments Lanes Median Exclusive left lanes Adjustment factors
2 Divided Yes +5% Multi Undivided Yes -5% Multi Undivided No -25%
UNINTERRUPTED FLOW HIGHWAYS Lanes Median B C D E
2 Undivided 770 1,460 2,040 2,590 4 Divided 3,040 4,400 5,700 6,460 6 Divided 4,570 6,600 8,550 9,700
Non-State Signalized Roadway Adjustments (Alter corresponding volume by the indicated percent.)
Major City/County Roadways - 10%
Other Signalized Roadways - 35%
BICYCLE MODE2 (Multiply motorized vehicle volumes shown below by number of directional
roadway lanes to determine two-way maximum service volumes.) Paved Shoulder/ Bicycle Lane
C D E Coverage B 0-49% ** 270 710 >710
50-84% 220 330 1,270 >1,270 85-100% 400 >400 *** ***
PEDESTRIAN MODE2
(Multiply motorized vehicle volumes shown below by number of directional roadway lanes to determine two-way maximum service volumes.)
Sidewalk Coverage B C D E 0-49% ** ** 480 1,390
50-84% ** ** 1,100 1,820 85-100% ** 1,100 1,820 >1,820
State & Non-State Signalized Roadway Adjustments (Alter corresponding volume by the indicated percent.)
Divided/Undivided & Turn Lane Adjustments
Lanes Median Exclusive Left Lanes
Exclusive Right Lanes
Adjustment Factors
2 Divided Yes No +5% 2 Undivided No No -20%
Multi Undivided Yes No -5% Multi Undivided No No -25%
– – – Yes + 5%
One-Way Facility Adjustment Multiply the corresponding two-directional volumes in this table by 0.6.
1 Values shown are presented as hourly two-way volumes for levels of service and are for the automobile/truck modes unless specifically stated. Although presented as peak hour two-way volumes, they actually represent peak hour direction conditions with an applicable D factor applied. This table does not constitute a standard and should be used only for general planning applications. The computer models from which this table is derived should be used for more specific planning applications. The table and deriving computer models should not be used for corridor or intersection design, where more refined techniques exist. Calculations are based on planning applications of the Highway Capacity Manual, Bicycle LOS Model, Pedestrian LOS Model and Transit Capacity and Quality of Service Manual, respectively for the automobile/truck, bicycle, pedestrian and bus modes. 2 Level of service for the bicycle and pedestrian modes in this table is based on number of motorized vehicles, not number of bicyclists or pedestrians using the facility. 3 Buses per hour shown are only for the peak hour in the single direction of the higher traffic flow. ** Cannot be achieved using table input value defaults.
*** Not applicable for that level of service letter grade. For the automobile mode, volumes greater than level of service D become F because intersection capacities have been reached. For the bicycle mode, the level of service letter grade (including F) is not achievable because there is no maximum vehicle volume threshold using table input value defaults.
Source: Florida Department of Transportation Systems Planning Office 605 Suwannee Street, MS 19 Tallahassee, FL 32399-0450

2009 FDOT QUALITY/LEVEL OF SERVICE HANDBOOK
TABLE 5 (continued)
Generalized Peak Hour Two-Way Volumes for Florida’s
Areas Transitioning Into Urbanized Areas OR Areas over 5,000 Not in Urbanized Areas 9/4/09
INPUT VALUE ASSUMPTIONS Uninterrupted Flow
Facilities Interrupted Flow Facilities
State Arterials Class II
Freeways
Highways
Class I
Class II
Class III
Bicycle
Pedestrian
ROADWAY CHARACATERISTICS Number of through lanes 4-10 2 4-6 2 4-6 2 4-6 2 4-6 4 4 Posted speed (mph) 70 50 50 45 50 45 45 35 35 45 45 Free flow speed (mph) 75 55 55 50 55 50 50 40 40 50 50 Aux, meter, or accel/decel >1500 (n,y) n n n Median (n, nr, r) n r n r n r n r r r Terrain (l, r) l l l % no passing zone 60 Exclusive left turn lanes/[impact] (n, y) [n] y y y y y y y y y Exclusive right turn lanes (n, y) n n n n n n n n Paved shoulder/bicycle lane (n, y) n,50%,y n Outside lane width t t Pavement condition t Sidewalk (n, y) n,50%,y
Sidewalk/roadway separation (a, t, w) t Sidewalk protective barrier (n, y) n Facility length (m) 8 5 5 2 2 2 2 2 2 2 2 Number of segments 4
TRAFFIC CHARACTERISTICS Planning analysis hour factor (K) 0.094 0.097 0.097 0.097 0.097 0.097 0.097 0.097 0.097 0.097 0.097 Directional distribution factor (D) 0.55 0.55 0.55 0.55 0.55 0.55 0.55 0.55 0.55 0.55 0.55 Peak hour factor (PHF) 0.950 0.910 0.910 0.910 0.910 0.910 0.910 0.910 0.910 0.910 0.910 Base capacity (pcphpl) 1700 2100 1950 1950 1950 1950 1950 1950 1950 1950 Heavy vehicle percent 9.0 4.0 4.0 3.0 3.0 3.0 3.0 2.0 2.0 3.0 3.0 Local adjustment factor 0.950 1.00 0.950 % left turns 12 12 12 12 12 12 12 12 % right turns 12 12 12 12 12 12 12 12
CONTROL CHARACTERISTICS Number of Signals 2 2 6 6 10 10 6 6 Arrival type (1-6) 3 3 4 4 4 4 4 4 Signal type (a, s, p) a a s s s s s s Cycle length (C) 120 120 120 120 120 120 120 120 Effective green ratio (g/C) 0.44 0.44 0.44 0.44 0.44 0.44 0.44 0.44
LEVEL OF SERVICE THRESHOLDS
Level of Service
Freeways Highway Segments State & Non-State Two-Way Arterials Bicycle Pedestrian
Density Two-Lane Multilane Class I Class II Class III
Score Score %ffs Density ats ats ats B ≤17 >0.833 ≤18 > 34 mph > 28 mph > 24 mph <2.5 <2.5 C ≤24 >0.750 ≤26 > 27 mph > 22 mph > 18 mph ≤3.5 ≤3.5 D ≤31 >0.667 ≤35 > 21 mph > 17 mph > 14 mph ≤4.5 ≤4.5 E ≤39 >0.583 ≤41 > 16 mph > 13 mph > 10 mph ≤5.5 ≤5.5
% ffs = Percent free flow speed ats = Average travel speed
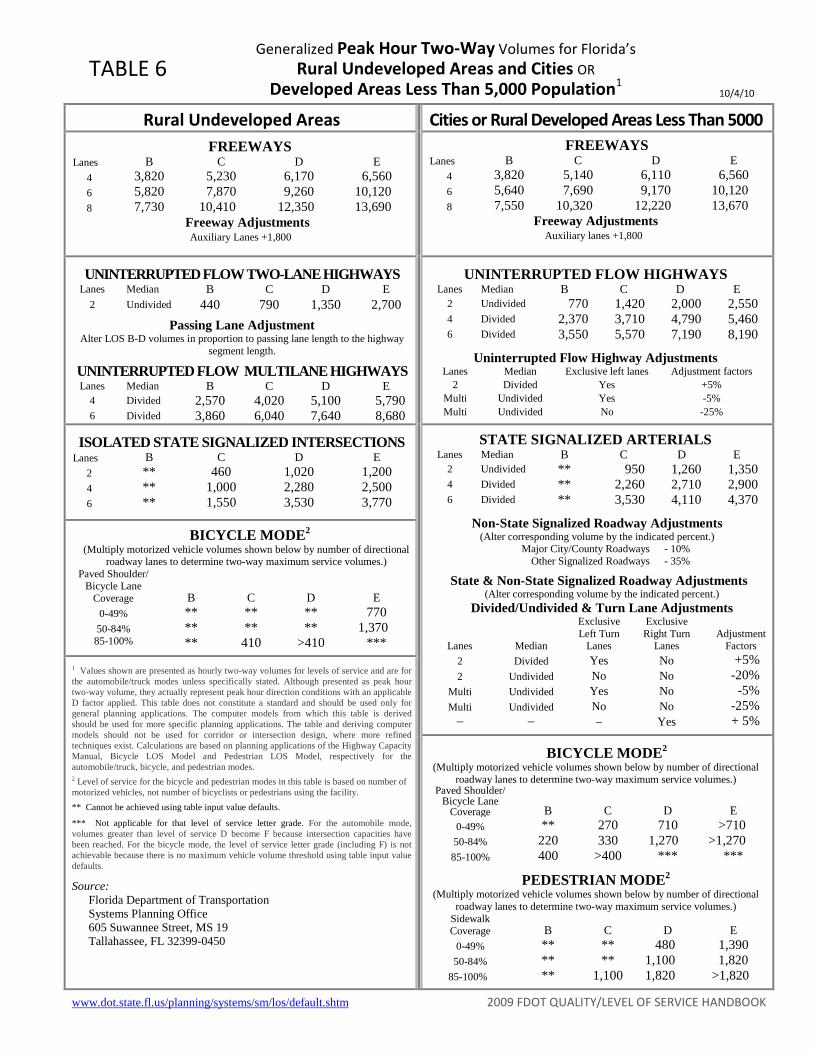
www.dot.state.fl.us/planning/systems/sm/los/default.shtm 2009 FDOT QUALITY/LEVEL OF SERVICE HANDBOOK
TABLE 6 Generalized Peak Hour Two-Way Volumes for Florida’s
Rural Undeveloped Areas and Cities OR Developed Areas Less Than 5,000 Population1 10/4/10
Rural Undeveloped Areas Cities or Rural Developed Areas Less Than 5000
Freeway Adjustments Auxiliary Lanes +1,800
FREEWAYS Lanes B C D E
4 3,820 5,230 6,170 6,560 6 5,820 7,870 9,260 10,120 8 7,730 10,410 12,350 13,690
Freeway Adjustments Auxiliary lanes +1,800
FREEWAYS Lanes B C D E
4 3,820 5,140 6,110 6,560 6 5,640 7,690 9,170 10,120 8 7,550 10,320 12,220 13,670
UNINTERRUPTED FLOW TWO-LANE HIGHWAYS Lanes Median B C D E
2 Undivided 440 790 1,350 2,700 Passing Lane Adjustment
Alter LOS B-D volumes in proportion to passing lane length to the highway segment length.
UNINTERRUPTED FLOW MULTILANE HIGHWAYS Lanes Median B C D E
4 Divided 2,570 4,020 5,100 5,790 6 Divided 3,860 6,040 7,640 8,680
Uninterrupted Flow Highway Adjustments Lanes Median Exclusive left lanes Adjustment factors
2 Divided Yes +5% Multi Undivided Yes -5% Multi Undivided No -25%
UNINTERRUPTED FLOW HIGHWAYS Lanes Median B C D E
2 Undivided 770 1,420 2,000 2,550 4 Divided 2,370 3,710 4,790 5,460 6 Divided 3,550 5,570 7,190 8,190
ISOLATED STATE SIGNALIZED INTERSECTIONS Lanes B C D E
2 ** 460 1,020 1,200 4 ** 1,000 2,280 2,500 6 ** 1,550 3,530 3,770
STATE SIGNALIZED ARTERIALS Lanes Median B C D E
2 Undivided ** 950 1,260 1,350 4 Divided ** 2,260 2,710 2,900 6 Divided ** 3,530 4,110 4,370
Non-State Signalized Roadway Adjustments (Alter corresponding volume by the indicated percent.)
Major City/County Roadways - 10% Other Signalized Roadways - 35%
State & Non-State Signalized Roadway Adjustments (Alter corresponding volume by the indicated percent.)
Divided/Undivided & Turn Lane Adjustments
Lanes Median
Exclusive Left Turn
Lanes
Exclusive Right Turn
Lanes Adjustment
Factors 2 Divided Yes No +5% 2 Undivided No No -20%
Multi Undivided Yes No -5% Multi Undivided No No -25%
– – – Yes + 5%
BICYCLE MODE2 (Multiply motorized vehicle volumes shown below by number of directional
roadway lanes to determine two-way maximum service volumes.) Paved Shoulder/
Bicycle Lane Coverage B C D E
0-49% ** ** ** 770 50-84% ** ** ** 1,370 85-100% ** 410 >410 ***
1 Values shown are presented as hourly two-way volumes for levels of service and are for the automobile/truck modes unless specifically stated. Although presented as peak hour two-way volume, they actually represent peak hour direction conditions with an applicable D factor applied. This table does not constitute a standard and should be used only for general planning applications. The computer models from which this table is derived should be used for more specific planning applications. The table and deriving computer models should not be used for corridor or intersection design, where more refined techniques exist. Calculations are based on planning applications of the Highway Capacity Manual, Bicycle LOS Model and Pedestrian LOS Model, respectively for the automobile/truck, bicycle, and pedestrian modes. 2 Level of service for the bicycle and pedestrian modes in this table is based on number of motorized vehicles, not number of bicyclists or pedestrians using the facility. ** Cannot be achieved using table input value defaults.
*** Not applicable for that level of service letter grade. For the automobile mode, volumes greater than level of service D become F because intersection capacities have been reached. For the bicycle mode, the level of service letter grade (including F) is not achievable because there is no maximum vehicle volume threshold using table input value defaults.
Source: Florida Department of Transportation Systems Planning Office 605 Suwannee Street, MS 19 Tallahassee, FL 32399-0450
BICYCLE MODE2 (Multiply motorized vehicle volumes shown below by number of directional
roadway lanes to determine two-way maximum service volumes.) Paved Shoulder/
Bicycle Lane Coverage B C D E
0-49% ** 270 710 >710 50-84% 220 330 1,270 >1,270 85-100% 400 >400 *** ***
PEDESTRIAN MODE2
(Multiply motorized vehicle volumes shown below by number of directional roadway lanes to determine two-way maximum service volumes.)
Sidewalk Coverage B C D E
0-49% ** ** 480 1,390 50-84% ** ** 1,100 1,820
85-100% ** 1,100 1,820 >1,820

2009 FDOT QUALITY/LEVEL OF SERVICE HANDBOOK
TABLE 6 (continued)
Generalized Peak Hour Two-Way Volumes for Florida’s
Rural Undeveloped Areas and Cities OR Developed Areas Less than 5,000 Population 9/4/09
INPUT VALUE ASSUMPTIONS Uninterrupted Flow Facilities Interrupted Flow Facilities
Freeways
Highways
Isolated Signalized Intersections
Arterials Class I
Bicycle Class I
Pedestrian Class I
ROADWAY CHARACTERISTICS Area type (ru, rd) ru/rd ru ru rd rd ru rd rd ru rd rd Number of through lanes 4-8 2 4-6 2 4-6 2-6 2 4-6 2 2 2 Posted speed (mph) 70 55 65 50 55 45 45 55 45 45 Free flow speed (mph) 75 60 70 55 60 50 50 60 50 50 Aux, meter, or accel/decel >1500 (n,y) n Median (n, nr, r) n r n r n n r n n n
Terrain (l,r) l l l l l % no passing zone 20 60 Exclusive left turn lanes/[impact] (n, y) [n] y [n] y y y y [n] y y Exclusive right turn lanes (n, y) Paved shoulder/bicycle lane (n, y) n,50%,y n,50%,y n,50%,y Outside lane width Pavement condition Sidewalk (n, y) Sidewalk/roadway separation (a, t, w) Sidewalk protective barrier (n, y) Obstacle to bus stop (n, y) Facility length (mi) 14 10 10 5 5 2 2 4 2 2 Number of segments 4
TRAFFIC CHARACTERISTICS Planning analysis hour factor (K) 0.103 0.098 0.098 0.100 0.100 0.098 0.097 0.097 0.098 0.097 0.097 Directional distribution factor (D) 0.55 0.55 0.55 0.55 0.55 0.55 0.55 0.55 0.55 0.55 0.55 Peak hour factor (PHF) 0.950 0.880 0.880 0.895 0.895 0.88 0.895 0.895 0.88 0.895 0.895 Base saturation flow rate (pcphpl) 1700 2300 1700 2200 1950 1950 1950 1950 1950 1950 Heavy vehicle percent 9.0 5.0 9.0 4.0 4.0 5.0 3.0 3.0 6.0 3.0 3.0 Local adjustment factor 0.90 1.00 0.86 1.00 0.93 % left turns 12 12 12 12 12 % right turns 12 12 12 12 12 12
CONTROL CHARACTERISTICS Number of signals 4 4 2 4 4 Arrival type (1-6) 3 3 3 3 3 3 Signal type (a, s, p) a s s a s s Cycle length (C) 60 90 90 60 90 90 Effective green ratio (g/C) 0.44 0.44 0.44 0.44 0.44 0.44
LEVEL OF SERVICE THRESHOLDS
Level of Service
Freeways Highway Segments Isolated
Intersections Arterials Bicycle Pedestrian
Density
Two-Lane ru
Two-Lane rd
Multilane ru
Multilane rd
Other (Control delay)
Major City/Co.
Score Score %tsf %ffs ats ats ats ats B ≤17 ≤50 >0.833 ≤14 ≤14 ≤10 sec > 34 mph ≤2.5 ≤2.5 C ≤24 ≤65 >0.750 ≤22 ≤22 ≤15 sec > 27 mph ≤3.5 ≤3.5 D ≤31 ≤80 >0.667 ≤29 ≤29 ≤20 sec > 21 mph ≤4.5 ≤4.5 E ≤39 >80 >0.583 ≤34 ≤34 ≤40 sec > 16 mph ≤5.5 ≤5.5
% tsf = Percent time spent following % ffs = Percent free flow speed ats = Average travel speed ru = Rural undeveloped rd = Rural developed

www.dot.state.fl.us/planning/systems/sm/los/default.shtm 2009 FDOT QUALITY/LEVEL OF SERVICE HANDBOOK
TABLE 7 Generalized Peak Hour Directional Volumes for Florida’s
Urbanized Areas1 10/4/10
STATE SIGNALIZED ARTERIALS Class I (>0.00 to 1.99 signalized intersections per mile)
Lanes Median B C D E 1 Undivided 510 820 880 *** 2 Divided 1,560 1,890 1,960 *** 3 Divided 2,400 2,860 2,940 *** 4 Divided 3,240 3,830 3,940 ***
Class II (2.00 to 4.50 signalized intersections per mile) Lanes Median B C D E
1 Undivided ** 560 810 860 2 Divided ** 1,330 1,770 1,870 3 Divided ** 2,080 2,680 2,830 4 Divided ** 2,830 3,590 3,780
Class III/IV (more than 4.50 signalized intersections per mile) Lanes Median B C D E
1 Undivided ** 270 630 790 2 Divided ** 670 1,500 1,700 3 Divided ** 1,050 2,330 2,570 4 Divided ** 1,440 3,170 3,450
FREEWAYS Lanes B C D E
2 2,200 3,020 3,720 4,020 3 3,300 4,580 5,580 6,200 4 4,400 6,080 7,420 8,400 5 5,500 7,680 9,320 10,580 6 7,560 10,220 12,080 12,780
Freeway Adjustments Auxiliary
Lanes Ramp
Metering
+ 1,000 + 5%
Uninterrupted Flow Highway Adjustments Lanes Median Exclusive left lanes Adjustment factors
2 Divided Yes +5% Multi Undivided Yes -5% Multi Undivided No -25%
UNINTERRUPTED FLOW HIGHWAYS Lanes Median B C D E
1 Undivided 400 800 1,140 1,440 2 Divided 1,770 2,560 3,320 3,760 3 Divided 2,660 3,840 4,980 5,650
Non-State Signalized Roadway Adjustments (Alter corresponding state volumes by the indicated percent.)
Major City/County Roadways - 10%
Other Signalized Roadways - 35%
BICYCLE MODE2 (Multiply motorized vehicle volumes shown below by number of directional
roadway lanes to determine two-way maximum service volumes.) Paved Shoulder/ Bicycle Lane
C D E Coverage B 0-49% ** 170 650 >650
50-84% 130 200 >200 *** 85-100% 340 >340 *** ***
PEDESTRIAN MODE2
(Multiply motorized vehicle volumes shown below by number of directional roadway lanes to determine two-way maximum service volumes.)
Sidewalk Coverage B C D E 0-49% ** ** 270 770
50-84% ** 100 600 1000 85-100% ** 610 1000 >1000
BUS MODE (Scheduled Fixed Route)3 (Buses in peak hour in peak direction)
Sidewalk Coverage B C D E 0-84% >5 >4 >3 >2
85-100% >4 >3 >2 >1
State & Non-State Signalized Roadway Adjustments (Alter corresponding state volumes by the indicated percent.) Divided/Undivided & Turn Lane Adjustments
Lanes Median Exclusive Left Lanes
Exclusive Right Lanes
Adjustment Factors
2 Divided Yes No +5% 2 Undivided No No -20%
Multi Undivided Yes No -5% Multi Undivided No No -25%
– – – Yes + 5%
One-Way Facility Adjustment Multiply the corresponding volumes in this table by 1.20.
1 Values shown are presented as hourly directional volumes for levels of service and are for the automobile/truck modes unless specifically stated. To convert to annual average daily traffic volumes, these volumes must be divided by appropriate D and K factors. This table does not constitute a standard and should be used only for general planning applications. The computer models from which this table is derived should be used for more specific planning applications. The table and deriving computer models should not be used for corridor or intersection design, where more refined techniques exist. Calculations are based on planning applications of the Highway Capacity Manual, Bicycle LOS Model, Pedestrian LOS Model and Transit Capacity and Quality of Service Manual, respectively for the automobile/truck, bicycle, pedestrian and bus modes. 2 Level of service for the bicycle and pedestrian modes in this table is based on number of motorized vehicles, not number of bicyclists or pedestrians using the facility. 3 Buses per hour shown are only for the peak hour in the single direction of the higher traffic flow. ** Cannot be achieved using table input value defaults.
*** Not applicable for that level of service letter grade. For the automobile mode, volumes greater than level of service D become F because intersection capacities have been reached. For the bicycle mode, the level of service letter grade (including F) is not achievable because there is no maximum vehicle volume threshold using table input value defaults.
Source: Florida Department of Transportation Systems Planning Office 605 Suwannee Street, MS 19 Tallahassee, FL 32399-0450

2009 FDOT QUALITY/LEVEL OF SERVICE HANDBOOK
TABLE 7 (continued)
Generalized Peak Hour Directional Volumes for Florida’s
Urbanized Areas 9/4/09
INPUT VALUE ASSUMPTIONS Uninterrupted Flow Facilities
Interrupted Flow Facilities State Arterials Class II
Freeways
Highw
ays
Class I
Class II
Class III
Bicycle
Pedestrian
Bus
ROADWAY CHARACTERISTICS Area type (l,o) l l l l l l l l l l l l Number of through lanes 2-6 1 2-3 1 2-4 1 2-4 1 2-4 2 2 Posted speed (mph) 65 50 50 45 50 45 45 35 35 45 45 Free flow speed (mph) 70 55 55 50 55 50 50 40 40 50 50 Aux, meter, or accel/decel >1500 (n,y) n Median (n, nr, r) n r n r n r n r r r Terrain (l,r) l l l % no passing zone 80 Exclusive left turn lanes /[impact](n, y) [n] y y y y y y y y y Exclusive right turn lanes (n, y) n n n n n n n n Paved shoulder/bicycle lane (n, y) n, 50%,y n Outside lane width t t Pavement condition t Sidewalk (n, y) n, 50%,y n,y Sidewalk/roadway separation (a, t, w) t Sidewalk protective barrier (n, y) n Obstacle to bus stop (n, y) n Facility length (mi) 4 5 5 2 2 2 2 2 2 2 2 2 Number of segments 4
TRAFFIC CHARACTERISTICS Planning analysis hour factor (K) 0.092 0.094 0.094 0.097 0.097 0.097 0.097 0.097 0.097 0.097 0.097 Directional distribution factor (D) 0.55 0.55 0.55 0.55 0.55 0.55 0.55 0.55 0.55 0.55 0.55 Peak hour factor (PHF) 0.95 0.925 0.925 0.925 0.925 0.925 0.925 0.925 0.925 0.925 0.925 Base saturation flow rate (pcphpl) 1700 2100 1950 1950 1950 1950 1950 1950 1950 1950 Heavy vehicle percent 4.0 2.0 2.0 2.0 2.0 2.0 2.0 1.5 1.5 2.0 2.0 Local adjustment factor 0.98 1.0 0.98 % left turns 12 12 12 12 12 12 12 12 % right turns 12 12 12 12 12 12 12 12 Bus span of service 15
CONTROL CHARACTERISTICS Number of signals 2 2 6 6 10 10 6 6 Arrival type (1-6) 3 3 4 4 4 4 4 4 Signal type (a, s, p) a a s s s s s s Cycle length (C) 120 120 120 120 120 120 120 120 Effective green ratio (g/C) 0.44 0.44 0.44 0.44 0.44 0.44 0.44 0.44
LEVEL OF SERVICE THRESHOLDS
Level of Service
Freeways Highway Segments State & Non-State Signalized Arterials
Bicycle Pedestrian Bus
Density Two-Lane Multilane Class I Class II Class III
Score Score Buses per hr. %ffs Density ats ats ats B ≤17 >0.833 ≤18 > 34 mph > 28 mph > 24 mph ≤2.5 ≤2.5 ≥4 C ≤24 >0.750 ≤26 > 27 mph > 22 mph > 18 mph ≤3.5 ≤3.5 ≥3 D ≤31 >0.667 ≤35 > 21 mph > 17 mph > 14 mph ≤4.5 ≤4.5 ≥2 E ≤39 >0.583 ≤41 > 16 mph > 13 mph > 10 mph ≤5.5 ≤5.5 ≥1
% ffs = Percent free flow speed ats = Average travel speed

www.dot.state.fl.us/planning/systems/sm/los/default.shtm 2009 FDOT QUALITY/LEVEL OF SERVICE HANDBOOK
TABLE 8 Generalized Peak Hour Directional Volumes for Florida’s
Areas Transitioning into Urbanized Areas OR Areas Over 5,000 Not In Urbanized Areas1 10/4/10
STATE SIGNALIZED ARTERIALS Class I (>0.00 to 1.99 signalized intersections per mile)
Lanes Median B C D E 1 Undivided 470 750 800 *** 2 Divided 1,430 1,710 1,800 *** 3 Divided 2,210 2,590 2,720 ***
Class II (2.00 to 4.50 signalized intersections per mile) Lanes Median B C D E
1 Undivided ** 500 730 780 2 Divided ** 1,210 1,600 1,690 3 Divided ** 1,900 2,420 2,550
Class III (more than 4.50 signalized intersections per mile) Lanes Median B C D E
1 Undivided ** 250 570 710 2 Divided ** 610 1,360 1,540 3 Divided ** 960 2,120 2,340
FREEWAYS Lanes B C D E
2 2,200 2,980 3,560 3,800 3 3,300 4,480 5,340 5,880 4 4,400 5,980 7,120 7,940 5 5,500 7,520 8,920 9,960
Freeway Adjustments Auxiliary Lanes
Ramp Metering
+ 1,000 +5%
Uninterrupted Flow Highway Adjustments Lanes Median Exclusive left lanes Adjustment factors
2 Divided Yes +5% Multi Undivided Yes -5% Multi Undivided No -25%
UNINTERRUPTED FLOW HIGHWAYS Lanes Median B C D E
1 Undivided 420 800 1,120 1,420 2 Divided 1,670 2,420 3,130 3,550 3 Divided 2,510 3,630 4,700 5,330
Non-State Signalized Roadway Adjustments (Alter corresponding state volumes by the indicated percent.)
Major City/County Roadways - 10%
Other Signalized Roadways - 35%
BICYCLE MODE2 (Multiply motorized vehicle volumes shown below by number of directional
roadway lanes to determine two-way maximum service volumes.) Paved Shoulder/ Bicycle Lane
C D E Coverage B 0-49% ** 150 390 >390
50-84% 120 180 700 >700 85-100% 220 >220 ** **
PEDESTRIAN MODE2
(Multiply motorized vehicle volumes shown below by number of directional roadway lanes to determine two-way maximum service volumes.)
Sidewalk Coverage B C D E 0-49% ** ** 270 770
50-84% ** ** 600 1,000 85-100% ** 610 1,000 >1,000
State & Non-State Signalized Roadway Adjustments (Alter corresponding volume by the indicated percent.)
Divided/Undivided & Turn Lane Adjustments
Lanes Median Exclusive Left Lanes
Exclusive Right Lanes
Adjustment Factors
2 Divided Yes No +5% 2 Undivided No No -20%
Multi Undivided Yes No -5% Multi Undivided No No -25%
– – – Yes + 5%
One-Way Facility Adjustment Multiply the corresponding volumes in this table by 1.20.
1 Values shown are presented as hourly directional volumes for levels of service and are for the automobile/truck modes unless specifically stated. To convert to annual average daily traffic volumes, these volumes must be divided by appropriate D and K factors. This table does not constitute a standard and should be used only for general planning applications. The computer models from which this table is derived should be used for more specific planning applications. The table and deriving computer models should not be used for corridor or intersection design, where more refined techniques exist. Calculations are based on planning applications of the Highway Capacity Manual, Bicycle LOS Model, Pedestrian LOS Model and Transit Capacity and Quality of Service Manual, respectively for the automobile/truck, bicycle, pedestrian and bus modes. 2 Level of service for the bicycle and pedestrian modes in this table is based on number of motorized vehicles, not number of bicyclists or pedestrians using the facility. 3 Buses per hour shown are only for the peak hour in the single direction of the higher traffic flow. ** Cannot be achieved using table input value defaults.
*** Not applicable for that level of service letter grade. For the automobile mode, volumes greater than level of service D become F because intersection capacities have been reached. For the bicycle mode, the level of service letter grade (including F) is not achievable because there is no maximum vehicle volume threshold using table input value defaults.
Source: Florida Department of Transportation Systems Planning Office 605 Suwannee Street, MS 19 Tallahassee, FL 32399-0450
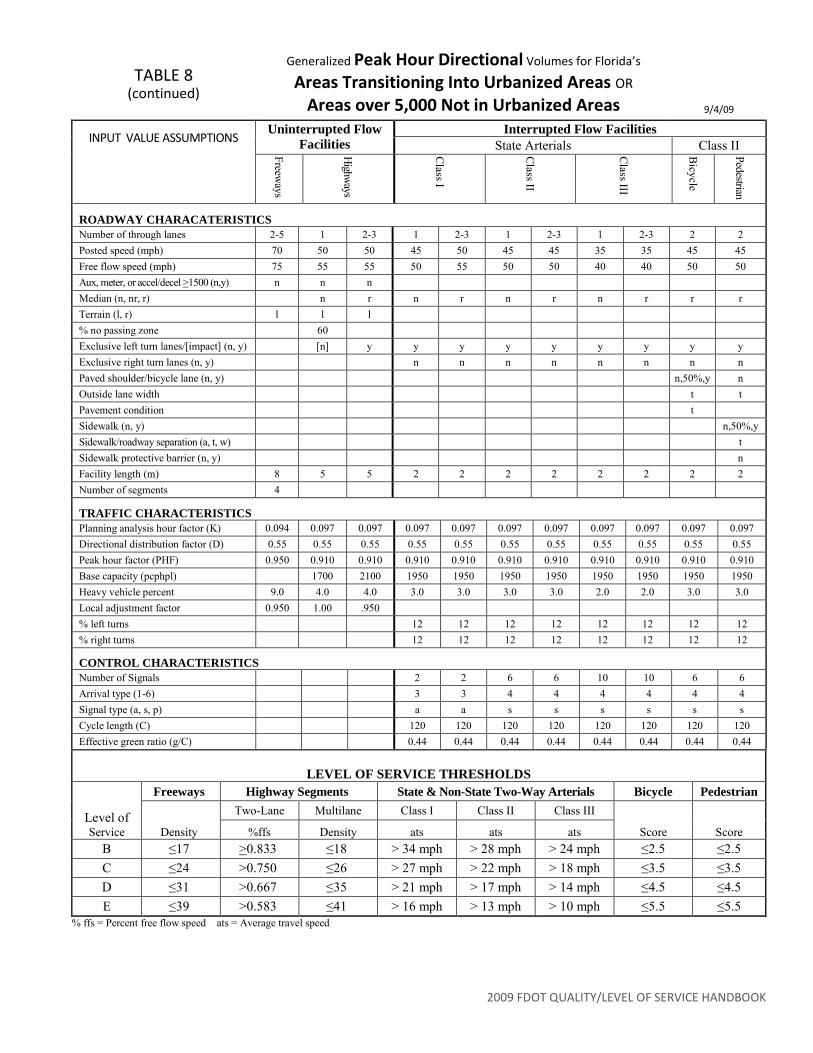
2009 FDOT QUALITY/LEVEL OF SERVICE HANDBOOK
TABLE 8 (continued)
Generalized Peak Hour Directional Volumes for Florida’s
Areas Transitioning Into Urbanized Areas OR Areas over 5,000 Not in Urbanized Areas 9/4/09
INPUT VALUE ASSUMPTIONS Uninterrupted Flow
Facilities Interrupted Flow Facilities
State Arterials Class II
Freeways
Highways
Class I
Class II
Class III
Bicycle
Pedestrian
ROADWAY CHARACATERISTICS Number of through lanes 2-5 1 2-3 1 2-3 1 2-3 1 2-3 2 2 Posted speed (mph) 70 50 50 45 50 45 45 35 35 45 45 Free flow speed (mph) 75 55 55 50 55 50 50 40 40 50 50 Aux, meter, or accel/decel >1500 (n,y) n n n Median (n, nr, r) n r n r n r n r r r Terrain (l, r) l l l % no passing zone 60 Exclusive left turn lanes/[impact] (n, y) [n] y y y y y y y y y Exclusive right turn lanes (n, y) n n n n n n n n Paved shoulder/bicycle lane (n, y) n,50%,y n Outside lane width t t Pavement condition t Sidewalk (n, y) n,50%,y
Sidewalk/roadway separation (a, t, w) t Sidewalk protective barrier (n, y) n Facility length (m) 8 5 5 2 2 2 2 2 2 2 2 Number of segments 4
TRAFFIC CHARACTERISTICS Planning analysis hour factor (K) 0.094 0.097 0.097 0.097 0.097 0.097 0.097 0.097 0.097 0.097 0.097 Directional distribution factor (D) 0.55 0.55 0.55 0.55 0.55 0.55 0.55 0.55 0.55 0.55 0.55 Peak hour factor (PHF) 0.950 0.910 0.910 0.910 0.910 0.910 0.910 0.910 0.910 0.910 0.910 Base capacity (pcphpl) 1700 2100 1950 1950 1950 1950 1950 1950 1950 1950 Heavy vehicle percent 9.0 4.0 4.0 3.0 3.0 3.0 3.0 2.0 2.0 3.0 3.0 Local adjustment factor 0.950 1.00 .950 % left turns 12 12 12 12 12 12 12 12 % right turns 12 12 12 12 12 12 12 12
CONTROL CHARACTERISTICS Number of Signals 2 2 6 6 10 10 6 6 Arrival type (1-6) 3 3 4 4 4 4 4 4 Signal type (a, s, p) a a s s s s s s Cycle length (C) 120 120 120 120 120 120 120 120 Effective green ratio (g/C) 0.44 0.44 0.44 0.44 0.44 0.44 0.44 0.44
LEVEL OF SERVICE THRESHOLDS
Level of Service
Freeways Highway Segments State & Non-State Two-Way Arterials Bicycle Pedestrian
Density Two-Lane Multilane Class I Class II Class III
Score Score %ffs Density ats ats ats B ≤17 >0.833 ≤18 > 34 mph > 28 mph > 24 mph ≤2.5 ≤2.5 C ≤24 >0.750 ≤26 > 27 mph > 22 mph > 18 mph ≤3.5 ≤3.5 D ≤31 >0.667 ≤35 > 21 mph > 17 mph > 14 mph ≤4.5 ≤4.5 E ≤39 >0.583 ≤41 > 16 mph > 13 mph > 10 mph ≤5.5 ≤5.5
% ffs = Percent free flow speed ats = Average travel speed

www.dot.state.fl.us/planning/systems/sm/los/default.shtm 2009 FDOT QUALITY/LEVEL OF SERVICE HANDBOOK
TABLE 9 Generalized Peak Hour Directional Volumes for Florida’s
Rural Undeveloped Areas and Cities OR Developed Areas Less Than 5,000 Population1 10/4/10
Rural Undeveloped Areas Cities or Rural Developed Areas Less Than 5000
Freeway Adjustments Auxiliary Lanes +1,000
FREEWAYS Lanes B C D E
2 2,100 2,880 3,400 3,600 3 3,200 4,320 5,100 5,560 4 4,260 5,720 6,800 7,520
Freeway Adjustments Auxiliary Lanes +1,000
FREEWAYS Lanes B C D E
2 2,100 2,820 3,360 3,600 3 3,100 4,220 5,040 5,560 4 4,160 5,680 6,720 7,520
UNINTERRUPTED FLOW TWO-LANE HIGHWAYS Lanes Median B C D E
1 Undivided 240 430 740 1,480 Passing Lane Adjustment
Alter LOS B-D volumes in proportion to passing lane length to the highway segment length..
UNINTERRUPTED FLOW MULTILANE HIGHWAYS Lanes Median B C D E
2 Divided 1,410 2,210 2,800 3,180 3 Divided 2,120 3,320 4,200 4,770
Uninterrupted Flow Highway Adjustments Lanes Median Exclusive left lanes Adjustment factors
2 Divided Yes +5% Multi Undivided Yes -5% Multi Undivided No -25%
UNINTERRUPTED FLOW HIGHWAYS Lanes Median B C D E
1 Undivided 420 780 1,100 1,400 2 Divided 1,300 2,040 2,630 3,000 3 Divided 1,950 3,060 3,950 4,500
ISOLATED STATE SIGNALIZED INTERSECTIONS Lanes B C D E
1 ** 260 560 660 2 ** 560 1,260 1,380 3 ** 860 1,940 2,080
STATE SIGNALIZED ARTERIALS Lanes Median B C D E
1 Undivided ** 520 690 740 2 Divided ** 1,240 1,490 1,590 3 Divided ** 1,940 2,260 2,400
Non-State Signalized Roadway Adjustments (Alter corresponding volume by the indicated percent.)
Major City/County Roadways - 10% Other Signalized Roadways - 35%
State & Non-State Signalized Roadway Adjustments (Alter corresponding volume by the indicated percent.)
Divided/Undivided & Turn Lane Adjustments
Lanes Median
Exclusive Left Turn
Lanes
Exclusive Right Turn
Lanes Adjustment
Factors 2 Divided Yes No +5% 2 Undivided No No -20%
Multi Undivided Yes No -5% Multi Undivided No No -25%
– – – Yes + 5%
BICYCLE MODE2 (Multiply motorized vehicle volumes shown below by number of directional
roadway lanes to determine two-way maximum service volumes.) Paved Shoulder/
Bicycle Lane Coverage B C D E
0-49% ** ** ** 420 50-84% ** ** ** 760 85-100% ** 230 >230 ***
1 Values shown are presented as hourly directional volumes for levels of service and are for the automobile/truck modes unless specifically stated. To convert to annual average daily traffic volumes, these volumes must be divided by appropriate D and K factors. This table does not constitute a standard and should be used only for general planning applications. The computer models from which this table is derived should be used for more specific planning applications. The table and deriving computer models should not be used for corridor or intersection design, where more refined techniques exist. Calculations are based on planning applications of the Highway Capacity Manual, Bicycle LOS Model and Pedestrian LOS Model, respectively for the automobile/truck, bicycle, and pedestrian modes. 2 Level of service for the bicycle and pedestrian modes in this table is based on number of motorized vehicles, not number of bicyclists or pedestrians using the facility. ** Cannot be achieved using table input value defaults.
*** Not applicable for that level of service letter grade. For the automobile mode, volumes greater than level of service D become F because intersection capacities have been reached. For the bicycle mode, the level of service letter grade (including F) is not achievable because there is no maximum vehicle volume threshold using table input value defaults.
Source: Florida Department of Transportation Systems Planning Office 605 Suwannee Street, MS 19 Tallahassee, FL 32399-0450
BICYCLE MODE2 (Multiply motorized vehicle volumes shown below by number of directional
roadway lanes to determine two-way maximum service volumes.) Paved Shoulder/
Bicycle Lane Coverage B C D E
0-49% ** 150 390 >390 50-84% 120 180 700 >700 85-100% 210 >210 *** ***
PEDESTRIAN MODE2
(Multiply motorized vehicle volumes shown below by number of directional roadway lanes to determine two-way maximum service volumes.)
Sidewalk Coverage B C D E
0-49% ** ** 270 770 50-84% ** ** 600 1000 85-100% ** 610 1000 >1000
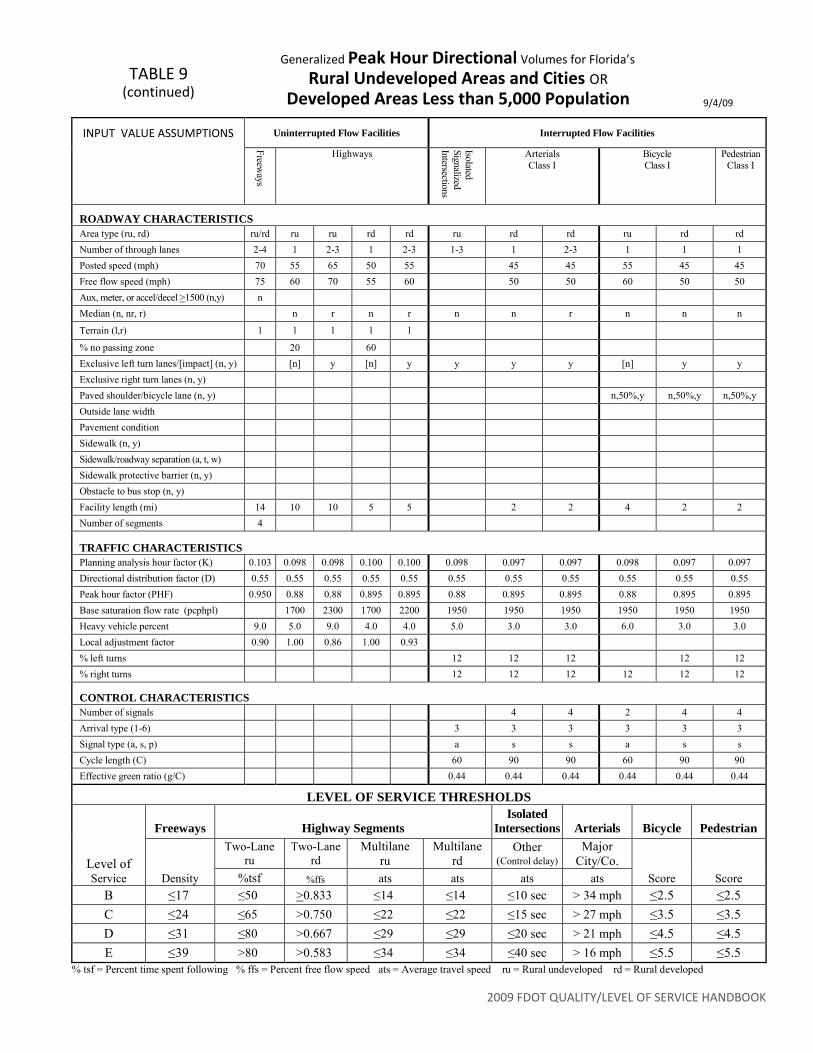
2009 FDOT QUALITY/LEVEL OF SERVICE HANDBOOK
TABLE 9 (continued)
Generalized Peak Hour Directional Volumes for Florida’s
Rural Undeveloped Areas and Cities OR Developed Areas Less than 5,000 Population 9/4/09
INPUT VALUE ASSUMPTIONS Uninterrupted Flow Facilities Interrupted Flow Facilities
Freeways
Highways
Isolated Signalized Intersections
Arterials Class I
Bicycle Class I
Pedestrian Class I
ROADWAY CHARACTERISTICS Area type (ru, rd) ru/rd ru ru rd rd ru rd rd ru rd rd Number of through lanes 2-4 1 2-3 1 2-3 1-3 1 2-3 1 1 1 Posted speed (mph) 70 55 65 50 55 45 45 55 45 45 Free flow speed (mph) 75 60 70 55 60 50 50 60 50 50 Aux, meter, or accel/decel >1500 (n,y) n Median (n, nr, r) n r n r n n r n n n
Terrain (l,r) l l l l l % no passing zone 20 60 Exclusive left turn lanes/[impact] (n, y) [n] y [n] y y y y [n] y y Exclusive right turn lanes (n, y) Paved shoulder/bicycle lane (n, y) n,50%,y n,50%,y n,50%,y Outside lane width Pavement condition Sidewalk (n, y) Sidewalk/roadway separation (a, t, w) Sidewalk protective barrier (n, y) Obstacle to bus stop (n, y) Facility length (mi) 14 10 10 5 5 2 2 4 2 2 Number of segments 4
TRAFFIC CHARACTERISTICS Planning analysis hour factor (K) 0.103 0.098 0.098 0.100 0.100 0.098 0.097 0.097 0.098 0.097 0.097 Directional distribution factor (D) 0.55 0.55 0.55 0.55 0.55 0.55 0.55 0.55 0.55 0.55 0.55 Peak hour factor (PHF) 0.950 0.88 0.88 0.895 0.895 0.88 0.895 0.895 0.88 0.895 0.895 Base saturation flow rate (pcphpl) 1700 2300 1700 2200 1950 1950 1950 1950 1950 1950 Heavy vehicle percent 9.0 5.0 9.0 4.0 4.0 5.0 3.0 3.0 6.0 3.0 3.0 Local adjustment factor 0.90 1.00 0.86 1.00 0.93 % left turns 12 12 12 12 12 % right turns 12 12 12 12 12 12
CONTROL CHARACTERISTICS Number of signals 4 4 2 4 4 Arrival type (1-6) 3 3 3 3 3 3 Signal type (a, s, p) a s s a s s Cycle length (C) 60 90 90 60 90 90 Effective green ratio (g/C) 0.44 0.44 0.44 0.44 0.44 0.44
LEVEL OF SERVICE THRESHOLDS
Level of Service
Freeways Highway Segments Isolated
Intersections Arterials Bicycle Pedestrian
Density
Two-Lane ru
Two-Lane rd
Multilane ru
Multilane rd
Other (Control delay)
Major City/Co.
Score Score %tsf %ffs ats ats ats ats B ≤17 ≤50 >0.833 ≤14 ≤14 ≤10 sec > 34 mph ≤2.5 ≤2.5 C ≤24 ≤65 >0.750 ≤22 ≤22 ≤15 sec > 27 mph ≤3.5 ≤3.5 D ≤31 ≤80 >0.667 ≤29 ≤29 ≤20 sec > 21 mph ≤4.5 ≤4.5 E ≤39 >80 >0.583 ≤34 ≤34 ≤40 sec > 16 mph ≤5.5 ≤5.5
% tsf = Percent time spent following % ffs = Percent free flow speed ats = Average travel speed ru = Rural undeveloped rd = Rural developed