Embed Size (px)
Citation preview
Technological University Dublin Technological University Dublin
ARROW@TU Dublin ARROW@TU Dublin
Masters Engineering
2010-01-01
Feasibility of Using Passive Monitoring Techniques in Mesh Feasibility of Using Passive Monitoring Techniques in Mesh
Networks for the Support of Routing Networks for the Support of Routing
Chenzhe Zhang Technological University Dublin, [email protected]
Follow this and additional works at: https://arrow.tudublin.ie/engmas
Part of the Electrical and Computer Engineering Commons
Recommended Citation Recommended Citation Zhang, C. (2010). Feasibility of Using Passive Monitoring Techniques in Mesh Networks for the Support of Routing. Masters dissertation. Technological University Dublin. doi:10.21427/D7490J
This Theses, Masters is brought to you for free and open access by the Engineering at ARROW@TU Dublin. It has been accepted for inclusion in Masters by an authorized administrator of ARROW@TU Dublin. For more information, please contact [email protected], [email protected], [email protected].
This work is licensed under a Creative Commons Attribution-Noncommercial-Share Alike 3.0 License
brought to you by COREView metadata, citation and similar papers at core.ac.uk
provided by Arrow@dit
Feasibility of Using Passive Monitoring Techniques in Mesh Networks for the Support
of Routing
by
Chenzhe Zhang BEng
A thesis submitted to the Dublin Institute of Technology
for the degree of
Master of Philosophy
Supervisor: Dr. Mark Davis
School of Electronic and Communications Engineering
2010
1
Abstract In recent years, Wireless Mesh Networks (WMNs) have emerged as a promising
solution to provide low cost access networks that extend Internet access and other
networking services. Mesh routers form the backbone connectivity through
cooperative routing in an often unstable wireless medium. Therefore, the techniques
used to monitor and manage the performance of the wireless network are expected to
play a significant role in providing the necessary performance metrics to help
optimize the link performance in WMNs. This thesis initially presents an assessment
of the correlation between passive monitoring and active probing techniques used for
link performance measurement in single radio WMNs. The study reveals that by
combining multiple performance metrics obtained by using passive monitoring, a high
correlation with active probing can be achieved. The thesis then addresses the
problem of the system performance degradation associated with simultaneous
activation of multiple radios within a mesh node in a multi-radio environment. The
experiments results suggest that the finite computing resource seems to be the limiting
factor in the performance of a multi-radio mesh network. Having studied this
characteristic of multi-radio networks, a similar approach as used in single radio mesh
network analysis was taken to investigate the feasibility of passive monitoring in a
multi-radio environment. The accuracy of the passive monitoring technique was
compared with that of the active probing technique and the conclusion reached is that
passive monitoring is a viable alternative to active probing technique in multi-radio
mesh networks.

2
Declaration
I certify that this thesis which I now submit for examination for the award of
_____________________, is entirely my own work and has not been taken from the
work of others save and to the extent that such work has been cited and acknowledged
within the text of my work.
This thesis was prepared according to the regulations for postgraduate study by
research of the Dublin Institute of Technology and has not been submitted in whole or
in part for an award in any other Institute or University.
The work reported on in this thesis conforms to the principles and requirements of the
Institute's guidelines for ethics in research.
The Institute has permission to keep, to lend or to copy this thesis in whole or in part,
on condition that any such use of the material of the thesis be duly acknowledged.
Signature__________________________________Date_______________

3
Acknowledgments
Firstly, I would like to thank my supervisor, Dr. Mark Davis, for all his
support and availability to discuss all the issues that have arisen throughout these
years at the Communication Network Research Institute (CNRI).
I am very grateful to all my colleagues at CNRI, without them it would not
have been possible to complete my MPhil. In particular, I want to thank Mirek, Karol,
Marak and Brian for all their help.
This research work has been funded by Science Foundation Ireland (SFI)
under a Research Frontier Programme (RFP) award (reference number CMSF704).
My thanks to this organization for making it possible for me to undertake this research
work.
Finally I would also like to thank my family and friends for having stood by
me and for their love and encouragement.

Table of Contents Abstract .......................................................................................................................... 1
Table of Contents ........................................................................................................... 1
List of Figures and Tables.............................................................................................. 3
Acronym ........................................................................................................................ 4
1 Introduction ............................................................................................................ 6
2 Background Details .............................................................................................. 10
2.1 Wireless Mesh Networks Intro ...................................................................... 10
2.2 Literature Review .......................................................................................... 12
2.2.1 The rise of wireless mesh networking ................................................... 12
2.2.2 Performance measurement in wireless mesh networks ......................... 13
2.2.3 Why accurate link quality measurements? ............................................ 17
2.2.4 Problems with performance measurements and existing techniques ..... 19
2.2.5 Limitations of existing techniques ......................................................... 20
2.2.6 The study of multi-radio Mesh .............................................................. 23
2.2.7 The study of multi-hop wireless mesh ................................................... 25
2.3 Summary ....................................................................................................... 26
3 Technical Details ................................................................................................. 28
3.1 Introduction to CSMA/CA and passive metrics ............................................ 28
3.1.1 CSMA/CA.............................................................................................. 28
3.1.2 Passive metrics ....................................................................................... 30
3.2 Single Radio Test bed ................................................................................... 32
3.2.1 System description ................................................................................. 33
3.2.2 Network setup and configuration ........................................................... 34
3.2.3 Experimental approach and evaluation metrics ..................................... 35
3.3 Wireless Multi Radio Test bed ...................................................................... 36
3.3.1 System Description ................................................................................ 37
3.3.2 Network setup and configurations ......................................................... 37
3.3.3 Experimental approach and evaluation metrics ..................................... 38
3.4 Cabled Multi Radio Test bed ........................................................................ 40
3.4.1 System Description ................................................................................ 41
3.4.2 Network setup and configurations ......................................................... 41
3.4.3 Experimental approach and evaluation metrics ..................................... 42
4 Experimental Results ........................................................................................... 49
4.1 Single Radio Testbed .................................................................................... 49

2
4.1.1 Correlation between the PER and the RSSI ........................................... 49
4.1.2 Correlation between the PER and the idle bandwidth (BWidle) ............. 50
4.1.3 Combining Passive Measurements ........................................................ 51
4.2 Wireless Multi Radio Testbed ....................................................................... 53
4.2.1 Throughput statistics under non-saturation condition at the Tx node.... 53
4.2.2 Throughput measurements under saturation condition at the Tx node .. 56
4.2.3 Experiments at the Rx node ................................................................... 59
4.3 Cabled Multi Radio Testbed ......................................................................... 61
4.3.1 Experiments to determine the weighting factors ................................... 61
4.4 Summary ....................................................................................................... 67
5 Conclusions .......................................................................................................... 69
5.1 Findings of this Work .................................................................................... 70
5.2 Future Work .................................................................................................. 76
References .................................................................................................................... 79
List of Publications ...................................................................................................... 83
3
List of Figures and Tables Figure 2.1 An illustration of a Wireless Mesh Network 11
Figure 2.2 Illustration of passive monitoring and active probing techniques. 15
Figure 3.1 MAC layer bandwidth components concept 31
Figure 3.2 Single radio experimental test bed. 34
Figure 3.3 Wireless multi-radio experimental test bed. 37
Figure 3.4 Cabled multi-radio experimental test bed. 41
Figure 3.5 Factors that have impact on PER. 44
Figure 4.1 Correlation coefficient of RSSI and PER over all test cases. 50
Figure 4.2 Correlation coefficient of BWidle and PER over all test cases. 51
Figure 4.3 Correlation coefficient of the combined function and PER over all 30 test cases. 52
Figure 4.4 Variation in the combined function value and PER over time (Y-axis unit is percentage in true value). 53
Figure 4.5 The variation in the aggregate node throughput under non-saturation conditions with multiple wireless cards and different packet sizes. 54
Figure 4.6 Effect of additional NICs on throughput under non-saturation with a packet size of 1470 bytes. 55
Figure 4.7 Throughput statistics under saturation condition with reference to CPU idle% for a packet size of 1470 bytes . 57
Figure 4.8 Throughput comparison in 2 different modes under saturation @ 1470 bytes. 58
Figure 4.9 Plot of PER against Contention values. 63
Figure 4.10 Plot of PER against RSSI values. 63
Figure 4.11 Plot of PER against Line Rate values. 64
Figure 4.12 Pearson correlation coefficients over 40 test cases. 67
Table 3.1 Inter-dependencies of the passively gathered metrics. .............................. 43
Table 3.2 Modulation schemes used for different LineRate s in 802.11a. ................ 46
Table 4.1 Throughput under non-saturation at the TX node with different packet sizes and number of active interfaces. ...................................................... 54
Table 4.2 Results recorded at the RX node under different test scenarios (link quality is obtained directly from the madwifi ifconfig command) ........... 60
Table 4.3 Recorded values of PER when different metric combinations were used.62
Table 4.4 The coefficients and the constant of the combined function model. ........ 65
Table 4.5 The percentage error difference between the PER value predicted by the combined function model and the actual PER. ......................................... 66

4
Acronym
AODV Ad hoc On – Demand Distance Vector Routing Protocol
AWGN Additive White Gaussian Noise
AP Access Point
BAP Broadcast based Active Probing
BC Backoff Counter
BER Bit Error Rate
BPSK Binary Phase – Shift Keying
BW Bandwidth
CA Collision Avoidance
CCA Clear Channel Assessment
CNRI Communication Network Research Institute
CPU Central Processing Unit
CSMA Carrier Sense Multiple Access
CW Contention Window
D-ITG Distributed Internet Traffic Generator
DSR Dynamic Source Routing
ETX Expected Transmission Count
ETT Expected Transmission Time
ExOR Extremely Opportunistic Routing
ICMP Internet Control Message Protocol
IEEE Institute of Electrical and Electronics Engineers
IP Internet Protocol
LOS Line of Sight

5
MAC Media Access Control
MASA Multiple Access with Salvation Army
MN Mesh Node
NADV Normalized Advance (link metric)
NIC Network Interface Card
PCI Peripheral Component Interconnect
PER Packet Error Rate
PHY Physical Layer
QAM Quadrature Amplitude Modulation
QoS Quality of Service
QPSK Quadrature Phase – Shift Keying
RF Radio Frequency
RSSI Received Signal Strength Indicator
Rx Receiving
SIP Session Initiation Protocol
SNR Signal to Noise Ratio
SSH Secure Shell
Tx Transmitting
VoD Video on Demand
VoIP Voice/Video over IP
WLAN Wireless Local Area Network
WEP Wired Equivalent Privacy
WPA Wi-Fi Protected Access
WRM WLAN Resource Monitor
WMN Wireless Mesh Network
6
1 Introduction
Next-generation wireless mobile communications will be driven by converged
networks that integrate disparate technologies and services. Wireless Mesh Networks
(WMNs) are expected to be one of the next generation of wireless interconnection
technologies, providing flexible high bandwidth wireless backhaul over large
geographical areas. While single radio mesh nodes operating on a single channel
suffer from capacity constraints, equipping mesh routers with multiple radios using
multiple non-overlapping channels can significantly alleviate the capacity problem
and increase the aggregate bandwidth available to the network.
However, multi-radio WMNs face many limitations such as channel selection,
routing, interference etc. Routing plays a critical role in improving the performance of
WMNs. For the better support of routing, it is vital to have an effective mechanism of
path selection and this process essentially involves assessing link performance and
generating performance metrics to support the path selection mechanism.
Traditionally researchers have been using active probing methods to obtain such
performance metrics. Although these active probing methods are considered to be
accurate and efficient, they nevertheless impose an additional overhead on the
network due to the extra probe packets transmitted on the medium,. This overhead
poses a particular problem for WMNs due to the limited availability of bandwidth and
the unpredictable nature of the medium. Furthermore, these additional probe

7
transmissions serve to increase the level of interference on the WMN which has the
undesirable effect of further reducing the capacity.
Therefore obtaining accurate performance metrics with low overhead has always been
a challenge for WMNs. The goal of this thesis is to present a feasible alternative to the
active probing method in WMNs in order to avoid the overhead problem and
increased interference.
The approach adopted here involves the development of a passive monitoring
technique to estimate link performance metrics. The main advantage of passive
monitoring when compared to active probing is that it passively listens to the
transmissions on the medium and as such does not generate any overhead. Moreover,
it does not lead to an increase in the level of interference in the wireless network
environment.
Through a series of experiments conducted on single radio mesh nodes, it is shown
that by combining several passively obtained performance metrics such as bandwidth
availability, signal strength and contention, and it is possible to generate an accurate
estimate of the packet error rate (PER) performance metric. In other words, we
demonstrate the feasibility of using passive monitoring as a substitute for active
probing on WMNs. A possible drawback of the passive monitoring approach is that it
imposes an additional computational overhead on the mesh nodes (MN).
This thesis also undertook a study of the feasibility of passive monitoring in mesh
networks. Multi-radio networks face many challenges such as channel assignment,
mitigating interference etc. A major concern is the system performance degradation

8
associated with simultaneous activation of multiple radios within a node. Some
researchers have ascribed this performance degradation to electrical and radio
frequency (RF) crosstalk. Therefore, a first step in the study of multi-radio mesh
networks was to verify the existence of this crosstalk and to investigate its impact on
the performance of a network node. This involved the use of an experimental test bed
where up to four radios were activated at a node. From the experimental results it was
found that: i) the capacity of the network increases as the number of radios increases;
ii) crosstalk does not appear to be a limiting factor in the performance of a multi-radio
node, rather it is the limited computing resource available at the node that constrains
the potential of multi-radio mesh networks.
To further verify these findings the test bed was modified by the introduction of
couplers, antenna cables and attenuators to realize a cabled wireless network. This
allows us to eliminate any potential external influences to the network as well as
providing for controlled wireless environment. This allowed for greater reliability in
the results gathered. Again, the experimental results from this cabled test bed
confirmed the findings from the original wireless test bed.
The final step in the study of the feasibility of passive monitoring was to investigate
its performance in a multi-radio mesh environment. A similar approach to that used
for the single radio experiments was adopted where the accuracy of the passive
monitoring was compared with that of active probing. Again, the results showed that
it is possible to generate an accurate estimate of packet error rate (PER) performance
metric through passive monitoring.

9
The final conclusion from this work is that passive motoring is a viable alternative to
the active probing when seeking to estimate link performance metrics in a multi-radio
mesh networks.
The rest of the thesis is organized as follows:
Chapter 2: Background Detail
This chapter provides the background to the study and underpins the various topics
dealt with and the conclusions obtained.
Chapter 3: Technical Detail
This section describes the experimental test-bed set up which were used for the
investigation of the performance of the passive monitoring technique. All the
hardware used along with the protocols and network tools employed to conduct these
experiments are presented in detail.
Chapter 4: Results
In this chapter the results obtained are presented along with the answers to a number
of questions that arose over the course of the main experimental investigation.
Chapter 5: Summary and Conclusions
This chapter presents a summary of the main findings and conclusions arising from
the experimental work carried out. It also suggests areas of further research.

10
2 Background Details
2.1 Wireless Mesh Networks Intro
In 1997, the Defense Advanced Research Projects Agency (DARPA), the
organization that created the Internet, began developing a robust, tactical, mobile
communications system for use by the U.S. Military. The military needed to provide
soldiers with broadband access to IP-based voice, video and data services that could
be used on the battlefield with little or no fixed infrastructure The result was ad hoc
peer-to-peer (p2p) wireless networking – more commonly known as mesh
networking [49].
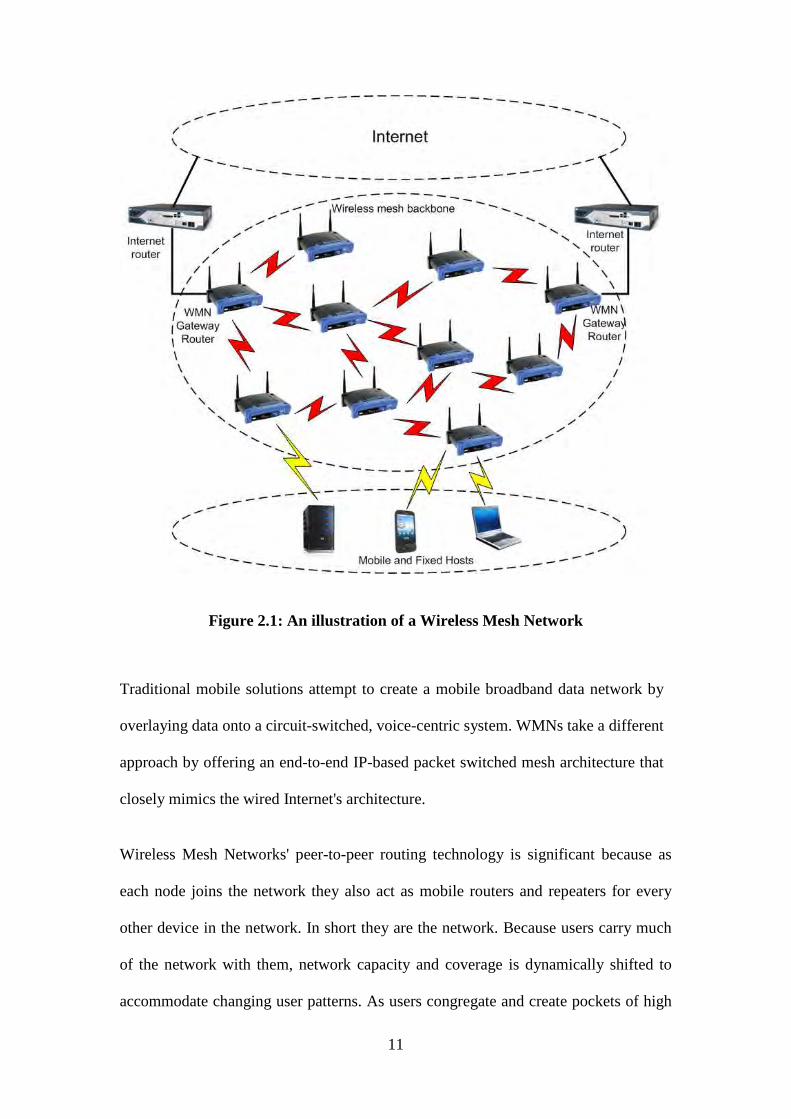
An ad hoc WMN is a collection of wireless terminals (e.g. handheld devices, mobile
phones, automotive telematic systems, etc.) that communicate directly with each
other without the aid of established infrastructure such as cell sites and towers.
Through multi-hop routing techniques, the terminals act as routers/relays for each
other and extend the range and coverage of communications links between users.
The Figure 2.1 below is an illustration of a WMN.
11
Figure 2.1: An illustration of a Wireless Mesh Network
Traditional mobile solutions attempt to create a mobile broadband data network by
overlaying data onto a circuit-switched, voice-centric system. WMNs take a different
approach by offering an end-to-end IP-based packet switched mesh architecture that
closely mimics the wired Internet's architecture.
Wireless Mesh Networks' peer-to-peer routing technology is significant because as
each node joins the network they also act as mobile routers and repeaters for every
other device in the network. In short they are the network. Because users carry much
of the network with them, network capacity and coverage is dynamically shifted to
accommodate changing user patterns. As users congregate and create pockets of high
12
demand, they also create additional routes for each other to hop through, thus
enabling network capacity from surrounding access points to be utilized. Intelligent
routing technology allows users to automatically hop away from congested routes and
access points to less congested routes and network access points. This permits the
network to increase network utilization. This self-balancing aspect of the WMN
architecture is one of its fundamental advantages over cellular wireless topologies, as
cellular network usually adopts a single base station (AP) – end users scenario, so
when the base station experience performance issue, there is no other paths available
to re-route the packets in a given geographic location. The most attractive feature of
WMN architecture is that it is a cost effective way to deploy large scale (and usually
outdoor) wireless broadband access networks. But when compared to cellular
topologies, a clear disadvantage of WMN is that the exchange of routing information
can produce a lot of traffic overhead, i.e. every device on the network shall have an
overview of all other routes and how to reach them.
2.2 Literature Review
2.2.1 The rise of wireless mesh networking
Infrastructure wireless networks based on the IEEE 802.11 protocol have become a
popular choice as a network access technology. The fact that they require no wires
thus allowing for increased mobility has led to their widespread acceptance in home
and office environments. Within this context a wireless access point (AP) attaches a
multitude of wireless devices to an infrastructure network through a single wired
connection. Potential disadvantages of this configuration are i) each AP needs to
13
maintain at least one wired connection (i.e. the backhaul connection) which
constitutes the most significant part of the network cost, and ii) the range of the access
network is limited by the range of the wireless medium.
These limitations gave birth to a new area of wireless communication referred to as
wireless mesh networking [1]. Wireless mesh networking has been drawing
considerable attention due mainly to its potential for last-mile broadband services,
instant surveillance systems, and back-haul services for large-scale wireless sensor
networks [2], [3], [4], [5]. Within this area each AP no longer needs to maintain its
own wired connection and may relay traffic generated by other APs. The benefits of
the proposed solution are i) the network can now extend beyond the range of a single
access point, and ii) the costly wired connection attaching the wireless network to the
Internet now serves more traffic than that of a single AP [6], [7].
2.2.2 Performance measurement in wireless mesh networks
In order to optimize the link performance in WMNs, it is necessary to make use of
performance metrics that take account of jitter, packet error rate, delay, capacity,
bandwidth, etc. In this section the different aspects of performance measurements are
discussed.
Wireless network performance measurements have been in use since the beginning of
WLAN networking [8]. Their applications range from characterizing wireless
networks and networking protocols, traffic or user patterns, detecting performance
14
anomalies, planning location of critical nodes, analyzing the performance of deployed
services, determining service policies, etc. However, it has not been until recently that
the need for wireless measurements has become important to network researchers and
administrators as the number of wireless networking users and the demands for a
more efficient management of resources grows.
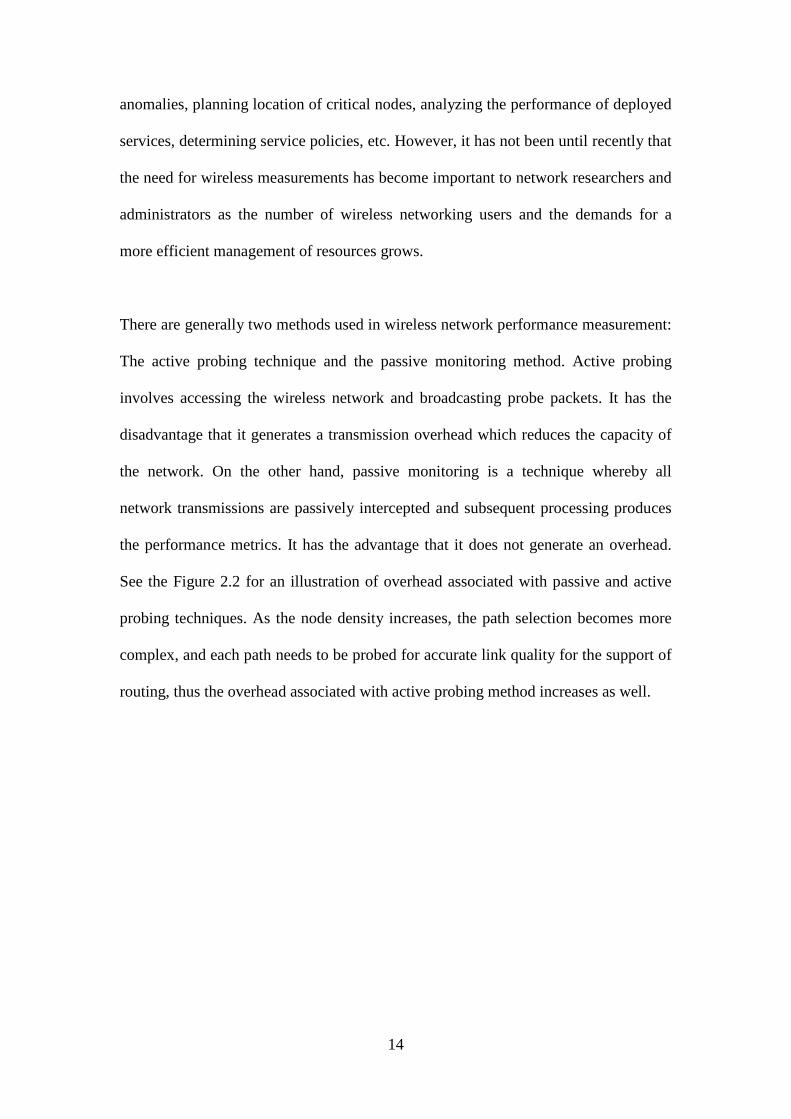
There are generally two methods used in wireless network performance measurement:
The active probing technique and the passive monitoring method. Active probing
involves accessing the wireless network and broadcasting probe packets. It has the
disadvantage that it generates a transmission overhead which reduces the capacity of
the network. On the other hand, passive monitoring is a technique whereby all
network transmissions are passively intercepted and subsequent processing produces
the performance metrics. It has the advantage that it does not generate an overhead.
See the Figure 2.2 for an illustration of overhead associated with passive and active
probing techniques. As the node density increases, the path selection becomes more
complex, and each path needs to be probed for accurate link quality for the support of
routing, thus the overhead associated with active probing method increases as well.
15
Figure 2.2: Comparison of passive monitoring and active probing techniques.
Recently the passive monitoring technique has gained much popularity and the reason
being that when considering wireless network measurements, the passive monitoring
technique serves to characterize the traffic at any particular point of the network with
zero overhead [9]. All of this makes the passive technique a popular choice.
Traditionally, wireless network measurements taken on the wireless side of a network
have relied on single-radio nodes. As was shown in previous studies (e.g. [10] or [11]),
the quality of the network measurements depends on issues such as the wireless
channel characteristics or the accuracy of the measurement tool that is being used. As
a result, careful calibration of the measurement tools is usually necessary and often
becomes a critical aspect of the single-radio wireless network measurements.

16
Regarding the impact of the wireless channel on the measurements, earlier studies of
IEEE 802.11 links [12], [13], and [14] have found that packet losses are not easily
predicted and depend on the traffic. This is caused by movements in the environment,
either of the receiver or obstacles which induce slow changes in the channel due to
Rayleigh fading. In the case of static outdoor IEEE 802.11 measurements [14], the
highly directional antennas are susceptible to motion caused by wind which is a
possible explanation for their random packet losses.
The study presented by Henty in [10] describes a relationship between active
measurements and the propagation characteristics of the wireless channel. Specifically,
the study comes up with an empirical model where two software tools were created to
conduct an extensive measurement campaign to evaluate the performance of two
IEEE 802.11b access points (APs) under ideal, multi-user, and interference scenarios.
The data from this measurement campaign was then used to create empirically-based
throughput prediction models. The resulting models were first developed using RSSI
measurements and then confirmed using predicted signal strength parameters. Also
the model relates the received SNR and the maximum wireless traffic throughput that
can be injected in the network. This model was extended in [15] by Na et al.
In a previous companion study [16] to this paper, it was shown that when using
different combinations of WLAN hardware devices to establish a wireless
communication, the observed performance varies significantly. As a result, the
maximum number of packets that can be injected in a wireless network is limited not
only by the application but also by the hardware tools being used. In the same study,
17
the authors provided some experimental performance bounds for commonly used
hardware devices.
Regarding the performance of passive measurement techniques, Yeo et al. (see [17],
[18], [19]) showed that care should be taken when analyzing traces obtained using
off-the-shelf wireless sniffers, e.g. Wireshark, as they are prone to lose part of the
observed traffic. They observed that both the wireless channel behavior and the
performance of the wireless devices cause information loss in sniffer traces. They also
devised a method to enhance the view of a network obtained with a sniffer by
merging (and synchronizing) traces coming from various independent sniffers that are
monitoring the same communication. The results in [16] also provided bounds on the
maximum performance that can be expected from an off-the-shelf wireless sniffer tool.
2.2.3 Why accurate link quality measurements?
Wireless link quality varies with environmental factors, such as interference,
multipath effects, and even weather conditions [20], [21], [22]. Due to their typical
deployment in large and heterogeneous areas, the wireless link quality of multi-hop
WMNs can fluctuate significantly. Moreover, the various network routing protocols,
such as the shortest-path and geographic routing protocols, are designed under the
strong link-quality assumption and often suffer performance degradation or weak
connectivity as a result [20], [23], [19].
Accurate link-quality measurement is essential to solve the following problems
associated with varying link-quality in WMNs, as one can see from the following user
cases:
18
• Selection of the best relay node: Accurate link-quality information can reduce the
recovery cost of lost frames caused by link-quality fluctuations. For example, ExOR
[24], [25] and MASA [26] attempt to reduce the number of transmissions with the
help of intermediate relay nodes in retransmitting lost frames. Both solutions are
based on capturing effects that allow in-range nodes to cooperatively relay
“overheard” frames, but a key question is how to select the relay node that has the
best link quality. This thesis elaborates on this topic in Chapter 3.
• Supporting Quality-of-Service (QoS): Wireless link quality information enables
applications and network protocols to effectively address users’ QoS requirements.
For example, applications such as VoIP and IPTV can dynamically adjust the service
level that can be sustained by varying link quality in the network. On the other hand,
link-quality-aware routing protocols [27], [28] can accurately locate a path that
satisfies the QoS requirements (e.g. in terms of throughput and delay) based on the
link-quality information.
• Network failure diagnosis: Link-quality statistics can be used to diagnose and
isolate faulty nodes/links in WMNs and to facilitate network management [29], [30].
WMNs covering shopping malls, a campus, or a city usually consist of a large number
of nodes where each node must deal with site-specific link conditions. Thus, WMNs
require accurate information on link conditions for troubleshooting.

19
Motivated by these and other user cases, this thesis will address how to measure link-
quality and how beneficial accurate link quality measurements can be in efficiently
utilizing network capacity.
2.2.4 Problems with performance measurements and existing techniques
The increasing deployment of WMN technologies and infrastructure is leading to an
increased use of applications such as IP telephony, video streaming, public
surveillance etc., and in turn these applications often demand a good link performance
from the network. However, due to their deployment in large and heterogeneous areas,
wireless links often experience significant quality fluctuations, performance
degradation, and weak connectivity [20], [23].
To deal with such wireless link characteristics, significant efforts have been made to
improve the network performance by mitigating the impact of unexpected link-quality
changes. For example, ExOR [24], [25] is a routing protocol that tries to reduce the
number of retransmissions via cooperative diversity among neighbouring nodes.
MASA [25] is a MAC-layer approach that tries to minimize the overhead in
recovering lost frames via nearby “salvaging” nodes. Finally, NADV [31] is a link
metric that assists a geographic routing protocol to choose the relay node by
optimizing the tradeoffs between proximity and link quality.
In addition to the above efforts, accurate measurement of wireless link quality is
essential to dealing with link-quality fluctuations for the following reasons. Firstly,
20
the three solutions mentioned above rely heavily on the availability of accurate link-
quality information to select the best relay nodes. Secondly, applications such as
video streaming and VoIP also need the link-quality information to support QoS
guarantees over WMNs. Thirdly, diagnosing a network, especially a large-scale
WMN, requires accurate long-term statistics of link-quality information to pinpoint
the source of network failures and reduce the management overhead [29]. Finally,
WMNs commonly use multiple channels [27], [32], [33] and determining the best-
quality channel among multiple available channels requires the information on the
quality of each channel. Unfortunately, there are several limitations in using existing
techniques to measure the quality of links in WMNs. Broadcast-based active probing
(BAP) has been widely used for link-quality-aware routing [24], [27], [28]. Even
though it incurs a small overhead (e.g. 1 probe packet per second), broadcasting does
not always generate the same quality measurements as actual data transmissions due
to different PHY settings (e.g. different modulation schemes). Thus, BAP can often
provide inaccurate link-quality measurements. Finally passive monitoring has been
suggested as an efficient and accurate method [31]. It makes use of network traffic, as
it selects neighbours with the optimal trade-off between proximity and link cost. This
is realised by self and neighbouring passive frame monitoring. But the method
proposed in the work also incurs an overhead arising from the probing of idle links.
2.2.5 Limitations of existing techniques
There has been a significant volume of work on performing link-quality
measurements. Here we discuss the advantages and disadvantages of using these
techniques for WMNs.
21
1) Accuracy and Efficiency: A measurement technique must yield accurate results at
as low a cost as possible. BAP has been widely used for adopting link-quality-aware
routing metrics such as expected transmission count (ETX) [28] and expected
transmission time (ETT) [28]. BAP uses simple broadcasting of identical probe
packets from each node and derives link-quality information by multiplying the
percentage of successful transmissions in each direction. Even though it is
inexpensive, broadcasting uses a fixed and low data rate (e.g. 2 Mbps) which is more
tolerant of bit errors than other rates and may differ from the actual data transmission
rates (e.g. 11 Mbps) used. Thus, BAP yields less accurate link-quality information
than a unicast-based approach. Note that, although recent device drivers (e.g.,
MadWiFi [34]) allow for using multiple data rates in broadcasting data, such multi-
rate BAP will increase the probing overhead.
A unicast-based approach to measuring link bandwidth [28], [35], [36] can yield
accurate results as it uses the same data rate for probing a link as that for actual data
transmissions over the link. However, frequent probing of link to each neighbouring
node incurs a higher overhead than BAP. As the number of neighbour nodes increases,
probe packets may consume a significant portion of the channel capacity.
Passive monitoring (which avoids the transmission of probe packets) yields accurate
link-quality measurements without incurring any overhead. Signal-to-noise ratio
(SNR) monitoring may be the easiest to implement, but it is shown to be not the only
factor to determine the actual link quality [20]. Self-monitoring [31] can be attractive

22
due to its use of actual data-frame transmission results. However, it also incurs an
overhead in probing links when there are no data packets sent over them.
2) Flexibility and Feasibility: Measurement techniques must be flexible enough to
cope with time-varying link quality. First, a periodic measurement which captures
link quality only for a certain period as in [37] and [38] might be the simplest way to
monitor link conditions. However, it yields poor measurement accuracy in wireless
environments due to frequent link-quality fluctuations or requires significant efforts to
determine the optimal measurement period.
On the other hand, the simple on-demand link-quality measurement used in MANETs
[39], [40] might be cost-effective. However, it mainly focuses on link connectivity (i.e.
a binary value indicating connectivity or not) instead of the actual wireless link
quality. Even though several approaches (e.g. [41]) have been proposed to elaborately
measure link quality using SNR, their main purpose is to maintain stable connectivity
rather than adapting to the link dynamics in real time.
Finally, the measurement techniques have to be easily implementable and deployable
in existing WMNs. BAP and unicast-based approaches can be implemented at any
protocol layer without requiring any significant system changes. Passive monitoring
can be developed in the network and MAC layers. However, it needs to exploit the
information from the MAC layer which might not be available to the user [42].
Having studied the advantages and disadvantages of the existing techniques to
minimize the overhead associated with performance measurement, it is proposed to
explore the feasibility of using a passive monitoring technique to predict the PER.
23
2.2.6 The study of multi-radio Mesh
As this thesis is set in a multi-radio context, it is worth considering other research
studies in the area of multi-radio mesh networks.
The current state-of-the-art mesh networks which use off-the-shelf 802.11-based
network cards are typically configured to operate on a single channel using a single
radio. This configuration adversely affects the capacity of the WMNs due to many
factors as identified in [43]. In order to reduce the channel contention and increase the
capacity of mesh network it may be beneficial to employ WMN nodes with multi-
radio devices. Therefore the shift from single radio to multi-radio WMNs is an
inevitable trend. From the wireless network experiments conducted in [44] or [45],
one can find many advantages of using such architecture to take measurements in a
wireless network. For instance, multi-radio nodes can take advantage of issues such as
spatial diversity to overcome limitations posed by high wireless channel variability.
Equipping each mesh node with multiple radios is emerging as a promising approach
to improving the capacity of WMNs. First, the IEEE 802.11b/g and IEEE 802.11a
standards provide 3 and 12 non-overlapping (frequency) channels, respectively which
can be used simultaneously within a neighborhood (by assigning non-overlapping
channels to radios). This then leads to efficient spectrum utilization and increases the
actual bandwidth available to the network. Second, the availability of cheap off-the-
shelf commodity hardware also makes multi-radio solutions economically attractive.
Finally, the spatial-temporal diversity of radios operating on different frequencies
24
with different sensing-to-hearing ranges, bandwidth, and fading characteristics can be
leveraged to improve the capacity of the network.
Although multi-radio mesh nodes have the potential to significantly improve the
performance of mesh networks, they are more complex than single-radio WMNs as
they face many constrains and challenges related to channel selection and degradation
of overall throughput when using multiple Network Interface Cards (NICs) in a node,
etc. The ideal multi-fold performance improvement is simply not possible to achieve
in a real network. Extensive research has been done in the area regarding the
performance degradation and the evaluation has typically been addressed through
simulations. However, the research community recently started experimentally
evaluating mesh routers [7], [20], [28]. We should note at this point that the impact of
multiple WLAN cards has been briefly described in [28] where it was reported that no
two IEEE 802.11a and IEEE 802.11g cards could coexist in the same box without
significant performance impact. In addition, in [45] the authors suggest that Netgear
WAB501 cards require a separation of 15 cm, while Cisco Aironet 340 cards
appeared to generate interference in the vertical plane and a vertical separation of 7.5
cm was necessary to eliminate interference. Furthermore, in [44] the authors
suggested that simultaneous activation of multiple radios inside the same node leads
to degradation in performance due to: i) board crosstalk, ii) radiation leakage, and iii)
inadequate separation between the several antennas.

25
2.2.7 The study of multi-hop wireless mesh
Though the multi-hop configuration is not within the scope of this thesis as only the
single hop scenario is considered, it is still worth discussing as a preparation for
further studies.
The shift from single-hop wireless networks to multi-hop wireless networks leads to
many possible design choices for the architecture of an AP. Each AP can simply
feature one radio and forward traffic not destined to it (as in [28]). Alternatively, it
can feature several radios to form wireless point-to-point links with neighboring
nodes. When these radios are operated on non-interfering frequencies the capacity of
the network increases as a function of the number of radios [6], [7]. Nonetheless,
given the several degrees of freedom in the design of mesh routers (e.g. number of
radios, technologies of radios, etc.) a meaningful comparison among these efforts is
not possible. For instance, in [20] an outdoors multi-hop wireless network is described.
Each node operates a single radio and the results refer to the performance of the
network when packets are broadcast (no multi-hopping is actually tested). In [28] a
testbed of 23 nodes is described. The testbed features 2 radios per node, one operating
at 5GHz using IEEE 802.11a and the other at 2.4GHz using IEEE 802.11g. The
authors considered alternative ways to route traffic across such a network. Lastly, in
[7] the authors simulate a 2-radio wireless router using two laptops connected through
an Ethernet cable, each one featuring an IEEE 802.11b wireless card. They then
studied the performance improvement achieved when using 2 radios and algorithms
for setting up and tearing down paths through the multi-hop network. Lundgren et al.
[46], Yarvis et al. [47], and De Couto et al. [48] report much lower performance on
deployments of multi-hop routing systems than that predicted in simulation and all
26
have observed in one way or another that the problem is a predominance of
intermediate-quality links. They propose solutions that involve measuring link quality
and carefully routing through the best links.
2.3 Summary
WMNs are gaining in popularity due to their low cost, ease of configuration and self
healing abilities. However, their large scale implementation gives rise to degradation
of performance, weak connectivity etc due to the increasing complexity of path
selection for the support of routing.
In general there are two techniques that can be employed to obtain these performance
metrics: active probing and passive monitoring. Active probing involves accessing the
wireless network through broadcasting probe packets. It has the disadvantage that it
generates a transmission overhead. On the other hand, passive monitoring is a
technique whereby all network transmissions are passively intercepted and subsequent
processing produces the performance metrics. It has the advantage that it does not
generate an overhead.
From the peer studies presented earlier, there has been much research effort
conducted into reducing the overhead of performance measurement and all of the
reported studies suggest that passive monitoring techniques can produce accurate
results with the least overhead.
27
Traditionally, the majority of the WMN research efforts to date have been concerned
with a study the performance of the two techniques used separately or in some
combined technique [8]. However, to date little attention has been paid to the
correlation between passive monitoring and active probing techniques and the
possibility of using these techniques interchangeably in a multi-radio environment.
Also, much of the research has been conducted using computer simulations which
offer an efficient and flexible means to evaluate a network. However, in these
simulations, background traffic and random noise are normally not taken into account
and often unrealistic traffic traces are employed. Consequently, performance
evaluations obtained through computer simulations may not reflect the actual
performance obtained in real networks [50].
Thus, this thesis experimentally studies the correlation between the active probing and
the passive monitoring techniques in order to study the possibility of applying such
passive monitoring techniques in a single radio network. It then examines the
characteristics of the multi-radio WMNs in order to prepare for the application of
passive technique in a multi-radio network. Lastly it explores the feasibility of using a
passive technique to replace the active performance techniques. In summary, this
thesis proposes a novel approach to passive performance measurement on WMNS
that produces an accurate estimate of the PER without incurring an overhead.
28
3 Technical Details
In this chapter, a detailed description is given of the test bed, all the relevant software
tools and the experimental approach for a better understanding of the experiments and
results presented in the next chapter.
As discussed in the introduction chapter, the experimental study consists of 3 major
sections: The first section compares the effectiveness of the passive monitoring and
active probing techniques in a single radio test bed, the second section investigates the
problem of system performance degradation associated with multi-radio networks,
and the last section adopts a similar approach as the first section by examining the
feasibility of using passive monitoring techniques in multi-radio networks. The
accuracy of the passive technique is then compared with active probing. Different test
beds are used to carry out the investigations and these are described as follows:
3.1 Introduction to CSMA/CA and passive metrics
3.1.1 CSMA/CA
The Media Access Control (MAC) layer is a sub layer of the Data Link Layer
specified in the seven-layer OSI model [59]. It provides addressing and a channel
access control mechanism that makes it possible for several terminals or network
nodes to communicate within a multi-point network.
29
The most important difference in terms of the MAC mechanism between wireless
LANs and wired LANs is the impossibility to detect collisions. With the transmitting
and receiving antennas immediately next to each other, a wireless node is unable to
see any other signal but its own. As a result, the complete packet will have been sent
before the incorrect checksum reveals that a collision has occurred between
simultaneously transmitted packets. The successful operation of the network requires
that the number of collisions is kept to a minimum
The channel access control mechanism provided by the MAC layer is essentially a
multiple access protocol. This makes it possible for several stations that are connected
to the same physical medium to share it. The multiple access protocol may detect or
avoid data packet collisions. The MAC defined for IEEE 802.11 WLANs is based
upon collision avoidance and is known as carrier sense multiple access with collision
avoidance or CSMA/CA for short.
The collision avoidance mechanism in CSMA/CA requires wireless nodes or stations
to delay their transmission for an additional random Backoff Interval after the
medium becomes idle. The Backoff Interval is used to initialize the Backoff Timer.
The Backoff Timer is decreased as long as the medium remains idle, stopped when
the medium is sensed busy, and reactivated when the medium is sensed idle again. A
station may transmit its frame when its Backoff Timer reaches zero. The backoff time
is slotted (in IEEE 802.11b the duration of a time slot Slot_Time = 20 µs) and a station
is only allowed to transmit at the beginning of a time slot. The Backoff Interval is
randomly generated using a Backoff Interval = BC × Slot_Time where BC is a
pseudorandom integer drawn from a uniform distribution over the interval [0,CW] and
30
where CW is known as the Contention Window. The effect of this procedure is that
when multiple stations are deferring and go into random backoff, the station selecting
the smallest Backoff Interval will be the first to have its Backoff Timer reach zero and
transmit its packet. Fairness is promoted as each station must re-contend for access
after every transmission. Occasionally, two or more stations may choose the same BC
value leading to a collision as the stations involved will transmit their frames at the
same time. To resolve collisions, an exponential backoff scheme is used whereby the
size of the CW is doubled after each unsuccessful transmission [61] and a
retransmission of the packet is attempted.
3.1.2 Passive metrics
Contention
In packet mode communication networks, contention is a consequence of the MAC
mechanism in a shared broadcast medium [60]. All connected stations compete
against each other for transmission opportunities as described under the CSMA/CA
scheme where occasionally collisions will occur. A collision is a condition that occurs
when two or more data stations attempt to transmit at the same time over a shared
channel. The contention represents the average number of stations competing for each
access opportunity to the medium. The greater the contention the greater the
competition for access and the higher the probability of a collision occurring.
Collisions reduce the throughput of a station and lead to an overall reduction in the
capacity of the network. The contention parameter used in this thesis is obtained
passively by the WRM as introduced in Section 3.2.1.
31
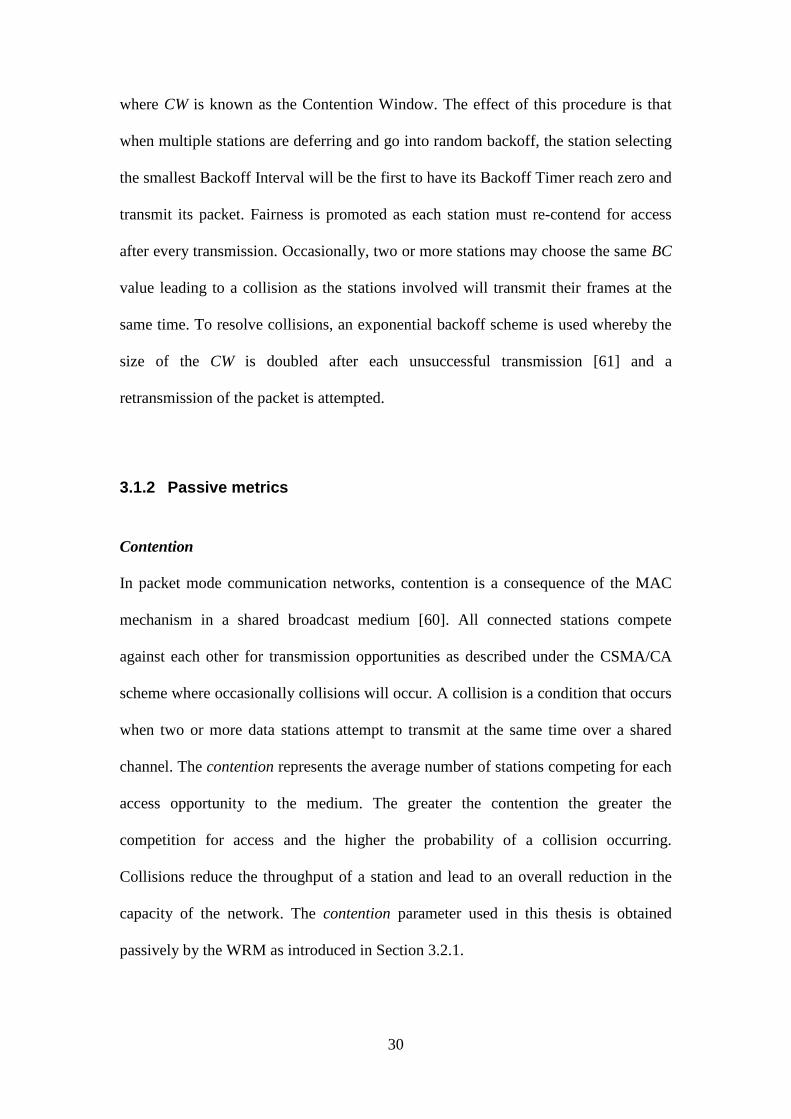
MAC Bandwidth Components - BWidle and BWbusy
Here BWbusy represents the portion of the time on the medium used in the transport of
the total traffic load. Similarly, BWidle represents the portion of the time on the
medium that is complementary to BWbusy and may be used by any station to win
access opportunities for its load. Associating the transmission of a packet with a
particular station k leads to the concept of the load bandwidth BWload (k) which
corresponds to that portion of time on the medium used in transporting its load and is
directly related to the throughput of the station.
Figure 3.1: MAC layer bandwidth components concept
Inevitably some bandwidth will be lost due to collisions between multiple stations
attempting to transmit at the same time. It is worth noting here that, apart from
collisions, stations do not share their load bandwidths during their transmissions. In
other words, once a station has won access to the medium, it has exclusive use of the
medium for the duration of the transmission of its frame. This is in contrast to the idle
bandwidth which is shared by all stations in the sense that any station can make use of
the idle time intervals on the medium to allow periods Slot_Time to elapse thereby
allowing the Backoff Timer to count down to zero.
32
Received Signal Strength RSSI
RSSI is the relative received signal strength in a wireless environment, in arbitrary
units. The RSSI value is derived from the Clear Channel Assessment (CCA) function
that is used to determine whether the medium is deemed to be busy or idle. Once the
card is clear to send, a packet of information can be sent. The end-user will likely
observe an RSSI value when measuring the signal strength of a wireless network
through the use of a wireless network monitoring tool like Wireshark, [Wildpackets
Omnipeek] [62].
RSSI measurements are unitless and are usually highly vendor dependent. For
example, Cisco Systems WLAN cards have a RSSI value between 0 and 100. Another
popular Wi-Fi chipset is manufactured by Atheros. An Atheros based WLAN card
will return an RSSI value of between 0 and 127 (0x7f) with 128 (0x80) indicating an
invalid value. The RSSI readings in this thesis are all direct readings from Atheros
based WLAN cards obtained by using the ifconfig command in Linux.
3.2 Single Radio Test bed The single radio test bed was set up to conduct a comparison between the active and
passive monitoring techniques. The results obtained from this experimental set up will
be used as a stepping stone in progressing to the multi-radio investigation. The details
of the test bed and the experimental approach are described next.
33
3.2.1 System description
All experiments have been carried out using the CNRI wireless mesh test bed [58].
This is a multi-purpose networking experimental platform which consists of 17 IEEE
802.11b/g based mesh routers, located around the DIT Focas building. Various usage
statistics about the CNRI mesh test bed can be obtained from http://mesh.cnri.dit.ie.
Each wireless node in the mesh test bed comprises a Soekris net4521 board [57]
running the Pebble Linux distribution.
To facilitate repeatable experiments and accurate data analysis, we have utilized
several different tools for network monitoring and diagnosis. These tools are now
described:
WLAN Resource Monitor (WRM): The WRM is a tool developed by the CNRI that
is capable of measuring both the availability and utilization of network bandwidth in
real time and on a per node basis [56]. It operates non-intrusively by passively
monitoring the wireless transmissions on the medium and therefore does not in any
way interfere with the normal flow of traffic on the network. Moreover, it does not
require WEP/WPA security keys to operate and therefore does not pose any security
risks when deployed on encrypted networks. The WRM differs from other WLAN
Analyzer tools in that it specifically addresses operation at the L2/MAC layer which
is where the network bandwidth is shared out between the competing nodes.
Consequently, this application can provide the type of critical network bandwidth
measurements required for effective radio resource management. During the
experiments, this application was utilized to measure the passive performance metrics
34
such as rssi, contention, available bandwidth etc. A number of these metrics were
subsequently chosen to establish the PER estimator.
Packet error rate (PER) calculation tool: PER is an important method of actively
measuring the network performance. In our performance analysis we have developed
a PER calculation tool based on the Pcap Library Engine [55]. It works by applying
protocol type filters (e.g. ICMP, SIP etc) to the packets sent from one node to another
and recording the number of packets transmitted and received over a given time
interval. This allows the PER to be calculated. This tool was installed on both the
transmitting and receiving stations. It was operated in parallel with the WRM
application to allow for a comparison between the active probing and passive
monitoring techniques.
3.2.2 Network setup and configuration
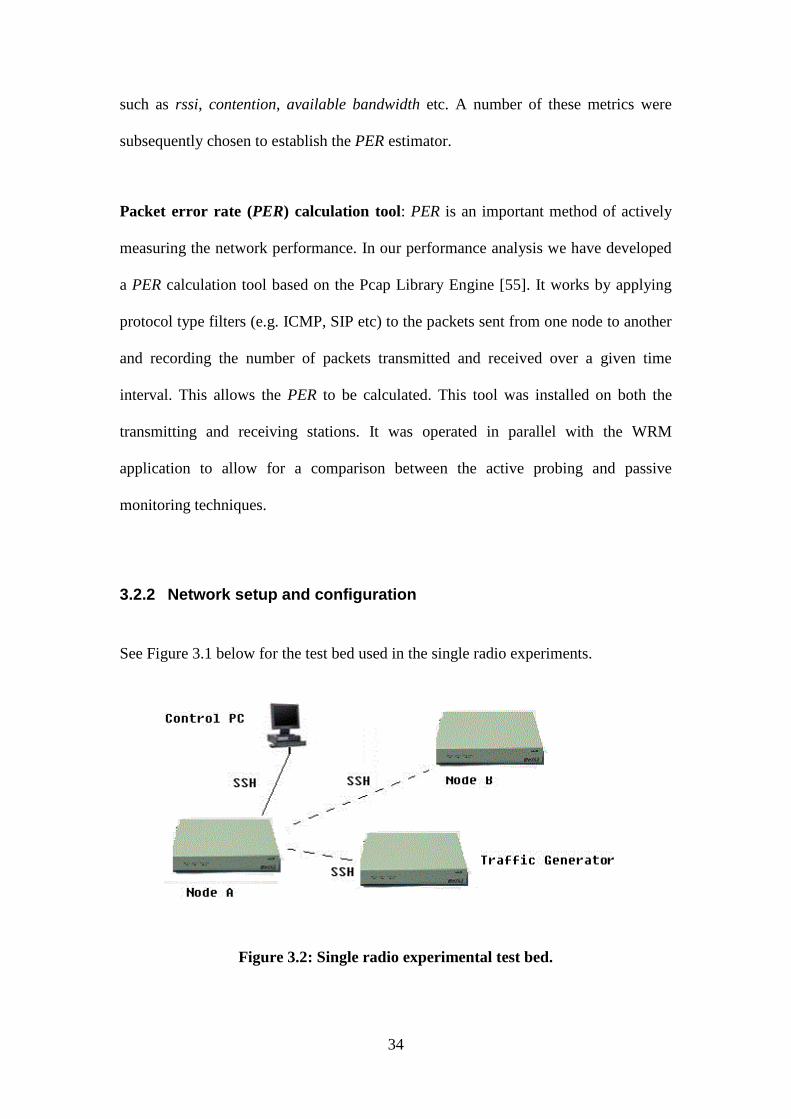
See Figure 3.1 below for the test bed used in the single radio experiments.
Figure 3.2: Single radio experimental test bed.
35
The experimental test bed consists of 3 Soekris net 4521 boards (equipped with a
single radio) as shown in Figure 3.2. Two of the net 4521 boards were configured to
operate in the Ad-Hoc mode, while the third node was used to generate different types
of background traffic on the network in various patterns such as Poisson, Uniform or
Exponential etc. Finally, a control PC is used to control the operations of all 3 nodes
using the SSH protocol.
3.2.3 Experimental approach and evaluation metrics
The experimental approach involves first gathering the performance metrics using
both active and passive probing techniques, and then calculating and plotting the
correlation between the measurements.
Initially, experiments were carried out to study the correlation between the individual
RSSI and the idle bandwidth (BWidle) measurements (passive), and the PER
measurements (active). Next, the correlation between the combined metric involving
the RSSI and BWidle measurements and the PER was studied. A total of 70
experiments were conducted. Each experiment that was carried out had a typical
duration of between 17 and 24 hours.
During the experiment, the PER was obtained by using active probing. This was done
by sending ICMP broadcast packets from Node A to Node B, and with the PER
calculation tool the PER was calculated on the receiving node based on the
successfully received ICMP packets sequence number. The passive monitoring used
the CNRI’s WRM tool where the BWidle and RSSI values were obtained.

36
To calculate the correlation between the two data sets, the Pearson correlation
coefficient is used which is a dimensionless index between -1.0 and 1.0 that reflects
the extent of the degree of correlation between the two data sets. The closer the
coefficient is to -1.0 or 1.0, the higher the correlation is between the two data sets
[54]. Mathematically, the Pearson correlation coefficient is given by:
( )( )( ) ( )∑ ∑
∑
−−
−−=
22yyxx
yyxxr Pearson correlation coefficient (3.1)
In the above equation, r denotes the correlation coefficient between two data sets (in
our case these two data sets are PER and combined passive function value. With all
the r values calculated for each of the test cases, one was able to plot all of these
values against the number of the test cases. In this way one can determine if the
passive and active monitoring techniques yield a reasonably high and stable
correlation amongst these test cases.
3.3 Wireless Multi Radio Test bed Following on from the previous single-radio test cases, the wireless multi-radio test
bed was setup. The goal here is to study the impact of using multiple radios in a
WLAN node. One of the biggest issues addressed in this work is the throughput
performance degradation associated with multi-radio networks as reported in [44].
This section of experiments aims to conduct a detailed investigation of a multi-radio
network’s performance, and again to examine if passive monitoring techniques can be
applied to such networks.
37
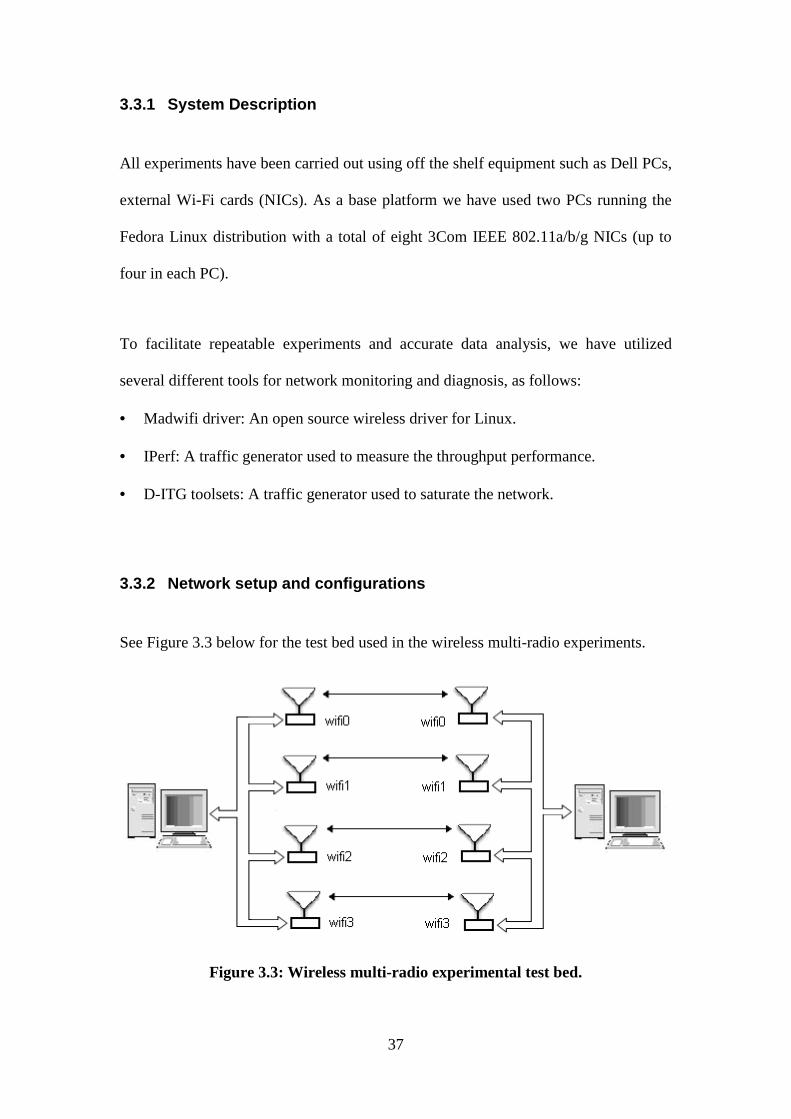
3.3.1 System Description
All experiments have been carried out using off the shelf equipment such as Dell PCs,
external Wi-Fi cards (NICs). As a base platform we have used two PCs running the
Fedora Linux distribution with a total of eight 3Com IEEE 802.11a/b/g NICs (up to
four in each PC).
To facilitate repeatable experiments and accurate data analysis, we have utilized
several different tools for network monitoring and diagnosis, as follows:
• Madwifi driver: An open source wireless driver for Linux.
• IPerf: A traffic generator used to measure the throughput performance.
• D-ITG toolsets: A traffic generator used to saturate the network.
3.3.2 Network setup and configurations
See Figure 3.3 below for the test bed used in the wireless multi-radio experiments.
Figure 3.3: Wireless multi-radio experimental test bed.

38
The experimental test bed comprises 2 PCs that are positioned eight meters apart from
each other in a dedicated area of the laboratory where the movement of people and the
access to the experiment can be kept to a minimum. Each PC can host up to 4 WLAN
NICs. These 8 NICs have been configured to operate in the Adhoc (i.e.
infrastructureless) mode to form 4 transmitter/receiver (Tx/Rx) pairs operating on
orthogonal (i.e. non-overlapping) channels.
All WLAN NICs operate in the IEEE 802.11a mode with the antenna diversity feature
disabled. This is because when this feature is enabled a second antenna on the NIC is
used which leads to higher CPU usage. During these experiments, a fixed
transmission rate of 54Mbps was used on each interface, i.e. automatic rate adaptation
was disabled. As the channel medium was stable and the distance between the stations
is short, the use of a fixed maximum rate would allow the maximum achievable
throughput for the system to be achieved.
3.3.3 Experimental approach and evaluation metrics
3.3.3.1 Experiments at the Tx node
1. Initially, a baseline performance for the throughput was established by
measuring the maximum achievable throughput between a single Tx/Rx pair
(i.e. involving just two NICs). The other six NICs are disabled. Measurements
are performed with the Iperf toolsets.
39
2. Having established a stable and reproducible baseline throughput, the impact
of multiple wireless interfaces within a node was studied. The objective was to
determine if there is any negative impact on the throughput performance as a
result of cross-talk between the wireless interfaces. During this study, a single
receiving node with a single interface was used and the number of transmitting
interfaces in the transmitting node was increased until all four PCI slots were
occupied. Each time an additional wireless interface card is inserted into the
PCI slot, the card is set to the monitor (passive) mode and tuned to an
orthogonal channel. The maximum achievable throughput is measured as
described in step 1 above. The CPU usage is obtained by using the Linux top
command. It provides an ongoing measure of processor activity in real time. It
displays a listing of the most CPU-intensive tasks on the system, and can
provide an interactive interface for manipulating processes. It can sort the
tasks by CPU usage, memory usage and runtime.
3. Steps 1 and 2 are then repeated with a different tool (i.e. D-ITG as this tool has
the capability to both generate and measure traffic throughput) to generate a
maximum throughput or saturation network condition, so the impact of an
additional NIC on the computational overhead can be measured. The
additional cards are set to the AP mode. The throughput results for the
saturated network were then recorded.
40
3.3.3.2 Experiments at the Rx node
Similar procedures are applied at the Rx node, but here different operation modes (i.e.
station mode, AP mode, monitor mode etc.) of the NICs are used while the saturated
throughput is recorded. Under the saturation condition, one of the causes of the
changes in the throughput value would be the result of using various operation modes
such as monitor mode, AP mode etc. Also the Tx transmission power is varied to
study its impact on the throughput. During each test, the link quality metric which is a
measurement indicator of the channel link quality provided by Madwifi driver were
recorded with the Linux Ifconfig command. The D-ITG tool sets are used to generate
a saturated network condition and to estimate the throughput for each scenario.
In both sections 3.2.3.1 and 3.2.3.2, the experimental tests were carried out for a
duration of 300 seconds each and were repeated 5 times and an average value
calculated.
3.4 Cabled Multi Radio Test bed
During the previous two test phases, the effectiveness of using the passive monitoring
technique in a single-radio network was examined and the performance of using
multiple NICs in a network was studied. Next, the intention is to examine the
feasibility of using the passive monitoring technique in a multi-radio network. The
ultimate goal of this section is to replicate the active performance metric (i.e. the
PER) with our proposed passive combined model. The details of the experiments are
given below.
41
3.4.1 System Description
All experiments in this section have been carried out on a cabled platform as shown in
Figure 3.3 below. It was developed by utilizing attenuators, cables and signal splitters
etc. The reason for doing this is to establish a stable network environment by
eliminating all possible external influences. This approach enabled us to gain more
reliable and reproducible results. The same set of tools as described in section 3.1.1
were also used here. In addition the D-ITG toolsets were also utilized to provide
background traffic.
3.4.2 Network setup and configurations
See Figure 3.4 below for the test bed used in the cabled multi-radio experiments.
Figure 3.4: Cabled multi-radio experimental test bed.
The cabled multi-radio test bed used off-the-shelf equipment comprising eight 3Com
wireless IEEE 802.11a/b/g NICs. All of the adapters were inserted into the parallel
42
PCI slots of the PCs where they share a common system bus. As mentioned earlier,
these adapters were then connected together through microwave coaxial cables and
couplers etc. Since this cabled network provides excellent channel condition, the PER
should be low. Therefore several 30dB attenuators were added in series along with the
cable to introduce signal attenuation – the RSSI at the Rx has been dramatically
reduced and this subsequently produced higher PER.
These 8 NICs were configured to operate in the Ad hoc (i.e. infrastructureless) mode
to form 4 pairs operating on orthogonal channels. All NICs operated in the IEEE
802.11a mode with the antenna diversity feature disabled and a fixed transmission
rate of 54Mbps on each interface as discussed in section 3.2.2.
3.4.3 Experimental approach and evaluation metrics
The experimental approach involves gathering the performance metrics using both
active and passive probing techniques, and then forming a combined function model
which will yield a high correlation with the actively obtained parameter. This
proposed combined function model is used to estimate the PER.
The PER is obtained by using active probing. This is done by sending ICMP packets
between two WLAN stations where the PER is calculated at the receiving node based
on the successfully received ICMP packets sequence number. The passive monitoring
uses the CNRI’s WRM tool where the RSSI, Contention and LineRate values were
obtained. The reason why this particular choice of parameters has been selected is
explained below.
43
Selection of performance metrics:
The goal here is to combine several passively obtained metrics together to realise an
estimator for the PER and to compare this estimate with the actual PER obtained by
measuring it directly.
There are many performance metrics that can be passively obtained by the WRM to
indicate network performance, typical metrics are LineRate, RSSI, Contention, BWidle
and BWbusy etc. Since we wish to select the most representative ones to combine
together to estimate the PER, the nature of these metrics and their inter-dependencies
need to be studied carefully. The Table 3.1 below shows the dependencies between
the various passively-obtained performance metrics.
LineRate RSSI Contention BWidle BWbusy
LineRate ----------- Y Y Y Y
RSSI N ----------- N N N
Contention Y N ----------- Y Y
BWidle Y N Y ----------- Y
BWbusy Y N Y Y -----------
Table 3.1 Inter-dependencies of the passively gathered metrics.
All of the above inter-dependencies are illustrated in Figure 3.4 where they generally
fall into four categories in relation to indicating network performance:
44
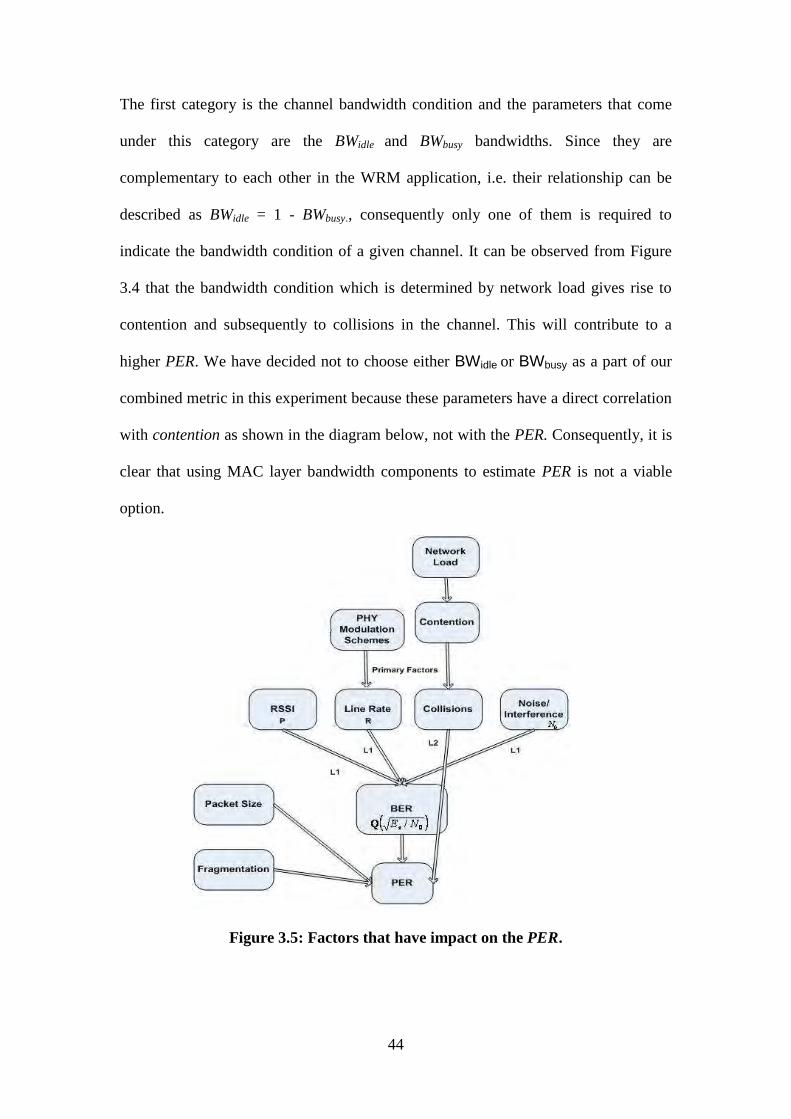
The first category is the channel bandwidth condition and the parameters that come
under this category are the BWidle and BWbusy bandwidths. Since they are
complementary to each other in the WRM application, i.e. their relationship can be
described as BWidle = 1 - BWbusy., consequently only one of them is required to
indicate the bandwidth condition of a given channel. It can be observed from Figure
3.4 that the bandwidth condition which is determined by network load gives rise to
contention and subsequently to collisions in the channel. This will contribute to a
higher PER. We have decided not to choose either BWidle or BWbusy as a part of our
combined metric in this experiment because these parameters have a direct correlation
with contention as shown in the diagram below, not with the PER. Consequently, it is
clear that using MAC layer bandwidth components to estimate PER is not a viable
option.
Figure 3.5: Factors that have impact on the PER.

45
The second category is the contention level in a given channel. The contention arises
from the MAC method that is used to share access to the broadcast medium [51]. In
an IEEE 802.11 WLAN network it arises from the fact that all stations have to
compete against each other for a transmission opportunity. Most importantly, as
shown in Figure 3.5, an increased contention level will result in a larger number of
occurrences of packet collision and this directly leads to a higher PER. It is clear that
the Contention parameter is a strong candidate for inclusion in this combined metric,
so it becomes our first metric candidate in the combined function.
The third category is the transmission rate measurement in a given channel. This
refers to the average channel transmission rate and this parameter is closely linked
with the rate adaptation algorithm. The majority of rate adaptation algorithms take
account of successive packet re-transmissions and the number of successive packet
transmissions to adapt the transmission rate. When the number of packet re-
transmission increases beyond a certain pre-set threshold, the rate adaptation
algorithm will automatically lower the transmission rate to ensure more reliable
communication and vice versa. Now let us consider the probability of the bit error rate
in a channel. In the IEEE 802.11a mode, different modulation schemes such as BPSK,
QPSK and 16QAM etc. are used for the different transmission rates, as shown in
Table 3.2 below. However, they all follow a general mathematical formula in terms of
the bit error rate Pb given by
(BER) (3.2)
( ) ( ) ( )000 /// RNSQNSTQNEQP sb ===

46
where S denotes the received signal power, T denotes transmission time, R denotes
transmission rate, Q() is the complementary error function and N0 denotes the noise
power spectral density. As can be observed from this equation, when R increases the
bit error rate will increases. There is a direct relationship between bit error rate and
PER where
nBERPER )1(1 −−= (3.3)
where n denotes the length of the packet in bits and the assumption is that the BER is
relatively low, it also assumes that the errors occur randomly and there are no burst
errors. This expression is widely used in networking community, also known as the
uniform hypothesis [52]. In short, the transmission rate has a direct correlation with
PER, so the value of the average transmission rate or LineRate becomes our second
metric candidate for inclusion in our combined metric.
LineRate Modulation schemes
6 BPSK
9 BPSK
12 QPSK
18 QPSK
24 16-QAM
36 16-QAM
48 64-QAM
54 64-QAM
Table 3.2 Modulation schemes used for different LineRates in IEEE 802.11a.
The last category is the RSSI which is the received signal strength indicator. This is
determined by the transmitter power. This parameter is widely used to measure link
quality. For example, when two stations are being moved further away apart from

47
each other, the RSSI will reduce and the communications between the two stations
will suffer from an increased PER. The mechanism behind this can be explained by
the bit error rate equation (2) above. When the transmission rate R increases, the
probability for a bit error increases which in turn leads to higher PER. Since RSSI is a
primary factor represented by S in the BER equation, it is chosen to become our third
metric to form the combined function.
Since we have chosen contention, LineRate and RSSI to form a combined function by
using the multiple linear regression model. It is now necessary to examine the
feasibility of using this proposed model. It is examined in the following two steps:
The first step is to calculate the correlation between the two data sets (i.e. combined
function value and PER value) by the Pearson correlation coefficient. With an
expected high and stable correlation with the active probing metric, it will
demonstrate the effectiveness and feasibility of the proposed model.
The second step is to use this proposed passive model to estimate the PER which is
obtained by using the active probing method and then this estimated PER will be
compared with the recorded experimental value. The difference between the two PER
values will reflect the accuracy of the proposed combined function model in a multi-
radio network.
The accuracy of the passive estimator’s estimation will serve to determine the
feasibility of the proposed passive estimator.
48
The work presented in this thesis has investigated the feasibility of using passive
performance metrics to predict the PER in a multi-radio wireless network, and the
experimental results drawn from 1000+ hours of tests suggested that it is accurate,
albeit under quite restricted and possibly ideal operating conditions. The obvious
benefit of such method is that it has no bandwidth overhead associated with it. The
percentage of overhead saving associated with the passive technique varies depending
on packet sizes, probing frequency and routing protocols etc. In [53] it has been
calculated that for an IEEE 802.11g probing scheme, there would be a 7.5% overhead
saving for a packet size of 1470 bytes and 26% for a packet size of 60 bytes. And at
the same time the associated computational effort (in terms of CPU load) has not
significantly increased. Also, it results in a reduced interference which would be
particularly attractive in high density WMNs.
49
4 Experimental Results
In this section the experimental results of this study are presented and analyzed. This
chapter is divided into three sections corresponding to each of the experimental
scenarios described in chapter 3. The first section shows that the passive monitoring
technique yields a high correlation with the active probing technique (as discussed
earlier in chapter 2). The second section demonstrates that the limited computing
resources available at the wireless node are responsible for the throughput degradation
associated with multi-radio networks. The third section discusses the feasibility of
using the passive monitoring technique in multi-radio networks and its correlation
with the active probing technique is investigated.
4.1 Single Radio Testbed
4.1.1 Correlation between the PER and the RSSI Initially the correlation of the RSSI value of the nodes (i.e. obtained from the passive
monitoring technique) and the PER (i.e. obtained from the active probing technique)
was investigated for 20 test cases. Each test case has a typical duration of
approximately 17 hours.
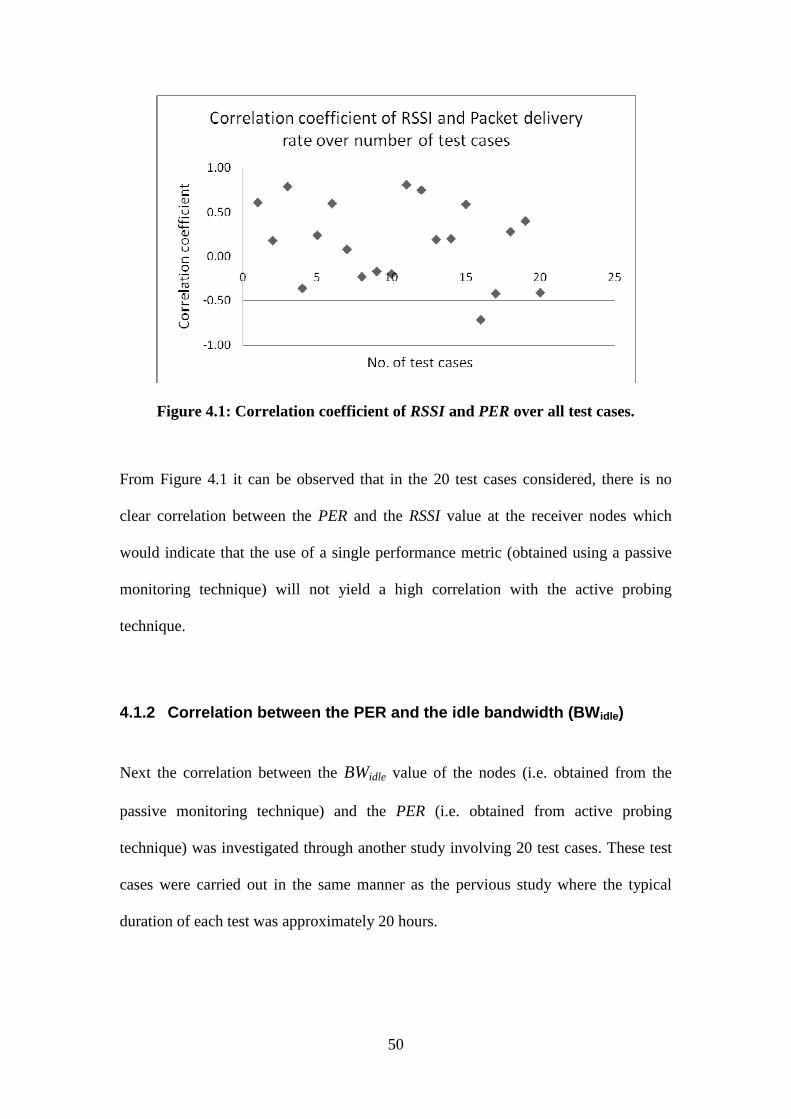
50
Figure 4.1: Correlation coefficient of RSSI and PER over all test cases.
From Figure 4.1 it can be observed that in the 20 test cases considered, there is no
clear correlation between the PER and the RSSI value at the receiver nodes which
would indicate that the use of a single performance metric (obtained using a passive
monitoring technique) will not yield a high correlation with the active probing
technique.
4.1.2 Correlation between the PER and the idle bandwidth (BWidle)
Next the correlation between the BWidle value of the nodes (i.e. obtained from the
passive monitoring technique) and the PER (i.e. obtained from active probing
technique) was investigated through another study involving 20 test cases. These test
cases were carried out in the same manner as the pervious study where the typical
duration of each test was approximately 20 hours.
51
Figure 4.2: Correlation coefficient of BWidle and PER over all test cases.
As can be seen in Figure 4.2, there is no discernible correlation between the PER and
the idle bandwidth BWidle for the 20 test cases considered. From these first two results,
it is evident that a single performance metric obtained from passive monitoring is
insufficient to establish a strong correlation with those from active probing.
4.1.3 Combining Passive Measurements In order to more accurately reflect the link performance obtained from the passive
monitoring technique, the RSSI value and the BWidle value are combined and
normalised as follows:
( )30
*,
BWidleRSSIBWidleRSSIF = (4.1)
The reason that the factor 30 is used to normalize the function is that the MadWifi
driver used in these experiments specifies that the RSSI value of a strong signal will
have a value of 30.

52
Figure 4.3 below shows the results obtained from calculating the correlation of the
active probing technique and the passive combined function method. A total of 30 test
cases were performed.
Figure 4.3: Correlation coefficient of the combined function and PER over all 30 test cases.
As shown in Figure 4.3, a high degree of correlation can be observed with a
correlation coefficient between 0.7 and 0.9. This indicates that passive monitoring can
have a good correlation with active probing if the combined function is used for the
passive monitoring measurements.
In order to further verify the combined function in a network, background traffic was
introduced. Figure 4.4 shows the correlation between the two techniques when they
try to monitor the variation of the network traffic in terms of PER. The variation in
the network load is produced by another Soekris board as explained in the previous
chapter of this thesis.
53
Figure 4.4: Variation in the combined function value and PER over time (Y-axis unit is percentage in true value).
Figure 4.4 shows how both the PER and the combined function values react to the
variation in background traffic load. It can be observed that during the course of the
experiments their reaction to this variation are quite similar, that is whenever the
background load varies, the two performance metrics respond to it simultaneously.
This indicates that both passive monitoring and active probing techniques can
accurately reflect the network performance in terms of the PER.
4.2 Wireless Multi Radio Testbed
4.2.1 Throughput statistics under non-saturation condition at the Tx node
This section presents the results of the performance measurement under a non-
saturation condition at the Tx node. Between the Tx and Rx nodes, data packets are
transmitted by using traffic generation tools as explained in Chapter 3. Then the
throughput between an active pair is firstly measured. This measurement will be re-
54
performed after an extra NIC is inserted into the Tx node. The CPU idle % is
measured also.
Table 4.1 Throughput under non-saturation at the Tx node with different packet
sizes and number of active interfaces.
Table 4.1 above contains the measured throughput measurements between the active
pair of NICs and it shows the changes in throughput when the number of active NICs
varies with different packet sizes.
Figure 4.5: The variation in the aggregate node throughput under non-saturation conditions with multiple wireless cards and different packet sizes.
Mb/s
55
Figure 4.5 shows a graph of the results given in Table 4.1 and it shows that under
non-saturation conditions, the throughput between the active pair decreases as more
NICs are activated in the Tx node. Also it is worth pointing out that larger packet
sizes also contribute to the increased throughput owing to more efficient use of the
transmission medium.
Figure 4.6 below is a graph of the throughput and CPU idle % data collected during
an experiment. This experiment measured the maximum possible throughput between
the active pair as well as the CPU idle % value (by using the top command in the
linux system). These measurements were then repeated after additional NICs were
inserted into the testbed. The results show the effect of each additional NIC on
throughput with reference to the CPU idle %. Again the experiment was conducted
under non-saturation conditions.
Figure 4.6: Effect of additional NICs on throughput under non-saturation with a packet size of 1470 bytes.
Mb/s

56
Table 4.1 and Figures 4.5 and 4.6 indicate that when the network is not saturated and
provided that there is sufficient CPU processing power, the throughput between the
active pair decreases as the number of NICs increase. As expected when given a fixed
number of radios in a node, the throughput between the pair increases when using
larger packet sizes owing to more efficient use of the transmission medium. It should
be emphasized that each additional NIC card has been placed in a monitor (passive)
state, and therefore each additional NIC imposes an additional load on the CPU as
every frame on the medium is monitored by these additional NICs and hence requires
servicing by the CPU.
4.2.2 Throughput measurements under saturation condition at the Tx node
This section presents data collected during the experiments conducted when the
network is fully saturated, and the testbed is setup as described in Section 3.3.2.
Figure 4.7 below is the result from an experiment where the network is fully saturated
and the impact of inserting an additional NIC on the active pair throughput and the
CPU idle % can be seen.
57
Figure 4.7: Throughput statistics under saturation condition with reference to CPU idle % for a packet size of 1470 bytes .
It can be observed from Figure 4.7 that when the network is fully saturated, additional
NICs inserted into the system do not have any discernable impact on either the
throughput performance or the CPU idle %.
As the Madwifi driver is able to provide different operation modes for the NICs, an
experiment was performed to investigate the impact of using two different modes, i.e.
the AP and Monitor modes, under saturation condition. The results from this
experiment are shown in Figure 4.8 below and show that additional NICs do not have
a significant impact on the throughput performance.
Mb/s
58
Figure 4.8: Throughput comparison in 2 different modes under saturation with 1470 bytes packets.
During this phase of the experiment, the D-ITG tool sets are used to generate large
amounts of UDP traffic in order to fully saturate the network and the CPU processing
power of the receiving node. The packets are 1470 bytes in size and are created at the
rate of 5000 packets per second. From an analysis of the data carried out after the
experiments, it was observed that the CPU idle% had been less than 1% throughout
the tests.
Furthermore, Figure 4.7 shows that the throughput does not vary when additional
NICs are inserted, which is contrary to the result for the non-saturation experiment
presented in Figure 4.7. This result confirms the observation made in Section 4.2.1
that the decrease in throughput is primarily due to the finite processing power of the
node. In other words, the crosstalk does not appear to be a limiting factor in
determining the maximum achievable throughput. Figure 4.8 shows the throughput
Mb/s

59
comparison when the additional NICs are set to the Monitor mode and the AP mode
under saturation conditions. There is a slight increase in throughput when using the
AP mode which is due to the fact that AP mode does not require as much CPU
resources when compared to the Monitor mode.
4.2.3 Experiments at the Rx node This section presents the results from an experiment to investigate the impact of using
different operating modes, transmission power, and link quality on the saturated
throughput between the active pair.
As shown in Table 4.2 below, different test scenarios were created for an increasing
number of active NICs. When additional NICs are inserted into the node, the signal
level, throughput and link quality are measured for several operating modes with
different power output levels.
60
Table 4.2 Results recorded at the Rx node under different test scenarios (link quality is obtained directly from the madwifi ifconfig command)
From Table 4.2 above, several observations can be made as follows:
1. Both the signal level and noise level decreases when the number of active
NICs at the Rx node increases.
2. When the additional NICs are placed in the inactive mode, it can be observed
that the signal level increases as well as the link quality. There is also a slight
increase in the throughput.

61
3. There is no significant change in the throughput when additional NICs are
inserted into the Rx node.
4. There is no major difference in throughput between the various operating
modes.
5. A significant decrease in throughput can be observed when the Tx transmitting
power is set to its minimum value.
6. The throughput increases with link quality improves.
In summary, despite the variations in signal levels and link quality, additional NICs
inserted into the node do not seem to produce a negative impact on throughput
performance.
4.3 Cabled Multi Radio Testbed
4.3.1 Experiments to determine the weighting factors This section of experiments is concerned with finding the weights for each of the
metrics used in the combined function model. Table 4.3 below presents the recorded
values of PER when various combinations of Line Rate, RSSI and Contention are
used.
62
PER(%) LR(Mbps) Contention(n) RSSI(dBm)
0.7 47 2.5 8
0.62 45 2.1 16
0.55 42 1.8 20
0.39 35 1.5 28
0.25 29 1.2 35
0.17 25 0.8 38
0.15 22 0.7 39
0.12 16 0.6 41
0.1 12 0.3 43
Table 4.3 Recorded values of PER when different metric combinations were used.
As discussed in the previous chapter, in order to use the multiple linear regression
model to determine the different weightings for the metrics, it is necessary to plot the
PER against each of the metrics to determine the nature of the relationship.
The results contained in the figure below are from an experiment where the
contention value and the PER are measured simultaneously when the data is being
sent from one node to another.
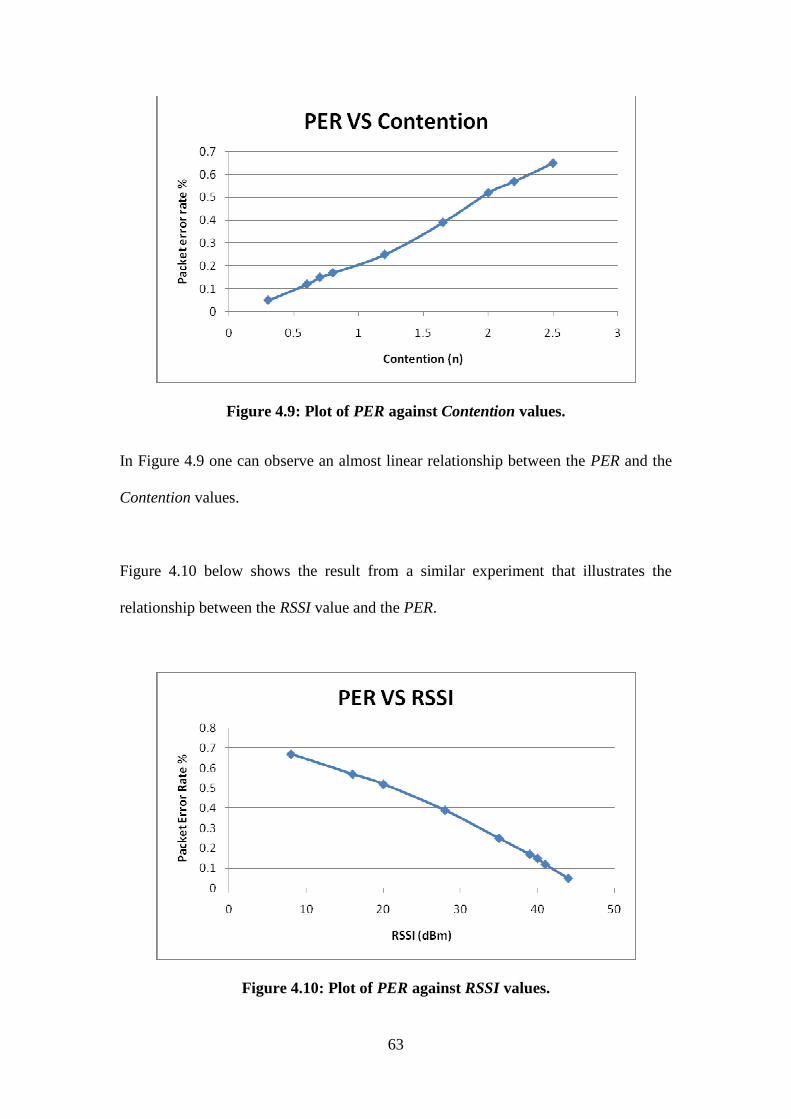
63
Figure 4.9: Plot of PER against Contention values.
In Figure 4.9 one can observe an almost linear relationship between the PER and the
Contention values.
Figure 4.10 below shows the result from a similar experiment that illustrates the
relationship between the RSSI value and the PER.
Figure 4.10: Plot of PER against RSSI values.
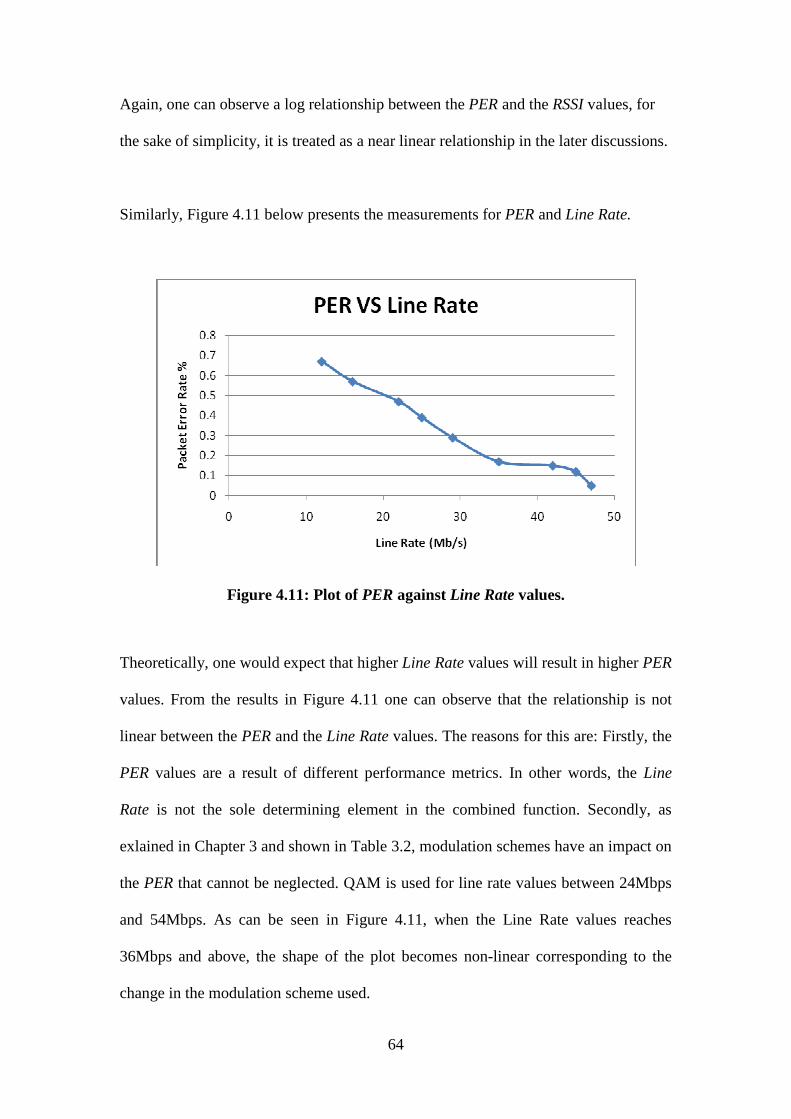
64
Again, one can observe a log relationship between the PER and the RSSI values, for
the sake of simplicity, it is treated as a near linear relationship in the later discussions.
Similarly, Figure 4.11 below presents the measurements for PER and Line Rate.
Figure 4.11: Plot of PER against Line Rate values.
Theoretically, one would expect that higher Line Rate values will result in higher PER
values. From the results in Figure 4.11 one can observe that the relationship is not
linear between the PER and the Line Rate values. The reasons for this are: Firstly, the
PER values are a result of different performance metrics. In other words, the Line
Rate is not the sole determining element in the combined function. Secondly, as
exlained in Chapter 3 and shown in Table 3.2, modulation schemes have an impact on
the PER that cannot be neglected. QAM is used for line rate values between 24Mbps
and 54Mbps. As can be seen in Figure 4.11, when the Line Rate values reaches
36Mbps and above, the shape of the plot becomes non-linear corresponding to the
change in the modulation scheme used.

65
Following on from the discussion of the three figures above and for sake of
simplicity, it is reasonable to approximate the relationship between the three metrics
as a linear relationship. Therefore, the next step is to utilize a multiple linear
regression model (which was discussed earlier in chapter 3) to determine the
coefficients for the desired combined function.
As outlined earlier, the objective of this section is to determine the different weights
that each parameter carries in the combined function. Below are the weights
calculated based on the data from Table 4.3 by using the multiple linear regression
method.
Line Rate (Mbps) 0.006
Contention(Arbitrary Unit) 0.089
RSSI(dBm) 0.018
Constant(Arbitrary Unit) 0.08
Table 4.4 The coefficients and the constant of the combined function model.
From the results shown in Table 4.4 above, the combined function model is as
follows:
08.0018.0089.0006.0 +×+×+×= RSSIContentionLineRatePER (4.2)
Since the weightings for the various passive metrics that comprise the combined
function have been determined, the next step is to validate the accuracy of this
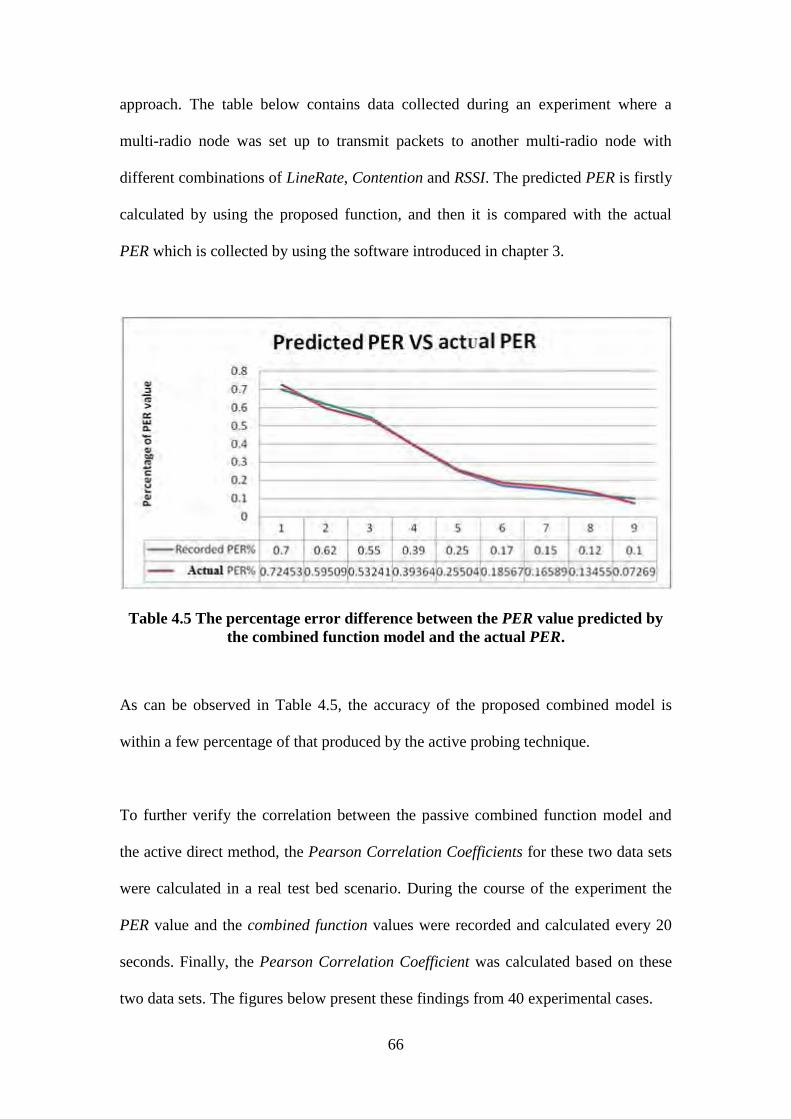
66
approach. The table below contains data collected during an experiment where a
multi-radio node was set up to transmit packets to another multi-radio node with
different combinations of LineRate, Contention and RSSI. The predicted PER is firstly
calculated by using the proposed function, and then it is compared with the actual
PER which is collected by using the software introduced in chapter 3.
Table 4.5 The percentage error difference between the PER value predicted by the combined function model and the actual PER.
As can be observed in Table 4.5, the accuracy of the proposed combined model is
within a few percentage of that produced by the active probing technique.
To further verify the correlation between the passive combined function model and
the active direct method, the Pearson Correlation Coefficients for these two data sets
were calculated in a real test bed scenario. During the course of the experiment the
PER value and the combined function values were recorded and calculated every 20
seconds. Finally, the Pearson Correlation Coefficient was calculated based on these
two data sets. The figures below present these findings from 40 experimental cases.
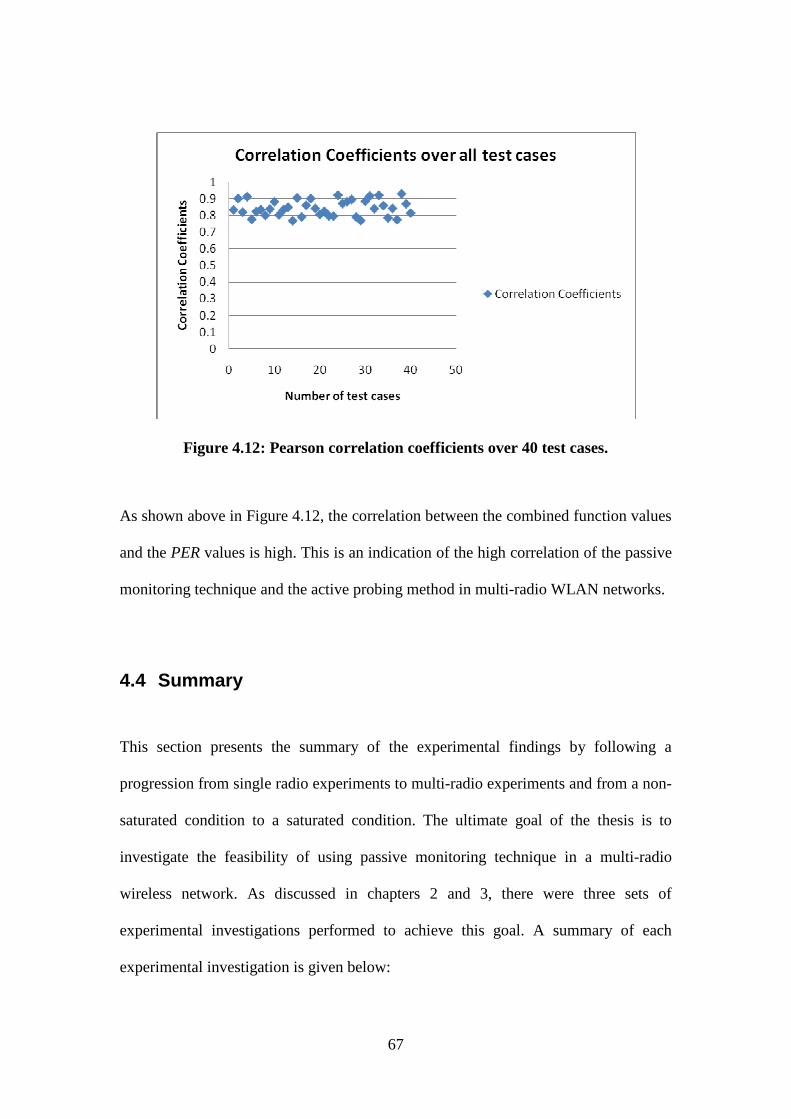
67
Figure 4.12: Pearson correlation coefficients over 40 test cases.
As shown above in Figure 4.12, the correlation between the combined function values
and the PER values is high. This is an indication of the high correlation of the passive
monitoring technique and the active probing method in multi-radio WLAN networks.
4.4 Summary
This section presents the summary of the experimental findings by following a
progression from single radio experiments to multi-radio experiments and from a non-
saturated condition to a saturated condition. The ultimate goal of the thesis is to
investigate the feasibility of using passive monitoring technique in a multi-radio
wireless network. As discussed in chapters 2 and 3, there were three sets of
experimental investigations performed to achieve this goal. A summary of each
experimental investigation is given below:
68
The first experimental investigation studied the effectiveness of the passive
monitoring technique when compared with the traditional active probing method in a
single radio network. This serves as the starting point that will lead towards the multi-
radio goal. During the experiments, it was observed that by combing certain passively
obtained metrics, the passive monitoring technique yields a high correlation with the
active probing method.
The second experimental investigation was concerned with the operating
characteristics of multi-radio networks. During these experiments, the impact of using
multiple radios in a network was studied under both non-saturated and fully saturated
conditions. It was found that when the network was not saturated, the capacity
increases as a function of the number of NICs. But under saturation, it would appear
that the additional NICs do not produce any benefit in terms of improved network
performance. The system throughput degradation was also investigated where it was
found that the limited CPU resources of the computer platform used is the main cause
of the performance degradation.
Having studied the performance of the passive monitoring technique in single radio
networks and the operating characteristics of the multi-radio networks, the next step
was to test the feasibility of using such a technique in a multi-radio network. By
proposing the use of a combined function composed of passively obtained metrics, it
was shown through the experiment results that such a technique yields an accurate
measurement of PER when compared with the active probing method.
69
5 Conclusions
As the use of wireless mesh networks (WMNs) continues to become more
widespread, it seems likely that the deployment of real-time applications on these
networks will also increase. Applications such as VoIP and VOD will continue to
drive the need for improved capacity in multi-radio networks. In mesh networks
improved monitoring techniques are vital for the support of highly effective route
selection mechanisms to realize higher capacities.
This thesis presents a detailed experimental analysis of a passive monitoring
technique for use in WMNs. In this technique all transmissions are passively
intercepted and subsequent processing produces useful performance metrics such as
line rate, contention and RSSI etc. It has the advantage that it does not generate any
overhead unlike the continuous transmission of probe packets by the active probing
techniques. The proposed technique is examined by comparing its accuracy with that
of the active probing technique in both single-radio and multi-radio networks. The
study shows that there is a high degree of correlation between these two techniques
and that they can be used interchangeably. The performance impact of using multiple
radios in a mesh node is also studied and it was found that the system performance
degradation is caused by insufficient CPU resources. The addition of extra radios in a
mesh node does not produce a discernible impact on the throughput under saturation
condition. In order to realize an accurate substitute for the active probing technique,
several passively gathered performance metrics were carefully chosen to form a
combined function model. This was shown to produce an accurate estimate of the
packet error rate (PER).
70
5.1 Findings of this Work
The WLAN Resource Monitor (WRM) application was used in this work to generate
the passive network performance metrics. It operates non-intrusively by passively
monitoring the wireless transmissions on the medium and therefore does not in any
way interfere with the normal flow of traffic on the network. It has the advantage that
it does not generate any form of overhead as opposed to the active probing technique
which sends probing packets to the network at a constant rate.
The first objective of this work was the literature review to establish the state-of-
the-art regarding the measurement of link performance and the operation of
routing selection mechanism in WMNs. This part of the work involved extensive
reading and research on all relevant papers, journals and peer studies. The main
findings from the literature review are as follows:
It has been found that since there may be a large number of nodes within a WMN,
there may be as many different routes to choose from when forwarding a packet from
one network node to another. The mechanism that controls the routes selection
process is referred to as the routing protocol. Many different routing protocols have
been developed and proposed for WMNs such as ADOV, DSR etc. The routing
selection mechanisms of those routing protocols vary considerably. The routing
protocols use link metrics as part of the path selection mechanism. As such, it is
important to determine accurate performance metrics. Traditionally, researchers had
been using the active probing method which although it generates overhead it is
71
considered an accurate and reliable method. Only recently has passive monitoring
started to gain in popularity as a means to obtain network performance metrics. It has
the advantage over the active probing methods that it does not impose any overhead
on the network.
Based upon the findings from the literature review, the following questions arise:
How accurate is passive monitoring compared to the active probing method? Can it
replace the active probing method? Traditionally, routing protocols have used active
performance metrics like hop count, ETT, packet loss rate etc. to establish the routing
decision. This thesis focuses on the packet error rate (PER) in an attempt to develop a
passive monitoring mechanism and these questions lead us to the next objective of
this work.
The second objective of this work was to investigate the correlation of the passive
monitoring and the active probing techniques in a single-radio WMN as a
foundation for further research. A segment of our 17-node mesh network was
chosen to be the experimental test bed for this purpose. The idea behind the
experiments was to passively collect MAC layer performance metrics and at the same
time to actively calculate the PER every 10 seconds. These experiments had a
duration of at least 17 hours and generated two sets of data corresponding to each of
the techniques used. The Pearson Correlation Coefficient was calculated for these two
data sets and then plotted.
As shown in section 4.1 of this thesis, initially only one passive metric was chosen
and its correlation with the PER was calculated. The results demonstrated that none of
72
these passively gathered performance metrics on their own were capable of producing
a reliable and high correlation with the PER obtained through active probing. This
indicated that a single passive metric is not sufficient to accurately determine the
network performance. Therefore the next step in the experiment was to combine a
number of passively obtained performance metrics in order to realize a higher
correlation with the PER generated by the active probing method.
Subsequent experimental results revealed the feasibility of such a model as it yielded
a stable correlation with the PER obtained using the active probing method. The
findings of this section shows that by combining certain passively gathered
performance metrics, the passive monitoring technique can be used to accurately
estimate the PER. Moreover, this combined function model can well be used inter-
changeably with the active probing technique.
The third objective of this work was to study the characteristics of multi-radio
wireless networks with regard to the throughput degradation problem associated
with the simultaneous activation of multiple radios in a network node. The
ultimate goal of this thesis is to determine the feasibility of using a passive monitoring
technique instead of an active probing method in obtaining performance metrics for
supporting routing in WMNs. Therefore, it is important to study the performance
impact of using multiple radios in a network. In this thesis, the throughput between
two multi-radio nodes under various test scenarios was examined. This part of the
work is divided into two sections: the network performance under saturation
conditions and the network performance under non-saturation conditions.
73
Under non-saturation conditions, it was observed that the overall capacity of a multi-
radio node increases as a function of the number of active radios. The impact of each
additional radio was examined with regard to the CPU idle %. Each experiment was
repeated 5 times to obtain the average value of this metric in order to provide an
indication of the computational load imposed on the CPU. Also when all of the
additional radios were placed into the passive mode, it was observed that each
additional radio would impose a 3-5% penalty on the CPU idle %. The reason was
that although the radio card was placed in the passive mode, each frame in the
medium is monitored by these radios and thus requires CPU servicing. This leads to
the system performance degradation which was confirmed by the experimental
results.
When the network is fully saturated, it was found that regardless of the number of the
active radio cards within a station, the CPU processing power was fully consumed
while the maximum achievable throughput of the station did not vary. We conclude
that the so called “cross talk” (as suggested by other researchers in this area) between
the active radio cards would not appear to be a limiting factor in determining the
maximum achievable throughput. Instead the finite computing power available at the
node was largely responsible for the system performance degradation problem
associated with the simultaneous activation of multiple radios within a node.
Another set of experiments was carried out to study the impact on the link quality and
throughput when using different operation modes and transmission powers. The
following observations were made: Both the signal level and noise level decrease
when the number of active radio cards at the Rx node increases and similar to the

74
previous experiments there is no significant change in the throughput when additional
radio cards are inserted into the Rx node. Another interesting finding is that there is
no major difference in throughput between the various operating modes and
transmitting powers. Having said that, it was observed that the only exception to this
was that there was a significant decrease in throughput when the transmission power
is set to its minimum value as the power was too low to ensure reliable packet
delivery. Having studied the performance characteristics of WMNs, the next step was
to incorporate the passive monitoring technique into a multi-radio network.
The fourth objective of this work was to investigate the feasibility of using the
passive monitoring technique in a multi-radio network. The term feasibility refers
to a number of aspects here and its definition should be obtained from answering the
following questions: In a multi-radio network, can the passive monitoring technique
yield similar results to those obtained through the active probing method as observed
in the single radio network? If so, can an accurate model be developed to estimate the
active performance metric with passive performance metrics? What is the accuracy of
such a model?
With these questions in mind, the first priority is to choose suitable passive
performance metrics in order to establish a combined model. The inter-dependencies
and the relationship of the many MAC bandwidth components were carefully studied
and only the ones with the most direct relationship with the PER were chosen, namely
line rate, contention and RSSI. The details of this selection process are explained in
chapter 3.
75
Through a series of experiments it was found that each of these metrics has an almost
linear relationship with the PER. It was clear that in order to accurately establish a
combined function model, it was necessary to calculate the coefficients/weightings for
the three metrics. This was done by using a multiple linear regression model which is
described in chapter 3. Once the corresponding weightings were calculated, an
expression was established in the form of (the units are: linerate in Mbps, rssi in dBm
and contention is a dimensionless ratio):
08.0*018.0*089.0*006.0 +++= rssicontentionlineratePER (5.1)
This equation can be used to estimate the active performance metric from the passive
measurements.
It was also found that the line rate has the dominant effect on PER performance as
indicated in chapter 4. Later this equation was validated in a multi-radio test bed as
shown in earlier chapters. The results showed a small error difference between the
estimated PER and the actual PER where the error was of the order of a few percent.
Through a large number of experimental runs, the results demonstrated a high and
stable correlation between the two methods which confirms the effectiveness of the
passive monitoring technique in a multi-radio network and the inter-changeability of
the two techniques.
76
5.2 Future Work
In this work, a novel method of estimating the active performance metrics through the
use of passively obtained metrics in multi-radio networks has been proposed.
Although this method has been shown to accurately estimate the PER, which is an
important network performance indicator, further analysis of the scheme under
different network and propagation conditions could be performed.
Regarding the wireless multi-radio testbed, only a single hop scenario was established
and examined. It would be beneficial to implement and test this scheme within a
multi-hop Wireless Mesh Network. In such networks, the contention for access will
be greater which will have an impact of the PER estimate.
Another important concern in this work is that for the purposes of assessing its
performance, the performance metric selected is the PER. Packet errors tend to arise
from two sources, namely channel conditions and network conditions. The channel
conditions involve AWGN, fading, interference etc. and the network conditions refers
to collisions, retransmissions etc. Not surprisingly the passive monitoring technique is
only able to track the changes in the network conditions, not the channel conditions.
During the course of this work the channel conditions were kept relatively stable and
therefore the main limitation of the proposed passive scheme is that it has not been
applied to network deployments where there is an absence of LOS communication
between nodes. Consequently, there will no longer be a simple linear relationship
between the metrics. This will probably require the introduction of additional passive
metrics into the combined function. Thus, it would be extremely beneficial to further

77
develop the proposed scheme to adapt to both channel and network conditions in the
future.
Although the scheme presented in this thesis is quite limited as discussed above, the
main contribution of this work is that is presents an important first step in the
development of passively obtained performance metrics for supporting routing
protocols in WMNs. It has demonstrated the feasibility of such an approach, i.e. that it
is possible (in principle) to substitute active probing techniques with passive ones.
Clearly, this thesis represents just the beginning of a whole new approach to obtaining
efficient and accurate passive routing metrics for WMNs. There is considerably more
work to be done in improving the accuracy and applicability of the technique.
However, this is beyond the scope of this MPhil thesis and would be more appropriate
to a PhD study.
Ultimately, the future works in this area will involve extensive experiments in outdoor
and multi-hop networks where the accuracy of the proposed scheme can be further
assessed. Depending on the outcome, additional passive metrics may need to be
added, and also further mathematical analysis may be needed to investigate the
correlation between the passive metrics and the channel interference such as fading
etc. All of the above considerations will need to be incorporated into the proposed
scheme to improve its accuracy under different deployment and channel conditions.
As the proposed scheme is a means of monitoring the network performance, it makes
sense to develop this scheme as a piece of monitoring software that will take account
of both network and channel conditions and report the real-time network performance
to the end users or feed it back into the monitoring application. Such software

78
application can also aid the path selection and subsequently, the routing selection
process.
79
References [1] K.Kowalik, B.Keegan and M.Davis., "Making OLSR Aware of Resources."
Shanghai, China: Wicom2007, August 2007. [2] MIT Roofnet. [Online] [Last checked: April 27, 2010.]
http://www.pdos.lcs.mit.edu/roofnet. [3] Mesh networking summit. [Online] [Last checked: April 27, 2010.]
http://research.microsoft.com/meshsummit. [4] Seattle Wireless. [Online] [Last checked: April 27, 2010.]
http://www.seattlewireless.net. [5] Mesh Dynamics Inc. [Online] [Last checked: April 27, 2010.]
http://www.meshdynamics.com. [6] R.Karrer, A.Sabharwal, and E.Knightly., "Enabling Large-scale Wireless
Broadband: The case for TAPs." Cambridge, MA, USA: Hotnets, 2003. [7] S.Lee, S.Nanerjee, and S.Bhattacharjee., "The Case for a Multi-hop Wireless
Local Area Network." HongKong, China: IEEE Infocom, March, 2004. [8] Portoles-Comeras, M. Mangues-Bafalluy, and J. Requena-Esteso., "Multi-radio
Based Active and Passive Wireless Network Measurements." Boston, MA, USA: 4th International Symposium on Modelling and Optimization in Mobile,
Ad Hoc and Wireless Networks, April 2006. [9] L. Ciavattone, A. Morton, and G. Ramachandran., "Standardized Active measurements on a tier 1 IP backbone." IEEE Comm. Mag., V4 i6, P90-97,
June 2003. [10] Rappaport, Benjamin E. Henty and Theodore S., Throughput Measurements
and Empirical Prediction Models for IEEE 802.11b Wireless LAN (WLAN) Installations. [Online] Technical Report MPRG 01-08, Dept. of Electrical and Computer Engineering, Virginia Polytechnic Institute and State University, 2001. [Last checked: April 27, 2010.] http://scholar.lib.vt.edu/theses/available/etd-08142001-172523/unrestricted/hentythesis.pdf.
[11] J. Yeo, M. Youssef, T. Henderson, and A. Agrawala., "An accurate technique for measuring the wireless side of wireless networks." Seattle, WA, USA: WiTMeMo '05, June 2005.
[12] A. Willig, M. Kubisch, C. Hoene, and A. Wolisz., "Measurements of a wireless link in an industrial environment using an IEEE 802.11-compliant physical layer." IEEE Transactions on Industrial Electronics, December 2002, Issue no. 6, pp. 1265-1282, Vol. 43.
[13] G. Nguyen, R. H. Katz, B. Noble, , and M. Satyanarayanan., "A trace-based approach for modeling wireless channel behavior." Coronado, CA, USA: Winter Simulation Conf, December 1996.
[14] M. V. Clark, K. K. Leung, B. McNair, and Z. Kostic., "Outdoor IEEE 802.11 cellular networks: Radio link performance." New York, USA: IEEE ICC 2002, April 2002.
[15] Na, Chen., IEEE 802.11 Wireless LAN Traffic Analysis: A Cross-layer approach. [Online] PhD thesis dissertation, the university of Texas at Austin, May 2005. [Last checked: April 27, 2010.] http://gradworks.umi.com/31/76/3176313.html.
80
[16] Marc Portoles-Comeras, Manuel Requena-Esteso, Josep Mangues- Bafalluy., "Monitoring wireless networks: performance assessment of sniffer architectures." Chicago, USA: IEEE ICC, June 2006.
[17] J. Yeo, M. Youssef, T. Henderson, and A. Agrawala., "An accurate technique for measuring the wireless side of wireless networks." Seattle, WA, USA: WiTMeMo '05, June 2005.
[18] J. Yeo, S. Banerjee and A. Agrawala., Measuring traffic on the wireless medium: experience and pitfalls. [Online] December 2002. [Last checked: April 27, 2010.] http://www.cs.umd.edu/Library/TRs/CS-TR-4421/CS-TR-4421.pdf.
[19] J. Yeo, M. Youssef, A. Agrawala., "A Framework for Wireless LAN Monitoring and its Applications." Philadelphia, PA, USA: ACM MobiCom 2004, October 2004 .
[20] D. Aguayo, J. Bicket, S. Biswas, G. Judd, and R. Morris., "Link-level measurements from an 802.11 b mesh network." Portland, USA: ACM SIGCOMM, Aug 2004. pp. 121–132.
[21] D.Kotz, C. Newport, R. S. Gray, J. Liu, Y.Yuan, and C. Elliott., Experimental evaluation of wireless simulation assumptions. [Online] Dept. of Computer Science, Dartmouth College, Tech., 2004. [Last checked: April 27, 2010.] www.ists.dartmouth.edu/library/45.pdf. Rep. TR2004-507.
[22] Haykin, S., "Cognitive radio: Brain-empowered wireless communications." IEEE J. Sel. Areas Commun., Feb 2005, Issue no. 2, pp. 201–220, Vol. 23.
[23] D. S. D. Couto, D. B. Aguayo, A. Chambers, and R. Morris., "Performance of multi-hop wireless networks: Shortest path is not enough." Princeton, NJ, USA: HotNets-I, Oct 2002.
[24] Morris, S. Biswas and R., "ExOR: Opportunistic multi-hop routing for wireless networks." Philadelphia, PA, USA: ACM SIGCOMM, Aug 2005.
[25] Morris, S. Biswas and R., "Opportunistic routing in multi-hop wireless networks." Cambridge, MA, USA: HotNets-II, Nov 2003.
[26] C. Yu, K. G. Shin, and L. Song., "Link-layer salvaging for making routing progress in mobile ad hoc networks." Urbana-Champaign, IL, USA: ACM MobiHoc, May 2005.
[27] R. Draves, J. Padhye, and B. Zill., "Routing in multi-radio, multi-hop wireless mesh networks." Philadelphia, PA, USA: ACM MobiCom, Sep. 2004.
[28] D. S. D. Couto, D. Aguayo, J. Bicket, and R. Morris., "A high-throughput path metric for multi-hop wireless routing." San Diego, CA, USA: ACM MobiCom, Sep. 2003.
[29] L. Qiu, P. Bahl, A. Rao, and L. Zhou., "Troubleshooting multi-hop wireless networks." Alberta, Canada: ACM SigMetrics, Jun. 2005.
[30] D. D. Clark, C. J. Partridge, C. Ramming, and J. T. Wroclawski., "A knowledge plane for the Internet." Karlsruhe, Germany: ACM SigComm, Aug. 2003.
[31] S. Lee, B. Bhattacharjee, and S. Banerjee., "Efficient geographic routing in multihop wireless networks." Urbana-Champaign, IL, USA: ACM MobiHoc, May 2005.
[32] P. Bahl, R. Chandra, and J. Dunagan., "SSCH: Slotted seeded channel hopping for capacity improvement." Philadelphia, PA, USA: ACMMobiCom, Sep. 2004.
[33] Chiueh, A. Raniwala and T., "Architecture and algorithms for an IEEE 802.11b based multi-channel wireless mesh network." Miami, FL, USA: IEEE InfoCom, Mar. 2005. pp. 2223–2234.
81
[34] Multiband Atheros driver for WiFi. [Online] [Last checked: April 27, 2010.] http://madwifi. org/.
[35] C. Dovrolis, P. Ramanathan, and D. Moore., "What do packet dispersion techniques measure." Anchorage, AK, USA: IEEE InfoCom, Apr. 2001. pp. 905–914.
[36] Downey, A. B., "Using pathchar to estimate Internet link characteristics." Cambridge, MA, USA: ACM SigComm, Sep. 1999. pp. 241–250.
[37] Hedrick, C., Routing information protocol. Internet Request for Comments 1058. [Online] 1988. [Last checked: April 27, 2010.] http://www.ietf.org/rfc/rfc1058.txt.
[38] Moy, J., OSPF version 2. Internet Request for Comments 2328. [Online] 1998. [Last checked: April 27, 2010.] http://www.rfc-editor.org/rfc/rfc2328.txt.
[39] Maltz, D. B. Johnson and D. A., Dynamic source routing in ad hoc wireless networks. Norwell, MA, USA: Kluwer, 1996. 0071477330.
[40] C. Perkins, E. Belding-Royer, and S. Das., Ad-hoc on-demand distance vecto. Internet Request for Comments 3561. [Online] 2003. [Last checked: April 27, 2010.] http://www.ietf.org/rfc/rfc3561.txt.
[41] T. Goff, N. B. Abu-Ghazaleh, D. S. Phatak, and R. Kahvecioglu., "Preemptive routing in ad hoc networks." Long Beach, CA, USA: ACM MobiCom, Jul. 2001. pp. 43–52.
[42] C. Ho, K. Ramachandran, K. Almeroth, and E. Belding-Royer., "A scalable framework for wireless network monitoring." Philadelphia, PA, USA: ACM WMASH, Oct. 2004.
[43] M.Ye, W.Wu and X.Xu., "MR Mesh: A Multi-Radio Wireless Mesh Network Testbed." Dalian, China: Wicom08, Oct 2008.
[44] J. Robinson, K. Papagiannaki, C. Diot, X. Guo, L. Krishnamurthy., "Experimenting with a Multi-Radio Mesh Networking Testbed." Trentino, Italy: WinMee’05, Apr. 2005.
[45] A. Adya, P. Bahl, J. Padhye, A.Wolman, and L. Zhou., "A multi-radio uni-fication protocol for IEEE 802.11 wireless networks." San Jose, CA, USA: Broadnets, Oct 2004.
[46] H. Lundgren, E. Nordstrom, and C. Tschudin., "Coping with communication gray zones in IEEE 802.11b based ad hoc networks." Atlanta, Georgia, USA: ACM WoWMoM Workshop, September 2002.
[47] M. Yarvis, W. Conner, L. Krishnamurthy, J. Chhabra, B. Elliott, and A. Mainwaring., "Real-world experiences with an interactive ad hoc sensor network." Boston, MA, USA: the International Workshop on Ad Hoc Networking, August 2002.
[48] D. De Couto, D. Aguayo, J. Bicket, and R. Morris., "A high-throughput path metric for multi-hop wireless routing." San Diego, CA, USA: ACM MobiCom , Sep. 2003.
[49] Hay, Roger., An Introduction to Mesh Networking. [Online] April 2006. [Last checked: April 27, 2010.] http://home.cogeco.ca/~rmhay/WirelessMeshIntro_20060312.pdf.
[50] Yuan Sun, Irfan Sherif, Elizbeth M. Belding-Royer and Kevin C. Almeroth., "An Experimental Study of Multimedia Traffic Performance in Mesh Networks." Seattle, WA, USA: MobiSys, Jun. 2005.
[51] Davis, Mark., "A Wireless Traffic Probe for Radio Resource Management and QoS Provisioning in IEEE 802.11 WLANs." Venice, Italy: MSWiM’04, Jun. 2004.
82
[52] Ramin Khalili, Kave Salamatian., Evaluation of packet error rate in wireless networks. [Online] 2004. [Last checked: April 27, 2010.] http://www-rp.lip6.fr/~khalili/pub/mswim2004.pdf.
[53] Brian Keegan, Karol Kowalik and Mark Davis., "Experimental Measurement of Overhead Associated with Active Probing of Wireless Mesh Networks." Dubai: ICSPC07, Nov. 2007.
[54] J.Benesty, J.Chen, Y.Huang, I.Cohen., "Pearson Correlation Coefficient." Noise Reduction in Speech Processing. Springer Berlin Heidelberg, ISBN: 978-3-540-49125-5.
[55] Pcap Library. [Online] [Last checked: April 27, 2010.] http://www.tcpdump.org.
[56] Davis, Mark., WLan Resource Monitor. [Online] [Last checked: April 27, 2010.] http://www.cnri.dit.ie/research.wrm.html.
[57] Soekris net 4521. [Online] [Last checked: April 27, 2010.] http://www.soekris.com/net4521.htm.
[58] CNRI Mesh Testbed. [Online] [Last checked: April 27, 2010.] http://www.cnri.dit.ie/research.mesh.testbed.html.
[59] Wetteroth, Debbra., OSI Reference Model for Telecommunications. s.l. : McGraw-Hill Professional, 2001. ISBN: 0071380418.
[60] Goransson, Paul and Greenlaw, Raymond., Secure Roaming in 802.11 Networks. Newnes, 2007. ISBN-10: 0-7506-8211-6.
[61] Mark Davis, Tristan Raimondi., "A Novel Framework for Radio Resource Management in IEEE 802.11 Wireless LANs." Italy: WiOpt’05, Apr. 2005.
[62] WireShark. [Online] [Last checked: April 27, 2010.] http://www.wildpackets.com/products/network_analysis/omnipeek_network_analyzer
83
List of Publications
1. “An Investigation of the Correlation between Passive Monitoring and Active Probing Techniques Used in WLAN Mesh Networks,” in Information Technology and Telecommunications Conference 2008 (ITT 2008), Galway Mayo Institute of Technology, October 2008.
2. “An Experimental Study of the Impact of Using Multi-Radio in WLAN Mesh
Networks Wireless,” in 5th International Conference on Communications, Networking and Mobile Computing. (WiCom '09). 24-26 Sept. 2009 Beijing, China.