Embed Size (px)
Citation preview
FEASIBILITY STUDY
FOR THE DIRECT USE OF GEOTHERMAL ENERGY FOR ONION DEHYDRATION IN VALE/ONTARIO AREA, OREGON
FINAL REPORT
Funded by a Grant from the
Oregon Department of Energy Interagency Agreement
No. I07039-Amendment No. 1 and U.S. Department of Energy
Office of Geothermal Technologies
GEO-HEAT CENTER OREGON INSTITUTE OF TECHNOLOGY
KLAMATH FALLS, OR 97601
1 MAY 2006
FEASIBILITY STUDY FOR THE DIRECT USE OF GEOTHERMAL ENERGY
FOR ONION DEHYDRATION IN VALE/ONTARIO AREA, OREGON
FINAL REPORT
Funded by a Grant from the
Oregon Department of Energy Interagency Agreement
No. I07039 – Amendment No. 1 and U.S. Department of Energy
Office of Geothermal Technologies
Prepared by
Andrew Chiasson John W. Lund Tonya L. Boyd
Al Waibel
Geo-Heat Center Oregon Institute of Technology
Klamath Falls, OR 97601
1 May 2006
TABLE OF CONTENTS Purpose 1 Background 1 Objectives 1 Schedule 2 The Feasibility Study Based on the Program Objectives 2 1. Source of Raw Onion 2 2. Market for the Finished Product 3 3. Size of the Plant 3 4. Energy Requirements 4 5. Geothermal Resources Availability 5 6. Development Risk 6 7. Energy and Economic Analysis 7 Energy Consumption 8 Cost Analysis 10 Tax Analysis 12 Cumulative Annual Cash Flows 14 Annual Financial Summary 15 Sensitivity Analysis 15 Summary and Conclusions 18 Recommendations 20 References 20 Appendix 21
LIST OF FIGURES Figure 1. Typical single-line dryer sketch. 3 Figure 2. Energy and temperature requirements for a typical single-line dryer. 4 Figure 3. General resource location map. 7 Figure 4. Energy Consumption worksheet for the onion dehydration model. 9 Figure 5. Geothermal heating load fraction as a function of geothermal 10
resource temperature and flow rate for the use in the Energy Consumption worksheet.
Figure 6. Cost Analysis worksheet for the onion dehydration model. 11 Figure 7. Tax Analysis worksheet for the onion dehydration model. 13 Figure 8. Cumulative annual cash flows. 14 Figure 9. Annual cash flow summaries for an onion dehydration plant using 16
(a) conventional 100% natural gas, and (b) 80% geothermal, 20% natural gas. Note costs (profits) are shown as negative (positive).
Figure 10. Sensitivity analysis of various cost items of an onion dehydration 17
plant. Figure 11. Sensitivity of percent heat supplied by geothermal to annual worth 18
relative to a conventional 100% natural gas onion dehydration plant.
LIST OF TABLES Table 1. Dryer stages temperature and energy requirements. 5
FEASIBILITY STUDY FOR
THE DIRECT USE OF GEOTHERMAL ENERGY FOR
ONION DEHYDRATION IN VALE/ONTARIO AREA, OREGON
GEO-HEAT CENTER OREGON INSTITUTE OF TECHNOLOGY
KLAMATH FALLS, OR 97601
FINAL REPORT 1 MAY 2006
PURPOSE The purpose of this study is to determine the feasibility of utilizing geothermal energy for a proposed onion dehydration plant in eastern Oregon, near the Vale/Ontario area. This study was funded by a grant from the Oregon Department of Energy under Interagency Agreement No. I07039, which in turn was funded by a grant from the Office of Geothermal Technologies, U.S. Department of Energy. BACKGROUND Onion dehydration with geothermal energy has been undertaken in two places in Nevada: Brady’s Hot Spring and Empire. The first has been successful and continues to operate, and the other, also dehydrating garlic, has closed due to competition with imported garlic from China. Potato processing plants are already in operation in the Vale/Ontario area, which is an agricultural area. An onion dehydration plant is operating at Boardman using natural gas, and one is shut down at Umatilla. The area has several promising geothermal resources, some over 200° F – which are suitable for onion dehydration. The combination of product supply and geothermal resources make this project worthy of investigation. If proven successful, it would stimulate the economic activity in the area. Onions are grown on approximately 24,000 acres in Malheur County, Oregon including acreage in western Idaho. These onions are grown and exported for the fresh market, thus a different type of onion would have to be grown for dehydration. OBJECTIVES
• Determine the source of raw onions that can be utilized in the project • Determine the market for the finished (dehydrated) products • Determine the economic feasibility and size of a dehydration facility • Determine the energy requirements for the facility • Determine the availability of geothermal resources to meet the energy needs • Determine the cost estimate for the project • Write a final report with findings, costs and recommendations
Onion Dehydration with Geothermal Energy Final Report Geo-Heat Center, May 2006
The assumption in this report is that the facility would be owned and operated by the local onion grower’s association. SCHEDULE An initial conference call was held with interested persons representing the onion growers in the eastern Oregon-western Idaho area, agricultural extension agents, economic development members and persons from the Oregon Department of Energy. They all met at the OSU Extension Office in Ontario on November 29, 2005. The Geo-Heat Center staff was unable to attend due to a snow storm in the Klamath Falls area. A PowerPoint presentation by conference call was made by the Geo-Heat Center staff on the onion dehydration process using geothermal energy. A brief resource evaluation of the Vale/Ontario area was also presented. Recommendations for further investigations were presented by the interested parties. A second meeting was held in Ontario on January 4, 2006. The Geo-Heat Center staff presented the results of their preliminary study in PowerPoint format. This presentation included preliminary estimates of the various costs and income associated with a plant that could process 10,000 lbs/hr of wet and produce 2,000 lbs/hr of dehydrated onions resulting in 12 million pounds of dried product/yr. The preliminary economic analysis was presented on six worksheets: energy consumption data; cost input/analysis; annual cost graph; annual cash flows; break even analysis; and sensitivity analysis. Some of these data were based on information provided by persons involved with the Empire, NV plant and the Boardman, OR plant. Detailed maps and well/spring data were also presented indicating where the geothermal resources were located and where the most likely sites might be found. Recommendations for further investigations were presented by interested parties. The Geo-Heat Center contracted with Al Waibel, a consulting geologist, for an in-depth analysis of the geothermal resources in the area, along with recommendations for potential sites. His report is attached (Appendix A) and is summarized below. A final draft report was discussed by conference call on March 15, 2006 with interested parties. Recommendations from that conference call are incorporated into this final report. THE FEASIBILITY STUDY BASED ON THE PROGRAM OBJECTIVES 1. Source of raw onion At present, 24,000 acres of fresh onions are under cultivation in the Vale/Ontario/western Idaho area. To provide 10,000 lbs/hr for 24 hr/day for an estimated season of 250 days, a total of 30,000 tons would be required. At 20 tons/acre this would require 1,500 acres of production. Thus, there is more than adequate area for production to support a single-line dryer operation. If this single-line is successful, there is certainly adequate potential for a second line. Of course, a different type of onion, such as Creole, Southport Globe and Hybrid Southport would have to be grown to obtain the best product from dehydration.
2
Onion Dehydration with Geothermal Energy Final Report Geo-Heat Center, May 2006
2. Market for the finished product This item was not explored in detail, but there are several national and international companies who would be interested in purchasing the final product, such as Durkee, Harmony House Foods, Gilroy Food Company (Conagra Foods), etc. Purchase contracts with these companies would have to be negotiated before starting operation. 3. Size of the plant Our initial proposal is to use a single line continuous belt dryer consisting of four stages, A to D. The dryer would be of the type manufactured by Proctor and Schwartz or National. These dryers are 190 to 212 feet long and 12.5 feet wide. Hot air, heated by the geothermal energy, is circulated through perforated plates holding onions at depths of several inches to several feet, depending upon the stage. Depending upon the humidity of the outside air, a Bryair desiccator may be necessary at the final stage. Approximately 24 hours are required from input to output, the belt moving at about eight feet per hour. They can process five to seven tons (10,000 to 14,000 lbs) of wet onions per hour producing from 1,500 to 2,500 lbs of dry onions per hour. The onions are dried from around 85% to 4% moisture by weight; however, based on input from the onion growers in the area, an initial moisture content of 77% was used in this analysis. The final product could be in the form of powdered, granulated, ground, minced, chopped or sliced, depending on the market. A sketch of a typical dryer is shown in Figure 1.
Exhausts
InletA-1
A-2
A-3
B-1
A-4
209 ft 8 in
B-2
DIntakes
C
Outlet
Figure 1. Typical single-line dryer sketch.
3
Onion Dehydration with Geothermal Energy Final Report Geo-Heat Center, May 2006
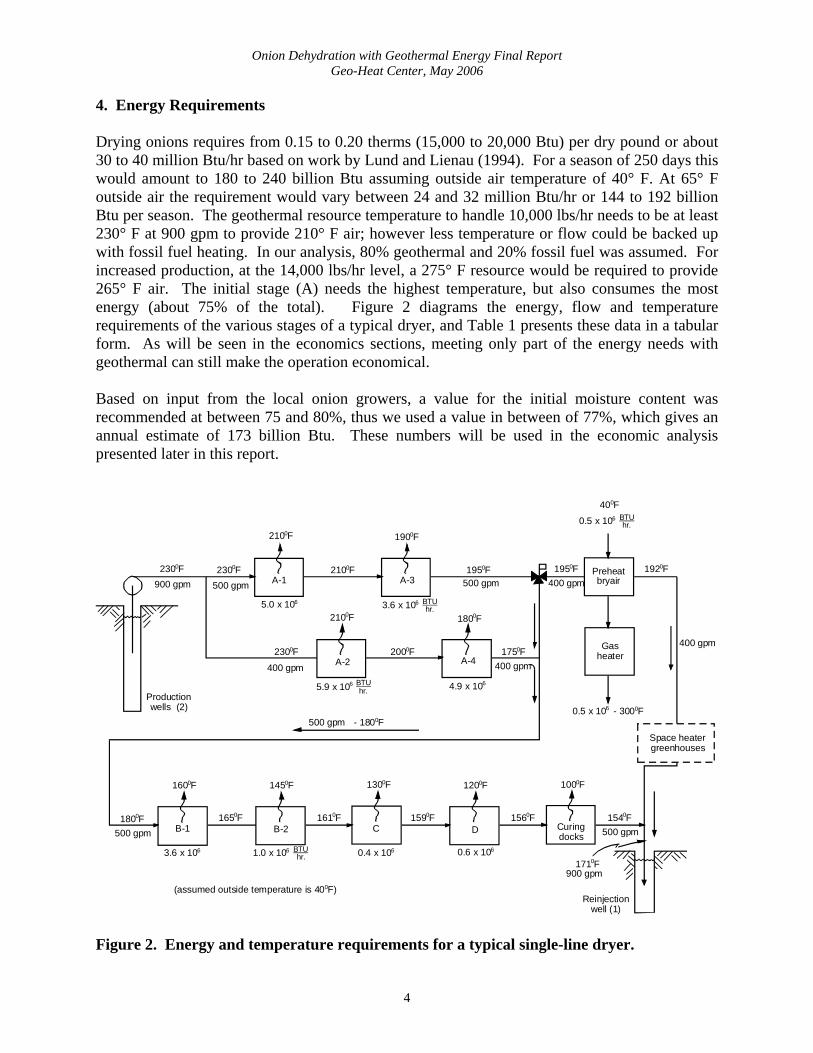
4. Energy Requirements Drying onions requires from 0.15 to 0.20 therms (15,000 to 20,000 Btu) per dry pound or about 30 to 40 million Btu/hr based on work by Lund and Lienau (1994). For a season of 250 days this would amount to 180 to 240 billion Btu assuming outside air temperature of 40° F. At 65° F outside air the requirement would vary between 24 and 32 million Btu/hr or 144 to 192 billion Btu per season. The geothermal resource temperature to handle 10,000 lbs/hr needs to be at least 230° F at 900 gpm to provide 210° F air; however less temperature or flow could be backed up with fossil fuel heating. In our analysis, 80% geothermal and 20% fossil fuel was assumed. For increased production, at the 14,000 lbs/hr level, a 275° F resource would be required to provide 265° F air. The initial stage (A) needs the highest temperature, but also consumes the most energy (about 75% of the total). Figure 2 diagrams the energy, flow and temperature requirements of the various stages of a typical dryer, and Table 1 presents these data in a tabular form. As will be seen in the economics sections, meeting only part of the energy needs with geothermal can still make the operation economical. Based on input from the local onion growers, a value for the initial moisture content was recommended at between 75 and 80%, thus we used a value in between of 77%, which gives an annual estimate of 173 billion Btu. These numbers will be used in the economic analysis presented later in this report.
A-1
5.0 x 10⁶
1600F
500 gpm
2100F
2100F2300F900 gpm
400 gpm
2300F
A-2
Preheatbryair
A-4
2100F
2000F
- 3000F
3.6 x 10⁶ BTUhr.
5.9 x 10⁶ BTUhr. 4.9 x 10⁶
Productionwells (2)
400F
1800F
1750F
500 gpm
400 gpm
1950F 1920F
400 gpm
A-3
Gasheater
1950F
0.5 x 10⁶ BTUhr.
400 gpm
Space heatergreenhouses
0.5 x 10⁶
1900F
500 gpm - 1800F
500 gpm
2300F
B-1 B-2 C D Curingdocks
1800F 1650F
1450F
1610F
1300F
1590F
1200F
1.0 x 10⁶ BTUhr.3.6 x 106 0.4 x 10⁶ 0.6 x 10⁶
1560F
1000F
1540F
1710F900 gpm
500 gpm
Reinjectionwell (1)
(assumed outside temperature is 400F)
Figure 2. Energy and temperature requirements for a typical single-line dryer.
4
Onion Dehydration with Geothermal Energy Final Report Geo-Heat Center, May 2006
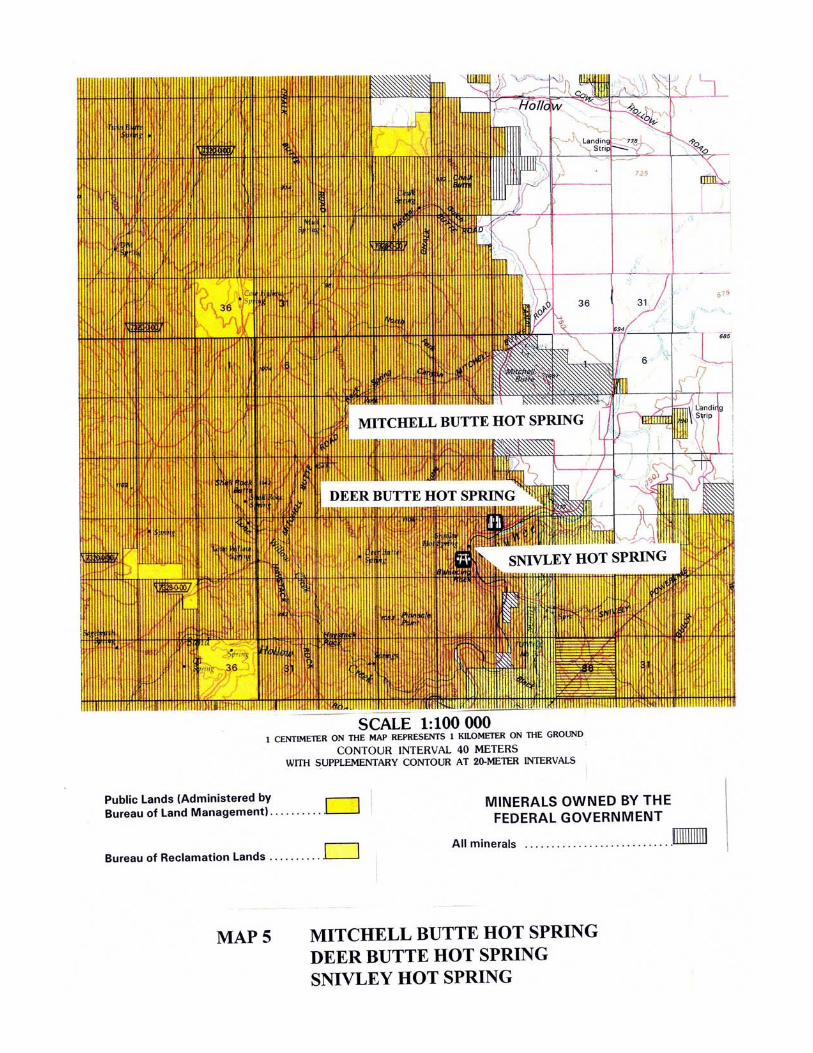
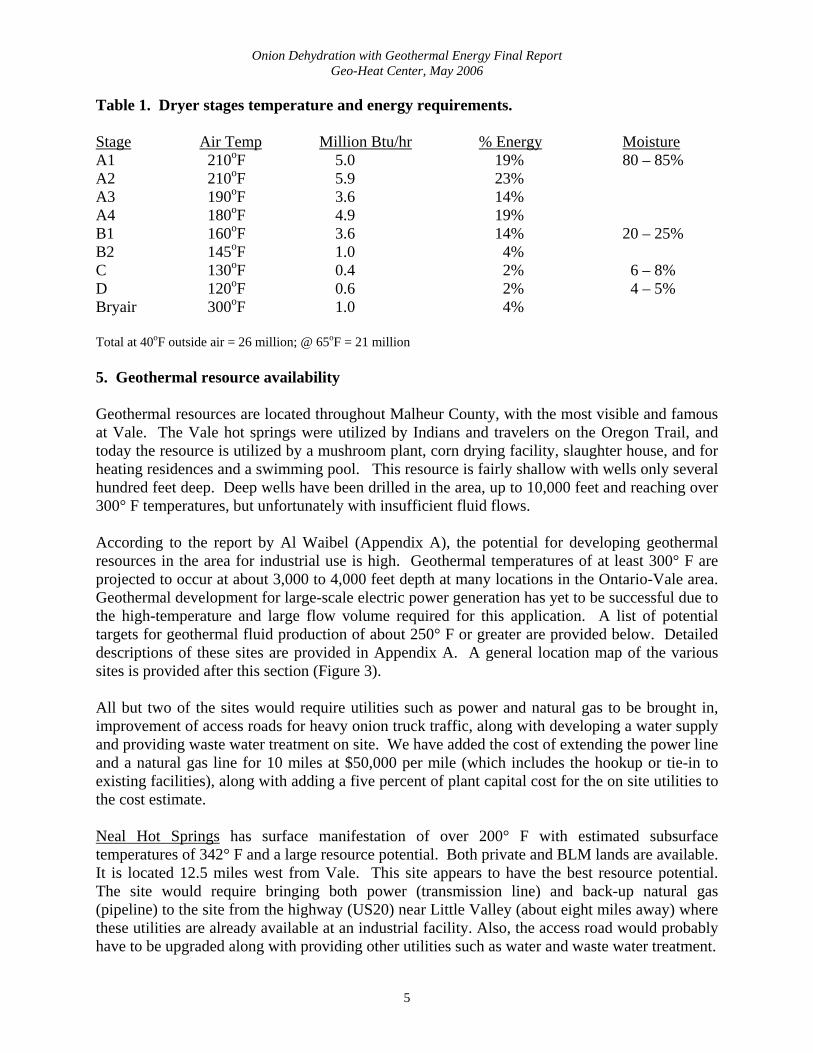
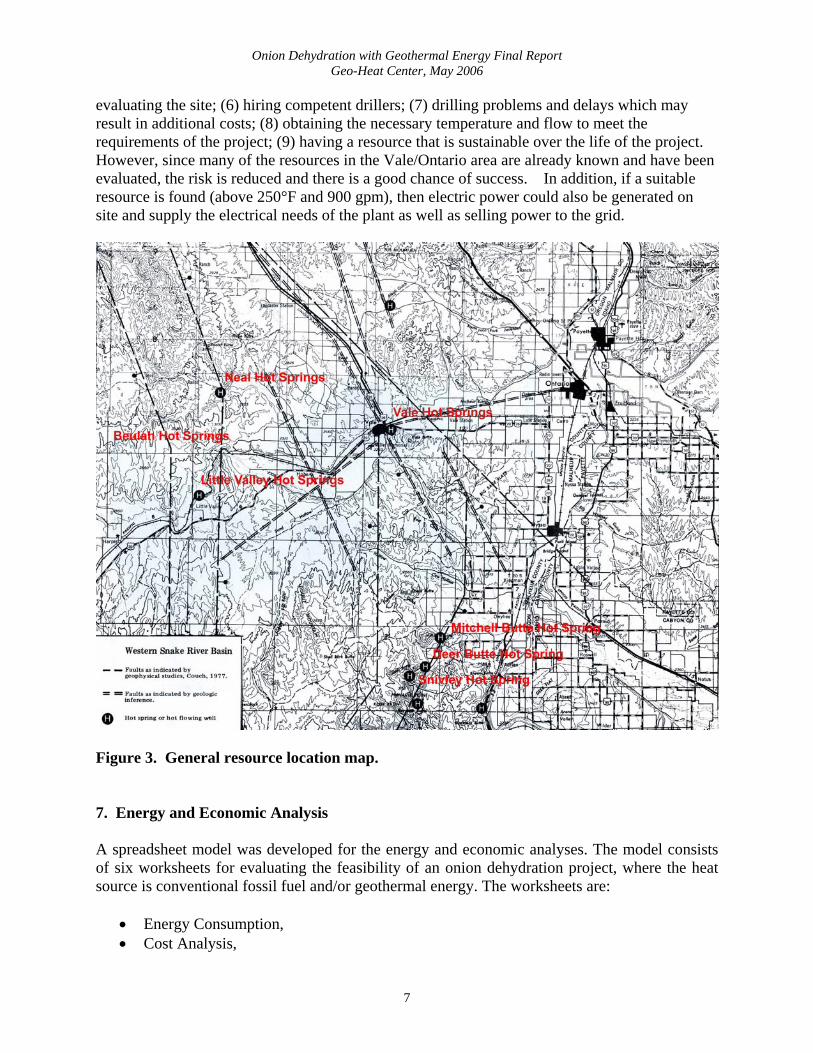
Table 1. Dryer stages temperature and energy requirements. Stage Air Temp Million Btu/hr % Energy Moisture A1 210oF 5.0 19% 80 – 85% A2 210oF 5.9 23% A3 190oF 3.6 14% A4 180oF 4.9 19% B1 160oF 3.6 14% 20 – 25% B2 145oF 1.0 4% C 130oF 0.4 2% 6 – 8% D 120oF 0.6 2% 4 – 5% Bryair 300oF 1.0 4% Total at 40oF outside air = 26 million; @ 65oF = 21 million 5. Geothermal resource availability Geothermal resources are located throughout Malheur County, with the most visible and famous at Vale. The Vale hot springs were utilized by Indians and travelers on the Oregon Trail, and today the resource is utilized by a mushroom plant, corn drying facility, slaughter house, and for heating residences and a swimming pool. This resource is fairly shallow with wells only several hundred feet deep. Deep wells have been drilled in the area, up to 10,000 feet and reaching over 300° F temperatures, but unfortunately with insufficient fluid flows. According to the report by Al Waibel (Appendix A), the potential for developing geothermal resources in the area for industrial use is high. Geothermal temperatures of at least 300° F are projected to occur at about 3,000 to 4,000 feet depth at many locations in the Ontario-Vale area. Geothermal development for large-scale electric power generation has yet to be successful due to the high-temperature and large flow volume required for this application. A list of potential targets for geothermal fluid production of about 250° F or greater are provided below. Detailed descriptions of these sites are provided in Appendix A. A general location map of the various sites is provided after this section (Figure 3). All but two of the sites would require utilities such as power and natural gas to be brought in, improvement of access roads for heavy onion truck traffic, along with developing a water supply and providing waste water treatment on site. We have added the cost of extending the power line and a natural gas line for 10 miles at $50,000 per mile (which includes the hookup or tie-in to existing facilities), along with adding a five percent of plant capital cost for the on site utilities to the cost estimate. Neal Hot Springs has surface manifestation of over 200° F with estimated subsurface temperatures of 342° F and a large resource potential. Both private and BLM lands are available. It is located 12.5 miles west from Vale. This site appears to have the best resource potential. The site would require bringing both power (transmission line) and back-up natural gas (pipeline) to the site from the highway (US20) near Little Valley (about eight miles away) where these utilities are already available at an industrial facility. Also, the access road would probably have to be upgraded along with providing other utilities such as water and waste water treatment.
5
Onion Dehydration with Geothermal Energy Final Report Geo-Heat Center, May 2006
Little Valley Hot Springs is located along the Malheur River 18 miles SW of Vale with a spring temperature of 158° F that flow in excess of 145 gpm. An adjacent well is reported at 156° F. Subsurface temperature is estimated at 293° F. Private land is available. The economics at this site are favored by already having power and natural gas available, as well as easy access to highway US20. Beulah Hot Springs is located 20 miles north of Juntura on the NE edge of Beulah Reservoir. Little is known about this resource, but subsurface temperature is estimated at 336° F. The main disadvantages are its remote location and potentially very small resource, and would require providing utilities such as power, gas, road improvement, water and waste water treatment. Vale Hot Springs are located on the eastern edge of the town adjacent to the Malheur River. The maximum reported surface temperature is 194° F with wells producing up to 230° F. Deeper temperatures are estimated from 250 to 306° F. There are numerous hot wells utilizing this shallow resource. It has excellent location and potential; however, existing use would take precedence. Deeper wells (3,000 to 4,000 feet deep) might penetrate a different aquifer; however, the potential for interference does exist, limiting development and use. Mitchell Butte Hot Spring is located on the west side of the Owyhee River 10 miles SW of Nyssa. The spring temperature is reported at 143° F at a flow of 16 gpm. The deeper resource is estimated at 273° F. It is surrounded by private land, but its remote location and moderate temperature limits its potential. This site would require bringing utilities in from the Vale area as well as developing utilities on site. Deer Butte Hot Spring is located on the north shore of Owyhee River about 20 miles south of Vale. The spring is reported at 174° F with the deeper resource estimated at 282° F. It is located on Bureau of Reclamation land and the remote location limits its potential, again because utilities would have to be brought to and developed on site. Snivley Hot Spring is on the west bank of the Owyhee River about 22 miles south of Vale. The spring temperature is reported at 134° F with a deeper temperature estimated at 244° F. Its remote location requiring utilities and being on BLM land limits its potential. The Willow Creek Thermal Area extends S-SE from Vale for about 10 miles and includes the Vale KGRA (22 square miles). There are very few surface indicators of the resource, but based on shallow drill holes and three deep geothermal exploration wells deeper temperature of 277 to 280° F are reported, but with very limited fluid flow. This area is on BLM land, and with the poor results from the deep drilling, and its remote location also requiring utility services, the potential is probably limited. 6. Development Risk With the development of any geothermal resource there are risks. These include: (1) access and ownership of the land; (2) ownership of the resource; (3) obtaining the necessary permits; (4) completing an environmental assessment, if necessary; (5) hiring competent geologists for
6
Onion Dehydration with Geothermal Energy Final Report Geo-Heat Center, May 2006
evaluating the site; (6) hiring competent drillers; (7) drilling problems and delays which may result in additional costs; (8) obtaining the necessary temperature and flow to meet the requirements of the project; (9) having a resource that is sustainable over the life of the project. However, since many of the resources in the Vale/Ontario area are already known and have been evaluated, the risk is reduced and there is a good chance of success. In addition, if a suitable resource is found (above 250°F and 900 gpm), then electric power could also be generated on site and supply the electrical needs of the plant as well as selling power to the grid.
Figure 3. General resource location map. 7. Energy and Economic Analysis A spreadsheet model was developed for the energy and economic analyses. The model consists of six worksheets for evaluating the feasibility of an onion dehydration project, where the heat source is conventional fossil fuel and/or geothermal energy. The worksheets are:
• Energy Consumption, • Cost Analysis,
7
Onion Dehydration with Geothermal Energy Final Report Geo-Heat Center, May 2006
• Tax Analysis, • Cumulative Annual Cash Flows, • Annual Financial Summary, and • Sensitivity Analysis
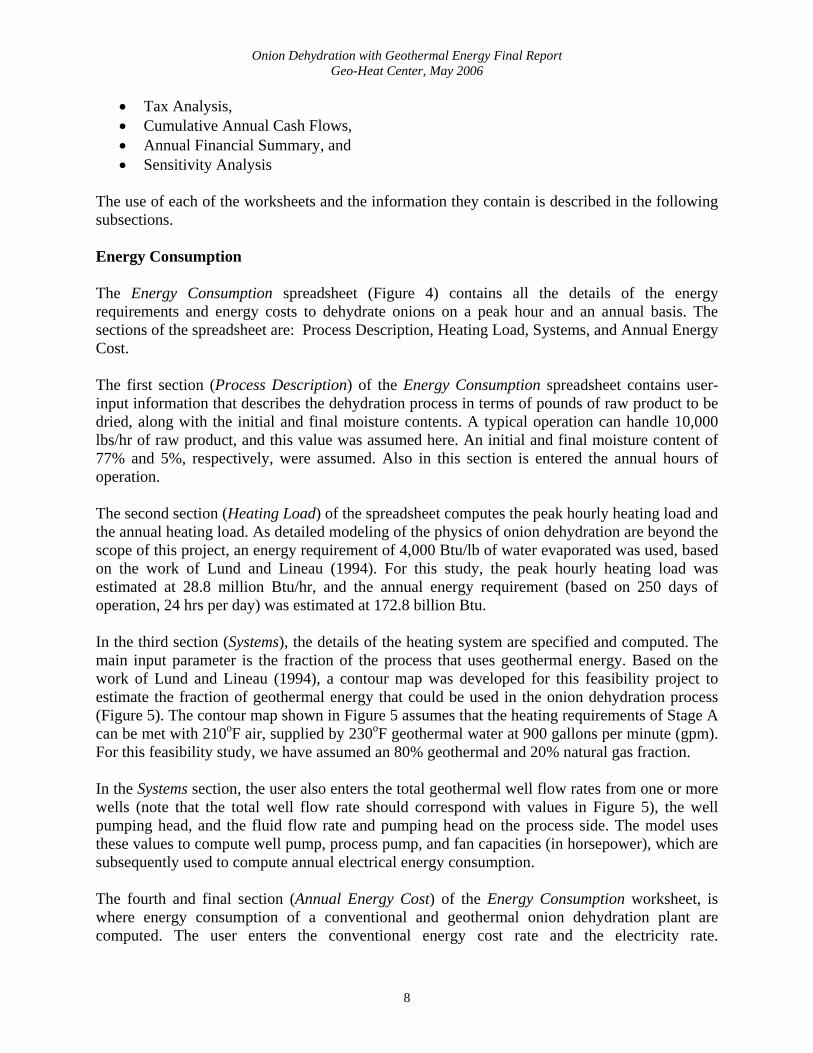
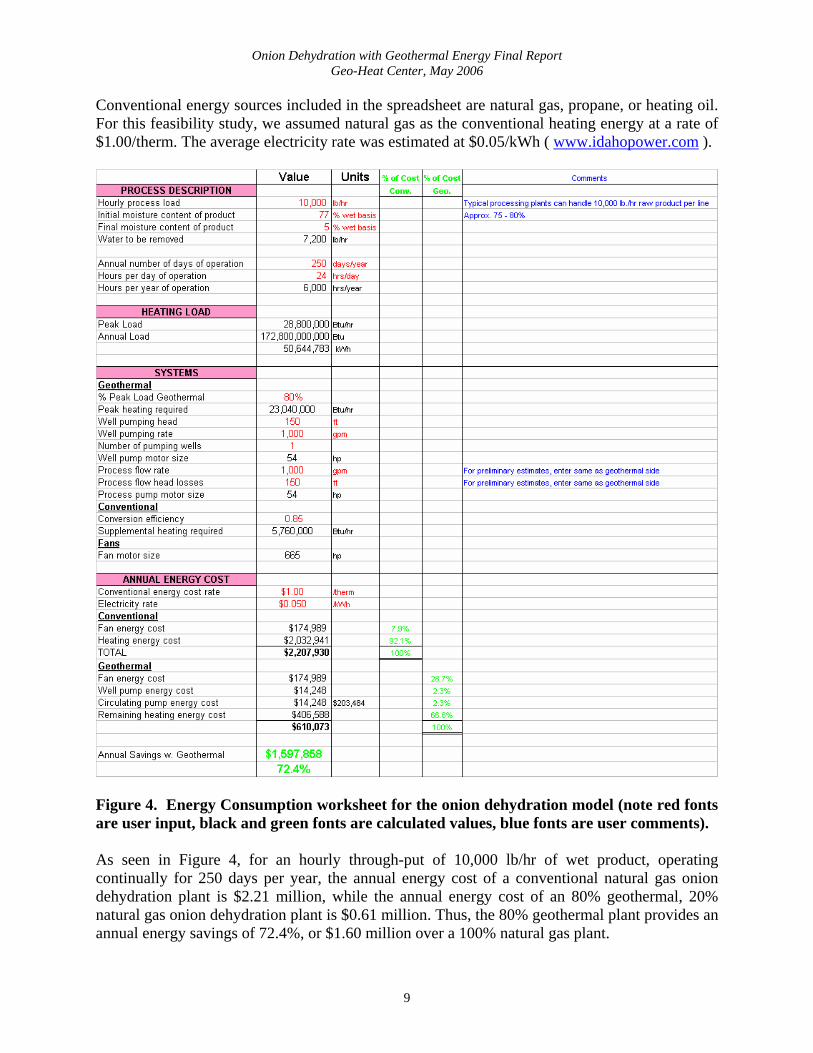
The use of each of the worksheets and the information they contain is described in the following subsections. Energy Consumption The Energy Consumption spreadsheet (Figure 4) contains all the details of the energy requirements and energy costs to dehydrate onions on a peak hour and an annual basis. The sections of the spreadsheet are: Process Description, Heating Load, Systems, and Annual Energy Cost. The first section (Process Description) of the Energy Consumption spreadsheet contains user-input information that describes the dehydration process in terms of pounds of raw product to be dried, along with the initial and final moisture contents. A typical operation can handle 10,000 lbs/hr of raw product, and this value was assumed here. An initial and final moisture content of 77% and 5%, respectively, were assumed. Also in this section is entered the annual hours of operation. The second section (Heating Load) of the spreadsheet computes the peak hourly heating load and the annual heating load. As detailed modeling of the physics of onion dehydration are beyond the scope of this project, an energy requirement of 4,000 Btu/lb of water evaporated was used, based on the work of Lund and Lineau (1994). For this study, the peak hourly heating load was estimated at 28.8 million Btu/hr, and the annual energy requirement (based on 250 days of operation, 24 hrs per day) was estimated at 172.8 billion Btu. In the third section (Systems), the details of the heating system are specified and computed. The main input parameter is the fraction of the process that uses geothermal energy. Based on the work of Lund and Lineau (1994), a contour map was developed for this feasibility project to estimate the fraction of geothermal energy that could be used in the onion dehydration process (Figure 5). The contour map shown in Figure 5 assumes that the heating requirements of Stage A can be met with 210oF air, supplied by 230oF geothermal water at 900 gallons per minute (gpm). For this feasibility study, we have assumed an 80% geothermal and 20% natural gas fraction. In the Systems section, the user also enters the total geothermal well flow rates from one or more wells (note that the total well flow rate should correspond with values in Figure 5), the well pumping head, and the fluid flow rate and pumping head on the process side. The model uses these values to compute well pump, process pump, and fan capacities (in horsepower), which are subsequently used to compute annual electrical energy consumption. The fourth and final section (Annual Energy Cost) of the Energy Consumption worksheet, is where energy consumption of a conventional and geothermal onion dehydration plant are computed. The user enters the conventional energy cost rate and the electricity rate.
8
Onion Dehydration with Geothermal Energy Final Report Geo-Heat Center, May 2006
Conventional energy sources included in the spreadsheet are natural gas, propane, or heating oil. For this feasibility study, we assumed natural gas as the conventional heating energy at a rate of $1.00/therm. The average electricity rate was estimated at $0.05/kWh ( www.idahopower.com ).
Figure 4. Energy Consumption worksheet for the onion dehydration model (note red fonts are user input, black and green fonts are calculated values, blue fonts are user comments). As seen in Figure 4, for an hourly through-put of 10,000 lb/hr of wet product, operating continually for 250 days per year, the annual energy cost of a conventional natural gas onion dehydration plant is $2.21 million, while the annual energy cost of an 80% geothermal, 20% natural gas onion dehydration plant is $0.61 million. Thus, the 80% geothermal plant provides an annual energy savings of 72.4%, or $1.60 million over a 100% natural gas plant.
9
Onion Dehydration with Geothermal Energy Final Report Geo-Heat Center, May 2006
160 170 180 190 200 210 220 230
Geothermal Resource Temperature (F)
100
200
300
400
500
600
700
800
900
1000
Geo
ther
mal
Wel
l Yie
ld (g
pm)
PERCENT OF HEATING LOAD HANDLED BY GEOTHERMALAS A FUNCTION OF FLOW RATE AND TEMPERATURE OF WATER
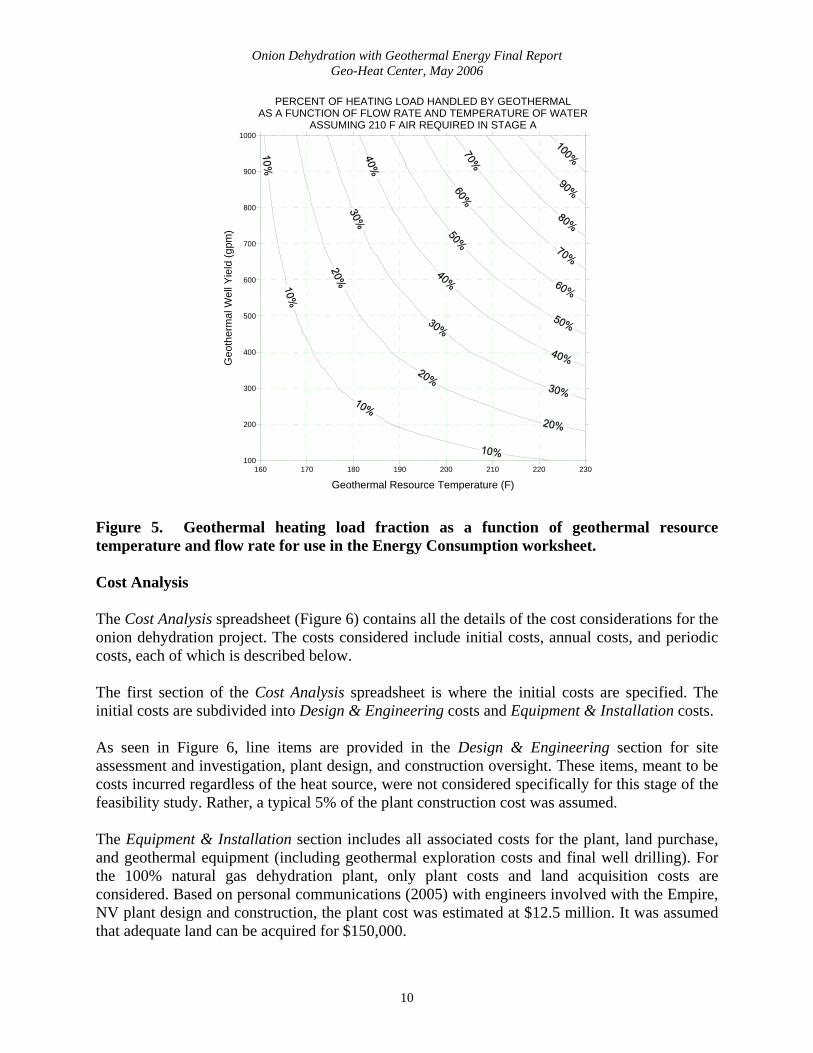
ASSUMING 210 F AIR REQUIRED IN STAGE A Figure 5. Geothermal heating load fraction as a function of geothermal resource temperature and flow rate for use in the Energy Consumption worksheet. Cost Analysis The Cost Analysis spreadsheet (Figure 6) contains all the details of the cost considerations for the onion dehydration project. The costs considered include initial costs, annual costs, and periodic costs, each of which is described below. The first section of the Cost Analysis spreadsheet is where the initial costs are specified. The initial costs are subdivided into Design & Engineering costs and Equipment & Installation costs. As seen in Figure 6, line items are provided in the Design & Engineering section for site assessment and investigation, plant design, and construction oversight. These items, meant to be costs incurred regardless of the heat source, were not considered specifically for this stage of the feasibility study. Rather, a typical 5% of the plant construction cost was assumed. The Equipment & Installation section includes all associated costs for the plant, land purchase, and geothermal equipment (including geothermal exploration costs and final well drilling). For the 100% natural gas dehydration plant, only plant costs and land acquisition costs are considered. Based on personal communications (2005) with engineers involved with the Empire, NV plant design and construction, the plant cost was estimated at $12.5 million. It was assumed that adequate land can be acquired for $150,000.
10
Onion Dehydration with Geothermal Energy Final Report Geo-Heat Center, May 2006
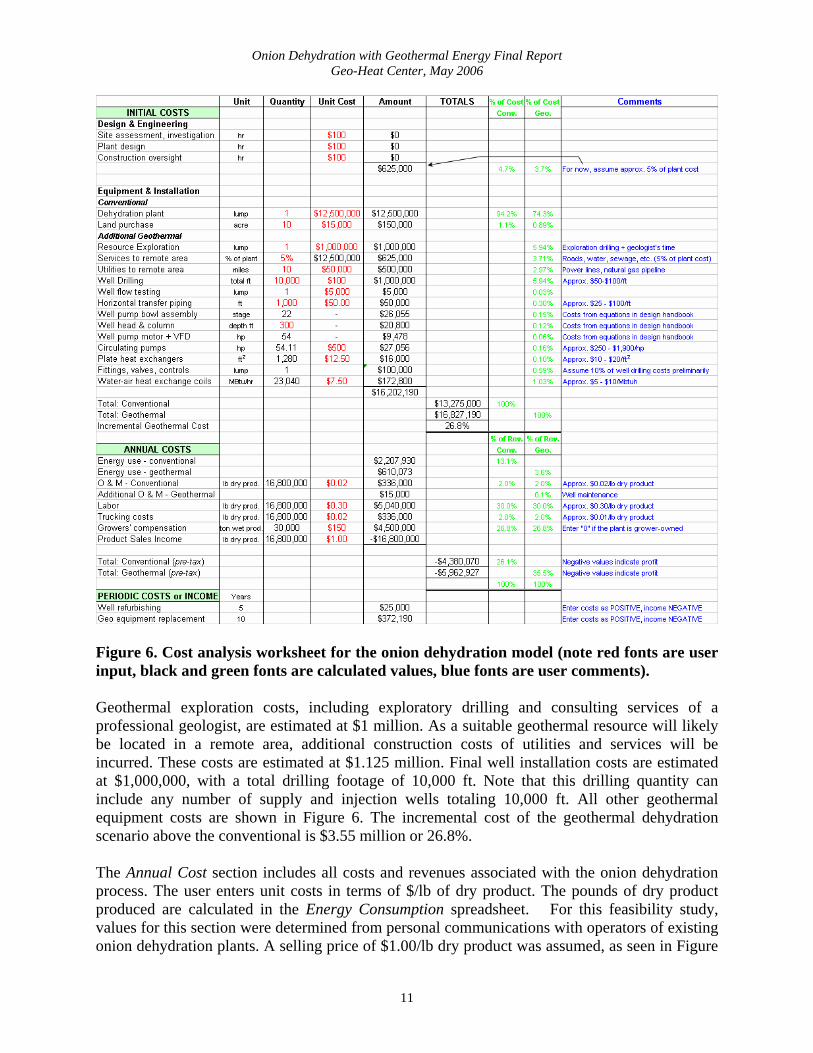
Figure 6. Cost analysis worksheet for the onion dehydration model (note red fonts are user input, black and green fonts are calculated values, blue fonts are user comments). Geothermal exploration costs, including exploratory drilling and consulting services of a professional geologist, are estimated at $1 million. As a suitable geothermal resource will likely be located in a remote area, additional construction costs of utilities and services will be incurred. These costs are estimated at $1.125 million. Final well installation costs are estimated at $1,000,000, with a total drilling footage of 10,000 ft. Note that this drilling quantity can include any number of supply and injection wells totaling 10,000 ft. All other geothermal equipment costs are shown in Figure 6. The incremental cost of the geothermal dehydration scenario above the conventional is $3.55 million or 26.8%. The Annual Cost section includes all costs and revenues associated with the onion dehydration process. The user enters unit costs in terms of $/lb of dry product. The pounds of dry product produced are calculated in the Energy Consumption spreadsheet. For this feasibility study, values for this section were determined from personal communications with operators of existing onion dehydration plants. A selling price of $1.00/lb dry product was assumed, as seen in Figure
11
Onion Dehydration with Geothermal Energy Final Report Geo-Heat Center, May 2006
6. Also shown in Figure 6 is that the most significant annual cost is labor, at 30% of the gross income, followed by growers’ compensation at 26.8%. For the conventional natural gas onion dehydration plant, energy costs account for 13.1% of gross income, while only 3.6% of the gross income is attributed to energy use in the 80% geothermal, 20% natural gas onion dehydration plant scenario. For the geothermal case, an additional well maintenance cost was assumed at $15,000, or 0.1% of the annual costs. As shown in Figure 6, for this feasibility study, it was assumed that the growers could be paid $150/wet ton of onions. This leaves approximately $4.38 million profit (before taxes) for the conventional plant scenario and $5.96 million profit (before taxes) for the geothermal scenario. Growers’ compensation will be further examined in the sensitivity analysis described later. Tax Analysis The Tax Analysis worksheet (Figure 7) contains the consideration of annual income taxes, depreciation, and tax credits and/or incentives. Since actual income tax payments would be difficult to calculate, some simplifying assumptions were made. The first section of the Tax Analysis spreadsheet addresses Annual Depreciation. At this stage of the feasibility study, it was assumed that 75% of the plant and equipment, 100% of the geothermal equipment, and 50% of the well installation cost could be depreciated. These are user-input values and can be changed as desired, as can the depreciation life. A 10-year life of the geothermal equipment was assumed (consistent with the Cost Analysis spreadsheet) with a scrap value of zero. All other depreciable items were assumed to have a life of 30-years. A simple straight-line depreciation method was used. The second section of the Tax Analysis spreadsheet includes Tax Credits. The Geo-Heat Center explored tax credit options for an onion dehydration project, and several credits may be applicable as described below:
Oregon Business Energy Tax Credit (BETC). This tax credit, given by the Oregon Department of Energy, allows a tax credit of up to 35% of all geothermal-related costs. These costs can be spread out over 5 years in increments of 10% in years 1 and 2, and 5% in years 3, 4, and 5.
Oregon Department of Agriculture, Property Tax Exemption. The Oregon Department of Agriculture (ODA) is preparing to adopt a set of temporary administrative rules governing the process of certifying eligible machinery and equipment (M&E) for property tax exemption under a new law (SB 479) passed by the 2005 Legislature. More information can be found at: http://egov.oregon.gov/ODA/FSD/temp_sb479.shtml
Oregon Economic and Community Development Department, Oregon Enterprise Zones. Oregon Legislature created a separate tax abatement program available in most (but not all) enterprise zones. Any type of business activity is eligible, but these incentives depend on local approval and minimum levels for investment size, job creation, and employee compensation. Eligible businesses receive a property tax abatement.
12
Onion Dehydration with Geothermal Energy Final Report Geo-Heat Center, May 2006
Possible Carbon Credits. Although no formal programs exist at this time, it is highly possible that carbon tax credits or carbon trading programs may become available in the future, given the rising concern over greenhouse gases emissions. Based on energy consumption estimates shown in Figure 4, an onion dehydration plant using 80% geothermal energy will avoid emission of about 13,000 tons of CO2 equivalent annually as compared to a plant using 100% natural gas.
Figure 7. Tax analysis worksheet for the onion dehydration model (note red fonts are user input, black and green fonts are calculated values, blue fonts are user comments). At this stage of the feasibility study, only the BETC program was considered as shown in Figure 7. The other tax credits described above depend on several variables, and would be applicable to both the conventional and geothermal scenarios. Property taxes were also not considered. For application of the BETC to an onion dehydration project using geothermal energy, it was assumed that all geothermal-related costs were eligible, including design, exploration, and equipment. Therefore, in years 1 and 2, a tax credit of $355,219 would be available, and in years 3 through 5, a tax credit of $177,609 would be available. The third section of the Tax Analysis spreadsheet calculates the Taxable Income. Taxable income is computed as:
Taxable Income = Gross Income – Expenses – Depreciation – Debt Interest - Tax Credits
13
Onion Dehydration with Geothermal Energy Final Report Geo-Heat Center, May 2006
As shown in Figure 7, taxable income varies from year to year as tax credit periods and the debt term expire. The fourth and final section of the Tax Analysis spreadsheet calculates the income tax based on a user-input tax rate. For this feasibility study, a tax rate of 35% was assumed. Cumulative Annual Cash Flows The fourth worksheet Annual Cash Flows contains calculations that include all annual cash disbursements and receipts. For these calculations, the following financial parameters were assumed, which are user-input values in the worksheet that can be varied as desired:
• Percent of initial project cost financed = 65% • Debt interest rate = 6.5% • Debt term = 10 years • Energy cost escalation rate = 2%
For each year, the net cash flows are calculated by accounting for: sales income, all expenses (corrected for inflation where applicable), periodic replacement costs, debt plus interest, and income taxes. A cumulative total is graphed as shown in Figure 8. Years to positive cash flow are also calculated for each alternative.
-$20
$0
$20
$40
$60
$80
$100
$120
$140
$160
0 5 10 15 20 25 30
Time (years)
Cum
mul
ativ
e Ca
sh F
low
($m
illio
n)
CONVENTIONAL - Pre Tax CONVENTIONAL-After Tax
GEOTHERMAL-Pre Tax GEOTHERMAL-After Tax
`
Figure 8. Cumulative annual cash flows. A review of Figure 8 shows that each scenario results in a positive annual cash flow in a relatively short period of time. An onion dehydration plant using conventional natural gas as a heat source would yield a positive cash flow (after taxes) in about 2.5 years, while a plant using
14
Onion Dehydration with Geothermal Energy Final Report Geo-Heat Center, May 2006
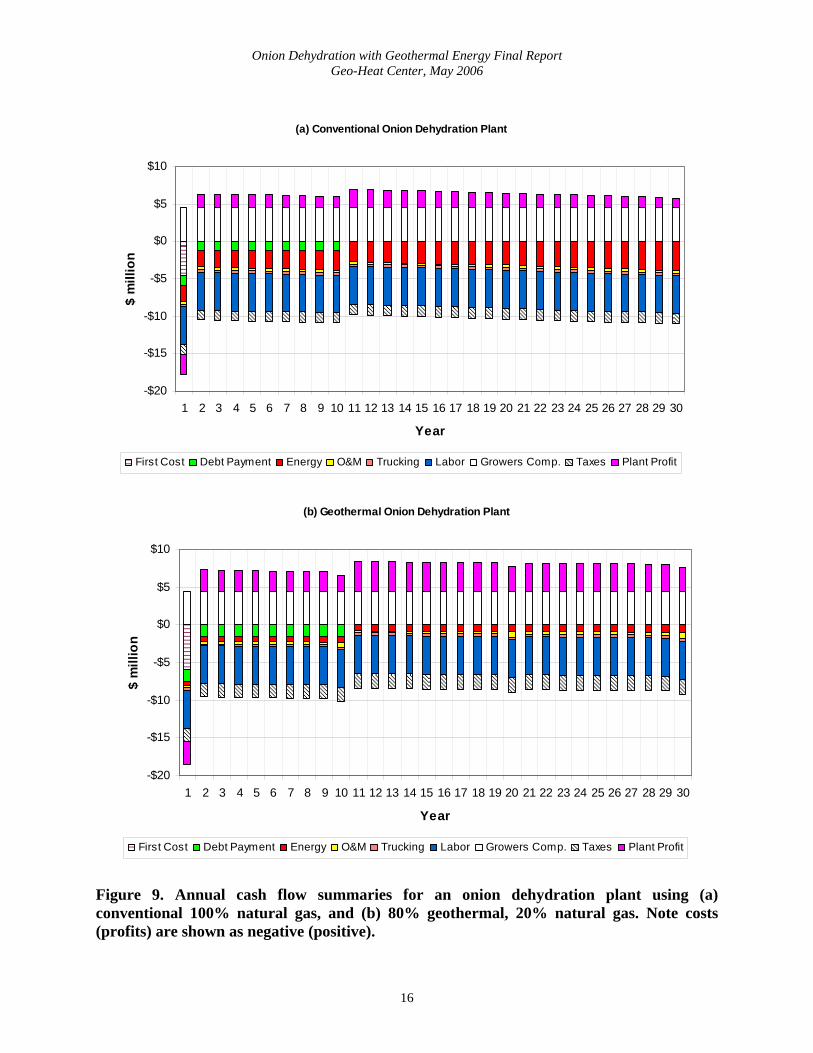
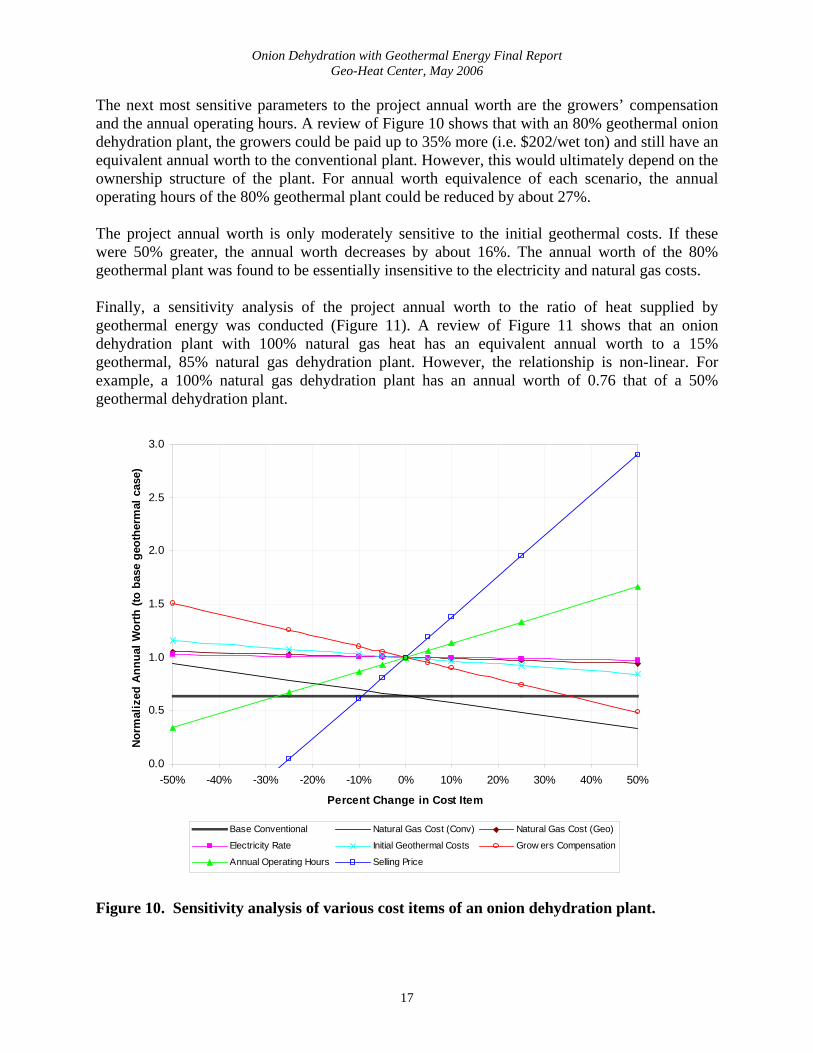
80% geothermal energy as a heat source would yield a positive cash flow (after taxes) in about 2.1 years. However, due to the energy savings of the geothermal dehydration plant, Figure 8 shows significantly higher positive cash flows over the life of the project. Annual Financial Summary The fifth worksheet (Figure 9) contains graphs that summarize the annual cash flows over the 30-year life cycle in a relative sense. The gross annual income from sales of the dry onions is not shown explicitly, but is equivalent to the total height of the column for each year. The exception is Year 1, where the capital cost of the plant represents an additional expense. Annual expenses are shown as negative, and plant profit as positive. Growers’ compensation is also shown as positive in order to display this as a benefit to the growers. A review of Figure 9 shows (as mentioned above) that labor costs are the most significant annual expense. Trucking and O&M costs are relatively minor. The energy savings, and resulting additional plant profits, in the geothermal scenario are evident from the graphs. Sensitivity Analysis The sixth and final worksheet is a Sensitivity Analysis. There are two purposes of this worksheet: (1) to compare annual worth (or equivalent uniform annual cost) of alternatives, and (2) to evaluate the uncertainty of various cost items on an annual worth basis. The annual worth (or equivalent uniform annual cost) of each alternative was computed by first reducing all scenarios to the present value, using a discount rate of 8%. The annual worth method of comparing the various alternatives was chosen because it seemed more convenient to comprehend project worth on an equivalent annual basis. The results of the sensitivity analysis and annual worth comparison are shown in Figure 10. The relative change in annual worth is plotted against the relative change in a given item. There are several conclusions that can be drawn from this Figure. First, in comparing the annual worth between the base cases, the conventional 100% natural gas case has an annual worth of 64% of the 80% geothermal case. The thin black line, showing sensitivity of the natural gas cost to the annual worth of the conventional dehydration plant, shows that the natural gas cost would have to be 50% lower ($0.50/therm) to approach the annual worth of the 80% geothermal case. Regarding sensitivity of the various items to the annual worth of the 80% geothermal onion dehydration plant, the project is most sensitive to the selling price of the product. If the selling price were approximately 25% lower (i.e. $0.75/lb dry product), the annual worth would be negative, and therefore the project would not be attractive. However, a 25% increase in the selling price results in an approximate doubling of annual worth.
15
Onion Dehydration with Geothermal Energy Final Report Geo-Heat Center, May 2006
(a) Conventional Onion Dehydration Plant
-$20
-$15
-$10
-$5
$0
$5
$10
1 2 3 4 5 6 7 8 9 10 11 12 13 14 15 16 17 18 19 20 21 22 23 24 25 26 27 28 29 30
Year
$ m
illio
n
First Cost Debt Payment Energy O&M Trucking Labor Growers Comp. Taxes Plant Profit
(b) Geothermal Onion Dehydration Plant
-$20
-$15
-$10
-$5
$0
$5
$10
1 2 3 4 5 6 7 8 9 10 11 12 13 14 15 16 17 18 19 20 21 22 23 24 25 26 27 28 29 30
Year
$ m
illio
n
First Cost Debt Payment Energy O&M Trucking Labor Growers Comp. Taxes Plant Profit
Figure 9. Annual cash flow summaries for an onion dehydration plant using (a) conventional 100% natural gas, and (b) 80% geothermal, 20% natural gas. Note costs (profits) are shown as negative (positive).
16
Onion Dehydration with Geothermal Energy Final Report Geo-Heat Center, May 2006
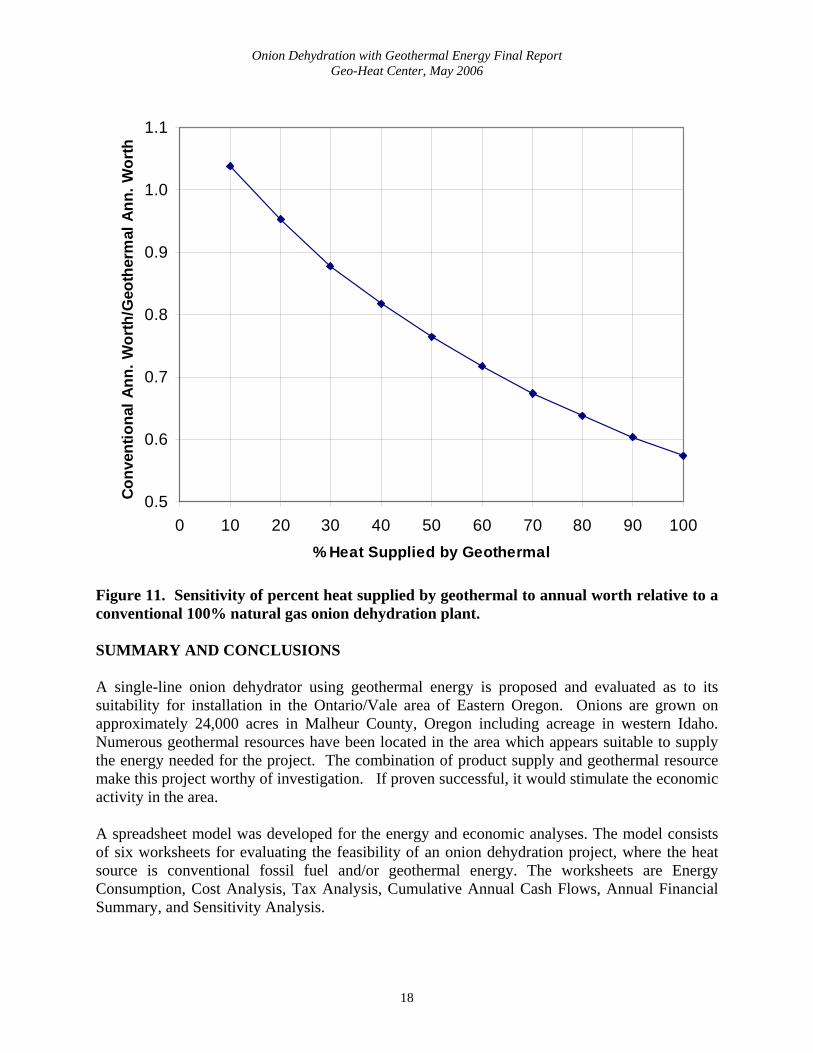
The next most sensitive parameters to the project annual worth are the growers’ compensation and the annual operating hours. A review of Figure 10 shows that with an 80% geothermal onion dehydration plant, the growers could be paid up to 35% more (i.e. $202/wet ton) and still have an equivalent annual worth to the conventional plant. However, this would ultimately depend on the ownership structure of the plant. For annual worth equivalence of each scenario, the annual operating hours of the 80% geothermal plant could be reduced by about 27%. The project annual worth is only moderately sensitive to the initial geothermal costs. If these were 50% greater, the annual worth decreases by about 16%. The annual worth of the 80% geothermal plant was found to be essentially insensitive to the electricity and natural gas costs. Finally, a sensitivity analysis of the project annual worth to the ratio of heat supplied by geothermal energy was conducted (Figure 11). A review of Figure 11 shows that an onion dehydration plant with 100% natural gas heat has an equivalent annual worth to a 15% geothermal, 85% natural gas dehydration plant. However, the relationship is non-linear. For example, a 100% natural gas dehydration plant has an annual worth of 0.76 that of a 50% geothermal dehydration plant.
0.0
0.5
1.0
1.5
2.0
2.5
3.0
-50% -40% -30% -20% -10% 0% 10% 20% 30% 40% 50%
Percent Change in Cost Item
Nor
mal
ized
Ann
ual W
orth
(to
base
geo
ther
mal
cas
e)
Base Conventional Natural Gas Cost (Conv) Natural Gas Cost (Geo)
Electricity Rate Initial Geothermal Costs Grow ers Compensation
Annual Operating Hours Selling Price
Figure 10. Sensitivity analysis of various cost items of an onion dehydration plant.
17
Onion Dehydration with Geothermal Energy Final Report Geo-Heat Center, May 2006
0.5
0.6
0.7
0.8
0.9
1.0
1.1
0 10 20 30 40 50 60 70 80 90 100% Heat Supplied by Geothermal
Conv
entio
nal A
nn. W
orth
/Geo
ther
mal
Ann
. Wor
th
Figure 11. Sensitivity of percent heat supplied by geothermal to annual worth relative to a conventional 100% natural gas onion dehydration plant. SUMMARY AND CONCLUSIONS A single-line onion dehydrator using geothermal energy is proposed and evaluated as to its suitability for installation in the Ontario/Vale area of Eastern Oregon. Onions are grown on approximately 24,000 acres in Malheur County, Oregon including acreage in western Idaho. Numerous geothermal resources have been located in the area which appears suitable to supply the energy needed for the project. The combination of product supply and geothermal resource make this project worthy of investigation. If proven successful, it would stimulate the economic activity in the area. A spreadsheet model was developed for the energy and economic analyses. The model consists of six worksheets for evaluating the feasibility of an onion dehydration project, where the heat source is conventional fossil fuel and/or geothermal energy. The worksheets are Energy Consumption, Cost Analysis, Tax Analysis, Cumulative Annual Cash Flows, Annual Financial Summary, and Sensitivity Analysis.
18
Onion Dehydration with Geothermal Energy Final Report Geo-Heat Center, May 2006
Two scenarios of an onion dehydration plant were considered: (i) an onion dehydration plant with a 100% natural gas heat source for dehydrating the onions and (ii) an onion dehydration plant with a 80% geothermal energy and 20% natural gas heat for dehydrating the onions. The feasibility of each case was evaluated by comparing cash flows as well as annual worth (equivalent uniform annual cost). A sensitivity analysis was conducted to evaluate the impact of uncertainty of various cost items on the annual worth of various scenarios. Some specific conclusions of the study are: A single-line onion dehydrator using geothermal energy with up to 20% fossil fuel (natural gas) contribution is economically feasible to be developed in the Ontario/Vale area of eastern Oregon.
This facility would require a supply of fresh onions of 10,000 lbs/hr producing 2,000 lbs/hr of dry onions.
The facility would operate 24 hours per day for a 250 day season, producing 6,000 tons of dried onion selling for an estimated $1.00/lb.
A total of 1,500 acres under cultivations with dehydration type onion would be required to supply the facility.
Geothermal resources are located throughout Malheur Country which could be developed for industrial use (above 250°F).
The most promising resource locations are at Neal Hot Springs and Little Valley Hot Springs west of Vale. The former would require utility services to be brought in and developed on site; whereas, the latter has nearby utilities at an existing industrial plant.
Vale Hot Springs has excellent potential for use, but is probably limited by potential interference with other geothermal resource users.
All the remaining sites either have a resource that is limited or is remotely located requiring utilities.
The estimated incremental cost of the geothermal scenario above the conventional is $3.55 million or 26.8%.
The estimated annual energy savings in the geothermal scenario over the conventional is $1.6 million or 72.4%.
Both the conventional and geothermal scenarios examined result in a positive after-tax annual cash flow in a relatively short period of time. An onion dehydration plant using conventional natural gas as a heat source would yield a positive cash flow (after taxes) in about 2.5 years, while a plant using 80% geothermal energy as a heat source would yield a positive cash flow (after taxes) in about 2.1 years. The geothermal dehydration plant scenario, due to the savings in energy cost, shows significantly higher positive cash flows over the life of the project.
The most significant annual cost is labor, at 30% of the gross income, followed by growers’ compensation at 26.8%. For the conventional natural gas onion dehydration plant, energy costs account for 13.1% of gross income, while only 3.6% of the gross income is attributed to energy use in the geothermal scenario.
Growers’ compensation of $150/wet ton appears profitable for the plant. The growers’ compensation could be increased by 35% (i.e. $202.50/wet ton) to be equivalent to the 100% natural gas case.
The annual worth of the conventional 100% natural gas case is 64% of the geothermal case. The annual worth of the conventional natural gas case is quite sensitive to the natural gas cost. The natural gas cost would have to be decreased by 50% (i.e. down to $0.50/therm) to have an
19
Onion Dehydration with Geothermal Energy Final Report Geo-Heat Center, May 2006
equivalent annual worth to the 80% geothermal case. The geothermal project annual worth is only moderately sensitive to the geothermal initial costs, but is highly sensitive to the selling price of dry onions and the annual operating hours.
A conventional 100% natural gas onion dehydration plant has an equivalent annual worth to a 15% geothermal, 85% natural gas onion dehydration plant, and a 76% annual worth to a 50% geothermal dehydration plant.
If sufficient resource is obtained (>250°F and 900 gpm) then there is a potential to develop geothermal electric energy to be used either at the plant or sold to the grid.
RECOMMENDATIONS Based on our analysis and conclusions we feel that onion dehydration plant using geothermal energy is technically and economically feasible and should be pursued based on the following criteria:
1. Verify that there is a market for the dried onions. 2. The Little Valley site is the most practical and economical one to develop; thus, the
following should be undertaken to develop the resource: a. Hire a geologist to determine the best location(s) for a test well b. Obtain an option on the land for the well and plant site (10 acres) c. Advertise and hire a competent driller d. Drill a test well or slim hole to verify the resource e. Prove the resource before proceeding with the plant
3. Hire a consultant to design the plant 4. Hire a contractor to build the plant 5. Begin operation 6. Investigate the potential for developing a geothermal power plant 7. If the resource does not prove adequate, either:
a. Investigate and develop an alternate site such as Neal Hot Springs b. Investigate designing and constructing a gas-fired plant on the Little Valley site –
as this operation appears to provide a profit, but less than the geothermal project. REFERENCES Lund, J.W. and Lineau P.J., 1994. Onion Dehydration. In Geothermal Food Dehydration,
Nevada and Colorado Resources, Geo-Heat Center Bulletin, Vol. 15, No. 4.
20
APPENDIX A
Overview of Geothermal Resources In the
Ontario – Vale Area of Eastern Oregon
Al Waibel Columbia Geoscience
2006
Overview of Geothermal Resources in the
Ontario - Vale Area of Eastern Oregon
Al Waibel Columbia Geoscience
2006
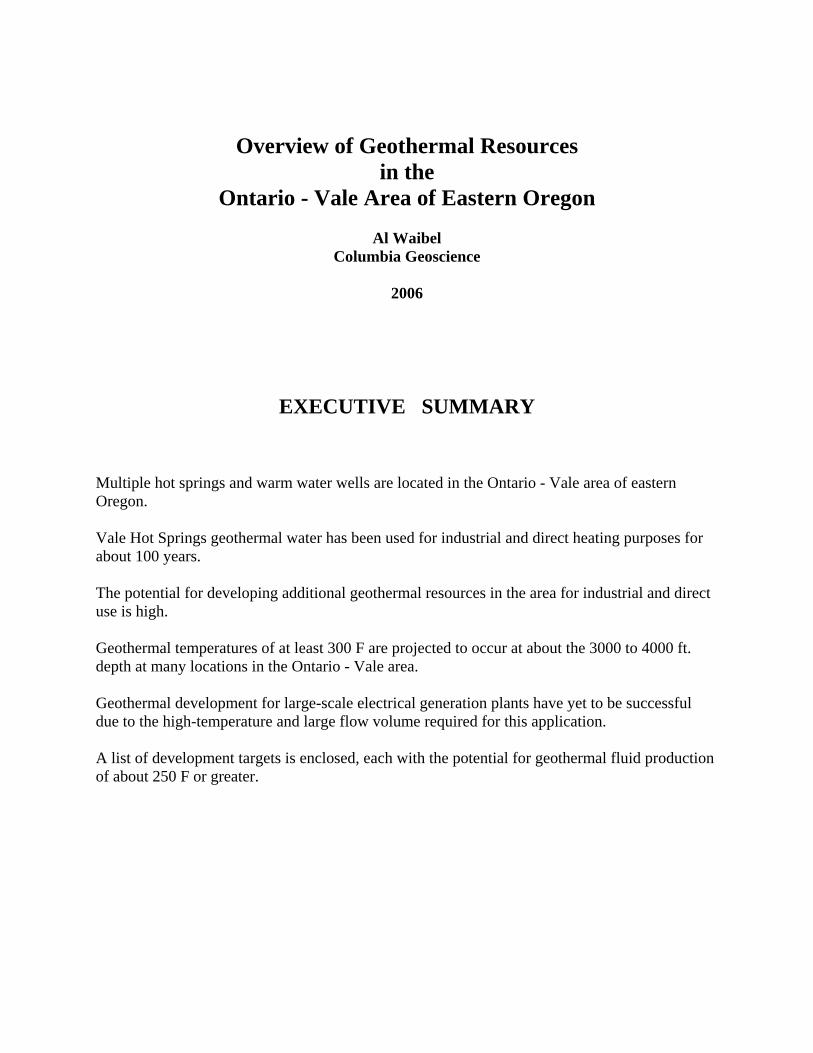
EXECUTIVE SUMMARY Multiple hot springs and warm water wells are located in the Ontario - Vale area of eastern Oregon. Vale Hot Springs geothermal water has been used for industrial and direct heating purposes for about 100 years. The potential for developing additional geothermal resources in the area for industrial and direct use is high. Geothermal temperatures of at least 300 F are projected to occur at about the 3000 to 4000 ft. depth at many locations in the Ontario - Vale area. Geothermal development for large-scale electrical generation plants have yet to be successful due to the high-temperature and large flow volume required for this application. A list of development targets is enclosed, each with the potential for geothermal fluid production of about 250 F or greater.
Overview of Geothermal Resources in the
Ontario - Vale Area of Eastern Oregon
Al Waibel Columbia Geoscience
2006
This report summarizes available information from published and unpublished reports and from private communications related to geothermal resources in the Ontario-Vale area. Locations with potential for underground geothermal resources with temperatures above 250 F are identifies.
INTRODUCTION Hot springs and temperature gradient data from wells identify areas of above average heat flow throughout the Ontario-Vale area of eastern Oregon. Numerous scientific investigations have been conducted in the area over the last 100 years with regard to natural hot water, beginning with the U.S.G.S. (Russell, 1903). Oregon Department of Geology and Mineral Industries participated in a number of basic scientific investigations, including geologic mapping, that provided base-line data that others could build on (Bowen, et.al., 1975; Brown et.al., 1980; Ferns, et.al., 1993). The U. S. Geological survey has provided additional information, including critical water chemistry (Gannett, 1988; Lindholm, 1981; Mariner et.al., 1980). The Geo-Heat Utilization Center at Oregon Institute of Technology (Lienau, 1978), Oregon State University (Couch, 1978a; Couch, 1978b; Couch and Baker, 1977), National Laboratories (Finger, et.al., 1996), and reports for private industry (Blackwell and Wisian, 1995) also have contributed to the understanding of geothermal resources in the Ontario-Vale area. The cumulative results of these studies identify large areas with great potential for geothermal resource discoveries. Ample low and moderate temperature resources have been identified. However the results of the efforts do not specifically identify deep production drill targets for high temperature, large flow rate, geothermal resources. Direct use of geothermal water has been utilized in Vale for heating and commercial purposes for many years. Intermittent exploration for geothermal resources capable of large-scale electrical power generation have taken place occasionally in the area, though to date without success. The threshold of success for these two applications is substantially different. Direct use heating and industrial applications of a geothermal resource usually require flow rates of hundreds of gallons per hour with temperatures less than 250 F. Large-scale electrical power generation (30 MW or greater) requires hundreds of thousands of gallons per hour of geothermal water with temperatures exceeding 350 F. A review of available geothermal data for the Ontario-Vale area suggests that the risk for successful exploration and development of a geothermal resource with 300 F water and sustained production rates of a few thousand gallons per hour is moderate, while the risk for exploring and developing a geothermal resource capable of sustained 30 MW electrical power generation is very high.
GEOLOGY The geology of the Ontario-Vale area of the western Snake River sedimentary basin is made up of several thousand feet of sedimentary, volcaniclastic and volcanic deposits ( Blackwell and Wisian, 1995; Brown, et.al. 1980;Ferns et.al., 1993; Finger et.al., 1996;Gannett, 1988). The surface geologic units consist of river gravels, terraces, landslide deposits and windblown sediments, all Pleistocene to Recent. The Snake River Plains geology is made up of lake sediments and gravels overlying basalt flows. Below the basalt are additional lake sediments, rhyolitic ash and tuff beds. These basal tuffs are dated at 9.2 Ma (Ferns et.al., 1993). The upper lake sediments are reported to be 4600 feet thick about 10 miles east of Vale, while less than 1000 feet thick at Vale (Finger et.al., 1996). Below the Snake River Plains formations are the Oregon - Idaho Graben Deposits. These deposits are composed of rhyolitic lavas and tuffs, basalt flows, and sediments. The lower volcanic units of the graben deposits are middle Miocene, approximately 15 Ma. Underlying the graben deposits are rhyolite and basalt volcanics (Ferns et.al., 1993). Effective movement of water, upward-flowing along vertical aquifers, is required to support a dynamic geothermal system. These high-angle aquifers allow water heated at great depths to flow toward the surface to economically drillable depths. Often not all hot water from a geothermal system discharges at the surface as hot springs. At shallow to intermediate depths (near surface to about 2000 ft.) up-flowing hot water may disburse laterally, away from the vertical aquifer, along permeable layers. In order to develop a geothermal resource, production wells must intersect the vertical hot aquifers directly or intersect hot lateral aquifers proximal to the up-flow zone. Rock permeability is a critical component of geothermal resource development. Clay and silt rich sediments have low potential for water permeability. Fresh fractured lava commonly has high permeability, while altered lava can have low permeability. Shallow broad layers of sand and gravel can have high permeability, while isolated lenses of the same can be depleted of water. Water Well Reports submitted to the state of Oregon show the most productive shallow aquifers in the Ontario-Vale area to be sand and gravel layers.
DEEP WELLS Four deep geothermal test wells have been drilled in the Ontario-Vale area. They are Union 47-10 (4.5 miles SSE of Vale) , Ore-Ida #1 (in Ontario), Transpacific A-Alt. ( 3 miles SSE of Vale) and Transpacific 61-10 (4 miles SE of Vale), ( Blackwell and Wisian, 1995; Finger et.al., 1996). None of the four wells were considered successful and all have been plugged. The disappointing results are due to lack of production volume and/or sub-economic temperatures for power generation technology at the time. Union 47-10 had a temperature of 277 F at 3855 ft. Extrapolation of the thermal gradient projects a temperature of 300 F at 5000 ft. depth. Ore-Ida #1 was drilled to a depth of 10,000 ft. Temperature measurements report 300 F at 7,000 ft. and 380 F at 10,000 ft. Transpacific A-Alt well is reported to have encountered significant fracture permeability below 4000 ft., though with a temperature of only 224 F. Transpacific 61-10 was drilled to a depth of 5814 ft. with a reported a maximum temperature of 280 F. Fracture permeability in wells Union 47-10 and Transpacific 61-10 was observed in rhyolitic lavas.
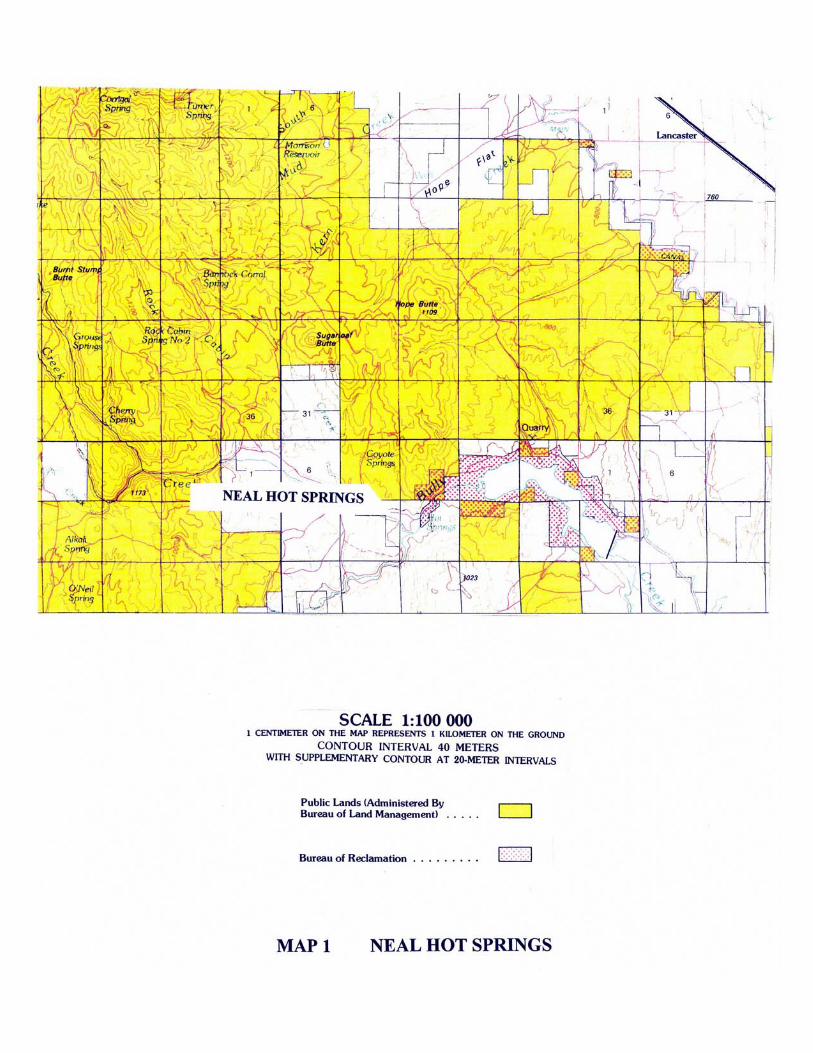
GEOTHERMAL SYSTEMS Hot springs, warm water wells (85-105 F) and shallow wells with high temperature gradients are not unusual in the Ontario-Vale portion of the western Snake River Plain. Regional geological, geochemical and geophysical studies provide constraints on how the overall geothermal systems work in this area. Geology provides basic lithologic and rock mechanic parameters and structural information. Chemistry of the hot water from springs provides estimates as to maximum water temperatures at depth. Geophysics provides sub-surface measurements that allow extrapolation of geologic interpretations to depth. The deepest component of the geothermal activity observed in the Vale-Mitchell Butte area is probably around the 20,000 ft. depth where water is flowing thru fractures, heating up to about 300 F. The heated water likely flows up along structural and/or fractured vertical aquifers. The hot water probably flows laterally through fractured volcanic rock adjacent to the vertical aquifers. Surface leakage from these up-flow areas are noted as hot springs. The chemical compositions of the hot springs waters allow for estimates of deeper temperatures. The chemistry of waters from the hot springs in the Vale-Mitchell Butte region all suggest a deeper production temperature of near 300 F. The majority of the hot springs and wells in the Ontario-Vale area are located within the Western Snake River Plain (Ferns et.al., 1993). These hot springs and warm water wells are all very similar in geologic setting. The chemistry of these waters also are very similar, all showing a maximum resource temperature of 250 to 300 F ( Brown, et.al. 1980; Mariner et.al., 1980). Three hot springs are located in association with the Oregon - Idaho Graben, a geologic structure adjacent to the Snake River Plain. Two of these hot springs, Neal and Beulah, have water chemistries that indicate notably higher resource temperatures than those hot springs of the Snake River Plain area. HOT SPRINGS OF THE OREGON - IDAHO GRABEN Neal Hot Springs and Bully Creek Hot Springs (T18S, R43E, Sections 9 and 4) comprise the Bully Creek geothermal area. It is located on Bully and Cottonwood Creeks, about 4 ½ miles by road west of the Bully creek reservoir dam and about 12 ½ miles by road west of the town of Vale. Surface geothermal manifestations at Neal Hot Springs include spring pools with temperatures up to 202 F and extensive silicic sinter hot springs deposits. Chemical geothermometry based on quartz conductive calculations indicate a deeper resource temperature of 173 C or 343 F (Mariner et.al. 1980). In the 1970's Chevron drilled an exploration hole just to the north of the hot springs deposits. The hole is reported to have blown out and ejected steam and hot water a few months after completion. Currently the hot springs water is not used by the land owner. Map 1 Land status: Private, with BLM land along the northern edge. Positive: High temperature. Large resource.
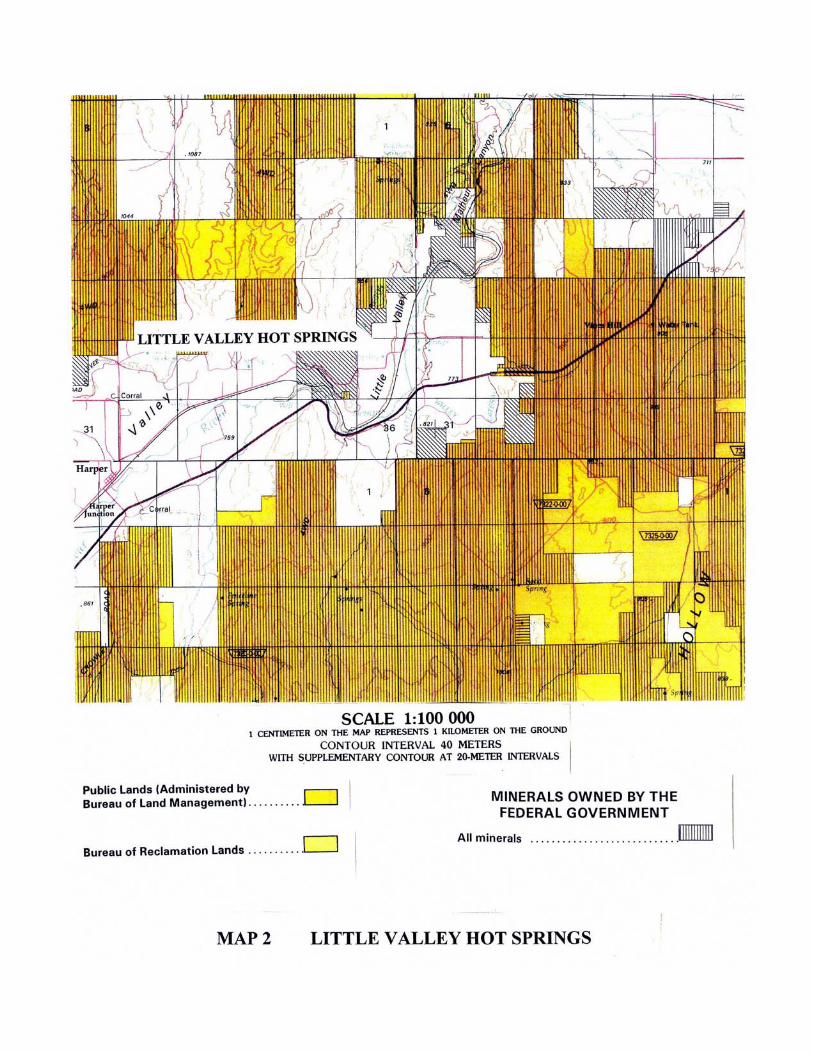
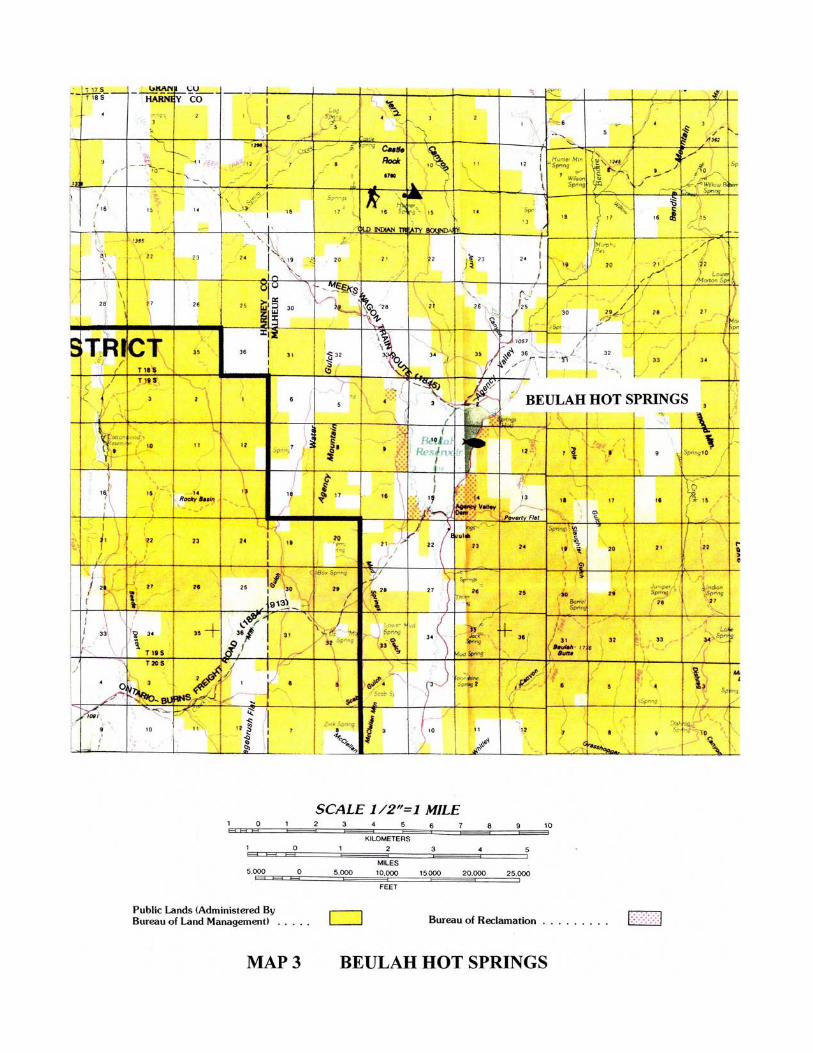
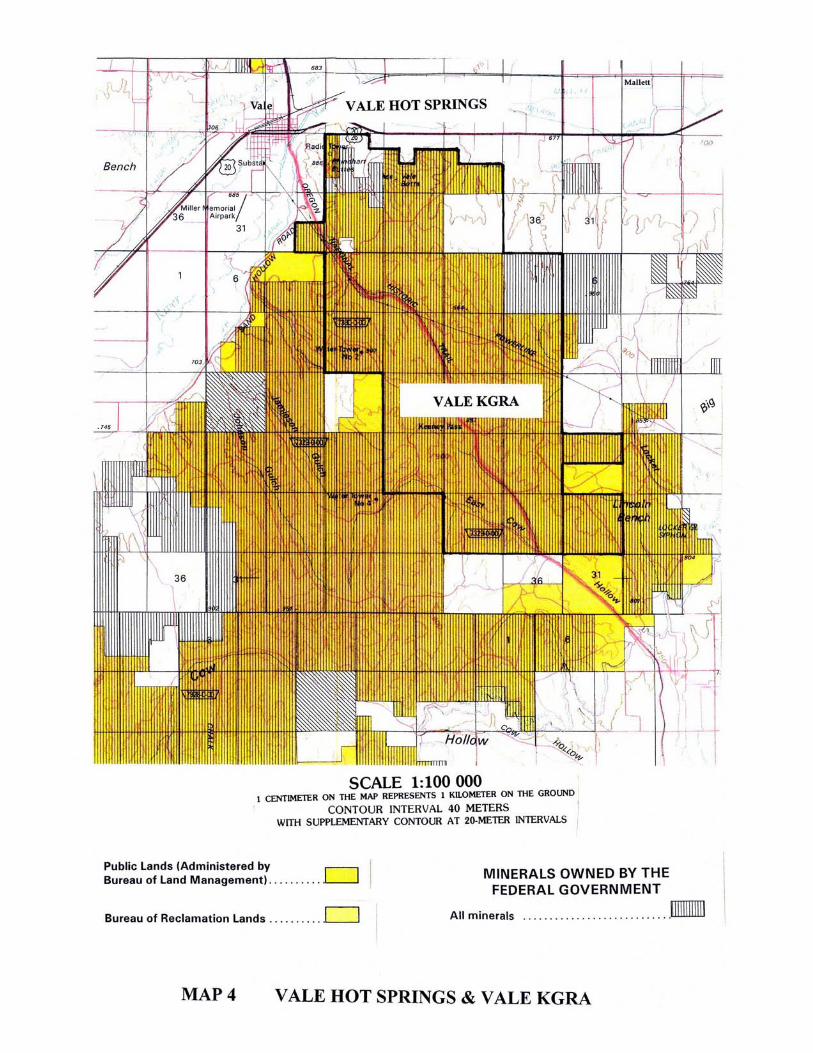
Private land. No competitive users. Negative: Twelve and one half miles from Vale. Little Valley Hot Springs, Malheur Co., T19S, R43E, Sec. 30, is located along the Malheur river. Spring pool temperature is reported to be 158 F. The flow rate of the hot spring is reported to be in excess of 145 gpm. An adjacent well is reported to have 156 F water. Chemical geothermometry based on quartz conductive calculations indicate a deeper resource temperature of 145 C or 293 F (Mariner et.al. 1980). Map 2 Land status: Private. Positive: Moderate temperature. Private land. Negative: Approximately 18 miles SW of Vale. Beulah Hot Springs, Malheur Co., T19S, R37E, Sec.2, is located twenty miles north of Juntura, on the northeastern edge of Beulah Reservoir. Chemical geothermometry based on quartz conductive calculations indicate a deeper resource temperature of 169 C or 336 F (Mariner et.al. 1980). The surface flow of hot water is reported to be 13 gpm. No geothermal exploration is reported to have conducted in this area. Map 3 Land status: BLM, Bur. Of Rec., private. Positive: High temperature. No competitive industrial use. Negative: Remote location. Possibly a very small resource. HOT SPRINGS OF THE SNAKE RIVER BASIN Vale Hot Springs, T18S R45E Sec. 20, are located at the eastern edge of the town of Vale, adjacent to the Malheur River. The maximum reported surface spring temperature is 194 F (Brown et.al. 1980). Hot wells drilled into the shallow geothermal aquifer have down-hole temperatures ranging from slightly warm to 230 F. Production temperatures reach up to 225 F (Gannett, 1988). Chemical geothermometry based on quartz conductive calculations show a range of possible deeper resource temperatures, from 250 to 306 F (121-152 C), (Mariner et.al. 1980). Numerous hot wells utilizing the shallower portion of the geothermal aquifer are located in an area of approximately 40 acres between Malheur River and Rhinehart Buttes (Gannett, 1988). Hot water from this geothermal area has been used for recreational and industrial purposes for much of the twentieth century, and is currently used for agribusiness and direct heating. Map 4 Land status: Private. Positive: Higher temperature.
Centrally located. Negative: Substantial existing use of the resource which would take
precedence over new uses. Mitchell Butte Hot Spring, T21S, R45E, Sec. 12, is located along the west side of the Owyhee River, approximately 10 miles SW of the town of Nyssa. The spring temperature is reported to be 143 F, with a flow rate of 16 gpm. Chemical geothermometry based on quartz conductive calculations indicate a deeper resource temperature of 134 C or 273 F (Mariner et.al. 1980). The hot spring is located along a proposed NNE-trending fault. No systematic geothermal resource exploration is reported for this area, though it has been proposed that drilling into the postulated fault at depth would produce geothermal water ranging from 100 to 212 F. Hot water encountered is wells located in sections 7 and 8 (T21S, R46E), to the east of Mitchell Butte Hot Spring, indicate that the occurrence of geothermal water cannot be resolved by a single fault solution. Map 5 Land status: Private. Positive: Private land. Negative: Moderate temperature. Deer Butte Hot Spring, T21S, R45E, Sec. 14, is located on the north shore of Owyhee River, east of Deer Butte. The spring temperature is reported to be 174 F. No flow rate is reported. Chemical geothermometry based on quartz conductive calculations indicate a deeper resource temperature of 139 C or 282 F (Brown et.al. 1980). This hot spring is situated about 0.35 miles west of a proposed NNE-trending fault which is postulated to extend thru the Mitchell Butte Hot Springs. Map 5 Land status: Bur. of Rec. Positive: Negative: Bur. of Rec. Land. Snivley Hot Spring, T21S R45E Sec. 22, is located along the west bank of the Owyhee River, about 1.5 miles SW of Deer Butte Hot Spring. The spring temperature is reported to be 134 F. No flow rate is reported. Chemical geothermometry based on quartz conductive calculations indicate a deeper resource temperature of 118 C or 244 F (Brown et.al. 1980). Map 5 Land status: BLM. Positive: Negative: Moderate temperature. BLM land Remote location.
The Willow Creek thermal area extends south-southeasterly from the town of Vale for about ten miles, and includes the designated Vale Known Geothermal Resource Area (approximately 22 square miles). Other than one small warm spring, no surface thermal indicators are reported within this area. The recognition of this area as having good geothermal potential is based on many shallow drill holes with high temperature gradients. Three relatively deep geothermal exploration wells have been drilled in this area, Union 47-10 (4.5 miles SSE of Vale) Transpacific A-Alt. ( 3 miles SSE of Vale) and Transpacific 61-10 (4 miles SE of Vale). All three of these test wells failed to locate temperature and flow volumes required to support large scale production of electrical power. Reported deeper temperatures in this area are 277 F at 3855 ft. (Union 47-10) and 280 F at 5814 ft. (Transpacific 61-10). Map 4 Land status: BLM. Positive: A large area of high heat. Negative: Remote from agricultural land. BLM land. Weak encouragement from earlier drilling.
No obvious drill targets.
EXPLORATION AND DEVELOPMENT Hot springs, warm water wells, and shallow wells with high temperature gradients are plentiful in the Ontario-Vale area. Exploration techniques used to characterize the deeper temperatures and the locations of geothermal systems within this area have been geology (Brown et.al., 1980; Ferns, et.al., 1993), water chemistry ( Brown et.al., 1980; Mariner et.al., 1980), temperature gradients (Bowen, et.al., 1975; Blackwell and Wisian, 1995; Brown et.al., 1980; Gannett, 1988), gravity (Couch, 1978a; Couch, 1978b; Couch and Baker, 1977) and magnetics (Blackwell and Wisian, 1995; Finger, et.al., 1996). Geology shows surface distribution of rock types and surface traces of structure. Water chemistry provides guidelines for likely resource temperatures at depth. Temperature gradient measurements measure temperature changes with depth, identifying areas heated by up-flowing geothermal water. Gravity measurements show changes in rock density, possibly related to faulting. Magnetic surveys show changes in magnetic fields. Of these techniques, only water chemistry and temperature gradients directly measure the affects of heat. The other techniques provide non-unique solutions used to infer possible locations of subsurface hot water. The purpose of conducting exploration programs for any natural resource is to cost effectively reduce development risk. While there are a wide array of exploration techniques available, many would contribute little toward risk reduction, particularly in that the anticipated resource temperatures in this area are low enough that there would be little detectable alteration or mineralization signature associated with production zones. A detailed exploration program would have to be constructed to address the specifics of each geothermal target in the Vale area. However, a general exploration outline can be described that would provide the basic framework for exploration and development of any of the geothermal targets identified in this report. The program would begin with a detailed gravity survey of the target area. Next, four temperature gradient wells with depths in the 1500 ft. range should be drilled. These wells would be
completed with a 2-inch tubing, sealed at the bottom, to accommodate tools measuring temperature profiles. The results of the gravity survey would be integrated with the temperature gradient data to identify possible high-temperature structures. The combined results would then be used to target production test drilling. Production of a 250 to 340 F resource could be anticipated between depths of 3000 and 4000 ft. Each deep well should be permitted for 4500 ft., with the actual completion depth identified on site while drilling is underway. Production targets would be high-angle faults and fractures hosting up-flowing geothermal fluid. An experienced geothermal geologist should be on location during drilling of the wells to pick casing points and well completion depths. A minimum number of wells would include one production well, one injection well, and possibly one standby production well. Optimum hole diameter for the production and injection portions of the wells should be large, possibly as much as 9 inches, to easily accommodate large volumes of fluid flow. Total time for the exploration program would be about four months. Each deep well should take no longer than 30 to 45 days to complete.
BIBLIOGRAPHY Blackwell, David D. and Kenneth Wisian, 1995, Interpretation of thermal results at Vale, Oregon geothermal system. Report for Trans-Pacific Geothermal Corp. 46 pp. Bowen, Richard G., David D. Blackwell and Donald Hull, 1975, Geothermal studies and exploration in Oregon. Oregon dept. of Geology and Mineral Industries,. Open-File Report 0-75-7, 65 pp. Brown, D.E., G.D. McLean and G.L. Black, 1980, Preliminary geology and geothermal potential of the Western Snake River Plane, Oregon. Oregon dept. Geology and Mineral Industries Open file Report 0-80-5, 3 maps. Couch, R.W,, 1978a, Geophysical investigations of the Vale-Owyhee geothermal region, Malheur County, Oregon. U. S. G. S. Extramural Geothermal Research Program, Technical Report 4, 133 pp. Couch, R.W,, 1978b, Analysis of geophysical data pertaining to the Vale K.G.R.A. U. S. G. S. Extramural Geothermal Research Program, Final Report, 52 pp. Couch, R.W,, and B. Baker, 1977, Geophysical investigations of the Vale-Owyhee geothermal region, Malheur County, Oregon. U. S. G. S. Extramural Geothermal Research Program, Technical Report 2, 13 pp. Ferns, Mark L., Howard C. Brooks, James G. Evans and Michael L. Cummings, 1993, Geologic map of the Vale 30 x 60 minute quadrangle, Malheur County, Oregon and Owyhee county, Idaho. Oregon Dept. Of Geology and Mineral Industries Geological Map Series GMS-77.
Finger, John T., Ronald D. Jacobson and Charles E. Hickox, 1996, Vale exploration slimhole: Drilling and testing. Sandia Report SAND96-1396, Gannett, Marshall W., 1988, Hydrogeologic assessment of the developed geothermal aquifer near Vale, Oregon. State of Oregon Water Resources Department Open file Report 88-04, 33 pp. Lienau, Paul J., 1978, Agribusiness geothermal energy uitlization potential of Klamath and western Snake river Basins, Oregon. Idaho National Engineering Laboratory Report IDO/1621-1, 183 pp. Lindholm, G.F., 1981, Plan of study for the regional aquifer-system analysis of the Snake River Plain, Idaho and eastern Oreton. U.S.G.S. Open File Report 81-689, 20 pp. Mariner, R.H., J.R. Swanson, G.J. Orris, T.S. Presser and W.C. Evans, 1980, Chemical and isotopic data for water from thermal springs and wells of Oregon. U.S.G.S. Open File Report 80-737, 50 pp. Moelter, S., c. 1982, Lithologic notes from the lower portion of Ore-Ida No. 1 Well. Unpublished notes for Columbia Geoscience. Ore-Ida Foods Inc., 1979, Log composite of Ore-Ida No. 1 Well, published by Earth Science Laboratory, Univ. Of Utah, 1 plate. Russell, I.C., 1903, Preliminary report of artesian basins in southwestern Idaho and southeastern Oregon. U.S.G.S. Water Supply and Irrigation Paper No. 78, 53 pp.