Embed Size (px)
Citation preview

Feasibility study project for the JCM
(2016FY)
“Feasibility study for installing Solar PV system
at Mwea Rice Mills
in the Republic of Kenya”
March, 2017
Ministry of Economy, Trade and Industry (METI)
NTT Data Institute of Management Consulting, Inc.

Contents
1. Overview of the study ............................................................................. 1
1.1. Background and Objective of the Study ............................................................. 1
1.2. Scope of the Study ................................................................................................ 1
1.3. Outline of “Japanese technology” ....................................................................... 2
2. Technical assessment of solar generating system ................................. 3
2.1. Self-consumption project employing linear control for solar power systems in
Kenya .................................................................................................................... 3
2.1.1 Key points concerning solar power linear control ..................................... 3
2.1.2 Overview of project site ............................................................................... 5
2.1.3 System considerations ................................................................................. 6
3. Solar power potential in irrigation sector ............................................ 15
3.1. Potential assessment of irrigation sector ......................................................... 15
3.1.1 Rice industry .............................................................................................. 15
3.1.2 Irrigation policy ......................................................................................... 15
3.1.3 Strategic Plan of NIB ................................................................................ 16
3.1.4 Specific Plan of NIB .................................................................................. 17
3.2. Summary of potential assessment of Irrigation sector ................................... 17
4. Potential assessment of private sector ................................................ 19
4.1. Market potential for solar power in Kenya ...................................................... 19
4.2. Analyzing the business environment for the solar power market in the private
sector ................................................................................................................... 19
4.2.1 Interview with private sector business operators ................................... 19
4.2.2 Cost performance analysis and economic scale from solar business, as
learned through interviews ......................................................................................... 21
4.2.3 Analyzing self-consumption private IPP businesses in Kenya .............. 21
4.3. Analyzing business risk..................................................................................... 25
4.4. Feasibility of market entry by Japanese enterprises ...................................... 27
4.5. Business feasibility in the products or services market ................................. 28
4.5.1 For the utility-scale market (500 kW – 40 MW) ..................................... 28
4.5.2 For self consumption market (several kW to 500 kW systems) ............. 29
4.6. Power generation business investment feasibility .......................................... 30
4.6.1 Business investment options .................................................................... 30
4.6.2 Interview concerning feasibility of investment by Japanese enterprises
31

4.7. Potential in off grid markets ............................................................................. 32
4.7.1 Essence of hybrid mini-grid ...................................................................... 32
4.7.2 Potential assessment of hybrid mini-grid ................................................ 33
4.8. Conclusion .......................................................................................................... 35
5. Potential of GHG reduction by proposed projects ............................... 38
5.1. Potential assessment of Irrigation sector ........................................................ 38
5.1.1 Proposed Methodology KE_PM002 .......................................................... 38
5.1.2 Reference emission .................................................................................... 38
5.2. Estimation of GHG reduction by proposed projects ........................................ 38
5.2.1 Potential of GHG reduction by proposed projects ................................... 39
6. Issues and opportunities on project development ............................... 40
6.1. Issues involved in launching a business .......................................................... 40
6.1.1 Issues concerning business investment/capitalization ........................... 40
6.1.2 Issues concerning the deployment of equipment, systems, and other
hardware 40
6.2. Specific actions for establishing a business ..................................................... 41
6.2.1 Japanese companies' advantages ............................................................. 41
6.2.2 Carrying out projects through international support ............................. 42
6.2.3 Carrying out projects with investment from Japan ................................ 42
6.3. Best practices in Thailand ................................................................................ 43
7. Utilizing the JCM in the Future .......................................................... 44
7.1. The JCM as a motivating factor for business in Kenya .................................. 44
7.1.1 Paris Agreement and Kenya's INDC........................................................ 44
7.1.2 Improving MRV capability through the use of the JCM ........................ 44
7.1.3 Specific projects going forward ................................................................. 45
8. Conclusion: Strategic engagement about JCM development ............. 46

1
1. Overview of the study
1.1. Background and Objective of the Study
Renewable energy is widely promoted in Kenya to respond the increase of electricity demands.
We will conduct a feasibility study (F/S) for installing Japanese Solar PV system at Mwea rice mill
and calculate the GHG reduction by this project at rice mill. And we will promote the Japanese
Solar PV system based upon the F/S to other sectors in Kenya.
1.2. Scope of the Study
The scope of F/S is to install Solar PV system with 200kW to 500kW capacity at Mwea rice mill
owned and managed by NIB (National Irrigation Board). The solar PV system could reduce GHG
by alternating electricity from national grid or diesel generators. This GHG reduction at rice mill
will contribute to JCM scheme as well. KYOCERA will introduce their PV modules, PCS (Power
conditioners) and electricity control unit to this project.
The specific items of this study is as follows;
① Technical assessment of Solar generating system
② Potential assessment of irrigation sector
③ Potential assessment of private sector
④ Potential of GHG reduction by proposed projects
⑤ Issues and opportunities on project development
⑥ Utilizing the JCM in the Future
⑦ Conclusion: Strategic engagement about JCM development

2
1.3. Outline of “Japanese technology”
Figure 1 Before and After the project
Mwea rice mill uses electricity provided from National grid and standby diesel generators.
Project will install Solar PV system (PV module/ PCS: Power Conditioner) and Controlling system
arranged by KYOCERA. Regarding KYOCERA PV modules, they have over 30 years records of
operation, and third party institutions/organizations verify their reliability. Controlling system can
provide electricity with minimized batteries to reduce the initial cost. And the controlling system can
utilize electricity from National grid / diesel generates at night or on rainy/cloudy days when Solar
PV does not generate enough electricity. Even Controlling system can improve the quality of
electricity.
Before Project (Current)
After project

3
2. Technical assessment of solar generating system
This chapter examines a concrete plan for a follow-up project using the type of solar power system
targeted to be used under the JCM in Kenya.
2.1. Self-consumption project employing linear control for solar power systems in Kenya
2.1.1 Key points concerning solar power linear control
This section discusses the deployment of a solar power linear control at Mwea Rice Mills (MRM)
in Kirinyaga County, Kenya. Linear control is a technology needed to maximize solar power supply
without generating a reverse power flow, and is used when deploying a solar power system at a plant
with unstable power loads.
In general, solar power systems are connected via power conditioners to the national grid, which is
run by a power utility. Power generated by a solar power system is first consumed according to that
consumer's load. The remainder is then sent to the national grid via reverse power flow and is
purchased by a power utility. In other words, maximum power output is achieved at all times,
regardless of the load being used by the consumer.
However, many countries that have fragile power grids or that do not have net metering systems
prohibit power generated by a solar power system from being sent to the national grid. When deploying
solar power systems in such countries, one can deploy solar power systems with output capacities
smaller than the consumer's load, which eliminates any reverse power flow. One can also install a
reverse power relay (RPR) at the point of connection to the power grid. When the RPR detects a
reverse power flow, it shuts down the solar power system. The first method, because it involves
limiting solar power systems' capacity, does a poor job of reducing CO2 emissions and lowering grid
power consumption. The second method involves frequent shutdowns of the solar power system. Thus,
both methods have problems in terms of capacity utilization.
Therefore we propose the “PV Linear Control System”, which allows a solar power system to
operate in accordance with the load used by a consumer without ever shutting down, and does not
involve generating a reverse power flow to the national grid. “PV Linear Control System” allows for
monitoring the power flow at the grid connection point and the output generated by the solar power
system, and controls the output from the system so as to avoid generating a reverse power flow to the
grid.
When a net metering system is implemented in the future, it will be easy to change from the linear
control system to maximum power point tracking by reconfiguring the control system software. This
will make it possible to sell surplus electricity to the grid while still consuming self-generated power.
The figures below show the workings of the two systems.

4
Figure 2 Existing method and PV Linear Control System

5
2.1.2 Overview of project site
The following provides an overview of MRM, the site for this project. Mwea irrigation scheme
plays an important role in the cultivation of the rice milled at MRM. The NIB (National Irrigation
Board) built MRM's facilities and currently maintains and manages them. Since MRM is a subsidiary
of NBI, MRM is, in a broad sense, part of the Mwea irrigation scheme. Mwea irrigation scheme are
an important aspect of NIB planning, and there are plans to expand the irrigation area. Mwea is a major
irrigation scheme for rice cultivation and a model of agricultural success through irrigation.
Figure 3 Location and facilities
Figure 4 MRM facilities
Mill [1]
Mill [1] Mill [2]
Mill [2] Ware houses
Ware houses
6
2.1.3 System considerations
1) Power usage
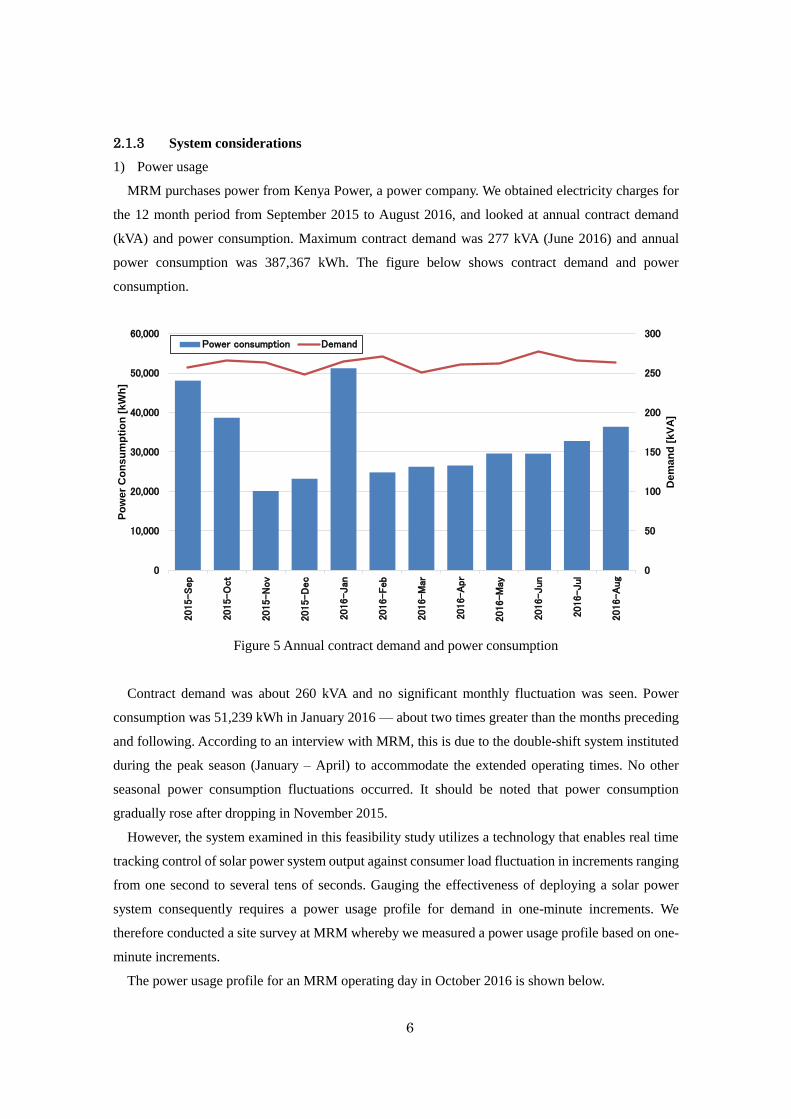
MRM purchases power from Kenya Power, a power company. We obtained electricity charges for
the 12 month period from September 2015 to August 2016, and looked at annual contract demand
(kVA) and power consumption. Maximum contract demand was 277 kVA (June 2016) and annual
power consumption was 387,367 kWh. The figure below shows contract demand and power
consumption.
Figure 5 Annual contract demand and power consumption
Contract demand was about 260 kVA and no significant monthly fluctuation was seen. Power
consumption was 51,239 kWh in January 2016 — about two times greater than the months preceding
and following. According to an interview with MRM, this is due to the double-shift system instituted
during the peak season (January – April) to accommodate the extended operating times. No other
seasonal power consumption fluctuations occurred. It should be noted that power consumption
gradually rose after dropping in November 2015.
However, the system examined in this feasibility study utilizes a technology that enables real time
tracking control of solar power system output against consumer load fluctuation in increments ranging
from one second to several tens of seconds. Gauging the effectiveness of deploying a solar power
system consequently requires a power usage profile for demand in one-minute increments. We
therefore conducted a site survey at MRM whereby we measured a power usage profile based on one-
minute increments.
The power usage profile for an MRM operating day in October 2016 is shown below.
0
50
100
150
200
250
300
0
10,000
20,000
30,000
40,000
50,000
60,000
2015-Sep
2015-O
ct
2015-N
ov
2015-D
ec
2016-Jan
2016-Feb
2016-M
ar
2016-A
pr
2016-M
ay
2016-Jun
2016-Jul
2016-A
ug
De
ma
nd
[k
VA
]
Po
we
r C
on
su
mp
tio
n [
kW
h]
Power consumption Demand

7
Figure 6 MRM's power usage profile (one-minute increments, October 2016)
The maximum load in the power usage profile for the operating day measured was 277 kW (at 11:23
AM). Plant operating hours are estimated to be from 8 AM to 5 PM, giving a daily load between 60
kW and 150 kW. Night time load is an almost constant 1–3 kW, suggesting a power draw from night
time lighting or other equipment.
To evaluate year-round business sustainability, we must also take into account monthly power usage
fluctuations. Although it is usually desirable to measure power usage profiles on a monthly basis, for
this feasibility study we made a proportional correction based on power usage for each month to the
power usage profile, which involved measuring power consumption on one plant operating day in
October 2016. Actual values obtained from electricity charges for the past 12 months are given for
monthly power consumption. MRM operates on weekdays and Saturdays. Workers are on holiday on
Kenya's national holidays, which fall on January 1, March 25, March 28, May 2, June 1, July 8,
October 20, December 12, and December 26.
The figure below shows power usage profile for May 2016 after correction.
0
25
50
75
100
125
150
175
200
225
250
275
3000:0
0
2:0
0
4:0
0
6:0
0
8:0
0
10:0
0
12:0
0
14:0
0
16:0
0
18:0
0
20:0
0
22:0
0
Lo
ad
Pro
file
[kW
]

8
Figure 7 Power usage profile for May 2016 (after correction)
0
50
100
150
200
250
30005/0
1
05/0
2
05/0
3
05/0
4
05/0
5
05/0
6
05/0
7
05/0
8
05/0
9
05/1
0
05/1
1
05/1
2
05/1
3
05/1
4
05/1
5
05/1
6
05/1
7
05/1
8
05/1
9
05/2
0
05/2
1
05/2
2
05/2
3
05/2
4
05/2
5
05/2
6
05/2
7
05/2
8
05/2
9
05/3
0
05/3
1
Lo
ad
Pro
file
[kW
]

9
2) Site information
MRM uses a large amount of power during the day to operate its rice mills that produce edible rice
from paddy. Some of the MRM site is unused land and could be used to install high-capacity solar
power systems.
The Embu-Nairobi Highway runs close by the site, allowing for relatively easy transport of
equipment and materials by truck.
Figure 8 View of the candidate site for solar power system installation (MRM)
3) System structure
The system being considered for MRM uses 1,152 solar cell modules rated at 270 W, giving a total
of 311.04 kW. The figure below shows a layout of the site.
Figure 9 Site layout (MRM)
80 m x 30 m of the plant site is usable land that would allow for the installation of a solar array that
could generate up to 311.04 kW. The diagrams and estimates provided below assume the deployment
Electric Room
Container Room
Cable Root* Power Line* Control Line
Map Data ⓒ2016 Google
Image ⓒ2016 Landsat / Copernicus

10
of solar panels capable of providing 311.04 kW of output, the scale needed to maximize self
consumption at the site. The unused land could also be utilized for a future solar array expansion. The
"Container Room" in the figure would be a container-like equipment storage facility and would store
power conditioners, AC Connection Board, and interface box. The "Electric Room" is MRM's existing
electric room and would serve for the installation of a PV Switchgear Panel and control box.
The diagram below shows the system block.
Figure 10 System block diagram (MRM)
12 power conditioners rated at 25 kW would be used. The power conditioners' output cables would
collect power via the breaker box and photovoltaic connection boards, and would connect to the bus
bar on the existing switchgear panel. In addition, the photovoltaic control box would collect power
supplied from the grid and output generated by the solar power system, maximize self consumption
at the plant, and instantly compute the maximum generated output for the solar power system such
that there was no reverse power flow to the grid. The computed maximum generated output from the
solar panel system would be sent to the power conditioners via the interface box, and the power
conditioners would control solar power system output according to the command values received
from the PV Control Box. Accomplishing this entire control procedure in just a few seconds allows
for linear control of solar panel system output according to the rice mill's power load.
System Block Diagram
Grid 3φ 3W11kV, 50Hz
Photovoltaic Array24s × 4p 25.92kW
Photovoltaic Array24s × 4p 25.92kW
Pyranometer
Thermometer
: Power Cable
: Signal Cable
: LAN Cable
Photovoltaic Array24s × 4p 25.92kW
Photovoltaic Array24s × 4p 25.92kW
Power ConditionerNo.6 25kW
Power ConditionerNo.7 25kW
Power ConditionerNo.12 25kW
Power ConditionerNo.1 25kW AC
Connection BoardNo.1
ExistingHUB
500A Busbar 500A Busbar
500A Switch
500A Switch
30A Switch
60A Switch
100ASwitch
30ASwitch
15ASwitch
30ASwitch
150ASwitch
150ASwitch
Transformer
630kVA11kV/433V
3φ 4W, 250/433V, 50Hz
Interface Box(With Signal Transducer)
Off
ice
Man
ager
House
White
Ric
e M
ill
Par
boile
dR
ice M
ill
Boile
r R
oom
Genera
tor
Room
Lig
hting
/ O
utlet
Road
Lig
hting
Par
boile
d R
ice M
ill (N
ew
P
anel)
AC Connection
BoardNo.2
DG 72kVA
PVSwitchgear
Panel
PV ControlBox
Switch
PV Site Electrical Room
InternetTotal PV Capacity : 311.04kW(270W x 24s x 48p)
Container Room
11
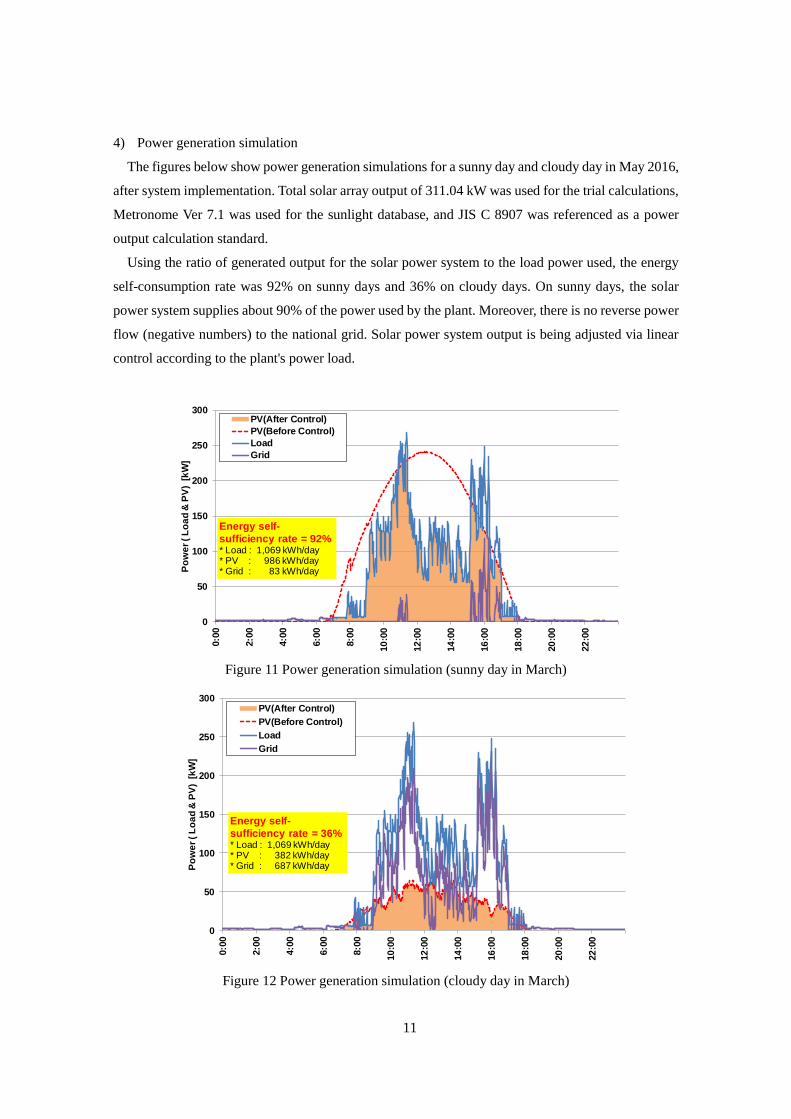
4) Power generation simulation
The figures below show power generation simulations for a sunny day and cloudy day in May 2016,
after system implementation. Total solar array output of 311.04 kW was used for the trial calculations,
Metronome Ver 7.1 was used for the sunlight database, and JIS C 8907 was referenced as a power
output calculation standard.
Using the ratio of generated output for the solar power system to the load power used, the energy
self-consumption rate was 92% on sunny days and 36% on cloudy days. On sunny days, the solar
power system supplies about 90% of the power used by the plant. Moreover, there is no reverse power
flow (negative numbers) to the national grid. Solar power system output is being adjusted via linear
control according to the plant's power load.
Figure 11 Power generation simulation (sunny day in March)
Figure 12 Power generation simulation (cloudy day in March)
0
50
100
150
200
250
300
0:0
0
2:0
0
4:0
0
6:0
0
8:0
0
10
:00
12
:00
14
:00
16
:00
18
:00
20
:00
22
:00
Po
we
r (
Lo
ad
& P
V) [
kW
]
PV(After Control)
PV(Before Control)
Load
Grid
Energy self-
sufficiency rate = 92%* Load : 1,069 kWh/day* PV : 986 kWh/day* Grid : 83 kWh/day
0
50
100
150
200
250
300
0:0
0
2:0
0
4:0
0
6:0
0
8:0
0
10
:00
12
:00
14
:00
16
:00
18
:00
20
:00
22
:00
Po
we
r (
Lo
ad
& P
V) [
kW
]
PV(After Control)
PV(Before Control)
Load
Grid
Energy self-
sufficiency rate = 36%* Load : 1,069 kWh/day* PV : 382 kWh/day* Grid : 687 kWh/day

12
5) System pricing
In light of the technologies for linearly controlling solar power system output and of the need to
guarantee the system, the main equipment and materials required for the solar power system will be
procured from Japan.
Table 1 shows the total costs for the project in four categories: (1) equipment and material cost, (2)
transport cost, (3) trial run technology cost, and (4) construction cost. VAT will be added to the total
amount.
Table 1 Total project costs (not including MRM or VAT)
No. Equipment or Cost Quantity Price
① Equipment and material cost
$ 614,000
1 Mounting structure 1,152
2 Equipment to be installed 1
3 Power conditioners
(25 kW models) 12
4 AC Connection Board 2
5 PV Switchgear Panel 1
6 Control system 1
7 Measuring device (including a
weather gauge) 1
8 Cables, etc. 1
② Transport cost $ 61,600
③ Trial run technology cost $ 67,000
④ Construction cost $ 310,600
Total $ 1,053,200
6) Projections for utility power consumption reduction and return on investment due to self-
consumption
Deploying this solar power system and maximizing the self-consumption of its output can reduce
power purchased from the national grid. Fig. 13 shows projections for reducing power purchased from
the national grid. Fig. 14 shows projections for years until return on investment and profit loss
assuming that costs related to the power grid and the site's power contract (kW unit price, kWh unit
price, fixed fees, fuel charges, foreign exchange fees, other taxes) will not change from their 2016
levels. Return on investment will be obtained in approximately 25.2 years.

13
Figure 13 Projections for reducing power purchased from the national grid
Figure 14 Years until return on investment and profit/loss
7) Ideal scenario “Maximize the demand of MRM”
As Fig.11 shows, the peak of electricity demands at MRM was at 11am and 16pm. Although
electricity generated by solar power system reach the highest amount around noon, the electricity
demand isn’t high. If MRM operates facilities in accordance with the pattern of solar power generation,
the efficiency of power usage will be improved.
The figure below showed the improved demand at MRM. In this scenario, MRM could use almost
all the electricity generated by solar power system. Return on investment will be improved and
obtained in approximately 14.1 years.
0
10,000
20,000
30,000
40,000
50,000
60,000
20
15
-Se
p
20
15
-Oc
t
20
15
-No
v
20
15
-De
c
20
16
-Jan
20
16
-Fe
b
20
16
-Ma
r
20
16
-Ap
r
20
16
-Ma
y
20
16
-Ju
n
20
16
-Ju
l
20
16
-Au
g
Po
we
r C
on
su
mp
tio
n [
kW
h]
Before
Aftetr
-120,000
-110,000
-100,000
-90,000
-80,000
-70,000
-60,000
-50,000
-40,000
-30,000
-20,000
-10,000
0
10,000
20,000
0 1 2 3 4 5 6 7 8 9 10 11 12 13 14 15 16 17 18 19 20
[k K
sh
]
Annual Saving of Electrical Bill
Accumulated Saving Against Initial Cost
Initial Cost

14
Figure 15 Improved power generation simulation (sunny day in March)
0
50
100
150
200
250
3000:0
0
2:0
0
4:0
0
6:0
0
8:0
0
10
:00
12
:00
14
:00
16
:00
18
:00
20
:00
22
:00
Po
we
r (
Lo
ad
& P
V) [
kW
]
PV(After Control)
PV(Before Control)
Grid
Load(After adjustment)
Energy self-sufficiency
rate = 92%* Load : 1,875 kWh/day* PV : 1,723 kWh/day* Grid : 151 kWh/day

15
3. Solar power potential in irrigation sector
3.1. Potential assessment of irrigation sector
3.1.1 Rice industry
Ministry of Agriculture (now Ministry of Agriculture, Livestock and Fisheries) has published
““National Rice Development Strategy (2008 – 2018)” 1 . According to this strategy, the
consumption of rice will reach 517,538,004tons /year. And in order to supply all the rice from
domestic farmers, the production of rice should grow 9.31%/year. This means the rice production
increase three times between 2008 and 2030.
Figure 16 Projections on production and consumption of rice by 2030
3.1.2 Irrigation policy
Ministry of Agriculture, Livestock and Fisheries2 has published “National Irrigation Policy,
2015” 3 (NIP2015). NIP pointed that Kenya has not fully developed the irrigation potential
estimated as 1.342 million ha. The irrigation potential is based on surface and underground water
1 Ministry of Agriculture “National Rice Development Strategy (2008 – 2018)” 2 From 2016, the Ministry of Water and Irrigation is in charge of irrigation
policies. 3 Ministry of Agriculture, Livestock and Fisheries “National Irrigation Policy,
2015”

16
including water harvesting and storage. By end of 2013, approximately 161,840 ha of irrigation
potential had been developed. This is about 12% of the potential leaving more than 80% of Kenya's
irrigation potential undeveloped.
Additional irrigation infrastructure will be developed and existing schemes expanded by the
National Government in collaboration with the County Government, with the aim of attaining the
national target in order to ensure irrigation contributes to the attainment of national targets,
1,341,900 ha by 2030. This ambitious policy means that the irrigation scheme in 2030 is eight times
larger than in 2013.
3.1.3 Strategic Plan of NIB
NIB has published “Strategic Plan 2013-2017” and showed the specific plan of irrigation
development as shown in the following table.
Table 2 Irrigation plan of NIB
Number of
projects
Irrigation area Irrigation area
(2013 – 2017)
Estimated Cost
(Ksh million)
Large scale 28 502,750ha 120,650ha 65,364
Small scale 108 47,000ha NA 31,339
Total 136 549,750ha - 96,703
The table shows that NIB has specific plan to develop 549,750ha. On the other hand, the target
of NIP2015 is 1,341,900 ha by 2030. If NIB accomplish all the project, the irrigation area will be
40% of target showed by NIP2015.

17
3.1.4 Specific Plan of NIB
Figure 17 Irrigation plan by NIB and three prioritized projects
The figure above illustrates the irrigation plan by NIB and three prioritized projects. We
interviewed with NIB and found 1. Galana and Kulalu Ranch project, 2. Expansion of Mwea
irrigation scheme and 3. Expansion of Mwea irrigation scheme are the prioritized projects.
Especially, the electricity demands of Galana and Kulalu Ranch project will be 5MW, and NIB
will install diesel generators to supply electricity. Considering the solar diesel hybrid system, the
potential of solar power system in Galana and Kulalu Ranch project will be around 3MW.
3.2. Summary of potential assessment of Irrigation sector
The table below shows the summary of potential assessment of Irrigation sector. Currently, the
facility which we can install solar power system is only Mwea Rice Mills (MRM). Other mills are
small to install solar power system. The proposed capacity of solar power system at MRM is
311.04kW. According to the “Strategic Plan 2013-2017” of NIB, the irrigation area will be
developed to 3.4 times larger. The potential of milling facility will also 3.4 times larger than MRM.

18
We could assume that the potential of solar power system in irrigation scheme would 1,057kW
(311.04kW x 3.4).
In addition, we could point out that the potential of solar power system at Galana and Kulalu
Ranch would be around 3MW.
Table 3 Summary of potential assessment of Irrigation sector
Policy/Plan Objects Increase
1. Ministry of
Agriculture
National Rice
Development
Strategy (2008 –
2018)
Rice production 7 times
(2008-2030)
2. Ministry of
Agriculture,
Livestock and
Fisheries
“National
Irrigation Policy,
2015
Irrigation area 8 times
(2013-2030)
3. NIB Strategic Plan
2013-2017
Specific irrigation plan 3.4 times
(2013- )

19
4. Potential assessment of private sector
4.1. Market potential for solar power in Kenya
There are two main methods for installing solar power systems: ground installations and rooftop
installations. With the former, sufficient land needs to be acquired for the project size. Ground
installation projects in Kenya hold considerable market potential in Kenya due to the vast space
available. However, using this plan requires negotiating with landowners and having regard for the
preservation of flora and fauna. As discussed further on, ground installations also carry risks that
include having the equipment stolen. Because of these circumstances, this study focuses on the
potential of installing solar power systems on rooftops.
The total potential for solar power system installation in the nonresidential market in Kenya has
been estimated between 900 MW and 1700 MW. As this estimate assumes nonresidential building
area comprises the rooftops of all plants and warehouses, the true capacity is likely to be lower. As
discussed later on, interviews with people in the private sector suggest there are anywhere from
2,000 to 3,000 warehouses in the country, which would place total potential output at somewhere
between 900 MW and 1700 MW.
4.2. Analyzing the business environment for the solar power market in the private sector
4.2.1 Interview with private sector business operators
We interviewed government officials, EPC business operators, project developers, and private
enterprises that have the potential to install solar power systems in the future.
From the interviews, we learned that the most promising market for solar power in the private
sector is the grid-connected self-consumption market for private citizens.
One reason is that Kenya receives abundant sunlight — a prerequisite for solar business — that
will allow for more power generation than would be possible in Japan. Another reason is that the
necessary investment costs for installing solar power systems is 1.0 to 1.5 USD/W, less than half
the cost in Japan. Depending on project period length, this would allow for keeping power
generation costs even lower than the cost per energy unit on grid power. However, grid power is
expensive and felt to be burdensome by many private enterprises. These factors seem to suggest
potential for business in Kenya that involves supplying solar power systems to replace grid power
usage.
Assuming a project period of 12 years, the power cost would be 9 cents/kWh during the project
period, less than half the price of grid power. Given this power cost comparison, the self-
consumption market is eminently feasible. There are business risks, however, and political risk is
estimated to be chief among them. Consequently, projects with overly long payback periods are not

20
likely to get off the ground. Every enterprise interviewed said their payback period was around five
years, which suggests five years or so will be the hurdle for new businesses.
Lastly, all enterprises thought Japan's renewable energy technologies produced high-quality,
albeit costly, products. There is a considerable gap between the current market prices of solar panels
in Japan and the price of solar panels in Kenya as we discovered in the study. Given that solar panels
have come to be viewed as commodities, improving cost competitiveness in order to continue
selling their products will remain a major focus for Japanese manufacturers.
Table 4 Findings from interviews with private enterprises
No Question Category Summary
1
Trends concerning permits
and laws
Half of those we interviewed were skeptical about any
kind of FIT or net metering system being implemented.
Some systems may offer a certain measure of cost
performance.
2 Industrial power pricing
trends
Everyone felt industrial power pricing in Kenya was too
high and wanted lower pricing
3
Cost of investment for solar
power system installation
Solar power systems cost roughly 1.5 to 5.0 USD/W to
install. Recently, cost of some large projects are less than
1.5 USD/W.
4
Environment for locally-
sourced financing
Lending rate regulations stifle private enterprises' ability
to get financing and loans are difficult to get for high-risk
projects. Financing thus remains a challenge. However,
with respect to companies with relatively stable finances,
it is possible to get financing from international
organizations/investors.
5
Business risk in Kenya Political risk (risks involving politics, changes to approval
schemes, etc.) was thought to be the most significant
business risk. Some development-related enterprises said
they had trouble getting land rights.
6
Solar power business
development in Kenya
Most solar power projects are on the scale of 100–200 kW,
and extremely short payback periods (roughly 5 years) are
commonly desired.
7
Evaluation of Japanese
renewable energy
technologies
Although everyone we spoke with lauded Japanese
renewable energy technologies for their high quality, sales
prices were about twice that for locally-sourced panels.

21
4.2.2 Cost performance analysis and economic scale from solar business, as learned
through interviews
Based on the above considerations, we estimated the economic scale of renewable energy
generation business (100% self-consumption model) in Kenya. This was accomplished by
multiplying the potential capacity as already calculated in the potential output analysis by the
economic scale of that capacity (including deployment costs and total maintenance fees during the
project period). The figure below presents these results.
The economy for the deployment of solar power systems solely for self-consumption in Kenya
could be up to 2,667 million USD, and the economy for maintenance around 755 million USD.
Table 5 Economic scale estimates
4.2.3 Analyzing self-consumption private IPP businesses in Kenya
As background context for this business conditions, some private enterprises are beginning to
appear that use renewable energy to offer decreased electricity charges as a business solution. South
Africa-based SolarAfrica is a project developer that uses solar power. The company operates a solar
power energy supply service for Garden City Mall, which was built outside Nairobi in 2015.
Facility overview
Garden City Mall is a large shopping mall along Thika Road, 13 km north of downtown Nairobi.
The mall opened in 2015 with facilities that include everything from restaurants to a consumer
electronics chain store, a supermarket, and clothing stores.
Economic scale calculations
Subject Value Unit Source
Project period 12 years Arbitrarily set
Unit of capacity 1.5 USD/W From interviews
Installed capacity 100 kW Arbitrarily set
Deployment cost 150,000 USD Unit of capacity x installed capacity
Annual maintenance cost 7,500 USD 5% of annual sales
Total maintenance cost 42,453 USD Discounted present value through government bonds
Total 192,453 USD Deployment cost + total maintenance cost
Economic scale for capacity 2 USD/W
Breakdown: Deployment cost 1.5 USD/W
Maintenance cost 0.4 USD/W
Economic scale based on potential
Subject Value Unit Source
Potential installed capacity 1,778 MW Estimate of potential
Economic scale for capacity 1.9 USD/W From above calculation
Economic scale 3,422 M USD Potential capacity x economic scale for capacity
Breakdown: Deployment cost 2,667 M USD
Maintenance cost 755 M USD

22
Figure 18 Aerial view of Garden City Mall
Business scheme
SolarAfrica operates a business that supplies renewable energy to this shopping center. The figure
below details the company's business scheme based on the information we have obtained.
Figure 19 Business scheme
Table 6 Organizations involved in the Garden City Mall Project
Role Organization Notes
Client Garden City Mall Shopping mall owner. Mall funding was
provided by Actis, an investment fund
financing projects in Asia and South
America
General contractor SolarAfrica Co., Ltd. A company that provides solar power
Garden City Mall(ショッピングセンター)
(太陽光発電プロジェクト・オーナー)
BOT契約12年間 設置施工
EPC発注
(EPC事業者)
(Solar power project owner)
(EPC)
EPC contact
12-year BOT contract Building and installation
(Shopping center)

23
self-consumption solutions and
financing functions for enterprises in
Africa
EPC Solar Century Co., Ltd. Designs and builds solar power systems
Project owner SolarAfrica contracts out system construction to Solar Century (which handles
EPC, i.e. engineering procurement, and construction). Solar Century designs and builds solar power
systems for Garden City Mall. After the system is built, Solar Century provides the system to
SolarAfrica. SolarAfrica has formed a 12-year BOT (Build Own Transfer) agreement with Garden
City Mall and will be in charge of system operation for this contract period. Generated output is
sold to Garden City Mall to be used within the mall. When the agreement period ends, power
generation equipment ownership transfers from SolarAfrica to Garden City Mall.
Installed system structure
The following table lays out the structure of the installed system.
Table 7 Garden City Mall project solar power system structure
Subject Details Notes
System structure Solar diesel hybrid system System switching is performed
automatically using a system
controller made by SMA
Installed panels 3,366 255 W output per panel
Panels made by Yingli Green
Energy
Total output (kW) 858 kW
CO2 emission reduction
during operating period
18,750 tons 12-year operating period
The system is characteristic for its usage of multiple small inverters (with about 12 kW in output
each) rather than one or two large inverters (with 500 kW-level output) as is common at mega solar
plants. Recent years have seen usage of this multiple small inverter system design in distributed
systems, even in Japan.
Although more power conditioners increases the need for maintenance manpower, this system is
able to minimize power loss as its power conditioners are capable of shutting off. This type of
system, which utilizes multiple smaller power conditioners, is seen as a practical means of risk
avoidance in environments such as Kenya where there is a lack of a robust network for system

24
maintenance and inspection.
Figure 20 Installed power conditioners
Installation conditions
The following photos show how system equipment is installed. Panels are used to construct the
roofs over carports in covered parking lots. Installing solar panel systems on carports makes
effective use of the plentiful space of covered parking lots while at the same time keeping
temperatures down inside cars parked there.
Figure 21 Solar power plant using carports

25
Figure 22 Mounts for solar panel-equipped carports
System operation monitoring
According to its service agreement, SolarAfrica provides monitoring and maintenance services,
and guarantees performance. SolarAfrica conducts monitoring remotely, with maintenance and
inspections performed using the company's local network of partners.
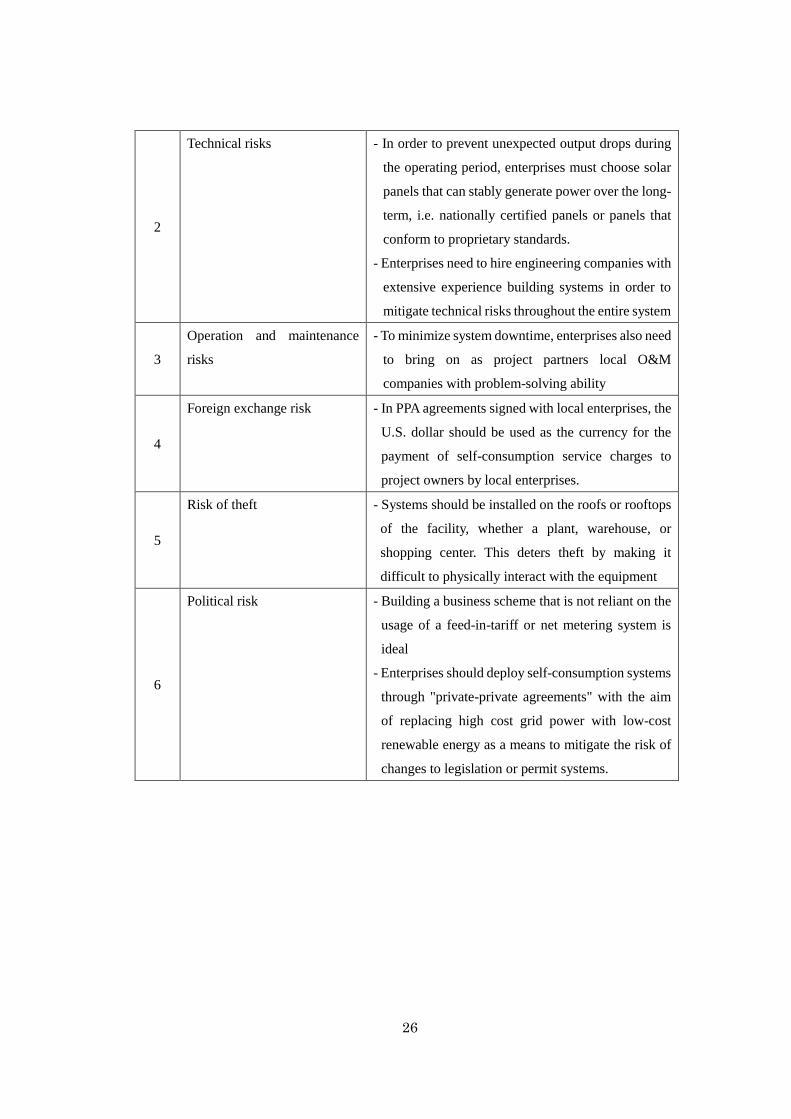
4.3. Analyzing business risk
This section discusses business risks in Kenya and potential solutions to mitigate them.
Essentially, rather than building a business scheme dependent on feed in tariffs, as is the case in
Japan, it would be advisable to build a business scheme focused on replacing costly grid energy
with low-cost renewable energy and recouping investment in a short timeframe.
Table 8 Renewable energy-related business using Japanese technologies
No Risk Solutions
1
Non-payment risk - Presently, those installing solar power systems for
self consumption should be limited to foreign-
owned enterprises operating in Kenya, state-backed
enterprises with financial stability, and other such
organizations.
- It is also advisable to minimize payback risk from
nonpayment by dramatically shortening the
payback period by such means as reducing the costs
of the systems installed.
26
2
Technical risks - In order to prevent unexpected output drops during
the operating period, enterprises must choose solar
panels that can stably generate power over the long-
term, i.e. nationally certified panels or panels that
conform to proprietary standards.
- Enterprises need to hire engineering companies with
extensive experience building systems in order to
mitigate technical risks throughout the entire system
3
Operation and maintenance
risks
- To minimize system downtime, enterprises also need
to bring on as project partners local O&M
companies with problem-solving ability
4
Foreign exchange risk - In PPA agreements signed with local enterprises, the
U.S. dollar should be used as the currency for the
payment of self-consumption service charges to
project owners by local enterprises.
5
Risk of theft - Systems should be installed on the roofs or rooftops
of the facility, whether a plant, warehouse, or
shopping center. This deters theft by making it
difficult to physically interact with the equipment
6
Political risk - Building a business scheme that is not reliant on the
usage of a feed-in-tariff or net metering system is
ideal
- Enterprises should deploy self-consumption systems
through "private-private agreements" with the aim
of replacing high cost grid power with low-cost
renewable energy as a means to mitigate the risk of
changes to legislation or permit systems.

27
4.4. Feasibility of market entry by Japanese enterprises
We examined the feasibility of solar power market entry in Kenya by Japanese enterprises. The
figure below presents general power generation business schemes for countries to use.
These can be broadly categorized into two methods by which Japanese enterprises can do
business in Kenya. The first involves providing products or services to the Kenyan market. More
specifically, it involves either selling solar panels or designing and building systems and then selling
them — engineering businesses, in other words. The second entails operating a pure investment
business. This means running business more indirectly instead of directly operating a business.
Specific methods for market entry may include contributing to investment funds whose sole focus
is on renewable energy investment, or offering loans through an SPV established to conduct power
generation business locally.
Figure 23 Options for doing business in Kenya's solar power industry
The table below provides additional notes on the role of different enterprises in the above business
schemes.
Table 9 Renewable energy-related business using Japanese technologies
Enterprise Role Notes
Investor Domestic investor Operates renewable energy
generation business in Kenya
Investment fund Obtains funding from investors and runs a
fund
Using an investment fund is not
necessary but may be useful in
certain cases.
SPC A special purpose corporation established
through an investment fund in the business
Are generally established in the
business hub country, after
Investor A
Investor B
Investor X
Investment fundSPC
(business hub
country, etc.)
Commercial
and industrial
sector
enterprises
SPV
Local EPC,
etc.
Investment
Dividends
Financing
Investme
nt
Management
O&M
Investment
Dividends
PPA
or
Lease
Solar power
equipment
1
2
Conduct business in the products
and services market
Invest in power generation business

28
hub country. consideration of the presence of
investment treaties, etc. between
Japan and the investee country.
SPV An investment vehicle established for each
project by a special purpose company
Uses the appropriate legal
instruments based on the local legal
and taxation systems
Local EPC, etc. Enterprises engaged in engineering,
procurement, and construction of power
generation systems in Kenya
May include conducting O&M
after project start
Solar power
equipment
Power generation equipment owned by an
SPV locally
Supplies generated power to a client
Enterprises in the
commercial or
industrial sectors
Are the purchasers of power and the
enterprises that have solar power systems
installed
Procure power from SPVs through
PPA agreements, etc.
4.5. Business feasibility in the products or services market
4.5.1 For the utility-scale market (500 kW – 40 MW)
With respect to systems for the utility-scale market, enterprises need to reduce EPC costs by
conducting bigger projects. Reducing EPC costs low keeps initial investment low, which in turn
lowers power generation costs throughout the project period. By lowering these costs, enterprises
can make winning bids with cheaper power selling prices when they participate in feed-in tariff
auctions.
Another important requirement regarding solar power systems is ensuring that output does not
drop during the project period. Conservatively speaking, solar power system output generally
declines by about 0.5% yearly. For utility-scale projects with particularly long project periods (over
20 years or so), annual average degradation rate numbers can significantly impact business
profitability. The figure below presents a graph estimating cumulative cash flow in the 20th year for
different annual degradation rates.

29
Figure 24 Cumulative cash flow for different annual degradation rates (at the time of project period
end)
It has been estimated that, when compared to the base case of a 0.5% annual degradation rate, a
rate of 3.0% results in a roughly 30% difference in cumulative cash flow by the end of the project.
With utility-scale projects involving systems with tens of thousands of panels, defective panels
sometimes need to be replaced after they have already been installed. The replacement costs in this
case are enormous, and are extremely damaging to the business's bottom line.
As we can see from the above, in the case of utility-scale projects, while it is important to reduce
initial investment costs, enterprises must also deploy solar panels that can continue to stably provide
a certain level of output as long as they are in use.
4.5.2 For self consumption market (several kW to 500 kW systems)
We now turn to the needs of the self-consumption market and the technical requirements involved.
As mentioned previously, power costs are high in the industrial sector (about 20 Ksh/kWh). Solar
power systems have the potential to serve as non-utility power solutions that lower these high power
costs.
However, they require a reverse power flow to the grid. Kenyan law currently does not allow the
selling of surplus solar power back to the grid. Furthermore, although there are plans to deploy a
net metering system, there has been no clear indication of selling price or when the system will be
instituted. In view of the above, power control technologies that prevent excess solar power from
0.50% 1.00% 2.00% 3.00%
Cu
mu
lative
ca
sh
flo
w (
KsH
)
Mill
ion
Average annual degradation rate (%)
Cumulative cash flow for different annual degradation rates(at the time of project period end)
▲30%
30
going to the grid are likely to become technical requirements in the self-consumption market.
On many of the buildings in the industrial and commercial sectors, which are expected to be the
main markets for this technology, diesel generators are installed as emergency non-utility power
equipment. Enterprises will need to meet power control requirements that include coordinated
control for these diesel generators and solar power systems. In addition to incorporating these power
control technologies into systems, enterprises will have to develop a cost structure that will allow
for keeping total unit price during the project period to below that for grid power.
4.6. Power generation business investment feasibility
Now we would like to look at the potential for investing in power generation business in Kenya,
the second option available to Japanese enterprises looking to enter the Kenyan market. There
appear to be three options for business investment.
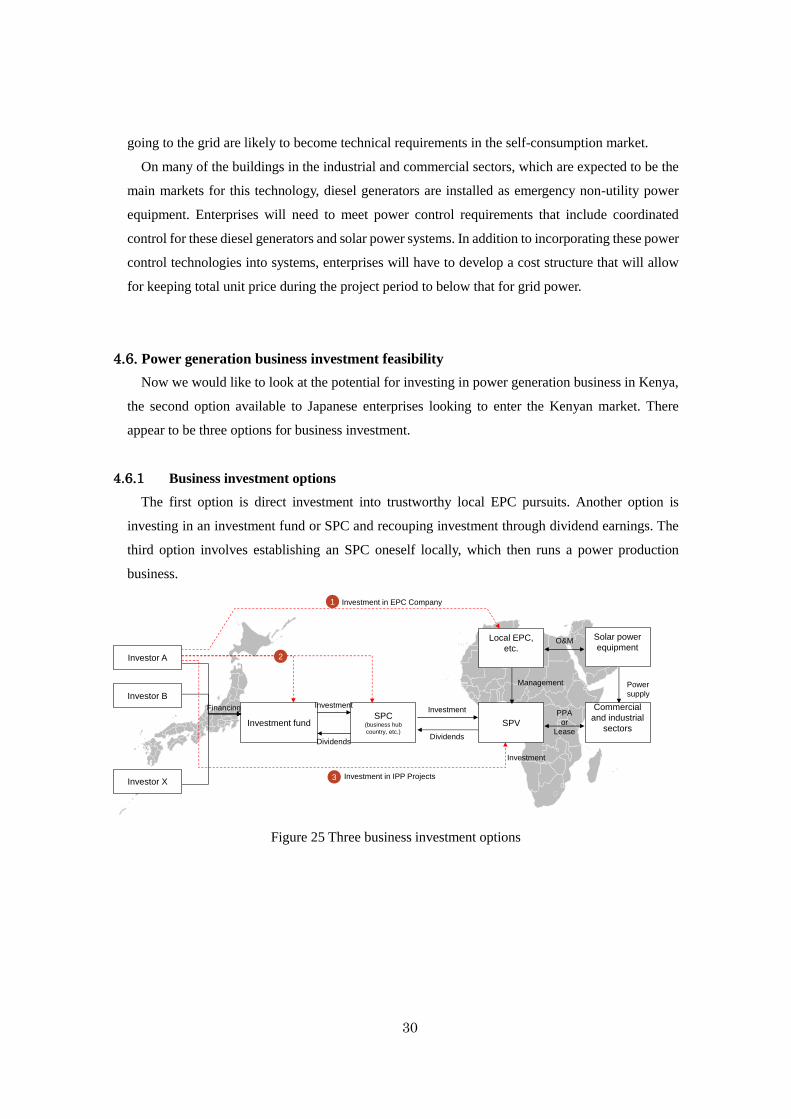
4.6.1 Business investment options
The first option is direct investment into trustworthy local EPC pursuits. Another option is
investing in an investment fund or SPC and recouping investment through dividend earnings. The
third option involves establishing an SPC oneself locally, which then runs a power production
business.
Figure 25 Three business investment options
Investor A
Investor B
Investor X
Investment fundSPC
(business hub
country, etc.)
Commercial
and industrial
sectorsSPV
Local EPC,
etc.
Investment
Dividends
Financing
1
2
Investment
Management
O&M
Investment
Dividends
PPA
or
Lease
Solar power
equipment
Power
supply
3
Investment in EPC Company
Investment in IPP Projects

31
The pros and cons of each option are shown below.
Table 10 Business investment option pros and cons
No. Option Pros Cons Challenges
1 Invest in EPC
Do not assume technical
risks (power plant
equipment risk) during the
power generating period.
Assume construction
completion risks, etc.;
earnings following
construction completion are
assured
As more projects
means more revenues
and expenses, the
effects of changes in
the economy and to
approval systems are
received directly
Finding trustworthy EPC
partners and making
investments
2 Invest in funds
Can hedge all business risks
associated with generating
power
Contract out to fund
managers operations such as
project monitoring
Is an investment
business, so business
growth potential is
limited (e.g. new
business created out of
power generation
business)
Finding good funds in
terms of investment
performance in the
renewable energy field
3
Invest in
power
generation
projects
(SPVs)
Can make earnings through
power generation business
based on stake.
Can expect stable CF
throughout the project
period
Will assume all
business risk
concerning the power
equipment, in addition
to all off-take, political,
and other risks
Minimizing business risk
and achieving a good cost
performance balance
4.6.2 Interview concerning feasibility of investment by Japanese enterprises
Based on the results of our studies and analyses so far, we held an exchange of views with
Japanese private-sector IPP enterprises concerning the feasibility of conducting renewable power
generation business in Kenya.
All were in agreement that non-payment risks and off-take risks were salient business risks. Given
the high price of electricity in Kenya, all enterprises were interested in self-consumption as a
solution that uses renewable energy. However, the fact that there is no network of trustworthy
enterprises in the country is a major hurdle to serious consideration of doing business in the market.

32
Many also said they may hesitate to invest in the country because of the existence of a feed-in
tariff system in Japan. The enterprises have renewable energy businesses in both Japan and other
countries, and the IRR in Japan and other countries are 5% and 15%, respectively. Under Japan's
feed-in tariff system, 20 years of revenue from sales of electric power is guaranteed for commercial
solar power systems. However, as previously discussed, power generation business in other
countries involves different risks than those in Japan, including off-take risk and political risk. In
order to invest outside of Japan, these enterprises therefore have to get upper managers on board by
explaining the grounds for and measures to accommodate the 10% IRR gap between Japan and
other countries. When unable to justify the 10% gap, they become unable to get the business going,
no matter how high the IRR may be.
4.7. Potential in off grid markets
4.7.1 Essence of hybrid mini-grid
In the areas where the extension of the national grid is difficult, the mini-grid system using diesel
generators is formed under the electrification policies that contribute to the improvement of living
standards of residents and local industrial development. However, electric power generation
systems that use fossil fuels lead to generation of greenhouse gas. Increases in fuel prices on a long-
term span are also concerned. In response to these issues, this FS proposes the implementation of a
hybrid mini-grid system in combination with a photovoltaic power generation system, which is a
renewable energy system (not including storage battery).

33
4.7.2 Potential assessment of hybrid mini-grid
Figure 26 Distribution of Hybrid-Mini Grids
(Source: Kenya Power)
The Government of Kenya repeated negotiations with various donors. The AFD (French Agency
for Development) decided to provide a low-interest loan of 30 million euros (approximately 4
billion yen) in 2013 for 23 sites in the map shown below. “Number 3, Lodwar” in the table below
is scheduled to expand the solar power generation system with a grant aid from NORAD
(Norwegian Agency for Development Cooperation).

34
Table 11 Hybrid Mini-Grids Plan4
4 AFD(African Solar Designs and Marge) “AFD Feasibility Study for an Off- Grid
Programme in Kenya”, June 2014
DIESEL
CAPACITY
(KW)
SOLAR PV
(KW)
WIND
(KW)
SOLAR PV
(KW)
WIND
(KW)
1 MANDERA 1,600 350 0 200 0
2 WAJIR 3,400 0 0 800 300
3 LODWAR 1,440 60 0 250 0
4 HOLA 800 60 0 100 0
5 MERTI 128 10 0 100 100
6 HABASWEIN 360 30 50 100 0
7 ELWAK 360 50 0 100 0
8 BARAGOI 128 0 0 100 100
9 MFANGANO 520 11 0 100 0
10 RHAMU 184 0 0 50+50 0
11 ELDAS 184 0 0 30+70 0
12 TAKABA 184 0 0 50+50 0
13 LOKICHOGGIO 640 0 0 80+70 0
14 LOKORI 184 0 0 150 0
15 FAZA 360 0 0 100 100
16 KIUNGA 230 0 0 150 0
17 HULUGHO 230 0 0 150 0
18 LAISAMIS 184 0 0 80 0
19 NORTH HORR 184 0 0 100 100
20 LOKITANG 184 0 0 150 0
21 DADAAB 640 0 0 200 0
22 MAIKONA 640 0 0 100 100
23 LOKIRIAMA 0 0 0 150 0
24 BANISA 0 0 0 100 100
12,764 571 50 3,730 900
NUNBER STAION NAME
EXISTING PROPOSED
for AFD
TOTAL

35
Concerning solar power generation systems and wind power generation systems in these 23 sites,
the material and technology to be adopted will be decided through tenders held by REA (Rural
Electrification Authority). For the time being, aggregate 3.5 MW solar power (without 3 Lodwar
site) generation indicated in this plan is the potential of hybrid mini-grids.
In addition to the support from AFD and NORAD, other funding from KfW(Reconstruction
Credit Institute, Germany), GIZ(German Federal Enterprise for International Cooperation)、World
Bank, DFID(Department for International Development, UK) , USAID and Embassy of Spain are
planning to provide supports to hybrid mini-grids. REA has identified over 100 sites and there will
be huge markets of renewable energy in rural electrification by the hybrid mini-grids.
4.8. Conclusion
The table below summarizes the overall direction for rural electrification and getting into IPP
business in Kenya using Japanese renewable technologies. We examined opportunities and
challenges for each market segment with respect to options for doing business (selling systems to
power project enterprises and investing in renewable energy projects using SPC, etc.).

36
Figure 27 Evaluation of business options in Kenya's solar power market
On gridOff grid
50
0kW
to
40
MW
Pro
jec
t
Cap
acity
10
0kW
to
MW
cla
ss
Be
low
10
0kW
10
0kW
To
MW
cla
ss
So
urc
e o
f
Pro
fit
Au
ctio
n s
tyle
FIT
(<K
SH
12/k
Wh)
Alte
rna
ting
“Die
sel G
en
se
t”
(K
SH
50
-
60
/kW
h)
Alte
rna
ting
“Ke
rose
ne”
Se
lf-
co
nsu
mptio
n
by re
pla
cin
g
“Grid
Ele
ctric
ity”
(K
SH
20/k
Wh)
Ne
t Mete
ring
(<K
SH
2.6
/kW
h)
Sta
tus
of M
ark
et
•“A
uctio
n s
tyle
FIT
” will b
e in
trod
uced
in
20
17
.
•F
rom
the
“Au
ctio
n s
tyle
FIT
” in S
ou
th
Afric
a, F
IT m
igh
t be
KS
H4
to 6
/kW
h.
•B
idd
ers
ha
ve
to s
ho
w “c
om
pe
titive
FIT
”
by d
eve
lop
ing
larg
e s
ca
le p
roje
cts
.
•O
pp
ortu
nitie
s o
f “roo
f top
insta
llatio
n” a
t
co
mm
erc
ial s
ecto
rs a
nd in
du
stria
l secto
rs.
(so
me
sh
op
pin
g m
alls
insta
lled
so
lar)
•T
he
issu
e is
“Se
cu
re th
e in
itial c
ost”.
Le
ase
mo
de
l by P
PA
ag
ree
me
nt m
igh
t
be
a g
oo
d s
olu
tion
.
•H
yb
ridiz
atio
n (S
ola
r + G
en
se
tse
tc) a
nd
co
ntro
lling
syste
m w
ill be
req
uire
d.
•N
et m
ete
ring
po
licy m
igh
t be
a d
rive
of
“roo
f top
insta
llatio
n”
•H
yb
rid s
yste
m (S
ola
r + G
en
se
ts) is
ma
in
op
tion
. Co
ntro
lling
syste
m w
ith “A
nti
reve
rse
cu
rren
t” an
d “M
atc
hin
g w
ith
de
ma
nd
s” w
ill be
req
uire
d.
•P
roje
ct w
ith p
ub
lic s
ecto
rs w
ill attra
ct
“inte
rna
tion
al s
up
po
rt” e.g
. Irriga
tion
,
Ru
ral e
lectrific
atio
n.
•S
ola
r lan
tern
s a
re p
en
etra
ting
into
off-
grid
are
as.
Hard
we
ar / S
ys
tem
●C
om
pe
tition
of “E
PC
pric
e”
“Au
ctio
n s
tyle
FIT
”
●L
arg
e s
ca
le p
roje
cts
will
ha
ve
ad
va
nta
ge
. Ho
we
ve
r,
securin
g la
nd a
nd O
&M
will b
e c
ha
llen
ge
s.
○N
ee
ds o
f co
ntro
lling s
yste
m
(So
lar+
Ge
nse
t, Ma
tch
ing
with
De
ma
nd
s)
○P
roje
ct w
ith p
ub
lic s
ecto
rs to
ob
tain
“inte
rna
tion
al s
up
po
rt”
an
d s
ecu
re in
itial c
ost.
●C
ost o
f Ja
pa
ne
se
So
lar
pro
du
cts
/syste
m
○N
ee
ds o
f co
ntro
lling
syste
m (S
ola
r+G
en
se
t,
Ma
tch
ing
with
De
ma
nd
s)
○H
igh
effic
ien
cy o
f So
lar to
limite
d p
roje
ct s
ite
○T
ech
nic
al p
rop
osa
l with
se
cu
ring
initia
l co
st w
ill be
acce
pta
ble
●C
ost o
f Ja
pa
ne
se
So
lar
pro
du
cts
/syste
m
ー
×○~◎ ○-
Inve
stm
en
t to b
usin
es
s
○In
vestm
en
t as a
min
or s
ha
re
ho
lde
rs o
f pro
jects
●L
arg
e s
ca
le p
roje
ct in
ord
er to
bid
co
mp
etitiv
e F
IT
●L
oca
l bra
nch
will b
e re
qu
ired
to
de
ve
lop
larg
e p
roje
cts
.
○P
ub
lic fin
an
ce
/ Inte
rna
tion
al
su
pp
ort w
ill de
cre
ase
the
off
take
rs ris
k.
●W
e c
an
’t invest in
Gra
nd p
roje
ct.
○A
ctiv
e m
ark
ets
with
“hig
h
ele
ctric
ity ta
riff”.
○P
roje
ct d
eve
lop
me
nt w
ith
fore
ign
inve
stm
en
t to s
ecu
re
the in
itial c
ost.
●P
artn
er s
hip
with
loca
l EP
C o
r
fore
ign
inve
sto
rs
●O
ff take
rs ris
k, E
PC
risk, O
&M
risk.
ー
△○ ○-
Eva
lua
tion
an
d C
om
me
nts
“O
pp
ortu
nity
” a
nd
“C
ha
llen
ge”
Ou
tline
of S
ola
r PV
bu
sin
es
s in
Ke
nya
Ke
y:○:O
pp
ortu
nity
●:C
ha
llen
ge
Eva
lua
tion
an
d C
om
me
nts

37
Business in the power generation products and services market
Looking first at system sales business, diesel power alternatives in the off-grid market appears to
be the most attractive business option here.
However, the most competitive area appears to be the 500 kW or greater utility-scale market.
Although revenues and expenses can be more easily forecasted in power sales businesses operating
under a feed-in tariff system, keeping power costs low requires controlling total operating expenses
(initial investment + interest + operation and maintenance costs) incurred during the project period.
This effectively means Japanese system sellers negotiating on price with foreign system sellers to
keep initial investment low. According to a report published by IRENA in September 2016, there is
already a nearly 40% price difference between solar panels made in Japan and those made in China.
Given the likelihood of a price war with system sellers dealing in low cost panels under auction
systems, Japanese panel costs will need to come down even further if Japanese renewable energy
technologies are to be deployed in the utility-scale market.
Investment in power generation business
We next examine investment in renewable energy businesses in Kenya. There appear to be
opportunities here in areas that include investing in grid-connected, self-consumption systems
operating under net metering, as well as investing in SPCs offering diesel-alternative solutions for
the off-grid market.
Competition is most fierce, however, in the aforementioned system sales business and utility-
scale market, making such business investment tricky. In Kenya, the successful development of
utility-scale projects, in particular, requires not only planning for the kinds of business risk so far
discussed but also building a network with local EPC enterprises and government officials.
Enterprises that do not have a network or business office with project development functions in
the country will need to expend time and manpower to build them first. This makes utility-scale
projects relatively unattractive for business investment.
There are other possible business opportunities in these two areas, but success will require
forming agreements to effectively avoid off-take risk, in addition to having partners that can
faithfully and properly provide O&M services during the project period.

38
5. Potential of GHG reduction by proposed projects
5.1. Potential assessment of Irrigation sector
5.1.1 Proposed Methodology KE_PM002
In Kenya, a draft mmethodology “KE_PM002 Installation of Solar PV System” was
published under the JCM procedure on 2nd March 2017. The scope of GHG emission
reduction measures is “Displacement of grid electricity and/or captive electricity using fossil
fuel as a power source by installation and operation of the solar PV system(s)”. When we
successfully develop the proposed project under JCM scheme, we will apply this methodology.
5.1.2 Reference emission
KE_PM002 defines the emission factor as 0.533 tCO2/MWh. This emission factor is
lower than 0.5793 tCO2/MWh as the build margin calculated at that time addressed in the report
published by the National Environment Management Authority of Kenya (NEMA 2014).
The back ground of this consideration is that almost all of the electricity generated by “non
renewable and hydro power plants” which emits GHG was sourced from diesel. To ensure net
emission reductions, KE_PM002 uses conservative emission factor. The most efficient diesel
generator in the world has a generation efficiency close to 49%. A power generation efficiency
of 49% translates into an emission factor of 0.533 tCO2/MWh.
5.2. Estimation of GHG reduction by proposed projects
In the case of solar power generation, Project Emission (PE) is 0 (zero). And the amount of
Reference Emissions (RE) is equal to GHG reduction.
[Reference emissions]
REp Reference emissions during period p[tCO2/p]
EG i,y Quantity of electricity generated by project solar PV system i during
period p[MWh/p]
EFRE Reference CO2emission factor [tCO2/MWh]

39
5.2.1 Potential of GHG reduction by proposed projects
The table below shows the potential of GHG reduction by proposed projects in this study.
Table 12 GHG reduction by the proposed projects
Projects
Solar System
Capacity
(kW)
Electrity from
Solar system
(MWh/year)
GHG Reduciotn
(t-CO2/year)
1Mwea Rice Mills
*Under current factory loads311.04 285.2 152.0
2
Mwea Rice Mills
*Under the scenario Factory loads are
maximized
311.04 524.3 279.4
3 Galana and Kulalu Ranch project 3,000.00 5,056.6 2,695.2
4 Future potential at rice mills in Kenya 1,057.00 1,781.6 949.6
5Rural Electrification
(Hybrid Mini Grid)3,500.00 5,899.4 3,144.4
Step 3 6Future potential in Private sector
(roof tops of factries, mall etc)900,000.00 1,516,987.8 808,554.5
Total(2+3+4+5+6) 907,868.04 1,530,249.8 815,623.1
Step 1
Step 2
[Project emissions]
PEp Project emissions during period p [tCO2/p]
[Emissions reductions]
ERp Emission reductions during period p[tCO2/p]
REp Reference emissions during period p[tCO2/p]
PEp Project emissions during period p[tCO2/p]

40
6. Issues and opportunities on project development
Chapter 4 examined the possibilities for solar power business in Kenya and laid out two possible
avenues: 1. deploying equipment, systems, and other hardware, and 2. investing in projects. This
chapter looks at issues Japanese companies may face when getting into the solar power business in
Kenya and lays out a strategy for solving these issues and expanding business opportunities.
6.1. Issues involved in launching a business
6.1.1 Issues concerning business investment/capitalization
Focusing first on the subject of business investment, IPP businesses in Japan and energy or
infrastructure-related businesses that are already doing business overseas are among the companies
with a strong desire to invest in business in Kenya.
There are two risks with the potential to hinder business investment or capitalization in Kenya:
1. the lack of a business network, and 2. off-take risk.
Regarding 1., a comparison to Asian countries makes it clear that fewer Japanese companies are
doing business in Africa. Even companies interested in Africa do not even have agencies in the
region, let alone offices. This situation makes it extremely difficult to get local information, look
for potential partner companies, and then construct and execute a project. Simply put, Africa is still
a long way off for Japanese companies.
With respect to off-take risk, enterprises will need to carefully consider project owners' solvency.
In Kenya, there is a method for mitigating this-offtake risk by shortening the payback period for
initial investment to two or three years. However, there is a limited range of businesses where this
kind of short-term initial investment can be achieved, and it is very difficult to use this model for
solar power and other energy-related business.
6.1.2 Issues concerning the deployment of equipment, systems, and other hardware
Let us next analyze the issues involved in deploying equipment, systems, and other hardware.
We conducted a SWOT analysis (see figure below) focused on the entry of Japanese solar power
equipment manufacturers and EPC businesses into the Kenyan market.
The results point to cost as being the biggest issue with respect to Japanese solar power systems.
In light of this, and because the auction-determined feed-in tariffs to be conducted beginning in
2017 are likely to result in an EPC price war, deploying Japanese solar power systems will
unfortunately be rather difficult.
On the other hand, with respect to the use of self-consumption oriented solar power and solar
power for rural electrification, the linear control discussed here will have an advantage. Lowering
EPC prices is something that must be done, but reliable solar power systems and control systems

41
are areas where Japanese companies enjoy major advantages.
Especially in rural, off-grid areas, costly-to-run diesel generators are a necessity for electrification.
Consequently, it is conceivable that EPC costs under solar panel business will exceed those for
projects using FIT schemes. Because of the nature of off-grid areas, EPC costs are set high due to
the technical requirements, which include the need for hybrid diesel-solar systems. This project
would therefore be a good market entry project for Japanese companies.
6.2. Specific actions for establishing a business
In light of the issues described above, the following discussion focuses on specific actions for
conducting solar power business by Japanese companies in Kenya. Japanese companies should
begin in the public sector in order to demonstrate their technological advantages and, in the process,
build a steadfast EPC structure locally. After building a solid EPC structure, these companies can
ultimately launch private solar power businesses in Kenya with capitalization from Japan.
Figure 28 Future actions for business development
6.2.1 Japanese companies' advantages
Like the linear control and other technologies described in Chapter 3, Japanese companies hold
technical advantages when it comes to solar power systems. After these advantages are leveraged
in the Kenyan market, they need to be effectively advertised. Using solar power equipment with
low degradation rates, for example, can help avoid dramatic losses in cumulative cash flow over the
project's entire lifecycle. Another major benefit is the fact that using linear control brings solar
power equipment uptime to over 90%, whereas existing system uptime is only 25%.
[STEP1]Pilot project
MRM “Solar Pilot project”by LCET and JCM
[STEP2]Project withpublic sectorRenewable energy projectin Public sector with International support
[STEP3]Project with Japanese investmentProject development with investment from Japan.We will develop solar projects not only “Public sector”, but also "Private sector”.

42
It should also be made clear that, especially with projects conducted in the public sector, the
emphasis should be on the long-term durability and reliability of the equipment, as well as the
trustworthiness of the technologies themselves. In the case of business by private enterprises, there
is no need to extend project periods as long as initial investment is paid back and profits are
generated. Consequently, greater emphasis is often placed on EPC cost than on the long-term
reliability of solar power systems. Nevertheless, the goal of public sector projects is not to achieve
a return on investment but to maximize the benefits of solar power through long-term usage of the
equipment. Japanese enterprises need to conduct pilot projects and other efforts in order to show
the public sector the advantages of Japan's solar power systems.
6.2.2 Carrying out projects through international support
When promoting Japanese enterprises' solar power systems to the public sector, the JCM, LCET
Programme, and GCF (Green Carbon Fund) are some of the means available for acquiring
international support.
As discussed in the previous sub-section, the reliability of solar power systems over extended
project periods is highly compatible with the aims of public sector projects. Furthermore, public
sector projects solve development problems in Kenya and are therefore highly likely to receive
international support. Specifically, it may be effective to use international support to provide
renewable energy for irrigation projects in off-grid areas as currently being considered by the NIB,
and to get involved with hybrid/mini-grid projects being conducted by the REA (Rural
Electrification Agency) that have already received support from multiple countries.
Enterprises can also conduct technology transfers and provide EPC advisement and education
when conducting public sector projects with international support. When a country has poor
capabilities in terms of EPC, the involvement of Japanese engineers becomes all the more critical,
causing costs to increase. When carrying out projects, enterprises that are able to improve local EPC
capabilities will be able to specialize in the E (Engineering) of EPC in Japan and lower their EPC
costs. The goal is to localize Japanese-style EPC and build a low-cost, high-quality EPC structure.
6.2.3 Carrying out projects with investment from Japan
If the actions discussed in the previous subsection are taken into consideration, the Kenyan
market should seem attractive to the Japanese investor. International support and collaboration with
the public sector will drive down off-take risk. Moreover, low-cost, high-quality EPC systems can
mitigate project risk. Japanese private sector investment can therefore bring about substantial
opportunities for public sector business.
This would ultimately improve connections between Japanese enterprises and the Kenyan market
and would expand networks. The lack of a good network in the region, a risk for Japanese investors,

43
would also be remedied. It would also better pave the way for business in the private sector, which
holds the greatest possibilities for business.
6.3. Best practices in Thailand
Let us look at Thailand-based SPCG as a model for how it may be possible to start businesses in
Kenya in the future.
SPCG operates a solar power business in Thailand that provides 250 MW of output. The company
is committed to using Kyocera-brand power generation modules for its solar power systems.
Its 250 MW-plus project makes use of feed-in tariffs and the company has received funding as
an IPP. In recent years, it has installed solar panels on, among other places, the roofs of plants and
commercial facilities as part of efforts to further develop the self-consumption oriented project. The
company has entered into agreements with and received extensive investment from Japanese
companies, among other organizations.
In this way, enterprises that utilize Japanese technologies and that have a good handle on EPC
can join with partners capable of expanding their business to grow the solar power market in Kenya.
Lastly, we would like to share the response we received regarding why SPCG's president
continues to use Kyocera-brand solar power modules:
"If your child was sick, you would no doubt do everything in your power to take him to the most
competent hospital. Solar power projects are my children — I will spend the next 10 or 20 years
raising my children. Using high-quality products to ensure the prosperous future, this is a matter of
course for any parents."
Figure 29 Introduction of SPCG by UNFCCC5
5 http://unfccc.int/secretariat/momentum_for_change/items/8693.php

44
7. Utilizing the JCM in the Future
7.1. The JCM as a motivating factor for business in Kenya
7.1.1 Paris Agreement and Kenya's INDC
The Paris Agreement was adopted at COP21 on December 12, 2015. The key point of the
agreement is that "all developed and developing countries establish targets to reduce greenhouse
gases and work towards their achievement".
Before the Paris Agreement was made, Kenya submitted its new climate action plan, an Intended
Nationally Determine Contribution (INDC), on July 31, 2015. In essence, it seeks to "reduce CO2
emissions to 30% below the BAU level in 2030", and states that "it is necessary to have international
support in the form of things such as finance, investment, technology development and transfer, and
capacity building". If Kenya is going to need projects that achieve specific CO2 emission reductions,
action will need to be taken to gain international support for these endeavors.
7.1.2 Improving MRV capability through the use of the JCM
Through this survey, the "importance of promoting a better understanding of the JCM as
preparation for acquiring international support for reducing CO2 emissions" has been repeatedly
explained based on the background described in the previous subsection. After explaining that there
are limits to existing support and development schemes being put forth to resolve issues hindering
development in Kenya, it was explained that international support could be obtained if the concept
of reducing CO2 emissions were raised as a development subjects.
As a strategy for obtaining international support, we proposed building the capabilities of MRV
(Monitoring, Reporting, and Verification), which seeks to reduce CO2 emissions, by conducting
projects under the JCM scheme. The international community is looking for projects aimed at
reducing CO2 emissions not only in Africa but around the world. By showing its MRV capability
through JCM projects, Kenya can gain an advantage over other countries with respect to obtaining
international support.
Kenya and Japan agreed on the development of JMC. Efforts must be made to better motivate the
host country with respect to making broader use of the JCM. Specific actions must of course be
taken, including conducting feasibility studies and pilot projects, organizing JCM projects, and
expanding JCM projects under the leadership of the private sector. But a strong commitment from
both the public and private sectors in Japan are also needed.
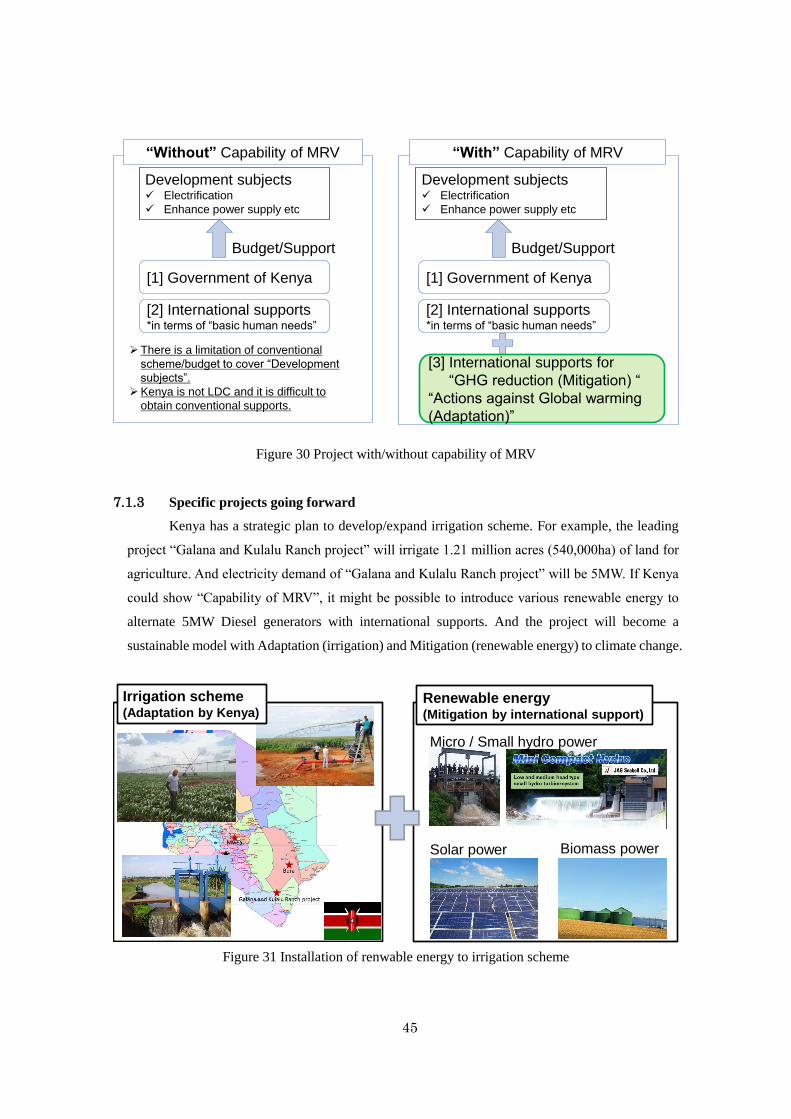
45
Figure 30 Project with/without capability of MRV
7.1.3 Specific projects going forward
Kenya has a strategic plan to develop/expand irrigation scheme. For example, the leading
project “Galana and Kulalu Ranch project” will irrigate 1.21 million acres (540,000ha) of land for
agriculture. And electricity demand of “Galana and Kulalu Ranch project” will be 5MW. If Kenya
could show “Capability of MRV”, it might be possible to introduce various renewable energy to
alternate 5MW Diesel generators with international supports. And the project will become a
sustainable model with Adaptation (irrigation) and Mitigation (renewable energy) to climate change.
Figure 31 Installation of renwable energy to irrigation scheme
“Without” Capability of MRV
Development subjects Electrification
Enhance power supply etc
[1] Government of Kenya
[2] International supports*in terms of “basic human needs”
Budget/Support
There is a limitation of conventional
scheme/budget to cover “Development
subjects”.
Kenya is not LDC and it is difficult to
obtain conventional supports.
Development subjects Electrification
Enhance power supply etc
[1] Government of Kenya
[2] International supports*in terms of “basic human needs”
Budget/Support
[3] International supports for
“GHG reduction (Mitigation) “
“Actions against Global warming
(Adaptation)”
“With” Capability of MRV
Irrigation scheme(Adaptation by Kenya)
Renewable energy(Mitigation by international support)
Micro / Small hydro power
Solar power Biomass power

46
8. Conclusion: Strategic engagement about JCM development
The following box shows the “Strategic engagement about JCM development in Kenya”. This
“Strategic engagement” is based upon the discussion in the previous chapters.
1. Irrigation sector
Sustainable agriculture by liking development subjects with GHG reduction
Installation of “Solar power system by linear controlling” to existing/new rice mills
and irrigation schemes
2. Energy sector
With regard to Solar power “Assurance of performance for 20 years based on long
term experience” should be required.
Reliable control system should be introduced off-grid areas where electricity is
supplied by grid power, diesel generators and renewable energy.
Attractive policy to activate the solar power market in Kenya
3. Implementation of JCM
Kenya could enjoy the reliable/durable Japanese low carbon technology
Promoting JCM in order to contribute to the INDC, or to abate its GHG emission by
30% by 2030 with international supports