Embed Size (px)
Citation preview

Acta Cryst. (2008). A64, 135–148 doi:10.1107/S0108767307061181 135
feature articles
Acta Crystallographica Section A
Foundations ofCrystallography
ISSN 0108-7673
Received 4 September 2007
Accepted 20 November 2007
# 2008 International Union of Crystallography
Printed in Singapore – all rights reserved
High-pressure crystallography
Andrzej Katrusiak‡2
Faculty of Chemistry, Adam Mickiewicz University, Grunwaldzka 6, 60-780 Poznan, Poland.
Correspondence e-mail: [email protected]
Since the late 1950’s, high-pressure structural studies have become increasingly
frequent, following the inception of opposed-anvil cells, development of
efficient diffractometric equipment (brighter radiation sources both in
laboratories and in synchrotron facilities, highly efficient area detectors) and
procedures (for crystal mounting, centring, pressure calibration, collecting and
correcting data). Consequently, during the last decades, high-pressure crystal-
lography has evolved into a powerful technique which can be routinely applied
in laboratories and dedicated synchrotron and neutron facilities. The variation
of pressure adds a new thermodynamic dimension to crystal-structure analyses,
and extends the understanding of the solid state and materials in general. New
areas of thermodynamic exploration of phase diagrams, polymorphism,
transformations between different phases and cohesion forces, structure–
property relations, and a deeper understanding of matter at the atomic scale in
general are accessible with the high-pressure techniques in hand. A brief history,
guidelines and requirements for performing high-pressure structural studies are
outlined.
1. Introduction
X-ray structural diffraction studies revolutionized material
sciences: chemists, physicists and biologists looked at their
substances of interest at the atomic level (Pauling, 1939),
which allowed them to understand the properties of matter
and to predict new properties of other structures. Up to now,
over half a million structures have been determined, most of
them at ambient conditions and at low temperature. The
justification for performing structural analyses at ambient
conditions is very simple – we live and apply most materials at
ambient conditions (ca. 295 K and 0.1 MPa).1
Conditions that are considerably different from those of the
human environment are described as extreme conditions. The
development of science and technology increasingly relies on
technologies involving extreme conditions, like extrusion of
metal capillaries, syntheses of super-hard materials (Huppertz,
2004; Kim et al., 2007), production of components of jet
engines and spacecraft coatings, and also in the search for new
polymorphic forms of drugs (Boldyreva, Shakhtshneider,
Ahsbahs, Sowa & Uchtmann, 2002; Boldyreva, Shakht-
shneider, Ahsbahs, Uchtmann et al., 2002), pigments and
energetic materials (Fabbiani & Pulham, 2006). For many
years, variation of temperature has been the main manner
of changing thermodynamical conditions in technological
processes and structural studies. Of all 404800 organic and
organometallic structures deposited in the Cambridge Crys-
tallographic Database Centre (CCDC, 5.28 Version released
in January 2007), 134405 structures were measured below
283 K (40546 below 150 K, 1517 below 90 K and 82 below
5 K), and only 596 above 303 K. There are various reasons for
lowering temperature in structural investigations, mainly as a
routine procedure to reduce atomic thermal vibrations and
obtain more precise structural data, or to investigate phase
transitions and low-temperature phases, or to crystallize and
analyse substances which are liquid, gaseous or unstable at
normal conditions. Some studies were performed as a function
of other thermodynamical variables, like chemical composi-
tion or electrical field. Only about 100 structures of organic
compounds deposited in CCDC were determined at elevated
pressure. The number of CCDC entries with the pressure
descriptor in 2007 (350 entries) doubled from 2005 (174
entries) and tripled from 2000 (123 entries). Although a larger
number of elements, minerals and inorganic compounds were
studied at high pressures, the fraction of all crystals investi-
gated at elevated pressure is still very low.
Initially, those most interested in matter at high-pressure
conditions were geoscientists and astrophysicists. Most of the
matter of Earth and of the Solar System is exposed to very
high pressure. For example, the pressure at the centre of the
Earth is estimated as 364 GPa, in Saturn 2500 GPa, in Jupiter
4000 GPa and in the Sun 15000000 GPa, not to mention the
neutron stars (about 1026 GPa). Geoscientists are interested in
the formation of rocks and minerals, their high-pressure
phases, compressibility, dynamics of transformations at
earthquakes, and propagation of seismic waves. Pressure is
‡ In memory of Dr Igor Goncharenko (1965–2007).1 The SI pressure units, Pascal = Newton metre�2 (Pa = N m�2), are used inthis paper. The atmospheric pressure at sea level is approximately 0.1 MPa =1 bar.

highly efficient for generating phase transitions and new
phases, for triggering new chemical reactions, conformational
and structural transformations of molecules, polymerization,
phase transitions, polymorphism and structure–property
relations, which are of interest to chemists and physicists. The
knowledge of stability of substances at extreme conditions is
still far from complete: it is difficult to generally predict
pressure-generated reactions and transformations. Many of
them are relevant to materials sciences or geosciences. For
example, gas hydrates stable at high pressure (Kuhs, 2004;
Dyadin et al., 1994; Shimizu et al., 2002) constitute most of the
carbon fuels on Earth, and the composition of the Earth’s core
and the interiors of large planets still remain to be investi-
gated. It is generally believed that at sufficiently high pressures
all substances become metallic; in some substances, pressure
can induce superconductivity (e.g. boron, lithium, silicon,
sulfur, oxygen) and enhance or suppress superconductivity in
others (Gauzzi et al., 2004; Hemley, 1998; Edvards & Hensel,
1997; Struzhkin et al., 1997). Transformations of protein
structures and their high-pressure stabilization are of interest
to biologists (Kundrot & Richards, 1986; Katrusiak & Dauter,
1996; Barciszewski et al., 1999; Kunz, 2001; Gruner, 2004;
Fourme et al., 2004; Girard et al., 2007).
It is now apparent that pressure can considerably contribute
to a better understanding of many condensed-phase
phenomena, and in numerous projects researchers naturally
progress toward high-pressure experiments (Hemley &
Ashcroft, 1998). One of the best-known examples is the
stability of H2O ice: at ambient pressure, only hexagonal
P63/mmc phase Ih and cubic Fd3m symmetric phase Ic are
known to be stable to lowest temperatures,2 while at elevated
pressures ten other phases have been discovered (Lobban et
al., 1997).
Meanwhile, for years, high-pressure structural studies were
hindered by technical difficulties, caused by the access to the
sample through the thick walls of the environment vessels.
Thus, in most high-pressure experiments macroscopic prop-
erties of substances were measured (Bridgman, 1949), whereas
diffraction studies were scarce and required large and
cumbersome installations (Kabalkina & Vereshchagin, 1960;
Kabalkina & Troitskaya, 1961).
The most remarkable breakthrough in high-pressure
research was triggered by the invention of the diamond-anvil
cell in 1958 (Jamieson et al., 1959; Weir et al., 1959). Other
inventions and discoveries made in high-pressure method-
ology soon followed. Now researchers have convenient
methods for generating pressure, which can be applied for
various probing techniques in their laboratories and dedicated
beamlines in synchrotron and neutron facilities (Hazen &
Finger, 1982; Eremets, 1996; Holzapfel & Isaacs, 1997;
Katrusiak & McMillan, 2004). Indeed, following the inception
of the diamond-anvil cell (DAC) and developments of X-ray
diffraction techniques, the number of structural determina-
tions at high pressures steadily increases every year. The DAC
is also used to perform complementary studies, like electric
conductivity, magnetism (Goncharenko, 2004), optical,
Raman, IR, X-ray absorption, Mossbauer (Pasternak et al.,
2004) and NMR (Lee et al., 1987; Bertani et al., 1990, 1992)
spectroscopies. At the same time, the development of
diffractometers and high-pressure methodology over the last
decades considerably facilitated the high-pressure experi-
ments. The principal aim of this paper is to summarize selected
achievements of high-pressure crystallography, to present
some details of the high-pressure equipment that can be
installed in most X-ray diffraction laboratories, and to exem-
plify some of possible structural transformation induced by
pressure in crystals.
2. Some facts about the diamond-anvil cell (DAC)
2.1. Historical background
In hindsight, the construction of the DAC appears very
simple and its operation obvious. It is amazing that such a
small, plain and elegant device is capable of generating the
highest static pressures achieved in a laboratory. Moreover, it
seems that all the knowledge necessary for the DAC invention
was known and published by P. W. Bridgman.3 He formulated
the principle of massive support (Bridgman, 1937),
constructed the opposed-anvils apparatus (so called Bridgman
anvils) capable of generating a pressure of 10 GPa (Bridgman,
1950, 1952), and used a pipestone gasket for sealing and
preventing extrusion of the sample from between the anvils.
However, his anvils were large and made of carboloy (tung-
sten carbide cemented in cobalt), a material very hard and
heat-resistant but in many respects inferior to diamond. Other
milestones that led to the DAC invention were:
(i) application of diamond in high-pressure devices (Lawson
& Tang, 1950; Jamieson, 1957);
(ii) designs of the opposed-diamond-anvils cell (DAC)
(Jamieson et al., 1959; Weir et al., 1959);
(iii) application of a metal gasket in the DAC for obtaining
hydrostatic pressure conditions (van Valkenburg, 1962);
(iv) invention of the ruby-fluorescence method for pressure
calibration (Forman et al., 1972).
There were a considerable number of other very important
developments, without which the DAC would not be such a
versatile apparatus as it is today (for reviews, see Hazen &
Finger, 1982; Jayaraman, 1983; Ahsbahs, 1987; Eremets, 1996;
Holzapfel & Isaacs, 1997; Katrusiak & McMillan, 2004).
2.2. The key issue of right materials
The heart of any DAC is built of diamond. For ages,
diamond has been known as the hardest material and assigned
the highest grade of 10 on the Mohs scale. However, the jump
to the next-hardest on the Mohs scale, corundum (grade 9), is
feature articles
136 Andrzej Katrusiak � High-pressure crystallography Acta Cryst. (2008). A64, 135–148
2 Ice Ih doped with KOH at 72 K transforms following the onset of the H-atomordering (Kawada, 1972) to the orthorhombic polar structure, space groupCmc21, often described as ice phase XI (Line & Whitworth, 1996; Jackson etal., 1997).
3 Percy Williams Bridgman (1882–1961), a Professor of Harvard University inCambridge, Massachusetts, dedicated his research to high-pressure physics,thermodynamics and philosophy; in 1946, he was awarded the Nobel Prize forhis achievements in high-pressure research.
a large one (Brazhkin et al., 2002). On the Knoop hardness
scale, diamond is several times harder than corundum – on this
absolute scale, the hardness of corundum is much closer to
that of talc and graphite (grade 1 on the Mohs scale) than to
diamond; and the resistance of diamond to abrasion (about
140000 on the Rosiwal scale) is over two orders of magnitude
higher than that of corundum (1000). Thus, with respect to its
hardness, diamond is the most suitable material for high-
pressure cell construction. It also has other advantages: low
absorption of short X-rays, linear absorption coefficient
�diamond(Mo K�) = 0.202 mm�1, excellent transparency for
visual radiation, and good transparency for UV and IR
wavelengths (type IIA diamonds with low nitrogen content).
Although diamonds are considered expensive, the cost of a
typical DAC for X-ray diffraction, equipped with flawless14 carat brilliant anvils, amounts to a mere few percent of that
of either a low- or a high-temperature attachment.
The DAC is a unique construction of the most advanced
apparatus of its kind, ingenious and elegant in its simplicity,
the most essential parts of which were well known to nearly
everyone – the flawless brilliants like those in rings or jewel-
ler’s shops (Fig. 1). For X-ray diffraction applications, the
diamond anvils are often mounted on beryllium discs, which in
turn are centred in a steel vice with conical windows, like in a
miniature Merrill–Bassett cell shown in Fig. 2 (Merrill &
Bassett, 1974). The linear absorption coefficient for beryllium
is very low for molybdenum radiation, �Be(Mo K�) =
0.048 mm�1, however the beams passing through the discs
increase the background, produce powder diffraction rings
and beryllium softens at about 500 K, which hampers appli-
cations at high temperature. Beryllium is also expensive and
its oxide is poisonous. Therefore, the anvils are often mounted
directly on the steel edges of the conical windows (Konno et
al., 1989). The central hole in the beryllium disc or the conical
window in the steel backing plates give convenient access for
optical observations and spectroscopic measurements. The
small volume of the DAC chamber eliminates any risk of
explosions, associated with much larger cylinder-and-piston
devices.
Up to today, flawless low-birefringence type IA 14 carat
(1 carat = 0.2 g) brilliant diamonds with a phased culet are
most often used in DAC’s (Fig. 1). In fact, the anvils of the first
DAC’s were gems confiscated from smugglers by customs
agents and donated for research purposes (Piermarini, 2001).
Other than brilliant shapes of diamond anvils have been
designed in order to reduce the strains (which could result in
failure of the anvils when generating pressure) or to facilitate
mounting of the anvils. Some of these designs are illustrated in
Fig. 3. In the standard Drukker anvil, its shape has been
simplified and the table surface increased (Seal, 1984); the
Boehler–Almax anvil was optimized for supporting its crown
section on the precisely matching tungsten carbide backing
plate (Boehler & De Hantsetters, 2004; Boehler, 2006);
another design with the specially made anvils mounted on the
crown section was described by Ahsbahs (2004). For pressures
up to about 5.0 GPa, ordinary brilliant anvils supported on the
crown facets by a steel backing plate (Fig. 4) are used in our
laboratory. Diamond plates were also used for supporting
Acta Cryst. (2008). A64, 135–148 Andrzej Katrusiak � High-pressure crystallography 137
feature articles
Figure 1The brilliant-design diamond anvil, with the names of its parts and facetsindicated. Flat culets with 8 or 16 edges are polished for high-pressureanvils.
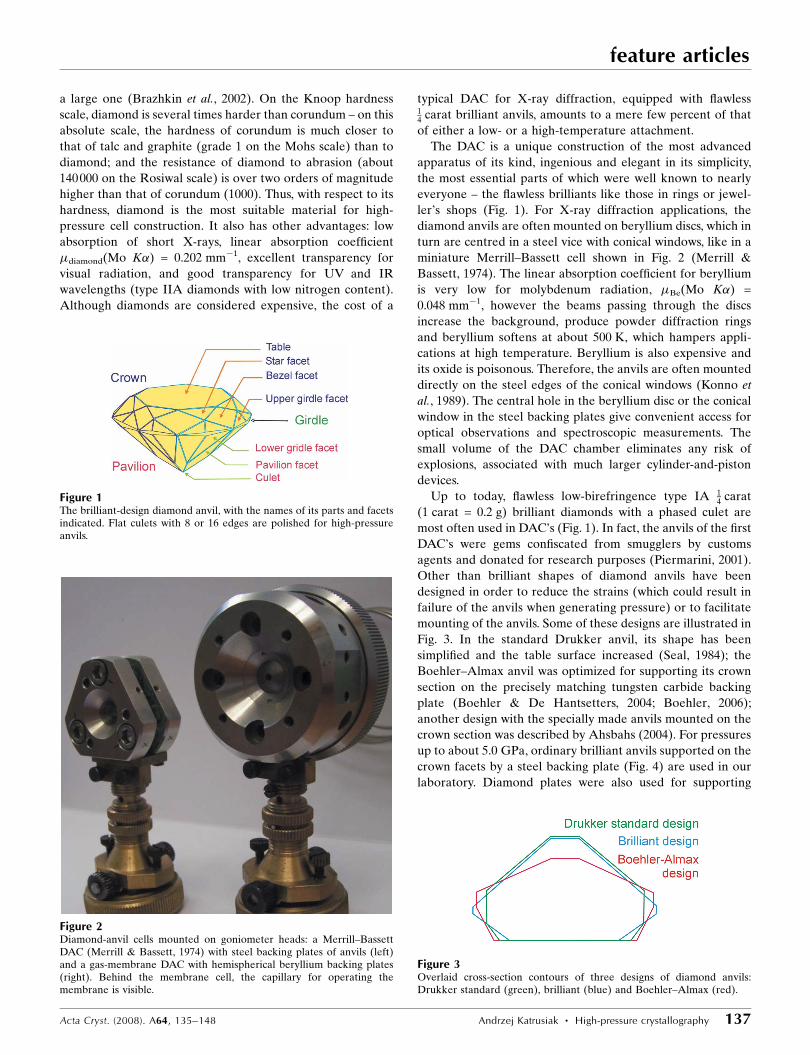
Figure 2Diamond-anvil cells mounted on goniometer heads: a Merrill–BassettDAC (Merrill & Bassett, 1974) with steel backing plates of anvils (left)and a gas-membrane DAC with hemispherical beryllium backing plates(right). Behind the membrane cell, the capillary for operating themembrane is visible.
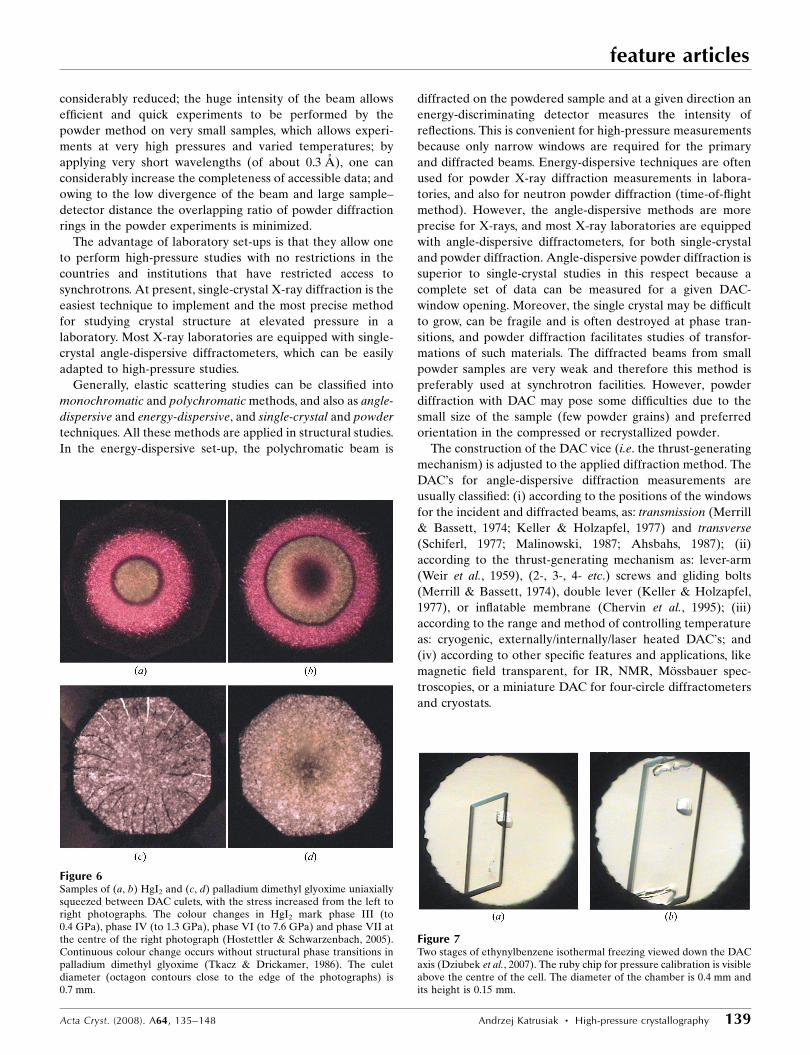
Figure 3Overlaid cross-section contours of three designs of diamond anvils:Drukker standard (green), brilliant (blue) and Boehler–Almax (red).

the anvils (Yamanaka, Fukuda et al., 2001), and perforated
diamond anvils are made for reducing absorption in Moss-
bauer spectroscopy (Dadashev et al., 2001). For Mbar pres-
sures (above 100 GPa), bevelled culets reduce the stress
concentration on the culet edges (Mao & Bell, 1978; Seal,
1984).
The DAC’s are small – they can be mounted on stable
goniometer heads (Fig. 2) and used for experiments with
standard laboratory X-ray diffractometers (Fig. 5).
2.3. Principles of the DAC operation
The axial thrust produced by the DAC vice mechanism is
transmitted to the large tables and crown edges of two
opposed diamond anvils, and through the stressed anvils to the
culets. The pressure exerted on the tables is multiplied by the
factor of the ratio of the surface area of the supported table
side to the culet surface, and squeezes the gasket and sample
contained in the high-pressure chamber. For table and culet
diameters of 3.0 and 0.7 mm, respectively, the ratio is
3.02/0.72� 20, and to obtain the multiplication factor of 100 a
0.3 mm culet diameter would be required.
The chamber diameter is usually equal to half or less of that
of the culet. Like in the seals designed by Bridgman, the
pressure exerted by the culets on the gasket exceeds that in
the pressurized sample, so the closure is self-sealing. The
hardness of the gasket and anvil materials increases under
compression. These principles of the DAC operation are the
same in all designs, although they can be considerably modi-
fied for specific applications and adapted to the requirements
of different probing methods. For the purpose of this paper,
we will focus on X-ray diffraction crystallographic experi-
ments, although DAC’s are also used for high-pressure optical
spectroscopy (IR, UV-VIS, Raman, NMR) and for other
physical experiments, chemical reactions, syntheses of new
materials, biological observations, and even as precision
cuvettes in forensic investigations. The DAC is an ideal micro
reaction chamber allowing optical observation of chemical
transformations at many GPa pressures and varied tempera-
tures (Nicol & Yin, 1984) – the progress in analytical methods
allows successful characterization of minute amounts of
products synthesized in this way. Pressure-induced transfor-
mations can be investigated in non-hydrostatic conditions
when a substance is squeezed between the DAC culets (Fig. 6)
and in hydrostatic conditions when the investigated substance
is contained in a liquid (Fig. 7).
It follows from the massive support principle that a conical
anvil can support a compressive stress nK, where K is the yield
stress of the anvil material and n equals 1.0 for cylindrical
anvils (semi-cone angle � equal to 0�) and 3.0 for � equal to
90�. The anvil culet is further supported by the plastically
deformable gasket, which extrudes around the sloped pavilion
to diameter Dext, larger than the diameter of the culet, D, and
additionally increases attainable pressure to P = 2K ln(Dext/D)
(Yousuf & Rajan, 1982; Dunstan, 1989; Dunstan & Spain,
1989).
2.4. DAC types and designs
There have been various DAC designs, optimized for the
measurement technique, sample requirements and other
thermodynamical conditions (low or high temperature). X-ray
diffraction can be performed on single crystals and powders
(Meade & Jeanloz, 1990; McMahon, 2004; Parise, 2004), as
well as on intermediate cases of ‘bad powders’ with large
crystalline grains. Only the DAC’s for diffraction studies will
be briefly classified and exemplified below. Laboratory X-ray
diffractometers and those used at synchrotron beamlines
considerably differ too (Prewitt et al., 1987; Mao et al., 1988;
Nelmes et al., 1992; Fiquet & Andrault, 1999; Crichton &
Mezouar, 2004; Katrusiak, 2004a). At synchrotrons, very
intense X-ray beams can be collimated to a few micrometres,
thus the problem of the beam shadowing by the gasket is
feature articles
138 Andrzej Katrusiak � High-pressure crystallography Acta Cryst. (2008). A64, 135–148
Figure 4The effective access to the sample for laboratory X-ray diffractionmeasurements, illustrated for a brilliant-cut anvil, the crown facets ofwhich are supported on the edges of the window in the steel backingplate.
Figure 5A Merrill–Bassett diamond-anvil cell, mounted on a stable goniometerhead on a four-circle � diffractometer KUMA KM4-CCD during a datacollection in the � = 0� and !-scan mode. To reduce the level of radiationscattered on the diamonds, beryllium plates and gasket, the gap betweenthe DAC parts is shielded with a metal strip; additionally, lead-loadedglass shielding (not shown here) encloses the diffractometer for securityreasons.
considerably reduced; the huge intensity of the beam allows
efficient and quick experiments to be performed by the
powder method on very small samples, which allows experi-
ments at very high pressures and varied temperatures; by
applying very short wavelengths (of about 0.3 A), one can
considerably increase the completeness of accessible data; and
owing to the low divergence of the beam and large sample–
detector distance the overlapping ratio of powder diffraction
rings in the powder experiments is minimized.
The advantage of laboratory set-ups is that they allow one
to perform high-pressure studies with no restrictions in the
countries and institutions that have restricted access to
synchrotrons. At present, single-crystal X-ray diffraction is the
easiest technique to implement and the most precise method
for studying crystal structure at elevated pressure in a
laboratory. Most X-ray laboratories are equipped with single-
crystal angle-dispersive diffractometers, which can be easily
adapted to high-pressure studies.
Generally, elastic scattering studies can be classified into
monochromatic and polychromatic methods, and also as angle-
dispersive and energy-dispersive, and single-crystal and powder
techniques. All these methods are applied in structural studies.
In the energy-dispersive set-up, the polychromatic beam is
diffracted on the powdered sample and at a given direction an
energy-discriminating detector measures the intensity of
reflections. This is convenient for high-pressure measurements
because only narrow windows are required for the primary
and diffracted beams. Energy-dispersive techniques are often
used for powder X-ray diffraction measurements in labora-
tories, and also for neutron powder diffraction (time-of-flight
method). However, the angle-dispersive methods are more
precise for X-rays, and most X-ray laboratories are equipped
with angle-dispersive diffractometers, for both single-crystal
and powder diffraction. Angle-dispersive powder diffraction is
superior to single-crystal studies in this respect because a
complete set of data can be measured for a given DAC-
window opening. Moreover, the single crystal may be difficult
to grow, can be fragile and is often destroyed at phase tran-
sitions, and powder diffraction facilitates studies of transfor-
mations of such materials. The diffracted beams from small
powder samples are very weak and therefore this method is
preferably used at synchrotron facilities. However, powder
diffraction with DAC may pose some difficulties due to the
small size of the sample (few powder grains) and preferred
orientation in the compressed or recrystallized powder.
The construction of the DAC vice (i.e. the thrust-generating
mechanism) is adjusted to the applied diffraction method. The
DAC’s for angle-dispersive diffraction measurements are
usually classified: (i) according to the positions of the windows
for the incident and diffracted beams, as: transmission (Merrill
& Bassett, 1974; Keller & Holzapfel, 1977) and transverse
(Schiferl, 1977; Malinowski, 1987; Ahsbahs, 1987); (ii)
according to the thrust-generating mechanism as: lever-arm
(Weir et al., 1959), (2-, 3-, 4- etc.) screws and gliding bolts
(Merrill & Bassett, 1974), double lever (Keller & Holzapfel,
1977), or inflatable membrane (Chervin et al., 1995); (iii)
according to the range and method of controlling temperature
as: cryogenic, externally/internally/laser heated DAC’s; and
(iv) according to other specific features and applications, like
magnetic field transparent, for IR, NMR, Mossbauer spec-
troscopies, or a miniature DAC for four-circle diffractometers
and cryostats.
Acta Cryst. (2008). A64, 135–148 Andrzej Katrusiak � High-pressure crystallography 139
feature articles
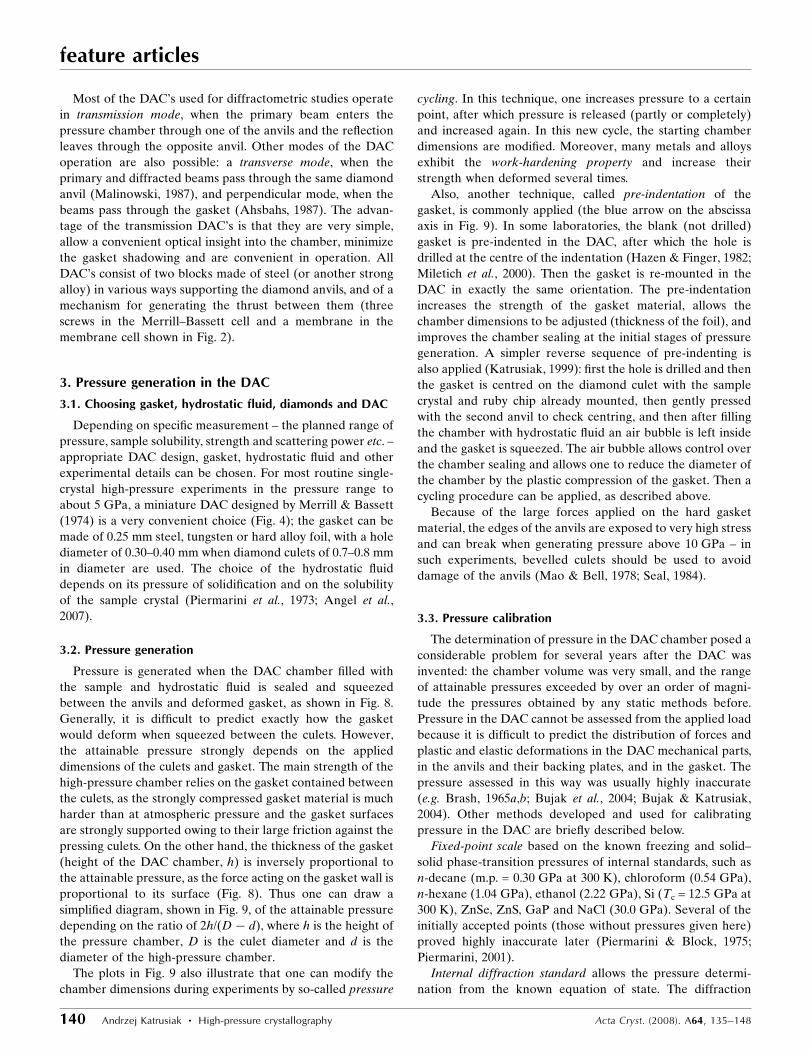
Figure 7Two stages of ethynylbenzene isothermal freezing viewed down the DACaxis (Dziubek et al., 2007). The ruby chip for pressure calibration is visibleabove the centre of the cell. The diameter of the chamber is 0.4 mm andits height is 0.15 mm.
Figure 6Samples of (a, b) HgI2 and (c, d) palladium dimethyl glyoxime uniaxiallysqueezed between DAC culets, with the stress increased from the left toright photographs. The colour changes in HgI2 mark phase III (to0.4 GPa), phase IV (to 1.3 GPa), phase VI (to 7.6 GPa) and phase VII atthe centre of the right photograph (Hostettler & Schwarzenbach, 2005).Continuous colour change occurs without structural phase transitions inpalladium dimethyl glyoxime (Tkacz & Drickamer, 1986). The culetdiameter (octagon contours close to the edge of the photographs) is0.7 mm.
Most of the DAC’s used for diffractometric studies operate
in transmission mode, when the primary beam enters the
pressure chamber through one of the anvils and the reflection
leaves through the opposite anvil. Other modes of the DAC
operation are also possible: a transverse mode, when the
primary and diffracted beams pass through the same diamond
anvil (Malinowski, 1987), and perpendicular mode, when the
beams pass through the gasket (Ahsbahs, 1987). The advan-
tage of the transmission DAC’s is that they are very simple,
allow a convenient optical insight into the chamber, minimize
the gasket shadowing and are convenient in operation. All
DAC’s consist of two blocks made of steel (or another strong
alloy) in various ways supporting the diamond anvils, and of a
mechanism for generating the thrust between them (three
screws in the Merrill–Bassett cell and a membrane in the
membrane cell shown in Fig. 2).
3. Pressure generation in the DAC
3.1. Choosing gasket, hydrostatic fluid, diamonds and DAC
Depending on specific measurement – the planned range of
pressure, sample solubility, strength and scattering power etc. –
appropriate DAC design, gasket, hydrostatic fluid and other
experimental details can be chosen. For most routine single-
crystal high-pressure experiments in the pressure range to
about 5 GPa, a miniature DAC designed by Merrill & Bassett
(1974) is a very convenient choice (Fig. 4); the gasket can be
made of 0.25 mm steel, tungsten or hard alloy foil, with a hole
diameter of 0.30–0.40 mm when diamond culets of 0.7–0.8 mm
in diameter are used. The choice of the hydrostatic fluid
depends on its pressure of solidification and on the solubility
of the sample crystal (Piermarini et al., 1973; Angel et al.,
2007).
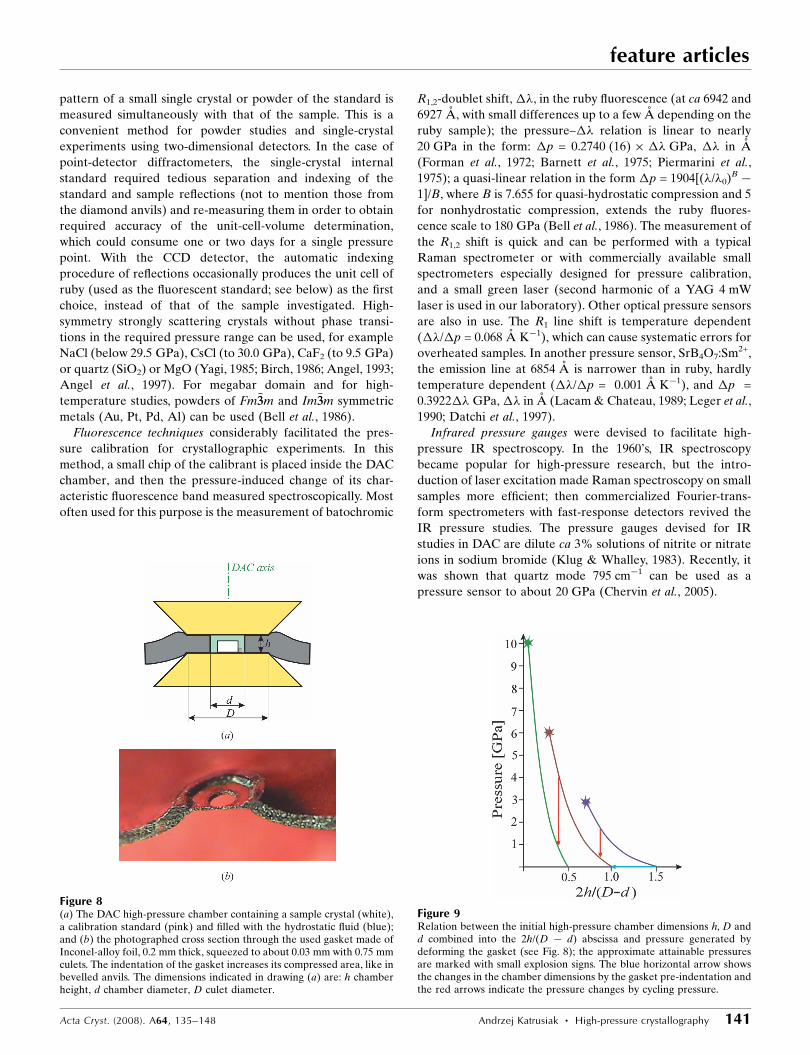
3.2. Pressure generation
Pressure is generated when the DAC chamber filled with
the sample and hydrostatic fluid is sealed and squeezed
between the anvils and deformed gasket, as shown in Fig. 8.
Generally, it is difficult to predict exactly how the gasket
would deform when squeezed between the culets. However,
the attainable pressure strongly depends on the applied
dimensions of the culets and gasket. The main strength of the
high-pressure chamber relies on the gasket contained between
the culets, as the strongly compressed gasket material is much
harder than at atmospheric pressure and the gasket surfaces
are strongly supported owing to their large friction against the
pressing culets. On the other hand, the thickness of the gasket
(height of the DAC chamber, h) is inversely proportional to
the attainable pressure, as the force acting on the gasket wall is
proportional to its surface (Fig. 8). Thus one can draw a
simplified diagram, shown in Fig. 9, of the attainable pressure
depending on the ratio of 2h/(D � d), where h is the height of
the pressure chamber, D is the culet diameter and d is the
diameter of the high-pressure chamber.
The plots in Fig. 9 also illustrate that one can modify the
chamber dimensions during experiments by so-called pressure
cycling. In this technique, one increases pressure to a certain
point, after which pressure is released (partly or completely)
and increased again. In this new cycle, the starting chamber
dimensions are modified. Moreover, many metals and alloys
exhibit the work-hardening property and increase their
strength when deformed several times.
Also, another technique, called pre-indentation of the
gasket, is commonly applied (the blue arrow on the abscissa
axis in Fig. 9). In some laboratories, the blank (not drilled)
gasket is pre-indented in the DAC, after which the hole is
drilled at the centre of the indentation (Hazen & Finger, 1982;
Miletich et al., 2000). Then the gasket is re-mounted in the
DAC in exactly the same orientation. The pre-indentation
increases the strength of the gasket material, allows the
chamber dimensions to be adjusted (thickness of the foil), and
improves the chamber sealing at the initial stages of pressure
generation. A simpler reverse sequence of pre-indenting is
also applied (Katrusiak, 1999): first the hole is drilled and then
the gasket is centred on the diamond culet with the sample
crystal and ruby chip already mounted, then gently pressed
with the second anvil to check centring, and then after filling
the chamber with hydrostatic fluid an air bubble is left inside
and the gasket is squeezed. The air bubble allows control over
the chamber sealing and allows one to reduce the diameter of
the chamber by the plastic compression of the gasket. Then a
cycling procedure can be applied, as described above.
Because of the large forces applied on the hard gasket
material, the edges of the anvils are exposed to very high stress
and can break when generating pressure above 10 GPa – in
such experiments, bevelled culets should be used to avoid
damage of the anvils (Mao & Bell, 1978; Seal, 1984).
3.3. Pressure calibration
The determination of pressure in the DAC chamber posed a
considerable problem for several years after the DAC was
invented: the chamber volume was very small, and the range
of attainable pressures exceeded by over an order of magni-
tude the pressures obtained by any static methods before.
Pressure in the DAC cannot be assessed from the applied load
because it is difficult to predict the distribution of forces and
plastic and elastic deformations in the DAC mechanical parts,
in the anvils and their backing plates, and in the gasket. The
pressure assessed in this way was usually highly inaccurate
(e.g. Brash, 1965a,b; Bujak et al., 2004; Bujak & Katrusiak,
2004). Other methods developed and used for calibrating
pressure in the DAC are briefly described below.
Fixed-point scale based on the known freezing and solid–
solid phase-transition pressures of internal standards, such as
n-decane (m.p. = 0.30 GPa at 300 K), chloroform (0.54 GPa),
n-hexane (1.04 GPa), ethanol (2.22 GPa), Si (Tc = 12.5 GPa at
300 K), ZnSe, ZnS, GaP and NaCl (30.0 GPa). Several of the
initially accepted points (those without pressures given here)
proved highly inaccurate later (Piermarini & Block, 1975;
Piermarini, 2001).
Internal diffraction standard allows the pressure determi-
nation from the known equation of state. The diffraction
feature articles
140 Andrzej Katrusiak � High-pressure crystallography Acta Cryst. (2008). A64, 135–148
pattern of a small single crystal or powder of the standard is
measured simultaneously with that of the sample. This is a
convenient method for powder studies and single-crystal
experiments using two-dimensional detectors. In the case of
point-detector diffractometers, the single-crystal internal
standard required tedious separation and indexing of the
standard and sample reflections (not to mention those from
the diamond anvils) and re-measuring them in order to obtain
required accuracy of the unit-cell-volume determination,
which could consume one or two days for a single pressure
point. With the CCD detector, the automatic indexing
procedure of reflections occasionally produces the unit cell of
ruby (used as the fluorescent standard; see below) as the first
choice, instead of that of the sample investigated. High-
symmetry strongly scattering crystals without phase transi-
tions in the required pressure range can be used, for example
NaCl (below 29.5 GPa), CsCl (to 30.0 GPa), CaF2 (to 9.5 GPa)
or quartz (SiO2) or MgO (Yagi, 1985; Birch, 1986; Angel, 1993;
Angel et al., 1997). For megabar domain and for high-
temperature studies, powders of Fm�33m and Im�33m symmetric
metals (Au, Pt, Pd, Al) can be used (Bell et al., 1986).
Fluorescence techniques considerably facilitated the pres-
sure calibration for crystallographic experiments. In this
method, a small chip of the calibrant is placed inside the DAC
chamber, and then the pressure-induced change of its char-
acteristic fluorescence band measured spectroscopically. Most
often used for this purpose is the measurement of batochromic
R1,2-doublet shift, ��, in the ruby fluorescence (at ca 6942 and
6927 A, with small differences up to a few A depending on the
ruby sample); the pressure–�� relation is linear to nearly
20 GPa in the form: �p = 0.2740 (16) � �� GPa, �� in A
(Forman et al., 1972; Barnett et al., 1975; Piermarini et al.,
1975); a quasi-linear relation in the form �p = 1904[(�/�0)B�
1]/B, where B is 7.655 for quasi-hydrostatic compression and 5
for nonhydrostatic compression, extends the ruby fluores-
cence scale to 180 GPa (Bell et al., 1986). The measurement of
the R1,2 shift is quick and can be performed with a typical
Raman spectrometer or with commercially available small
spectrometers especially designed for pressure calibration,
and a small green laser (second harmonic of a YAG 4 mW
laser is used in our laboratory). Other optical pressure sensors
are also in use. The R1 line shift is temperature dependent
(��/�p = 0.068 A K�1), which can cause systematic errors for
overheated samples. In another pressure sensor, SrB4O7:Sm2+,
the emission line at 6854 A is narrower than in ruby, hardly
temperature dependent (��/�p = 0.001 A K�1), and �p =
0.3922�� GPa, �� in A (Lacam & Chateau, 1989; Leger et al.,
1990; Datchi et al., 1997).
Infrared pressure gauges were devised to facilitate high-
pressure IR spectroscopy. In the 1960’s, IR spectroscopy
became popular for high-pressure research, but the intro-
duction of laser excitation made Raman spectroscopy on small
samples more efficient; then commercialized Fourier-trans-
form spectrometers with fast-response detectors revived the
IR pressure studies. The pressure gauges devised for IR
studies in DAC are dilute ca 3% solutions of nitrite or nitrate
ions in sodium bromide (Klug & Whalley, 1983). Recently, it
was shown that quartz mode 795 cm�1 can be used as a
pressure sensor to about 20 GPa (Chervin et al., 2005).
Acta Cryst. (2008). A64, 135–148 Andrzej Katrusiak � High-pressure crystallography 141
feature articles
Figure 9Relation between the initial high-pressure chamber dimensions h, D andd combined into the 2h/(D � d) abscissa and pressure generated bydeforming the gasket (see Fig. 8); the approximate attainable pressuresare marked with small explosion signs. The blue horizontal arrow showsthe changes in the chamber dimensions by the gasket pre-indentation andthe red arrows indicate the pressure changes by cycling pressure.
Figure 8(a) The DAC high-pressure chamber containing a sample crystal (white),a calibration standard (pink) and filled with the hydrostatic fluid (blue);and (b) the photographed cross section through the used gasket made ofInconel-alloy foil, 0.2 mm thick, squeezed to about 0.03 mm with 0.75 mmculets. The indentation of the gasket increases its compressed area, like inbevelled anvils. The dimensions indicated in drawing (a) are: h chamberheight, d chamber diameter, D culet diameter.
3.4. Data correction
The intensity of reflections from the crystal enclosed in the
DAC should be corrected for Lorentz–polarization effects, the
absorption of the DAC windows, absorption of the crystal
itself, and shadowing of the sample crystal by the gasket
(Hazen & Finger, 1982; Kuhs et al., 1996; Angel et al., 2000;
Katrusiak, 2004b,c). Computer programs for applying these
corrections have been written and are applied (Kuhs et al.,
1996; Katrusiak, 2001, 2004b; Angel, 2004). When data with
high redundancy are available, it is also possible, by checking
the consistency of the Bragg angles and intensities of
symmetry-equivalent reflections measured at varied positions
of the DAC (and different angles), to identify the reflections
‘colliding’ with the edges of the windows, superimposed with
the diamond reflections, or weakened by the simultaneous
diffraction effects in the sample and one or two diamond
anvils (Loveday et al., 1990). The Rint factor calculated after
applying the corrections is a good measure of the quality of
the corrected data. These data can be used like ordinary data,
albeit only partly complete, for further stages of crystal-
lographic calculations.
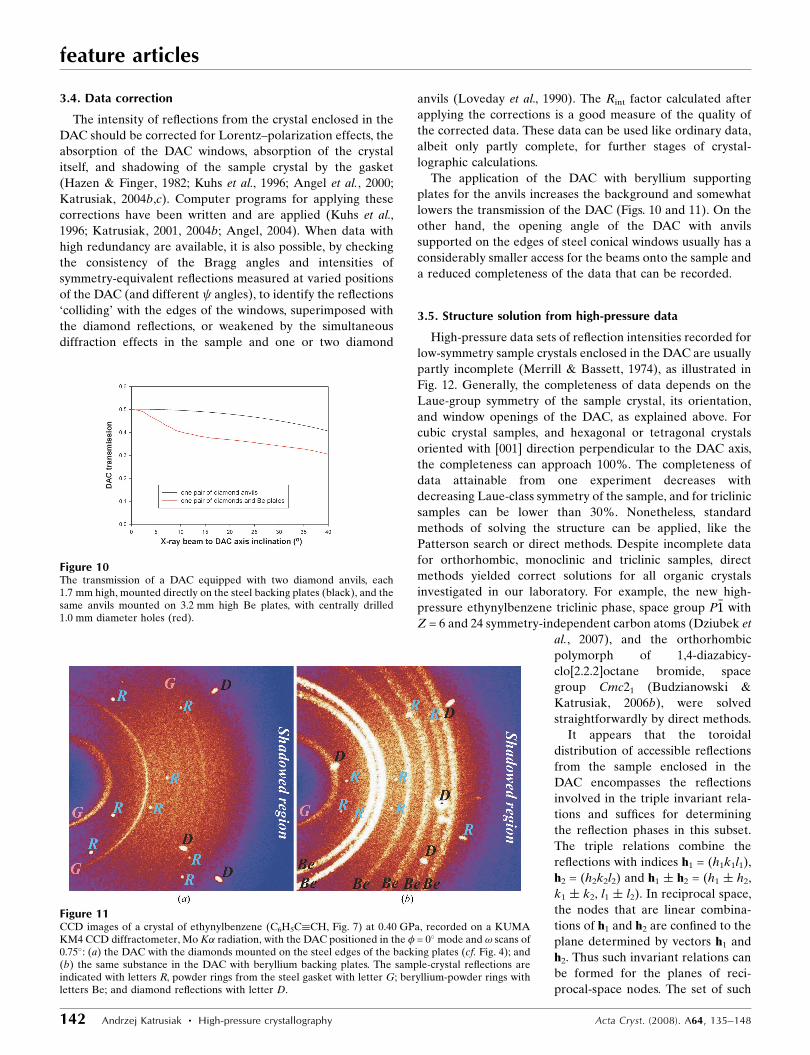
The application of the DAC with beryllium supporting
plates for the anvils increases the background and somewhat
lowers the transmission of the DAC (Figs. 10 and 11). On the
other hand, the opening angle of the DAC with anvils
supported on the edges of steel conical windows usually has a
considerably smaller access for the beams onto the sample and
a reduced completeness of the data that can be recorded.
3.5. Structure solution from high-pressure data
High-pressure data sets of reflection intensities recorded for
low-symmetry sample crystals enclosed in the DAC are usually
partly incomplete (Merrill & Bassett, 1974), as illustrated in
Fig. 12. Generally, the completeness of data depends on the
Laue-group symmetry of the sample crystal, its orientation,
and window openings of the DAC, as explained above. For
cubic crystal samples, and hexagonal or tetragonal crystals
oriented with [001] direction perpendicular to the DAC axis,
the completeness can approach 100%. The completeness of
data attainable from one experiment decreases with
decreasing Laue-class symmetry of the sample, and for triclinic
samples can be lower than 30%. Nonetheless, standard
methods of solving the structure can be applied, like the
Patterson search or direct methods. Despite incomplete data
for orthorhombic, monoclinic and triclinic samples, direct
methods yielded correct solutions for all organic crystals
investigated in our laboratory. For example, the new high-
pressure ethynylbenzene triclinic phase, space group P�11 with
Z = 6 and 24 symmetry-independent carbon atoms (Dziubek et
al., 2007), and the orthorhombic
polymorph of 1,4-diazabicy-
clo[2.2.2]octane bromide, space
group Cmc21 (Budzianowski &
Katrusiak, 2006b), were solved
straightforwardly by direct methods.
It appears that the toroidal
distribution of accessible reflections
from the sample enclosed in the
DAC encompasses the reflections
involved in the triple invariant rela-
tions and suffices for determining
the reflection phases in this subset.
The triple relations combine the
reflections with indices h1 = (h1k1l1),
h2 = (h2k2l2) and h1 � h2 = (h1 � h2,
k1 � k2, l1 � l2). In reciprocal space,
the nodes that are linear combina-
tions of h1 and h2 are confined to the
plane determined by vectors h1 and
h2. Thus such invariant relations can
be formed for the planes of reci-
procal-space nodes. The set of such
feature articles
142 Andrzej Katrusiak � High-pressure crystallography Acta Cryst. (2008). A64, 135–148
Figure 10The transmission of a DAC equipped with two diamond anvils, each1.7 mm high, mounted directly on the steel backing plates (black), and thesame anvils mounted on 3.2 mm high Be plates, with centrally drilled1.0 mm diameter holes (red).
Figure 11CCD images of a crystal of ethynylbenzene (C6H5C�CH, Fig. 7) at 0.40 GPa, recorded on a KUMAKM4 CCD diffractometer, Mo K� radiation, with the DAC positioned in the � = 0� mode and ! scans of0.75�: (a) the DAC with the diamonds mounted on the steel edges of the backing plates (cf. Fig. 4); and(b) the same substance in the DAC with beryllium backing plates. The sample-crystal reflections areindicated with letters R, powder rings from the steel gasket with letter G; beryllium-powder rings withletters Be; and diamond reflections with letter D.

planes of nodes, which are inclined to the DAC axis by less
than half of the angle of the DAC window-opening cones,
approximate the toroidal region accessible for the DAC.
Moreover, for most h1 and h2 vectors in all of the accessible
toroidal region, their sum h1 + h2 is contained in this region,
too. Thus the shape of the reciprocal-space-accessible region is
favourable for direct methods, and this is reflected in the
successful application of direct methods in high-pressure
structural analyses.
4. X-ray diffraction measurements with the DAC
4.1. From analogue to digital two-dimensional detectors
The first single-crystal high-pressure X-ray diffraction
measurements with a DAC were performed by using a
Buerger precession camera and diffraction patterns recorded
photographically – the high-pressure studies on crystalline
H2O ice VI (Block et al., 1965) and chloroform (Fourme, 1968)
were measured in this way. The recording of photographs on
the precession camera requires that the crystal be precisely
oriented such that the reciprocal plane be parallel to the film
(one of the reciprocal vectors preferably along the precession
axis and another vertical). The alignment of a bare crystal on
the precession camera was accomplished in several steps. First,
the crystal was mounted on a goniometer head in the
approximately aligned position, then the crystal was more
precisely adjusted by observing it through a microscope, and
finally by performing a preliminary precession photograph
from which final precise adjustments could be measured. The
alignment of the crystal in the DAC was more difficult because
of the limited possibility of controlling the orientation of the
crystals in the DAC (particularly those grown by pressure
freezing) and difficult microscopic observation of the crystal
on the camera. After aligning the crystal in the DAC, a Laue-
cone photograph and a few accessible reciprocal-lattice
sections (perpendicular to the DAC axis) could be recorded.
These data were sufficient for determining the crystal
symmetry and the position and orientation of small molecules
and ions in the crystal structure.
In the mid 1970’s automatic four-circle diffractometers were
applied to high-pressure single-crystal X-ray diffraction
studies (Merrill & Bassett, 1974). The diffractometers were
equipped with scintillation detectors and the measurement
consisted of several stages. The crystal centring was performed
optically with the aid of a microscope. The main difficulty was
caused by the viewing of the crystal sample being restricted to
one direction along the DAC axis. Thus the optical centring of
the sample was difficult and usually was not precise. Any
further steps required that the orientation matrix of the crystal
(UB matrix) be determined. For finding the initial set of
reflections, either a rotation photograph was made or a peak-
hunting procedure performed. Then the reflections had to be
indexed and the UB matrix could be determined and refined
(Busing & Levy, 1967). With the UB matrix determined, one
could refine the crystal centring by applying the diffracto-
metric centring technique, which is much more reliable than
the optical centring for the DAC. In the diffractometric
technique, the corrections in the crystal position are derived
from the offsets of the reflection positions. In the original
version of the method, the selected reflections were measured
at four or eight equivalent positions (Hamilton, 1974; King &
Finger, 1979) and more recently a general procedure based on
an arbitrary set of reflections was developed (Dera & Katru-
siak, 1999). After centring the crystal, the UB matrix could
be re-determined and more reliable unit-cell dimensions
obtained. This was very important because the crystal posi-
tioning errors and restricted access to the reciprocal lattice of
the sample often considerably lowered the precision of the UB
matrix and affected the measurements of reflection intensities.
The accessible reflections were measured one by one.
Whereas a bisecting mode of data collection was applied for
bare crystal samples (i.e. the ! axis fixed at the 0� position,
where the � circle bisected the angle formed by the incident
and reflected beams in the diffraction plane), Finger & King
(1978) showed that for the DAC the so-called � = 0� posi-
tioning mode (when the DAC axis lies in the diffraction plane)
minimizes the DAC absorption and maximizes the access to
the reciprocal-lattice nodes. The time required for measuring
each reflection had to be extended considerably (usually by a
factor of 5–10 compared to routine measurements carried out
for bare crystals) because of the DAC absorption and high
background of the radiation scattered on the beryllium discs,
gasket and diamonds.
Several other DAC types, operating in both transmission
and transverse geometries, were developed for the diffrac-
tometer measurements (e.g. Denner et al., 1978), however the
Acta Cryst. (2008). A64, 135–148 Andrzej Katrusiak � High-pressure crystallography 143
feature articles
Figure 12A geometrical construction illustrating the reciprocal-lattice regionaccessible for a crystal enclosed in the DAC. Two windows of the DACand its axis (dash-and-dot line) are superimposed with four reciprocal-lattice Ewald spheres corresponding to four limiting positions of beamsentering the DAC along four window edges (along the upper-left edge:purple circle; along bottom-left edge: green; along upper-right edge: red;and along bottom-right edge: blue; the centres of the circles are markedwith rectangles in the corresponding colours representing the crystalpositions). The yellow area marks the accessible area of the reciprocallattice – the accessible region in three dimensions is a torus obtained byrotating this area about the DAC axis. A DAC windows opening of 70�
and molybdenum wavelength have been depicted to scale in thisconstruction; the dotted circles correspond to the resolution of 0.80 A(larger) and 0.94 A (smaller).

heavy cells required a sophisticated mounting on the
diffractometer and often required difficult crystal-mounting
and DAC-centring procedures.
4.2. CCD detector era
The development of two-dimensional electronic detectors
for X-ray diffractometers soon prompted their use for high-
pressure studies (Piltz et al., 1992; Shimomura et al., 1992;
Allan et al., 2000; Shobu et al., 2001; Crichton & Mezouar,
2004; Ahsbahs, 2004). In several respects, the application of
diffractometers equipped with a CCD camera considerably
simplified the high-pressure experiments.
After initial difficulties with sample centring, a highly effi-
cient automatic gasket-shadow method was developed
(Budzianowski & Katrusiak, 2004; Angel, 2004; Dawson et al.,
2004). The UB-matrix determination prior to the data
collection is not necessary because the CCD camera records
the diffraction images, which can be analysed after the
experiment. The UB-matrix determination is easier when all
the data are available. Owing to the two-dimensional detector,
the data collection is much faster than by using the scintilla-
tion detector, and usually a considerable redundancy of the
data is obtained. The redundancy of the data allows several
important systematic errors to be eliminated by comparing
reflection intensities, such as those caused by overlaid reflec-
tions from the sample and from the diamonds or ruby stan-
dards, by the primary and diffracted beams truncated on the
DAC window edges, and by weakening of the beams by
simultaneous diffraction events on the sample crystal and
diamond anvils. Inspection of images is very helpful for veri-
fying the intensities of outlier reflections. ‘Blind measure-
ments’ on new phases are possible when one is not certain if a
new synthesized product or a new phase has been obtained,
and the unit-cell and symmetry determination can all be
performed after completing the data collection.
On the other hand, owing to the simultaneous recording of
reflections and absence of one diffraction plane associated
with the instrument, the reflections are not recorded precisely
at the optimal DAC position. Approximately optimal DAC
positioning can be obtained by maintaining the � = 0� posi-
tioning mode (Budzianowski & Katrusiak, 2004), however this
can be done only on four-circle diffractometers (three-axis
crystal orienter plus the �-axis detector positioner) made by
several manufacturers. Meanwhile, CCD diffractometers with
three axes only (! axis and � spindle at a fixed � angle, and the
detector axis) have become very common, but the complete-
ness and quality of high-pressure data measured on such
instruments is considerably lower.
4.3. High-pressure neutron diffraction studies
High-pressure neutron diffraction constitutes another
branch of high-pressure crystallography, which appeared and
developed during the last decades (McWhan, 1984; Bloch &
Voiron, 1984; Voiron & Vettier, 1987; Miletich et al., 2000;
Goncharenko, 2004; Somenkov, 2005). The neutron diffraction
can provide significant complementary information in many
structural problems, for example when protons have to be
located precisely, when the structure investigated contains
very heavy elements, when nuclei with a similar number of
electrons have to be distinguished, when magnetic structures
are investigated, and also for inelastic scattering experiments.
The main difficulty in these experiments is a relatively low
intensity of neutron sources, reactors or spallation sources,
compared even to the intensity of the X-ray beam from
conventional sealed tubes, not to mention synchrotrons, and
the scattering of neutrons by most materials is low. Therefore
the samples investigated by neutrons are much larger, usually
single crystals of a few mm3 and powder samples of a few cm3
are used.
Several types of high-pressure cells for neutron diffraction
studies have been built and are used both at nuclear reactors
and at spallation sources. Generally, the cells for high-pressure
neutron diffraction are large and in most cases adapted to
varied-temperature environments. The main types of high-
pressure cells for neutrons are (i) gas-pressure cells, (ii)
cylinder-and-piston cells, and (iii) opposed-anvils cells. In the
gas pressure cell, the pressure is generated by a compressor
outside the ‘bomb’ containing the sample and transmitted to it
through a capillary (Paureau & Vettier, 1975); a pressure of
about 0.5 GPa can be generated in these cells. The cylinder-
and-piston cells are bigger and usually driven by a hydraulic
press (Mizuki & Endoh, 1981; McWhan, 1984), but a higher
pressure of about 3 GPa can be obtained. The walls of the gas
or liquid pressure-cell bombs and the cylinders are made of
materials that scatter neutrons weakly: aluminium alloys,
vanadium, Ti66Zr34 alloy (having zero scattering amplitude
due to the opposite signs of scattering amplitudes of Ti and
Zr), and tungsten-carbide- or steel-supported Al2O3. The
highest range of pressure is attainable in the opposed-anvils
cells. Constructions of most of opposed-anvils cells for
neutrons incorporate anvils with a recess in the centre to
enclose a larger sample – so called Chechevitsa anvils (Stishov
& Popova, 1961); or toroid anvils, with toroid grooves in the
anvils around the sample space (Khvostantsev et al., 1977,
2004). The anvils are made of tungsten carbide, and of
sapphire or diamond for higher-pressure ranges. Single-crystal
neutron diffraction measurements in the pressure approaching
40 GPa were carried out (Glazkov et al., 1989), however the
large diamond anvils used were prohibitively expensive. At
present perhaps the most widely used is the so-called Paris–
Edinburgh cell, based on opposed toroid anvils and optimized
for time-of-flight neutron diffraction in pulsed neutron sources
(Besson et al., 1992), but also applied at synchrotrons for
experiments where the X-ray beam passes through the gasket.
A DAC has been applie in neutron diffraction studies too
(Goncharenko, 2006).
5. Strained crystals, molecules and atoms
High pressure was applied to various compounds as simple as
elements and as complex as proteins. The pressure-induced
changes in the crystal structures are sometimes compared to
those induced by temperature (Bujak & Angel, 2006), isotopic
feature articles
144 Andrzej Katrusiak � High-pressure crystallography Acta Cryst. (2008). A64, 135–148
replacement (Ichikawa, 1998; Goncharenko, 2005) or other
effects, but no general relations can be drawn. Depending on
the problem investigated, a different pressure range is applied.
Relatively low pressures, of a few GPa, can modify the
weakest interactions, like van der Waals forces. Thus mole-
cular crystals are easily modified and a pressure of about 2–
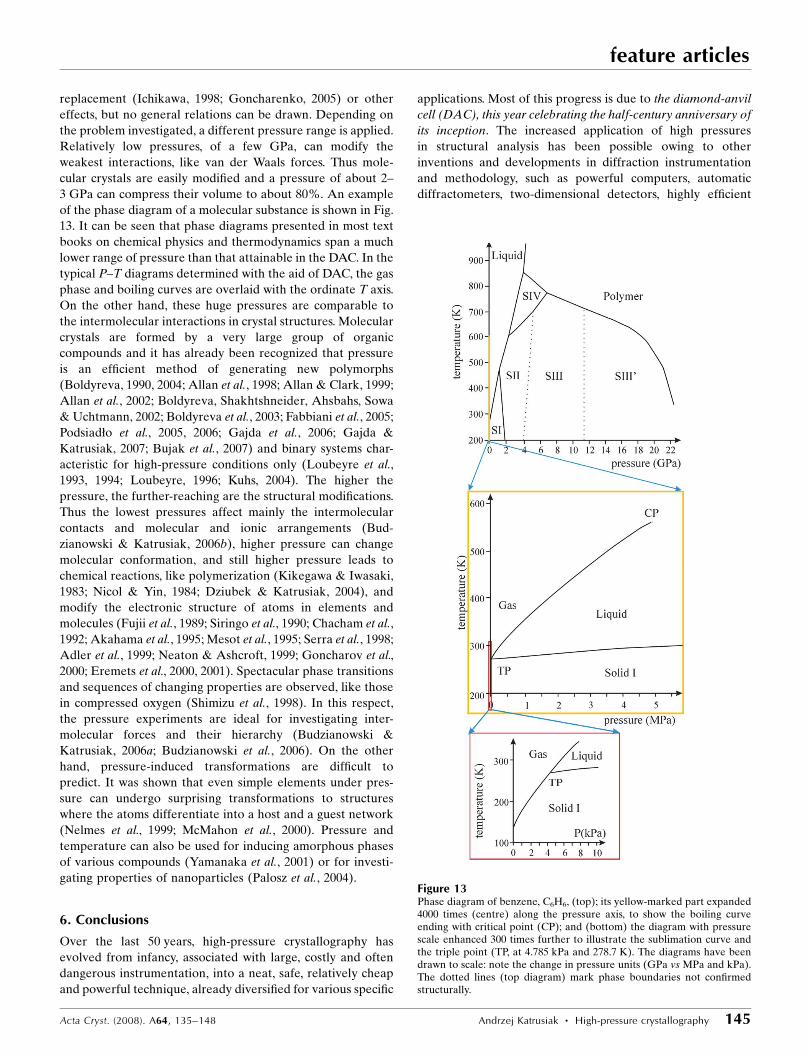
3 GPa can compress their volume to about 80%. An example
of the phase diagram of a molecular substance is shown in Fig.
13. It can be seen that phase diagrams presented in most text
books on chemical physics and thermodynamics span a much
lower range of pressure than that attainable in the DAC. In the
typical P–T diagrams determined with the aid of DAC, the gas
phase and boiling curves are overlaid with the ordinate T axis.
On the other hand, these huge pressures are comparable to
the intermolecular interactions in crystal structures. Molecular
crystals are formed by a very large group of organic
compounds and it has already been recognized that pressure
is an efficient method of generating new polymorphs
(Boldyreva, 1990, 2004; Allan et al., 1998; Allan & Clark, 1999;
Allan et al., 2002; Boldyreva, Shakhtshneider, Ahsbahs, Sowa
& Uchtmann, 2002; Boldyreva et al., 2003; Fabbiani et al., 2005;
Podsiadło et al., 2005, 2006; Gajda et al., 2006; Gajda &
Katrusiak, 2007; Bujak et al., 2007) and binary systems char-
acteristic for high-pressure conditions only (Loubeyre et al.,
1993, 1994; Loubeyre, 1996; Kuhs, 2004). The higher the
pressure, the further-reaching are the structural modifications.
Thus the lowest pressures affect mainly the intermolecular
contacts and molecular and ionic arrangements (Bud-
zianowski & Katrusiak, 2006b), higher pressure can change
molecular conformation, and still higher pressure leads to
chemical reactions, like polymerization (Kikegawa & Iwasaki,
1983; Nicol & Yin, 1984; Dziubek & Katrusiak, 2004), and
modify the electronic structure of atoms in elements and
molecules (Fujii et al., 1989; Siringo et al., 1990; Chacham et al.,
1992; Akahama et al., 1995; Mesot et al., 1995; Serra et al., 1998;
Adler et al., 1999; Neaton & Ashcroft, 1999; Goncharov et al.,
2000; Eremets et al., 2000, 2001). Spectacular phase transitions
and sequences of changing properties are observed, like those
in compressed oxygen (Shimizu et al., 1998). In this respect,
the pressure experiments are ideal for investigating inter-
molecular forces and their hierarchy (Budzianowski &
Katrusiak, 2006a; Budzianowski et al., 2006). On the other
hand, pressure-induced transformations are difficult to
predict. It was shown that even simple elements under pres-
sure can undergo surprising transformations to structures
where the atoms differentiate into a host and a guest network
(Nelmes et al., 1999; McMahon et al., 2000). Pressure and
temperature can also be used for inducing amorphous phases
of various compounds (Yamanaka et al., 2001) or for investi-
gating properties of nanoparticles (Palosz et al., 2004).
6. Conclusions
Over the last 50 years, high-pressure crystallography has
evolved from infancy, associated with large, costly and often
dangerous instrumentation, into a neat, safe, relatively cheap
and powerful technique, already diversified for various specific
applications. Most of this progress is due to the diamond-anvil
cell (DAC), this year celebrating the half-century anniversary of
its inception. The increased application of high pressures
in structural analysis has been possible owing to other
inventions and developments in diffraction instrumentation
and methodology, such as powerful computers, automatic
diffractometers, two-dimensional detectors, highly efficient
Acta Cryst. (2008). A64, 135–148 Andrzej Katrusiak � High-pressure crystallography 145
feature articles
Figure 13Phase diagram of benzene, C6H6, (top); its yellow-marked part expanded4000 times (centre) along the pressure axis, to show the boiling curveending with critical point (CP); and (bottom) the diagram with pressurescale enhanced 300 times further to illustrate the sublimation curve andthe triple point (TP, at 4.785 kPa and 278.7 K). The diagrams have beendrawn to scale: note the change in pressure units (GPa vs MPa and kPa).The dotted lines (top diagram) mark phase boundaries not confirmedstructurally.

methods of structure solution and refinement etc. Thanks to all
this progress, today it is possible to perform in a laboratory
structural determinations on crystals of minerals, ionic and
organic compounds, and even proteins; for specific cases, with
an accuracy comparable to that of results of measurements on
bare crystals. In synchrotron facilities, elastic and inelastic
scattering can be measured at extreme pressures and
temperatures on short time scales, and structures of much
more complex crystals determined. Neutron diffraction
experiments can be carried out to about 40 GPa (Gonchar-
enko, 2006).
The development of high-pressure methodology continues.
One can envisage several directions of improvement in the
area of high-pressure X-ray diffractometry in laboratories.
Brighter X-ray sources will be required for quicker data
collections on smaller samples enclosed in the DAC – thus
higher pressures and more precise results will be attainable in
laboratories. High-pressure measurements would be consid-
erably facilitated by fully automatic procedures for DAC
centring on diffractometers, fully automatic analysis of
diffraction images eliminating coincidences with diamond
reflections and simultaneous diffraction events, automatic
data reduction incorporating all corrections determined from
photographs of the pressure chamber, new efficient methods
for pressure calibration and complementary spectroscopic
analyses that could be performed ‘on-line’ with the diffraction
experiment, or availability of cheap larger diamond anvils to
increase the table/culet surface ratio and build better DAC’s
capable of reaching higher pressures automatically in pre-
programmed steps. With all these and other, currently not
conceivable, developments in the equipment and methods,
accompanied by a financial incentive for the commercial
suppliers of diffractometers generated by increased demand,
the thermodynamic parameter of pressure can become as
common in structural analysis as temperature or composition.
In certain respects, high-pressure structural experiments are
more convenient than those at low temperature. First of all, it
is possible to generate pressure away from the diffractometer,
and then the compressed crystal can be investigated by spec-
troscopic and diffractometric methods and practically stored
indefinitely in the DAC. This saves diffractometer time when
single crystals are grown in situ at elevated pressures. When
crystals are grown in the DAC, one can choose between
isothermal, isochoric and isobaric (at 0.1 MPa) crystallization,
and it is possible to adjust two thermodynamic parameters, T
and P, to any required value. The process of crystal growth is
most efficient close to the melting conditions, and one can
move along the melting curve by adjusting pressure and
temperature. Close to the melting curve, we have observed a
‘self-healing’ process, when faults in the faces of grown crystals
spontaneously repair. A single crystal fully filling the high-
pressure chamber is usually grown in an hour, and the healing
of faults requires halting the process (of increasing pressure or
lowering temperature) for minutes. The crystallization in the
DAC can be further modified by adding solvents and
conducting isochoric or isothermal freezing (van Valkenburg
et al., 1971; Fabbiani et al., 2005; Budzianowski & Katrusiak,
2006b). The high-pressure equipment and methodology for
crystallographic studies are constantly being developed.
Already structural results of high-pressure determinations
constitute a large database enormously contributing to all
materials sciences. For the last 50 years, high-pressure studies
of crystals have become the common element of research in
X-ray and neutron laboratories, and the number of crystal-
lographers employing high pressures and the scope of
problems tackled by high-pressure techniques are expected to
continue to increase.
Helpful discussions and preparation of photographs
presented in Figs. 6, 7 and 8 by Mr K. Dziubek and Mr M.
Podsiadło are gratefully acknowledged. This report was partly
supported by the Polish Ministry of Science and High
Education, Grant NN204 1956 33.
References
Adler, P., Schwarz, U., Syassen, K, Rozenberg, G. Kh., Machavariani,G. Yu., Milner, A. P., Pasternak, M. P. & Hanfland, M. (1999). Phys.Rev. B, 60, 4609–4617.
Ahsbahs, H. (1987). Prog. Cryst. Growth Charact. 14, 263–302.Ahsbahs, H. (2004). Z. Kristallogr. 219, 305–308.Akahama, Y., Kawamura, H., Haeuserman, D., Hanfland, M. &
Shimomura, O. (1995). Phys. Rev. Lett. 74, 4690–4693.Allan, D. R. & Clark, S. J. (1999). Phys. Rev. Lett. 82, 3464–3467.Allan, D. R., Clark, S. J., Brugmans, M. J. P., Ackland, G. J. & Vos,
W. L. (1998). Phys. Rev. B, 58, 11809–11812.Allan, D. R., Clark, S. J., Dawson, A., McGregor, P. A. & Parsons, S.
(2002). Acta Cryst. B58, 1018–1024.Allan, D. R., Clark, S. J., Parsons, S. & Ruf, M. (2000). J. Phys.
Condens. Matter, 12, L613–L618.Angel, R. J. (1993). J. Phys. Condens. Matter, 5, L141–L144.Angel, R. J. (2004). J. Appl. Cryst. 37, 486–492.Angel, R. J., Allan, D. R., Miletich, R. & Finger, L. W. (1997). J. Appl.
Cryst. 30, 461–466.Angel, R. J., Bujak, M., Zhao, J., Gatta, G. D. & Jacobsen, S. D. (2007).
J. Appl. Cryst. 40, 26–32.Angel, R. J., Downs, R. T. & Finger, L. W. (2000). Rev. Mineral.
Geochem. 41, 559–596.Barciszewski, J., Jurczak, J., Porowski, S., Specht, T. & Erdmann, V. A.
(1999). Eur. J. Biochem. 260, 293–307.Barnett, J. D., Block, S. & Piermarini, G. J. (1975). Rev. Sci. Intrum.
44, 3144–3150.Bell, P. M., Xu, J. A. & Mao, H. K. (1986). Shock Waves in Condensed
Matter, edited by Y. M. Gupta, pp. 125–130. New York: PlenumPress.
Bertani, R., Mali, M., Roos, J. & Brinkmann, D. (1990). J. Phys.Condens. Matter, 2, 7911–7923.
Bertani, R., Mali, M., Roos, J. & Brinkmann, D. (1992). Rev. Sci.Instrum. 63, 3303–3306.
Besson, J. M., Nelmes, R. J., Hamel, G., Loveday, J. S., Weil, G. & Hull,S. (1992). Physica (Utrecht), B180, 907–910.
Birch, F. (1986). J. Geophys. Res. 91, 4949–4954.Bloch, D. & Voiron, J. (1984). Condensed Matter Research Using
Neutrons, edited by S. W. Loversey & R. Scherm, NATO ASI SeriesB, Vol. 112, pp. 39–62. New York: Plenum.
Block, S., Weir, C. E. & Piermarini, G. J. (1965). Science, 148,947–948.
Boehler, R. (2006). Rev. Sci. Instrum. 77, 115103.Boehler, R. & De Hantsetters, K. (2004). High Press. Res. 24,
391–396.Boldyreva, E. V. (1990). React. Solids, 8, 269–282.
feature articles
146 Andrzej Katrusiak � High-pressure crystallography Acta Cryst. (2008). A64, 135–148
Boldyreva, E. V. (2004). High-Pressure Crystallography, edited byA. Katrusiak & P. F. McMillan, pp. 495–512. Dordrecht: KluwerAcademic Publishers.
Boldyreva, E. V., Ahsbahs, H. & Weber, H.-P. (2003). Z. Kristallogr.218, 231–236.
Boldyreva, E. V., Shakhtshneider, T. P., Ahsbahs, H., Sowa, H. &Uchtmann, H. (2002). J. Thermal Anal. Calorim. 66, 437–452.
Boldyreva, E. V., Shakhtshneider, T. P., Ahsbahs, H., Uchtmann, H.,Burgina, E. B. & Baltakhinov, V. P. (2002). Pol. J. Chem. 76,1333–1346.
Brash, J. W. (1965a). Spectrochim. Acta, 21, 1183–1188.Brash, J. W. (1965b). J. Chem. Phys. 43, 3473–3476.Brazhkin, V. V., Lyapin, A. G. & Hemley, R. J. (2002). Philos. Mag. 82,
231–253.Bridgman, P. W. (1937). Proc. Am. Acad. Arts Aci. 71, 387–460.Bridgman, P. W. (1949). The Physics of High Pressure. London: Bell
and Sons.Bridgman, P. W. (1950). Proc. R. Soc. London Ser. A, 203, 1–17.Bridgman, P. W. (1952). Proc. Am. Acad. Arts Aci. 81, 167–251.Budzianowski, A. & Katrusiak, A. (2004). High-Pressure Crystal-
lography, edited by A. Katrusiak & P. F. McMillan, pp. 101–112.Dordrecht: Kluwer Academic Publishers.
Budzianowski, A. & Katrusiak, A. (2006a). Acta Cryst. B62, 94–101.Budzianowski, A. & Katrusiak, A. (2006b). J. Phys. Chem. B, 110,
9755–9758.Budzianowski, A., Olejniczak, A. & Katrusiak, A. (2006). Acta Cryst.
B62, 1078–1089.Bujak, M. & Angel, R. J. (2006). J. Phys. Chem. B, 110, 10322–10331.Bujak, M., Budzianowski, A. & Katrusiak, A. (2004). Z. Kristallogr.
219, 573–579.Bujak, M., Dziubek, K. & Katrusiak, A. (2007). Acta Cryst. B63,
124–131.Bujak, M. & Katrusiak, A. (2004). Z. Kristallogr. 219, 669–674.Busing, W. R. & Levy, H. A. (1967). Acta Cryst. 22, 457–464.Chacham, H., Zhu, X. & Louie, S. G. (1992). Phys. Rev. B, 46,
6688–6699.Chervin, J. C., Canny, B., Besson, J. M. & Pruzan, P. (1995). Rev. Sci.
Instrum. 66, 2595–2598.Chervin, J. C., Power, Ch. & Polian, A. (2005). High Press. Res. 25,
97–105.Crichton, W. A. & Mezouar, Z. (2004). High-Pressure Crystal-
lography, edited by A. Katrusiak & P. F. McMillan, pp. 113–130.Dordrecht: Kluwer Academic Publishers.
Dadashev, A., Pasternak, M. P., Rozenberg, G. Kh. & Taylor, R. D.(2001). Rev. Sci. Instrum. 72, 2633–2637.
Datchi, F., LeToullec, R. & Loubeyre, P. (1997). J. Appl. Phys. 81,3333–3339.
Dawson, A., Allan, D. R., Parsons, S. & Ruf, M. (2004). J. Appl. Cryst.37, 410–416.
Denner, W., Schulz, H. & d’Amour, H. (1978). J. Appl. Cryst. 11,260–264.
Dera, P. & Katrusiak, A. (1999). J. Appl. Cryst. 32, 510–515.Dunstan, D. J. (1989). Rev. Sci. Instrum. 60, 3789–3795.Dunstan, D. J. & Spain, I. L. (1989). J. Phys. E Sci. Instrum. 22,
913–923.Dyadin, Y. A., Aladko, E. Y., Udachin, K. A. & Tkacz, M. (1994). Pol.
J. Chem. 68, 343–348.Dziubek, K. F. & Katrusiak, A. (2004). J. Phys. Chem. B, 108,
19089–19092.Dziubek, K. F., Podsiadlo, M. & Katrusiak, A. (2007). J. Am. Chem.
Soc. 129, 12620–12621.Edvards, P. P. & Hensel, F. (1997). Nature (London), 388, 621–622.Eremets, M. I. (1996). High Pressure Experimental Methods. Oxford
University Press.Eremets, M. I., Gregoryanz, E. A., Struzhkin, V. V., Mao, H.-K. &
Hemley, R. J. (2000). Phys. Rev. Lett. 85, 2797–2800.Eremets, M. I., Hemley, R. J., Mao, H.-K. & Gregoryanz, E. (2001).
Nature (London), 411, 170–174.
Fabbiani, F. P. A., Allan, D. R., Parsons, S. & Pulham, C. R. (2005).CrystEngComm, 7, 179–186.
Fabbiani, F. P. A. & Pulham, C. R. (2006). Chem. Soc. Rev. 35,932–942.
Finger, L. W. & King, H. E. (1978). Am. Mineral. 63, 337–342.Fiquet, G. & Andrault, D. (1999). J. Synchrotron Rad. 6, 81–86.Forman, R. A., Piermarini, G. J., Barnett, J. D. & Block, S. (1972).
Science, 176, 284–285.Fourme, R. (1968). J. Appl. Cryst. 1, 23–30.Fourme, R., Girard, E., Kahn, R., Ascone, I., Mezouar, M., Lin, T. &
Johnson, J. E. (2004). High-Pressure Crystallography, edited byA. Katrusiak & P. F. McMillan, pp. 537–542. Dordrecht: KluwerAcademic Publishers.
Fujii, Y., Hase, K., Ohishi, Y., Fujihisa, H., Hamaya, N., Takemura, K.,Shimomura, O., Kikegawa, T., Amemiya, Y. & Matsushita, T.(1989). Phys. Rev. Lett. 63, 536–539.
Gajda, R., Dziubek, K. & Katrusiak, A. (2006). Acta Cryst. B62,86–93.
Gajda, R. & Katrusiak, A. (2007). Acta Cryst. B63, 111–117.Gauzzi, A., Gilioli, E., Licci, F., Prodi, A., Bolzoni, F., Marezio, M.,
Massidda, S., Bernardini, F., Continenza, A. & Radaelli, P. G.(2004). High-Pressure Crystallography, edited by A. Katrusiak &P. F. McMillan, pp. 429–446. Dordrecht: Kluwer AcademicPublishers.
Girard, E., Dhaussy, A.-C., Couzinet, B., Chervin, J.-C., Mezouar, M.,Kahn, R., Ascone, I. & Fourme, R. (2007). J. Appl. Cryst. 40,912–918.
Glazkov, V. P., Goncharenko, I. N., Irodova, V. A., Somenkov, V. A.,Shilstein, S. S., Besedin, S. P., Makarenko, I. N. & Stishov, S. M.(1989). J. Phys. Chem. 163, 509–514.
Goncharenko, I. N. (2004). High-Pressure Crystallography, edited byA. Katrusiak & P. F. McMillan, pp. 321–340. Dordrecht: KluwerAcademic Publishers.
Goncharenko, I. N. (2005). Phys. Rev. Lett. 94, 20571.Goncharenko, I. N. (2006). Acta Cryst. A62, s95.Goncharov, A. F., Gregoryanz, E., Mao, H.-K., Liu, Z. & Hemley, R. J.
(2000). Phys. Rev. Lett. 85, 1262–1265.Gruner, S. M. (2004). High-Pressure Crystallography, edited by A.
Katrusiak & P. F. McMillan, pp. 543–556. Dordrecht: KluwerAcademic Publishers.
Hamilton, W. C. (1974). International Tables for X-ray Crystal-lography, Vol. IV, pp. 273–284. Birmingham: Kynoch Press.
Hazen, R. M. & Finger, L. W. (1982). Comparative Crystal Chemistry.New York: John Wiley and Sons.
Hemley, R. J. (1998). Science, 281, 1296–1297.Hemley, R. J. & Ashcroft, N. W. (1998). Phys. Today, 51, 26–32.Holzapfel, W. B. & Isaacs, N. I. (1997). High-Pressure Techniques in
Chemistry and Physics. Oxford University Press.Hostettler, M. & Schwarzenbach, D. (2005). C. R. Chim. 8, 147–156.Huppertz, H. (2004). Z. Kristallogr. 219, 330–338.Ichikawa, M. (1998). Pol. J. Chem. 72, 230–240.Jackson, S. M., Nield, V. M., Whitworth, R. W., Oguro, M. & Wilson,
C. C. (1997). J. Phys. Chem. B, 101, 6142–6145.Jamieson, J. C. (1957). J. Geol. 65, 334–343.Jamieson, J. C., Lawson, A. W. & Nachtrieb, N. D. (1959). Rev. Sci.
Instrum. 30, 1016–1019.Jayaraman, A. (1983). Rev. Mod. Phys. 55, 65–108.Kabalkina, S. S. & Troitskaya, Z. V. (1961). J. Struct. Chem. 2,
22–26.Kabalkina, S. S. & Vereshchagin, L. F. (1960). Dokl. Acad. Sci. USSR,
131, 300–302.Katrusiak, A. (1999). J. Appl. Cryst. 32, 1021–1023.Katrusiak, A. (2001). Z. Kristallogr. 216, 646–647.Katrusiak, A. (2004a). High-Pressure Crystallography, edited by
A. Katrusiak & P. F. McMillan, pp. 57–68. Dordrecht: KluwerAcademic Publishers.
Katrusiak, A. (2004b). Z. Kristallogr. 219, 461–467.Katrusiak, A. (2004c). Acta Cryst. A60, 409–417.
Acta Cryst. (2008). A64, 135–148 Andrzej Katrusiak � High-pressure crystallography 147
feature articles
Katrusiak, A. & Dauter, Z. (1996). Acta Cryst. D52, 607–608.Katrusiak, A. & McMillan, P. F. (2004). Editors. High-Pressure
Crystallography. Dordrecht: Kluwer Academic Publishers.Kawada, S. (1972). J. Phys. Soc. Jpn, 32, 1442.Keller, R. & Holzapfel, W. B. (1977). Rev. Sci. Instrum. 48, 512.Khvostantsev, L. G., Slesarev, V. N. & Brazhkin, V. V. (2004). High
Press. Res. 24, 371–383.Khvostantsev, L. G., Vereshchagin, L. F. & Novikov, A. P. (1977).
High Temp. High Press. 9, 637–639.Kikegawa, T. & Iwasaki, H. (1983). Acta Cryst. B39, 158–164.King, H. E. & Finger, L. W. (1979). J. Appl. Cryst. 12, 374–378.Kim, E., Pang, T., Utsumi, W., Solozhenko, V. L. & Zhao, Y. (2007).
Phys. Rev. B, 75, 18418.Klug, D. D. & Whalley, E. (1983). Rev. Sci. Instrum. 54, 1205–1208.Konno, M., Okamoto, T. & Shirotani, I. (1989). Acta Cryst. B45,
142–147.Kuhs, W. F. (2004). High-Pressure Crystallography, edited by A.
Katrusiak & P. F. McMillan, pp. 475–494. Dordrecht: KluwerAcademic Publishers.
Kuhs, W. F., Bauer, F. C., Hausmann, R., Ahsbahs, H., Doewarth, R. &Hoelzer, K. (1996). High Press. Res. 14, 341–352.
Kundrot, C. E. & Richards, F. M. (1986). J. Appl. Cryst. 19, 208–213.Kunz, M. (2001). Phase Transformations in Materials, edited by G.
Kostorz, pp. 655–696. Weinheim: Wiley-VCH.Lacam, A. & Chateau, C. (1989). J. Appl. Phys. 66, 366–372.Lawson, A. W. & Tang, T. Y. (1950). Rev. Sci. Instrum. 21, 815.Lee, H.-S, Luszczycki, K., Norberg, R. E. & Conradi, M. S. (1987).
Rev. Sci. Instrum. 58, 415–417.Leger, J. M., Chateau, C. & Lacam, A. (1990). J. Appl. Phys. 68,
2351–2354.Line, C. M. B. & Whitworth, R. W. (1996). J. Chem. Phys. 104,
10008–10013.Lobban, C., Finney, J. L. & Kuhs, W. F. (1997). Nature (London), 391,
268–270.Loubeyre, P. (1996). High Press. Res. 14, 353–361.Loubeyre, P., Jean-Louis, M., LeToullec, R. & Charon-Gerard, L.
(1993). Phys. Rev. Lett. 70, 178–181.Loubeyre, P., LeToullec, R. & Pinceaux, J.-P. (1994). Phys. Rev. Lett.
72, 1360–1363.Loveday, J. S., McMahon, M. I. & Nelmes, R. J. (1990). J. Appl. Cryst.
23, 392–396.McMahon, M. I. (2004). High-Pressure Crystallography, edited by
A. Katrusiak & P. F. McMillan, pp. 1–20. Dordrecht: KluwerAcademic Publishers.
McMahon, M. I., Bovornratanaraks, T., Allan, D. R., Belmonte, S. A.& Nelmes, R. J. (2000). Phys. Rev. B, 61, 3135–3138.
McWhan, D. B. (1984). Rev. Phys. Appl. 19, 715–718.Malinowski, M. (1987). J. Appl. Cryst. 20, 379–382.Mao, H.-K. & Bell, P. M. (1978). Science, 102, 1145–1147.Mao, H.-K., Jephcoat, A. P., Hemley, R. J., Finger, L. W., Zha, C. S.,
Hazen, R. M. & Cox, D. E. (1988). Science, 239, 1131–1134.Meade, C. & Jeanloz, R. (1990). Rev. Sci. Instrum. 61, 2571–2580.Merrill, L. & Bassett, W. A. (1974). Rev. Sci. Instrum. 45,
290–294.Mesot, J., Medarde, M., Rosenkranz, S., Fisher, P., Lacorre, P. &
Gobrecht, K. (1995). High Press. Res. 14, 35–40.Miletich, R., Allan, D. R. & Kuhs, W. F. (2000). Rev. Mineral.
Geochem. 41, 445–519.Mizuki, J. & Endoh, Y. (1981). J. Phys. Soc. Jpn, 50, 914–919.Neaton, J. B. & Ashcroft, N. W. (1999). Nature (London), 400,
141–144.Nelmes, R. J., Allan, D. R., McMahon, M. I. & Belmonte, S. A. (1999).
Phys. Rev. Lett. 83, 4081–4084.Nelmes, R. J., Hatton, P. D., McMahon, M. I., Piltz, R. O., Crain, J.,
Cernik, R. J. & Dushnell-Wye, G. (1992). Rev. Sci. Instrum. 63,1039–1042.
Nicol, M. & Yin, G. Z. (1984). J. Phys. Colloque C8, 48, 163–172.Palosz, B., Stel’makh, S., Grzanka, E., Gierlotka, S., Pielaszek, R.,
Bismayer, U., Werner, S. & Palosz, W. (2004). J. Phys. Condens.Matter, 16, S353–S377.
Parise, J. B. (2004). High-Pressure Crystallography, edited by A.Katrusiak & P. F. McMillan, pp. 101–112. Dordrecht: KluwerAcademic Publishers.
Pasternak, M. P., Rozenberg, G. Kh., Xu, W. M. & Taylor, R. D.(2004). High-Pressure Crystallography, edited by A. Katrusiak &P. F. McMillan, pp. 311–320. Dordrecht: Kluwer AcademicPublishers.
Pauling, L. (1939). The Nature of the Chemical Bond and the Structureof Molecules and Crystals. Cornell University Press.
Paureau, J. & Vettier, C. (1975). Rev. Sci. Instrum. 64, 1484–1488.Piermarini, G. J. (2001). J. Res. Natl Inst. Stand. Technol. 106,
889–920.Piermarini, G. J. & Block, S. (1975). Rev. Sci. Instrum. 46,
973–979.Piermarini, G. J., Block, S. & Barnett, J. D. (1973). J. Appl. Phys. 44,
5377–5382.Piermarini, G. J., Block, S., Barnett, J. D. & Forman, R. A. (1975). J.
Appl. Phys. 46, 2774–2780.Piltz, R. O., McMahon, M. I., Crain, J., Hatton, P. D., Nelmes, R. J.,
Cernik, R. J. & Bushnell-Wye, G. (1992). Rev. Sci. Instrum. 63,700–703.
Podsiadło, M., Dziubek, K. & Katrusiak, A. (2005). Acta Cryst. B61,595–600.
Podsiadło, M., Dziubek, K., Szafranski, M. & Katrusiak, A. (2006).Acta Cryst. B62, 1090–1098.
Prewitt, C. T., Coppens, P., Phillips, J. C. & Finger, L. W. (1987).Science, 238, 312–318.
Schiferl, D. (1977). Rev. Sci. Instrum. 58, 1316–1317.Seal, M. (1984). High Temp. High Press. 16, 573–579.Serra, S., Chiarotti, G., Scandolo, S. & Tosatti, E. (1998). Phys. Rev.
Lett. 80, 5160–5163.Shimizu, H., Kumazaki, T., Kume, T. & Sasaki, S. (2002). J. Phys.
Chem. B, 106, 30–33.Shimizu, K., Suhara, K., Ikumo, M., Eremets, M. I. & Amaya, K.
(1998). Nature (London), 393, 767–768.Shimomura, O., Takemura, K., Fujihisa, H., Fujii, Y., Ohishi, Y.,
Kikegawa, T., Amemiya, Y. & Matsushita, T. (1992). Rev. Sci.Instrum. 63, 967–972.
Shobu, T., Noda, Y., Iwasa, K., Hannan, A., Koghi, M., Ishimatsu, N.& Shimomura, O. (2001). J. Phys. Soc. Jpn, 70, 1162–1163.
Siringo, F., Pucci, R. & March, N. H. (1990). High Press. Res. 2,109–134.
Somenkov, V. A. (2005). J. Phys. Condens. Matter, 17,S2991–S3003.
Stishov, S. M. & Popova, S. V. (1961). Geokhimiya, 10, 923–926.Struzhkin, V. V., Hemley, R. J., Mao, H.-K. & Timofeev, Yu. A. (1997).
Nature (London), 390, 382–384.Tkacz, M. & Drickamer, H. G. (1986). J. Chem. Phys. 85, 1184–1189.Valkenburg, A. van (1962). Rev. Sci. Instrum. 33, 1462.Valkenburg, A. van, Mao, H.-K. & Bell, P. M. (1971). Carnegie Inst.
Washington Yearb. 70, 237–238.Voiron, J. & Vettier, C. (1987). High Pressure Chemistry and
Biochemistry, edited by R. van Eldik & J. Jonas, pp. 237–262.Dordrecht: Reidel.
Weir, C. E., Lippincott, E. R., van Valkenburg, A. & Bunting, E. N.(1959). J. Res. Natl Bur. Stand. Technol. 63A, 55–62.
Yagi, T. (1985). J. Phys. Chem. Solids, 39, 563–571.Yamanaka, T., Fukuda, T., Hattori, T. & Sumiya, Y. (2001). Rev. Sci.
Instrum. 72, 1458–1462.Yamanaka, T., Nagai, T. & Tsuchiya, T. (2001). Z. Kristallogr. 212,
401–462.Yousuf, M. & Rajan, K. G. (1982). Pramana, 18, 1–15.
feature articles
148 Andrzej Katrusiak � High-pressure crystallography Acta Cryst. (2008). A64, 135–148