Embed Size (px)
Citation preview
Corporate Presentation
February 2018
TSX/NYSE FNV
Cautionary StatementForward Looking StatementsThis presentation contains “forward looking information” and “forward looking statements” within the meaning of applicable Canadian securities laws and the United States Private Securities Litigation Reform Act of 1995, respectively, which mayinclude, but are not limited to, statements with respect to future events or future performance, management’s expectations regarding Franco‐Nevada’s growth, results of operations, estimated future revenues, carrying value of assets, futuredividends and requirements for additional capital, mineral reserve and mineral resource estimates, production estimates, production costs and revenue, future demand for and prices of commodities, expected mining sequences, business prospectsand opportunities and the completion of previously announced transactions, including Cobre Panama. In addition, statements (including data in tables) relating to reserves and resources and gold equivalent ounces are forward looking statements, asthey involve implied assessment, based on certain estimates and assumptions, and no assurance can be given that the estimates and assumptions are accurate and that such reserves and resources and gold equivalent ounces will be realized. Suchforward looking statements reflect management’s current beliefs and are based on information currently available to management. Often, but not always, forward looking statements can be identified by the use of words such as “plans”, “expects”,“is expected”, “budgets”, “scheduled”, “estimates”, “forecasts”, “predicts”, “projects”, “intends”, “targets”, “aims”, “anticipates” or “believes” or variations (including negative variations) of such words and phrases or may be identified by statementsto the effect that certain actions “may”, “could”, “should”, “would”, “might” or “will” be taken, occur or be achieved. Forward looking statements involve known and unknown risks, uncertainties and other factors, which may cause the actual results,performance or achievements of Franco‐Nevada to be materially different from any future results, performance or achievements expressed or implied by the forward looking statements. A number of factors could cause actual events or results todiffer materially from any forward looking statements, including, without limitation: fluctuations in the prices of the primary commodities that drive royalty and stream revenue (gold, platinum group metals, copper, nickel, uranium, silver, iron‐oreand oil and gas); fluctuations in the value of the Canadian and Australian dollar, Mexican Peso and any other currency in which revenue is generated, relative to the U.S. dollar; changes in national and local government legislation, including permittingand licensing regimes and taxation policies, and the enforcement thereof; regulatory, political or economic developments in any of the countries where properties in which Franco‐Nevada holds a royalty, stream or other interest are located orthrough which they are held; risks related to the operators of the properties in which Franco‐Nevada holds a royalty, stream or other interest, including changes in the ownership and control of such operators; influence of macroeconomicdevelopments; business opportunities that become available to, or are pursued by Franco‐Nevada; reduced access to debt and equity capital; litigation; title, permit or license disputes related to interests on any of the properties in which Franco‐Nevada holds a royalty, stream or other interest; whether or not Franco‐Nevada is determined to have “passive foreign investment company” (“PFIC”) status as defined in Section 1297 of the United States Internal Revenue Code of 1986, as amended;potential changes in Canadian tax treatment of offshore streams; excessive cost escalation as well as development, permitting, infrastructure, operating or technical difficulties on any of the properties in which Franco‐Nevada holds a royalty, streamor other interest; actual mineral content may differ from the reserves and resources contained in technical reports; rate and timing of production differences from resource estimates, other technical reports and mine plans; risks and hazardsassociated with the business of development and mining on any of the properties in which Franco‐Nevada holds a royalty, stream or other interest, including, but not limited to unusual or unexpected geological and metallurgical conditions, slopefailures or cave‐ins, flooding and other natural disasters, terrorism, civil unrest or an outbreak of contagious disease; and the integration of acquired assets. The forward looking statements contained in this presentation are based upon assumptionsmanagement believes to be reasonable, including, without limitation: the ongoing operation of the properties in which Franco‐Nevada holds a royalty, stream or other interest by the owners or operators of such properties in a manner consistent withpast practice; the accuracy of public statements and disclosures made by the owners or operators of such underlying properties; no material adverse change in the market price of the commodities that underlie the asset portfolio; Franco‐Nevada’songoing income and assets relating to determination of its PFIC status; no material changes to existing tax treatment; no adverse development in respect of any significant property in which Franco‐Nevada holds a royalty, stream or other interest; theaccuracy of publicly disclosed expectations for the development of underlying properties that are not yet in production; integration of acquired assets; risks related to the completion of previously announced transactions, including Cobre Panama;and the absence of any other factors that could cause actions, events or results to differ from those anticipated, estimated or intended. However, there can be no assurance that forward looking statements will prove to be accurate, as actual resultsand future events could differ materially from those anticipated in such statements and investors are cautioned that forward looking statements are not guarantees of future performance. Franco‐Nevada cannot assure investors that actual resultswill be consistent with these forward looking statements and investors should not place undue reliance on forward looking statements due to the inherent uncertainty therein. For additional information with respect to risks, uncertainties andassumptions, please refer to the “Risk Factors” section of Franco‐Nevada’s most recent Annual Information Form filed with the Canadian securities regulatory authorities on www.sedar.com and Franco‐Nevada’s most recent Annual Report filed onForm 40‐F filed with the SEC on www.sec.gov. The forward‐looking statements herein are made as of the date herein only and Franco‐Nevada does not assume any obligation to update or revise them to reflect new information, estimates or opinions,future events or results or otherwise, except as required by applicable law.
Non‐IFRS MeasuresAdjusted Net Income, Adjusted EBITDA and Margin are intended to provide additional information only and should not be considered in isolation or as a substitute for measures of performance prepared in accordance with International FinancialReporting Standards (“IFRS”). They do not have any standardized meaning under IFRS, and may not be comparable to similar measures presented by other issuers. Management uses these measures to evaluate the underlying operating performanceof the Company as a whole for the reporting periods presented, to assist with the planning and forecasting of future operating results, and to supplement information in its financial statements. The Company also uses Margin in its annual incentivecompensation process to evaluate management’s performance in increasing revenue and containing costs. Management believes that in addition to measures prepared in accordance with IFRS such as Net Income and Earnings per Share (“EPS”), ourinvestors and analysts use these measures to evaluate the results of the underlying business of the Company, particularly since the excluded items are typically not included in guidance. While the adjustments to Net Income and EPS include items thatare both recurring and non‐recurring, management believes these measures are useful measures of the Company’s performance because they adjust for items which may not relate to or have a disproportionate effect on the period in which they arerecognized, impact the comparability of our core operating results from period to period, are not always reflective of the underlying operating performance of our business, and/or are not necessarily indicative of future operating results. For areconciliation of these measures to various IFRS measures, please see the end of this presentation or the Company’s most recent Management’s Discussion and Analysis filed with the Canadian securities regulatory authorities on www.sedar.com andwith the SEC on www.sec.gov.This presentation does not constitute an offer to sell or a solicitation of an offer to purchase any security in any jurisdiction.
2
TSX/NYSE FNV
-100%
-50%
0%
50%
100%
150%
200%
250%
300%
350%
400%
450%
500%
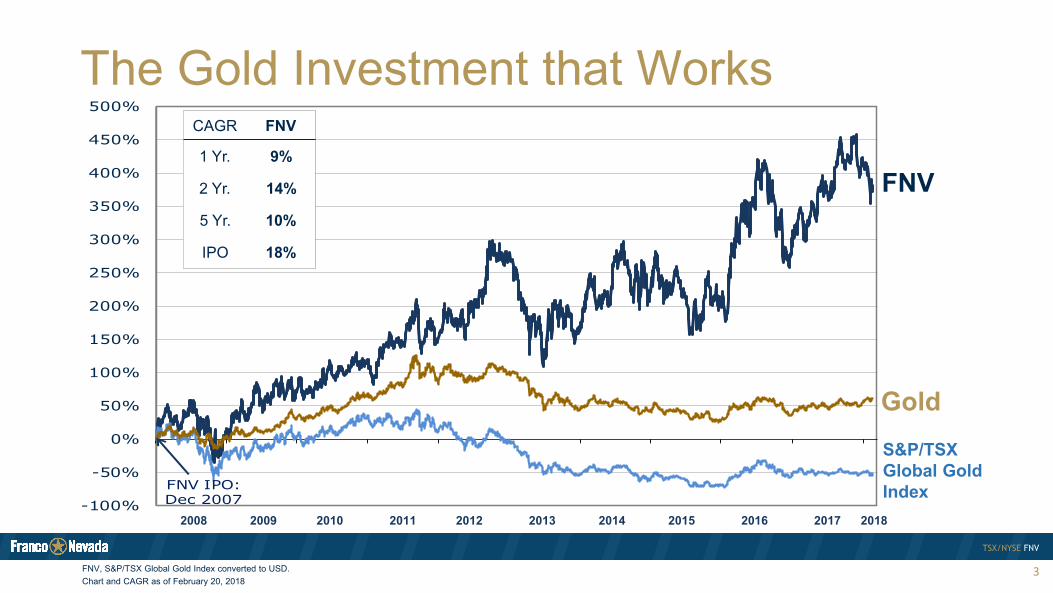
FNV IPO: Dec 2007
2008 2009 2010 2011 2012 2013 2014 2015 2016 2017 2018
The Gold Investment that Works
FNV
GoldS&P/TSX Global Gold Index
CAGR FNV
1 Yr. 9%
2 Yr. 14%
5 Yr. 10%
IPO 18%
FNV, S&P/TSX Global Gold Index converted to USD. Chart and CAGR as of February 20, 2018
3
TSX/NYSE FNV
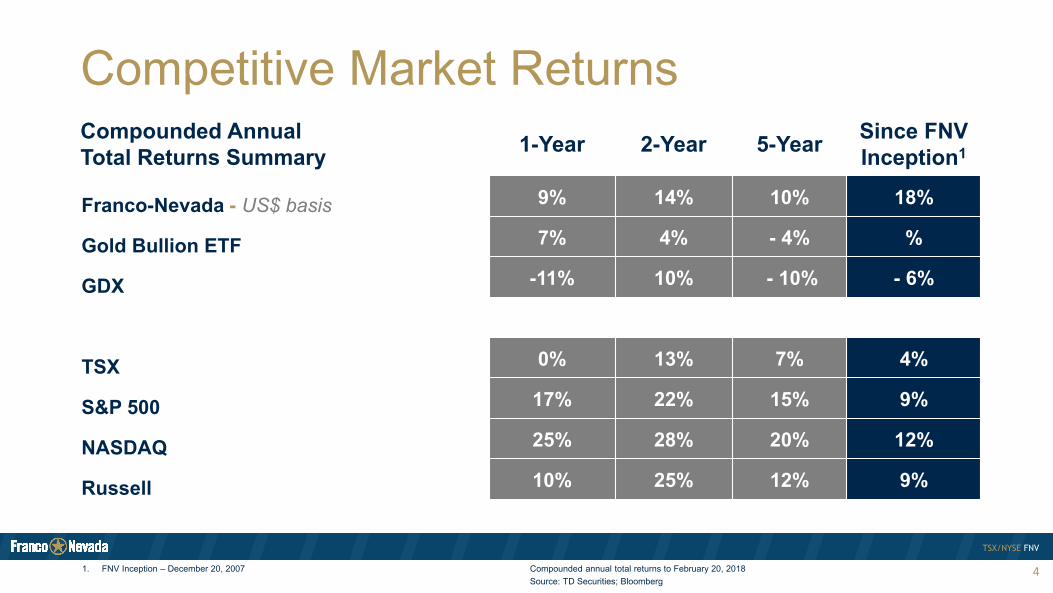
Competitive Market ReturnsCompounded Annual Total Returns Summary 1-Year 2-Year 5-Year Since FNV
Inception1
Franco-Nevada - US$ basis 9% 14% 10% 18%
Gold Bullion ETF 7% 4% - 4% %
GDX -11% 10% - 10% - 6%
TSX 0% 13% 7% 4%
S&P 500 17% 22% 15% 9%
NASDAQ 25% 28% 20% 12%
Russell 10% 25% 12% 9%
1. FNV Inception – December 20, 2007 Compounded annual total returns to February 20, 2018Source: TD Securities; Bloomberg
4

TSX/NYSE FNV
Outperforming in Bull and Bear Markets
5Source: TD Securities; Bloomberg All returns are in US$Total return assumes reinvestment of dividends over designated period
32%
(6%)
34%
14%
(14%)
10%
1%
(33%)
31%
(40%)
(20%)
–
20%
40%
Bull Market(2008 - 2012)
Bear Market(2013 - 2015)
Bull Market(2016 - 2017)
Franco-Nevada Gold GDX
TSX/NYSE FNV
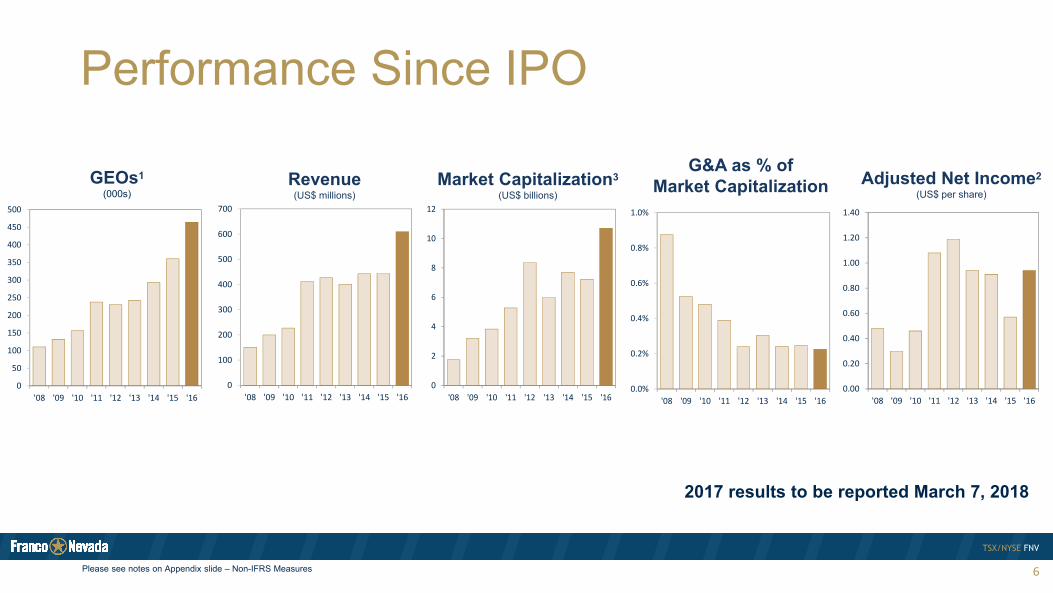
Performance Since IPO
GEOs1
(000s)
G&A as % of Market CapitalizationRevenue
(US$ millions)Adjusted Net Income2
(US$ per share)Market Capitalization3
(US$ billions)
0
50
100
150
200
250
300
350
400
450
500
'08 '09 '10 '11 '12 '13 '14 '15 '160
100
200
300
400
500
600
700
'08 '09 '10 '11 '12 '13 '14 '15 '160
2
4
6
8
10
12
'08 '09 '10 '11 '12 '13 '14 '15 '160.00
0.20
0.40
0.60
0.80
1.00
1.20
1.40
'08 '09 '10 '11 '12 '13 '14 '15 '160.0%
0.2%
0.4%
0.6%
0.8%
1.0%
'08 '09 '10 '11 '12 '13 '14 '15 '16
6Please see notes on Appendix slide – Non-IFRS Measures
2017 results to be reported March 7, 2018
TSX/NYSE FNV
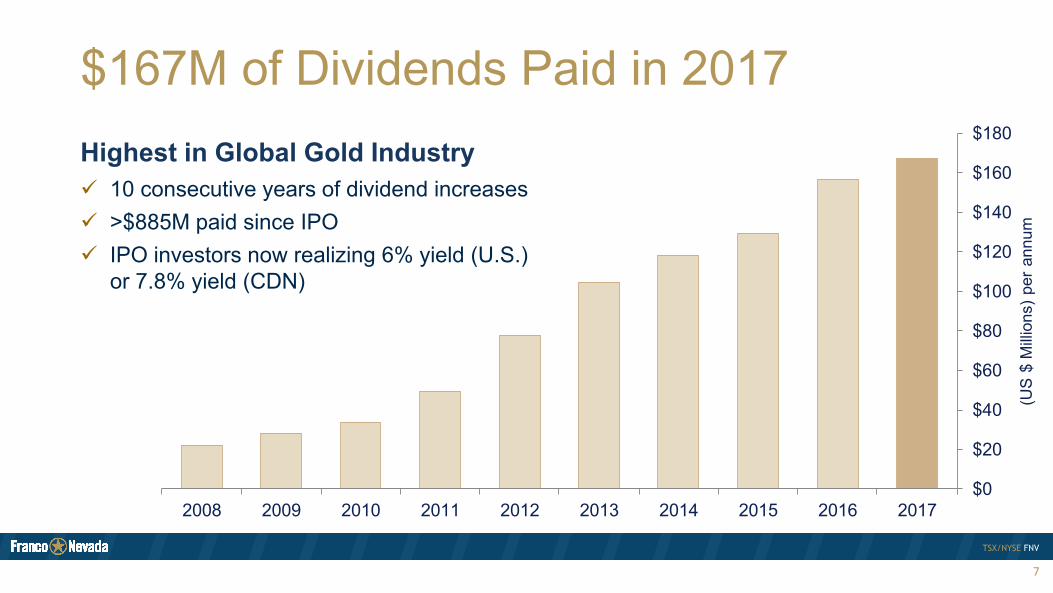
$167M of Dividends Paid in 2017
10 consecutive years of dividend increases >$885M paid since IPO IPO investors now realizing 6% yield (U.S.)
or 7.8% yield (CDN)
Highest in Global Gold Industry
7
2008 2009 2010 2011 2012 2013 2014 2015 2016 2017$0
$20
$40
$60
$80
$100
$120
$140
$160
$180
(US
$ M
illio
ns)
per
annu
m
TSX/NYSE FNV
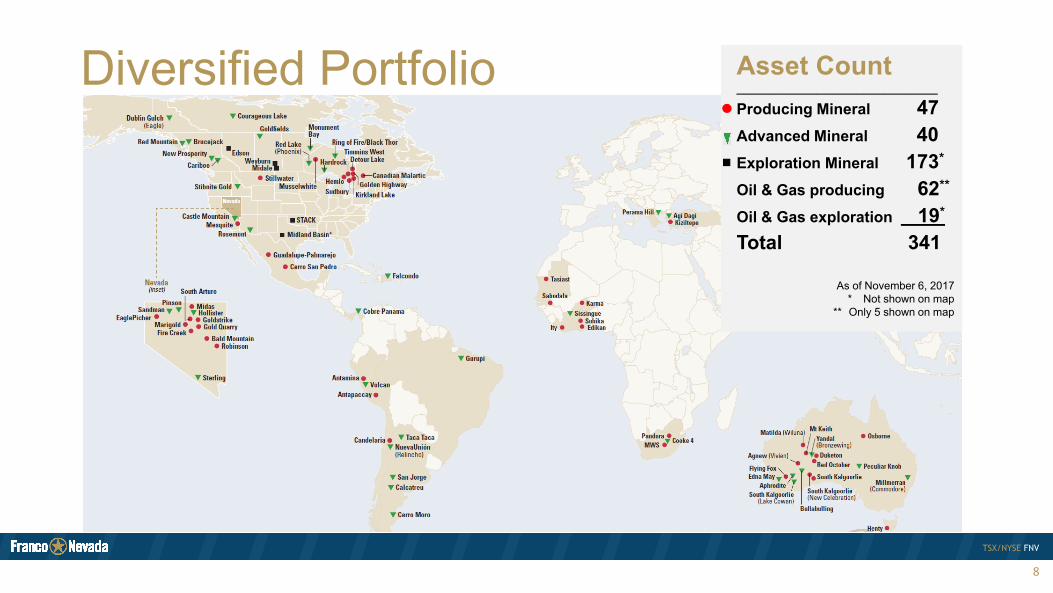
Diversified Portfolio Asset Count______________________________
Producing Mineral 47Advanced Mineral 40Exploration Mineral 173*
Oil & Gas producing 62**
Oil & Gas exploration 19*
Total 341
As of November 6, 2017* Not shown on map
** Only 5 shown on map
8

TSX/NYSE FNV
Organic Portfolio Growth
9
NEAR TERM2018Tasiast (Mauritania) phase 1 expansion Q2Subika/Ahafo (Ghana) commercial production H2Cerro Moro (Argentina) start-up in Q2Brucejack (British Columbia) production ramp-upSissingue (Côte d’Ivoire) start-up in H12019Cobre Panama (Panama) ramp-upCandelaria (Chile) new pit fleetIty (Côte d’Ivoire) CIL productionMusselwhite (Ontario) materials handling projectSubika/Ahafo (Ghana) mill expansion2020Cobre Panama (Panama) ramp-upTasiast (Mauritania) phase 2 expansionOrion O&G (Alberta) phase 2B + 2C expansions2021Stillwater (Montana) Blitz production adds >50%
EXPECTED DEVELOPMENTRosemont (Arizona) West Detour (Ontario)Hardrock (Ontario) Agi Dagi/Camyurt (Turkey)South Arturo (Nevada)Castle Mountain (California)Macassa (Ontario)SCOOP/STACK O&G (Oklahoma)Permian Basin O&G (Texas)
EXPLORATION GROWTHHemlo (Ontario)Bald Mountain (Nevada)Tasiast Sud (Mauritania)Marigold (Nevada)Duketon (Australia)Guadalupe (Mexico)Canadian Malartic (Ontario)
TSX/NYSE FNV
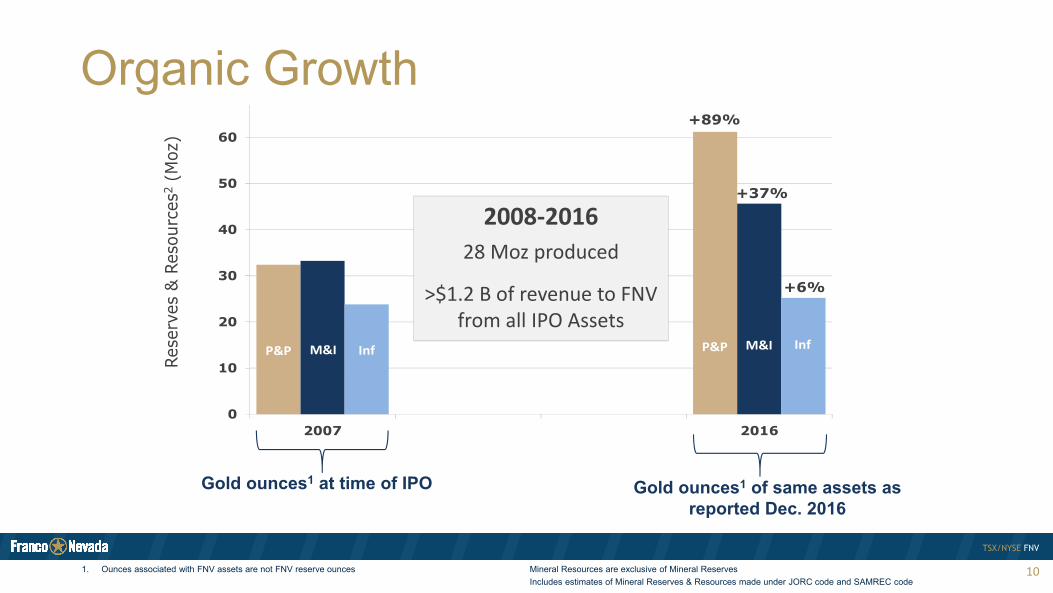
Organic Growth
10
0
10
20
30
40
50
60
2007 2016
Rese
rves
& R
esou
rces
2(M
oz)
+89%
+37%
+6%
P&P M&I Inf P&P M&I Inf
Gold ounces1 at time of IPO Gold ounces1 of same assets as reported Dec. 2016
2008‐201628 Moz produced
>$1.2 B of revenue to FNV from all IPO Assets
1. Ounces associated with FNV assets are not FNV reserve ounces Mineral Resources are exclusive of Mineral Reserves Includes estimates of Mineral Reserves & Resources made under JORC code and SAMREC code
TSX/NYSE FNV
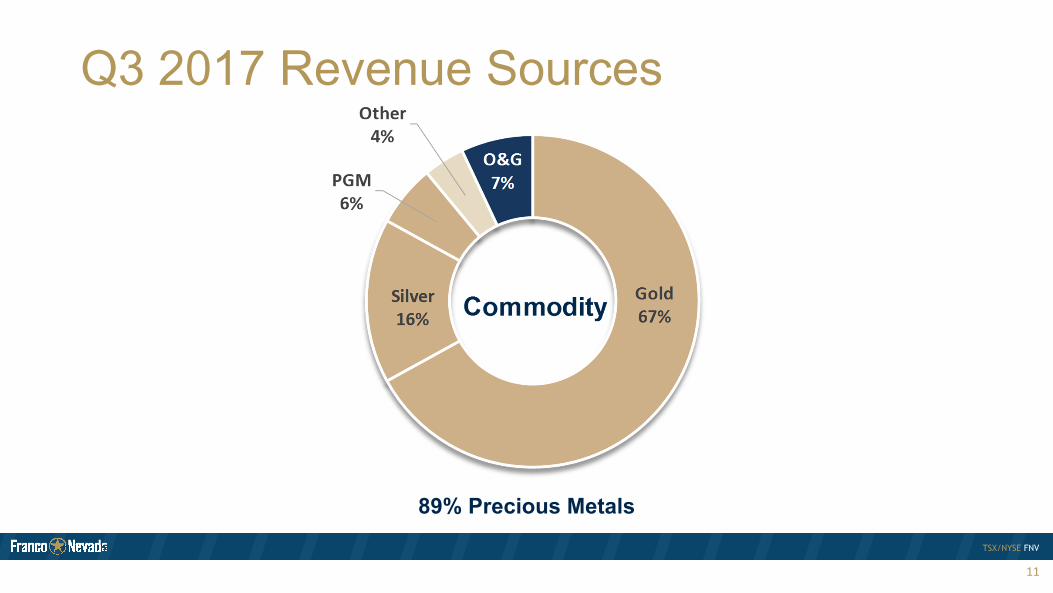
Q3 2017 Revenue Sources
11
89% Precious Metals
TSX/NYSE FNV
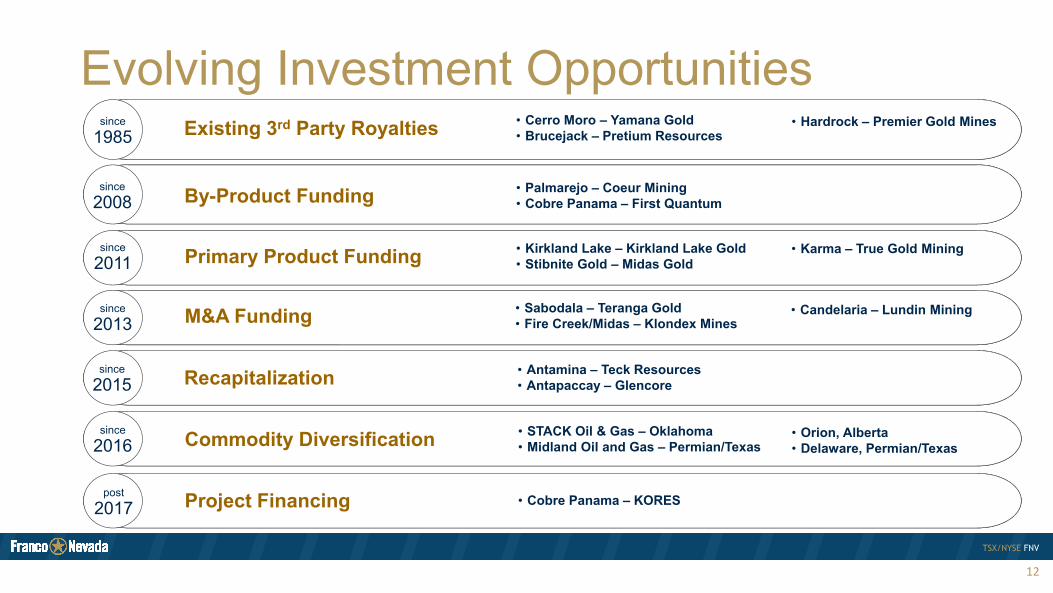
Evolving Investment Opportunities
12
since2011
since1985 Existing 3rd Party Royalties • Cerro Moro – Yamana Gold
• Brucejack – Pretium Resources
since2008
since2013
since2016
By-Product Funding • Palmarejo – Coeur Mining• Cobre Panama – First Quantum
Primary Product Funding • Kirkland Lake – Kirkland Lake Gold• Stibnite Gold – Midas Gold
M&A Funding • Sabodala – Teranga Gold• Fire Creek/Midas – Klondex Mines
Commodity Diversification • STACK Oil & Gas – Oklahoma• Midland Oil and Gas – Permian/Texas
since2015
post2017 Project Financing • Cobre Panama – KORES
Recapitalization • Antamina – Teck Resources• Antapaccay – Glencore
• Orion, Alberta• Delaware, Permian/Texas
• Hardrock – Premier Gold Mines
• Karma – True Gold Mining
• Candelaria – Lundin Mining
TSX/NYSE FNV
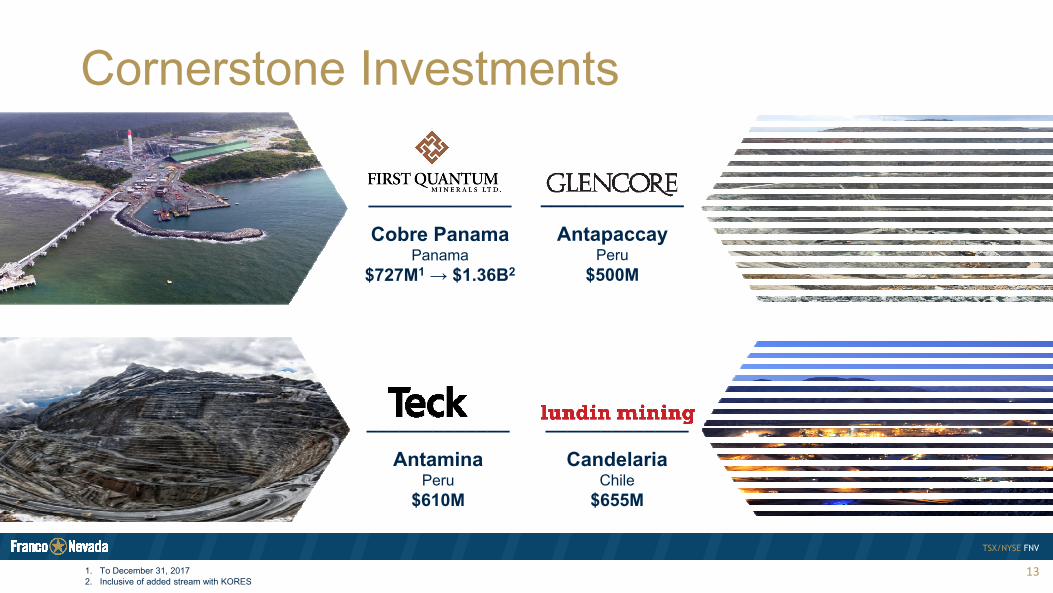
Cornerstone Investments
_____________
AntaminaPeru
$610M
_____________
Cobre PanamaPanama
$727M1 → $1.36B2
_____________
CandelariaChile
$655M
_____________
AntapaccayPeru
$500M
1. To December 31, 20172. Inclusive of added stream with KORES
13
TSX/NYSE FNV
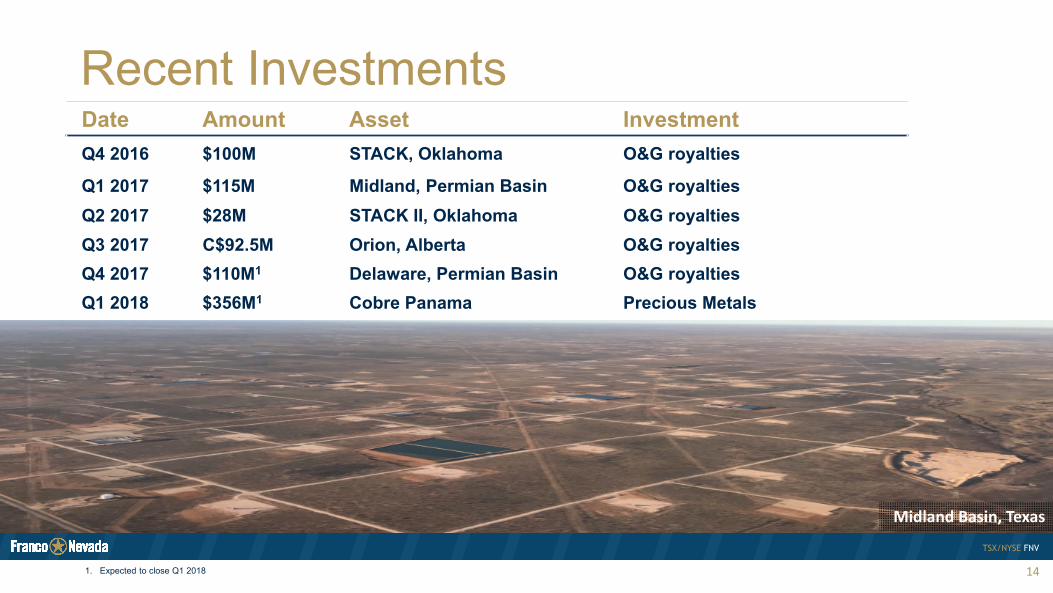
Recent Investments
14
Date Amount Asset InvestmentQ4 2016 $100M STACK, Oklahoma O&G royalties
Q1 2017 $115M Midland, Permian Basin O&G royaltiesQ2 2017 $28M STACK II, Oklahoma O&G royaltiesQ3 2017 C$92.5M Orion, Alberta O&G royaltiesQ4 2017 $110M1 Delaware, Permian Basin O&G royaltiesQ1 2018 $356M1 Cobre Panama Precious Metals
Midland Basin, Texas
1. Expected to close Q1 2018
TSX/NYSE FNV
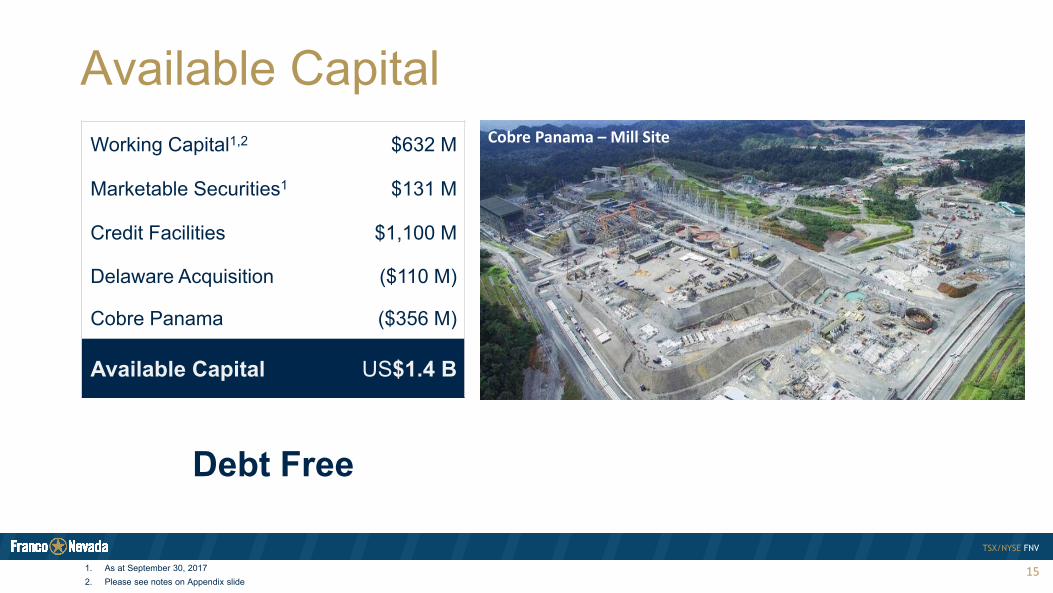
Available Capital
15
Debt Free
Working Capital1,2 $632 M
Marketable Securities1 $131 M
Credit Facilities $1,100 M
Delaware Acquisition ($110 M)
Cobre Panama ($356 M)
Available Capital US$1.4 B
1. As at September 30, 20172. Please see notes on Appendix slide
Cobre Panama – Mill Site
TSX/NYSE FNV
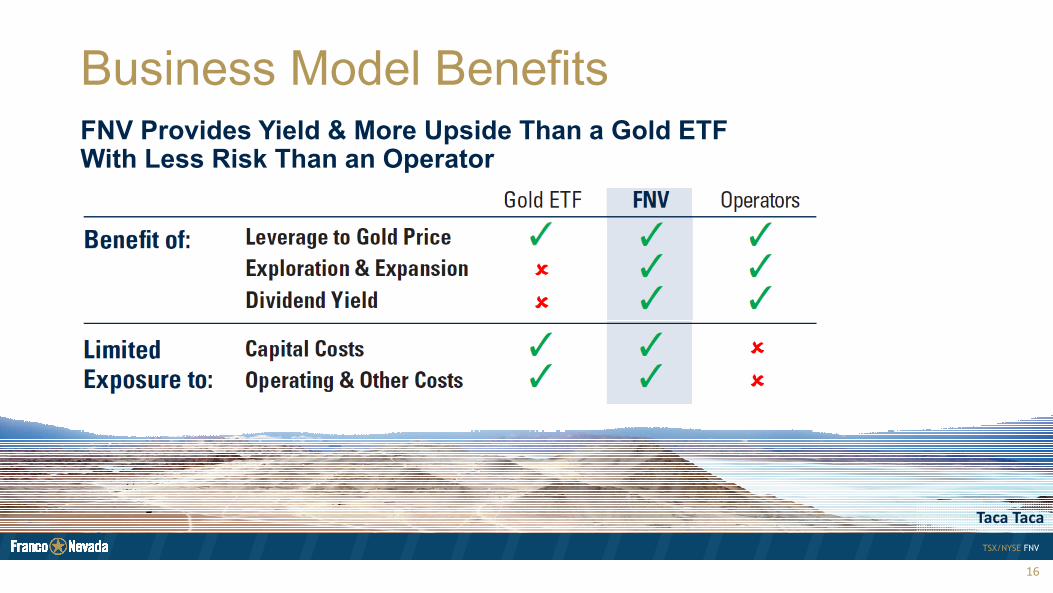
Business Model Benefits
16
FNV Provides Yield & More Upside Than a Gold ETF With Less Risk Than an Operator
Taca Taca
TSX/NYSE FNV
Why Own Franco-Nevada?
17
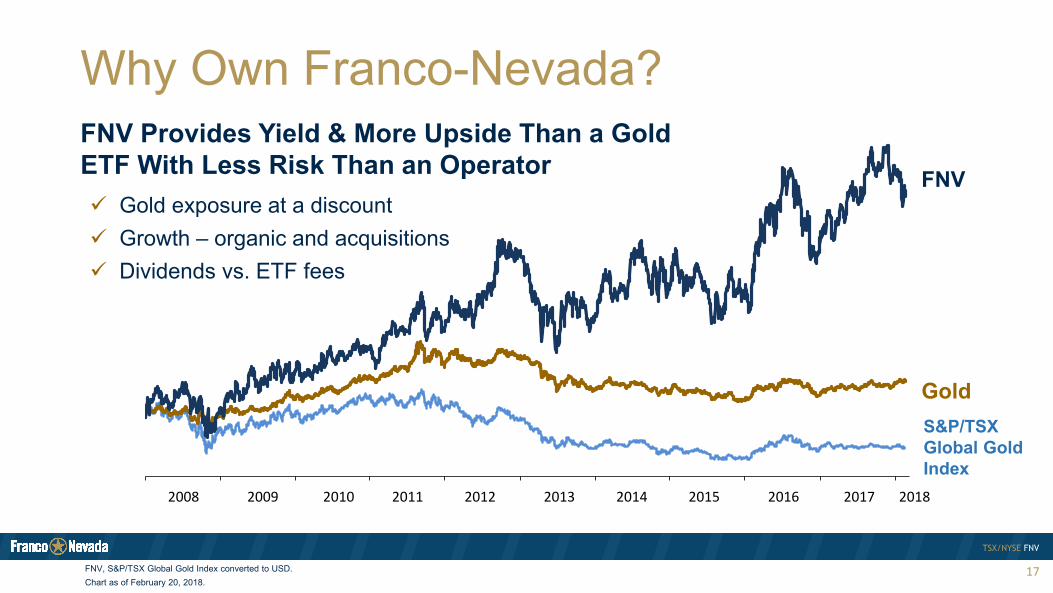
FNV Provides Yield & More Upside Than a Gold ETF With Less Risk Than an Operator Gold exposure at a discount Growth – organic and acquisitions Dividends vs. ETF fees
2008 2009 2010 2011 2012 2013 2014 2015 2016 2017 2018
FNV
GoldS&P/TSX Global Gold Index
FNV, S&P/TSX Global Gold Index converted to USD. Chart as of February 20, 2018.
TSX/NYSE FNV
Appendix – Non-IFRS Measures
18
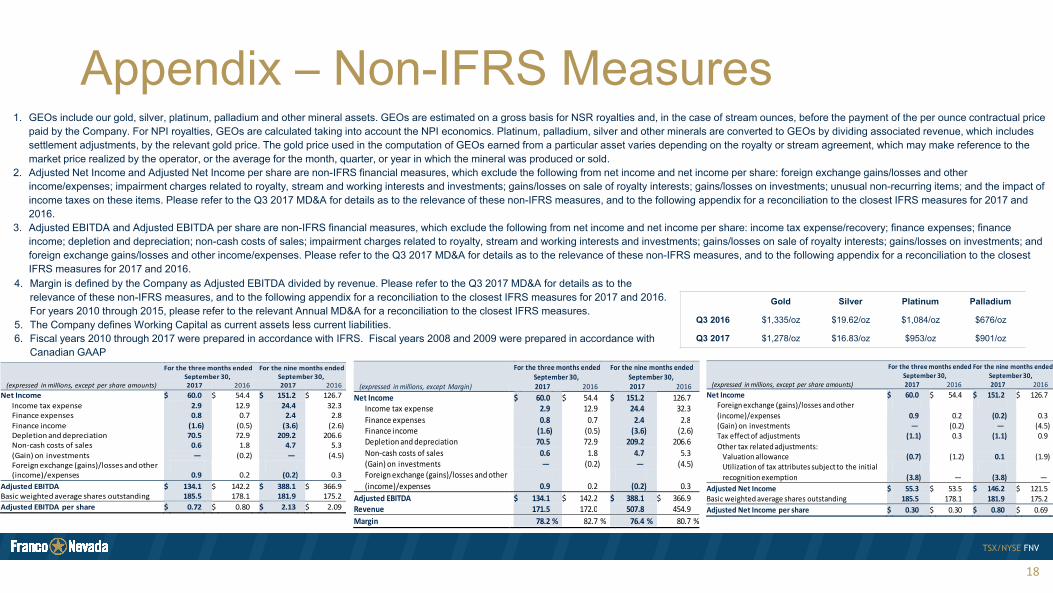
1. GEOs include our gold, silver, platinum, palladium and other mineral assets. GEOs are estimated on a gross basis for NSR royalties and, in the case of stream ounces, before the payment of the per ounce contractual price paid by the Company. For NPI royalties, GEOs are calculated taking into account the NPI economics. Platinum, palladium, silver and other minerals are converted to GEOs by dividing associated revenue, which includes settlement adjustments, by the relevant gold price. The gold price used in the computation of GEOs earned from a particular asset varies depending on the royalty or stream agreement, which may make reference to the market price realized by the operator, or the average for the month, quarter, or year in which the mineral was produced or sold.
2. Adjusted Net Income and Adjusted Net Income per share are non-IFRS financial measures, which exclude the following from net income and net income per share: foreign exchange gains/losses and other income/expenses; impairment charges related to royalty, stream and working interests and investments; gains/losses on sale of royalty interests; gains/losses on investments; unusual non-recurring items; and the impact of income taxes on these items. Please refer to the Q3 2017 MD&A for details as to the relevance of these non-IFRS measures, and to the following appendix for a reconciliation to the closest IFRS measures for 2017 and 2016.
3. Adjusted EBITDA and Adjusted EBITDA per share are non-IFRS financial measures, which exclude the following from net income and net income per share: income tax expense/recovery; finance expenses; finance income; depletion and depreciation; non-cash costs of sales; impairment charges related to royalty, stream and working interests and investments; gains/losses on sale of royalty interests; gains/losses on investments; and foreign exchange gains/losses and other income/expenses. Please refer to the Q3 2017 MD&A for details as to the relevance of these non-IFRS measures, and to the following appendix for a reconciliation to the closest IFRS measures for 2017 and 2016.
Gold Silver Platinum Palladium
Q3 2016 $1,335/oz $19.62/oz $1,084/oz $676/oz
Q3 2017 $1,278/oz $16.83/oz $953/oz $901/oz
(expressed in millions, except per share amounts)
Net Income Income tax expense Finance expenses Finance income Depletion and depreciation Non‐cash costs of sales (Gain) on investments Foreign exchange (gains)/losses and other (income)/expenses
Adjusted EBITDA Basic weighted average shares outstanding Adjusted EBITDA per share
For the three months ended For the nine months ended September 30, September 30,
2017 2016 2017 2016 $ 60.0 $ 54.4 $ 151.2 $ 126.7 2.9 12.9 24.4 32.3 0.8 0.7 2.4 2.8 (1.6) (0.5) (3.6) (2.6) 70.5 72.9 209.2 206.6 0.6 1.8 4.7 5.3 — (0.2) — (4.5)
0.9 0.2 (0.2) 0.3 $ 134.1 $ 142.2 $ 388.1 $ 366.9 185.5 178.1 181.9 175.2 $ 0.72 $ 0.80 $ 2.13 $ 2.09
(expressed in millions, except Margin)
Net Income Income tax expense Finance expenses Finance income Depletion and depreciation Non‐cash costs of sales (Gain) on investments Foreign exchange (gains)/losses and other (income)/expenses
Adjusted EBITDA Revenue Margin
For the three months ended For the nine months ended September 30, September 30,
2017 2016 2017 2016 $ 60.0 $ 54.4 $ 151.2 126.7 2.9 12.9 24.4 32.3 0.8 0.7 2.4 2.8 (1.6) (0.5) (3.6) (2.6) 70.5 72.9 209.2 206.6 0.6 1.8 4.7 5.3 — (0.2) — (4.5)
0.9 0.2 (0.2) 0.3 $ 134.1 $ 142.2 $ 388.1 $ 366.9 171.5 172.0 507.8 454.9 78.2 % 82.7 % 76.4 % 80.7 %
(expressed in millions, except per share amounts)
Net Income Foreign exchange (gains)/losses and other (income)/expenses (Gain) on investments Tax effect of adjustments Other tax related adjustments: Valuation allowance Utilization of tax attributes subject to the initial recognition exemption
Adjusted Net Income Basic weighted average shares outstanding Adjusted Net Income per share
For the three months ended For the nine months ended September 30, September 30, 2017 2016 2017 2016 $ 60.0 $ 54.4 $ 151.2 $ 126.7
0.9 0.2 (0.2) 0.3 — (0.2) — (4.5)
(1.1) 0.3 (1.1) 0.9
(0.7) (1.2) 0.1 (1.9)
(3.8) — (3.8) — $ 55.3 $ 53.5 $ 146.2 $ 121.5 185.5 178.1 181.9 175.2 $ 0.30 $ 0.30 $ 0.80 $ 0.69
4. Margin is defined by the Company as Adjusted EBITDA divided by revenue. Please refer to the Q3 2017 MD&A for details as to the relevance of these non-IFRS measures, and to the following appendix for a reconciliation to the closest IFRS measures for 2017 and 2016. For years 2010 through 2015, please refer to the relevant Annual MD&A for a reconciliation to the closest IFRS measures.
5. The Company defines Working Capital as current assets less current liabilities.6. Fiscal years 2010 through 2017 were prepared in accordance with IFRS. Fiscal years 2008 and 2009 were prepared in accordance with
Canadian GAAP
TSX/NYSE FNV
Board of Directors
19
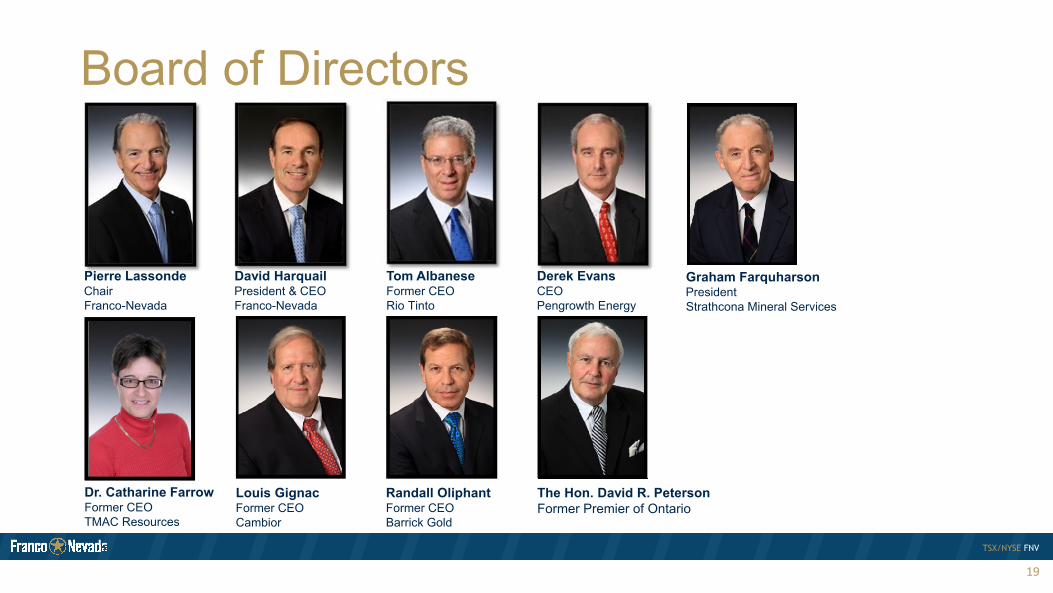
Pierre Lassonde ChairFranco-Nevada
David Harquail President & CEOFranco-Nevada
The Hon. David R. PetersonFormer Premier of Ontario
Tom AlbaneseFormer CEORio Tinto
Graham Farquharson PresidentStrathcona Mineral Services
Derek EvansCEO Pengrowth Energy
Louis GignacFormer CEO Cambior
Randall OliphantFormer CEOBarrick Gold
Dr. Catharine FarrowFormer CEOTMAC Resources
TSX/NYSE FNV
Additional Cobre Panama Stream
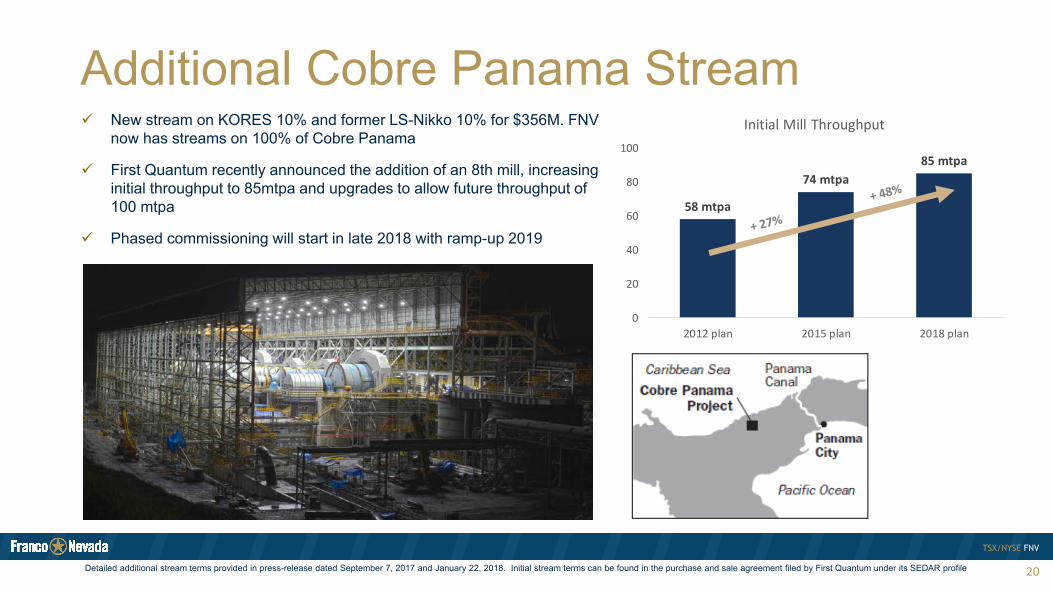
20Detailed additional stream terms provided in press-release dated September 7, 2017 and January 22, 2018. Initial stream terms can be found in the purchase and sale agreement filed by First Quantum under its SEDAR profile
New stream on KORES 10% and former LS-Nikko 10% for $356M. FNV now has streams on 100% of Cobre Panama
First Quantum recently announced the addition of an 8th mill, increasing initial throughput to 85mtpa and upgrades to allow future throughput of 100 mtpa
Phased commissioning will start in late 2018 with ramp-up 2019
58 mtpa
74 mtpa85 mtpa
0
20
40
60
80
100
2012 plan 2015 plan 2018 plan
Initial Mill Throughput

TSX/NYSE FNV
Orion 4% GORR
21
Acquired 4% GORR on Osum’s Orion Project for C$92.5M (effective date of Sep. 1, 2017)
Royalty applies to Clearwater formation and allows for deduction of transport and diluent costs
Orion is a SAGD operation located in Cold Lake area of Alberta Osum is a private oil sands company formed in 2005 and is well funded to
execute growth strategy
Current production rate of ~9,000 bbl/d Phase 2B+2C underway, expected to
increase production to 18,000 bbl/d by end of 2019
Company has regulatory approval for and is targeting production of up to 20,000 bbl/d via future phases
December royalty revenue of ~C$500k1
1. WTI averaged US$57.83/bbl in December
TSX/NYSE FNV
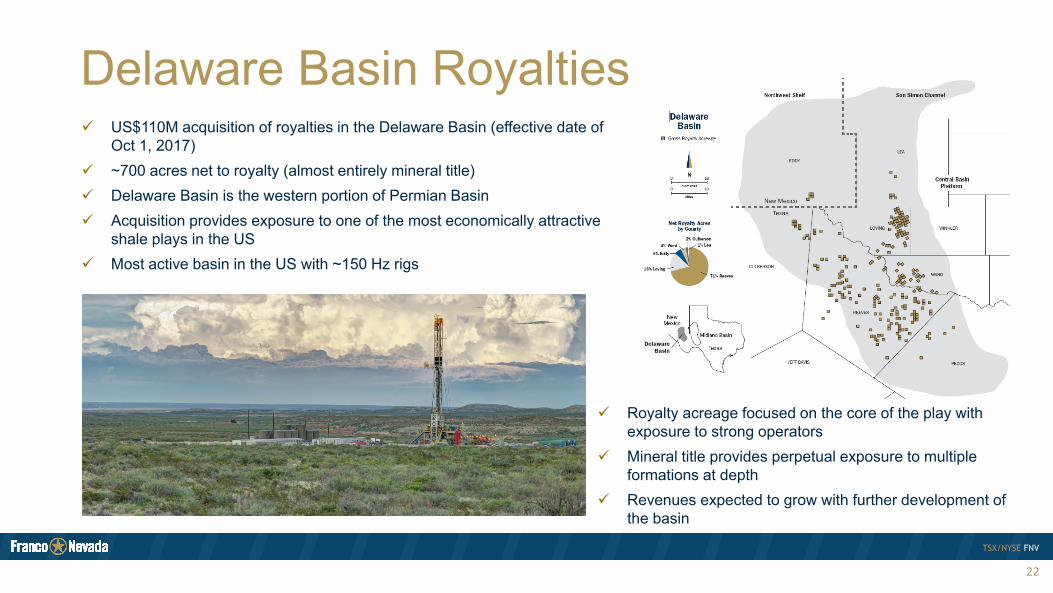
Delaware Basin Royalties
22
US$110M acquisition of royalties in the Delaware Basin (effective date of Oct 1, 2017)
~700 acres net to royalty (almost entirely mineral title) Delaware Basin is the western portion of Permian Basin Acquisition provides exposure to one of the most economically attractive
shale plays in the US Most active basin in the US with ~150 Hz rigs
Royalty acreage focused on the core of the play with exposure to strong operators
Mineral title provides perpetual exposure to multiple formations at depth
Revenues expected to grow with further development of the basin
TSX/NYSE FNV
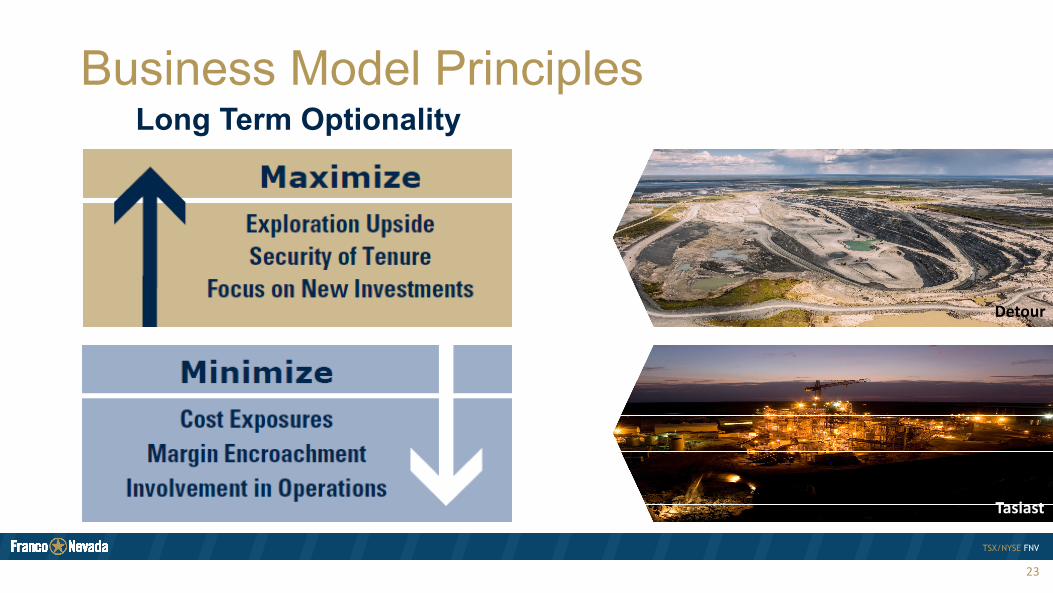
Business Model Principles
23
Long Term Optionality
Detour
Tasiast