Embed Size (px)
Citation preview
Federal Funds Information for States www.ffis.org
Progress? Or Same Old, Same Old?NASBO Annual MeetingStowe, Vermont
August 2015

2015 Congressional “To Do” List
FY 2016 appropriations Reconciliation Surface transportation ESEA (No Child Left Behind) Debt limit Other issues/deadlines
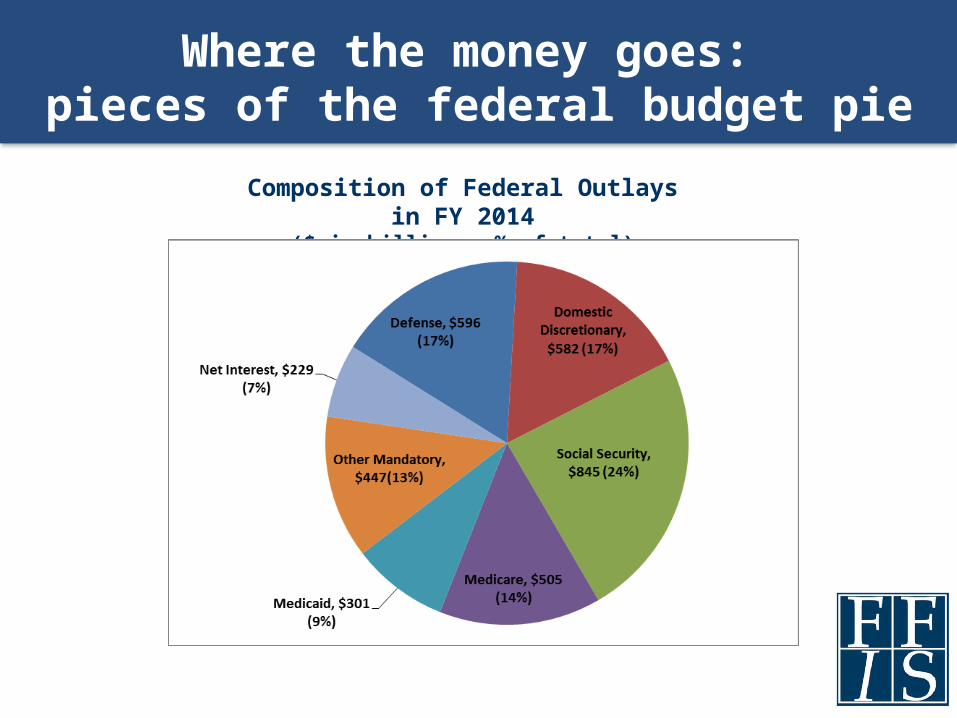
Where the money goes: pieces of the federal budget pie
Composition of Federal Outlays in FY 2014($ in billions, % of total)

Many grants have been flat…

…and the future is uncertain
FY 2015 FY 2016 FY 2017 FY 2018 FY 2019 FY 2020 FY 2021 FY 2022 FY 2023 FY 2024 FY 2025Defense: BCA/CBO Baseline* $521 $523 $536 $549 $562 $576 $590 $605 $620 $635 $651 Budget Resolution $521 $523 $536 $549 $562 $576 $590 $623 $636 $649 $662 President $522 $561 $573 $584 $592 $598 $610 $622 $635 $648 $661
Non-Defense: BCA/CBO Baseline* $492 $493 $504 $516 $530 $543 $555 $569 $583 $598 $613 Budget Resolution $492 $493 $477 $478 $487 $495 $503 $509 $515 $521 $527 President $506 $526 $535 $545 $554 $559 $570 $582 $595 $608 $620
*CBO baseline figures as reflected in House Budget Resolution
Comparison of Current Law/CBO Discretionary Baseline, FY 2016 Budget Resolution, and President's Budget($ in billions)

BCA still the law of the land
• Mandatory sequestration occurs on October 1 for covered programs– FY 2016: -6.8% for non-defense– e.g., SSBG, PSSF, highway spending outside
the obligation limitation • Discretionary sequestration built into the
caps

Budget Resolution Process

Divergent paths create problems
$613
$478
$527$506
$620
$400$425$450$475$500$525$550$575$600$625$650
FY 2015 FY 2016 FY 2017 FY 2018 FY 2019 FY 2020 FY 2021 FY 2022 FY 2023 FY 2024 FY 2025
($ in
bill
ions
)
Non-Defense Discretionary Spending under FY 2016 Budget Resolution, President's Budget, and Current Law/CBO Baseline
BCA/CBO Baseline* Budget Resolution President
*CBO baseline figures as reflected in House Budget Resolution

Differences of magnitude, not direction
Appropriations Subcommittee FY 2015 House Senate House SenateAgriculture $20.6 $20.7 $20.5 0.2% -0.4%Commerce-Justice-Science 50.1 51.4 51.1 2.5% 1.9%Defense 490.2 490.2 489.1 0.0% -0.2%Energy-Water 34.2 35.4 35.4 3.5% 3.4%Financial Services 21.8 20.3 20.6 -7.1% -5.7%Homeland Security 39.7 39.3 40.2 -0.9% 1.3%Interior-Environment 30.4 30.2 30.0 -0.8% -1.3%Labor-Health and Human Services-Education 156.8 153.1 153.2 -2.4% -2.3%Legislative Branch 4.3 4.3 4.3 0.0% 0.2%Military Construction 71.8 76.1 77.6 5.9% 8.0%State-Foreign Operations 40.0 40.5 39.0 1.3% -2.5%Transportation-Housing and Urban Development 53.8 55.3 55.6 2.7% 3.4%TOTAL $1,013.7 $1,016.6 $1,016.6 0.3% 0.3%
302(b) Sub-allocations, FY 2016($ in billions)
FY 2016 Change from FY 2015
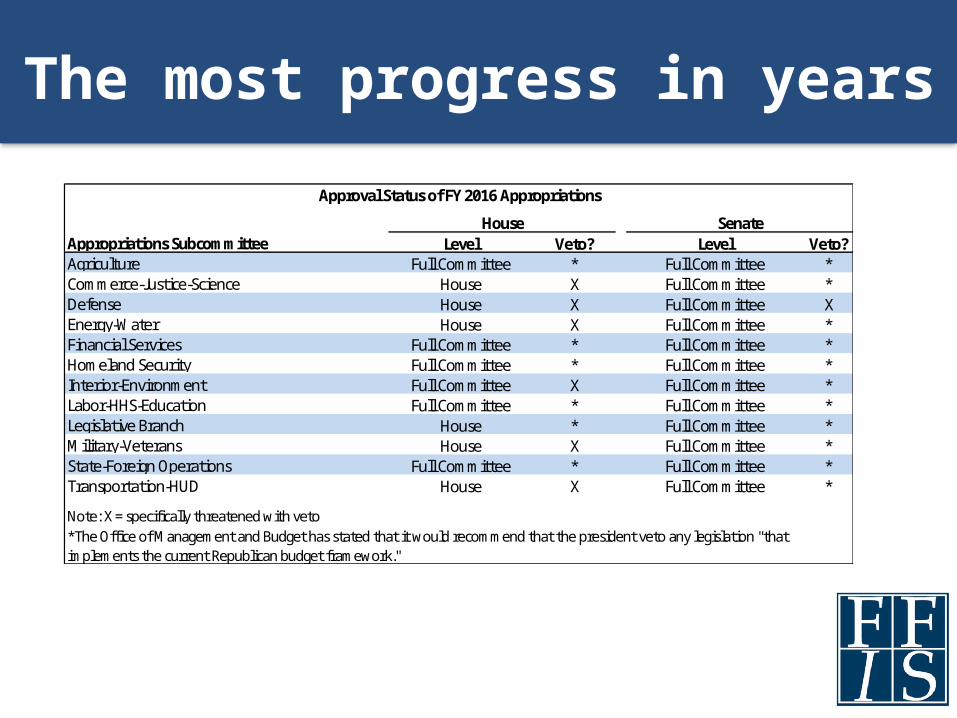
The most progress in years
Appropriations Subcommittee Level Veto? Level Veto?Agriculture Full Committee * Full Committee *Commerce-Justice-Science House X Full Committee *Defense House X Full Committee XEnergy-Water House X Full Committee *Financial Services Full Committee * Full Committee *Homeland Security Full Committee * Full Committee *Interior-Environment Full Committee X Full Committee *Labor-HHS-Education Full Committee * Full Committee *Legislative Branch House * Full Committee *Military-Veterans House X Full Committee *State-Foreign Operations Full Committee * Full Committee *Transportation-HUD House X Full Committee *
Approval Status of FY 2016 Appropriations
House Senate
*The Office of Management and Budget has stated that it would recommend that the president veto any legislation "that implements the current Republican budget framework."
Note: X = specifically threatened with veto
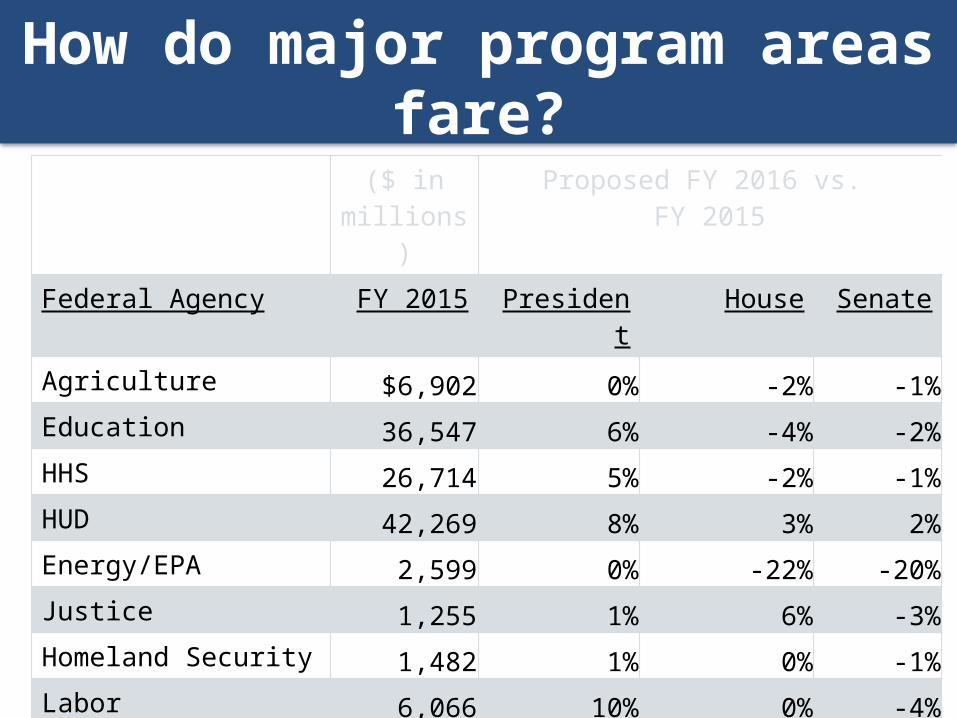
How do major program areas fare?($ in
millions)Proposed FY 2016 vs.
FY 2015Federal Agency FY 2015 President House SenateAgriculture $6,902 0% -2% -1%Education 36,547 6% -4% -2%HHS 26,714 5% -2% -1%HUD 42,269 8% 3% 2%Energy/EPA 2,599 0% -22% -20%Justice 1,255 1% 6% -3%Homeland Security 1,482 1% 0% -1%Labor 6,066 10% 0% -4%Transportation 55,568 29% -0% -1%Total – Discretionary 179,614 13% -1% -1%
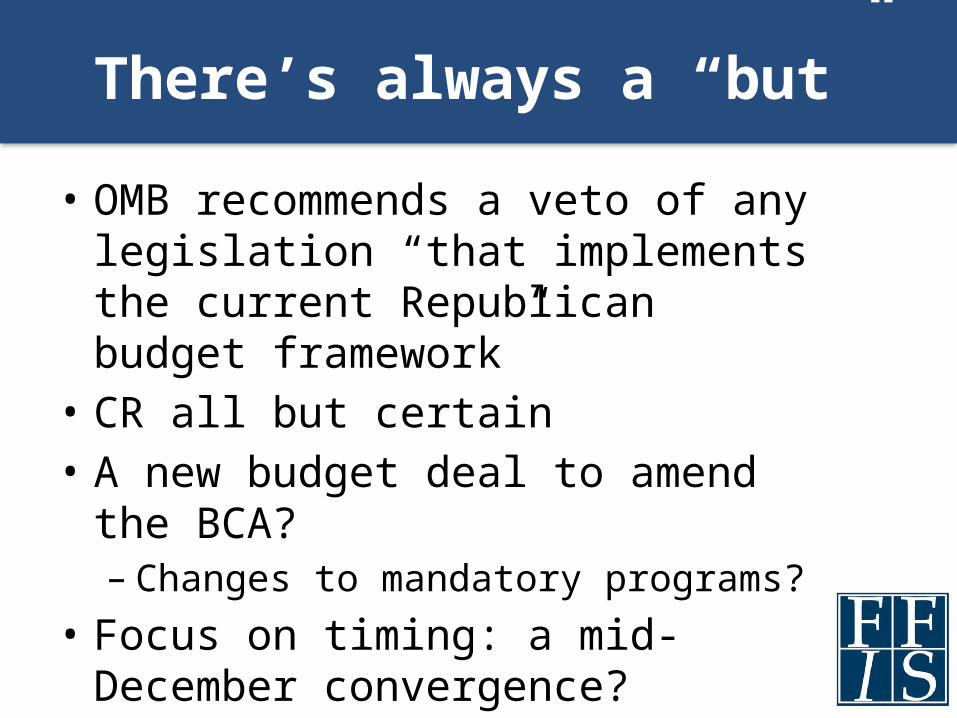
There’s always a “but”
• OMB recommends a veto of any legislation “that implements the current Republican budget framework”
• CR all but certain• A new budget deal to amend the BCA?– Changes to mandatory programs?
• Focus on timing: a mid-December convergence?

All’s quiet on the reconciliation front
Committee Savings/10 years Committee Savings/10 yearsEducation-Workforce $1,000 Finance $1,000Energy-Commerce 1,000 Health, Education, Labor, Pensions 1,000Ways and Means 1,000 TOTAL $2,000TOTAL $3,000
House Senate
Reconciliation Directives in FY 2016 Concurrent Budget Resolution($ in millions)
• Ambitious agenda gave way to “replace ACA, deal with King v. Burwell”• July 24 deadline came and went• Project creep?
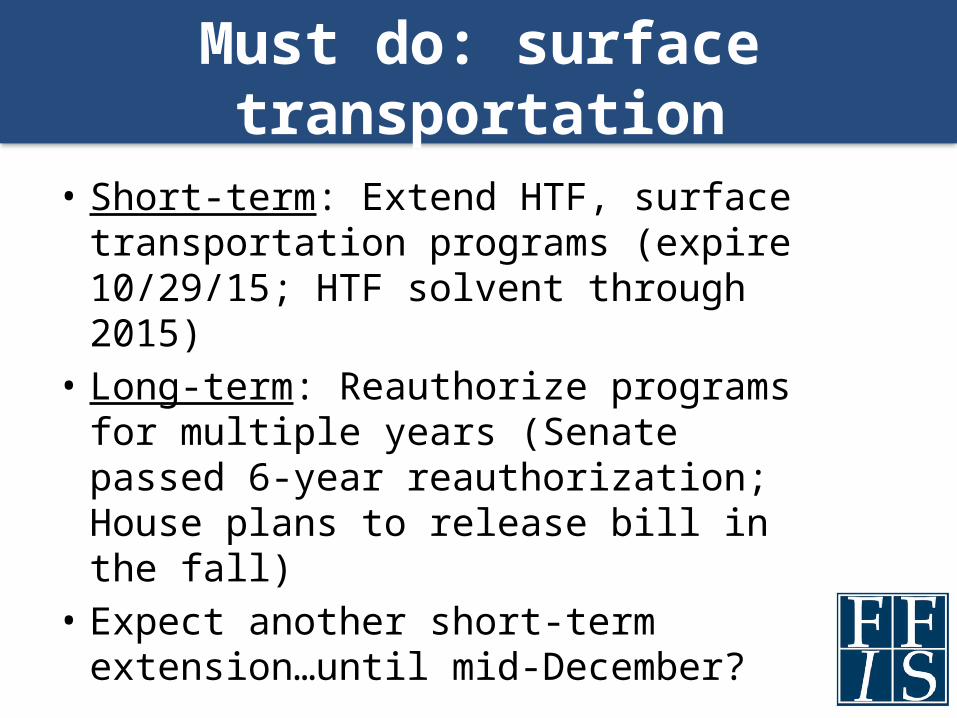
Must do: surface transportation
• Short-term: Extend HTF, surface transportation programs (expire 10/29/15; HTF solvent through 2015)
• Long-term: Reauthorize programs for multiple years (Senate passed 6-year reauthorization; House plans to release bill in the fall)
• Expect another short-term extension…until mid-December?
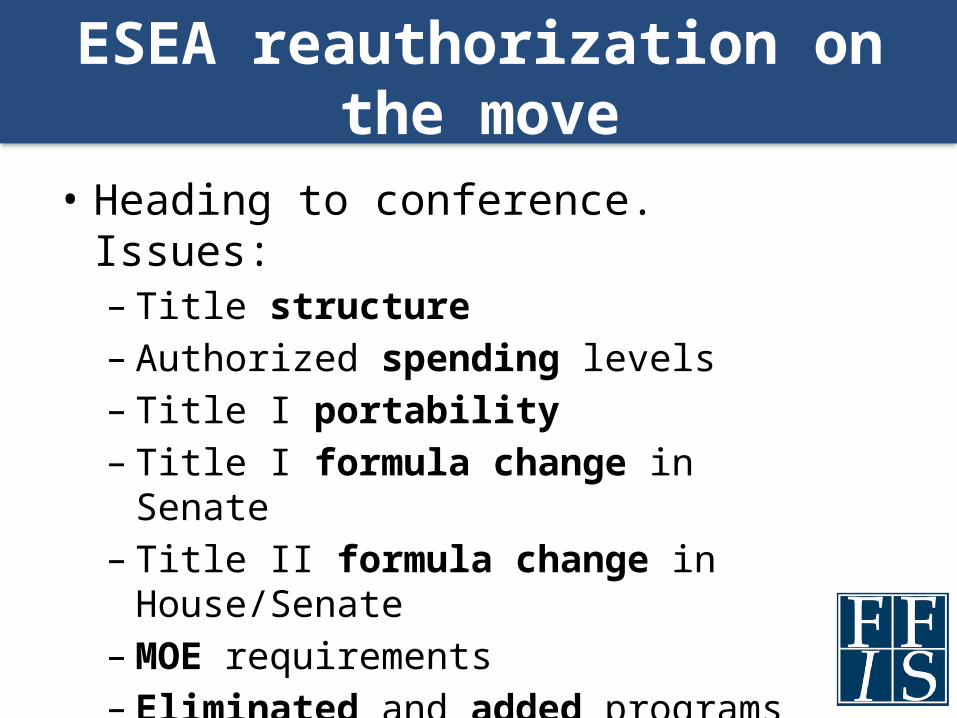
ESEA reauthorization on the move
• Heading to conference. Issues:– Title structure– Authorized spending levels– Title I portability– Title I formula change in Senate– Title II formula change in House/Senate– MOE requirements– Eliminated and added programs– See www.ffis.org for full coverage
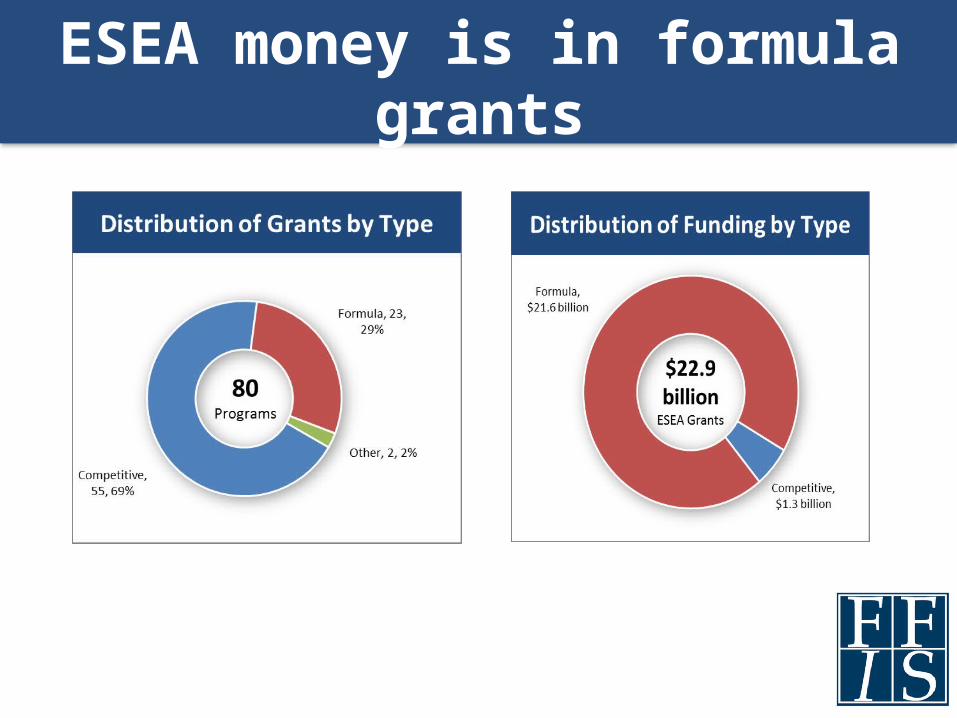
ESEA money is in formula grants

ESEA formula money is in Title I
Program FY 2015 Funding Cumulative %Title I Grants to LEAs $14,409,802 62.9%Improving Teacher Quality State Grants
2,349,830 73.1%
21st Century Community Learning Centers
1,151,673 78.1%
Impact Aid, Basic Support Payments
1,151,233 83.2%
English Language Acquisition State Grants
737,400 86.4%
Five Largest ESEA Programs($ in thousands)
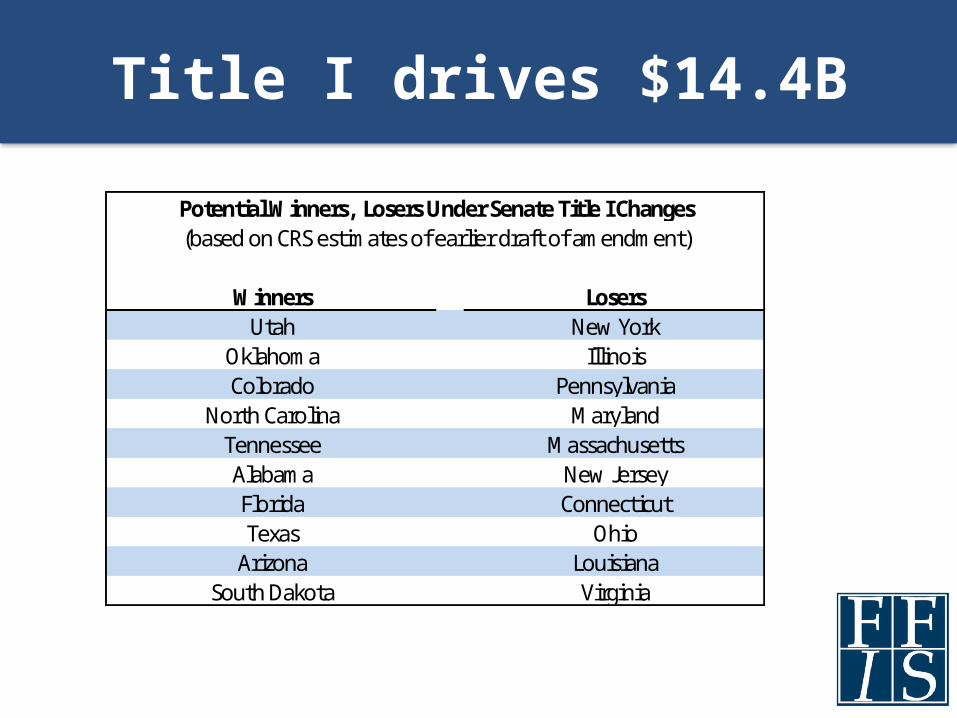
Title I drives $14.4B
Winners LosersUtah New York
Oklahoma IllinoisColorado Pennsylvania
North Carolina MarylandTennessee MassachusettsAlabama New JerseyFlorida ConnecticutTexas Ohio
Arizona LouisianaSouth Dakota Virginia
Potential Winners, Losers Under Senate Title I Changes(based on CRS estimates of earlier draft of amendment)

Title II drives $2.3B
Winners Losers Winners LosersNevada West Virginia Nevada West VirginiaArizona Puerto Rico Arizona New York
North Carolina New York North Carolina PennsylvaniaUtah Louisiana Georgia Michigan
Georgia Michigan South Carolina ConnecticutColorado Pennsylvania Tennessee Massachusetts
South Carolina Mississippi Florida MarylandTennessee Massachusetts Texas Louisiana
Florida Kentucky Utah MinnesotaTexas Connecticut Arkansas Wisconsin
House Senate
Winners and Losers Under House and Senate Title II Changes
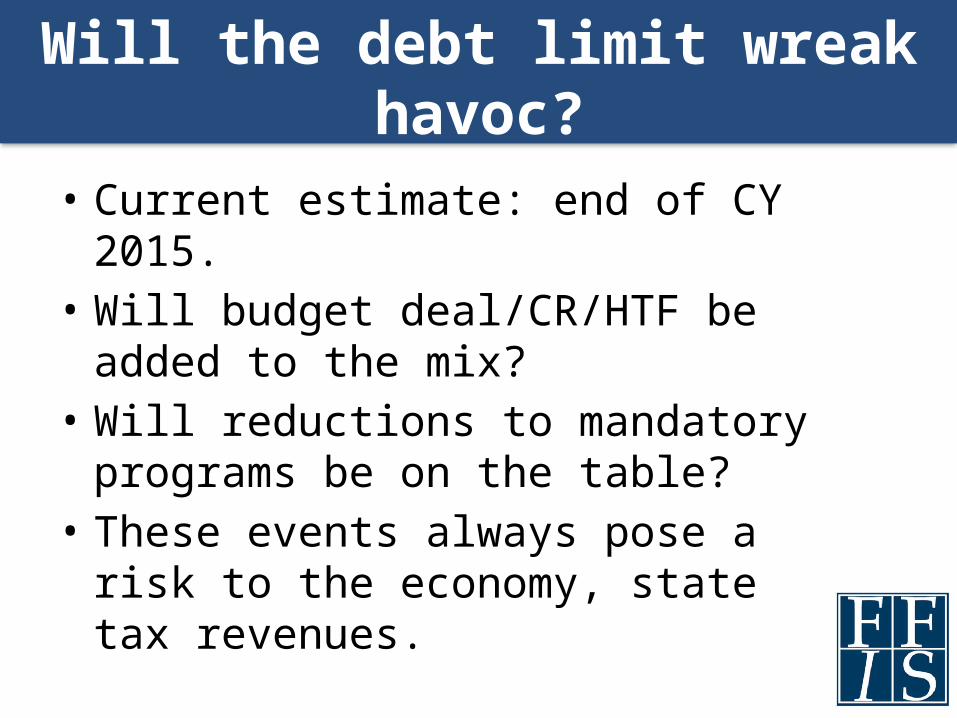
Will the debt limit wreak havoc?
• Current estimate: end of CY 2015.• Will budget deal/CR/HTF be added to the
mix?• Will reductions to mandatory programs
be on the table?• These events always pose a risk to the
economy, state tax revenues.

Other Issues/Deadlines
• TANF reauthorization (9/30/15; House discussion draft)
• Child welfare financing (Senate discussion draft)
• Older Americans Act (Senate passed)• Child nutrition (9/30/15 for some; no
action)• PILT/SRS (9/30/15)• AIP (9/30/15)• Tax extenders (for CY 2015)
Take-aways
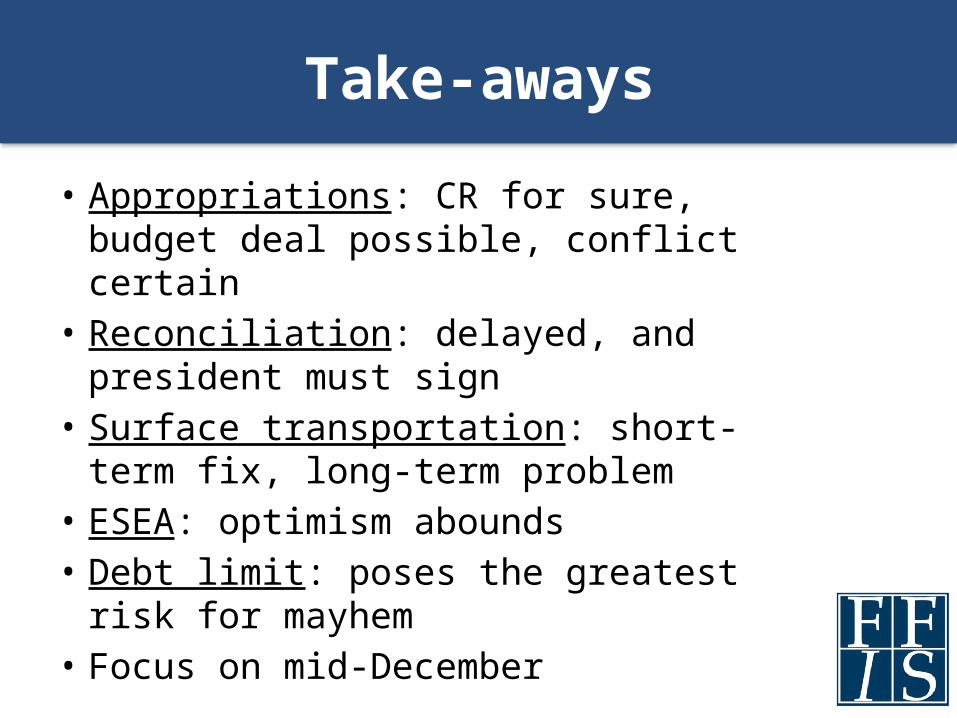
• Appropriations: CR for sure, budget deal possible, conflict certain
• Reconciliation: delayed, and president must sign
• Surface transportation: short-term fix, long-term problem
• ESEA: optimism abounds• Debt limit: poses the greatest risk for
mayhem• Focus on mid-December