Embed Size (px)
Citation preview
FEDERAL GOVERNMENT STRATEGIC SOURCING OF
INFORMATION PRODUCTS AND SERVICES
A Report Prepared by the Federal Research Division, Library of Congress
Under an Agreement w ith the Federal Library and Information Netw ork (FEDLINK),
Library of Congress
Revised April 2014
Researcher: Wm. Noël Ivey Project Manager: Alice R. Buchalter Federal Research Division Library of Congress Washington, D.C. 20540−4840 Tel: 202−707−3900 Fax: 202−707−3920 E-Mail: f [email protected] Homepage: http://w w w .loc.gov/rr/f rd/
66 Years of Service to the Federal Government 1948 – 2014
Library of Congress – Federal Research Division Strategic Sourcing of Information Products and Services
PREFACE
This report describes the current landscape of the federal marketplace regarding the
acquisition of information goods and services, including electronic databases, books, and serials.
It compiles comprehensive data from fiscal year (FY) 1979 through the first quarter of FY 2014
on the amount federal agencies have spent on these products and services, as well as identifying
major vendors. In addition, the report forecasts through FY 2016 the potential savings to the
federal government if agencies purchase these products and services through a strategic-sourcing
initiative. The report presents this data in the form of tables, graphs, and charts, accompanied by
narrative explanation and analysis.
i
Library of Congress – Federal Research Division Strategic Sourcing of Information Products and Services
TABLE OF CONTENTS
PREFACE ................................................................................................................................. i
KEY FINDINGS ............................................................................................................................. 1
INTRODUCTION .......................................................................................................................... 3
METHODOLOGY ......................................................................................................................... 3
OVERVIEW OF THE FEDERAL STRATEGIC-SOURCING INITIATIVE .............................. 5
DEFINING THE FEDERAL INFORMATION MARKET ........................................................... 6
INFORMATION MARKET SPENDING BY FEDERAL AGENCIES ..................................... 18
CONTRACTORS IN THE FEDERAL INFORMATION MARKET ......................................... 24
BENEFITS OF A STRATEGICALLY SOURCED INFORMATION MARKET ...................... 28
APPENDIX 1. Estimated Spending and Savings Projections, FY 2014–FY 2016 ...................... 36
APPENDIX 2. Product Service Code Definitions ........................................................................ 37
APPENDIX 3. Major Vendors for Major Information Commodities, FY 2010–FY 2014 Q1 ....................................................................................... 39
APPENDIX 4. Regression Diagnostics and Statistics .................................................................. 51
BIBLIOGRAPHY ......................................................................................................................... 55
TABLES Table 1. Federal Information Market, Products and Services, FY 1979–FY 2014 Q1 .................. 8
Table 2. Federal Departments and Independent Agencies’ Spending on Information Products and Services, FY 1979–FY 2014 Q1 ............................................................... 18
Table 3. Top Ten Contractors in the Federal Information Market, FY 1979–FY 2014 Q1 ......... 25
Table 4. Top Ten Contractors in the Federal Information Market, FY 2010–FY 2014 Q1 ......... 27
Table 5. FY 2013 Spending by Agency Under Different Savings Scenarios ............................... 29
Table 6. Spending Projections, FY 2014–FY 2016 ...................................................................... 32
iii
Library of Congress – Federal Research Division Strategic Sourcing of Information Products and Services
Table 7. Projected Growth and Savings in the Federal Information Market, FY 2014–FY 2016 .......................................................................................................... 36
Table 8. Total Spending Projections Based on Strategic-Sourcing Spending, FY 2014–FY 2016 .......................................................................................................... 36
Table 9. Formal Definitions of Product Service Codes ................................................................ 37
Table 10. Federal Information Market, Products and Services, FY 2010–FY 2014 Q1 .............. 39
Table 11. Top 50 Contractors in the Federal Information Market, FY 1979–FY 2014 Q1 .......... 40
Table 12. Top 50 Contractors in the Federal Information Market, FY 2010–FY 2014 Q1 .......... 43
Table 13. Top Contractors for Web-Based Subscriptions (PSC D317), FY 2010–FY 2014 Q1 ................................................................................................... 46
Table 14. Top Contractors for Books and Pamphlets (PSC 7610), FY 2010–FY 2014 Q1 ................................................................................................... 47
Table 15. Top Contractors for Administrative Support: Information Retrieval (PSC R612), FY 2010–FY 2014 Q1 ............................................................................. 48
Table 16. Top Contractors for Administrative Support: Library (PSC R605), FY 2010–FY 2014 Q1 ................................................................................................... 48
Table 17. Top Contractors for Newspapers and Periodicals (PSC 7630), FY 2010–FY 2014 Q1 ................................................................................................... 49
Table 18. Data Used in the Regression Analysis .......................................................................... 51
Table 19. Regression Analysis Statistics ...................................................................................... 52
FIGURES Figure 1. Federal Spending on Information Products and Services, FY 1979–FY 2013 ............... 9
Figure 2. Growth of Federal Spending on Information Products and Services,
FY 1980–FY 2010 ........................................................................................................ 10
Figure 3. Federal Spending on Information Products and Services by Quarter,
FY 1979 Q1–FY 2014 Q1 ............................................................................................. 11
Figure 5. Federal Information Market, Average Quarterly Spending, FY 1980–FY 2013 .......... 13
Figure 6. Federal Information Market, Products and Services, FY 1979–FY 2014 Q1 ............... 14
Figure 7. Federal Spending on Information Products and Services, FY 1979–FY 2013 ............. 16
iv
Library of Congress – Federal Research Division Strategic Sourcing of Information Products and Services
Figure 8. Federal Spending on Information Products and Services, FY 2010 Q1–
FY 2014 Q1 ................................................................................................................... 16
Figure 9. Federal Spending on Information Products and Services, by Decade........................... 17
Figure 10. Federal Information Market, Products and Services, FY 2010–FY 2014 Q1 ............. 18
Figure 11. Federal Information Market Spending by Agency as a Proportion of Total
Spending, FY 1979–FY 2014 Q1 ................................................................................ 21
Figure 12. Federal Information Market Spending by Agency as a Proportion of Total
Spending, FY 2010–FY 2014 Q1 ................................................................................ 21
Figure 13. Federal Information Market, Top Federal Agency Spending Trends,
FY 1979–FY 2013 ....................................................................................................... 22
Figure 14. Federal Information Market, Top-Spending Federal Agencies,
FY 1979– FY 2014 Q1 ................................................................................................ 23
Figure 15. Federal Information Market, Top-Spending Federal Agencies,
FY 2010– FY 2014 Q1 ................................................................................................ 24
Figure 16. Agency Spending with Different Savings Scenarios, FY 2010 Q1–
FY 2014 Q1 ................................................................................................................. 30
Figure 17. Federal Spending Using Different Savings Scenarios, FY 1979–
FY 2014 Q1 ................................................................................................................. 31
Figure 18. Federal Spending on Information Products and Services under Different
Savings Scenarios, FY 1979–FY 2013 ........................................................................ 31
Figure 19. Projected Growth and Potential Savings in the Federal Information Market,
FY 2014–FY 2016 ....................................................................................................... 33
Figure 20. Total Spending Projections Based on Various Strategic-Sourcing Scenarios,
FY 2014–FY 2016 ....................................................................................................... 35
Figure 21. Scatterplot of Annual Spending Figures, FY 1979–FY 2013 ..................................... 52
Figure 22. Scatterplot of Cubic Regression Residuals versus X-Values ...................................... 53
Figure 23. QQ-Plot of Cubic Regression Residuals ..................................................................... 54
Figure 24. Histogram of Cubic Regression Residuals .................................................................. 54
v
Library of Congress – Federal Research Division Strategic Sourcing of Information Products and Services
KEY FINDINGS
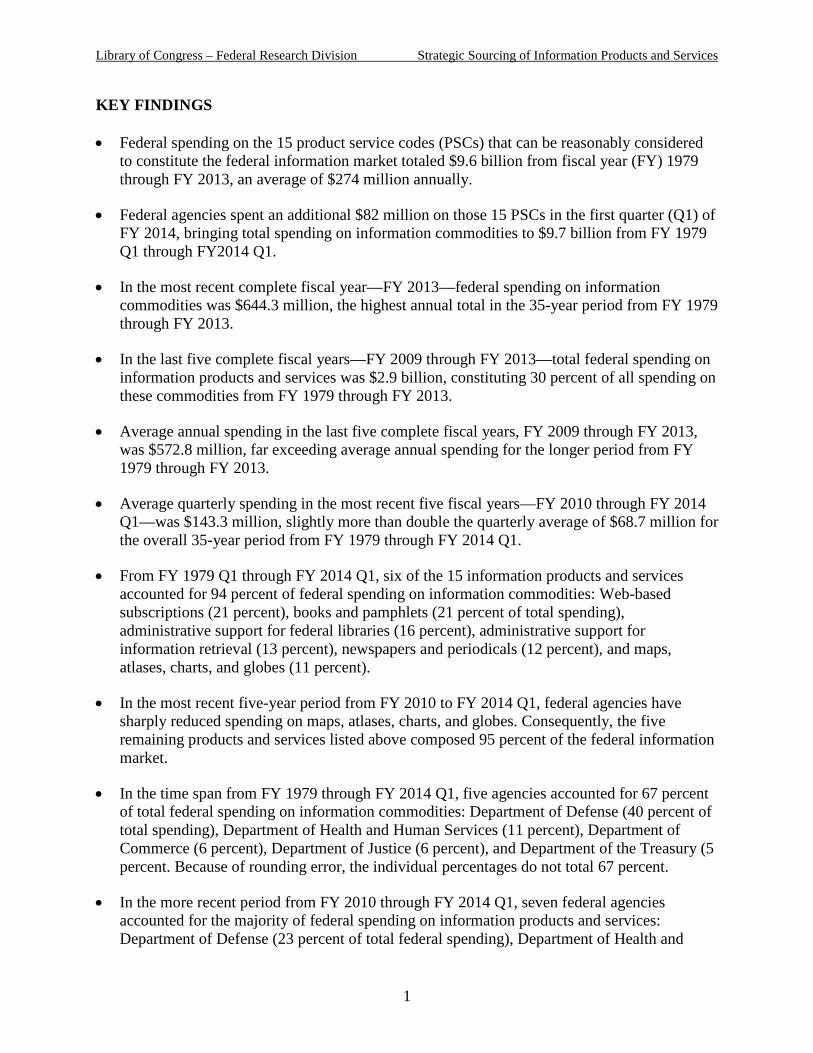
• Federal spending on the 15 product service codes (PSCs) that can be reasonably considered to constitute the federal information market totaled $9.6 billion from fiscal year (FY) 1979 through FY 2013, an average of $274 million annually.
• Federal agencies spent an additional $82 million on those 15 PSCs in the first quarter (Q1) of FY 2014, bringing total spending on information commodities to $9.7 billion from FY 1979 Q1 through FY2014 Q1.
• In the most recent complete fiscal year—FY 2013—federal spending on information commodities was $644.3 million, the highest annual total in the 35-year period from FY 1979 through FY 2013.
• In the last five complete fiscal years—FY 2009 through FY 2013—total federal spending on information products and services was $2.9 billion, constituting 30 percent of all spending on these commodities from FY 1979 through FY 2013.
• Average annual spending in the last five complete fiscal years, FY 2009 through FY 2013, was $572.8 million, far exceeding average annual spending for the longer period from FY 1979 through FY 2013.
• Average quarterly spending in the most recent five fiscal years—FY 2010 through FY 2014 Q1—was $143.3 million, slightly more than double the quarterly average of $68.7 million for the overall 35-year period from FY 1979 through FY 2014 Q1.
• From FY 1979 Q1 through FY 2014 Q1, six of the 15 information products and services accounted for 94 percent of federal spending on information commodities: Web-based subscriptions (21 percent), books and pamphlets (21 percent of total spending), administrative support for federal libraries (16 percent), administrative support for information retrieval (13 percent), newspapers and periodicals (12 percent), and maps, atlases, charts, and globes (11 percent).
• In the most recent five-year period from FY 2010 to FY 2014 Q1, federal agencies have sharply reduced spending on maps, atlases, charts, and globes. Consequently, the five remaining products and services listed above composed 95 percent of the federal information market.
• In the time span from FY 1979 through FY 2014 Q1, five agencies accounted for 67 percent of total federal spending on information commodities: Department of Defense (40 percent of total spending), Department of Health and Human Services (11 percent), Department of Commerce (6 percent), Department of Justice (6 percent), and Department of the Treasury (5 percent. Because of rounding error, the individual percentages do not total 67 percent.
• In the more recent period from FY 2010 through FY 2014 Q1, seven federal agencies accounted for the majority of federal spending on information products and services: Department of Defense (23 percent of total federal spending), Department of Health and
1
Library of Congress – Federal Research Division Strategic Sourcing of Information Products and Services
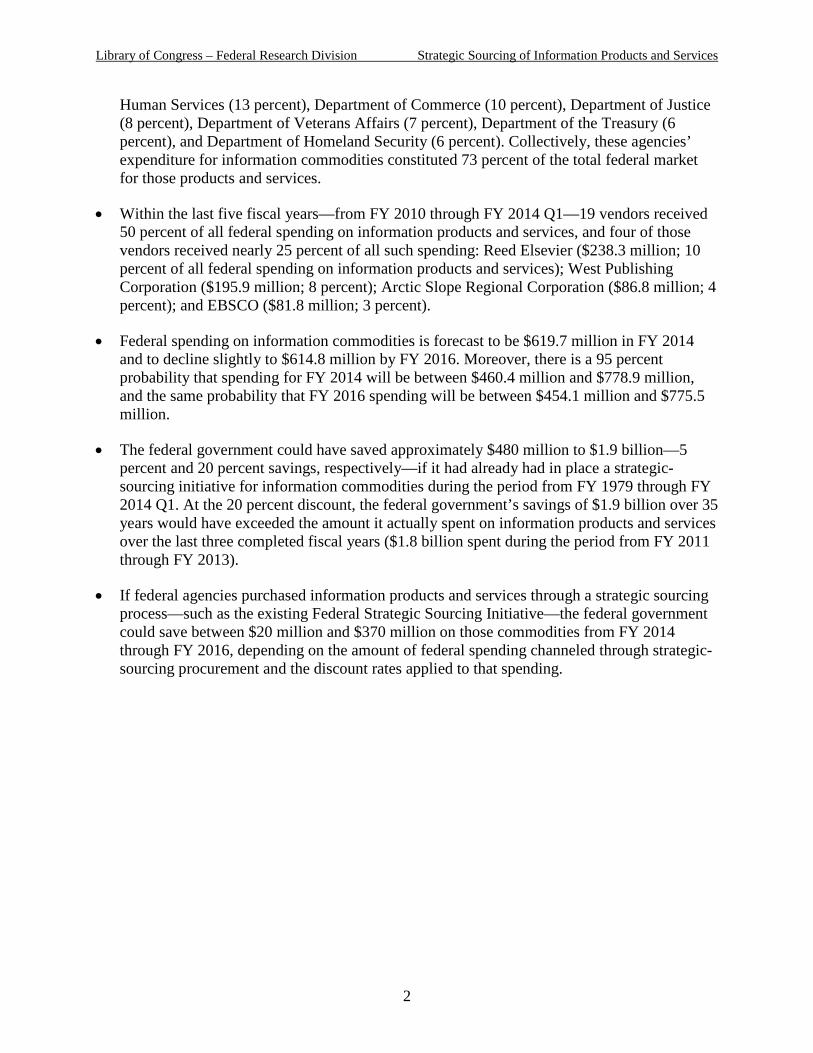
Human Services (13 percent), Department of Commerce (10 percent), Department of Justice (8 percent), Department of Veterans Affairs (7 percent), Department of the Treasury (6 percent), and Department of Homeland Security (6 percent). Collectively, these agencies’ expenditure for information commodities constituted 73 percent of the total federal market for those products and services.
• Within the last five fiscal years—from FY 2010 through FY 2014 Q1—19 vendors received 50 percent of all federal spending on information products and services, and four of those vendors received nearly 25 percent of all such spending: Reed Elsevier ($238.3 million; 10 percent of all federal spending on information products and services); West Publishing Corporation ($195.9 million; 8 percent); Arctic Slope Regional Corporation ($86.8 million; 4 percent); and EBSCO ($81.8 million; 3 percent).
• Federal spending on information commodities is forecast to be $619.7 million in FY 2014 and to decline slightly to $614.8 million by FY 2016. Moreover, there is a 95 percent probability that spending for FY 2014 will be between $460.4 million and $778.9 million, and the same probability that FY 2016 spending will be between $454.1 million and $775.5 million.
• The federal government could have saved approximately $480 million to $1.9 billion—5 percent and 20 percent savings, respectively—if it had already had in place a strategic-sourcing initiative for information commodities during the period from FY 1979 through FY 2014 Q1. At the 20 percent discount, the federal government’s savings of $1.9 billion over 35 years would have exceeded the amount it actually spent on information products and services over the last three completed fiscal years ($1.8 billion spent during the period from FY 2011 through FY 2013).
• If federal agencies purchased information products and services through a strategic sourcing process—such as the existing Federal Strategic Sourcing Initiative—the federal government could save between $20 million and $370 million on those commodities from FY 2014 through FY 2016, depending on the amount of federal spending channeled through strategic-sourcing procurement and the discount rates applied to that spending.
2
Library of Congress – Federal Research Division Strategic Sourcing of Information Products and Services
INTRODUCTION
This report analyzes the U.S. federal government’s spending on information products and
services from FY 1979 through the first quarter (Q1) of FY 2014, as well as estimates of cost
savings the federal government could realize from FY 2014 through FY 2016 if it were to
procure information goods and services through a strategic-sourcing process. Among the topics
analyzed are the products and services that compose the information market, the federal agencies
that have been major purchasers of those products and services, and the contractors that have
provided them. Throughout this report, data tables and graphs detail and illustrate the findings.
Among the data and graphs contained in this paper are the dataset, diagnostic graphs, and various
statistics used to create and assess forecasts of federal spending on information commodities, all
of which are in the appendix.
Briefly summarized, the research finds that, from FY 1979 through FY 2013 (all the
complete fiscal years during the period covered in this study), federal government agencies spent
an estimated $9.6 billion—$274 million annually—on print publications, electronic databases,
information retrieval, and other commodities, a set of products and services collectively
described as the “information market.” In addition, federal agencies spent $82 million on these
commodities in the first quarter of FY 2014, bringing total federal spending on information
products to $9.7 billion from FY 1979 Q1 through FY 2014 Q1. If federal agencies were to
procure information products and services through the federal government’s existing strategic-
sourcing program, the Federal Strategic Sourcing Initiative (FSSI), the federal government could
realize savings in the range of approximately $20 million to $370 million for the three years from
FY 2014 through FY 2016, depending on the amount the government spends on procurement
through strategic-sourcing methods. In addition to these direct savings on purchases, the
government could realize indirect savings on labor and other costs associated with procurement.
METHODOLOGY
The researcher gathered data for this report from Federal Procurement Data System-Next
Generation (FPDS-NG), an online database that the U.S. General Services Administration (GSA)
Federal Procurement Data Center operates to disclose information on federal procurement
contracts to the public. Information derived from database records includes the name of the
funding agency, the award amount, and the award recipient. The FPDS-NG, operational since
3
Library of Congress – Federal Research Division Strategic Sourcing of Information Products and Services
October 2003, replaced the previous system, the Federal Procurement Data System, which the
federal government had placed in operation in 1978. The U.S. Office of Management and Budget
(OMB) maintains a similar Web site called USAspending.gov, which also provides data on
procurement contracts and on grants and loans. While some previous iterations of this report
used data from USAspending.gov, the current report is based on data from the FPDS-NG. The
kFPDS-NG provides data covering a longer period (FY 1979 to present) than does
USAspending.gov (FY 2000 and later), and, therefore, allows for better analyses of trends in
federal spending.1
The first step in the research process was to determine which categories of goods and
services might reasonably be considered to constitute the “information market.” To make this
determination, the researcher studied the product service codes (PSCs) that federal procurement
contracts use to classify contracted products and services and identified 15 PSCs that designate
information commodities (listed in Table 1, below). The researcher then used the FDPS-NG Web
site’s Adhoc Reports feature to acquire data on the 15 PSCs for the period from FY 1979 Q1
through FY 2014 Q1—October 1, 1978, through December 31, 2014.2 Focusing on the federal
agencies that awarded contracts for these 15 PSCs, and on the contractors awarded those
contracts, the researcher downloaded nearly 190,000 records in comma-separated-value (CSV)
format. The researcher used Microsoft Excel, the statistical program R, and the R program
package MASS to analyze the data and create the graphs in this report.3 The data are accurate as
of the date of download, January 29, 2014. Future iterations of this report will incorporate
spending data after FY 2014 Q1.
1 U.S. Government Accountability Office (GAO), “Improvements Needed to the Federal Procurement Data System-Next Generation” (report no. GAO-05-960R, Washington, DC, September 27, 2005), http://www.gao.gov/assets/100/93613.pdf (accessed August 6, 2012); USAspending.gov, “Learn About USAspending.gov,” http://usaspending.gov/learn?tab=FAQ (accessed April 15, 2012). 2 To locate the relevant data in the FPDS-NG, the researcher used the “Adhoc Reports” feature of FPDS-NG’s ezSearch. The first iteration of this study used 16 PSCs in its analysis, but the second iteration incorporated only 15 PSCs. One of the PSCs in the first study of the federal information market—miscellaneous printed matter (PSC 7690)—was dropped from the second analysis because it included substantial spending on products and services that the researcher later determined were not information products and services. See William Noël Ivey, “Federal Government Strategic Sourcing of Information Products and Services” (report, Federal Research Division, Library of Congress, Washington, DC, December 2011), 4, http://www.loc.gov/flicc/publications/FRD/Strategic-Sourcing-Version-2_2011-Dec-5-Corrected.pdf (accessed April 15, 2012). 3 R Core Team, “R: A Language and Environment for Statistical Computing” (Vienna, Austria: R Foundation for Statistical Computing, 2013), http://www.R-project.org/ (version 3.0.2 downloaded October 3, 2013); William N. Venables and Brian D. Ripley, Modern Applied Statistics with S (New York: Springer, 2002).
4
Library of Congress – Federal Research Division Strategic Sourcing of Information Products and Services
The data used in this analysis have some potential limitations. Various observers,
including federal government agencies, have raised concerns about the accuracy and
completeness of data in federal procurement databases such as the FPDS and USAspending.gov.
Over time, GSA, OMB, and other federal agencies have made an effort to address those
concerns, leading to more accurate and complete data, particularly for FY 2004 and later. One
such effort was the creation of the FPDS-NG system as a successor to FPDS.4 Given potential
limitations of the federal procurement data available at the time the research for this analysis was
completed (April 2014), the researcher presents these findings with the following caveats: the
data relied on for this report may contain inaccuracies, and the comparability of data across years
is limited to an unknown extent.
OVERVIEW OF THE FEDERAL STRATEGIC-SOURCING INITIATIVE
In May 2005, OMB and the Office of Federal Procurement Policy issued a memorandum
requiring federal agencies to identify commodities that the government could efficiently
purchase through strategic sourcing. The document defined strategic sourcing as “the
collaborative and structured process of critically analyzing an organization's spending and using
this information to make business decisions about acquiring commodities and services more
effectively and efficiently.”5 Soon after, in November 2005, GSA and the Department of the
Treasury launched the Federal Strategic Sourcing Initiative (FSSI). As of April 2014, GSA has
established individual FSSIs for domestic delivery services, hardware supplies, office supplies,
print management, telecommunications-expense management services, and wireless services.
GSA plans several additional FSSIs, including for computer software (“SmartBUY”), furniture,
4 Michael Hardy, “Fixing the Next Generation Procurement Data System,” Federal Computer Week 19, no. 40 (November 21, 2005): 65–66, http://www.proquest.com/en-US/ (DOI 218835006; accessed April 15, 2012 via ProQuest); U.S. Government Accountability Office (GAO), “Improvements Needed to the Federal Procurement Data System-Next Generation.” 5 U.S. Office of Management and Budget, “Implementing Strategic Sourcing” (memorandum, Washington, DC, May 20, 2005), http://www.uspto.gov/web/offices/ac/comp/proc/OMBmemo.pdf (accessed July 15, 2011). A very similar definition of strategic sourcing was included in legislation introduced in both the House of Representatives and the Senate on July 16, 2013. The House and Senate bills—both formally called the Buy Smarter and Save Act of 2013—defined strategic sourcing as “a structured and collaborative process of critically analyzing an organization's spending patterns to better leverage its purchasing power, reduce costs, and improve overall value and performance.” See Buy Smarter and Save Act of 2013, H.R. 2649 and S. 1304, 113th Cong., (2013), http://beta.congress.gov/bill/113th/house-bill/2694/text and http://beta.congress.gov/bill/113th/senate-bill/1304/text (accessed September 17, 2013).
5
Library of Congress – Federal Research Division Strategic Sourcing of Information Products and Services
and for the subject of this analysis, information resources.6 According to GSA, federal
government agencies using the existing FSSIs collectively saved $8.9 million on office supplies,
$800,000 on print management, $1.9 million on wireless services, and an unspecified amount on
domestic delivery services in FY 2014 Q1 (i.e., October 1, 2013 through December 31, 2013).
According to available GSA data, the joint savings of these federal agencies amounted to 27.9
percent on domestic delivery services and 25.9 percent on telecommunications expense-
management services.7 Stated differently, federal agencies that have used existing FSSIs to
procure products and services have realized savings ranging from approximately 25 to 30 percent
on those commodities. Studies of strategic sourcing by private-sector entities and by public-
sector agencies outside of the United States have found slightly lower rates of savings, ranging
from 8 percent to 20 percent of procurement costs.8
A further development regarding federal strategic sourcing occurred in July 2013, with
the introduction of legislation in the House and Senate that would promote federal agencies’ use
of strategic sourcing in their procurement activities. The proposed legislation—the Buy Smarter
and Save Act of 2013—would require the comptroller general, OMB, the president of the United
States, and certain federal agencies to conduct specified actions to support implementation of
strategic sourcing as a procurement method. As of April 2014, both House and Senate had
referred their versions of the bill to committee, with no further action taken.9
DEFINING THE FEDERAL INFORMATION MARKET
The U.S. federal government does not formally define the term “information market” in
its publications. Moreover, researchers in academic and industrial sectors who report on
publishing and other aspects of the information industry do not cite a common definition of the
6 U.S. General Services Administration, “About Strategic Sourcing,” https://strategicsourcing.gov/about-fssi-0 (accessed April 4, 2013); U.S. General Services Administration, “Federal Strategic Sourcing Initiative (FSSI),” http://www.gsa.gov/portal/content/105156 (accessed April 4, 2014); U.S. General Services Administration, “Future Solutions,” https://strategicsourcing.gov/about-fssi (accessed April 4, 2014). 7 U.S. General Services Administration, “Strategic Sourcing Metrics,” https://strategicsourcing.gov/ (accessed April 4, 2014). 8 Cathy Hayward, “Reforming the Old Bill,” Supply Management, January 4, 2011, 21–23, http://www.proquest.com/en-US/ ( DOI 222195677; accessed April 15, 2012 via ProQuest); Carlos Niezen, Wulf Weller, and Heidi Deringer, “Strategic Supply Management,” MIT Sloan Management Review 48, no. 2 (Winter 2007): 7, http://www.proquest.com/en-US/ (DOI 2224964805; accessed April 15, 2012 via ProQuest). 9 Buy Smarter and Save Act of 2013, H.R. 2649 and S. 1304, 113th Cong., (2013), http://beta.congress.gov/bill/113th/house-bill/2694 and http://beta.congress.gov/bill/113th/senate-bill/1304 (accessed April 4, 2014).
6
Library of Congress – Federal Research Division Strategic Sourcing of Information Products and Services
term. To define the term “information market,” operationally for the purpose of this study, the
researcher constructed a taxonomy of products and services, based on the PSC classification
system that federal agencies use to specify goods and services purchased under government
procurement contracts.10
Federal government agencies also use another classification system for procurement, the
North American Industry Classification System (NAICS), which outlines categories of industries
and commercial activities that provide products and services. However, this report relies on PSC
data, rather than NAICS categories, because NAICS classifications specify the industries that
produce and distribute goods and services, whereas PSC designations identify the procured
products and services.11 Moreover, federal contract data on PSC classifications are more readily
available than are contract data organized by NAICS categories, since the data records for
procurement contracts, available through the FPDS-NG and USAspending.gov, almost
invariably list PSC class but often do not include NAICS category.
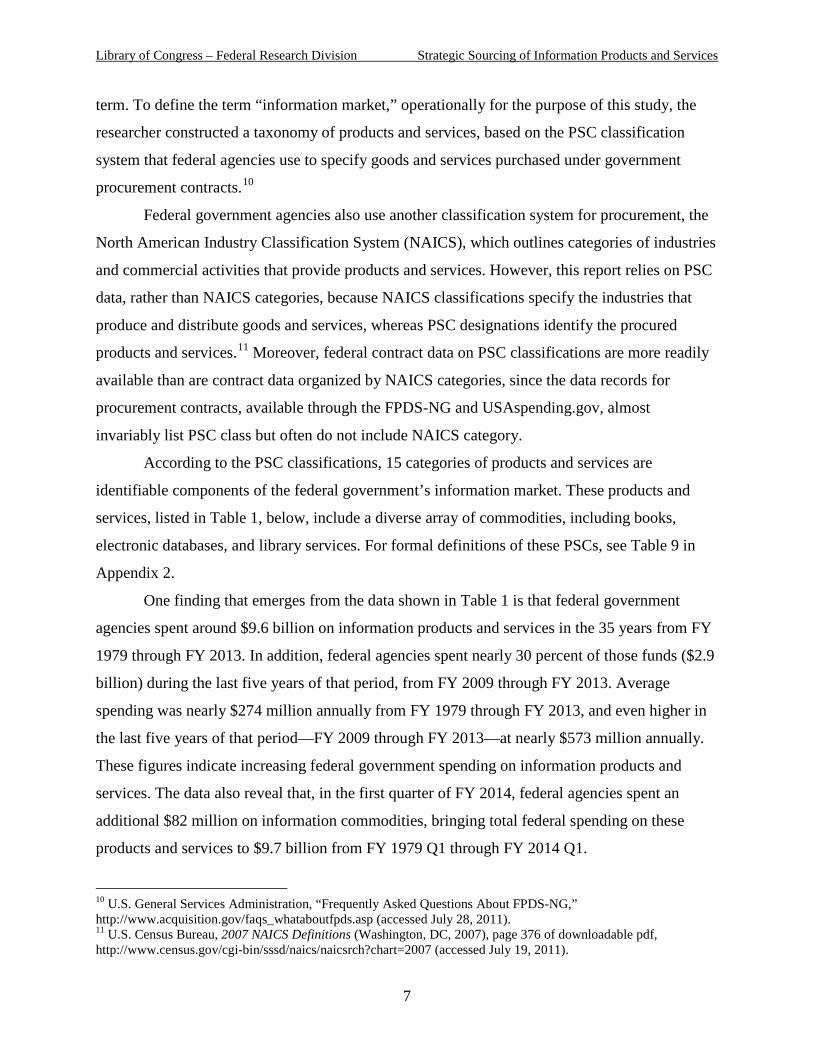
According to the PSC classifications, 15 categories of products and services are
identifiable components of the federal government’s information market. These products and
services, listed in Table 1, below, include a diverse array of commodities, including books,
electronic databases, and library services. For formal definitions of these PSCs, see Table 9 in
Appendix 2.
One finding that emerges from the data shown in Table 1 is that federal government
agencies spent around $9.6 billion on information products and services in the 35 years from FY
1979 through FY 2013. In addition, federal agencies spent nearly 30 percent of those funds ($2.9
billion) during the last five years of that period, from FY 2009 through FY 2013. Average
spending was nearly $274 million annually from FY 1979 through FY 2013, and even higher in
the last five years of that period—FY 2009 through FY 2013—at nearly $573 million annually.
These figures indicate increasing federal government spending on information products and
services. The data also reveal that, in the first quarter of FY 2014, federal agencies spent an
additional $82 million on information commodities, bringing total federal spending on these
products and services to $9.7 billion from FY 1979 Q1 through FY 2014 Q1.
10 U.S. General Services Administration, “Frequently Asked Questions About FPDS-NG,” http://www.acquisition.gov/faqs_whataboutfpds.asp (accessed July 28, 2011). 11 U.S. Census Bureau, 2007 NAICS Definitions (Washington, DC, 2007), page 376 of downloadable pdf, http://www.census.gov/cgi-bin/sssd/naics/naicsrch?chart=2007 (accessed July 19, 2011).
7
Library of Congress – Federal Research Division Strategic Sourcing of Information Products and Services
However, these spending figures may undercount the actual value of the information
market, because they exclude the value of contracts with PSCs designating categories unrelated
to that market. Some contracts with apparently unrelated PSCs may nonetheless involve
procurement of information products and services. For example, the $9.7 billion in federal
spending on information products and services from FY 1979 through FY 2014 Q1 does not
include several federal contracts with Reed Elsevier and West Publishing for the LexisNexis and
Westlaw electronic databases, because these contracts listed PSCs such as 7030 “ADP
[automatic data processing] software,” R499 “Other professional services,” and T003
“Cataloging services.”
Table 1. Federal Information Market, Products and Services, FY 1979–FY 2014 Q1
Products and Services (Product Service Code)
Contracts (in $ millions)
FY 1979– FY 2014 Q1
Percentage of Total
Contracts
Contracts (in $ millions)
FY 2010– FY 2014 Q1
Percentage of Total
Contracts
Web-based subscriptions (D317) $2,049.4 21.2% $550.9 22.6%
Books and pamphlets (7610) $2,046.9 21.1% $539.4 22.1%
Administrative support, library (R605) $1,576.0 16.3% $399.3 16.4%
Administrative support, information retrieval (R612) $1,232.6 12.7% $470.6 19.3%
Newspapers and periodicals (7630) $1,141.6 11.8% $360.3 14.8%
Maps, atlases, charts, and globes (7640) $1,065.1 11.0% $7.7 0.3%
Microfilm, processed (7670) $196.5 2.0% $1.0 0.0%
Drawings and specifications (7650) $196.4 2.0% $31.3 1.3%
Digital maps, charts, and geodetic products (7644) $95.8 1.0% $29.8 1.2%
Technical representative-books, maps, and other publications (L076) $63.1 0.7% $34.7 1.4%
Aeronautic maps, charts, and geodetic products (7641) $10.4 0.1% $7.0 0.3%
Sheet and book music (7660) $7.0 0.1% $0.6 0.0%
Topographic maps, charts, and geodetic products (7643) $4.4 0.0% $2.6 0.1%
8
Library of Congress – Federal Research Division Strategic Sourcing of Information Products and Services
Table 1. Federal Information Market, Products and Services, FY 1979–FY 2014 Q1
Products and Services (Product Service Code)
Contracts (in $ millions)
FY 1979– FY 2014 Q1
Percentage of Total
Contracts
Contracts (in $ millions)
FY 2010– FY 2014 Q1
Percentage of Total
Contracts
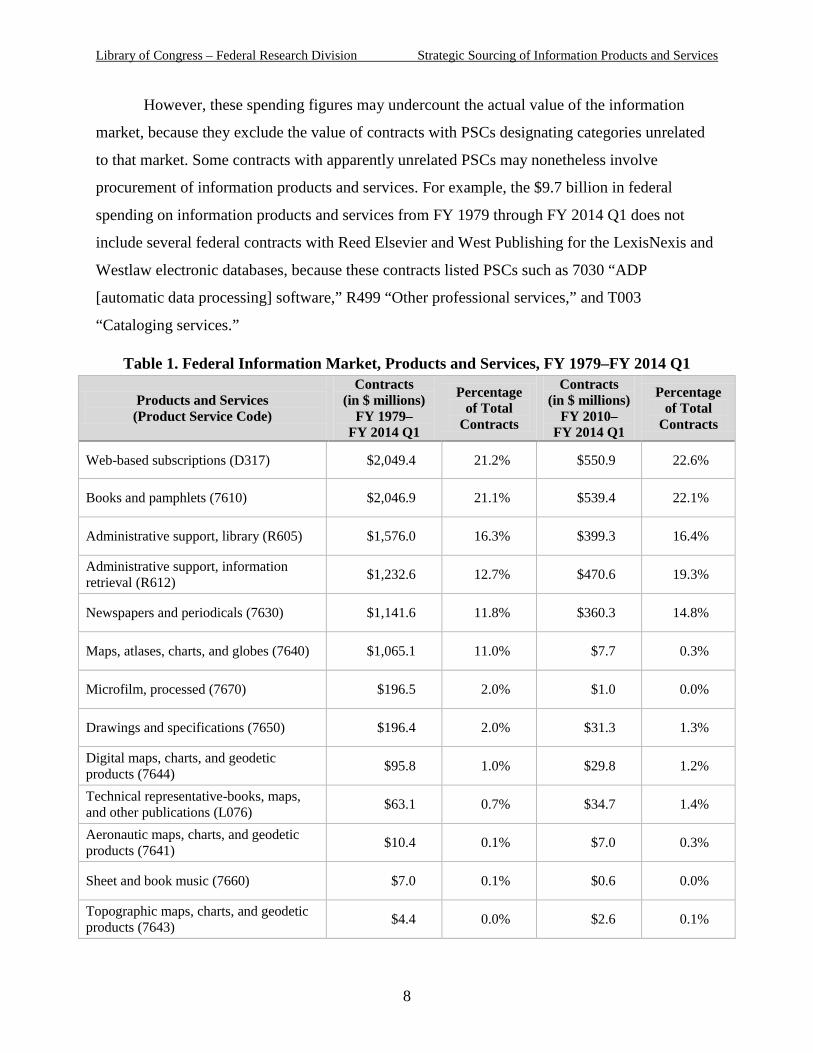
Hydrographic maps, charts, and geodetic products (7642) $2.3 0.0% $0.8 0.0%
Books, maps, other publications (76) $0.0 0.0% $0.0 0.0%
Total $9,687.6 100.0% $2,436.1 100.0%
Another finding is that federal government spending on information products and
services has fluctuated but has shown an overall increase over time. During FY 1979 through FY
2013—the period for which the FPDS-NG provides spending data on information products and
services for complete fiscal years—spending on information commodities increased from $76
million in FY 1979 to $276 million in FY 2000, to $530 million in FY 2010, and to $644 million
by FY 2013. However, the spending figures for FY 2013 and other recent fiscal years may
change as federal agencies continue to input and update spending data for those years into FPDS-
NG. Figure 1, below, depicts federal spending on information products and services from FY
1979 through FY 2013, with specific figures listed for FY 1980 and for ten-year intervals
thereafter (FY 1990, FY 2000, and FY 2010).
Figure 1. Federal Spending on Information Products and Services, FY 1979–FY 2013
$60 $73
$276
$530
$274
$0
$250
$500
$750
1980 1990 2000 2010
US$
mill
ions
Spending Average
9
Library of Congress – Federal Research Division Strategic Sourcing of Information Products and Services
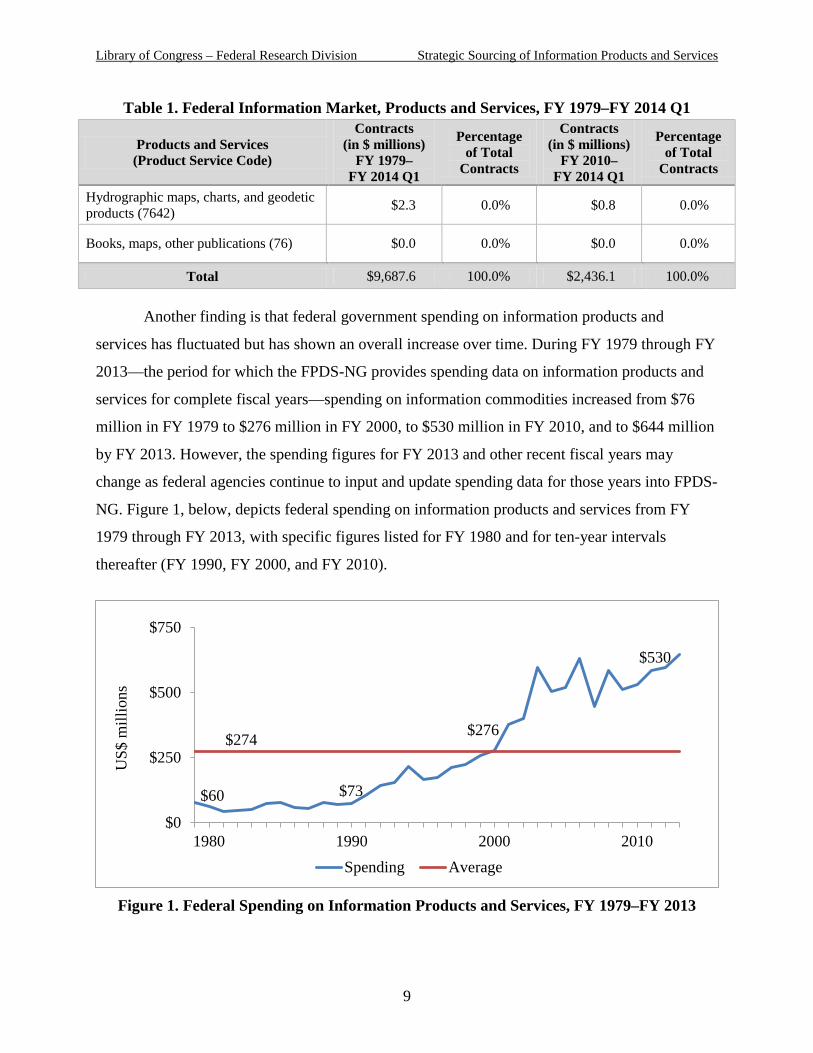
Expressing federal spending on information products and services for each year as ratios,
rather than as dollar figures, clarifies that spending on information products and services was
largely unchanged between FY 1980 and FY 1990, but nearly five times greater in FY 2000 than
in FY 1980. The spheres in Figure 2, below, which represent these spending ratios, demonstrate
the growth in federal spending on information commodities since FY 1980 (the base year of
comparison in the graph). As federal procurement of information commodities continued to
expand, spending ratios increased as well. Spending in FY 2000 was nearly four times greater
than in FY 1980, and spending in FY 2010 was almost nine times greater than in FY 1980.
Figure 2. Growth of Federal Spending on Information Products and
Services, FY 1980–FY 2010
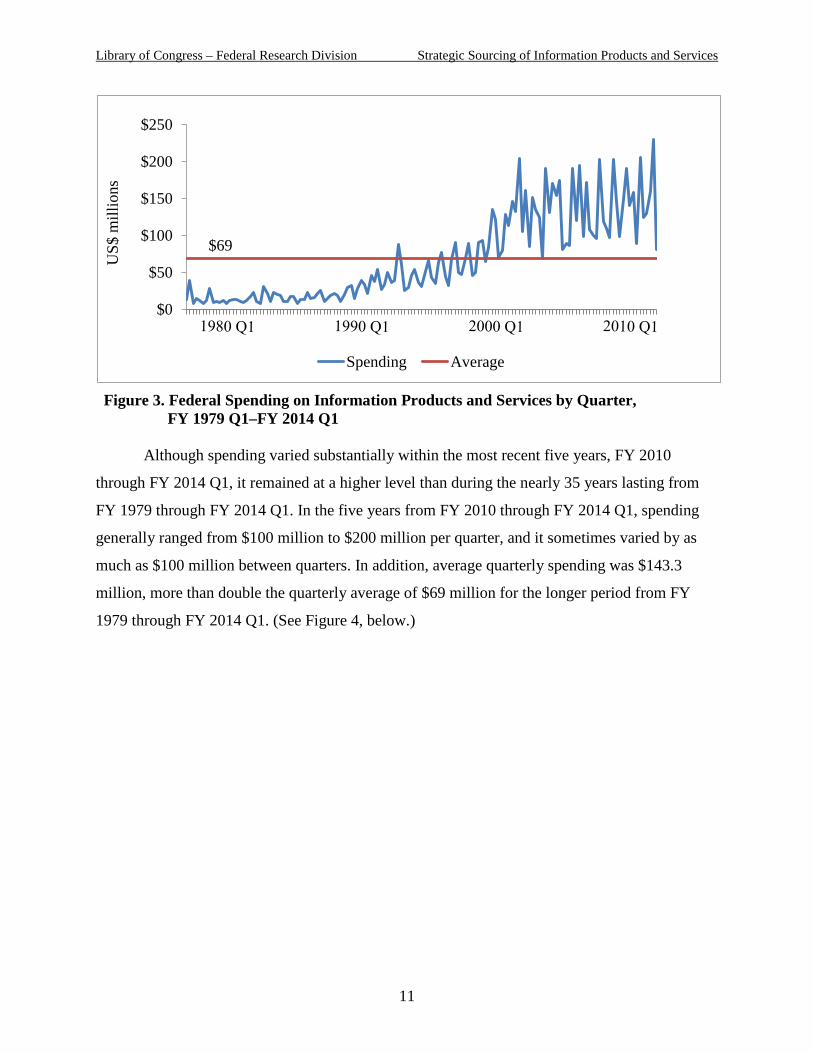
While federal spending on information commodities generally increased from FY 1979
through FY 2014 Q1, spending also fluctuated substantially within that period. Federal spending
on information commodities occasionally increased and declined by $50 million or more from
one quarter to the next. Figure 3, below, depicts these variations, showing federal spending on
information products and services for all completed fiscal quarters from FY 1979 Q1 through FY
2014 Q1. Figure 3 illustrates that spending on information commodities has trended upward but
has proven quite variable from quarter to quarter, and that average spending by quarter was
$68.7 million for the period.
$60 $73 $276 $530
1970 1980 1990 2000 2010 2020Values in US$ millions
10
Library of Congress – Federal Research Division Strategic Sourcing of Information Products and Services
Figure 3. Federal Spending on Information Products and Services by Quarter,
FY 1979 Q1–FY 2014 Q1
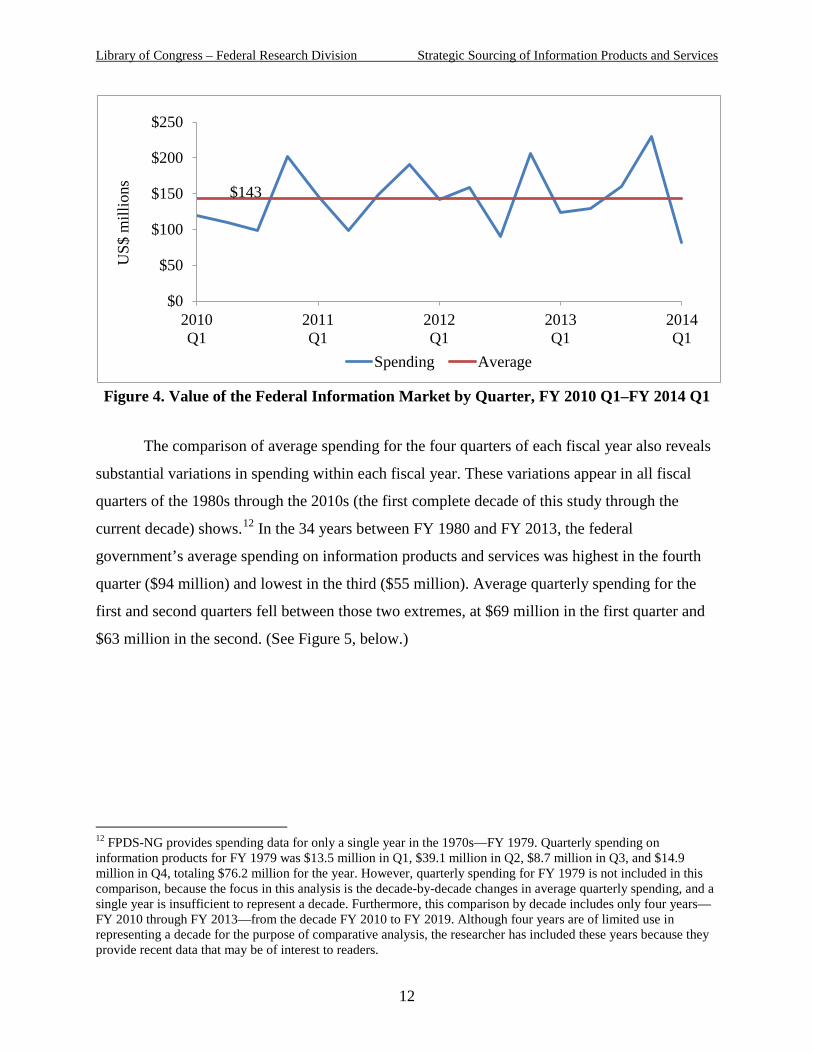
Although spending varied substantially within the most recent five years, FY 2010
through FY 2014 Q1, it remained at a higher level than during the nearly 35 years lasting from
FY 1979 through FY 2014 Q1. In the five years from FY 2010 through FY 2014 Q1, spending
generally ranged from $100 million to $200 million per quarter, and it sometimes varied by as
much as $100 million between quarters. In addition, average quarterly spending was $143.3
million, more than double the quarterly average of $69 million for the longer period from FY
1979 through FY 2014 Q1. (See Figure 4, below.)
$69
$0
$50
$100
$150
$200
$250U
S$ m
illio
ns
Spending Average
11
Library of Congress – Federal Research Division Strategic Sourcing of Information Products and Services
Figure 4. Value of the Federal Information Market by Quarter, FY 2010 Q1–FY 2014 Q1
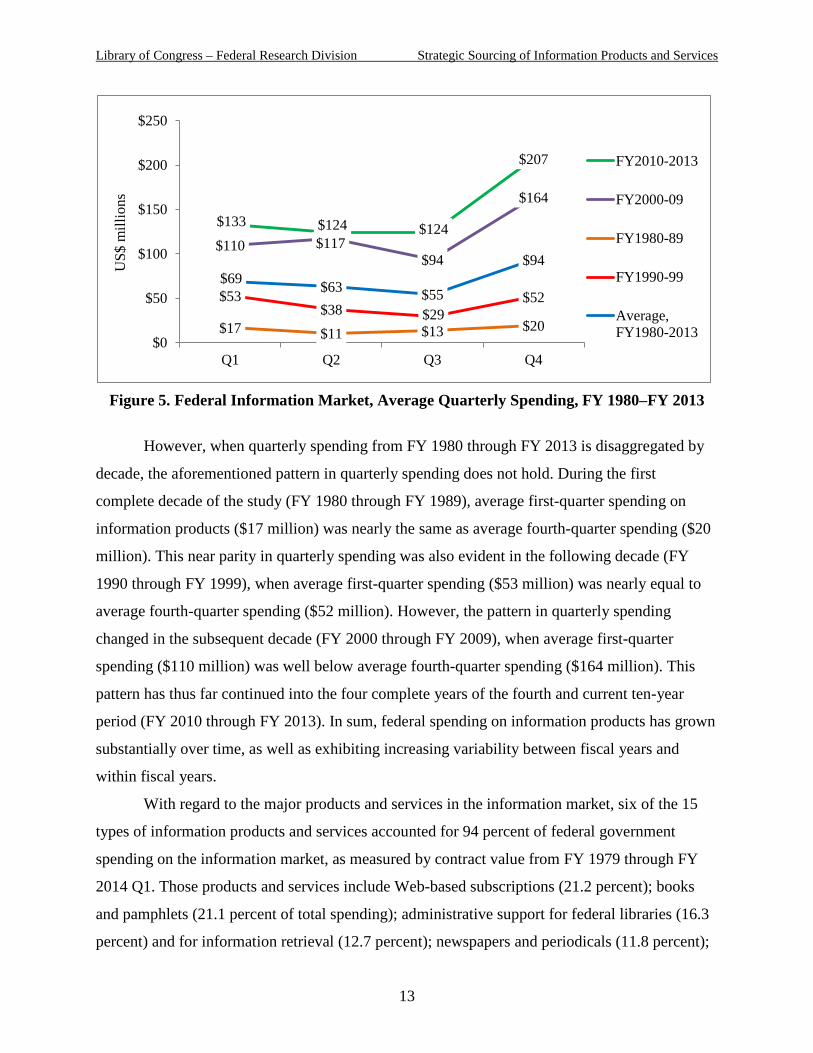
The comparison of average spending for the four quarters of each fiscal year also reveals
substantial variations in spending within each fiscal year. These variations appear in all fiscal
quarters of the 1980s through the 2010s (the first complete decade of this study through the
current decade) shows.12 In the 34 years between FY 1980 and FY 2013, the federal
government’s average spending on information products and services was highest in the fourth
quarter ($94 million) and lowest in the third ($55 million). Average quarterly spending for the
first and second quarters fell between those two extremes, at $69 million in the first quarter and
$63 million in the second. (See Figure 5, below.)
12 FPDS-NG provides spending data for only a single year in the 1970s—FY 1979. Quarterly spending on information products for FY 1979 was $13.5 million in Q1, $39.1 million in Q2, $8.7 million in Q3, and $14.9 million in Q4, totaling $76.2 million for the year. However, quarterly spending for FY 1979 is not included in this comparison, because the focus in this analysis is the decade-by-decade changes in average quarterly spending, and a single year is insufficient to represent a decade. Furthermore, this comparison by decade includes only four years—FY 2010 through FY 2013—from the decade FY 2010 to FY 2019. Although four years are of limited use in representing a decade for the purpose of comparative analysis, the researcher has included these years because they provide recent data that may be of interest to readers.
$143
$0
$50
$100
$150
$200
$250
2010Q1
2011Q1
2012Q1
2013Q1
2014Q1
US$
mill
ions
Spending Average
12
Library of Congress – Federal Research Division Strategic Sourcing of Information Products and Services
Figure 5. Federal Information Market, Average Quarterly Spending, FY 1980–FY 2013
However, when quarterly spending from FY 1980 through FY 2013 is disaggregated by
decade, the aforementioned pattern in quarterly spending does not hold. During the first
complete decade of the study (FY 1980 through FY 1989), average first-quarter spending on
information products ($17 million) was nearly the same as average fourth-quarter spending ($20
million). This near parity in quarterly spending was also evident in the following decade (FY
1990 through FY 1999), when average first-quarter spending ($53 million) was nearly equal to
average fourth-quarter spending ($52 million). However, the pattern in quarterly spending
changed in the subsequent decade (FY 2000 through FY 2009), when average first-quarter
spending ($110 million) was well below average fourth-quarter spending ($164 million). This
pattern has thus far continued into the four complete years of the fourth and current ten-year
period (FY 2010 through FY 2013). In sum, federal spending on information products has grown
substantially over time, as well as exhibiting increasing variability between fiscal years and
within fiscal years.
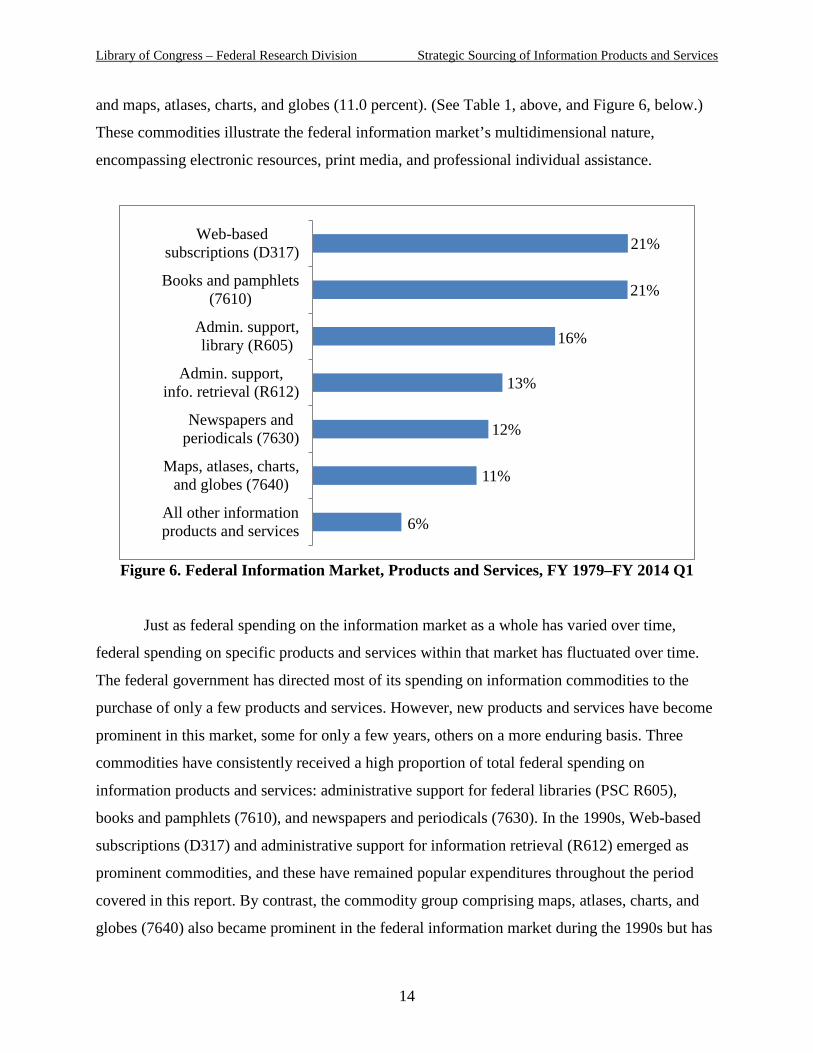
With regard to the major products and services in the information market, six of the 15
types of information products and services accounted for 94 percent of federal government
spending on the information market, as measured by contract value from FY 1979 through FY
2014 Q1. Those products and services include Web-based subscriptions (21.2 percent); books
and pamphlets (21.1 percent of total spending); administrative support for federal libraries (16.3
percent) and for information retrieval (12.7 percent); newspapers and periodicals (11.8 percent);
$133 $124 $124
$207
$110 $117 $94
$164
$17 $11 $13 $20
$53 $38 $29
$52 $69 $63 $55
$94
$0
$50
$100
$150
$200
$250
Q1 Q2 Q3 Q4
US$
mill
ions
FY2010-2013
FY2000-09
FY1980-89
FY1990-99
Average,FY1980-2013
13
Library of Congress – Federal Research Division Strategic Sourcing of Information Products and Services
and maps, atlases, charts, and globes (11.0 percent). (See Table 1, above, and Figure 6, below.)
These commodities illustrate the federal information market’s multidimensional nature,
encompassing electronic resources, print media, and professional individual assistance.
Figure 6. Federal Information Market, Products and Services, FY 1979–FY 2014 Q1
Just as federal spending on the information market as a whole has varied over time,
federal spending on specific products and services within that market has fluctuated over time.
The federal government has directed most of its spending on information commodities to the
purchase of only a few products and services. However, new products and services have become
prominent in this market, some for only a few years, others on a more enduring basis. Three
commodities have consistently received a high proportion of total federal spending on
information products and services: administrative support for federal libraries (PSC R605),
books and pamphlets (7610), and newspapers and periodicals (7630). In the 1990s, Web-based
subscriptions (D317) and administrative support for information retrieval (R612) emerged as
prominent commodities, and these have remained popular expenditures throughout the period
covered in this report. By contrast, the commodity group comprising maps, atlases, charts, and
globes (7640) also became prominent in the federal information market during the 1990s but has
6%
11%
12%
13%
16%
21%
21%
All other informationproducts and services
Maps, atlases, charts,and globes (7640)
Newspapers andperiodicals (7630)
Admin. support,info. retrieval (R612)
Admin. support,library (R605)
Books and pamphlets(7610)
Web-basedsubscriptions (D317)
14
Library of Congress – Federal Research Division Strategic Sourcing of Information Products and Services
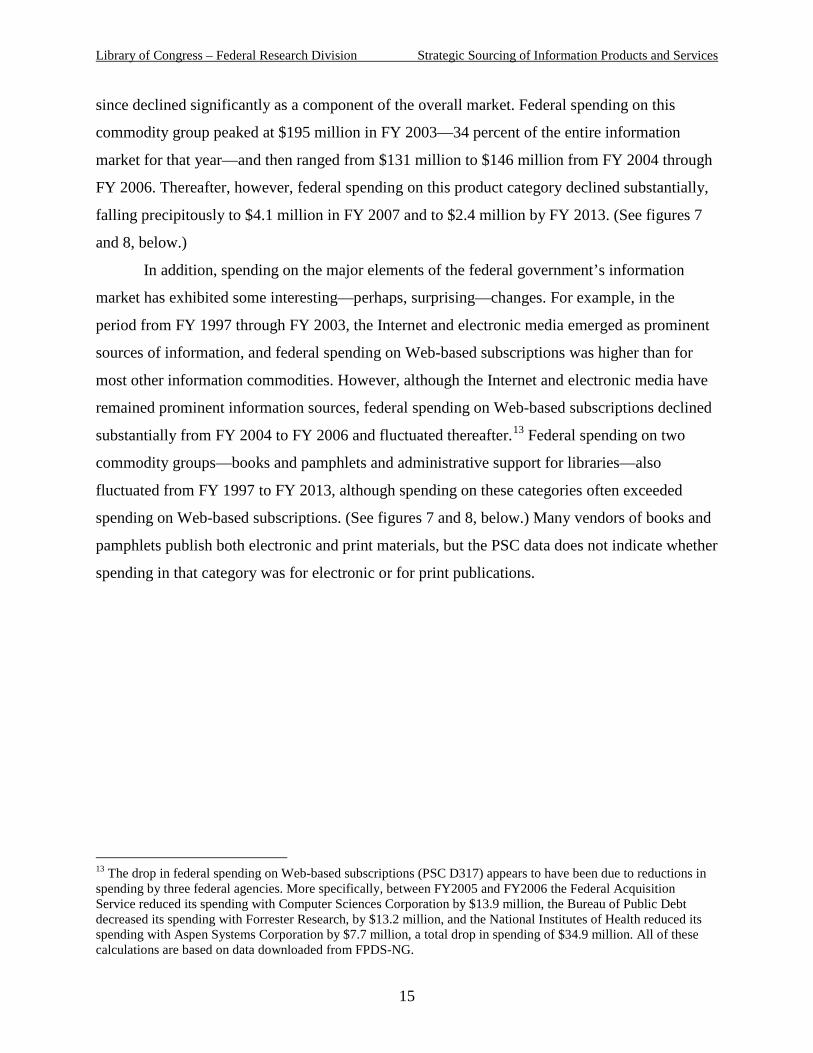
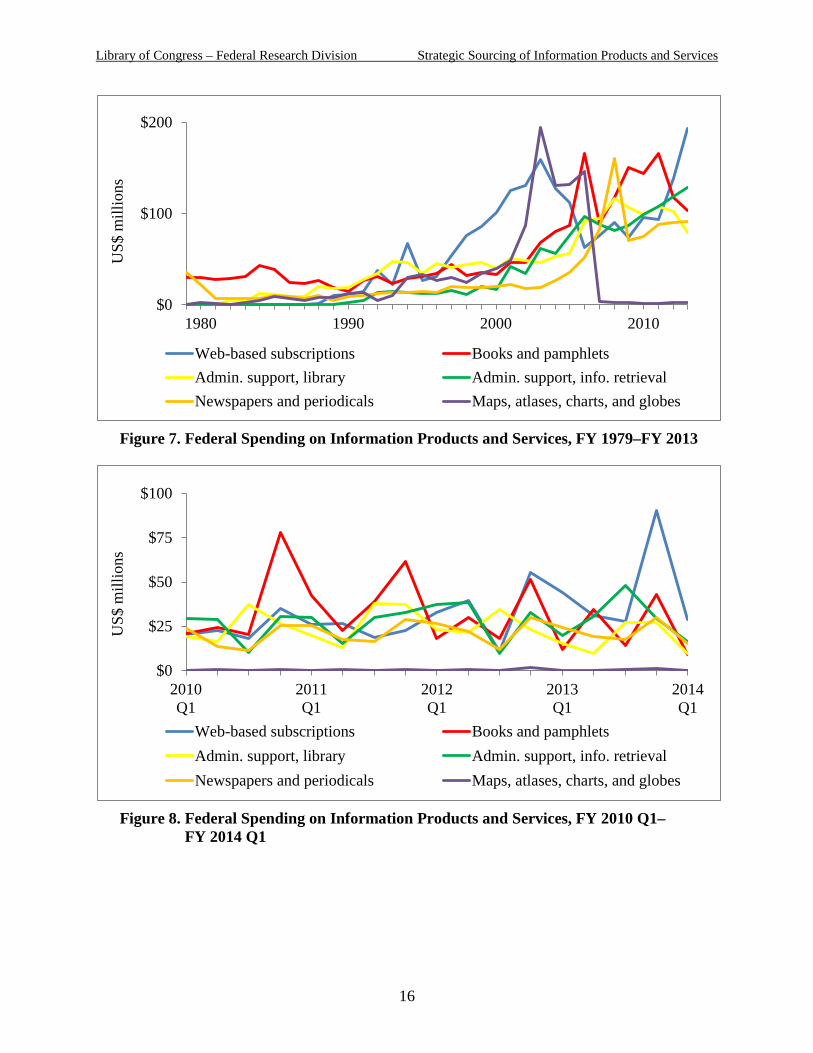
since declined significantly as a component of the overall market. Federal spending on this
commodity group peaked at $195 million in FY 2003—34 percent of the entire information
market for that year—and then ranged from $131 million to $146 million from FY 2004 through
FY 2006. Thereafter, however, federal spending on this product category declined substantially,
falling precipitously to $4.1 million in FY 2007 and to $2.4 million by FY 2013. (See figures 7
and 8, below.)
In addition, spending on the major elements of the federal government’s information
market has exhibited some interesting—perhaps, surprising—changes. For example, in the
period from FY 1997 through FY 2003, the Internet and electronic media emerged as prominent
sources of information, and federal spending on Web-based subscriptions was higher than for
most other information commodities. However, although the Internet and electronic media have
remained prominent information sources, federal spending on Web-based subscriptions declined
substantially from FY 2004 to FY 2006 and fluctuated thereafter.13 Federal spending on two
commodity groups—books and pamphlets and administrative support for libraries—also
fluctuated from FY 1997 to FY 2013, although spending on these categories often exceeded
spending on Web-based subscriptions. (See figures 7 and 8, below.) Many vendors of books and
pamphlets publish both electronic and print materials, but the PSC data does not indicate whether
spending in that category was for electronic or for print publications.
13 The drop in federal spending on Web-based subscriptions (PSC D317) appears to have been due to reductions in spending by three federal agencies. More specifically, between FY2005 and FY2006 the Federal Acquisition Service reduced its spending with Computer Sciences Corporation by $13.9 million, the Bureau of Public Debt decreased its spending with Forrester Research, by $13.2 million, and the National Institutes of Health reduced its spending with Aspen Systems Corporation by $7.7 million, a total drop in spending of $34.9 million. All of these calculations are based on data downloaded from FPDS-NG.
15
Library of Congress – Federal Research Division Strategic Sourcing of Information Products and Services
Figure 7. Federal Spending on Information Products and Services, FY 1979–FY 2013
Figure 8. Federal Spending on Information Products and Services, FY 2010 Q1–
FY 2014 Q1
$0
$100
$200
1980 1990 2000 2010
US$
mill
ions
Web-based subscriptions Books and pamphletsAdmin. support, library Admin. support, info. retrievalNewspapers and periodicals Maps, atlases, charts, and globes
$0
$25
$50
$75
$100
2010Q1
2011Q1
2012Q1
2013Q1
2014Q1
US$
mill
ions
Web-based subscriptions Books and pamphletsAdmin. support, library Admin. support, info. retrievalNewspapers and periodicals Maps, atlases, charts, and globes
16
Library of Congress – Federal Research Division Strategic Sourcing of Information Products and Services
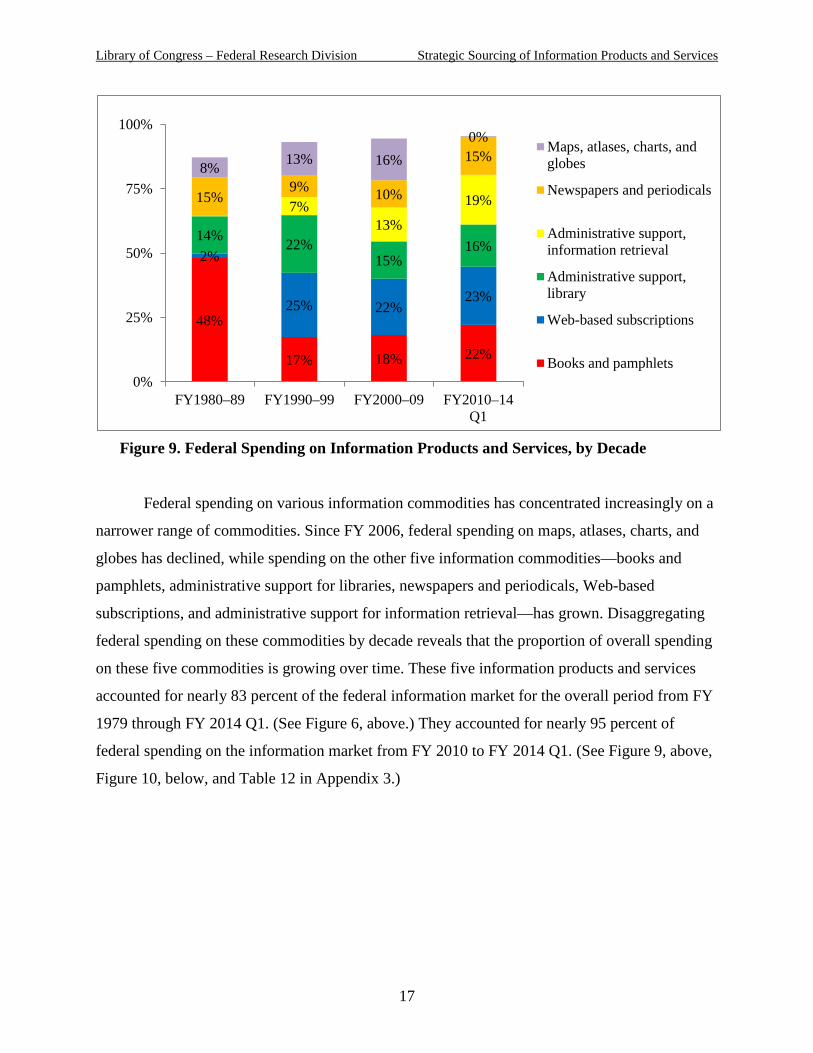
Figure 9. Federal Spending on Information Products and Services, by Decade
Federal spending on various information commodities has concentrated increasingly on a
narrower range of commodities. Since FY 2006, federal spending on maps, atlases, charts, and
globes has declined, while spending on the other five information commodities—books and
pamphlets, administrative support for libraries, newspapers and periodicals, Web-based
subscriptions, and administrative support for information retrieval—has grown. Disaggregating
federal spending on these commodities by decade reveals that the proportion of overall spending
on these five commodities is growing over time. These five information products and services
accounted for nearly 83 percent of the federal information market for the overall period from FY
1979 through FY 2014 Q1. (See Figure 6, above.) They accounted for nearly 95 percent of
federal spending on the information market from FY 2010 to FY 2014 Q1. (See Figure 9, above,
Figure 10, below, and Table 12 in Appendix 3.)
48%
17% 18% 22%
2%
25% 22% 23%
14% 22% 15%
16%
7% 13%
19% 15% 9% 10%
15% 8% 13% 16%
0%
0%
25%
50%
75%
100%
FY1980–89 FY1990–99 FY2000–09 FY2010–14 Q1
Maps, atlases, charts, andglobes
Newspapers and periodicals
Administrative support,information retrieval
Administrative support,library
Web-based subscriptions
Books and pamphlets
17
Library of Congress – Federal Research Division Strategic Sourcing of Information Products and Services
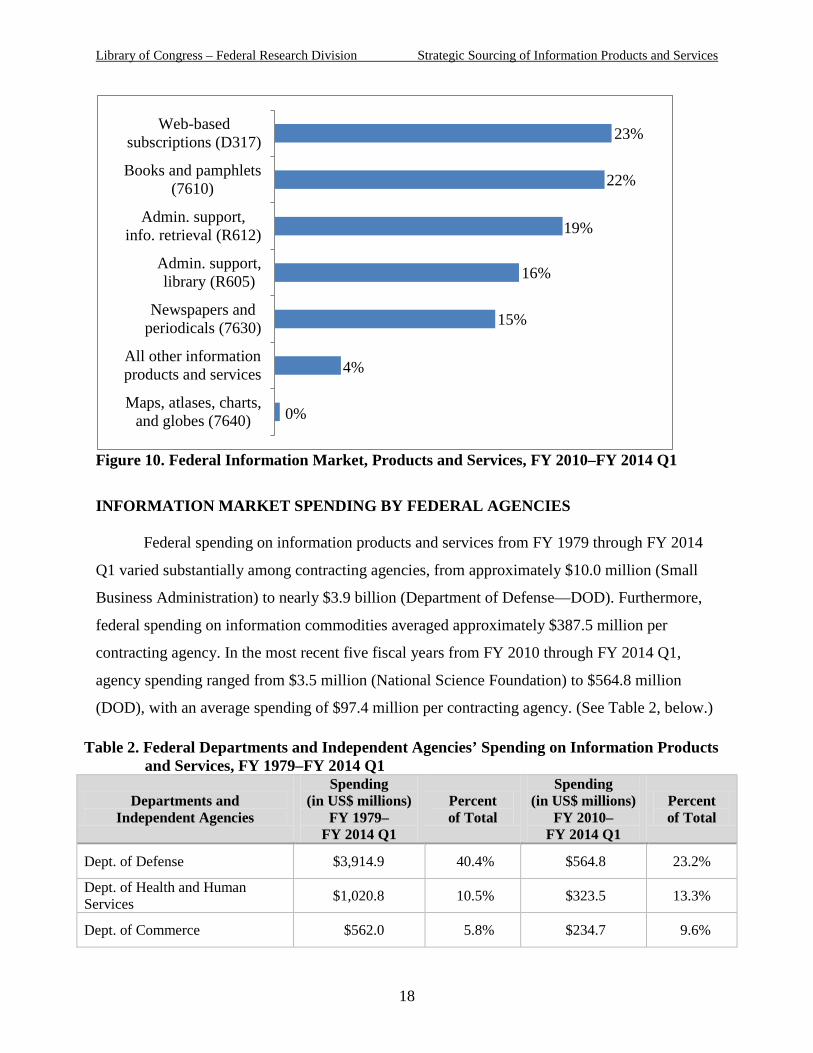
Figure 10. Federal Information Market, Products and Services, FY 2010–FY 2014 Q1
INFORMATION MARKET SPENDING BY FEDERAL AGENCIES
Federal spending on information products and services from FY 1979 through FY 2014
Q1 varied substantially among contracting agencies, from approximately $10.0 million (Small
Business Administration) to nearly $3.9 billion (Department of Defense—DOD). Furthermore,
federal spending on information commodities averaged approximately $387.5 million per
contracting agency. In the most recent five fiscal years from FY 2010 through FY 2014 Q1,
agency spending ranged from $3.5 million (National Science Foundation) to $564.8 million
(DOD), with an average spending of $97.4 million per contracting agency. (See Table 2, below.)
Table 2. Federal Departments and Independent Agencies’ Spending on Information Products and Services, FY 1979–FY 2014 Q1
Departments and Independent Agencies
Spending (in US$ millions)
FY 1979– FY 2014 Q1
Percent of Total
Spending (in US$ millions)
FY 2010– FY 2014 Q1
Percent of Total
Dept. of Defense $3,914.9 40.4% $564.8 23.2%
Dept. of Health and Human Services $1,020.8 10.5% $323.5 13.3%
Dept. of Commerce $562.0 5.8% $234.7 9.6%
0%
4%
15%
16%
19%
22%
23%
Maps, atlases, charts,and globes (7640)
All other informationproducts and services
Newspapers andperiodicals (7630)
Admin. support,library (R605)
Admin. support,info. retrieval (R612)
Books and pamphlets(7610)
Web-basedsubscriptions (D317)
18
Library of Congress – Federal Research Division Strategic Sourcing of Information Products and Services
Table 2. Federal Departments and Independent Agencies’ Spending on Information Products and Services, FY 1979–FY 2014 Q1
Departments and Independent Agencies
Spending (in US$ millions)
FY 1979– FY 2014 Q1
Percent of Total
Spending (in US$ millions)
FY 2010– FY 2014 Q1
Percent of Total
Dept. of Justice $533.7 5.5% $189.3 7.8%
Dept. of the Treasury $486.2 5.0% $152.2 6.2%
Dept. of Veterans Affairs $400.5 4.1% $167.3 6.9%
Environmental Protection Agency $391.2 4.0% $88.5 3.6%
General Services Administration $371.1 3.8% $37.2 1.5%
All Other Agencies $361.0 3.7% $129.4 5.3%
Dept. of Homeland Security $240.9 2.5% $142.4 5.8%
Social Security Administration $227.6 2.3% $84.8 3.5%
Dept. of the Interior $198.3 2.0% $59.9 2.5%
Dept. of State $156.9 1.6% $74.8 3.1%
Dept. of Transportation $146.2 1.5% $18.4 0.8%
Dept. of Agriculture $134.8 1.4% $34.1 1.4%
National Aeronautics and Space Administration $131.6 1.4% $22.3 0.9%
Dept. of Energy $98.6 1.0% $19.6 0.8%
Dept. of Education $83.9 0.9% $39.6 1.6%
United States Agency for International Development $70.7 0.7% $6.8 0.3%
Dept. of Labor $51.9 0.5% $13.5 0.6%
Dept. of Housing and Urban Development $45.2 0.5% $10.1 0.4%
Nuclear Regulatory Commission $24.2 0.2% $8.6 0.4%
Office of Personnel Management $14.7 0.2% $6.2 0.3%
National Science Foundation $10.6 0.1% $3.5 0.1%
19
Library of Congress – Federal Research Division Strategic Sourcing of Information Products and Services
Table 2. Federal Departments and Independent Agencies’ Spending on Information Products and Services, FY 1979–FY 2014 Q1
Departments and Independent Agencies
Spending (in US$ millions)
FY 1979– FY 2014 Q1
Percent of Total
Spending (in US$ millions)
FY 2010– FY 2014 Q1
Percent of Total
Small Business Administration $10.0 0.1% $4.4 0.2%
Total $9,687.6 100% $2,436.1 100%
Average $387.5 $97.4
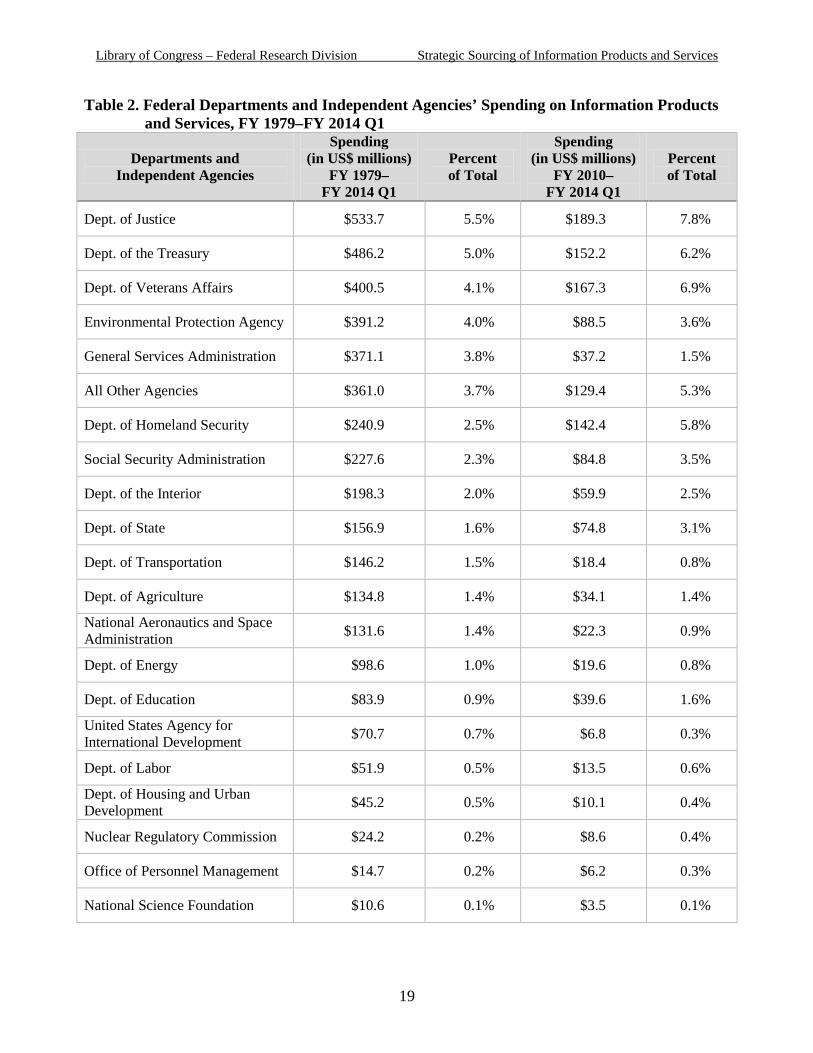
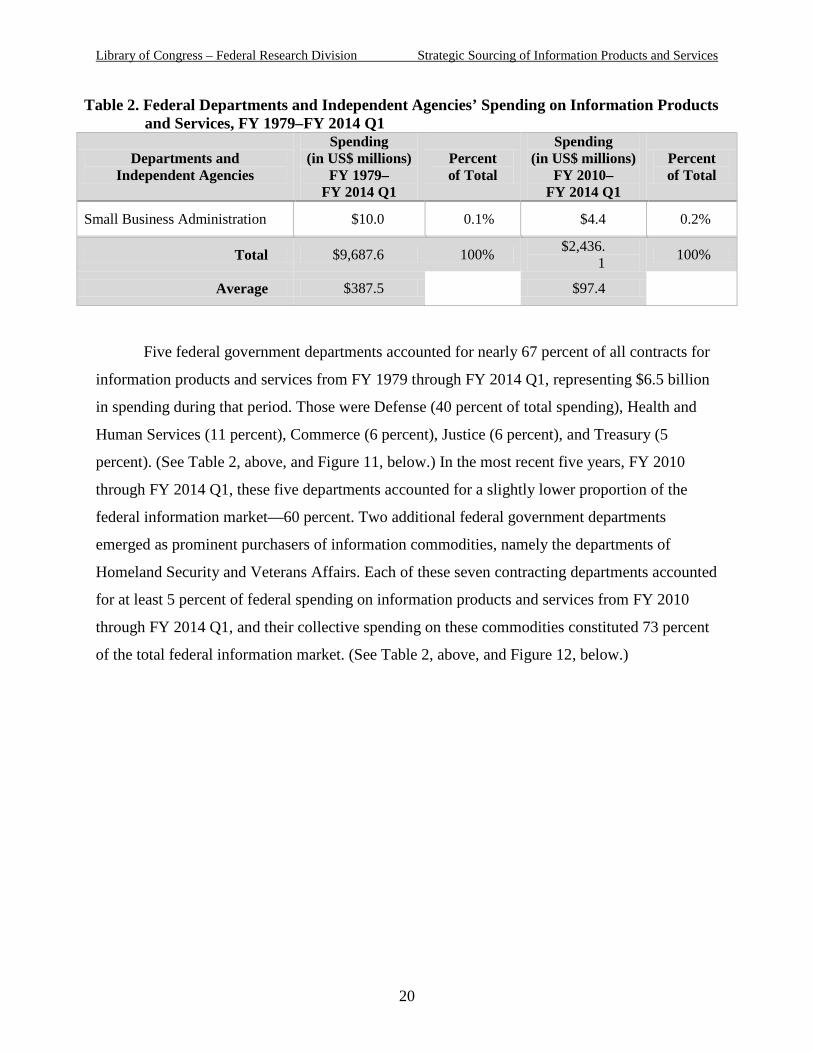
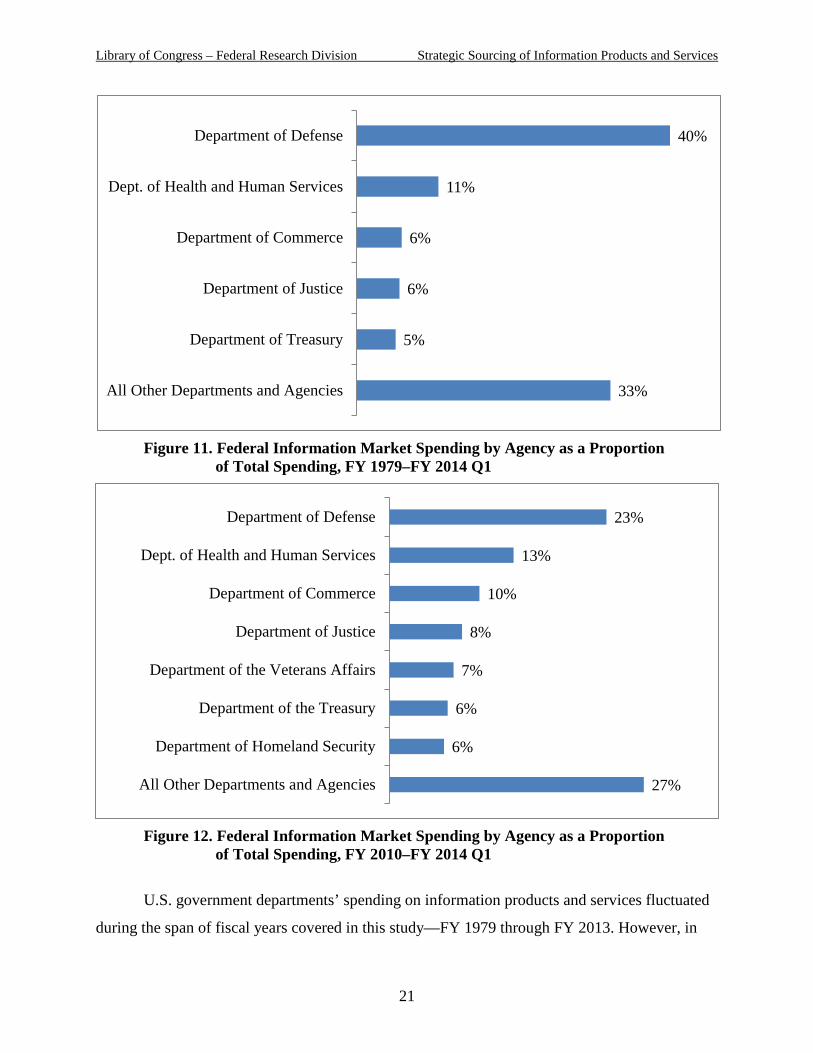
Five federal government departments accounted for nearly 67 percent of all contracts for
information products and services from FY 1979 through FY 2014 Q1, representing $6.5 billion
in spending during that period. Those were Defense (40 percent of total spending), Health and
Human Services (11 percent), Commerce (6 percent), Justice (6 percent), and Treasury (5
percent). (See Table 2, above, and Figure 11, below.) In the most recent five years, FY 2010
through FY 2014 Q1, these five departments accounted for a slightly lower proportion of the
federal information market—60 percent. Two additional federal government departments
emerged as prominent purchasers of information commodities, namely the departments of
Homeland Security and Veterans Affairs. Each of these seven contracting departments accounted
for at least 5 percent of federal spending on information products and services from FY 2010
through FY 2014 Q1, and their collective spending on these commodities constituted 73 percent
of the total federal information market. (See Table 2, above, and Figure 12, below.)
20
Library of Congress – Federal Research Division Strategic Sourcing of Information Products and Services
Figure 11. Federal Information Market Spending by Agency as a Proportion
of Total Spending, FY 1979–FY 2014 Q1
Figure 12. Federal Information Market Spending by Agency as a Proportion
of Total Spending, FY 2010–FY 2014 Q1
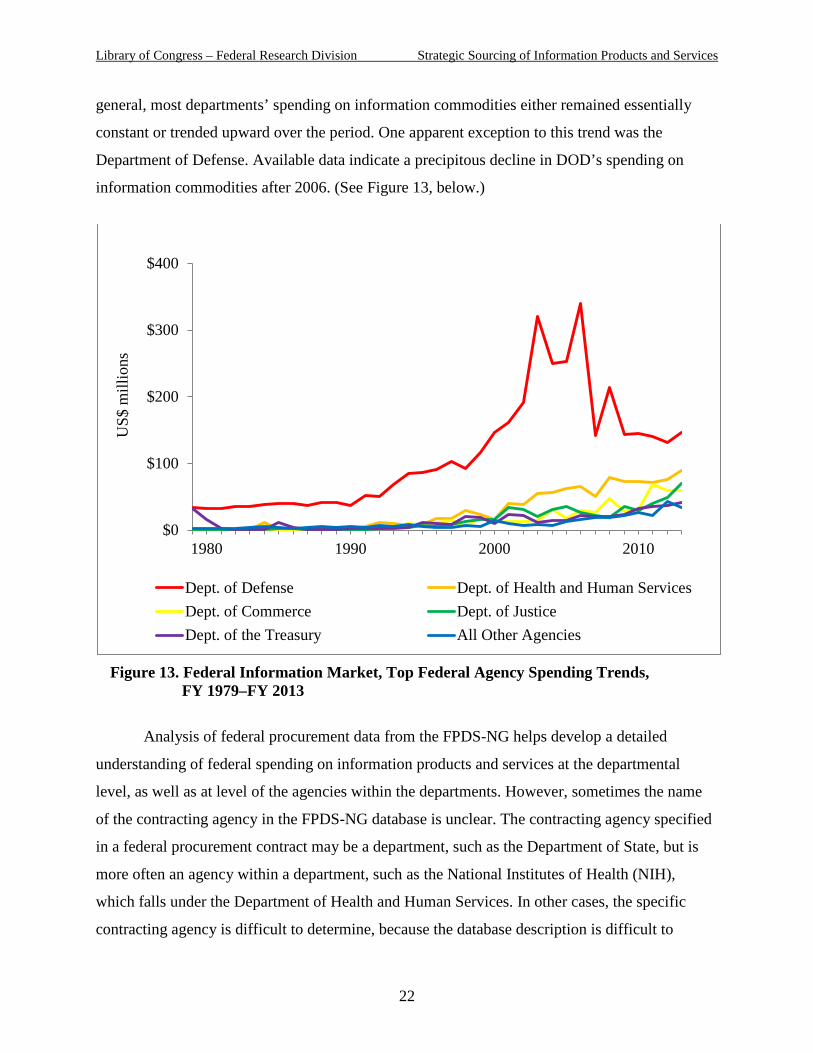
U.S. government departments’ spending on information products and services fluctuated
during the span of fiscal years covered in this study—FY 1979 through FY 2013. However, in
33%
5%
6%
6%
11%
40%
All Other Departments and Agencies
Department of Treasury
Department of Justice
Department of Commerce
Dept. of Health and Human Services
Department of Defense
27%
6%
6%
7%
8%
10%
13%
23%
All Other Departments and Agencies
Department of Homeland Security
Department of the Treasury
Department of the Veterans Affairs
Department of Justice
Department of Commerce
Dept. of Health and Human Services
Department of Defense
21
Library of Congress – Federal Research Division Strategic Sourcing of Information Products and Services
general, most departments’ spending on information commodities either remained essentially
constant or trended upward over the period. One apparent exception to this trend was the
Department of Defense. Available data indicate a precipitous decline in DOD’s spending on
information commodities after 2006. (See Figure 13, below.)
Figure 13. Federal Information Market, Top Federal Agency Spending Trends,
FY 1979–FY 2013
Analysis of federal procurement data from the FPDS-NG helps develop a detailed
understanding of federal spending on information products and services at the departmental
level, as well as at level of the agencies within the departments. However, sometimes the name
of the contracting agency in the FPDS-NG database is unclear. The contracting agency specified
in a federal procurement contract may be a department, such as the Department of State, but is
more often an agency within a department, such as the National Institutes of Health (NIH),
which falls under the Department of Health and Human Services. In other cases, the specific
contracting agency is difficult to determine, because the database description is difficult to
$0
$100
$200
$300
$400
1980 1990 2000 2010
US$
mill
ions
Dept. of Defense Dept. of Health and Human ServicesDept. of Commerce Dept. of JusticeDept. of the Treasury All Other Agencies
22
Library of Congress – Federal Research Division Strategic Sourcing of Information Products and Services
interpret—for example, the designation “Department of Defense Educational Activity” refers
neither to a department nor to an agency but to a departmental activity.
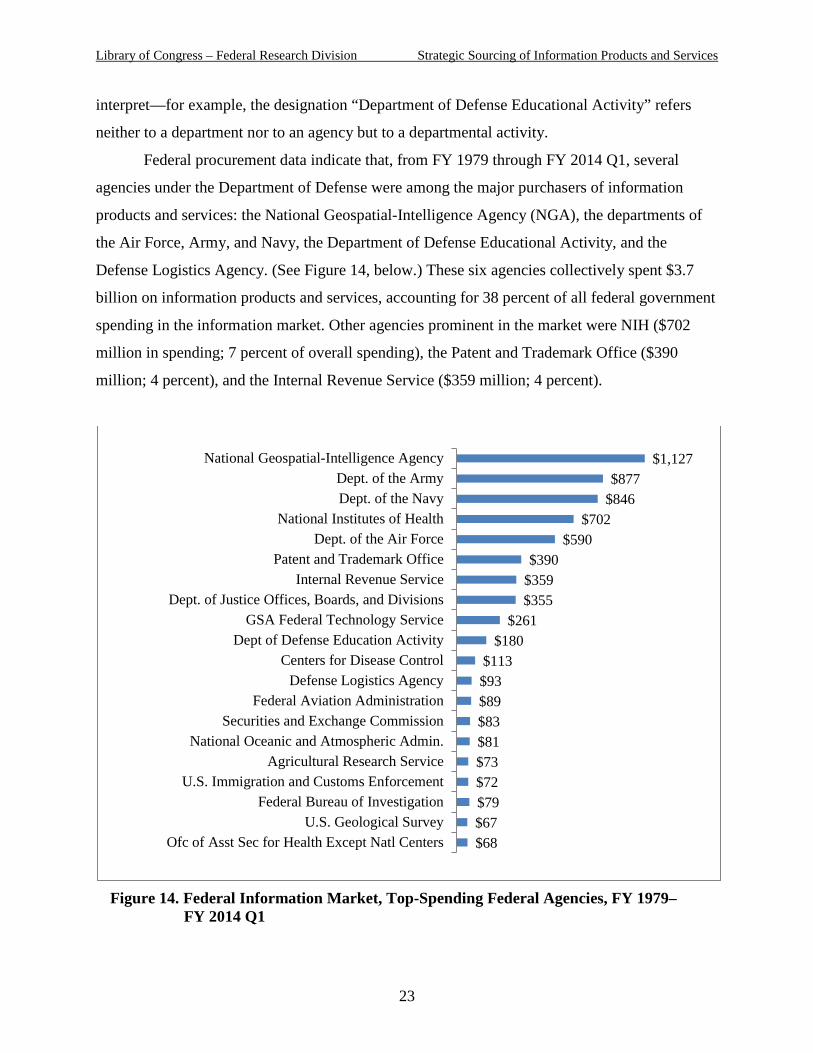
Federal procurement data indicate that, from FY 1979 through FY 2014 Q1, several
agencies under the Department of Defense were among the major purchasers of information
products and services: the National Geospatial-Intelligence Agency (NGA), the departments of
the Air Force, Army, and Navy, the Department of Defense Educational Activity, and the
Defense Logistics Agency. (See Figure 14, below.) These six agencies collectively spent $3.7
billion on information products and services, accounting for 38 percent of all federal government
spending in the information market. Other agencies prominent in the market were NIH ($702
million in spending; 7 percent of overall spending), the Patent and Trademark Office ($390
million; 4 percent), and the Internal Revenue Service ($359 million; 4 percent).
Figure 14. Federal Information Market, Top-Spending Federal Agencies, FY 1979–
FY 2014 Q1
$68 $67 $79 $72 $73 $81 $83 $89 $93 $113
$180 $261
$355 $359 $390
$590 $702
$846 $877
$1,127
Ofc of Asst Sec for Health Except Natl CentersU.S. Geological Survey
Federal Bureau of InvestigationU.S. Immigration and Customs Enforcement
Agricultural Research ServiceNational Oceanic and Atmospheric Admin.
Securities and Exchange CommissionFederal Aviation Administration
Defense Logistics AgencyCenters for Disease Control
Dept of Defense Education ActivityGSA Federal Technology Service
Dept. of Justice Offices, Boards, and DivisionsInternal Revenue Service
Patent and Trademark OfficeDept. of the Air Force
National Institutes of HealthDept. of the NavyDept. of the Army
National Geospatial-Intelligence Agency
23
Library of Congress – Federal Research Division Strategic Sourcing of Information Products and Services
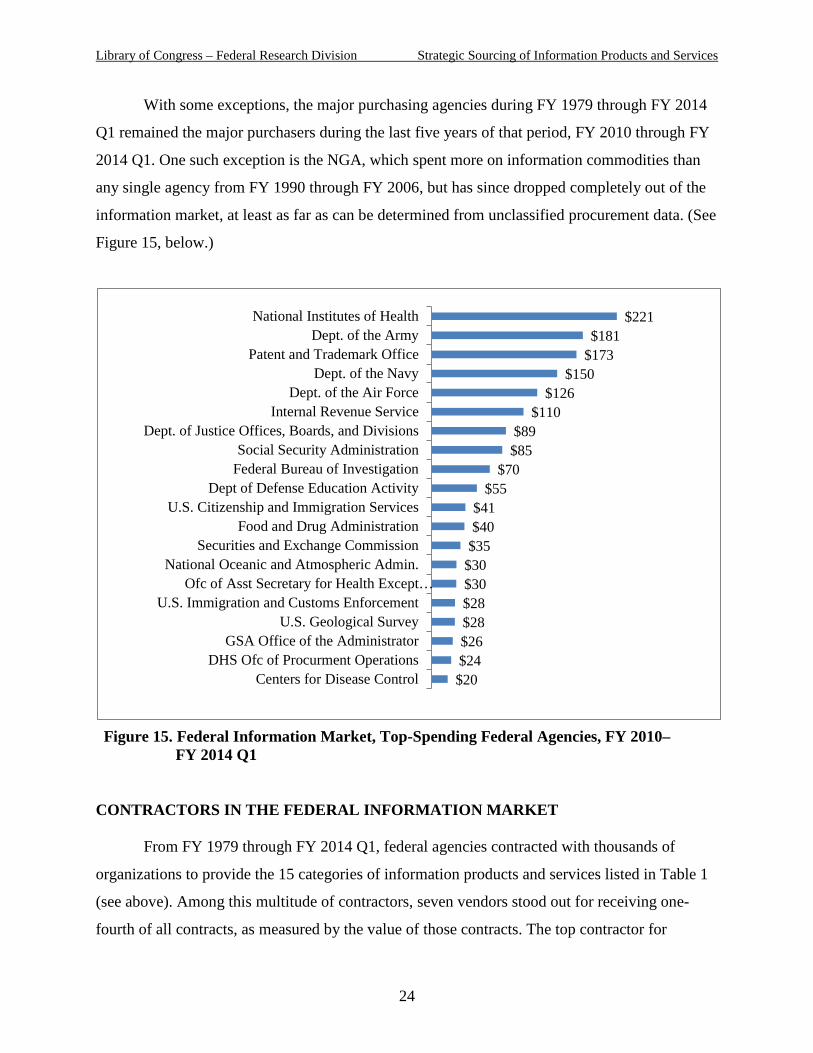
With some exceptions, the major purchasing agencies during FY 1979 through FY 2014
Q1 remained the major purchasers during the last five years of that period, FY 2010 through FY
2014 Q1. One such exception is the NGA, which spent more on information commodities than
any single agency from FY 1990 through FY 2006, but has since dropped completely out of the
information market, at least as far as can be determined from unclassified procurement data. (See
Figure 15, below.)
Figure 15. Federal Information Market, Top-Spending Federal Agencies, FY 2010–
FY 2014 Q1
CONTRACTORS IN THE FEDERAL INFORMATION MARKET
From FY 1979 through FY 2014 Q1, federal agencies contracted with thousands of
organizations to provide the 15 categories of information products and services listed in Table 1
(see above). Among this multitude of contractors, seven vendors stood out for receiving one-
fourth of all contracts, as measured by the value of those contracts. The top contractor for
$20 $24 $26 $28 $28 $30 $30 $35 $40 $41
$55 $70
$85 $89
$110 $126
$150 $173 $181
$221
Centers for Disease ControlDHS Ofc of Procurment Operations
GSA Office of the AdministratorU.S. Geological Survey
U.S. Immigration and Customs EnforcementOfc of Asst Secretary for Health Except…
National Oceanic and Atmospheric Admin.Securities and Exchange Commission
Food and Drug AdministrationU.S. Citizenship and Immigration Services
Dept of Defense Education ActivityFederal Bureau of InvestigationSocial Security Administration
Dept. of Justice Offices, Boards, and DivisionsInternal Revenue Service
Dept. of the Air ForceDept. of the Navy
Patent and Trademark OfficeDept. of the Army
National Institutes of Health
24
Library of Congress – Federal Research Division Strategic Sourcing of Information Products and Services
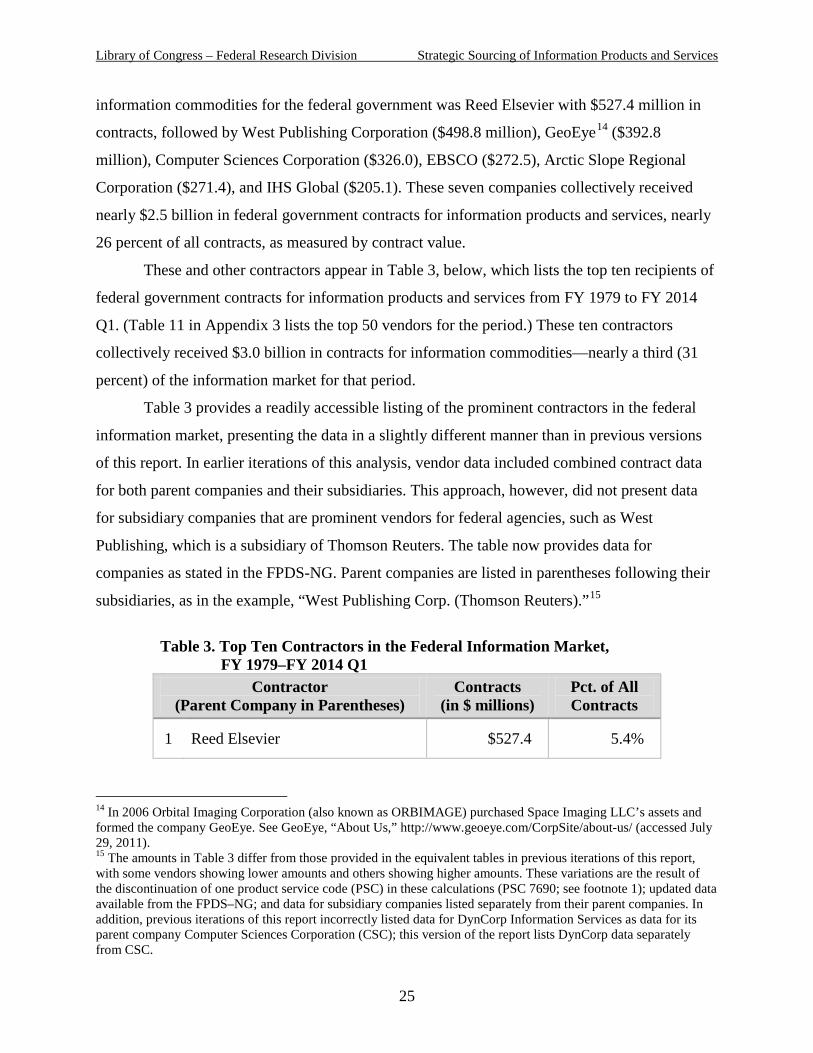
information commodities for the federal government was Reed Elsevier with $527.4 million in
contracts, followed by West Publishing Corporation ($498.8 million), GeoEye14 ($392.8
million), Computer Sciences Corporation ($326.0), EBSCO ($272.5), Arctic Slope Regional
Corporation ($271.4), and IHS Global ($205.1). These seven companies collectively received
nearly $2.5 billion in federal government contracts for information products and services, nearly
26 percent of all contracts, as measured by contract value.
These and other contractors appear in Table 3, below, which lists the top ten recipients of
federal government contracts for information products and services from FY 1979 to FY 2014
Q1. (Table 11 in Appendix 3 lists the top 50 vendors for the period.) These ten contractors
collectively received $3.0 billion in contracts for information commodities—nearly a third (31
percent) of the information market for that period.
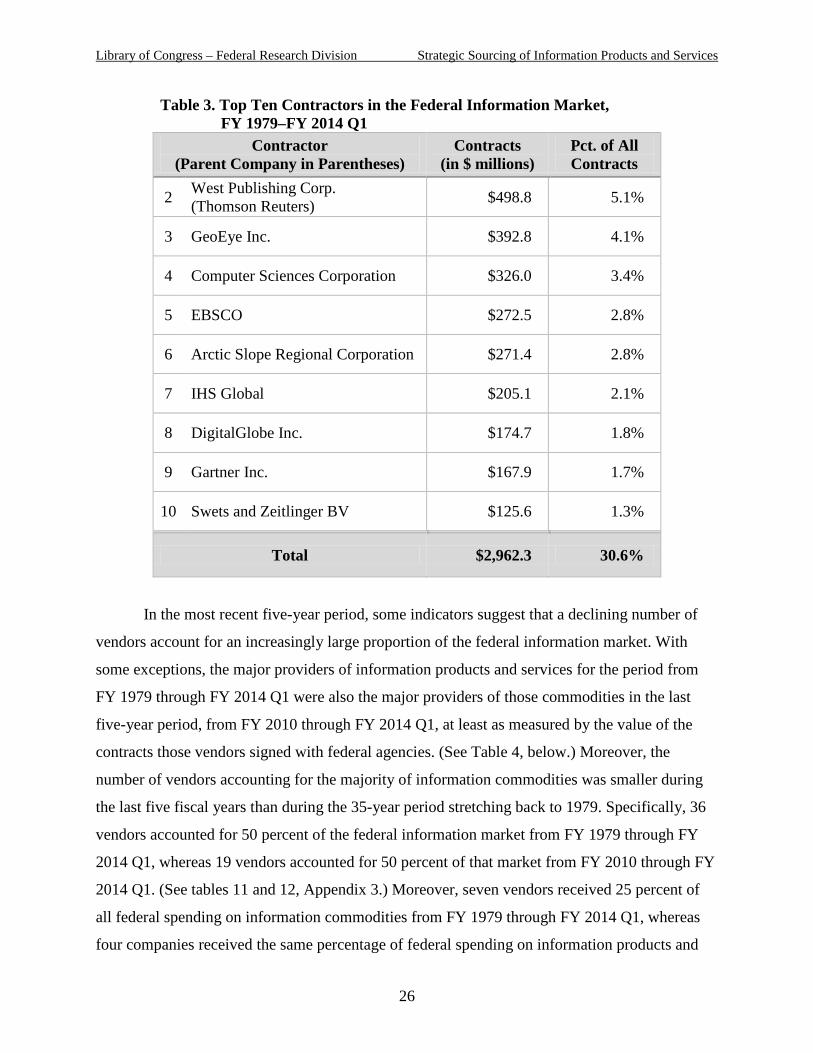
Table 3 provides a readily accessible listing of the prominent contractors in the federal
information market, presenting the data in a slightly different manner than in previous versions
of this report. In earlier iterations of this analysis, vendor data included combined contract data
for both parent companies and their subsidiaries. This approach, however, did not present data
for subsidiary companies that are prominent vendors for federal agencies, such as West
Publishing, which is a subsidiary of Thomson Reuters. The table now provides data for
companies as stated in the FPDS-NG. Parent companies are listed in parentheses following their
subsidiaries, as in the example, “West Publishing Corp. (Thomson Reuters).”15
Table 3. Top Ten Contractors in the Federal Information Market,
FY 1979–FY 2014 Q1 Contractor
(Parent Company in Parentheses) Contracts
(in $ millions) Pct. of All Contracts
1 Reed Elsevier $527.4 5.4%
14 In 2006 Orbital Imaging Corporation (also known as ORBIMAGE) purchased Space Imaging LLC’s assets and formed the company GeoEye. See GeoEye, “About Us,” http://www.geoeye.com/CorpSite/about-us/ (accessed July 29, 2011). 15 The amounts in Table 3 differ from those provided in the equivalent tables in previous iterations of this report, with some vendors showing lower amounts and others showing higher amounts. These variations are the result of the discontinuation of one product service code (PSC) in these calculations (PSC 7690; see footnote 1); updated data available from the FPDS–NG; and data for subsidiary companies listed separately from their parent companies. In addition, previous iterations of this report incorrectly listed data for DynCorp Information Services as data for its parent company Computer Sciences Corporation (CSC); this version of the report lists DynCorp data separately from CSC.
25
Library of Congress – Federal Research Division Strategic Sourcing of Information Products and Services
Table 3. Top Ten Contractors in the Federal Information Market, FY 1979–FY 2014 Q1
Contractor (Parent Company in Parentheses)
Contracts (in $ millions)
Pct. of All Contracts
2 West Publishing Corp. (Thomson Reuters) $498.8 5.1%
3 GeoEye Inc. $392.8 4.1%
4 Computer Sciences Corporation $326.0 3.4%
5 EBSCO $272.5 2.8%
6 Arctic Slope Regional Corporation $271.4 2.8%
7 IHS Global $205.1 2.1%
8 DigitalGlobe Inc. $174.7 1.8%
9 Gartner Inc. $167.9 1.7%
10 Swets and Zeitlinger BV $125.6 1.3%
Total $2,962.3 30.6%
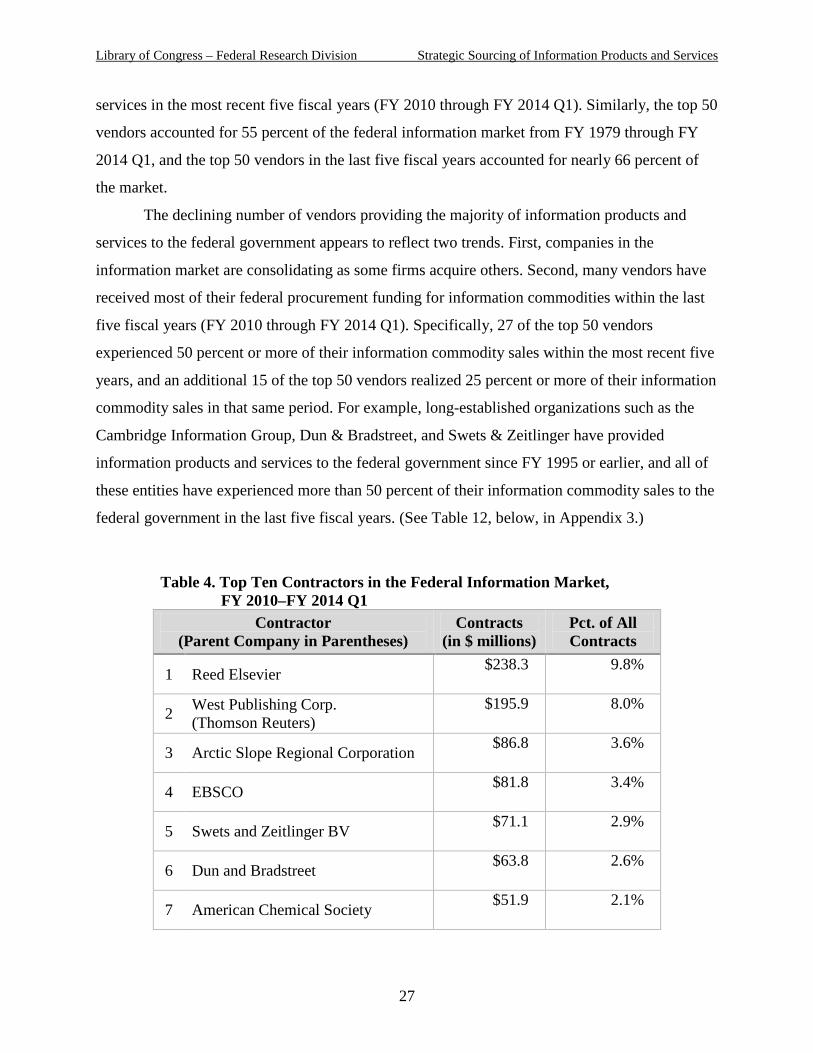
In the most recent five-year period, some indicators suggest that a declining number of
vendors account for an increasingly large proportion of the federal information market. With
some exceptions, the major providers of information products and services for the period from
FY 1979 through FY 2014 Q1 were also the major providers of those commodities in the last
five-year period, from FY 2010 through FY 2014 Q1, at least as measured by the value of the
contracts those vendors signed with federal agencies. (See Table 4, below.) Moreover, the
number of vendors accounting for the majority of information commodities was smaller during
the last five fiscal years than during the 35-year period stretching back to 1979. Specifically, 36
vendors accounted for 50 percent of the federal information market from FY 1979 through FY
2014 Q1, whereas 19 vendors accounted for 50 percent of that market from FY 2010 through FY
2014 Q1. (See tables 11 and 12, Appendix 3.) Moreover, seven vendors received 25 percent of
all federal spending on information commodities from FY 1979 through FY 2014 Q1, whereas
four companies received the same percentage of federal spending on information products and
26
Library of Congress – Federal Research Division Strategic Sourcing of Information Products and Services
services in the most recent five fiscal years (FY 2010 through FY 2014 Q1). Similarly, the top 50
vendors accounted for 55 percent of the federal information market from FY 1979 through FY
2014 Q1, and the top 50 vendors in the last five fiscal years accounted for nearly 66 percent of
the market.
The declining number of vendors providing the majority of information products and
services to the federal government appears to reflect two trends. First, companies in the
information market are consolidating as some firms acquire others. Second, many vendors have
received most of their federal procurement funding for information commodities within the last
five fiscal years (FY 2010 through FY 2014 Q1). Specifically, 27 of the top 50 vendors
experienced 50 percent or more of their information commodity sales within the most recent five
years, and an additional 15 of the top 50 vendors realized 25 percent or more of their information
commodity sales in that same period. For example, long-established organizations such as the
Cambridge Information Group, Dun & Bradstreet, and Swets & Zeitlinger have provided
information products and services to the federal government since FY 1995 or earlier, and all of
these entities have experienced more than 50 percent of their information commodity sales to the
federal government in the last five fiscal years. (See Table 12, below, in Appendix 3.)
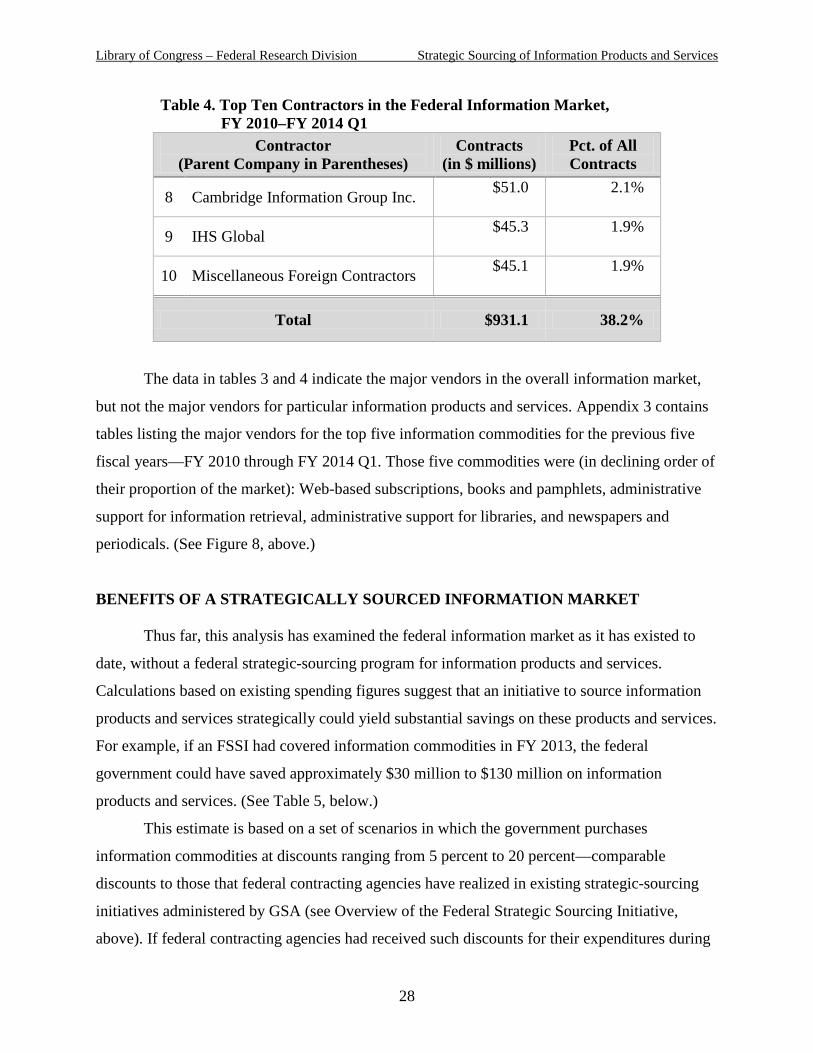
Table 4. Top Ten Contractors in the Federal Information Market, FY 2010–FY 2014 Q1
Contractor (Parent Company in Parentheses)
Contracts (in $ millions)
Pct. of All Contracts
1 Reed Elsevier $238.3 9.8%
2 West Publishing Corp. (Thomson Reuters)
$195.9 8.0%
3 Arctic Slope Regional Corporation $86.8 3.6%
4 EBSCO $81.8 3.4%
5 Swets and Zeitlinger BV $71.1 2.9%
6 Dun and Bradstreet $63.8 2.6%
7 American Chemical Society $51.9 2.1%
27
Library of Congress – Federal Research Division Strategic Sourcing of Information Products and Services
Table 4. Top Ten Contractors in the Federal Information Market, FY 2010–FY 2014 Q1
Contractor (Parent Company in Parentheses)
Contracts (in $ millions)
Pct. of All Contracts
8 Cambridge Information Group Inc. $51.0 2.1%
9 IHS Global $45.3 1.9%
10 Miscellaneous Foreign Contractors $45.1 1.9%
Total $931.1 38.2%
The data in tables 3 and 4 indicate the major vendors in the overall information market,
but not the major vendors for particular information products and services. Appendix 3 contains
tables listing the major vendors for the top five information commodities for the previous five
fiscal years—FY 2010 through FY 2014 Q1. Those five commodities were (in declining order of
their proportion of the market): Web-based subscriptions, books and pamphlets, administrative
support for information retrieval, administrative support for libraries, and newspapers and
periodicals. (See Figure 8, above.)
BENEFITS OF A STRATEGICALLY SOURCED INFORMATION MARKET
Thus far, this analysis has examined the federal information market as it has existed to
date, without a federal strategic-sourcing program for information products and services.
Calculations based on existing spending figures suggest that an initiative to source information
products and services strategically could yield substantial savings on these products and services.
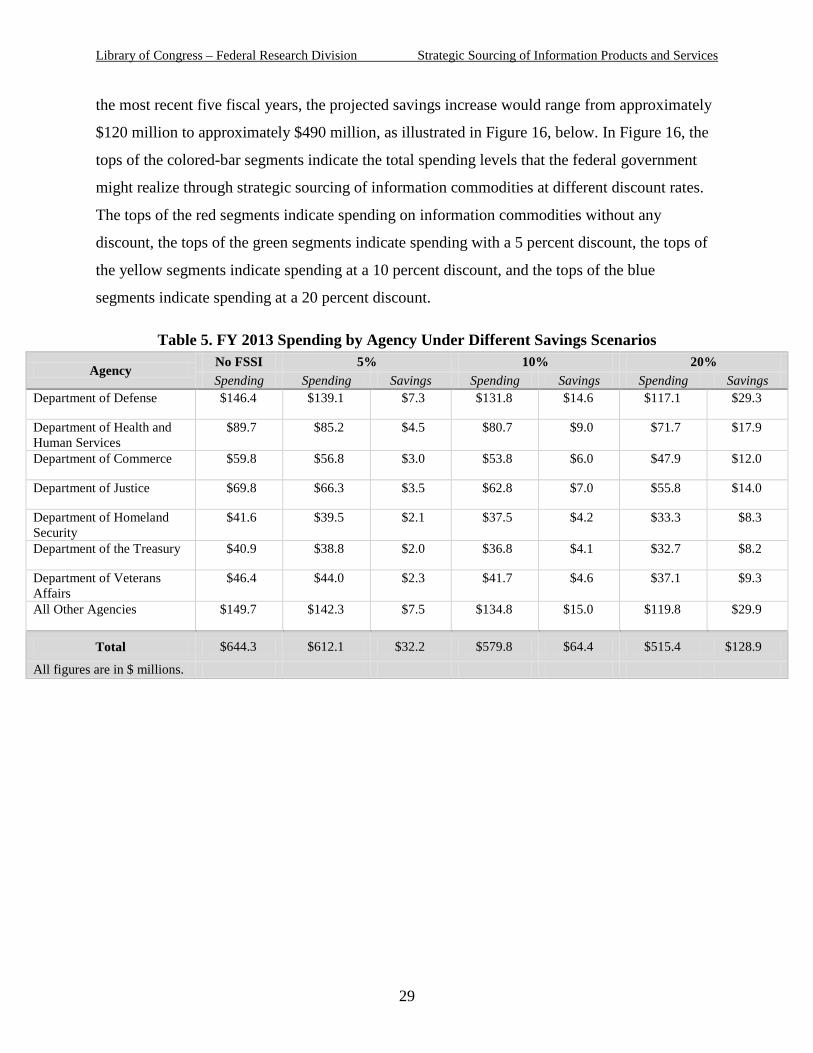
For example, if an FSSI had covered information commodities in FY 2013, the federal
government could have saved approximately $30 million to $130 million on information
products and services. (See Table 5, below.)
This estimate is based on a set of scenarios in which the government purchases
information commodities at discounts ranging from 5 percent to 20 percent—comparable
discounts to those that federal contracting agencies have realized in existing strategic-sourcing
initiatives administered by GSA (see Overview of the Federal Strategic Sourcing Initiative,
above). If federal contracting agencies had received such discounts for their expenditures during
28
Library of Congress – Federal Research Division Strategic Sourcing of Information Products and Services
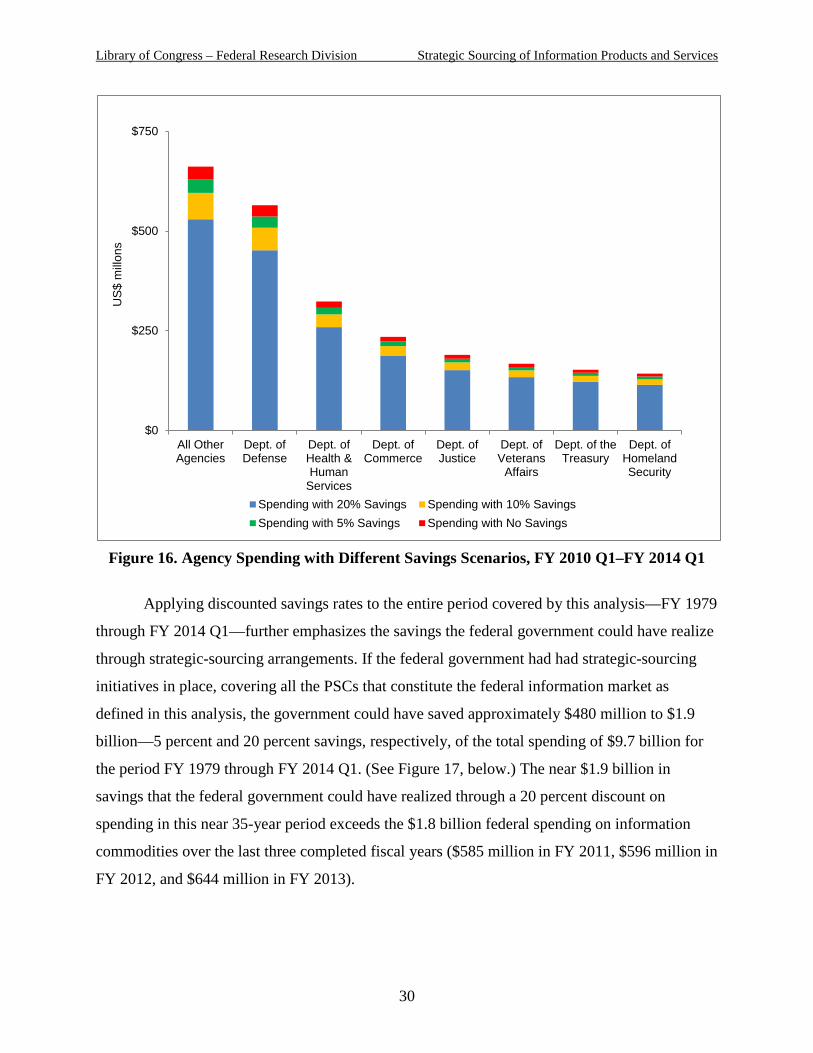
the most recent five fiscal years, the projected savings increase would range from approximately
$120 million to approximately $490 million, as illustrated in Figure 16, below. In Figure 16, the
tops of the colored-bar segments indicate the total spending levels that the federal government
might realize through strategic sourcing of information commodities at different discount rates.
The tops of the red segments indicate spending on information commodities without any
discount, the tops of the green segments indicate spending with a 5 percent discount, the tops of
the yellow segments indicate spending at a 10 percent discount, and the tops of the blue
segments indicate spending at a 20 percent discount.
Table 5. FY 2013 Spending by Agency Under Different Savings Scenarios
Agency No FSSI 5% 10% 20% Spending Spending Savings Spending Savings Spending Savings
Department of Defense $146.4 $139.1 $7.3 $131.8 $14.6 $117.1 $29.3
Department of Health and Human Services
$89.7 $85.2 $4.5 $80.7 $9.0 $71.7 $17.9
Department of Commerce $59.8 $56.8 $3.0 $53.8 $6.0 $47.9 $12.0
Department of Justice $69.8 $66.3 $3.5 $62.8 $7.0 $55.8 $14.0
Department of Homeland Security
$41.6 $39.5 $2.1 $37.5 $4.2 $33.3 $8.3
Department of the Treasury $40.9 $38.8 $2.0 $36.8 $4.1 $32.7 $8.2
Department of Veterans Affairs
$46.4 $44.0 $2.3 $41.7 $4.6 $37.1 $9.3
All Other Agencies $149.7 $142.3 $7.5 $134.8 $15.0 $119.8 $29.9
Total $644.3 $612.1 $32.2 $579.8 $64.4 $515.4 $128.9
All figures are in $ millions.
29
Library of Congress – Federal Research Division Strategic Sourcing of Information Products and Services
Figure 16. Agency Spending with Different Savings Scenarios, FY 2010 Q1–FY 2014 Q1
Applying discounted savings rates to the entire period covered by this analysis—FY 1979
through FY 2014 Q1—further emphasizes the savings the federal government could have realize
through strategic-sourcing arrangements. If the federal government had had strategic-sourcing
initiatives in place, covering all the PSCs that constitute the federal information market as
defined in this analysis, the government could have saved approximately $480 million to $1.9
billion—5 percent and 20 percent savings, respectively, of the total spending of $9.7 billion for
the period FY 1979 through FY 2014 Q1. (See Figure 17, below.) The near $1.9 billion in
savings that the federal government could have realized through a 20 percent discount on
spending in this near 35-year period exceeds the $1.8 billion federal spending on information
commodities over the last three completed fiscal years ($585 million in FY 2011, $596 million in
FY 2012, and $644 million in FY 2013).
$0
$250
$500
$750
All OtherAgencies
Dept. ofDefense
Dept. ofHealth &Human
Services
Dept. ofCommerce
Dept. ofJustice
Dept. ofVeterans
Affairs
Dept. of theTreasury
Dept. ofHomelandSecurity
US
$ m
illon
s
Spending with 20% Savings Spending with 10% SavingsSpending with 5% Savings Spending with No Savings
30
Library of Congress – Federal Research Division Strategic Sourcing of Information Products and Services
Figure 17. Federal Spending Using Different Savings Scenarios, FY 1979–FY 2014 Q1
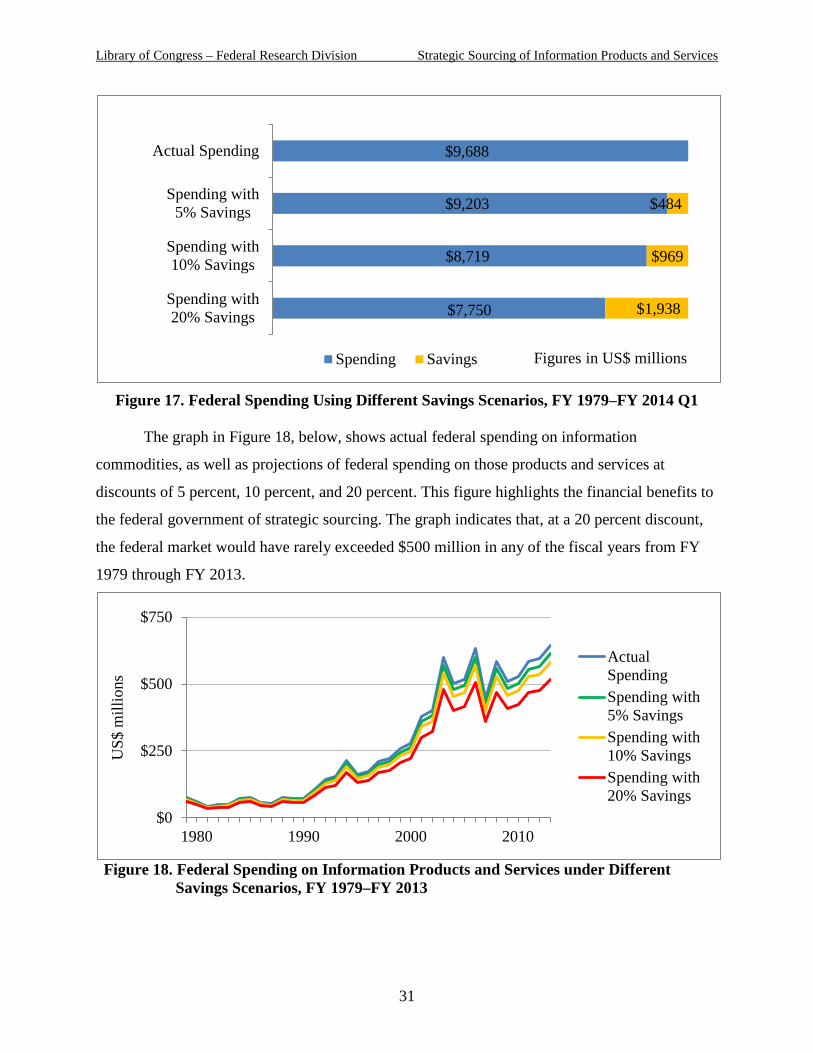
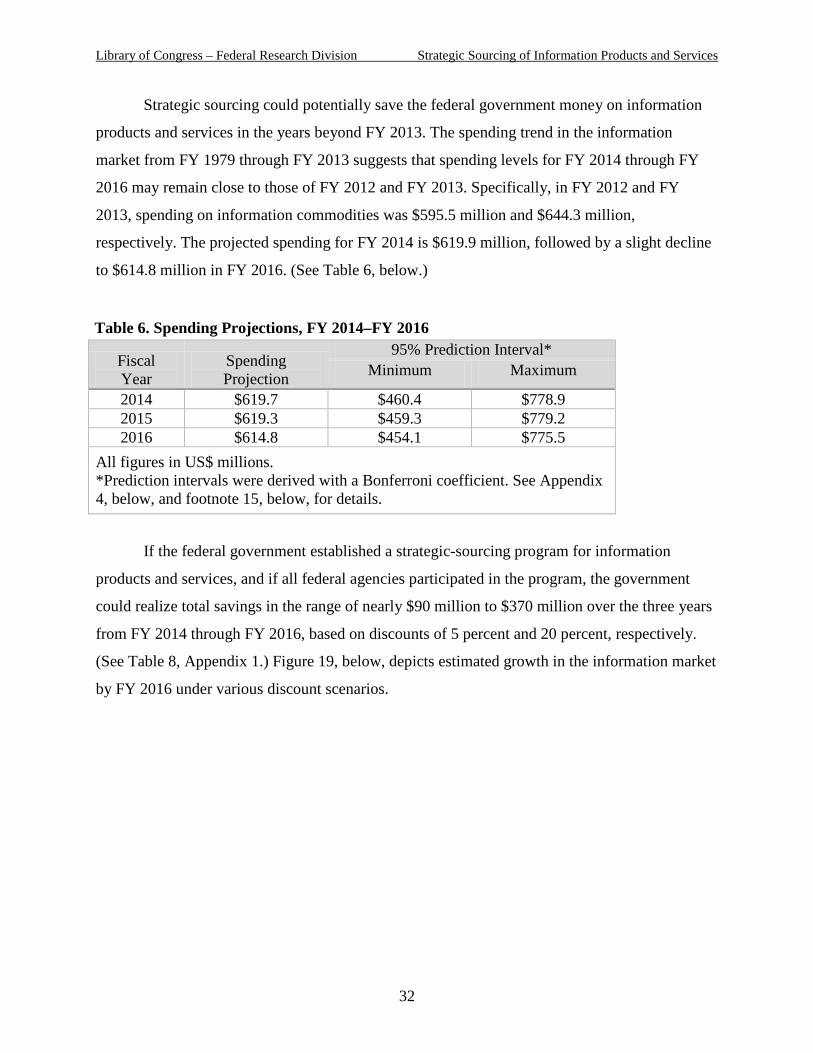
The graph in Figure 18, below, shows actual federal spending on information
commodities, as well as projections of federal spending on those products and services at
discounts of 5 percent, 10 percent, and 20 percent. This figure highlights the financial benefits to
the federal government of strategic sourcing. The graph indicates that, at a 20 percent discount,
the federal market would have rarely exceeded $500 million in any of the fiscal years from FY
1979 through FY 2013.
Figure 18. Federal Spending on Information Products and Services under Different
Savings Scenarios, FY 1979–FY 2013
$7,750
$8,719
$9,203
$9,688
$1,938
$969
$484
Spending with20% Savings
Spending with10% Savings
Spending with5% Savings
Actual Spending
Figures in US$ millions Spending Savings
$0
$250
$500
$750
1980 1990 2000 2010
US$
mill
ions
ActualSpendingSpending with5% SavingsSpending with10% SavingsSpending with20% Savings
31
Library of Congress – Federal Research Division Strategic Sourcing of Information Products and Services
Strategic sourcing could potentially save the federal government money on information
products and services in the years beyond FY 2013. The spending trend in the information
market from FY 1979 through FY 2013 suggests that spending levels for FY 2014 through FY
2016 may remain close to those of FY 2012 and FY 2013. Specifically, in FY 2012 and FY
2013, spending on information commodities was $595.5 million and $644.3 million,
respectively. The projected spending for FY 2014 is $619.9 million, followed by a slight decline
to $614.8 million in FY 2016. (See Table 6, below.)
Table 6. Spending Projections, FY 2014–FY 2016
Fiscal Year
Spending Projection
95% Prediction Interval* Minimum Maximum
2014 $619.7 $460.4 $778.9 2015 $619.3 $459.3 $779.2 2016 $614.8 $454.1 $775.5
All figures in US$ millions. *Prediction intervals were derived with a Bonferroni coefficient. See Appendix 4, below, and footnote 15, below, for details.
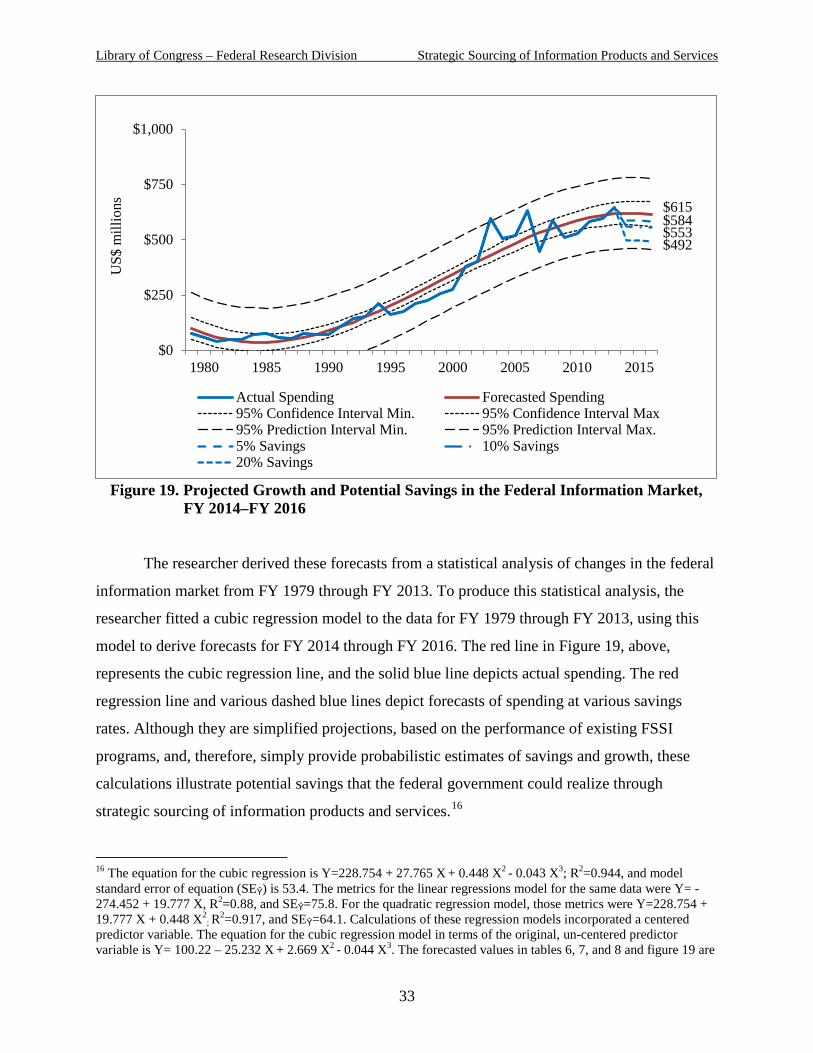
If the federal government established a strategic-sourcing program for information
products and services, and if all federal agencies participated in the program, the government
could realize total savings in the range of nearly $90 million to $370 million over the three years
from FY 2014 through FY 2016, based on discounts of 5 percent and 20 percent, respectively.
(See Table 8, Appendix 1.) Figure 19, below, depicts estimated growth in the information market
by FY 2016 under various discount scenarios.
32
Library of Congress – Federal Research Division Strategic Sourcing of Information Products and Services
Figure 19. Projected Growth and Potential Savings in the Federal Information Market,
FY 2014–FY 2016
The researcher derived these forecasts from a statistical analysis of changes in the federal
information market from FY 1979 through FY 2013. To produce this statistical analysis, the
researcher fitted a cubic regression model to the data for FY 1979 through FY 2013, using this
model to derive forecasts for FY 2014 through FY 2016. The red line in Figure 19, above,
represents the cubic regression line, and the solid blue line depicts actual spending. The red
regression line and various dashed blue lines depict forecasts of spending at various savings
rates. Although they are simplified projections, based on the performance of existing FSSI
programs, and, therefore, simply provide probabilistic estimates of savings and growth, these
calculations illustrate potential savings that the federal government could realize through
strategic sourcing of information products and services.16
16 The equation for the cubic regression is Y=228.754 + 27.765 X + 0.448 X2 - 0.043 X3; R2=0.944, and model
standard error of equation (SEŶ) is 53.4. The metrics for the linear regressions model for the same data were Y= -274.452 + 19.777 X, R2=0.88, and SEŶ=75.8. For the quadratic regression model, those metrics were Y=228.754 + 19.777 X + 0.448 X2
; R2=0.917, and SEŶ=64.1. Calculations of these regression models incorporated a centered predictor variable. The equation for the cubic regression model in terms of the original, un-centered predictor variable is Y= 100.22 – 25.232 X + 2.669 X2
- 0.044 X3. The forecasted values in tables 6, 7, and 8 and figure 19 are
$615 $584 $553 $492
$0
$250
$500
$750
$1,000
1980 1985 1990 1995 2000 2005 2010 2015
US$
mill
ions
Actual Spending Forecasted Spending95% Confidence Interval Min. 95% Confidence Interval Max95% Prediction Interval Min. 95% Prediction Interval Max.5% Savings 10% Savings20% Savings
33
Library of Congress – Federal Research Division Strategic Sourcing of Information Products and Services
These projections of future growth and potential savings in the information market
assume that all federal agencies would participate in a strategic-sourcing program for
information products and services. In actuality, the number of federal agencies participating in
the six currently available FSSI programs has varied. In FY 2014 Q1, for example, six agencies
participated in the wireless-services program, and 70 agencies participated in the program for
telecommunications-expense management services.17
Recalculating the growth and savings scenarios to include variations in federal agency
participation, a richer, would permit a more detailed picture of potential savings through strategic
sourcing to emerge. However, such an exercise entails creating numerous scenarios in which
agencies do or do not participate in strategic sourcing to varying extents and at varying discount
rates, calculations that are beyond the scope of this report. To estimate the variation in the
amount of savings that the federal agencies might realize if varying proportions of agencies
participated in an information-commodity FSSI program, the researcher made additional limited
calculations of savings, based on varying proportions of spending through such an FSSI program
at varying discount rates. Specifically, the researcher calculated spending and savings on
information products and services if one-fourth, one-third, and one-half of such spending
occurred at the discount rates of 5 percent, 10 percent, and 20 percent.
These findings are detailed in Table 8 (see Appendix 1) and depicted in Figure 20, below.
According to the researcher’s calculations, total savings on federal spending on information
commodities would vary from almost $20 million, if one-fourth of such spending occurred at a 5
percent discount, to nearly $370 million, if all of this spending occurred at a 20 percent discount.
In Figure 20, the colored-bar segments indicate spending levels at different discount rates. For
example, the tops of the green segments indicate spending on information commodities at a 5
percent discount, the tops of the yellow segments indicate spending at a 10 percent discount, and
the tops of the blue segments indicate spending at a 20 percent discount. The red bar on the left
of the graph depicts spending forecasts with no discount.
derived from the latter cubic regression equation. The confidence and prediction intervals of the cubic regression incorporate a Bonferroni coefficient (B=t(1-0.05/(2x3),35-4)=t(0.9917,31)=2.818). 17 U.S. General Services Administration, “Strategic Sourcing Metrics.”
34
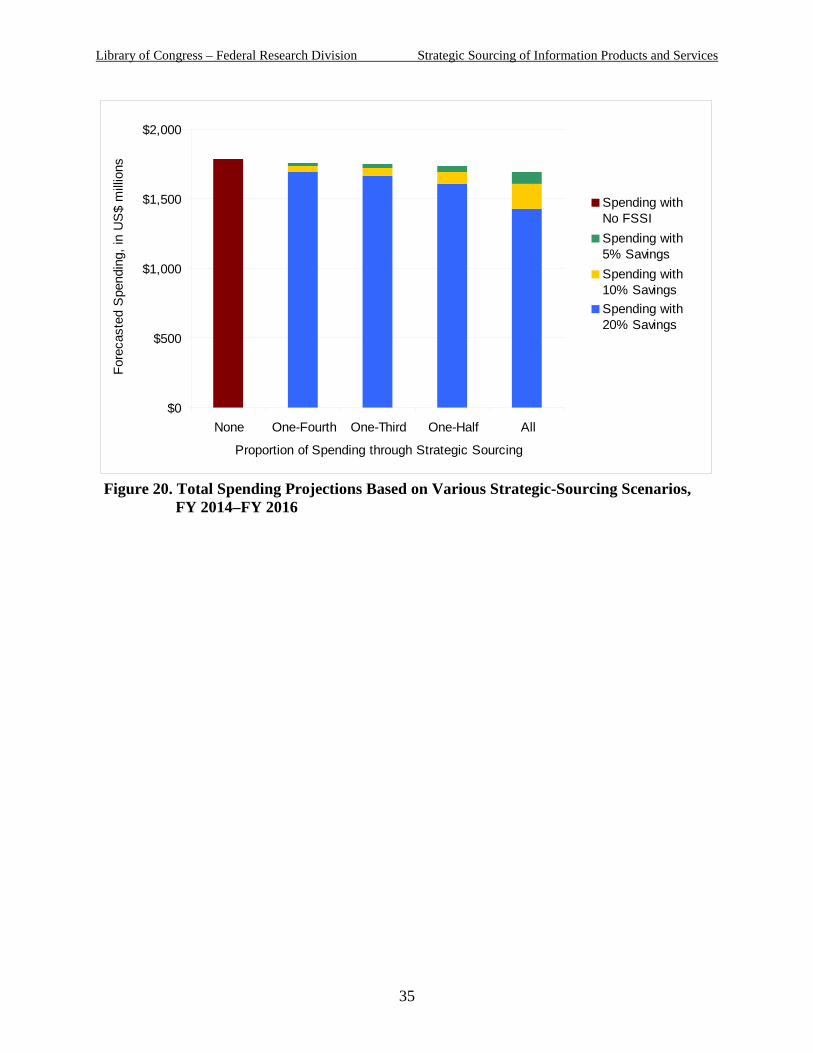
Library of Congress – Federal Research Division Strategic Sourcing of Information Products and Services
Figure 20. Total Spending Projections Based on Various Strategic-Sourcing Scenarios,
FY 2014–FY 2016
$0
$500
$1,000
$1,500
$2,000
None One-Fourth One-Third One-Half All
Proportion of Spending through Strategic Sourcing
Fore
cast
ed S
pend
ing,
in U
S$
mill
ions
Spending withNo FSSISpending with5% SavingsSpending with10% SavingsSpending with20% Savings
35
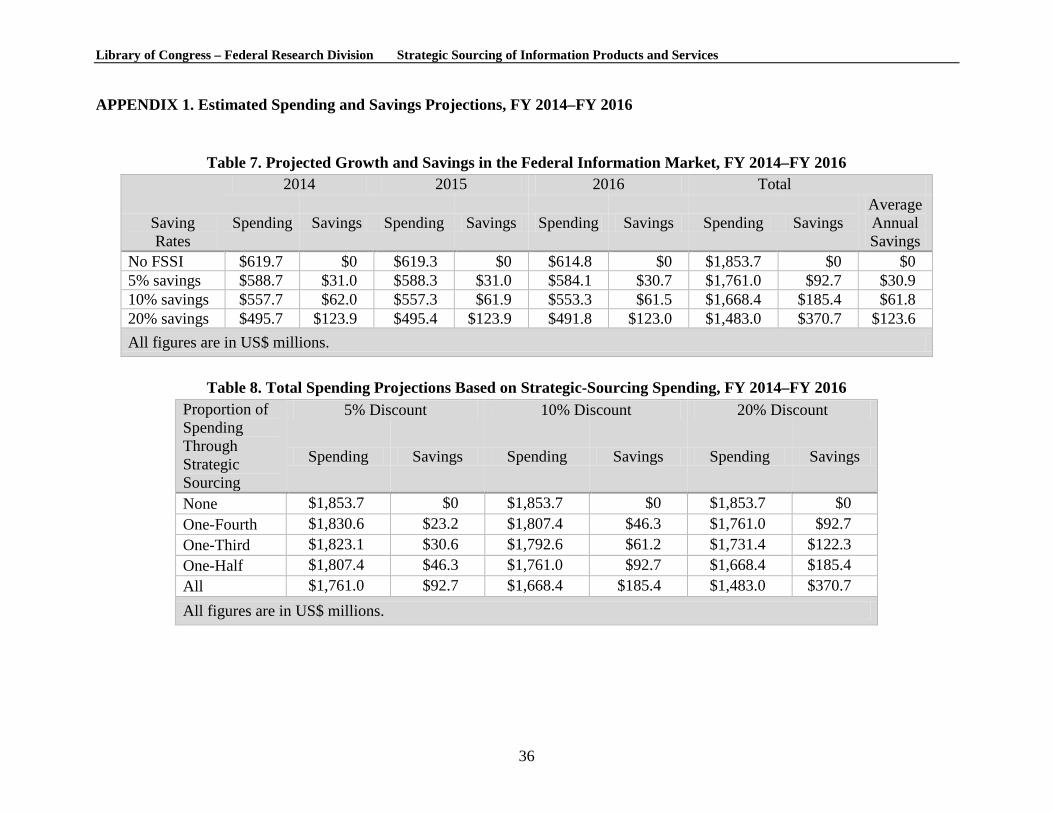
Library of Congress – Federal Research Division Strategic Sourcing of Information Products and Services APPENDIX 1. Estimated Spending and Savings Projections, FY 2014–FY 2016
Table 7. Projected Growth and Savings in the Federal Information Market, FY 2014–FY 2016
Saving Rates
2014 2015 2016 Total
Spending Savings Spending Savings Spending Savings Spending Savings Average Annual Savings
No FSSI $619.7 $0 $619.3 $0 $614.8 $0 $1,853.7 $0 $0 5% savings $588.7 $31.0 $588.3 $31.0 $584.1 $30.7 $1,761.0 $92.7 $30.9 10% savings $557.7 $62.0 $557.3 $61.9 $553.3 $61.5 $1,668.4 $185.4 $61.8 20% savings $495.7 $123.9 $495.4 $123.9 $491.8 $123.0 $1,483.0 $370.7 $123.6 All figures are in US$ millions.
Table 8. Total Spending Projections Based on Strategic-Sourcing Spending, FY 2014–FY 2016
Proportion of Spending Through Strategic Sourcing
5% Discount 10% Discount 20% Discount
Spending Savings Spending Savings Spending Savings
None $1,853.7 $0 $1,853.7 $0 $1,853.7 $0 One-Fourth $1,830.6 $23.2 $1,807.4 $46.3 $1,761.0 $92.7 One-Third $1,823.1 $30.6 $1,792.6 $61.2 $1,731.4 $122.3 One-Half $1,807.4 $46.3 $1,761.0 $92.7 $1,668.4 $185.4 All $1,761.0 $92.7 $1,668.4 $185.4 $1,483.0 $370.7 All figures are in US$ millions.
36
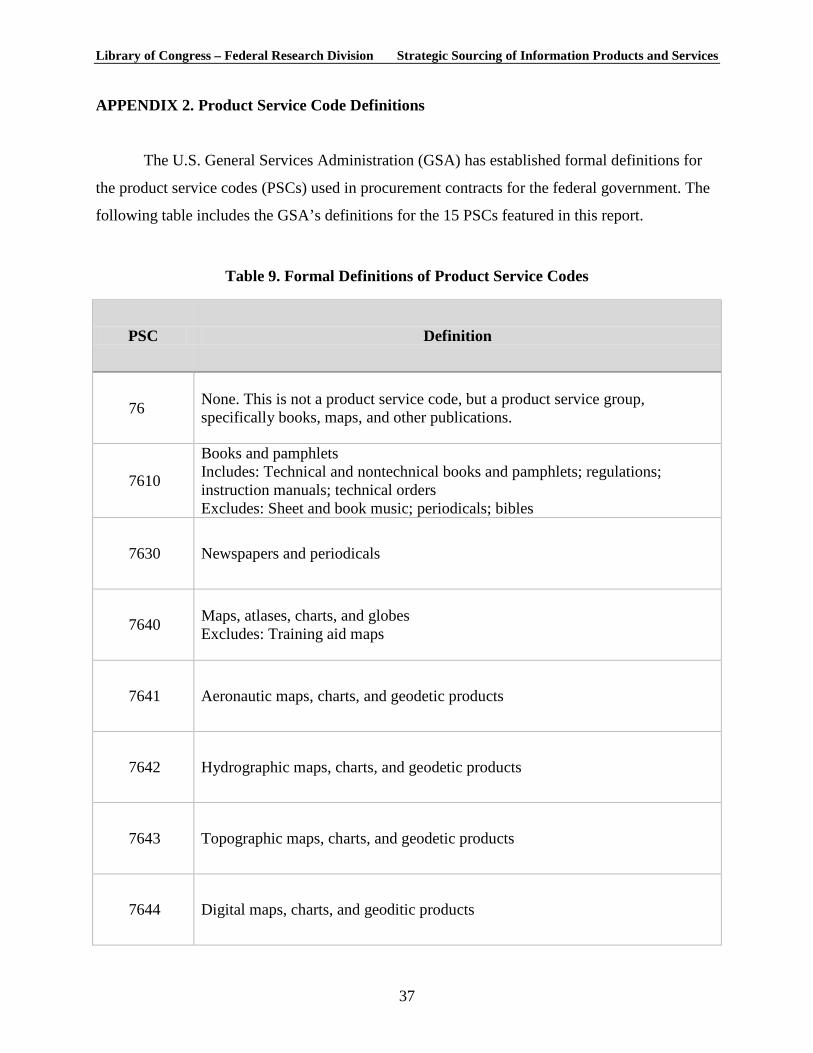
Library of Congress – Federal Research Division Strategic Sourcing of Information Products and Services APPENDIX 2. Product Service Code Definitions
The U.S. General Services Administration (GSA) has established formal definitions for
the product service codes (PSCs) used in procurement contracts for the federal government. The
following table includes the GSA’s definitions for the 15 PSCs featured in this report.
Table 9. Formal Definitions of Product Service Codes
PSC Definition
76 None. This is not a product service code, but a product service group, specifically books, maps, and other publications.
7610
Books and pamphlets Includes: Technical and nontechnical books and pamphlets; regulations; instruction manuals; technical orders Excludes: Sheet and book music; periodicals; bibles
7630 Newspapers and periodicals
7640 Maps, atlases, charts, and globes Excludes: Training aid maps
7641 Aeronautic maps, charts, and geodetic products
7642 Hydrographic maps, charts, and geodetic products
7643 Topographic maps, charts, and geodetic products
7644 Digital maps, charts, and geoditic products
37
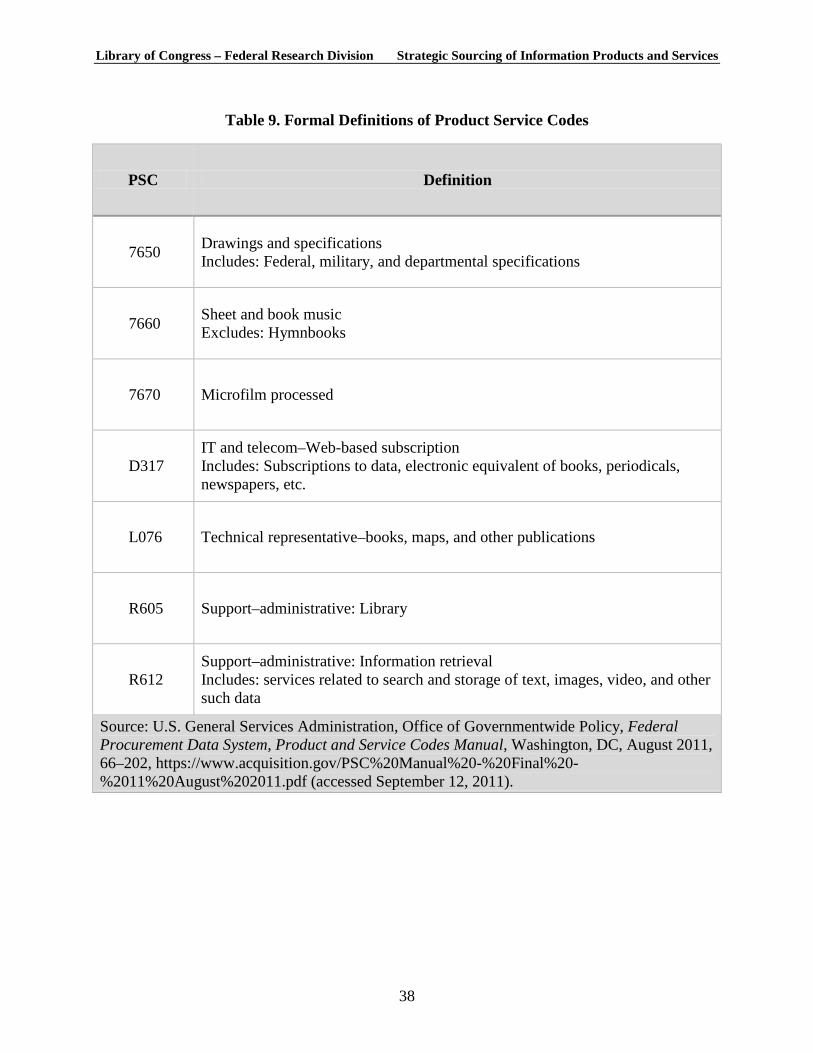
Library of Congress – Federal Research Division Strategic Sourcing of Information Products and Services
Table 9. Formal Definitions of Product Service Codes
PSC Definition
7650 Drawings and specifications Includes: Federal, military, and departmental specifications
7660 Sheet and book music Excludes: Hymnbooks
7670 Microfilm processed
D317 IT and telecom–Web-based subscription Includes: Subscriptions to data, electronic equivalent of books, periodicals, newspapers, etc.
L076 Technical representative–books, maps, and other publications
R605 Support–administrative: Library
R612 Support–administrative: Information retrieval Includes: services related to search and storage of text, images, video, and other such data
Source: U.S. General Services Administration, Office of Governmentwide Policy, Federal Procurement Data System, Product and Service Codes Manual, Washington, DC, August 2011, 66–202, https://www.acquisition.gov/PSC%20Manual%20-%20Final%20-%2011%20August%202011.pdf (accessed September 12, 2011).
38
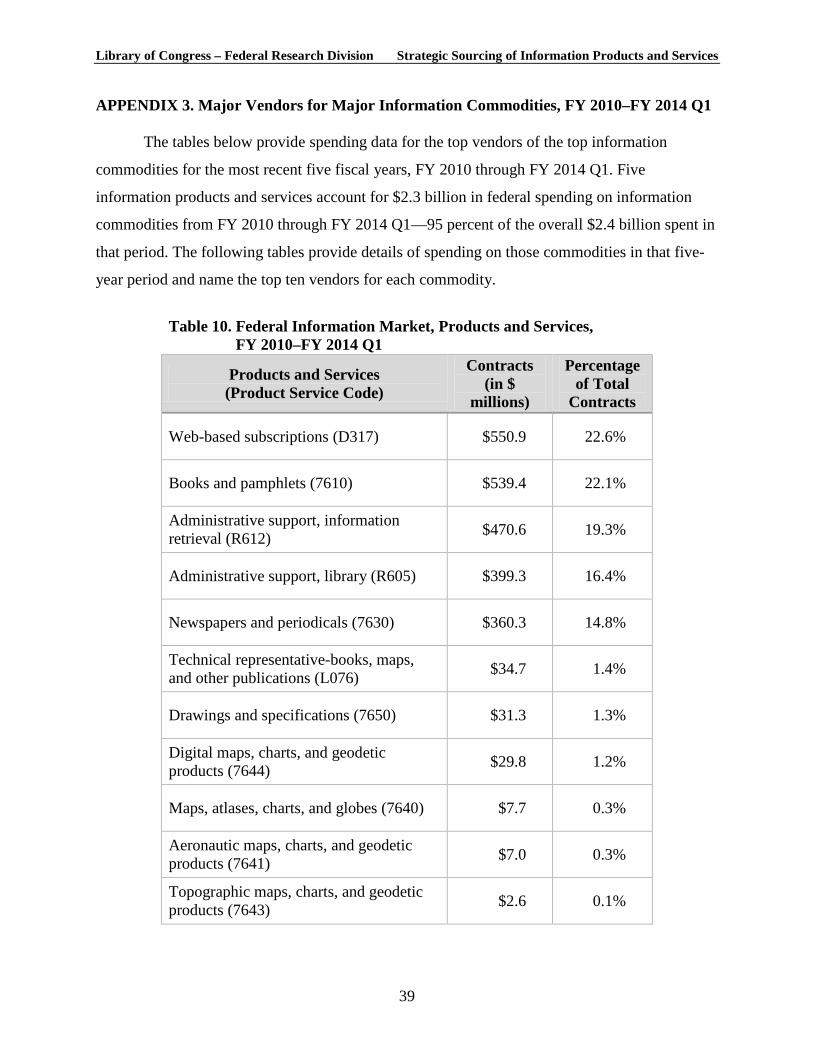
Library of Congress – Federal Research Division Strategic Sourcing of Information Products and Services APPENDIX 3. Major Vendors for Major Information Commodities, FY 2010–FY 2014 Q1
The tables below provide spending data for the top vendors of the top information
commodities for the most recent five fiscal years, FY 2010 through FY 2014 Q1. Five
information products and services account for $2.3 billion in federal spending on information
commodities from FY 2010 through FY 2014 Q1—95 percent of the overall $2.4 billion spent in
that period. The following tables provide details of spending on those commodities in that five-
year period and name the top ten vendors for each commodity.
Table 10. Federal Information Market, Products and Services,
FY 2010–FY 2014 Q1
Products and Services (Product Service Code)
Contracts (in $
millions)
Percentage of Total
Contracts
Web-based subscriptions (D317) $550.9 22.6%
Books and pamphlets (7610) $539.4 22.1%
Administrative support, information retrieval (R612) $470.6 19.3%
Administrative support, library (R605) $399.3 16.4%
Newspapers and periodicals (7630) $360.3 14.8%
Technical representative-books, maps, and other publications (L076) $34.7 1.4%
Drawings and specifications (7650) $31.3 1.3%
Digital maps, charts, and geodetic products (7644) $29.8 1.2%
Maps, atlases, charts, and globes (7640) $7.7 0.3%
Aeronautic maps, charts, and geodetic products (7641) $7.0 0.3%
Topographic maps, charts, and geodetic products (7643) $2.6 0.1%
39
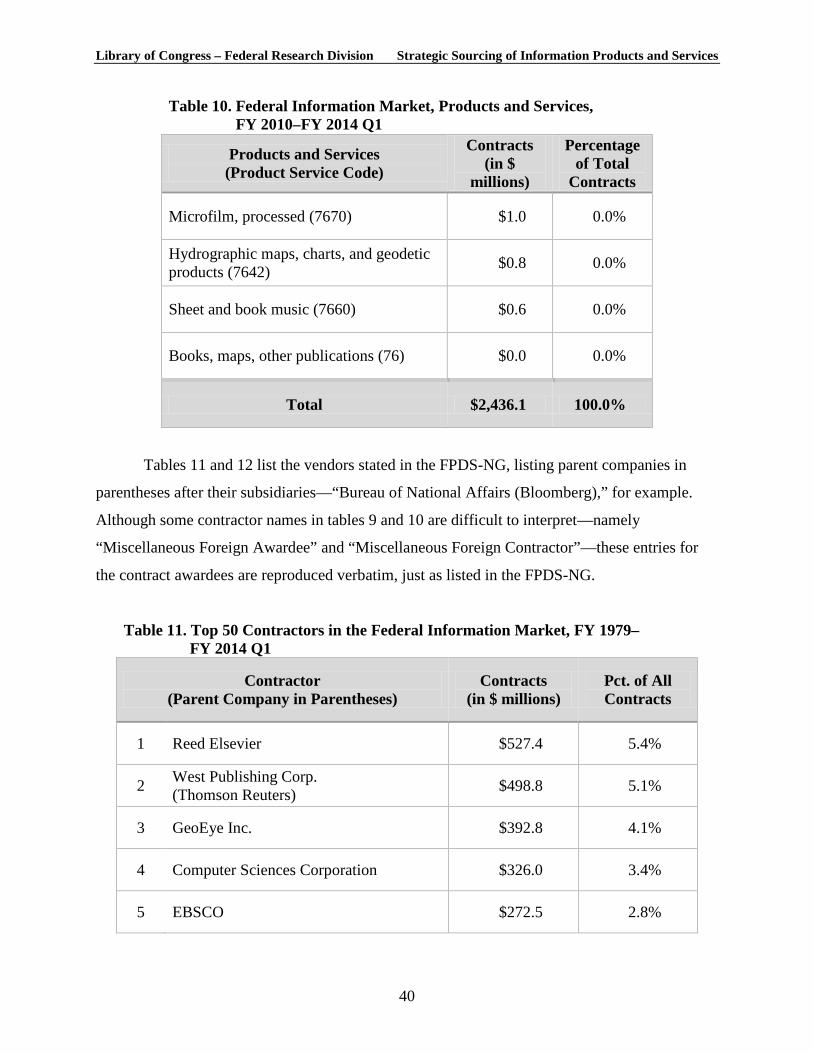
Library of Congress – Federal Research Division Strategic Sourcing of Information Products and Services
Table 10. Federal Information Market, Products and Services, FY 2010–FY 2014 Q1
Products and Services (Product Service Code)
Contracts (in $
millions)
Percentage of Total
Contracts
Microfilm, processed (7670) $1.0 0.0%
Hydrographic maps, charts, and geodetic products (7642) $0.8 0.0%
Sheet and book music (7660) $0.6 0.0%
Books, maps, other publications (76) $0.0 0.0%
Total $2,436.1 100.0%
Tables 11 and 12 list the vendors stated in the FPDS-NG, listing parent companies in
parentheses after their subsidiaries—“Bureau of National Affairs (Bloomberg),” for example.
Although some contractor names in tables 9 and 10 are difficult to interpret—namely
“Miscellaneous Foreign Awardee” and “Miscellaneous Foreign Contractor”—these entries for
the contract awardees are reproduced verbatim, just as listed in the FPDS-NG.
Table 11. Top 50 Contractors in the Federal Information Market, FY 1979– FY 2014 Q1
Contractor (Parent Company in Parentheses)
Contracts (in $ millions)
Pct. of All Contracts
1 Reed Elsevier $527.4 5.4%
2 West Publishing Corp. (Thomson Reuters) $498.8 5.1%
3 GeoEye Inc. $392.8 4.1%
4 Computer Sciences Corporation $326.0 3.4%
5 EBSCO $272.5 2.8%
40
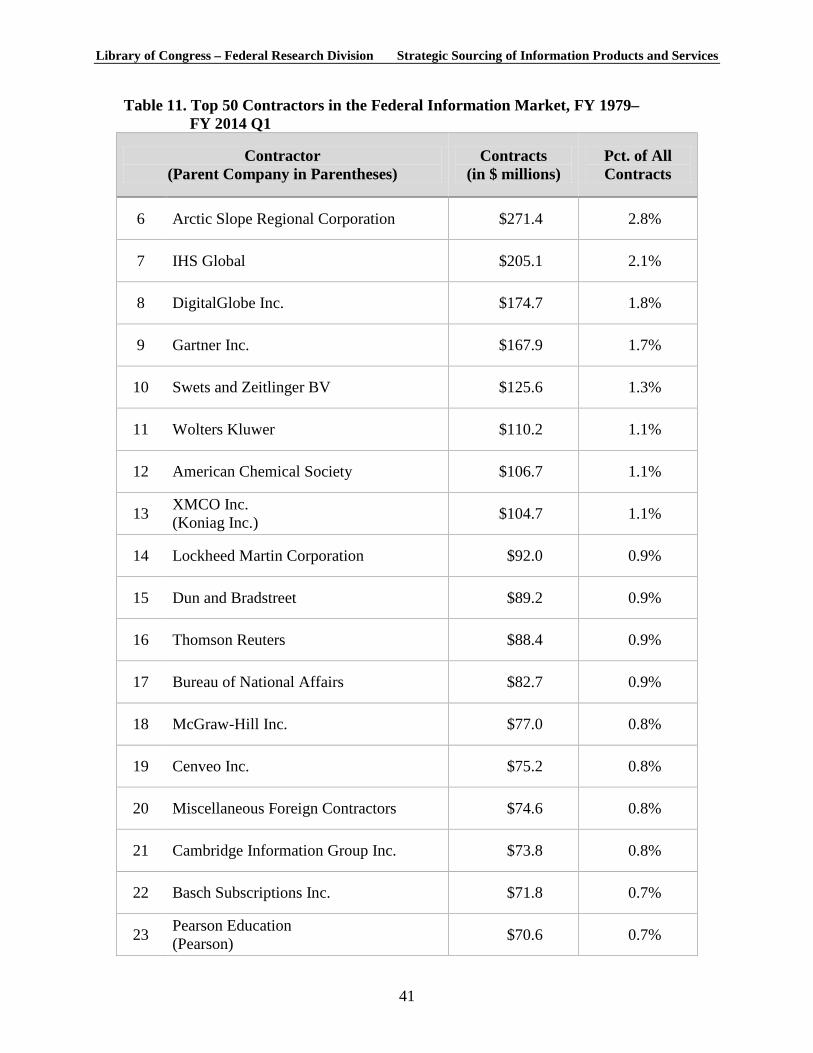
Library of Congress – Federal Research Division Strategic Sourcing of Information Products and Services
Table 11. Top 50 Contractors in the Federal Information Market, FY 1979– FY 2014 Q1
Contractor (Parent Company in Parentheses)
Contracts (in $ millions)
Pct. of All Contracts
6 Arctic Slope Regional Corporation $271.4 2.8%
7 IHS Global $205.1 2.1%
8 DigitalGlobe Inc. $174.7 1.8%
9 Gartner Inc. $167.9 1.7%
10 Swets and Zeitlinger BV $125.6 1.3%
11 Wolters Kluwer $110.2 1.1%
12 American Chemical Society $106.7 1.1%
13 XMCO Inc. (Koniag Inc.) $104.7 1.1%
14 Lockheed Martin Corporation $92.0 0.9%
15 Dun and Bradstreet $89.2 0.9%
16 Thomson Reuters $88.4 0.9%
17 Bureau of National Affairs $82.7 0.9%
18 McGraw-Hill Inc. $77.0 0.8%
19 Cenveo Inc. $75.2 0.8%
20 Miscellaneous Foreign Contractors $74.6 0.8%
21 Cambridge Information Group Inc. $73.8 0.8%
22 Basch Subscriptions Inc. $71.8 0.7%
23 Pearson Education (Pearson) $70.6 0.7%
41
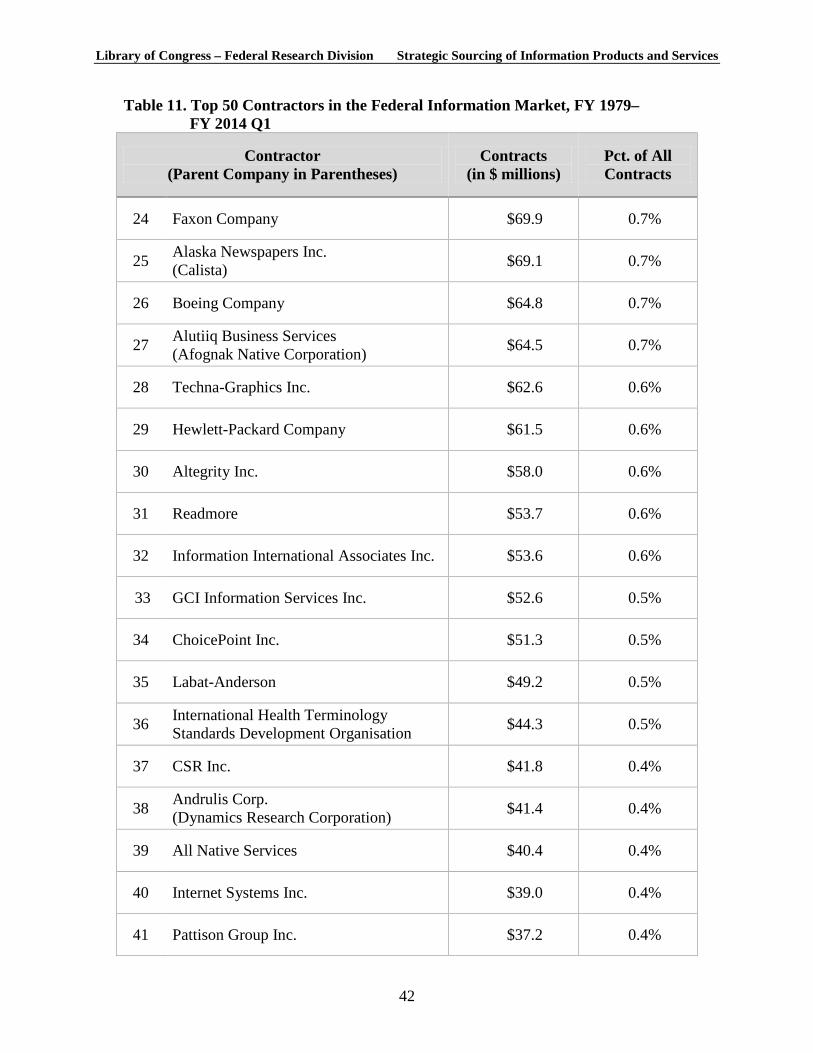
Library of Congress – Federal Research Division Strategic Sourcing of Information Products and Services
Table 11. Top 50 Contractors in the Federal Information Market, FY 1979– FY 2014 Q1
Contractor (Parent Company in Parentheses)
Contracts (in $ millions)
Pct. of All Contracts
24 Faxon Company $69.9 0.7%
25 Alaska Newspapers Inc. (Calista) $69.1 0.7%
26 Boeing Company $64.8 0.7%
27 Alutiiq Business Services (Afognak Native Corporation) $64.5 0.7%
28 Techna-Graphics Inc. $62.6 0.6%
29 Hewlett-Packard Company $61.5 0.6%
30 Altegrity Inc. $58.0 0.6%
31 Readmore $53.7 0.6%
32 Information International Associates Inc. $53.6 0.6%
33 GCI Information Services Inc. $52.6 0.5%
34 ChoicePoint Inc. $51.3 0.5%
35 Labat-Anderson $49.2 0.5%
36 International Health Terminology Standards Development Organisation $44.3 0.5%
37 CSR Inc. $41.8 0.4%
38 Andrulis Corp. (Dynamics Research Corporation) $41.4 0.4%
39 All Native Services $40.4 0.4%
40 Internet Systems Inc. $39.0 0.4%
41 Pattison Group Inc. $37.2 0.4%
42
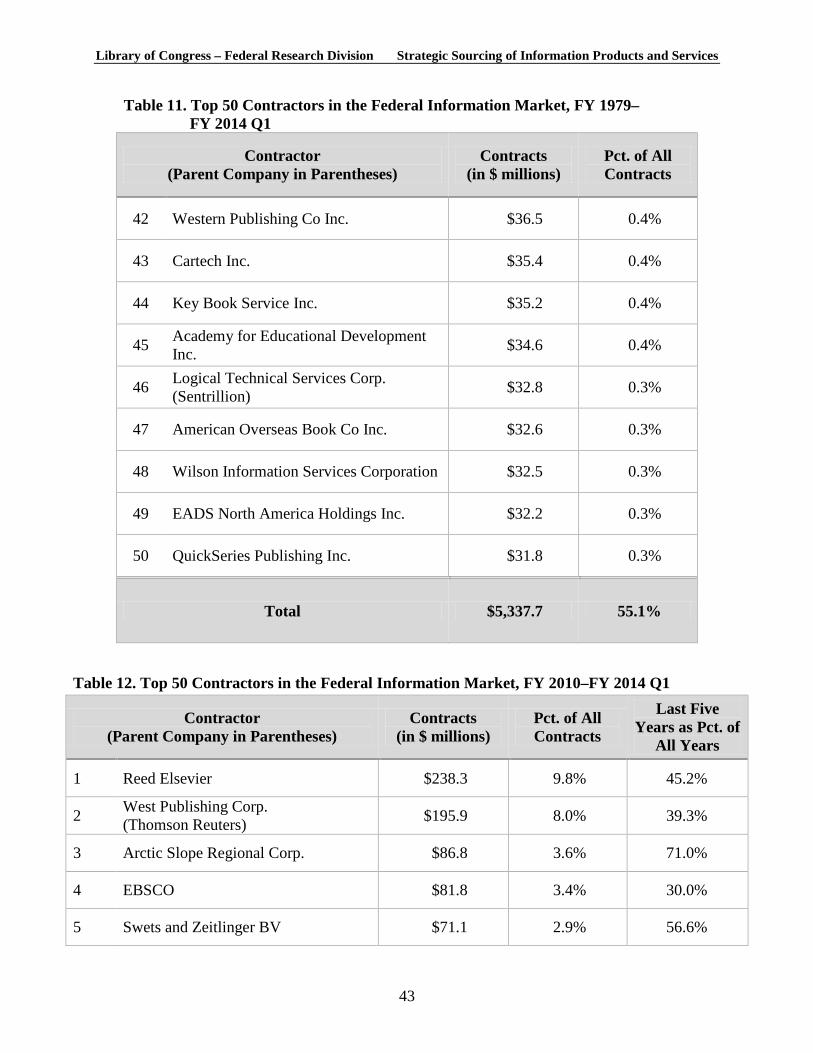
Library of Congress – Federal Research Division Strategic Sourcing of Information Products and Services
Table 11. Top 50 Contractors in the Federal Information Market, FY 1979– FY 2014 Q1
Contractor (Parent Company in Parentheses)
Contracts (in $ millions)
Pct. of All Contracts
42 Western Publishing Co Inc. $36.5 0.4%
43 Cartech Inc. $35.4 0.4%
44 Key Book Service Inc. $35.2 0.4%
45 Academy for Educational Development Inc. $34.6 0.4%
46 Logical Technical Services Corp. (Sentrillion) $32.8 0.3%
47 American Overseas Book Co Inc. $32.6 0.3%
48 Wilson Information Services Corporation $32.5 0.3%
49 EADS North America Holdings Inc. $32.2 0.3%
50 QuickSeries Publishing Inc. $31.8 0.3%
Total $5,337.7 55.1%
Table 12. Top 50 Contractors in the Federal Information Market, FY 2010–FY 2014 Q1
Contractor (Parent Company in Parentheses)
Contracts (in $ millions)
Pct. of All Contracts
Last Five Years as Pct. of
All Years
1 Reed Elsevier $238.3 9.8% 45.2%
2 West Publishing Corp. (Thomson Reuters) $195.9 8.0% 39.3%
3 Arctic Slope Regional Corp. $86.8 3.6% 71.0%
4 EBSCO $81.8 3.4% 30.0%
5 Swets and Zeitlinger BV $71.1 2.9% 56.6%
43
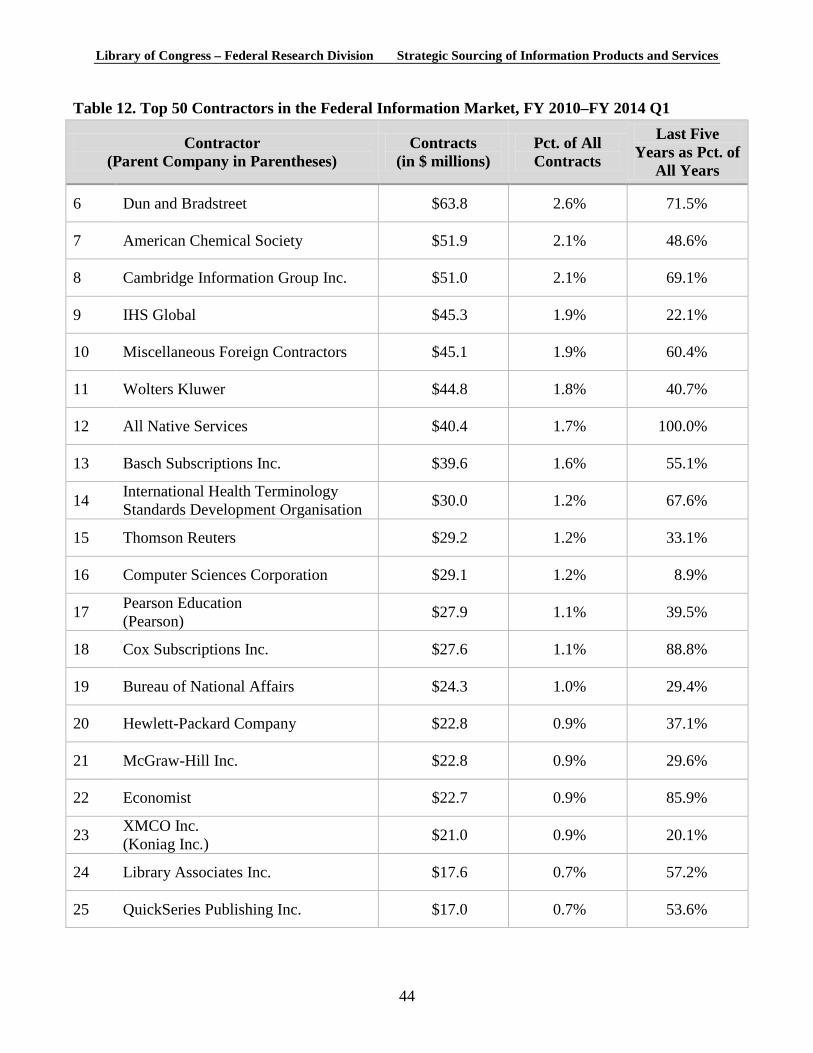
Library of Congress – Federal Research Division Strategic Sourcing of Information Products and Services
Table 12. Top 50 Contractors in the Federal Information Market, FY 2010–FY 2014 Q1
Contractor (Parent Company in Parentheses)
Contracts (in $ millions)
Pct. of All Contracts
Last Five Years as Pct. of
All Years
6 Dun and Bradstreet $63.8 2.6% 71.5%
7 American Chemical Society $51.9 2.1% 48.6%
8 Cambridge Information Group Inc. $51.0 2.1% 69.1%
9 IHS Global $45.3 1.9% 22.1%
10 Miscellaneous Foreign Contractors $45.1 1.9% 60.4%
11 Wolters Kluwer $44.8 1.8% 40.7%
12 All Native Services $40.4 1.7% 100.0%
13 Basch Subscriptions Inc. $39.6 1.6% 55.1%
14 International Health Terminology Standards Development Organisation $30.0 1.2% 67.6%
15 Thomson Reuters $29.2 1.2% 33.1%
16 Computer Sciences Corporation $29.1 1.2% 8.9%
17 Pearson Education (Pearson) $27.9 1.1% 39.5%
18 Cox Subscriptions Inc. $27.6 1.1% 88.8%
19 Bureau of National Affairs $24.3 1.0% 29.4%
20 Hewlett-Packard Company $22.8 0.9% 37.1%
21 McGraw-Hill Inc. $22.8 0.9% 29.6%
22 Economist $22.7 0.9% 85.9%
23 XMCO Inc. (Koniag Inc.) $21.0 0.9% 20.1%
24 Library Associates Inc. $17.6 0.7% 57.2%
25 QuickSeries Publishing Inc. $17.0 0.7% 53.6%
44
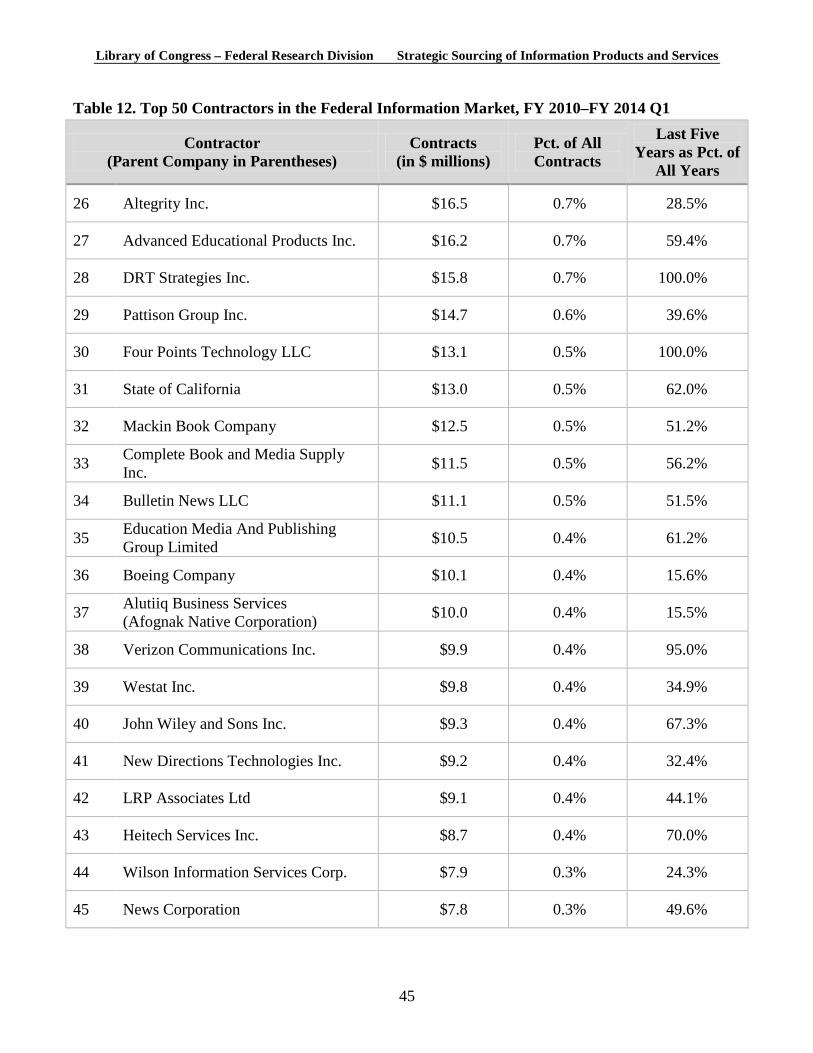
Library of Congress – Federal Research Division Strategic Sourcing of Information Products and Services
Table 12. Top 50 Contractors in the Federal Information Market, FY 2010–FY 2014 Q1
Contractor (Parent Company in Parentheses)
Contracts (in $ millions)
Pct. of All Contracts
Last Five Years as Pct. of
All Years
26 Altegrity Inc. $16.5 0.7% 28.5%
27 Advanced Educational Products Inc. $16.2 0.7% 59.4%
28 DRT Strategies Inc. $15.8 0.7% 100.0%
29 Pattison Group Inc. $14.7 0.6% 39.6%
30 Four Points Technology LLC $13.1 0.5% 100.0%
31 State of California $13.0 0.5% 62.0%
32 Mackin Book Company $12.5 0.5% 51.2%
33 Complete Book and Media Supply Inc. $11.5 0.5% 56.2%
34 Bulletin News LLC $11.1 0.5% 51.5%
35 Education Media And Publishing Group Limited $10.5 0.4% 61.2%
36 Boeing Company $10.1 0.4% 15.6%
37 Alutiiq Business Services (Afognak Native Corporation) $10.0 0.4% 15.5%
38 Verizon Communications Inc. $9.9 0.4% 95.0%
39 Westat Inc. $9.8 0.4% 34.9%
40 John Wiley and Sons Inc. $9.3 0.4% 67.3%
41 New Directions Technologies Inc. $9.2 0.4% 32.4%
42 LRP Associates Ltd $9.1 0.4% 44.1%
43 Heitech Services Inc. $8.7 0.4% 70.0%
44 Wilson Information Services Corp. $7.9 0.3% 24.3%
45 News Corporation $7.8 0.3% 49.6%
45
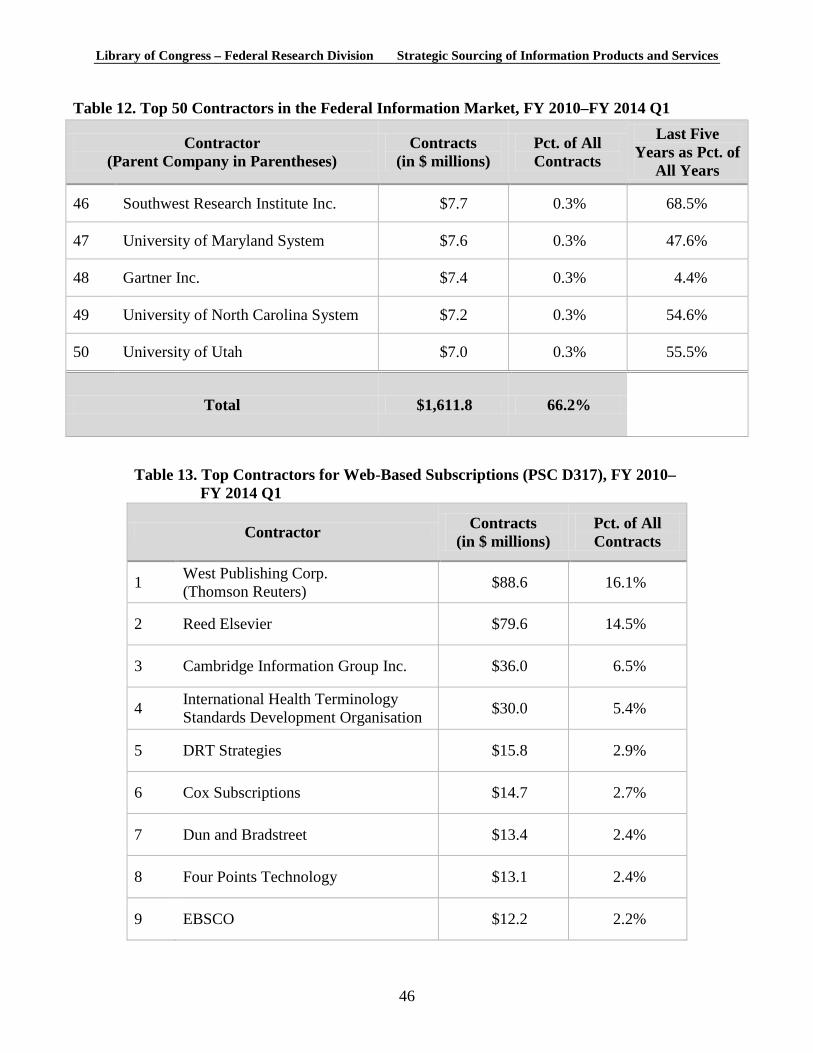
Library of Congress – Federal Research Division Strategic Sourcing of Information Products and Services
Table 12. Top 50 Contractors in the Federal Information Market, FY 2010–FY 2014 Q1
Contractor (Parent Company in Parentheses)
Contracts (in $ millions)
Pct. of All Contracts
Last Five Years as Pct. of
All Years
46 Southwest Research Institute Inc. $7.7 0.3% 68.5%
47 University of Maryland System $7.6 0.3% 47.6%
48 Gartner Inc. $7.4 0.3% 4.4%
49 University of North Carolina System $7.2 0.3% 54.6%
50 University of Utah $7.0 0.3% 55.5%
Total $1,611.8 66.2%
Table 13. Top Contractors for Web-Based Subscriptions (PSC D317), FY 2010–FY 2014 Q1
Contractor Contracts (in $ millions)
Pct. of All Contracts
1 West Publishing Corp. (Thomson Reuters) $88.6 16.1%
2 Reed Elsevier $79.6 14.5%
3 Cambridge Information Group Inc. $36.0 6.5%
4 International Health Terminology Standards Development Organisation $30.0 5.4%
5 DRT Strategies $15.8 2.9%
6 Cox Subscriptions $14.7 2.7%
7 Dun and Bradstreet $13.4 2.4%
8 Four Points Technology $13.1 2.4%
9 EBSCO $12.2 2.2%
46
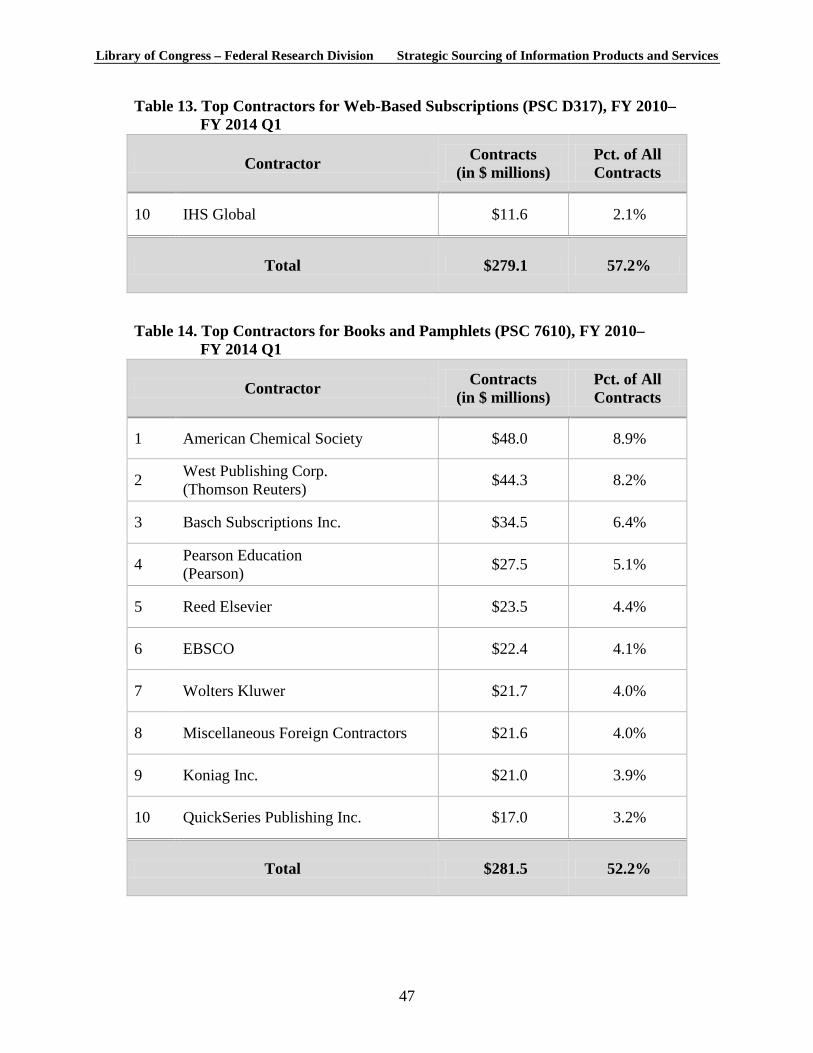
Library of Congress – Federal Research Division Strategic Sourcing of Information Products and Services
Table 13. Top Contractors for Web-Based Subscriptions (PSC D317), FY 2010–FY 2014 Q1
Contractor Contracts (in $ millions)
Pct. of All Contracts
10 IHS Global $11.6 2.1%
Total $279.1 57.2%
Table 14. Top Contractors for Books and Pamphlets (PSC 7610), FY 2010– FY 2014 Q1
Contractor Contracts (in $ millions)
Pct. of All Contracts
1 American Chemical Society $48.0 8.9%
2 West Publishing Corp. (Thomson Reuters) $44.3 8.2%
3 Basch Subscriptions Inc. $34.5 6.4%
4 Pearson Education (Pearson) $27.5 5.1%
5 Reed Elsevier $23.5 4.4%
6 EBSCO $22.4 4.1%
7 Wolters Kluwer $21.7 4.0%
8 Miscellaneous Foreign Contractors $21.6 4.0%
9 Koniag Inc. $21.0 3.9%
10 QuickSeries Publishing Inc. $17.0 3.2%
Total $281.5 52.2%
47
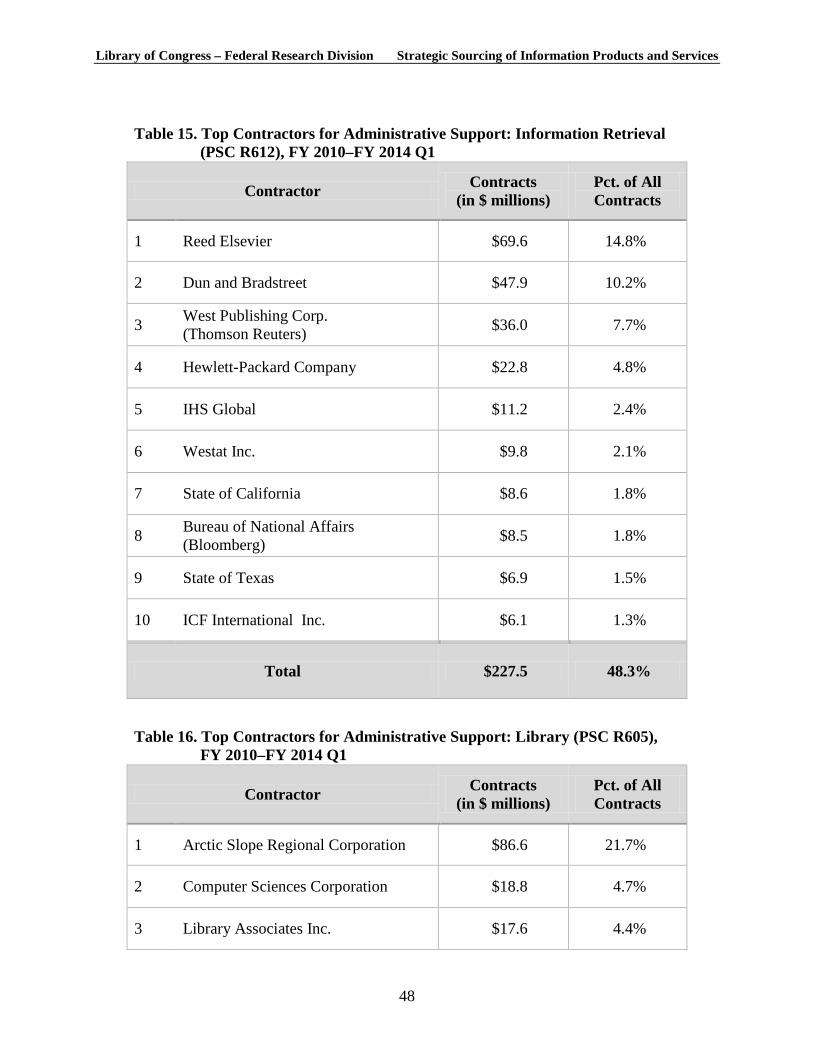
Library of Congress – Federal Research Division Strategic Sourcing of Information Products and Services
Table 15. Top Contractors for Administrative Support: Information Retrieval (PSC R612), FY 2010–FY 2014 Q1
Contractor Contracts (in $ millions)
Pct. of All Contracts
1 Reed Elsevier $69.6 14.8%
2 Dun and Bradstreet $47.9 10.2%
3 West Publishing Corp. (Thomson Reuters) $36.0 7.7%
4 Hewlett-Packard Company $22.8 4.8%
5 IHS Global $11.2 2.4%
6 Westat Inc. $9.8 2.1%
7 State of California $8.6 1.8%
8 Bureau of National Affairs (Bloomberg) $8.5 1.8%
9 State of Texas $6.9 1.5%
10 ICF International Inc. $6.1 1.3%
Total $227.5 48.3%
Table 16. Top Contractors for Administrative Support: Library (PSC R605), FY 2010–FY 2014 Q1
Contractor Contracts (in $ millions)
Pct. of All Contracts
1 Arctic Slope Regional Corporation $86.6 21.7%
2 Computer Sciences Corporation $18.8 4.7%
3 Library Associates Inc. $17.6 4.4%
48
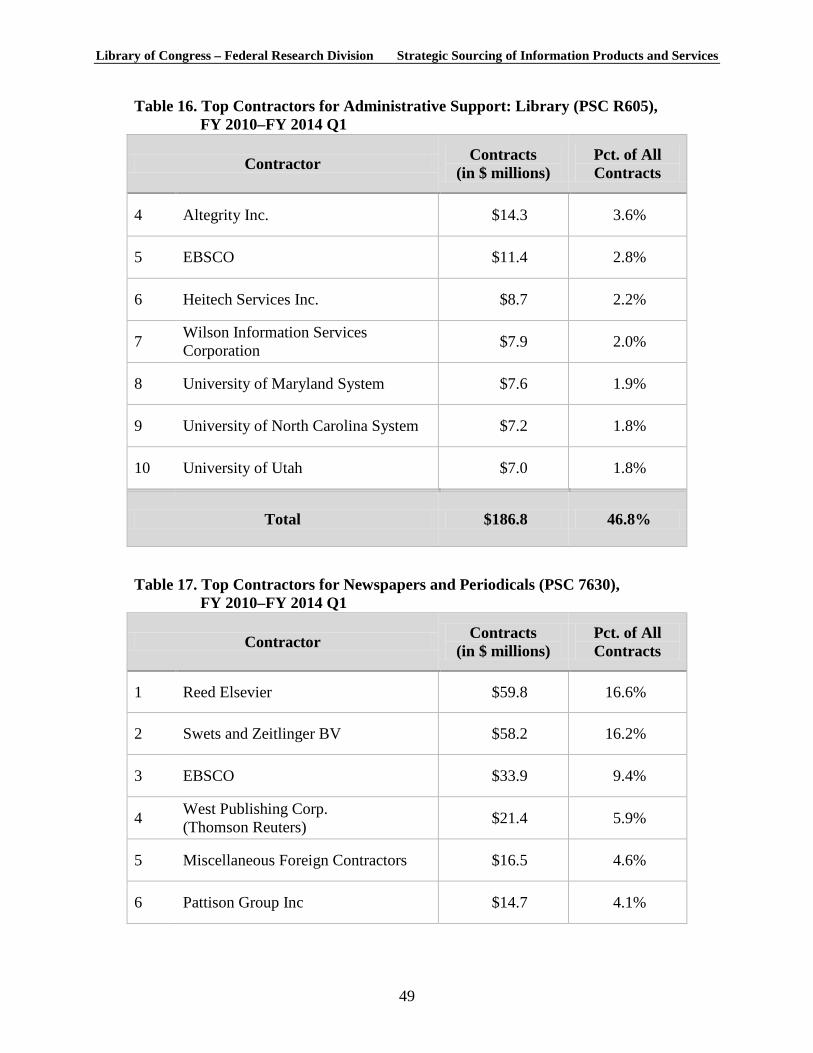
Library of Congress – Federal Research Division Strategic Sourcing of Information Products and Services
Table 16. Top Contractors for Administrative Support: Library (PSC R605), FY 2010–FY 2014 Q1
Contractor Contracts (in $ millions)
Pct. of All Contracts
4 Altegrity Inc. $14.3 3.6%
5 EBSCO $11.4 2.8%
6 Heitech Services Inc. $8.7 2.2%
7 Wilson Information Services Corporation $7.9 2.0%
8 University of Maryland System $7.6 1.9%
9 University of North Carolina System $7.2 1.8%
10 University of Utah $7.0 1.8%
Total $186.8 46.8%
Table 17. Top Contractors for Newspapers and Periodicals (PSC 7630), FY 2010–FY 2014 Q1
Contractor Contracts (in $ millions)
Pct. of All Contracts
1 Reed Elsevier $59.8 16.6%
2 Swets and Zeitlinger BV $58.2 16.2%
3 EBSCO $33.9 9.4%
4 West Publishing Corp. (Thomson Reuters) $21.4 5.9%
5 Miscellaneous Foreign Contractors $16.5 4.6%
6 Pattison Group Inc $14.7 4.1%
49
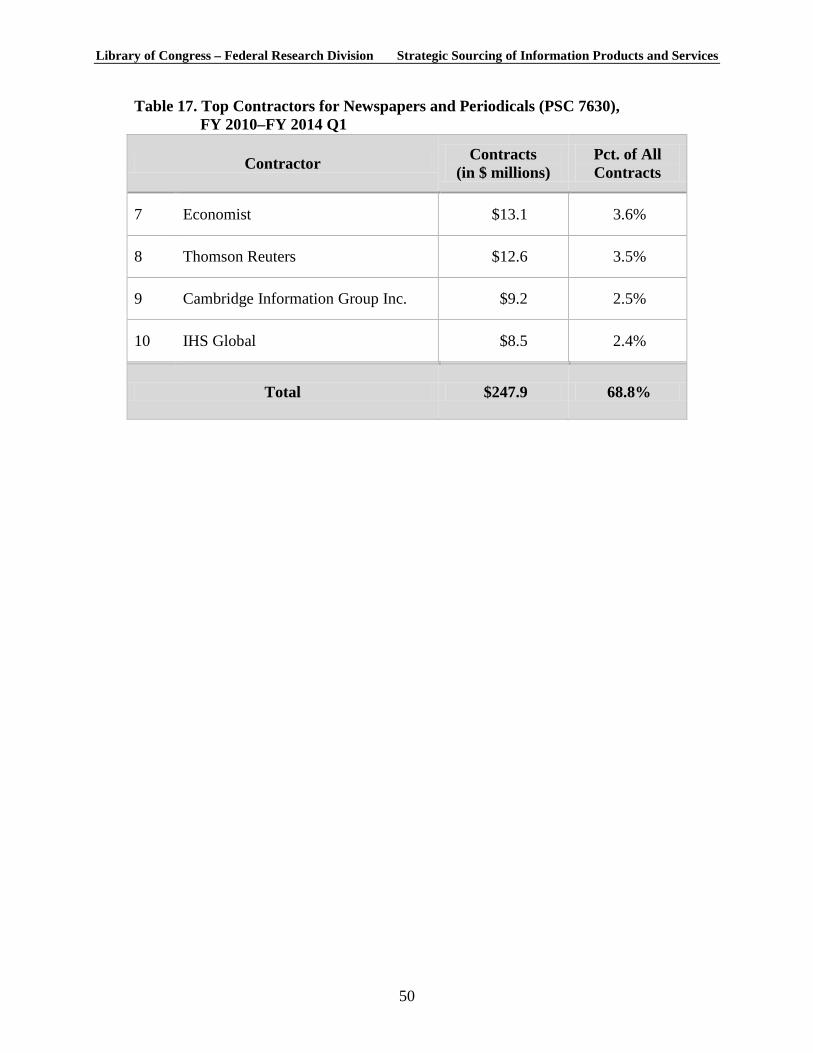
Library of Congress – Federal Research Division Strategic Sourcing of Information Products and Services
Table 17. Top Contractors for Newspapers and Periodicals (PSC 7630), FY 2010–FY 2014 Q1
Contractor Contracts (in $ millions)
Pct. of All Contracts
7 Economist $13.1 3.6%
8 Thomson Reuters $12.6 3.5%
9 Cambridge Information Group Inc. $9.2 2.5%
10 IHS Global $8.5 2.4%
Total $247.9 68.8%
50
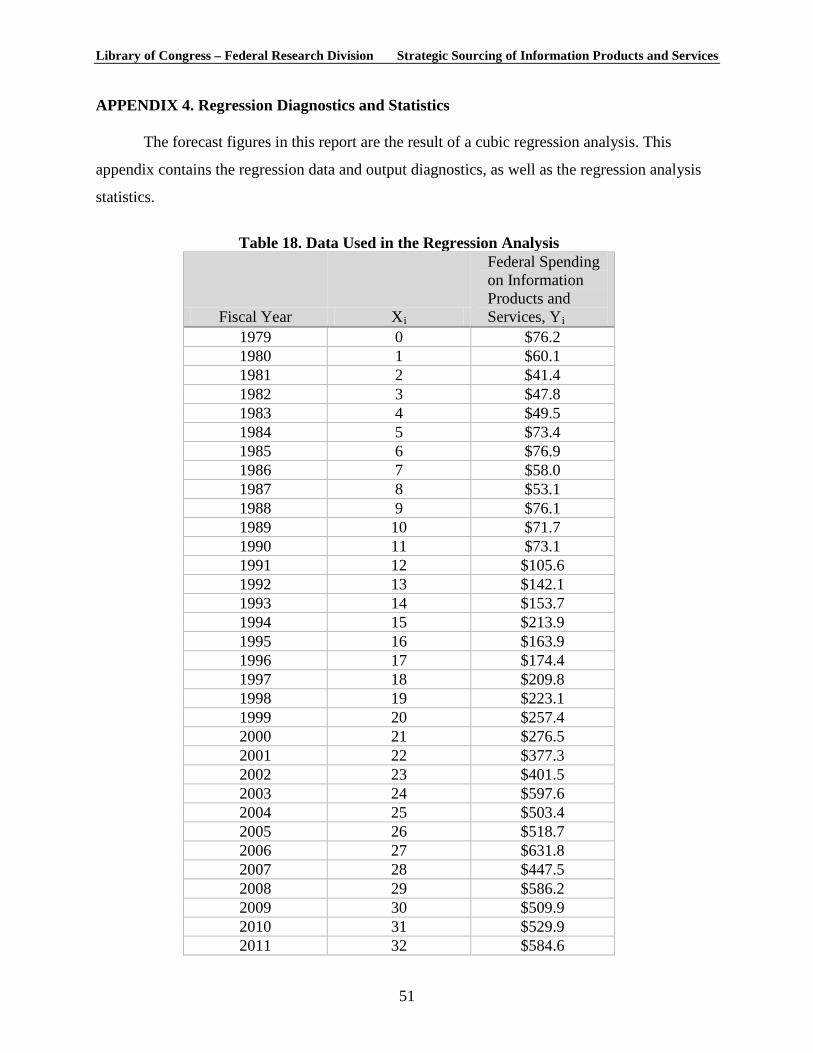
Library of Congress – Federal Research Division Strategic Sourcing of Information Products and Services APPENDIX 4. Regression Diagnostics and Statistics
The forecast figures in this report are the result of a cubic regression analysis. This
appendix contains the regression data and output diagnostics, as well as the regression analysis
statistics.
Table 18. Data Used in the Regression Analysis
Fiscal Year Xi
Federal Spending on Information Products and Services, Yi
1979 0 $76.2 1980 1 $60.1 1981 2 $41.4 1982 3 $47.8 1983 4 $49.5 1984 5 $73.4 1985 6 $76.9 1986 7 $58.0 1987 8 $53.1 1988 9 $76.1 1989 10 $71.7 1990 11 $73.1 1991 12 $105.6 1992 13 $142.1 1993 14 $153.7 1994 15 $213.9 1995 16 $163.9 1996 17 $174.4 1997 18 $209.8 1998 19 $223.1 1999 20 $257.4 2000 21 $276.5 2001 22 $377.3 2002 23 $401.5 2003 24 $597.6 2004 25 $503.4 2005 26 $518.7 2006 27 $631.8 2007 28 $447.5 2008 29 $586.2 2009 30 $509.9 2010 31 $529.9 2011 32 $584.6
51
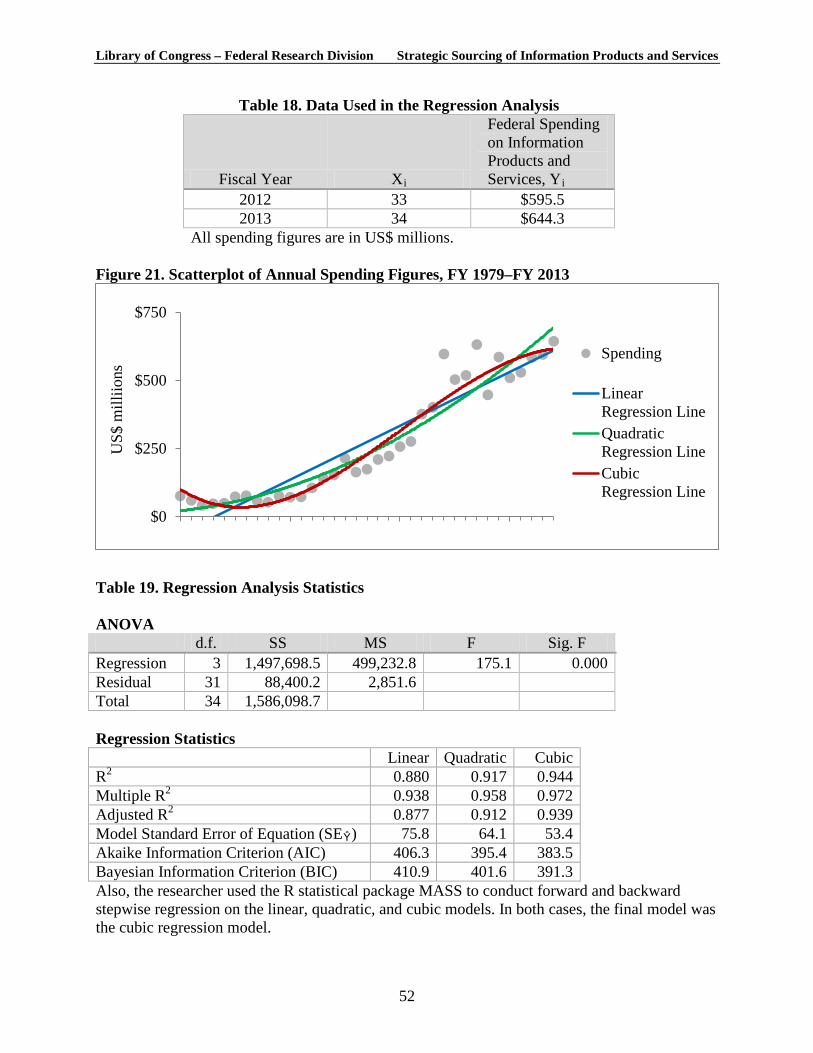
Library of Congress – Federal Research Division Strategic Sourcing of Information Products and Services
Table 18. Data Used in the Regression Analysis
Fiscal Year Xi
Federal Spending on Information Products and Services, Yi
2012 33 $595.5 2013 34 $644.3
All spending figures are in US$ millions. Figure 21. Scatterplot of Annual Spending Figures, FY 1979–FY 2013
Table 19. Regression Analysis Statistics ANOVA
d.f. SS MS F Sig. F Regression 3 1,497,698.5 499,232.8 175.1 0.000 Residual 31 88,400.2 2,851.6 Total 34 1,586,098.7 Regression Statistics Linear Quadratic Cubic R2 0.880 0.917 0.944 Multiple R2 0.938 0.958 0.972 Adjusted R2 0.877 0.912 0.939 Model Standard Error of Equation (SEŶ) 75.8 64.1 53.4 Akaike Information Criterion (AIC) 406.3 395.4 383.5 Bayesian Information Criterion (BIC) 410.9 401.6 391.3 Also, the researcher used the R statistical package MASS to conduct forward and backward stepwise regression on the linear, quadratic, and cubic models. In both cases, the final model was the cubic regression model.
$0
$250
$500
$750
US$
mill
iions
Spending
LinearRegression LineQuadraticRegression LineCubicRegression Line
52
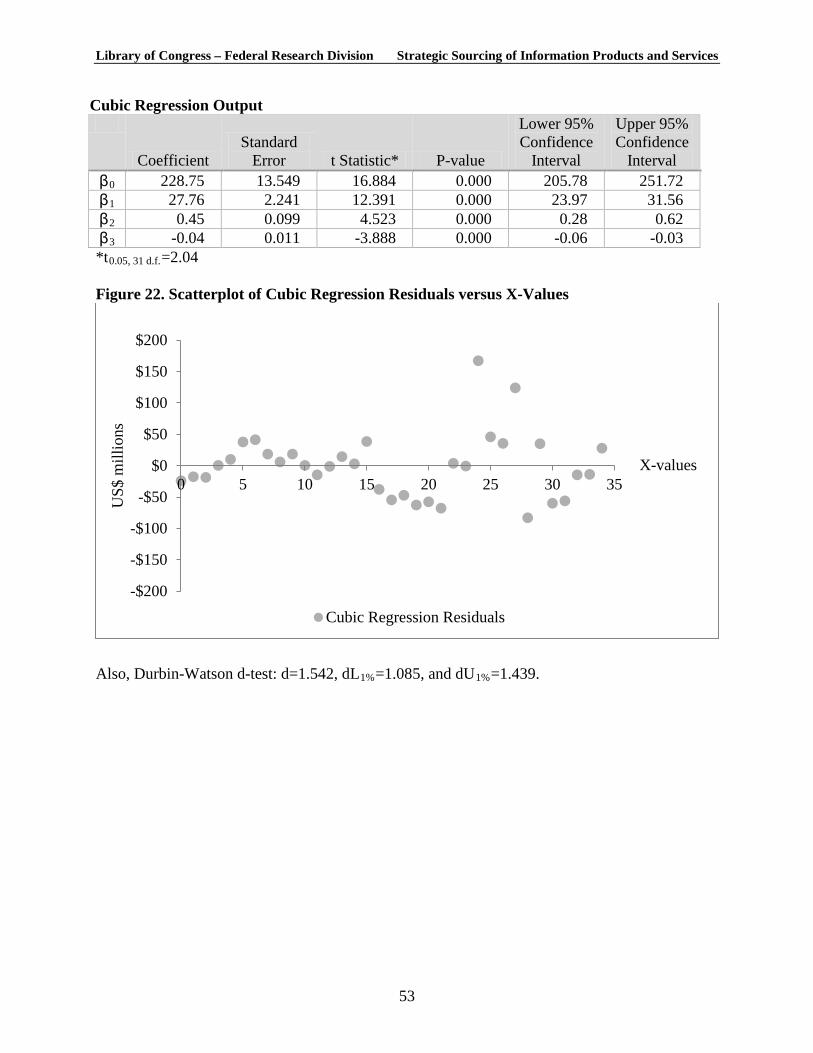
Library of Congress – Federal Research Division Strategic Sourcing of Information Products and Services
Cubic Regression Output
Coefficient Standard
Error t Statistic* P-value
Lower 95% Confidence
Interval
Upper 95% Confidence
Interval β0 228.75 13.549 16.884 0.000 205.78 251.72 β1 27.76 2.241 12.391 0.000 23.97 31.56 β2 0.45 0.099 4.523 0.000 0.28 0.62 β3 -0.04 0.011 -3.888 0.000 -0.06 -0.03 *t0.05, 31 d.f.=2.04 Figure 22. Scatterplot of Cubic Regression Residuals versus X-Values
Also, Durbin-Watson d-test: d=1.542, dL1%=1.085, and dU1%=1.439.
-$200
-$150
-$100
-$50
$0
$50
$100
$150
$200
0 5 10 15 20 25 30 35
US$
mill
ions
Cubic Regression Residuals
X-values
53
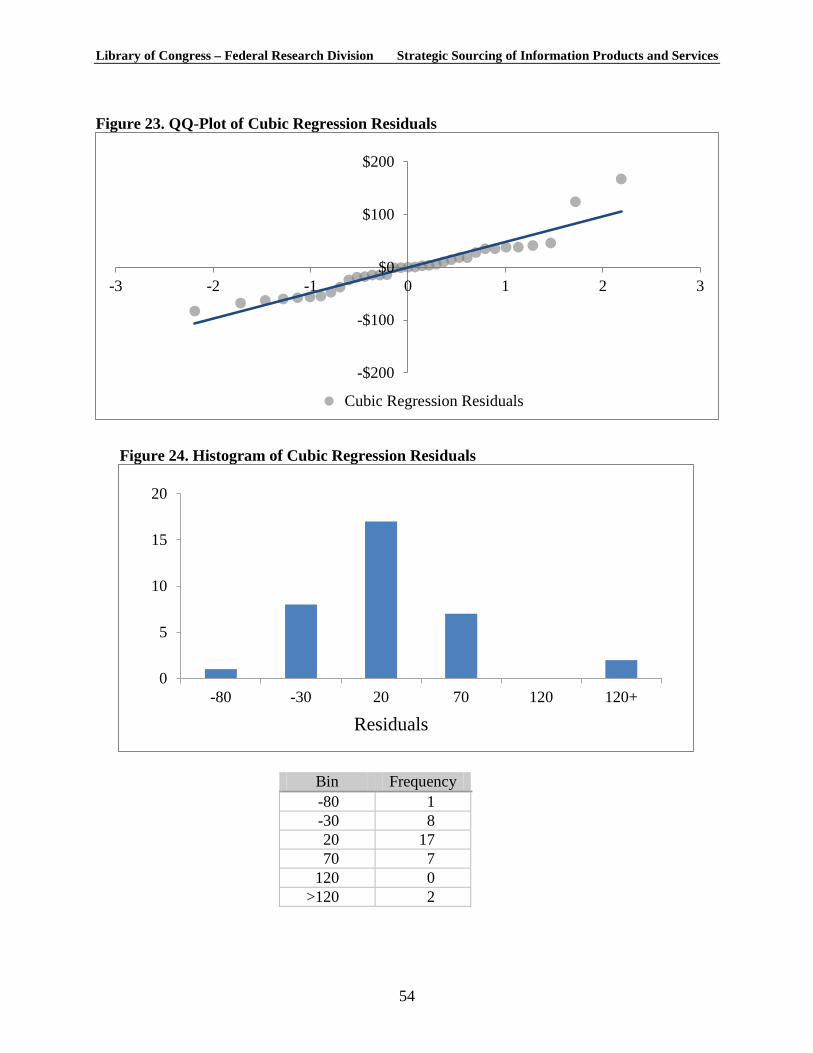
Library of Congress – Federal Research Division Strategic Sourcing of Information Products and Services Figure 23. QQ-Plot of Cubic Regression Residuals
Figure 24. Histogram of Cubic Regression Residuals
Bin Frequency -80 1 -30 8 20 17 70 7
120 0 >120 2
-$200
-$100
$0
$100
$200
-3 -2 -1 0 1 2 3
Cubic Regression Residuals
0
5
10
15
20
-80 -30 20 70 120 120+
Residuals
54
Library of Congress – Federal Research Division Strategic Sourcing of Information Products and Services BIBLIOGRAPHY
Hardy, Michael. “Fixing the Next Generation Procurement Data System.” Federal Computer Week 19, no. 40 (November 21, 2005): 65–66. http://www.proquest.com/en-US/ (DOI 218835006; accessed April 15, 2012 via ProQuest).
Hayward, Cathy. “Reforming the Old Bill.” Supply Management, January 4, 2011, 20–23. http://www.proquest.com/en-US/ (DOI 222195677; accessed April 15, 2012 via ProQuest).
Ivey, William Noël. “Federal Government Strategic Sourcing of Information Products and Services.” Report, Federal Research Division, Library of Congress, Washington, DC, December 2011. http://www.loc.gov/flicc/publications/FRD/Strategic-Sourcing-Version-2_2011-Dec-5-Corrected.pdf (accessed April 15, 2012).
Niezen, Carlos, Wulf Weller, and Heidi Deringer. “Strategic Supply Management.” MIT Sloan Management Review 48, no. 2 (Winter 2007): 7. http://www.proquest.com/en-US/(DOI2224964805; accessed via April 15, 2012 ProQuest).
R Core Team. “R: A Language and Environment for Statistical Computing.” Vienna, Austria: R Foundation for Statistical Computing, 2013. http://www.R-project.org/ (version 3.0.2 downloaded October 3, 2013).
U.S. Census Bureau. 2007 NAICS Definitions. Washington, DC: 2007. http://www.census.gov/cgi-bin/sssd/naics/naicsrch?chart=2007 (accessed July 19, 2011).
U.S. General Services Administration. Office of Governmentwide Policy. Federal Procurement Data System, Product and Service Codes Manual. Manual, Washington, DC, August 2011. https://www.acquisition.gov/PSC%20Manual%20-%20Final%20-%2011%20August%202011.pdf (accessed September 12, 2011).
U.S. Government Accountability Office (GAO). “Improvements Needed to the Federal Procurement Data System—Next Generation.” Report no. GAO-05-960R, Washington, DC, September 27, 2005. http://www.gao.gov/assets/100/93613.pdf (accessed August 6, 2012).
U.S. Office of Management and Budget. “Implementing Strategic Sourcing.” Memorandum, Washington, DC, May 20, 2005. http://www.uspto.gov/web/offices/ac/comp/proc/OMBmemo.pdf (accessed July 15, 2011).
Venables, William N., and Brian D. Ripley. Modern Applied Statistics with S. New York: Springer, 2002.
55