Embed Size (px)
Citation preview
August 10, 2021
FEDERAL PROGRAM SPENDING ONHOUSING AFFORDABILITY IN 2021
Powered by TCPDF (www.tcpdf.org)
The Parliamentary Budget Officer (PBO) supports Parliament by providing
economic and financial analysis for the purposes of raising the quality of
parliamentary debate and promoting greater budget transparency and
accountability.
This report is intended to help parliamentarians understand federal program
spending on housing affordability. It provides an update on our 2019 report,
Federal Program Spending on Housing Affordability in response to questions
raised by parliamentarians.
The planned spending profile for some of the programs identified in this
report are dependent on final program design being confirmed.
Lead Analyst:
Ben Segel-Brown, Analyst
Contributor:
Raphaël Liberge-Simard, Analyst
This report was prepared under the direction of:
Mark Mahabir, Director of Policy for Costing and Budgetary Analysis
Nancy Beauchamp, Carol Faucher, Martine Perreault and Rémy
Vanherweghem assisted with the preparation of the report for publication.
For further information, please contact [email protected]
Yves Giroux
Parliamentary Budget Officer
RP-2122-014-S_e
© Office of the Parliamentary Budget Officer, Ottawa, Canada, 2021
Table of Contents
Executive Summary 1
1. Introduction 3
2. Spending on Housing Affordability 5
2.1. Spending by Announcement 5
2.2. Spending by Core Responsibility 8
2.3. Explanation of Headline Commitment 10
3. New and modified programs 11
Appendix A: Spending in Context 13
Appendix B: Bilateral Agreements 15
Appendix C: Reported Results 19
Appendix D: Breakdown of Headline Commitment 22
Notes 24
Federal Program Spending on Housing Affordability in 2021
1
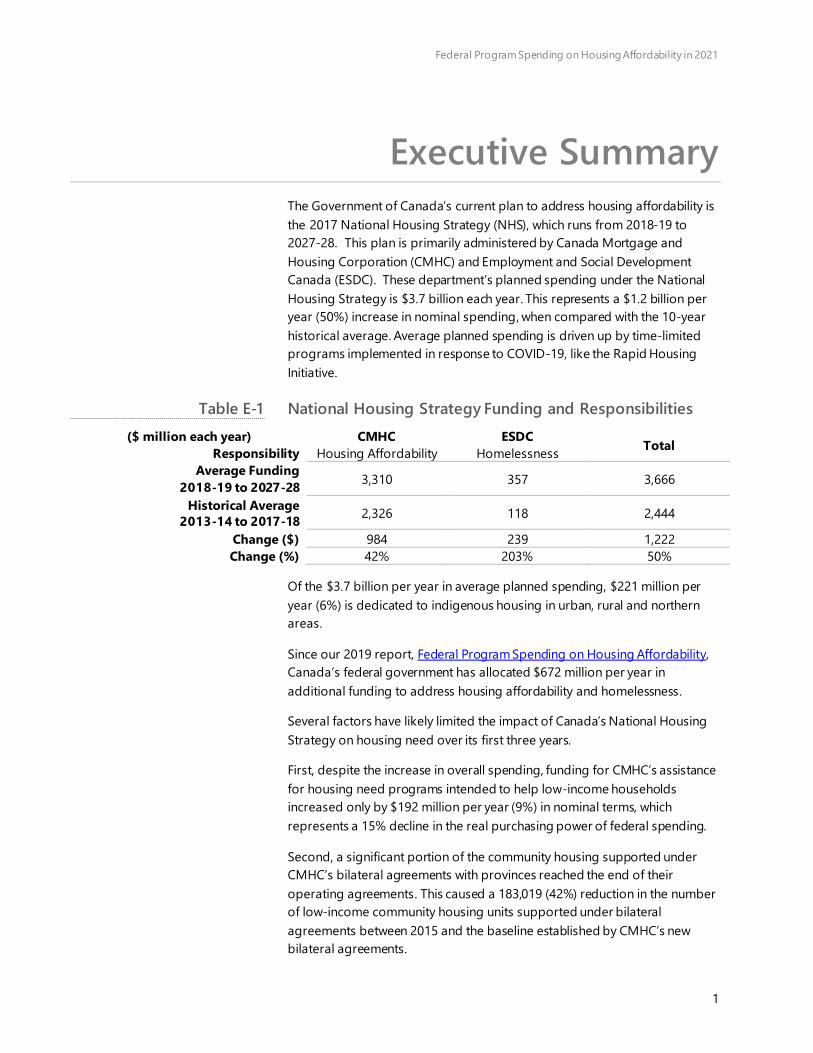
Executive Summary The Government of Canada’s current plan to address housing affordability is
the 2017 National Housing Strategy (NHS), which runs from 2018-19 to
2027-28. This plan is primarily administered by Canada Mortgage and
Housing Corporation (CMHC) and Employment and Social Development
Canada (ESDC). These department’s planned spending under the National
Housing Strategy is $3.7 billion each year. This represents a $1.2 billion per
year (50%) increase in nominal spending, when compared with the 10-year
historical average. Average planned spending is driven up by time-limited
programs implemented in response to COVID-19, like the Rapid Housing
Initiative.
National Housing Strategy Funding and Responsibilities
($ million each year) CMHC ESDC Total
Responsibility Housing Affordability Homelessness
Average Funding
2018-19 to 2027-28 3,310 357 3,666
Historical Average 2013-14 to 2017-18
2,326 118 2,444
Change ($) 984 239 1,222
Change (%) 42% 203% 50%
Of the $3.7 billion per year in average planned spending, $221 million per
year (6%) is dedicated to indigenous housing in urban, rural and northern
areas.
Since our 2019 report, Federal Program Spending on Housing Affordability,
Canada’s federal government has allocated $672 million per year in
additional funding to address housing affordability and homelessness.
Several factors have likely limited the impact of Canada’s National Housing Strategy on housing need over its first three years.
First, despite the increase in overall spending, funding for CMHC’s assistance for housing need programs intended to help low-income households
increased only by $192 million per year (9%) in nominal terms, which
represents a 15% decline in the real purchasing power of federal spending.
Second, a significant portion of the community housing supported under
CMHC’s bilateral agreements with provinces reached the end of their operating agreements. This caused a 183,019 (42%) reduction in the number
of low-income community housing units supported under bilateral
agreements between 2015 and the baseline established by CMHC’s new bilateral agreements.
Table E-1

Federal Program Spending on Housing Affordability in 2021
2
Third, CMHC’s capital contribution programs have faced implementation delays. Over the first three years of Canada’s National Housing Strategy, CMHC spent less than half the funding allocated for two key initiatives, the
National Housing Co-Investment Fund and Rental Construction Financing
Initiative. As of 30 October 2020, CMHC had made financial commitments
towards the creation of 4,270 units of affordable housing committing to
charge an average maximum of 52% of median market rent under the
National Housing Co-Investment Fund. CMHC had made financial
commitments towards the creation of 7,960 units of affordable housing
committing to charge an average maximum of 72% of 30% of median
household income under the Rental Construction Financing Initiative.
Fourth, CMHC’s shift of funding towards capital contributions over affordability supports means that the benefits of current spending are spread
over the life of the project. Even over their lifetime, capital contribution
programs secure smaller reductions, with the National Housing Co-
Investment fund securing an average of $0.38 in discounts relative to market
median rents for each dollar of total government capital contributions.
Finally, we project that in the absence of additional spending the number of
households in housing need would have increased to approximately
1.8 million households with a $9.3 billion aggregate affordability gap by
2025-26. Over the period of 2021 to 2025, incremental CMHC spending
averages 16% of the projected affordability gap and about $63/month per
household in housing need.

Federal Program Spending on Housing Affordability in 2021
3
1. Introduction
This report is intended to help parliamentarians understand federal program
spending on housing affordability. It provides an update on our 2019 report,
Federal Program Spending on Housing Affordability.
Since 2019, funding allocated to address housing affordability over the term
of Canada’s National Housing Strategy has increased by $672 million each
year (23%) to an average of $3.7 billion each year. Funding for Canada
Mortgage and Housing Corporation’s programs to address housing affordability has increased by $540 million per year (19%) to $3.3 billion per
year. Funding for Employment and Social Development Canada’s programs to address homelessness has increased by $132 million per year (59%) to
$357 million. This new funding is split between new and existing programs.
Changes to Planned Spending from 2018-19 to 2027-28
($ million each year) 2019 Report
Additional
Planned
Spending
2021 Update % Change
CMHC 2,770 540 3,310 19%
Assistance for Housing Needs 2,038 401 2,439 20%
Financing for Housing 627 138 765 22%
Housing Expertise and Capacity Development 105 0 105 0%
ESDC 225 132 357 59%
Homelessness 225 132 357 59%
Total 2,995 672 3,666 22%
Source: PBO based on data from CMHC and ESDC
Like our 2019 report, this report excludes tax expenditures. Estimates of tax
expenditures related to housing can be found in the Department of Finance’s Report on Federal Tax Expenditures.
This report also excludes Indigenous-specific programs administered by
Indigenous Services Canada and Crown-Indigenous Relations and Northern
Affairs Canada. An update regarding federal spending on Indigenous off-
reserve housing and the indigenous housing strategies was presented in our
recent report Urban, Rural, and Northern Indigenous Housing. That report
noted that $179 million per year was explicitly allocated for indigenous
housing in urban, rural and northern areas over the term of Canada’s National Housing Strategy. However, since that time $42 million per year in
additional funding has been announced for the Missing and Murdered
Table 1-1
Federal Program Spending on Housing Affordability in 2021
4
Indigenous Women and Girls Shelter Initiative. This announcement increases
funding explicitly allocated for indigenous housing in urban, rural and
northern areas to an average of $221 million per year (6% of planned
spending).
This report includes all CMHC planned and actual spending under its
Assisted Housing business segment except for two programs unrelated to
housing affordability; specifically, the Canada Emergency Commercial Rent
Assistance program and support for Granville Island.
Federal Program Spending on Housing Affordability in 2021
5
2. Spending on Housing Affordability
2.1. Spending by Announcement
Canada Mortgage and Housing Corporation
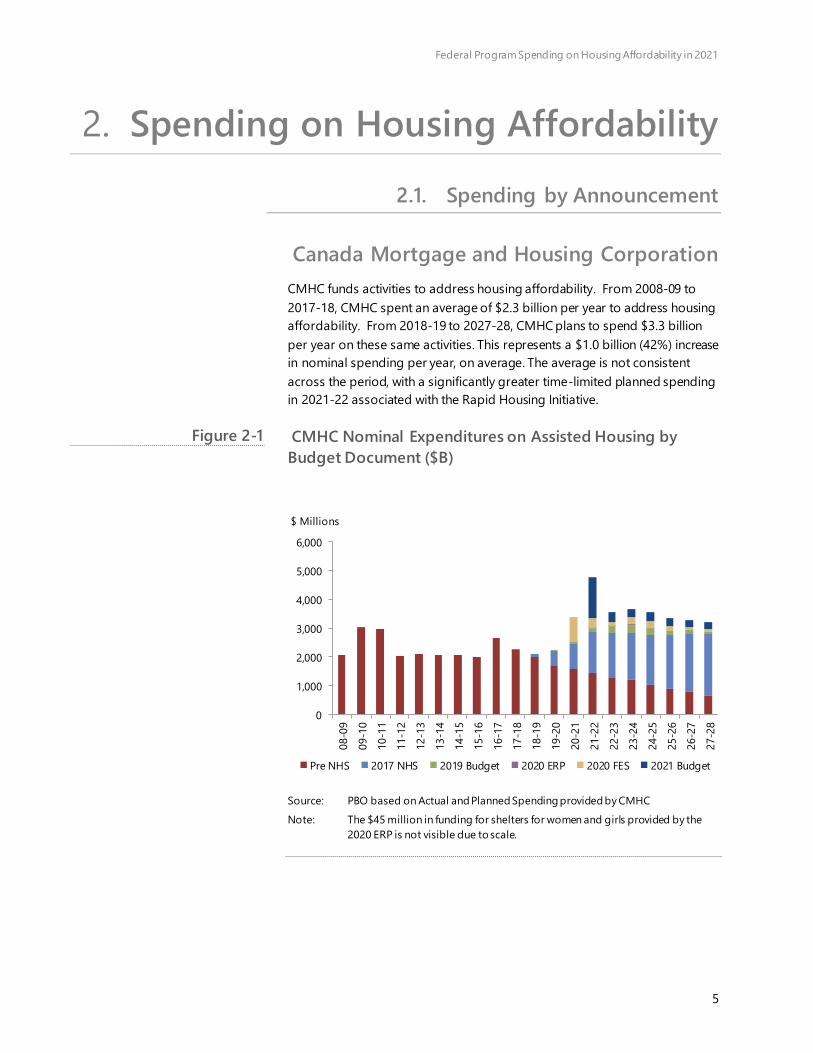
CMHC funds activities to address housing affordability. From 2008-09 to
2017-18, CMHC spent an average of $2.3 billion per year to address housing
affordability. From 2018-19 to 2027-28, CMHC plans to spend $3.3 billion
per year on these same activities. This represents a $1.0 billion (42%) increase
in nominal spending per year, on average. The average is not consistent
across the period, with a significantly greater time-limited planned spending
in 2021-22 associated with the Rapid Housing Initiative.
CMHC Nominal Expenditures on Assisted Housing by
Budget Document ($B)
Source: PBO based on Actual and Planned Spending provided by CMHC
Note: The $45 million in funding for shelters for women and girls provided by the
2020 ERP is not visible due to scale.
0
1,000
2,000
3,000
4,000
5,000
6,000
08-0
9
09-1
0
10-1
1
11-1
2
12-1
3
13-1
4
14-1
5
15-1
6
16-1
7
17-1
8
18-1
9
19-2
0
20-2
1
21-2
2
22-2
3
23-2
4
24-2
5
25-2
6
26-2
7
27-2
8
$ Millions
Pre NHS 2017 NHS 2019 Budget 2020 ERP 2020 FES 2021 Budget
Figure 2-1
Federal Program Spending on Housing Affordability in 2021
6
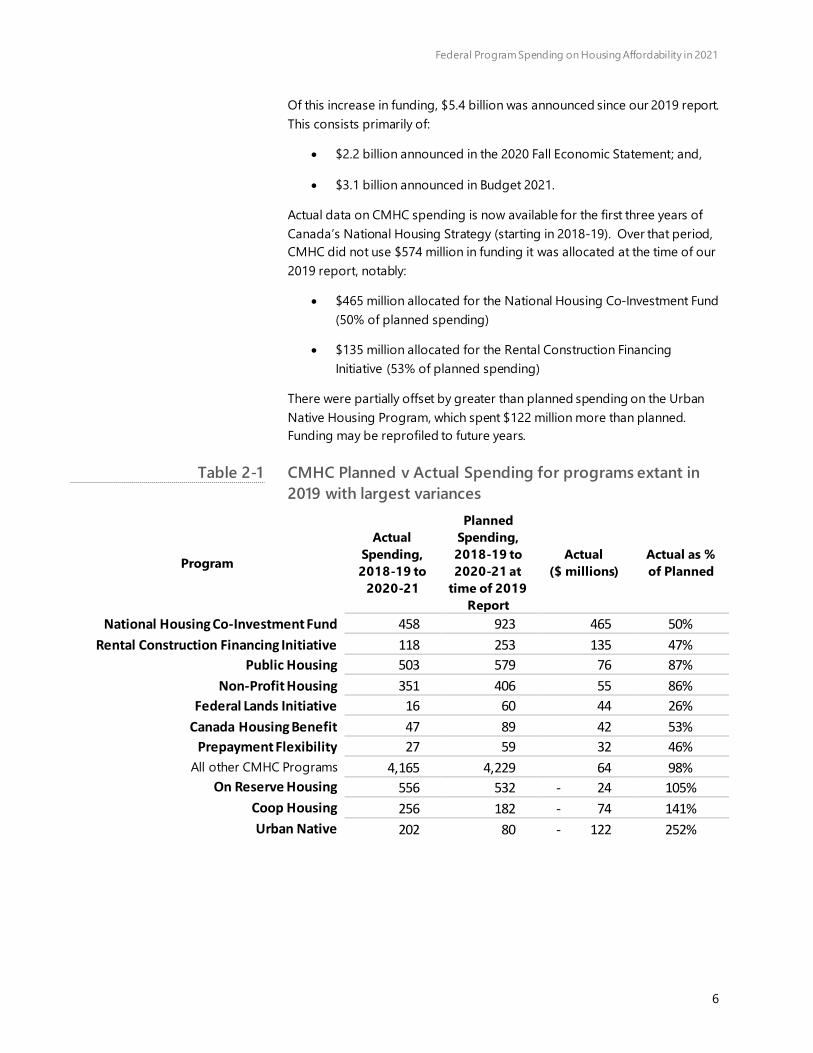
Of this increase in funding, $5.4 billion was announced since our 2019 report.
This consists primarily of:
• $2.2 billion announced in the 2020 Fall Economic Statement; and,
• $3.1 billion announced in Budget 2021.
Actual data on CMHC spending is now available for the first three years of
Canada’s National Housing Strategy (starting in 2018-19). Over that period,
CMHC did not use $574 million in funding it was allocated at the time of our
2019 report, notably:
• $465 million allocated for the National Housing Co-Investment Fund
(50% of planned spending)
• $135 million allocated for the Rental Construction Financing
Initiative (53% of planned spending)
There were partially offset by greater than planned spending on the Urban
Native Housing Program, which spent $122 million more than planned.
Funding may be reprofiled to future years.
CMHC Planned v Actual Spending for programs extant in
2019 with largest variances
Program
Actual
Spending,
2018-19 to
2020-21
Planned
Spending,
2018-19 to
2020-21 at
time of 2019
Report
Actual
($ millions)
Actual as %
of Planned
National Housing Co-Investment Fund 458 923 465 50%
Rental Construction Financing Initiative 118 253 135 47%
Public Housing 503 579 76 87%
Non-Profit Housing 351 406 55 86%
Federal Lands Initiative 16 60 44 26%
Canada Housing Benefit 47 89 42 53%
Prepayment Flexibility 27 59 32 46%
All other CMHC Programs 4,165 4,229 64 98%
On Reserve Housing 556 532 - 24 105%
Coop Housing 256 182 - 74 141%
Urban Native 202 80 - 122 252%
Table 2-1
Federal Program Spending on Housing Affordability in 2021
7
Employment and Social Development Canada
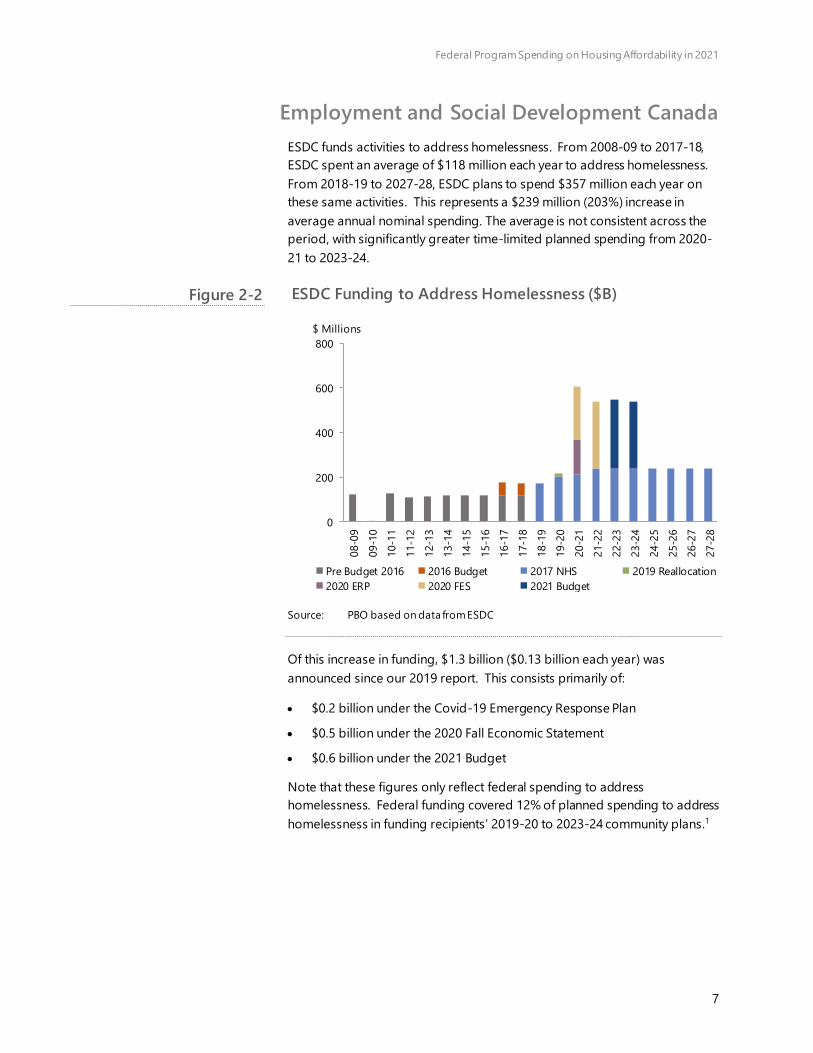
ESDC funds activities to address homelessness. From 2008-09 to 2017-18,
ESDC spent an average of $118 million each year to address homelessness.
From 2018-19 to 2027-28, ESDC plans to spend $357 million each year on
these same activities. This represents a $239 million (203%) increase in
average annual nominal spending. The average is not consistent across the
period, with significantly greater time-limited planned spending from 2020-
21 to 2023-24.
ESDC Funding to Address Homelessness ($B)
Source: PBO based on data from ESDC
Of this increase in funding, $1.3 billion ($0.13 billion each year) was
announced since our 2019 report. This consists primarily of:
• $0.2 billion under the Covid-19 Emergency Response Plan
• $0.5 billion under the 2020 Fall Economic Statement
• $0.6 billion under the 2021 Budget
Note that these figures only reflect federal spending to address
homelessness. Federal funding covered 12% of planned spending to address
homelessness in funding recipients’ 2019-20 to 2023-24 community plans.1
0
200
400
600
80008-0
9
09-1
0
10-1
1
11-1
2
12-1
3
13-1
4
14-1
5
15-1
6
16-1
7
17-1
8
18-1
9
19-2
0
20-2
1
21-2
2
22-2
3
23-2
4
24-2
5
25-2
6
26-2
7
27-2
8
$ Millions
Pre Budget 2016 2016 Budget 2017 NHS 2019 Reallocation
2020 ERP 2020 FES 2021 Budget
Figure 2-2
Federal Program Spending on Housing Affordability in 2021
8
2.2. Spending by Core Responsibility
All ESDC funding is similarly allocated to support programs which address
homelessness. However, the 2017 National Housing Strategy marked a
significant shift in how CMHC support will be allocated between CMHC’s core responsibilities.
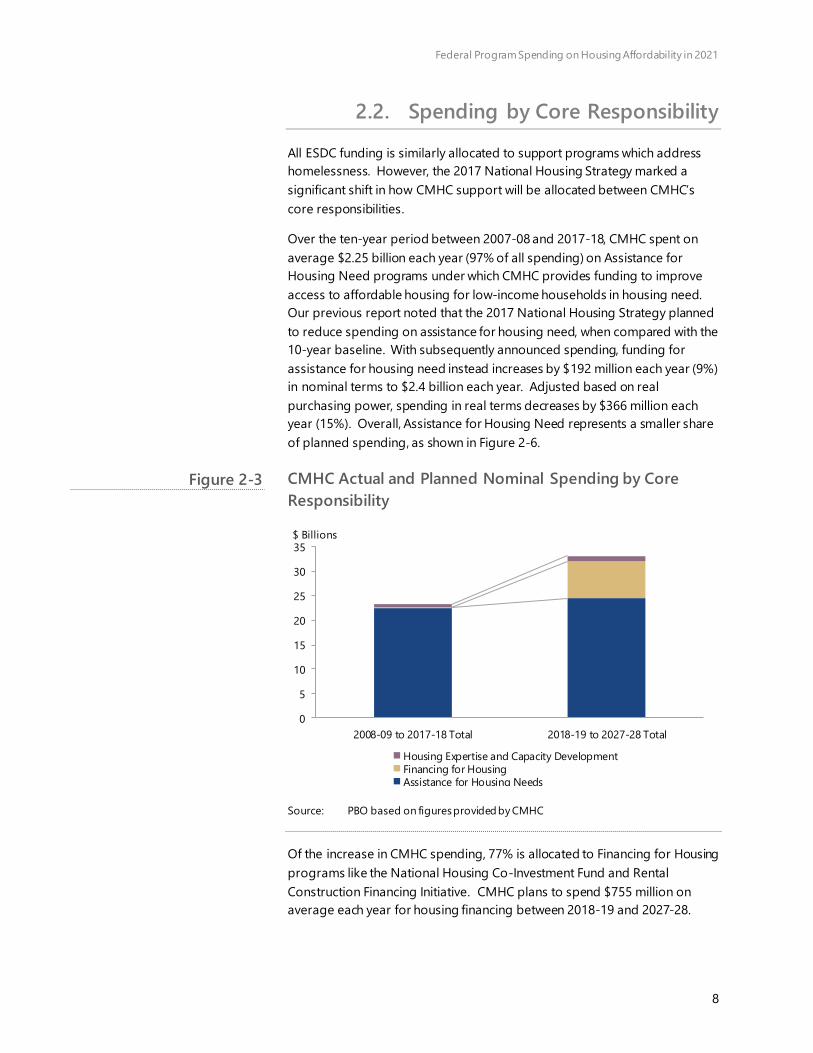
Over the ten-year period between 2007-08 and 2017-18, CMHC spent on
average $2.25 billion each year (97% of all spending) on Assistance for
Housing Need programs under which CMHC provides funding to improve
access to affordable housing for low-income households in housing need.
Our previous report noted that the 2017 National Housing Strategy planned
to reduce spending on assistance for housing need, when compared with the
10-year baseline. With subsequently announced spending, funding for
assistance for housing need instead increases by $192 million each year (9%)
in nominal terms to $2.4 billion each year. Adjusted based on real
purchasing power, spending in real terms decreases by $366 million each
year (15%). Overall, Assistance for Housing Need represents a smaller share
of planned spending, as shown in Figure 2-6.
CMHC Actual and Planned Nominal Spending by Core
Responsibility
Source: PBO based on figures provided by CMHC
Of the increase in CMHC spending, 77% is allocated to Financing for Housing
programs like the National Housing Co-Investment Fund and Rental
Construction Financing Initiative. CMHC plans to spend $755 million on
average each year for housing financing between 2018-19 and 2027-28.
0
5
10
15
20
25
30
35
2008-09 to 2017-18 Total 2018-19 to 2027-28 Total
$ Billions
Housing Expertise and Capacity DevelopmentFinancing for HousingAssistance for Housing Needs
Figure 2-3
Federal Program Spending on Housing Affordability in 2021
9
Across its core responsibilities, CMHC is prioritizing capital contributions to
support the creation of new affordable housing. Compared with other
program models which provide in-year support, like the Canada Housing
Benefit, this spreads the benefits of current spending over the coming
decades, providing a lesser but longer-term level of support. As highlighted
in our report on Urban, Rural, and Northern Indigenous Housing, under the
key National Housing Co-Investment Fund, Canada has secured contractual
commitments averaging $0.38 in discounts relative to market median rents
for each dollar of total government capital contributions.
Federal Program Spending on Housing Affordability in 2021
10
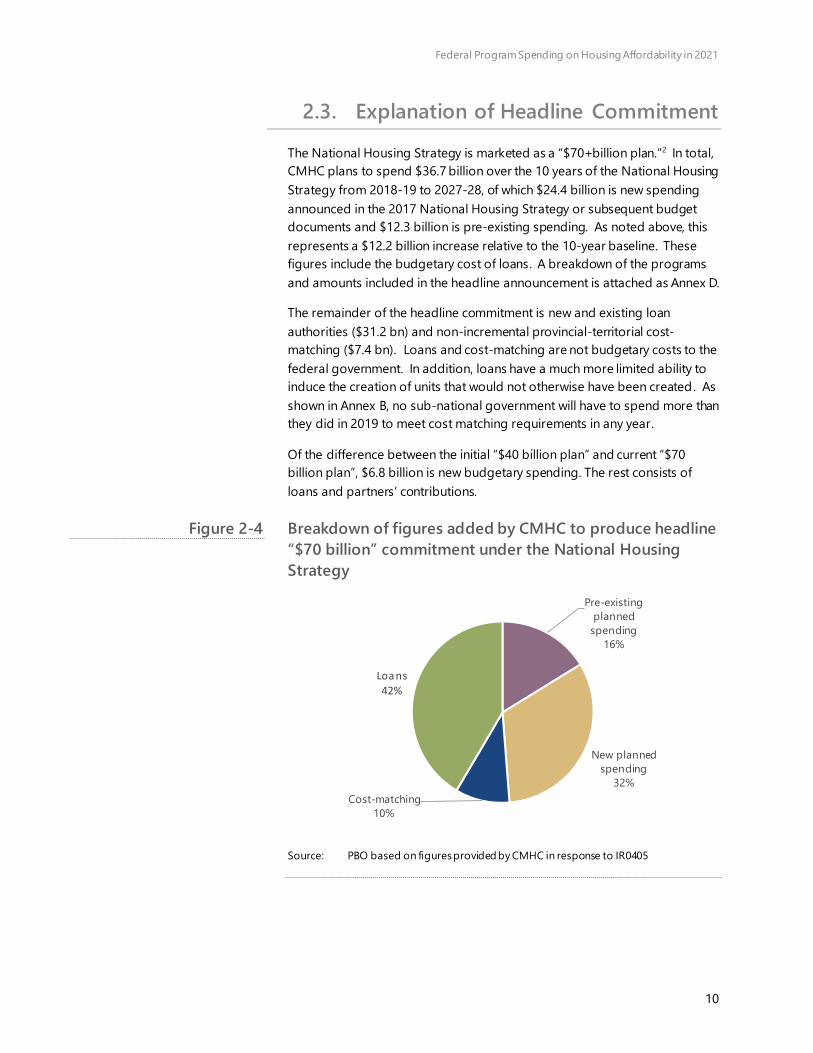
2.3. Explanation of Headline Commitment The National Housing Strategy is marketed as a “$70+billion plan.”2 In total,
CMHC plans to spend $36.7 billion over the 10 years of the National Housing
Strategy from 2018-19 to 2027-28, of which $24.4 billion is new spending
announced in the 2017 National Housing Strategy or subsequent budget
documents and $12.3 billion is pre-existing spending. As noted above, this
represents a $12.2 billion increase relative to the 10-year baseline. These
figures include the budgetary cost of loans. A breakdown of the programs
and amounts included in the headline announcement is attached as Annex D.
The remainder of the headline commitment is new and existing loan
authorities ($31.2 bn) and non-incremental provincial-territorial cost-
matching ($7.4 bn). Loans and cost-matching are not budgetary costs to the
federal government. In addition, loans have a much more limited ability to
induce the creation of units that would not otherwise have been created. As
shown in Annex B, no sub-national government will have to spend more than
they did in 2019 to meet cost matching requirements in any year.
Of the difference between the initial “$40 billion plan” and current “$70 billion plan”, $6.8 billion is new budgetary spending. The rest consists of
loans and partners’ contributions.
Breakdown of figures added by CMHC to produce headline
“$70 billion” commitment under the National Housing
Strategy
Source: PBO based on figures provided by CMHC in response to IR0405
Pre-existing planned spending
16%
New planned spending
32%
Cost-matching10%
Loans
42%
Figure 2-4
Federal Program Spending on Housing Affordability in 2021
11
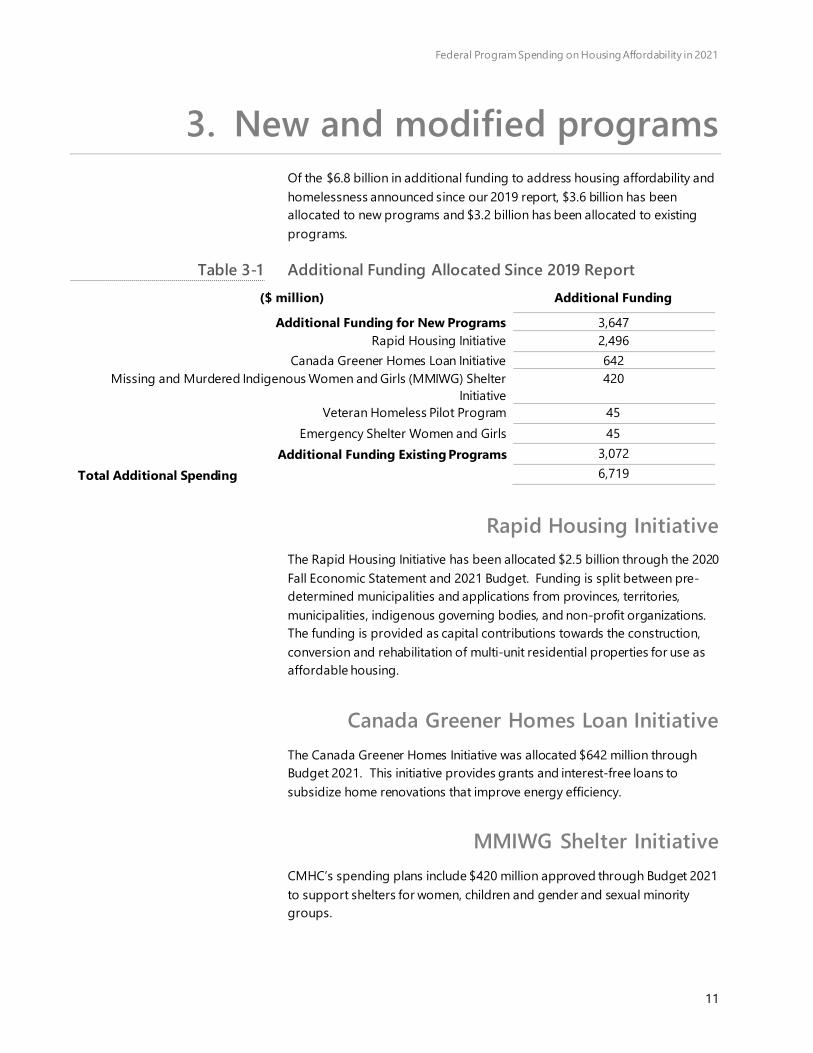
3. New and modified programs Of the $6.8 billion in additional funding to address housing affordability and
homelessness announced since our 2019 report, $3.6 billion has been
allocated to new programs and $3.2 billion has been allocated to existing
programs.
Additional Funding Allocated Since 2019 Report
($ million) Additional Funding
Additional Funding for New Programs 3,647
Rapid Housing Initiative 2,496
Canada Greener Homes Loan Initiative 642
Missing and Murdered Indigenous Women and Girls (MMIWG) Shelter
Initiative
420
Veteran Homeless Pilot Program 45
Emergency Shelter Women and Girls 45
Additional Funding Existing Programs 3,072
Total Additional Spending 6,719
Rapid Housing Initiative
The Rapid Housing Initiative has been allocated $2.5 billion through the 2020
Fall Economic Statement and 2021 Budget. Funding is split between pre-
determined municipalities and applications from provinces, territories,
municipalities, indigenous governing bodies, and non-profit organizations.
The funding is provided as capital contributions towards the construction,
conversion and rehabilitation of multi-unit residential properties for use as
affordable housing.
Canada Greener Homes Loan Initiative
The Canada Greener Homes Initiative was allocated $642 million through
Budget 2021. This initiative provides grants and interest-free loans to
subsidize home renovations that improve energy efficiency.
MMIWG Shelter Initiative
CMHC’s spending plans include $420 million approved through Budget 2021
to support shelters for women, children and gender and sexual minority
groups.
Table 3-1
Federal Program Spending on Housing Affordability in 2021
12
Addressing Veteran Homelessness
Budget 2021 commits $45 million for a new ESDC pilot program to address
veteran homelessness through rent supplements and support services.3
Emergency Shelter for Women and Girls
The 2020 Covid-19 Response plan included $45 million to support women’s shelters and sexual assault centres.
First-Time Home Buyer’s Incentive
The First-Time Home Buyer’s Incentive was originally outlined in the 2019 Fall
Economic Statement. Under this program, CMHC covers 5% or 10% of the
cost of purchasing a home in exchange for a corresponding share of the
value of the home.4
While included in our 2019 Report, this incentive was modified by the 2020
Fall Economic Statement. The modifications apply only to Toronto,
Vancouver and Victoria, and allow buyers in those markets to use the
incentive to purchase a home up to 4.5 times their household income, rather
than being limited to 4 times their household income. The modifications
also allow buyers in those markets to use the incentive if their income is
under $150,000 per year. No additional funding was allocated for costs
arising from these changes.5

Federal Program Spending on Housing Affordability in 2021
13
Appendix A: Spending in Context
With additional funding announced since our 2019 report, the real
purchasing power of federal spending is now higher over the term of
Canada’s National Housing Strategy from 2018-19 to 2027-28.
Real Spending ($ Millions)
Pre-NHS
10-year
Average
NHS
10-year
average 2018-1
9
2019-2
0
2020-2
1
2021-2
2
2022-2
3
2023-2
4
2024-2
5
2025-2
6
2026-2
7
2027-2
8
CMHC Spending on
Housing Affordability 2,326 3,310 2,086 2,216 3,375 4,785 3,549 3,663 3,543 3,366 3,299 3,213
ESDC Spending to
Address Homelessness 118 357 173 218 607 536 546 540 237 237 237 237
Apt. construction price
index 92 117 104 109 111 121 115 118 120 123 125 128
CMHC Real Spending 2,533 2,824 2,010 2,040 3,040 3,968 3,081 3,113 2,949 2,746 2,638 2,520
ESDC Real Spending 129 304 167 201 547 445 474 459 197 193 190 186
Figure A-1

Federal Program Spending on Housing Affordability in 2021
14
Without incremental spending, we would have expected the affordability
gap6 and number of households in core housing need to continue to
increase as shelter costs rise faster than household incomes. Over the period
of 2021 to 2025, incremental CMHC spending averages 16% of the
affordability gap and about $63/month per household in housing need. The
share of the affordability gap actually addressed would be substantially less
than incremental spending as a share of that gap because capital
contribution programs provide smaller reductions in rent per dollar spent
and spread the benefits of current spending over the coming decades.
Spending Relative to Affordability Gap ($ Millions)
2016-1
7
2017-1
8
2018-1
9
2019-2
0
2020-2
1
2021-2
2
2022-2
3
2023-2
4
2024-2
5
2025-2
6
Without
accounting
for policy changes
Affordability Gap
($ billion per year) 6.6 6.9 7.2 7.5 7.5 7.9 8.4 8.7 9.0 9.3
HHs in Housing Need
(millions) 1.7 1.7 1.7 1.7 1.7 1.8 1.8 1.8 1.8 1.8
Incremental
Spending
Relative to
2016
($ billion per year) - -0.4 -0.6 -0.4 1.1 2.5 1.3 1.4 0.9 0.8
As share of Affordability
Gap (%) 0% -6% -8% -6% 15% 31% 15% 16% 10% 8%
Per HH in Housing Need ($/month/household)
0 -20 -28 -20 55 116 58 62 42 34
Figure A-2

Federal Program Spending on Housing Affordability in 2021
15
Appendix B: Bilateral Agreements
Since our 2019 report, bilateral agreements have been signed with all
provinces setting out the funding they will receive and the baseline units they
commit to protecting.
Funding by Stream
Over the term of Canada’s National Housing Strategy, transfers to the provinces and territories under the pre-existing social housing agreements
decline, but this is offset by increasing funding under the Housing
Partnership Framework. Over time an increasing share of funding is allocated
to the Canada Community Housing Initiative and Canada Housing Benefit.
Funding Allocated Under Bilateral Agreements by Stream
and Fiscal Year
Source: Bilateral Agreements Note: Not all provinces and territories have been allocated their funding under the
Canada Housing Benefit. The funding profile for Provincial Priorities from 22-23 onwards was assumed to be constant for those provinces where the profile
beyond that year was not specified in the bilateral agreement.
0
200
400
600
800
1,000
1,200
1,400
1,600
19-20 20-21 21-22 22-23 23-24 24-25 25-26 26-27 27-28
$ Millions
Provicial Priorities Canada Community Housing
Canada Housing Benefit Northern Housing
Figure B-1
Federal Program Spending on Housing Affordability in 2021
16
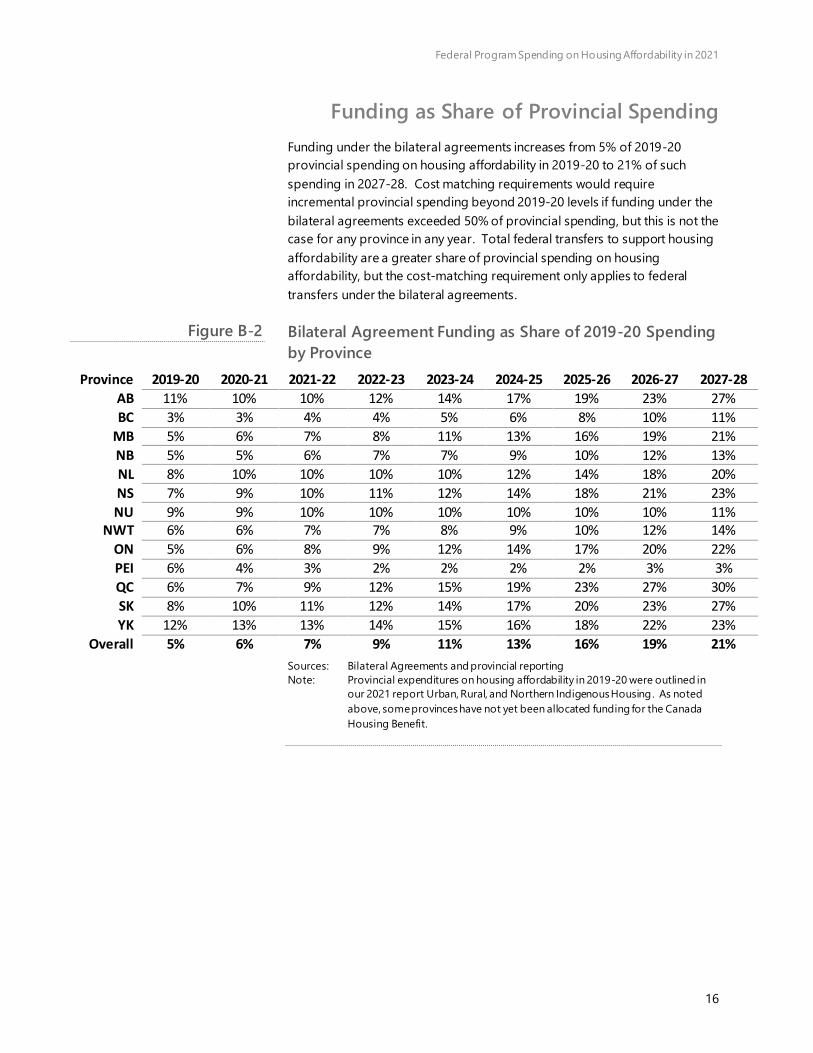
Funding as Share of Provincial Spending
Funding under the bilateral agreements increases from 5% of 2019-20
provincial spending on housing affordability in 2019-20 to 21% of such
spending in 2027-28. Cost matching requirements would require
incremental provincial spending beyond 2019-20 levels if funding under the
bilateral agreements exceeded 50% of provincial spending, but this is not the
case for any province in any year. Total federal transfers to support housing
affordability are a greater share of provincial spending on housing
affordability, but the cost-matching requirement only applies to federal
transfers under the bilateral agreements.
Bilateral Agreement Funding as Share of 2019-20 Spending
by Province
Province 2019-20 2020-21 2021-22 2022-23 2023-24 2024-25 2025-26 2026-27 2027-28
AB 11% 10% 10% 12% 14% 17% 19% 23% 27%
BC 3% 3% 4% 4% 5% 6% 8% 10% 11%
MB 5% 6% 7% 8% 11% 13% 16% 19% 21%
NB 5% 5% 6% 7% 7% 9% 10% 12% 13%
NL 8% 10% 10% 10% 10% 12% 14% 18% 20%
NS 7% 9% 10% 11% 12% 14% 18% 21% 23%
NU 9% 9% 10% 10% 10% 10% 10% 10% 11%
NWT 6% 6% 7% 7% 8% 9% 10% 12% 14%
ON 5% 6% 8% 9% 12% 14% 17% 20% 22%
PEI 6% 4% 3% 2% 2% 2% 2% 3% 3%
QC 6% 7% 9% 12% 15% 19% 23% 27% 30%
SK 8% 10% 11% 12% 14% 17% 20% 23% 27%
YK 12% 13% 13% 14% 15% 16% 18% 22% 23%
Overall 5% 6% 7% 9% 11% 13% 16% 19% 21%
Sources: Bilateral Agreements and provincial reporting Note: Provincial expenditures on housing affordability in 2019-20 were outlined in
our 2021 report Urban, Rural, and Northern Indigenous Housing. As noted
above, some provinces have not yet been allocated funding for the Canada
Housing Benefit.
Figure B-2
Federal Program Spending on Housing Affordability in 2021
17
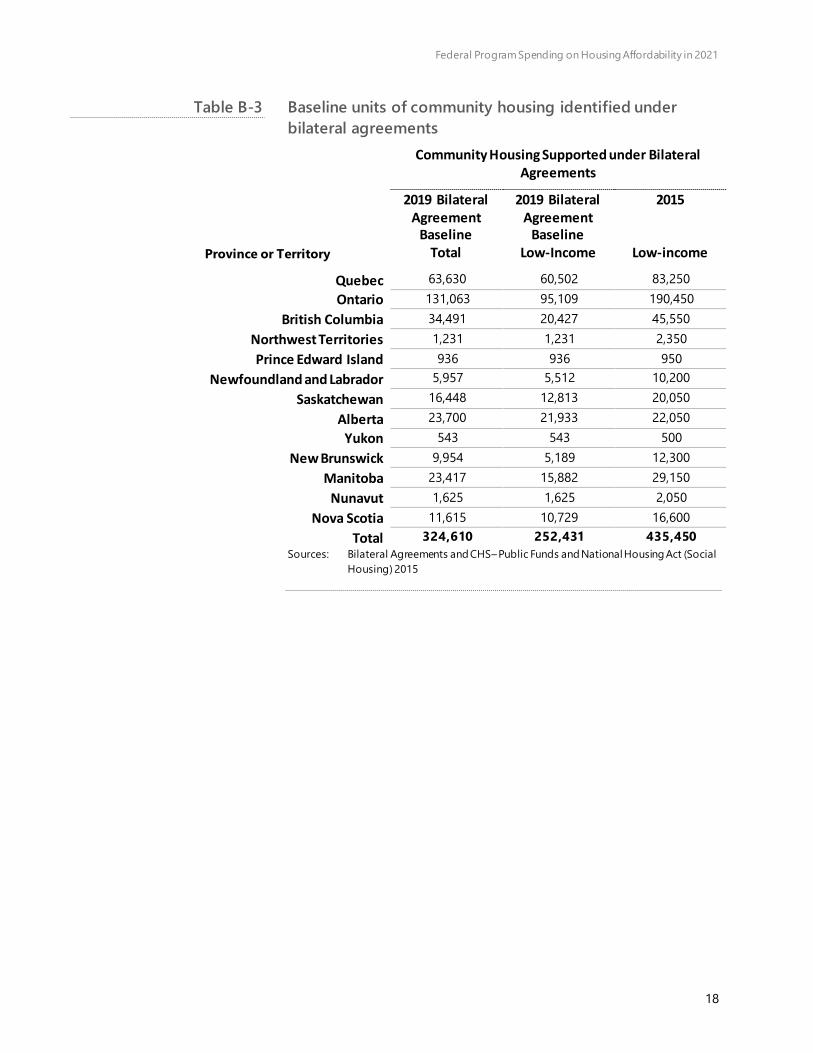
Baseline Units and Units Created
Canada’s National Housing Strategy set the goals of protecting 330,000 units of community housing and adding 50,000 units over the 10 years of Canada’s National housing Strategy.
In 2015, CMHC reported assisting 435,450 households in social housing
through its social housing agreements with provinces, which had fallen to
260,000 households assisted under those agreements in 2018 as operating
agreements expired.7 Under the bilateral agreements signed between 2019
and 2020, provinces identified 324,610 baseline units of community housing
that they committed to maintaining, of which 252,431 were to remain
targeted to low-income households. On a net basis, CMHC reports
supporting 183,019 fewer low-income households than in 2015, a reduction
of 42% over 4 years. This reflects a mixture of units being converted to
market-rate units and being off-loaded to sub-national governments. In
Ontario, for example, the FAO reports that municipalities are required to
maintain social housing units, but 83,000 of those units were at risk of being
converted to market-rate units as funding contracts with the federal
government expire.
Federal Program Spending on Housing Affordability in 2021
18
Baseline units of community housing identified under
bilateral agreements
Community Housing Supported under Bilateral
Agreements
Province or Territory
2019 Bilateral
Agreement
Baseline
Total
2019 Bilateral
Agreement
Baseline
Low-Income
2015
Low-income
Quebec 63,630 60,502 83,250
Ontario 131,063 95,109 190,450
British Columbia 34,491 20,427 45,550
Northwest Territories 1,231 1,231 2,350
Prince Edward Island 936 936 950
Newfoundland and Labrador 5,957 5,512 10,200
Saskatchewan 16,448 12,813 20,050
Alberta 23,700 21,933 22,050
Yukon 543 543 500
New Brunswick 9,954 5,189 12,300
Manitoba 23,417 15,882 29,150
Nunavut 1,625 1,625 2,050
Nova Scotia 11,615 10,729 16,600
Total 324,610 252,431 435,450
Sources: Bilateral Agreements and CHS– Public Funds and National Housing Act (Social
Housing) 2015
Table B-3
Federal Program Spending on Housing Affordability in 2021
19
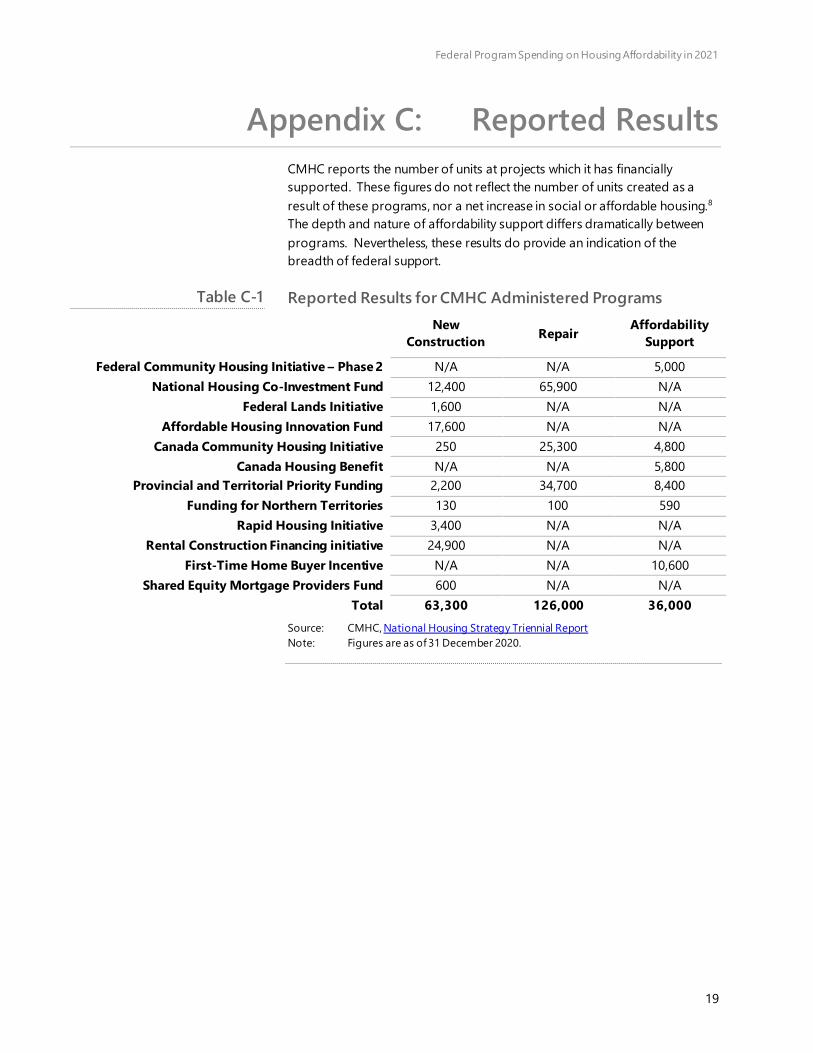
Appendix C: Reported Results
CMHC reports the number of units at projects which it has financially
supported. These figures do not reflect the number of units created as a
result of these programs, nor a net increase in social or affordable housing.8
The depth and nature of affordability support differs dramatically between
programs. Nevertheless, these results do provide an indication of the
breadth of federal support.
Reported Results for CMHC Administered Programs
New
Construction Repair
Affordability
Support
Federal Community Housing Initiative – Phase 2 N/A N/A 5,000
National Housing Co-Investment Fund 12,400 65,900 N/A
Federal Lands Initiative 1,600 N/A N/A
Affordable Housing Innovation Fund 17,600 N/A N/A
Canada Community Housing Initiative 250 25,300 4,800
Canada Housing Benefit N/A N/A 5,800
Provincial and Territorial Priority Funding 2,200 34,700 8,400
Funding for Northern Territories 130 100 590
Rapid Housing Initiative 3,400 N/A N/A
Rental Construction Financing initiative 24,900 N/A N/A
First-Time Home Buyer Incentive N/A N/A 10,600
Shared Equity Mortgage Providers Fund 600 N/A N/A
Total 63,300 126,000 36,000
Source: CMHC, National Housing Strategy Triennial Report
Note: Figures are as of 31 December 2020.
Table C-1

Federal Program Spending on Housing Affordability in 2021
20
The following tables present the loans, contributions, number of units,
number of affordable units, and average depth of affordability for projects
funded under the National Housing Co-Investment Fund and Rental
Construction Financing Initiative. These results are lower than those reported
above because they only include projects which had financial commitments,
and only those projects with financial commitments as of 30 October 2020.
Financial Commitments for New Construction projects
under the National Housing Co-Investment Fund
Loans
($ millions)
Contributions
($ millions) Units in project
Units with
affordability
commitments
Average Affordability
Commitment
(% of median
market rent)
Alberta 16 9 216 139 70
British Columbia 39 92 1,941 1,866 63
Manitoba 45 13 282 143 60
New Brunswick 7 2 68 55 38
Nova Scotia 0 6 74 74 -
Ontario 249 95 2,309 1,632 57
Prince Edward Island 31 2 176 120 37
Quebec 0 9 195 176 39
Saskatchewan 1 1 20 20 58
Yukon 5 9 45 45 -
Total 394 237 5,326 4,270 52
Table C-2

Federal Program Spending on Housing Affordability in 2021
21
Financial Commitments for Repair and Rehabilitiation
projects under the National Housing Co-Investment Fund
Loans
($ millions)
Contributions
($ millions) Units in project
Units with
affordability
commitments
Average
Affordability
Commitment
(% of median
market rent)
Alberta - 0 33 33 75
British Columbia - 0 20 12 70
Manitoba - 3 404 404 -
New Brunswick - 1 70 70 17
Nunavut 6 2 71 65 24
Ontario 814 528 58,898 53,575 69
Grand Total 820 536 59,496 54,159 43 Note: Toronto Community Housing Master Application accounts for the repair of
53,538 affordable housing units. Master applications relate to a portfolio of housing and there are not necessarily plans to repair each unit within that
portfolio.
Financial Commitments for New Construction under the
Rental Construction Financing Initiative
Loans
($ millions) Units in project
Units with
affordability
commitments
Average
Affordability Commitment (%
of 30% of median
household
income)
Alberta 190 1,006 622 70%
British Columbia 998 2,777 1,939 73%
Manitoba 86 365 376 70%
Nova Scotia 23 121 121 70%
Ontario 1,762 5,845 3,710 73%
Prince Edward Island 29 130 90 70%
Quebec 334 1,345 1,015 72%
Yukon 22 87 87 70%
Grand Total 190 11,676 7,960 72%
Table C-3
Table C-4

Federal Program Spending on Housing Affordability in 2021
22
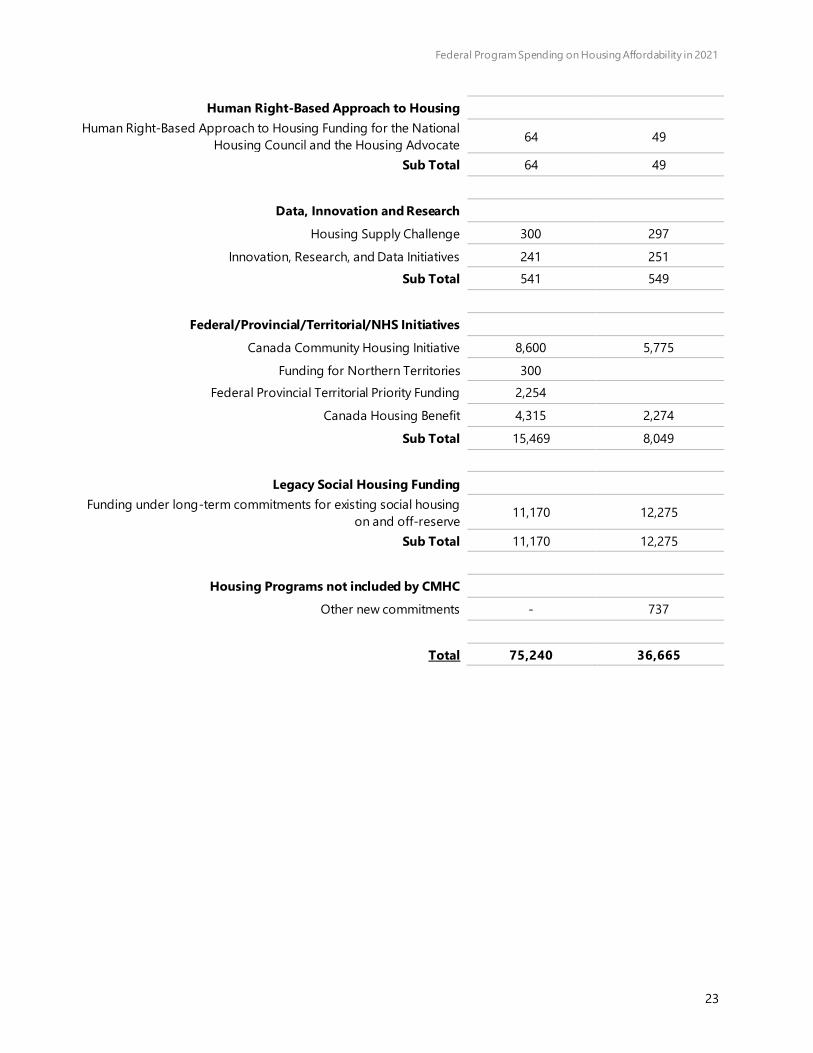
Appendix D: Breakdown of Headline
Commitment
Comparison of CMHC breakdown of headline
committement and actual and planned budgetary
expenditures by program
CMHC Breakdown
of Announced
Amount
($ millions)
CMHC Actual and
Planned Budgetary
Expenditures
2018-19 to 2027-
28
($ millions)
New Construction and Modernized Housing Supply
Affordable Housing Innovation Fund 808 723
Rental Construction Financing Initiative 25,750 1,621
National Housing Co-Investment Fund 13,174 5,117
Rapid Housing Initiative 2,500 2,496
Federal Lands Initiative 202 156
Missing and Murdered Indigenous Women and Girls Funding 420 420
Sub Total 42,854 10,533
Support for the Community Housing Sector
Federal Community Housing Initiative 618 625
Community Based Tenant Initiative 10 75
Community Housing Transformation Centre / Sector Transformation Fund
64
Sub Total 692 700
Reaching Home – Canada's Homelessness Strategy
Reaching Home 3,100 3,524
Sub Total 3,100 3,524
Improved Homeownership Options
First-Time Home Buyers Incentive 1,250 250
Shared Equity Mortgage Providers Fund 100
Sub Total 1,350 250
Table D-1
Federal Program Spending on Housing Affordability in 2021
23
Human Right-Based Approach to Housing
Human Right-Based Approach to Housing Funding for the National
Housing Council and the Housing Advocate 64 49
Sub Total 64 49
Data, Innovation and Research
Housing Supply Challenge 300 297
Innovation, Research, and Data Initiatives 241 251
Sub Total 541 549
Federal/Provincial/Territorial/NHS Initiatives
Canada Community Housing Initiative 8,600 5,775
Funding for Northern Territories 300
Federal Provincial Territorial Priority Funding 2,254
Canada Housing Benefit 4,315 2,274
Sub Total 15,469 8,049
Legacy Social Housing Funding
Funding under long-term commitments for existing social housing
on and off-reserve 11,170 12,275
Sub Total 11,170 12,275
Housing Programs not included by CMHC
Other new commitments - 737
Total 75,240 36,665
Federal Program Spending on Housing Affordability in 2021
24
Notes
1 The community plans did not account for supplemental funding provided since 2019.
Community plans were not available for Quebec and Nunavut.
2 CMHC, Canada’s National Housing Strategy.
3 Finance, Budget 2021.
4 CMHC, First-Time Home Buyer’s Incentive.
5 Finance, 2020 Fall Economic Statement.
6 For definition and methodology, see PBO, Urban, Rural, and Northern Indigenous
Housing.
We used the 2016 census microdata to estimate the average affordability gap. For households in adequate and suitable housing, the shelter cost was taken from the microdata. For households in inadequate or unsuitable housing, the shelter cost was replaced by the average rent of an adequate-sized unit in the same geographic area.
The rent data were provided by CHMC.
Shelter cost and household income have been projected for each observation in the microdata set. To project the shelter cost, the PBO used the annual growth rate in median renter shelter costs between the 2006 Census and 2016 Census. To project household incomes, we used the household personal income projection from our
economic model.
7 CMHC, CHS Public Funds and National Housing Act (Social Housing); CMHC 2019 Q4
Assisted Housing Business Supplement.
8 The design of these programs makes it difficult to draw a causal link between federal funding and the creation of any particular housing unit. Federal contributions represent only part of total contributions to a project, meaning the federal
government is essentially allowing provinces and territories funding to be stretched a bit further, rather than being causally responsible for all units created . Some programs with less strict affordability criteria that allow market-rate housing to be funded, like the Rental Construction Financing Initiative, may also be supporting private market activity that would have occurred anyways, or may be crowding out
private markets activity that would have otherwise occurred. The depth of support also varies dramatically between programs, with some units having no affordability commitment or receiving only minor repairs while others provide wrap-around
supports to homeless individuals or rents capped at 25% of tenant’s incomes.
The number of social and affordable housing units is tracked by the Census, new
Statistics Canada “Canada Housing Survey”, and new CMHC “Social and Affordable Housing Survey”. However, due to discontinuities and reporting lags, it is not yet
possible to determine whether the number of social and affordable housing units has
increased or decreased since 2017.