Embed Size (px)
Citation preview

Federalism: India’s Power Unleashed
IMA IndiaJanuary 2018
Extract

Lens 1: Income and expenditure

10 states account for 70% of national GDP: this share has not changed in the past ten years
4.96 , 15.2%
2.97 , 9.1%
8.1%
7.5%7.2%
6.0%
4.7%
4.5%
4.2%
3.9%
10 largest and smallest contributors to national GDP in 2006-7 and 2016-17 18.97 , 14.1%
12.15 , 9.0%
8.2%7.3%
7.0%
6.0%
5.0%
4.6%
4.3%4.1%
MaharashtraTNUP
Karnataka
Gujarat
WB
Rajasthan
AP
Telangana
Kerala
MaharashtraUPTN
GujaratWB
Karnataka
AP
Rajasthan
KeralaMP
J&K, HP, Goa, Tripura, Meghalaya, Nagaland, Manipur, Arunachal, Mizoram,
Sikkim
Numbers denote gross state domestic product (Rs trillion, rolling average of three years) and the state’s contribution to the national GDP3%

Size of a state’s economy is more a function of its population than affluence
19.0, 134.1
12.1, 130.2
11.0, 43.9
9.7, 132.7
9.4, 124.5
8.0, 78.9
6.8, 76.9
6.1, 95.7
5.8, 129.2
5.6, 139.4
5.6, 252.0
5.6, 56.5
4.9, 150.3
4.0, 114.6
3.9, 31.4
1.7, 134.8
1.1, 124.5
0.4, 274.9
0.2, 210.4
0.1, 85.7
Y-Values
GSDP (Rs trillion)
Per c
apita
incom
e (Rs
‘000
)
Goa
Sikkim
U’khandHP
ArPMizo
Naga
Delhi
HaryanaKerala
Telangana
Karnataka
Gujarat
Tamil Nadu
MaharashtraAP
WBRajasthan
MP UP
Median GSDP – Rs 3.7 trillion
Median per capita income – Rs 91,000
High GSDP, high PCILow GSDP, high PCI
Low GSDP, low PCI High GSDP, low PCI
10 economically most powerful states
Punjab
Mani J&K
Chh’garh
Odisha Bihar
The major contributing states to the national GDP are often low in levels of affluence
The two numbers denote GSDP (Rs trillion) and per capita NSDP (Rs thousand)

Common traits: Leading states have a much smaller share of Agri-GDP and a higher share of manufacturing-GDP compared to the laggard states
19 trn/112 mn 12 trn/72 mn 10 trn/61 mn
7.5 trn/69 mn 8 trn/91 mn 0.3 trn/4 mn

406 , 2.07
161 , 2.67
51 , 2.76
143 , 2.41
279 , 1.32 519 , 1.38
494 , 1.97
409 , 2.14
504 , 4.92
105 , 2.72 117 , 2.12
253 , 1.86
259 , 1.49 78 , 1.68
316 , 1.72
70 , 3.09
54 , 2.38
145 , 2.52 86 , 1.92
548 , 1.86
179 , 1.90
630 , 1.98 184 , 2.25
104 , 1.95
384 , 4.64
125 , 1.72
HPUttarakhand
HaryanaAP
Gujarat
Goa
Punjab
TNMaharashtra
DelhiKerala
Karnataka
States have followed different trajectories for the manufacturing sector
Figures depict number of factories in 2014-15 and increase from 2004-05
Number of factories per million population in 2014-15
Incr
ease
(num
ber o
f tim
es
sinc
e 20
04-0
5)
Median number of factories - 181
Median increase – 2
times72 mn
6.8 mn 10 mn

6.1 , 17%
3.9 , 6%
4.8 , 7%
8.7 , 9%
8.0 , 14%
10.6 , 7%
11.8 , 11%
6.5 , 9%
8.6 , 12%
4.7 , 11%8.8 , 11%
6.4 , 10%
4.4 , 13%
7.3 , 10%
8.8 , 7%
0.6 , 11%
4.0 , 5%
0.9 , 7%
6.5 , 13%
4.2 , 9%
6.1 , 11%4.1 , 11%
0.6 , 3%
6.4 , 10%
6.6 , 9%
5.4 , 12%
Industrial productivity (Rs mn of gross output value per worker)
Incr
ease
(CA
GR
) sin
ce 2
004-
05
Gujarat
Jharkhand
HP
Delhi
AP
Odisha
UP
Karnataka MP
HaryanaUttarakhand
Maharashtra
Goa
Median productivity in 2014-15 – Rs 6.2 mn per worker
Median increase 10% CAGR from
2004-05
Some of the laggard states such as Odisha, Jharkhand and AP have done well in improving their industrial productivity
WB
Kerala
TN
Manipur
Nagaland
Tripura
Assam
Meghalaya
Punjab

0.03 , 6%
0.05 , 3%
0.02 , 4%
0.02 , 6%
0.14 , -12%
0.28 , 10%0.05 , 8%
0.09 , 4%
0.19 , 20%
0.06 , -1%
0.03 , 7%
0.04 , 8%
0.07 , 3%
0.06 , 14%
0.03 , 4%
0.03 , 2%
0.06 , -4%
0.12 , 2%
0.04 , 7%
0.06 , 9%0.03 , 7%
0.09 , 6%
0.05 , 7%
0.04 , 7%
0.05 , 3%
Agricultural productivity (Rs mn of gross output value per worker)
Incr
ease
(CA
GR
) sin
ce 2
004-
05
Gujarat
HP
Median productivity in 2014-15 – Rs 0.05 mn per worker
Median increase 6%
CAGR from 2004-05
Goa
MP
Sikkim
Punjab
Tripura
HaryanaKerala
J&K
Nagaland
Chhattisgarh
Jharkhand
Bihar
Assam
Manipur
WBArP
The problem with agricultural productivity: low growth and low value across states

0.47 , 7%
0.46 , 8%0.37 , 9%
0.28 , 11%
0.28 , 8%
0.27 , 9%
0.23 , 0%
0.21 , 6%
0.20 , 5%
0.20 , 8%
0.20 , 6%
0.19 , 6%
0.16 , 6%
0.16 , 0%
0.15 , 3%
0.14 , 6%
0.13 , 2%
0.13 , 5%0.12 , 5%
0.11 , 5%
0.11 , 8%
0.10 , 3%
0.10 , 3%
0.10 , 1%0.09 , 1%
0.09 , 3%
0.09 , 3%
0.08 , 2%
0.07 , -1%
Productivity in the services sector (Rs mn of gross output value per worker)
Incr
ease
(CA
GR
) sin
ce 2
004-
05
Gujarat
HP
Median productivity in 2014-15 – Rs 0.15 mn per worker
Median increase 5%
CAGR from 2004-05
DelhiMP
Sikkim
Punjab
Tripura
Haryana
Nagaland
Chhattisgarh
Jharkhand
Bihar
Assam
Manipur
WB
ArP
Services sector productivity – more states in the upper half; greater scatter indicates high level of differentiation in current levels of productivity
Goa
Maharashtra
Uttarakhand
TN
KarnatakaKerala
Meghalaya
Mizoram
UP J&K
OdishaRajasthan
AP

4,582.0 , 11%
3,939.9 , 13%
3,344.9 , 11%
2,560.7 , 11%
2,484.1 , 19%
2,328.3 , 13%
1,982.9 , 14%
1,823.1 , 13%
1,482.3 , 12%
1,479.4 , 10%
1,441.9 , 5%
1,314.3 , 11%
677.9 , 13%
641.2 , 15%
638.1 , 11%
475.8 , 10%
457.8 , 7%
455.3 , 10%
448.7 , 10%
172.9 , 13%
115.9 , 8%
87.6 , 12%
86.0 , 8%
86.0 , 10%
77.0 , 12%
51.5 , 11%
45.9 , 13%
UP
Maharashtra
WB
TN
Rajasthan
Gujarat
KeralaKarnataka
Bihar Punjab
MP
Haryana
J&K
OdishaSikkim
Nagaland
MeghalayaChhattisgarh
Total outstanding liabilities of state governments in 2016-17 (Rs bn)
Total outstanding liabilities in 2016-17 (Rs bn)
Incr
ease
from
200
7-08
(% C
AG
R)
Median outstanding, Rs 641 bn
Median increase
(% CAGR),
11%
Fiscal realities: Aiding or impeding growth

UP, 3,313.8 Maha, 3,194.4
AP, 2,125.7
WB, 1,898.7
TN, 1,886.5
Kar, 1,588.6
Raj, 1,517.1
Bihar, 1,495.1
Guj, 1,467.4 MP, 1,246.3
Kerala, 1,239.0
Haryana, 855.4 Punjab, 848.4
Delhi, 676.3
Odisha, 592.5
Assam, 516.1
J'khand, 505.4
Chh'garh, 383.4
J&K, 299.5
U'khand, 235.8
HP, 179.9
Tripura, 69.7
Megh, 60.9
Mani, 52.7 Naga, 50.7
Goa, 49.8 ArP, 33.7
Mizo, 28.6
Sikkim, 13.8
Mega market (2)
Large market (9)
Middle market (6) Small market
(13)
Huge divergence in consumption market size of states – size and population key drivers
Account for 79% of total annual consumption
expenditure in the country
Account for 15% of total consumption expenditure
in the country Account for 6% of total consumption expenditure
in the country
The consumption expenditure of UP and Maharashtra is more
than the combined expenditure of the 6 middle market states
Annual consumption expenditure of each state in 2011-12, Rs bn

3,286 , 14%
3,039 , 16%
2,815 , 13%
2,759 , 16%
2,515 , 14%
2,334 , 16%
2,157 , 14%
2,147 , 15%
2,135 , 17%
2,128 , 12%
2,127 , 10%
2,071 , 12%
1,987 , 14%1,984 , 13%
1,948 , 12%
1,914 , 15%
1,847 , 14%
1,809 , 15%
1,710 , 13%
1,668 , 12%
1,555 , 15%
1,496 , 13%
1,404 , 14%
1,357 , 12%
1,357 , 6%
1,251 , 12%
1,225 , 12%
1,170 , 10%
1,161 , 14% Delhi
Kerala
Punjab
Haryana
Karnataka
MaharashtraTN
HP
Goa
High growth big spenders
Low growth big spenders
Low growth low spenders
High growth low spenders
OdishaMP
Tripura
RajasthanUttarakhand
Monthly per capita expenditure in 2011-12 (Rs)
% I
ncre
ase
(CA
GR
) sin
ce 2
004-
05
UP
Large markets such as UP are a function of population as per capita expenditure is lower than many middle and small market states
Nagaland
MizoramAPJ&K
Meghalaya
ManipurJharkhand
Chhattisgarh
Assam

34% 5% 13% 17%
34% 6% 12% 19%
44% 7% 25% 53%
45% 8% 25% 31%
52% 15% 42% 66%
46% 7% 24% 29%
51% 14% 38% 65%
Haryana KeralaRajasthan Uttarakhand
Bihar UP AP Goa
Population
Cereal
Processed food
Textile
Entertainment
Personal care
White goods
52% 100% 42% 1%
66% 100% 58% 1%
43% 100% 73% 1%
47% 100% 62% 1%
40% 100% 138% 4%
44% 100% 82% 2%
34% 100% 77% 2%
Population
Cereal
Processed food
Textile
Entertainment
Personal care
White goods
Large population translates to large market size, but the magnitude varies strikingly according to per capita affluence of the states being compared.
For example, although Haryana’s population is just over a tenth of that of UP, the state’s spend on white goods is more than a third of UP. Similarly, although Andhra Pradesh has less than half the population of UP, its spend on processed food is nearly three-quarters of UP, and spend on entertainment (cinema, theatre, cable TV, etc) is higher.

Lens 2: Influencers: demographics & urbanisation

© IMA India, 2016 www.ima-india.com 15
More urban population wasadded in the last decade,reversing a continual past trend
Figures within brackets indicate percentage share of total population increaseSource: Census, IMA analysis

© IMA India, 2016 www.ima-india.com 16
States vary widely in population and population density

© IMA India, 2016 www.ima-india.com 17
South and West more urbanised
Urban variations -34% in Andhra Pradesh to 62% in Goa.
Mega cities are in three corridors
Migration from rural to urban areas is the second most important contributor, after natural growth, to the increase in urban population.

© IMA India, 2016 www.ima-india.com 18
Age dynamics will influence consumption choice
Between 2001 and 2011, 172 mn people were added to the age group above 15 years. In 2021, the number will be 259 mn.
The age group 5-14 - crucial – will fall but still huge 225 mn
15-59 – MASSIVE.
2011 – 2021• Largest additions to the working age group: Uttar Pradesh, followed by Bihar, Maharashtra, WB,
Rajasthan and AP. • Most aged – Also Uttar Pradesh and Maharashtra followed by AP, WB, Bihar and Tamil Nadu.

Increasing education is setting up the stage for new consumption patternsand demand for employment – 2008-09 to 2015-16
Except the two north-eastern states of Mizoram and Nagaland, all the states have registered significant improvements in the past half decade in gross enrolment ratio for higher education

Lens 3: Employment scenario: fundamental shifts

© IMA India, 2016 www.ima-india.com 22
10 states account for 75% employment…
Except the four states of Arunachal Pradesh, Punjab, Madhya Pradesh and Himachal Pradesh, number of people above 15 years age with employment as principal occupation increased in all other
states between 2004-05 and 2015-16
9.81
5.77
9.89
2.26
7.53
3.17
1.02
5.52
(0.2
0)
1.09
3.09
1.64
4.59
1.97
1.53
(0.1
8)
0.95
0.92
0.45
0.01
(0.6
1) 0.36
0.31
0.08
0.02
0.11
(0.0
1)
0.15
0.08
0.02
63.5
47.237.1 33.833.5
27.6 27 24.3 24.3 23.216.6 15.313.2 12.8
11.7
9.1 95.7 3.4 3.4 2.3
1.81.4
1.3
0.9 0.60.6 0.50.5 0.3
(10.00)
-
10.00
20.00
30.00
40.00
50.00
60.00
70.00
UP
Mah WB
TN
Bih
ar
Kar
Raj
asth
an AP
MP
Guj
arat
Odi
sha
J'kh
and
Chh
'gar
h
Ker
ala
Ass
am
Punj
ab
Har
yana
Del
hi
J&K
U'k
hand HP
Trip
ura
Man
ipur
Meg
hala
ya
N'la
nd
Miz
oram ArP
P'ch
erry
Goa
Sikk
im
Increase in employment
Total employment in 2015-16
Cha
nge
in n
umbe
r of
peop
le e
mpl
oyed
All figures in mn

© IMA India, 2016 www.ima-india.com 23
Employment not keeping pace with number of people being added to working age population
Increase in employment was slower in all states (except Tripura) than working age population growth between 2004-05 and 2015-16.
Of particular concern, however, is the slow or negative growth in the most populous states in the country, such as Maharashtra, Uttar Pradesh and Madhya Pradesh
Source: NSSO, Labour Bureau, IMA analysis
© IMA India, 2016 www.ima-india.com 24
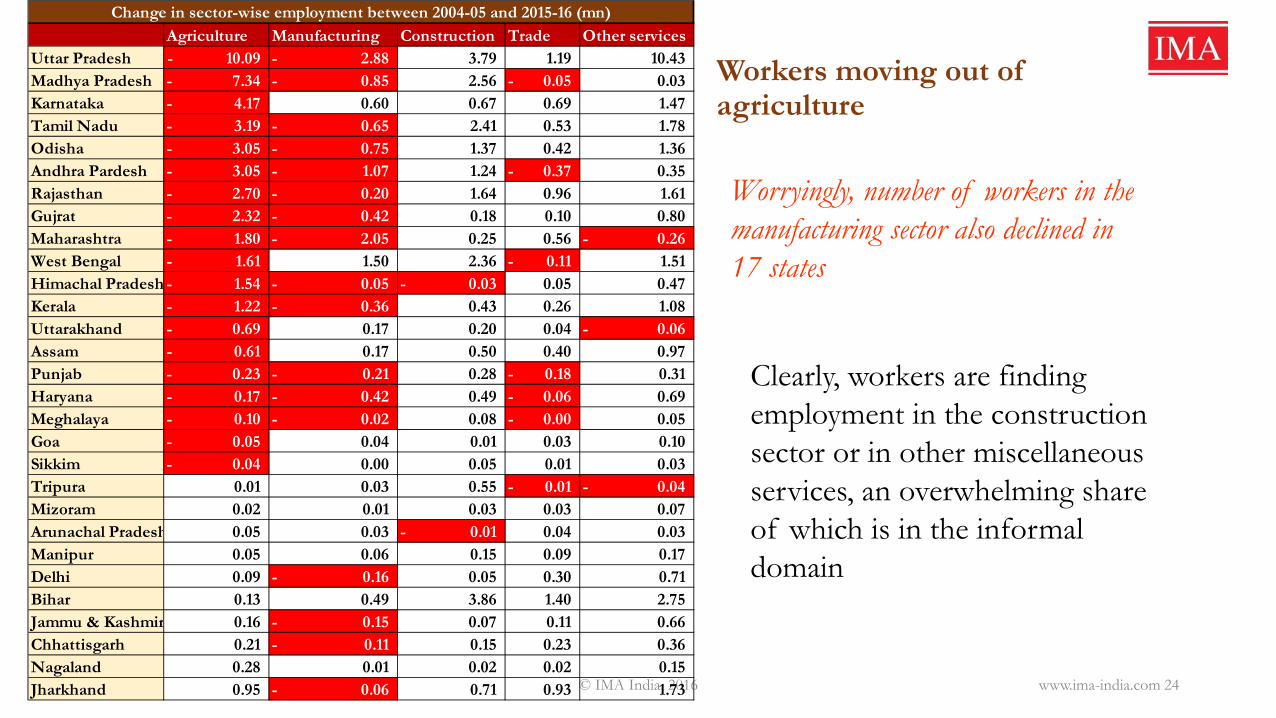
Workers moving out of agriculture
Worryingly, number of workers in the manufacturing sector also declined in 17 states
Agriculture Manufacturing Construction Trade Other services Uttar Pradesh 10.09- 2.88- 3.79 1.19 10.43 Madhya Pradesh 7.34- 0.85- 2.56 0.05- 0.03 Karnataka 4.17- 0.60 0.67 0.69 1.47 Tamil Nadu 3.19- 0.65- 2.41 0.53 1.78 Odisha 3.05- 0.75- 1.37 0.42 1.36 Andhra Pardesh 3.05- 1.07- 1.24 0.37- 0.35 Rajasthan 2.70- 0.20- 1.64 0.96 1.61 Gujrat 2.32- 0.42- 0.18 0.10 0.80 Maharashtra 1.80- 2.05- 0.25 0.56 0.26- West Bengal 1.61- 1.50 2.36 0.11- 1.51 Himachal Pradesh 1.54- 0.05- 0.03- 0.05 0.47 Kerala 1.22- 0.36- 0.43 0.26 1.08 Uttarakhand 0.69- 0.17 0.20 0.04 0.06- Assam 0.61- 0.17 0.50 0.40 0.97 Punjab 0.23- 0.21- 0.28 0.18- 0.31 Haryana 0.17- 0.42- 0.49 0.06- 0.69 Meghalaya 0.10- 0.02- 0.08 0.00- 0.05 Goa 0.05- 0.04 0.01 0.03 0.10 Sikkim 0.04- 0.00 0.05 0.01 0.03 Tripura 0.01 0.03 0.55 0.01- 0.04- Mizoram 0.02 0.01 0.03 0.03 0.07 Arunachal Pradesh 0.05 0.03 0.01- 0.04 0.03 Manipur 0.05 0.06 0.15 0.09 0.17 Delhi 0.09 0.16- 0.05 0.30 0.71 Bihar 0.13 0.49 3.86 1.40 2.75 Jammu & Kashmir 0.16 0.15- 0.07 0.11 0.66 Chhattisgarh 0.21 0.11- 0.15 0.23 0.36 Nagaland 0.28 0.01 0.02 0.02 0.15 Jharkhand 0.95 0.06- 0.71 0.93 1.73
Change in sector-wise employment between 2004-05 and 2015-16 (mn)
Clearly, workers are finding employment in the construction sector or in other miscellaneous services, an overwhelming share of which is in the informal domain

The Informal Sector: Overwhelming
© IMA India, 2016 www.ima-india.com 25
180/30/19mn 72%/6 25 mn / 9.2 mn

Lens 4: Investment & infrastructure
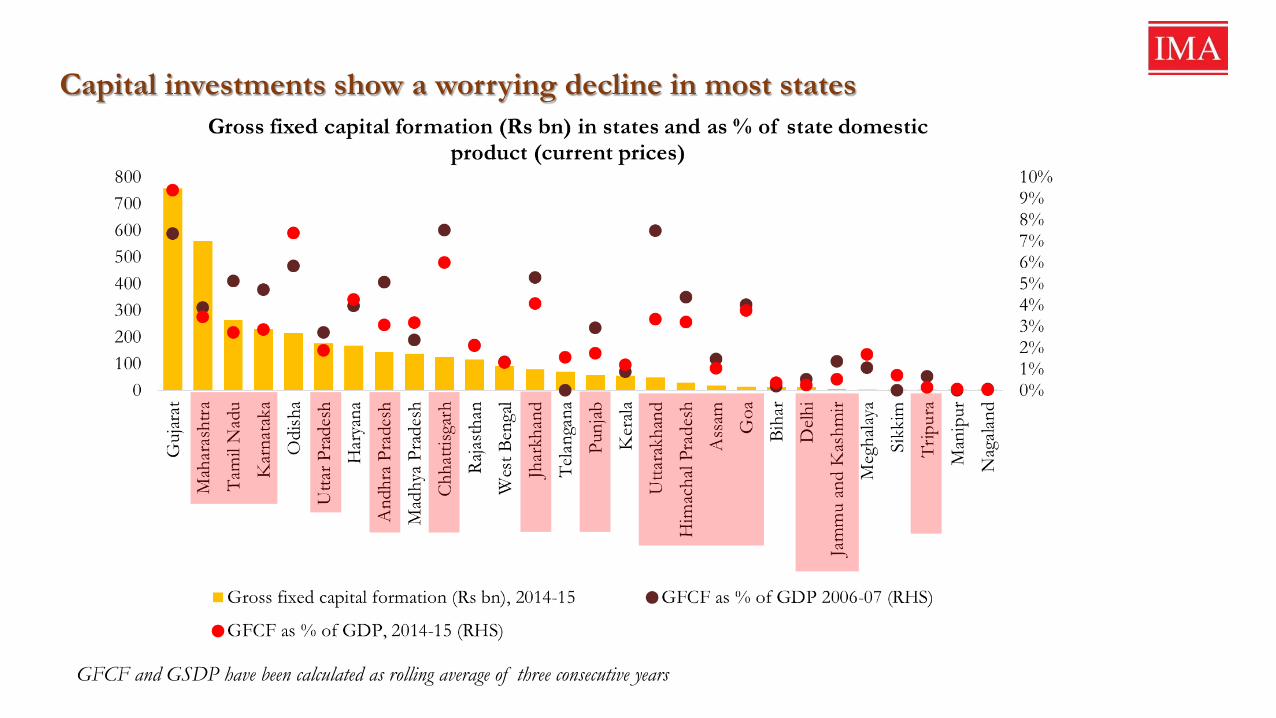
GFCF and GSDP have been calculated as rolling average of three consecutive years
Capital investments show a worrying decline in most states

UP, Rajasthan, MP and Chhattisgarh have registered significant growth in installed capacity for power generation
0%50%100%150%200%250%300%350%
05000
1000015000200002500030000350004000045000
Mah
aras
htra
Guj
arat
Tam
il N
adu
Utta
r Pra
desh
And
hra
Prad
esh
Kar
nata
kaRa
jast
han
Mad
hya
Prad
esh
Punj
abC
hhat
isgar
hH
arya
naW
est B
enga
lO
dish
aD
elhi
Ker
ala
Him
acha
l Pra
desh
Biha
rJa
mm
u an
d K
ashm
irU
ttara
khan
dJh
arkh
and
Ass
amSi
kkim
Trip
ura
Goa
Meg
hala
yaA
runa
chal
Pra
desh
Man
ipur
Nag
alan
dM
izor
am
Installed capacity, March 2017Increase in capacity CAGR % (2008-17) (RHS)Increase in supply CAGR % (2008-17) (RHS)
The laggards are scaling up fast

Massive divergence among states in creating road infrastructure
-2.0%
0.0%
2.0%
4.0%
6.0%
8.0%
10.0%
12.0%
14.0%
-50,000
-
50,000
100,000
150,000
200,000
250,000M
ahar
asht
ra
Mad
hya
Prad
esh
Ass
am
Utta
r Pra
desh
Biha
r
Tam
il N
adu
Odi
sha
And
hra
Prad
esh
Kar
nata
ka
Raja
stha
n
Guj
arat
Punj
ab
Jhar
khan
d
Utta
rakh
and
Jam
mu
and
Kas
hmir
Him
acha
l Pra
desh
Har
yana
Chh
attis
garh
Man
ipur
Wes
t Ben
gal
Aru
nach
al P
rade
sh
Trip
ura
Nag
alan
d
Goa
Sikk
im
Del
hi
Meg
hala
ya
Miz
oram
Ker
ala
Total road network added between 2009-15 (KM) CAGR (2009-15)(RHS)
Jharkhand, Bihar, Sikkim – low base, high growth

A number of states are set to have new airports
5 710
1
11
2
8 7 8
43
3
1
1
1
1
1 1
1 1
- 2 4 6 8
10 12 14
Kar
nata
ka
And
hra
Prad
esh
Mah
aras
htra
Goa
Guj
arat
Ker
ala
Mad
hya
Prad
esh
Pud
uche
rry
Sikk
in
Wes
t Ben
gal
Utta
r Pra
desh
No of proposed airports Existing no of airports

New politics, new policy direction?
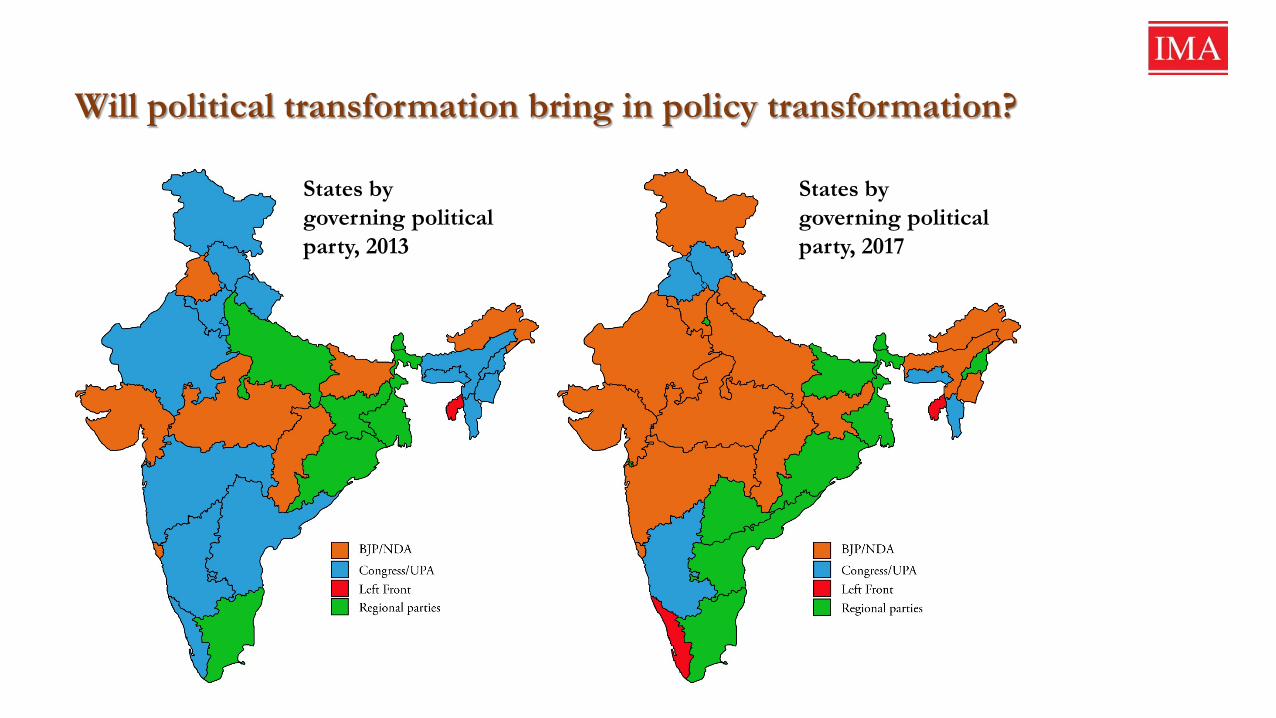
Will political transformation bring in policy transformation?
States by governing political party, 2013
States by governing political party, 2017