Embed Size (px)
Citation preview
Social and Economic Assessment and Analysis of First Nation Communities and Territorial Natural Resources for Integrated Marine Use Planning in the Pacific North Coast Integrated Management Area
Detailed Report, May 2009 Prepared By: Ference Weicker & Company Ltd. 550-475 West Georgia Street Vancouver, BC V6B 4M9 Tel: 604-688-2424
FERENCE WEICKER & COMPANY FERENCE WEICKER & COMPANY
FERENCE WEICKER & COMPANY
SUMMARY
Social and Economic Assessment and Analysis
SUMMARY PURPOSE OF THE PROJECT The purpose of this project was to undertake a social and economic assessment and analysis of First Nation communities and territorial natural resources in the region. The results will serve as input into integrated marine use planning in the Pacific North Coast Integrated Management area. The project consisted of two key components:
• A community survey to collect data which has been used to prepare a demographic profile of First Nations residents along the Central and North Coast. More specifically, the survey collected data on issues such as labour force participation, education and training, involvement in the marine sector, mobility, and community interest with regards to economic development.
• An assessment of the level of commercial activity based on marine resources including a
review of the direct and indirect benefits accruing to First Nation communities. The project also identified factors constraining First Nations participation, trends occurring over time and the opportunities for increasing the benefits to First Nation communities.
METHOD OF STUDY The major steps that we undertook to complete this project are as follows:
• Undertook a detailed review of the documentation regarding the marine use planning being undertaken in the Pacific North Coast Integrated Management Area and examined the relevant information available and determined the gaps in existing information.
• Determined the most appropriate methodologies to undertake a social economic assessment
and analysis of First Nations communities and prepared draft questionnaires and survey instruments and determined the most appropriate method in which to train socioeconomic planners and community researchers.
• Prepared a data analysis framework and incorporated the feedback received to finalize the
study methodology and work plan and participated in training sessions to prepare socioeconomic planners to administer the community surveys.
• Monitored completion of the community survey on a periodic basis and checked for data entry
errors in the excel files.
• Developed a sample of approximately 133 active businesses in the marine sector to be surveyed and conducted interviews with a sample of 99 businesses active in the marine sectors in the region and conducted interviews with a sample of approximately 32 selected experts.
• Collected and reviewed statistics, data and past reports relevant to the marine sector as well
as any sector and regional development strategies that have been prepared.
• Tabulated and analyzed the results of the interviews from the three surveys and prepared a draft report of the study findings as well as eight reports on the findings in each community.
FERENCE WEICKER & COMPANY
SUMMARY
Social and Economic Assessment and Analysis
THE NORTH AND CENTRAL COAST In conducting this study, a community survey commenced in June 2008 and was undertaken in nine communities along the North and Central Coast. In total, 1331 people were surveyed with 851 located in the North Coast and 480 located in the Central Coast. Data was collected on a number of key issues including residence, employment, generational changes, economic development opportunities and demographic characteristics. Some of the major findings of the survey include:
• Employment in the region varies across the communities with roughly one third of the respondents in the North and Central Coast currently employed full-time. Other common types of employment include part-time work), full-time school attendance, and seasonal work. Current occupations included retail positions, commercial fishers, and maintenance related positions. The most common sectors of employment are the Band office, fishing, retail and education.
• Finding employment in the region is generally viewed as somewhat difficult. Factors that make finding employment challenging include limited local job opportunities, a lack of the appropriate skills and education, and health or age related factors.
• The average annual income of residents in the region is somewhat lower than the
provincial average. On average, residents in the region reported an annual average income of $21,000. About half of this income was earned on-reserve while roughly a quarter was earned from the marine sector.
• The level of mobility among residents is low with the majority of residents in the North
and Central Coast having been located at the same address one year ago. The most common reasons for moving included employment and to be closer to friends and family.
• The majority of residents would prefer to be situated in their own community. The
scenery and surroundings, access to traditional foods and cultural activities, and proximity to family and friends were the major reasons given.
THE MARINE SECTORS The North and Central Coast have a number of thriving marine sectors which play an important role in their overall economy. After an extensive search into licensing information, business directories and referrals, we generated a sample of 133 active businesses in the marine sector and 99 of those businesses were surveyed across a range of marine sectors. The major marine sectors in the region are described below:
• Seafood processing typically involves the handling of seafood from both the wild harvest and the aquaculture operations and producing fresh, frozen, canned and smoked products. A number of businesses operate licensed fish processing facilities along the North and Central Coast. Our sample of businesses indicates approximately 24 facilities in the region in total with 5 of them located in the Central Coast and roughly 19 located in the North Coast. Based on the survey results and secondary data, we estimate the total annual revenues earned in the processing sector to be over $84 million for the region. We also estimate that the sector employs over 1,700 employees in the North and Central Coast.
• The aquaculture sector is defined as the farming of finfish, shellfish and aquatic plants in both freshwater and saltwater environments. We identified 17 operations in the region of which
FERENCE WEICKER & COMPANY
SUMMARY
Social and Economic Assessment and Analysis
fish hatcheries are the most common type of activity. Based on our survey results and secondary data, we estimate the aquaculture sector generates revenues over $17 million and employs over 140 employees in the region annually.
• Commercial fishing is also an essential economic driver in the North and Central Coast. Major commercial fisheries in the region include salmon, halibut, herring and herring roe, sea urchin, cod, crab, and shellfish. Using both survey data and secondary data on fish and seafood values and the average landed prices for 2007; we estimate that the revenues of the fishing sector total $48 million dollars annually.
• Marine tourism is a major economic force within the North and Central Coast. Many visitors are attracted by sports fishing – both fresh water and salt water. A large number are destined for the sport fishing lodges with most activity concentrated in the June to September period. Using our sample of businesses in the region and secondary data, we estimate that approximately 60 lodges operate along the North and Central Coast and generate close to $20 million annually as well as employ nearly 1,000 people.
• The energy sector is also emerging in the region with significant potential for wind farms in the offshore areas of BC. The North Coast is also recognized as among the best wind energy resources on the planet. We identified 7 operations in the energy sector some of which are still in the planning stages. These operations include wind farm developments which typically utilize offshore wind energy as well as other operations which include run-of-river hydro development projects.
• The marine transportation sector is emerging as a source of economic activity in the North
and Central Coast as well. With faster sailing times to Asia, world-class year-round ice-free container ports in the Vancouver region and Prince Rupert, and direct rail access to North America from its ports, BC is uniquely positioned to become a hub of international trade and commerce. Based on our estimates which utilized our survey results and secondary data, we estimate the annual revenues of the marine transportation industry in the region to total over $17 million and employ close to 500 people.
LINKAGES BETWEEN THE COMMUNITIES WITH THE MARINE SECTOR Communities have strong linkages to the marine sector particularly through employment, the use of marine resources and generational linkages. For First Nations communities, the marine sector is an important source of:
• Employment for residents. About half of all residents along the North and Central Coast
have had a job in the marine sector. The most common types of positions held by residents who had been employed in the sector included commercial fisher, fish plant worker, and shore worker.
• Income for residents. Residents who reported having worked in the marine sector over the past 12 months, had a slightly higher average income in comparison to all residents.
• Sustenance for residents. Roughly a third of all residents’ meals consist of seafood. In
addition, much of the seafood eaten is non-commercially harvested with residents often playing a role in the processing or harvesting of the seafood consumed. Time spent on these activities ranged from 0 to over 2,100 hours annually.
FERENCE WEICKER & COMPANY
SUMMARY
Social and Economic Assessment and Analysis
Residents typically have strong generational linkages to their communities with most residents indicating their parents and grandparents had lived much of their lives in the same region. However, residents tend to be less reliant on the marine economy than their parents or grandparents were. In addition, businesses have strong linkages to the communities in which they operate through employment, local purchases and the use of marine resources. The survey results indicate that:
• Businesses have strong linkages to local Aboriginal communities with roughly one-
third of their employees being of Aboriginal descent. Businesses also purchase resources, products and services directly from Aboriginal suppliers with annual spending totalling close to $3 million dollars.
• Marine sector businesses are also a source of revenue for local suppliers with almost all businesses surveyed indicating they purchase goods and services locally. These purchases total nearly $5 million dollars annually.
• Many of the businesses purchase or directly harvest resources. Resources harvested
include halibut, herring, salmon, sardines, and bottom fish. Of the 8% of businesses that indicated they further process these resources, the processing typically takes place within the region as well.
OPPORTUNITIES FOR DEVELOPMENT
• Residents believe that a high priority should be placed on economic developments related to the marine sector. Reasons for the high priority include the creation of employment and job opportunities in the community, improvements to the lifestyles of those living on-reserve and a reduction in dependence on welfare and improved access to marine resources.
• Businesses and experts believe that marine based economic development should be made a priority along the North and Central Coast. Areas of particular potential included tourism based growth, sports fishing and the potential to expand aquaculture and hatchery developments in the region.
• A number of opportunities exist to increase the participation of First Nations people
and organizations in the marine sector. In particular, opportunities were identified with respect to the expansion of tourism in the communities which could attract visitors year-round and employ the local people consistently throughout the year. The expansion of commercial and sports fishing operations could also be utilized to increase marine sector participation. Finally, the creation and enhancement of aquaculture developments in the community would also have a positive impact on marine sector participation in the region. Factors that may constrain First Nations participation in the marine economy include a lack of training, education, and certification, limited access to capital, and depleting fish stocks.
• A number of actions could be undertaken by the communities, industry, government and others to promote further development in the marine sector. These actions include the promotion and marketing of the tourism industry, development of a long-term strategic plan to address depleting fish stocks and mismanagement of local resources as well as increasing local training opportunities and reducing the cost of fuel which would make participation in the marine economy more affordable.
Introduction 1 The PNCIMA 2 Purpose of the Study 3 Method of the Study 4 Structure of the Report
Profile of the North and Central Coast 5 The North Coast
10 The Central Coast 16 Characteristics of Residents Surveyed
Characteristics of the Marine Sectors
31 Overview of the Key Sectors 39 Characteristics of the Marine Businesses Surveyed
Linkages Between the Communities With the Marine Sector
48 Community Linkages With the Marine Sector 54 Linkages of Businesses 63 Opportunities to Strengthen Linkages
Appendices A-1 Interview Guide A-4 Community Survey
A-14 Survey of Businesses A-21 Survey of Experts A-26 List of Businesses and Experts Surveyed A-29 Methodology A-32 Revenues by Sector
FERENCE WEICKER & COMPANY
INTRODUCTION
Social and Economic Assessment and Analysis – Draft Report Page 1
I. INTRODUCTION
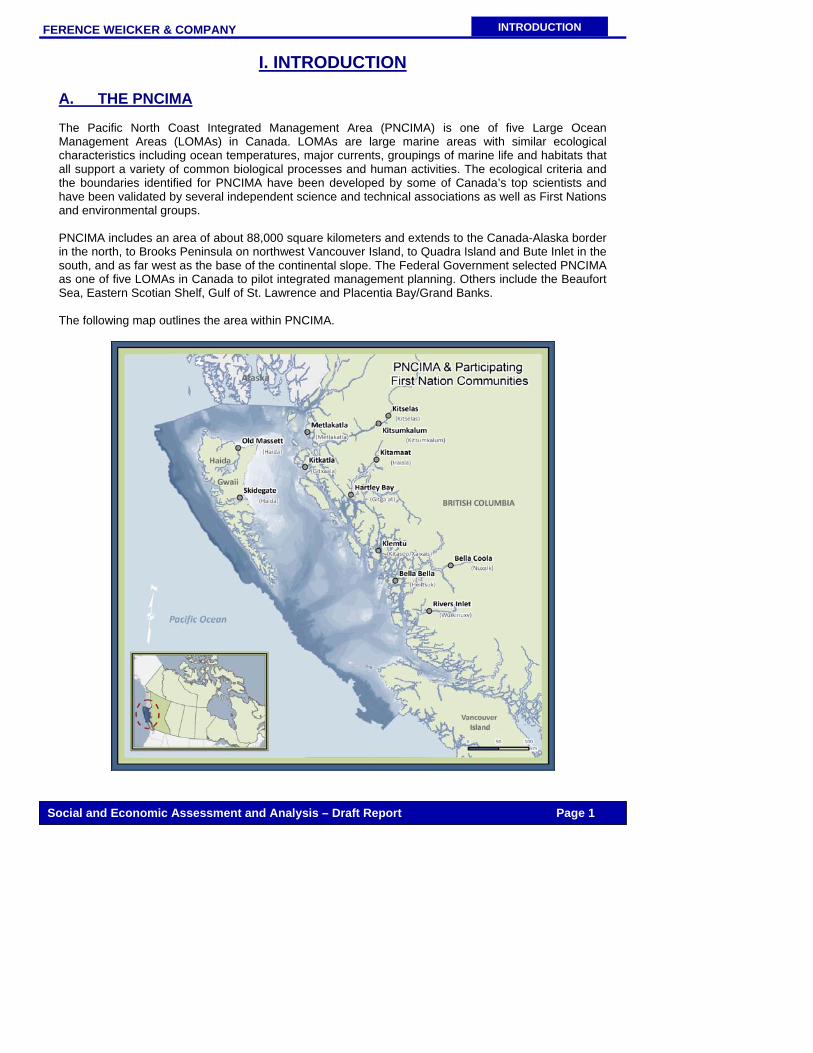
A. THE PNCIMA The Pacific North Coast Integrated Management Area (PNCIMA) is one of five Large Ocean Management Areas (LOMAs) in Canada. LOMAs are large marine areas with similar ecological characteristics including ocean temperatures, major currents, groupings of marine life and habitats that all support a variety of common biological processes and human activities. The ecological criteria and the boundaries identified for PNCIMA have been developed by some of Canada’s top scientists and have been validated by several independent science and technical associations as well as First Nations and environmental groups. PNCIMA includes an area of about 88,000 square kilometers and extends to the Canada-Alaska border in the north, to Brooks Peninsula on northwest Vancouver Island, to Quadra Island and Bute Inlet in the south, and as far west as the base of the continental slope. The Federal Government selected PNCIMA as one of five LOMAs in Canada to pilot integrated management planning. Others include the Beaufort Sea, Eastern Scotian Shelf, Gulf of St. Lawrence and Placentia Bay/Grand Banks. The following map outlines the area within PNCIMA.
FERENCE WEICKER & COMPANY
INTRODUCTION
Social and Economic Assessment and Analysis – Draft Report Page 2
Integrated marine use planning refers to a collaborative planning process that brings together stakeholders, governments, and First Nations to reach general agreement on sustainable resource use in marine areas. The greatest challenge facing the First Nations on the North and Central Coast is the development of a new conservation-based economy. To achieve harmony between economic development and conservation, there must be recognition of the inextricable link between economic and ecological sustainability. It is not possible to achieve one without the other. Similar to land use plans, integrated marine use plans will work to blend the intellectual and scientific expertise of the modern world, with the deep and ancient wisdom of traditional cultures. This blend of ancient wisdom and scientific knowledge will culminate in a plan that reflects how First Nations have managed their lands and resources for thousands of years. In modern terms, this is defined as an ecosystem-based approach to resource management. Community integrated marine use plans may include:
• A community vision for the marine territory; • Values and perspectives on ocean resources; • Goals, objectives and strategies for management of ocean resources and uses; • Designation of zones for specific areas to protect ecological, cultural, social and economic
values as identified by First Nations communities; and • A variety of other topics and issues as determined by each community.
The key goals of marine use planning are to: 1. Promote improved ocean management decisions based on understanding ecological,
cultural and socio-economic characteristics:
Community and cultural values; Future uses and opportunities; and Existing management and institutional arrangements.
2. Design an integrated marine use plan that:
Identifies shared values of the area, including environmental, economic, social and cultural
values; Identifies information gaps and needs; and Results in ecosystem-based management.
3. Develop institutional arrangements which bring together governments, First Nations, user
groups and other interests to enter into agreements on ocean management. 4. Contribute to the social, cultural, and economic well-being of First Nations, other coastal
communities and stakeholders by identifying viable opportunities and development strategies.
B. THE PURPOSE OF THE STUDY The purpose of this project was to undertake a social and economic assessment and analysis of First Nation communities and territorial natural resources in the region. The results will serve as input into integrated marine use planning in the Pacific North Coast Integrated Management Area. The project consisted of two key components:
• A community survey to collect data which will be used in preparing a profile of First Nations

FERENCE WEICKER & COMPANY
INTRODUCTION
Social and Economic Assessment and Analysis – Draft Report Page 3
residents along the Central and North Coast. More specifically, the survey collected data on issues such as labour force participation, education and training, involvement in the marine sector, mobility, and community interest with regards to economic development.
• An assessment of the level of commercial activity based on marine resources in the region including a review of the direct and indirect benefits accruing to First Nation communities. The project also identifies factors constraining First Nations participation, trends occurring over time and the opportunities for increasing the benefits to First Nation communities.
C. METHOD OF THE STUDY The major steps that we undertook to complete this project are as follows:
• Undertook a detailed review of the documentation regarding the marine use planning being undertaken in the Pacific North Coast Integrated Management Area.
• Conducted interviews with key stakeholders involved in marine use planning for the Pacific
North Coast Integrated Management Area to obtain a detailed understanding of the information that must be collected in the current study.
• Examined the relevant information available and determined the gaps in existing information.
• Determined the most appropriate methodologies to undertake a social economic assessment
and analysis of First Nations communities.
• Prepared draft questionnaires and survey instruments. A copy of the draft questionnaire for these interviews is provided in the Appendices.
• Determined the most appropriate method in which to train socioeconomic planners and
community researchers.
• Prepared a data analysis framework.
• Conducted a conference call with the study proponents to review the proposed design methodology. Based on the feedback received, we finalized the study methodology and work plan.
• Participated in training sessions to prepare socioeconomic planners to administer the
community surveys. Both sessions were held in Vancouver on separate occasions. Socioeconomic planners were provided with detailed instructions, an excel file in which to enter the completed surveys, and an excel sheet to monitor survey completion.
• Monitored completion of the community survey on a periodic basis and checked for data entry
errors in the excel files.
• Developed a sample of approximately 133 active businesses in the marine sector to be surveyed.
• Conducted interviews with a sample of 99 businesses active in the marine sectors in the
region. A copy of the draft questionnaire for these interviews is provided in Appendix III.
• Conducted interviews with a sample of approximately 32 selected experts (e.g. government representatives, economic development representatives, and businesses active in the marine

FERENCE WEICKER & COMPANY
INTRODUCTION
Social and Economic Assessment and Analysis – Draft Report Page 4
sectors in the region). A copy of the draft questionnaire for these interviews is provided in Appendix IV.
• Collected and reviewed statistics, data and past reports relevant to the marine sector as well
as any sector and regional development strategies that have been prepared.
• Tabulated and analyzed the results of the interviews from the three surveys and prepared a draft report of the study findings as well as eight reports on the findings in each community.
D. STRUCTURE OF THE REPORT The report is divided into three additional chapters:
• Chapter II provides a profile of the North and Central Coast and also describes the characteristics of the residents surveyed in terms of their demographic characteristics, employment status, personal income and mobility.
• Chapter III provides an overview of the characteristics of the marine sectors in the North and Central Coast including an overview of the key sectors and characteristics of the marine businesses surveyed.
• Chapter IV looks at linkages between the communities and the marine sector specifically through employment data, the use of marine resources, and generational linkages. It also looks at businesses linkages with the communities in terms of employment, local purchases and the use of marine resources. Finally, it identifies opportunities to strengthen these linkages.
FERENCE WEICKER & COMPANY
PROFILE OF THE COMMUNITIES
Social and Economic Assessment and Analysis – Draft Report Page 5
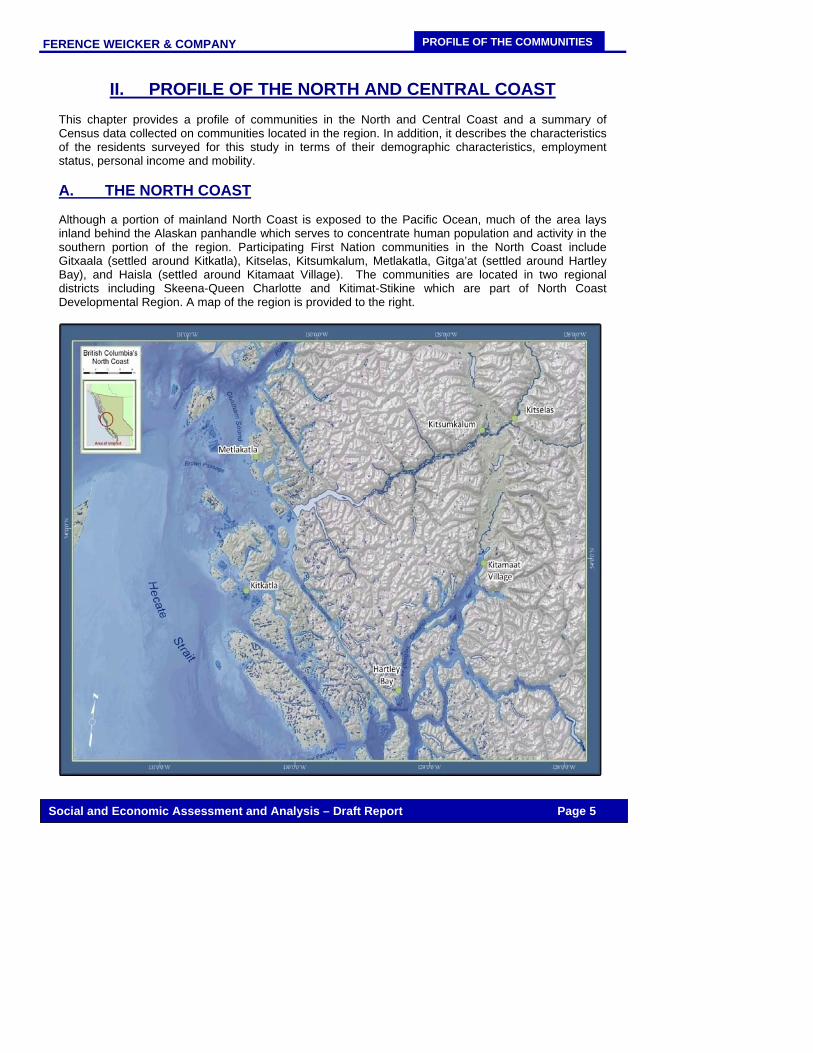
II. PROFILE OF THE NORTH AND CENTRAL COAST This chapter provides a profile of communities in the North and Central Coast and a summary of Census data collected on communities located in the region. In addition, it describes the characteristics of the residents surveyed for this study in terms of their demographic characteristics, employment status, personal income and mobility. A. THE NORTH COAST Although a portion of mainland North Coast is exposed to the Pacific Ocean, much of the area lays inland behind the Alaskan panhandle which serves to concentrate human population and activity in the southern portion of the region. Participating First Nation communities in the North Coast include Gitxaala (settled around Kitkatla), Kitselas, Kitsumkalum, Metlakatla, Gitga’at (settled around Hartley Bay), and Haisla (settled around Kitamaat Village). The communities are located in two regional districts including Skeena-Queen Charlotte and Kitimat-Stikine which are part of North Coast Developmental Region. A map of the region is provided to the right.

FERENCE WEICKER & COMPANY
PROFILE OF THE COMMUNITIES
Social and Economic Assessment and Analysis – Draft Report Page 6
1. Communities The communities along the North Coast include:
• Metlakatla Nation
Metlakatla is the second Tsimshian community situated on the Tsimshian Peninsula. Its name translated means, “between two bodies of water”. Metlakatla is located 7 km from Prince Rupert, the closest service center. Access is only by passenger ferry. Presently, the Metlakatla Band has approximately 780 members.
• Gitga’at Nation
Gitga’at Territory encompasses roughly 7,500 square kilometers of land and water, including the mainland and coastal islands of the lower Douglas Channel, Whale Channel, Wright Sound and Lewis Pass to Caamano Sound on British Columbia’s North and Central Coast. There are about 60 homes and several community buildings in Hartley Bay. Hartley Bay can be accessed by floatplane or ferry from Prince Rupert.
• Haisla Nation
At this point in time, the primary residence of the Haisla people is Kitamaat Village located at the head of the Douglas Channel on British Columbia's North Coast. In 1804, the Canadian Federal government set aside 1640 acres of land for the Haisla; currently access can be made via Highway 37.
• Kitselas Nation
Kitselas Nation is located around the main village of Kitselas (also Kulspai), on the Skeena River just east of Terrace, in northwestern B.C. It consists of nine reserves distributed on 1,103 hectares of land. The area has year round road access.
• Kitsumkalum Nation
Kitsumkalum is one of fourteen Tsimshian Tribes that has traditional territory in the Kitsumkalum Valley with property rights along the Skeena River, and along the northwest coast of British Columbia. The community is located 5 km west of Terrace. The nation has three reserves on 560 hectares and has year round road access.
• Gitxaala Nation
The Gitxaala are one of the 14 tribes of the Tsimshian nation. They inhabit a village called Kitkatla (sometimes called Laxklan), on Dolphin Island, a small island just by Porcher Island. The community has no year-round road access to a service centre and is spread out on 14.8javascript:openWindow('Flags.cfm?Lang=E&Geo1=BAND&Code1=59630160&Flag=') square km.
2. Demographic Profiles of Residents According to the available secondary data, each nation has seen an increase in membership over the past 12 years. According to Skeena Native Development Society, community population and
FERENCE WEICKER & COMPANY
PROFILE OF THE COMMUNITIES
Social and Economic Assessment and Analysis – Draft Report Page 7
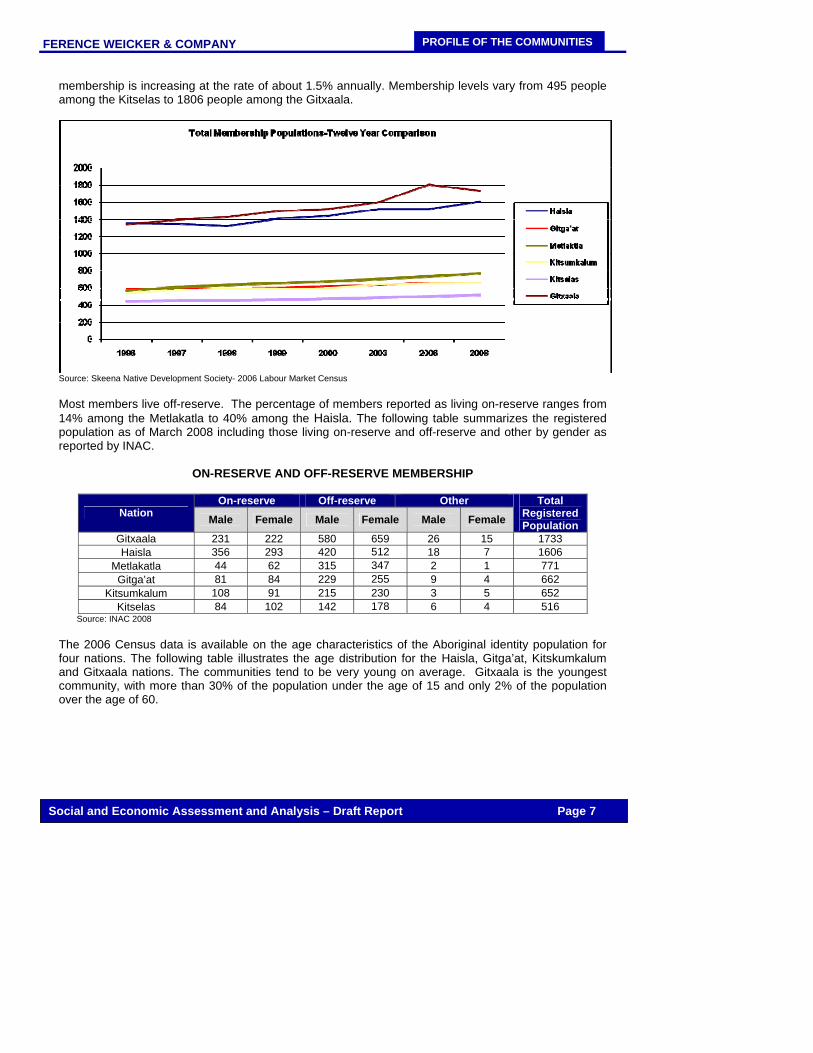
membership is increasing at the rate of about 1.5% annually. Membership levels vary from 495 people among the Kitselas to 1806 people among the Gitxaala.
Source: Skeena Native Development Society- 2006 Labour Market Census Most members live off-reserve. The percentage of members reported as living on-reserve ranges from 14% among the Metlakatla to 40% among the Haisla. The following table summarizes the registered population as of March 2008 including those living on-reserve and off-reserve and other by gender as reported by INAC.
ON-RESERVE AND OFF-RESERVE MEMBERSHIP
On-reserve Off-reserve Other Nation Male Female Male Female Male Female
Total Registered Population
Gitxaala 231 222 580 659 26 15 1733 Haisla 356 293 420 512 18 7 1606
Metlakatla 44 62 315 347 2 1 771 Gitga’at 81 84 229 255 9 4 662
Kitsumkalum 108 91 215 230 3 5 652 Kitselas 84 102 142 178 6 4 516
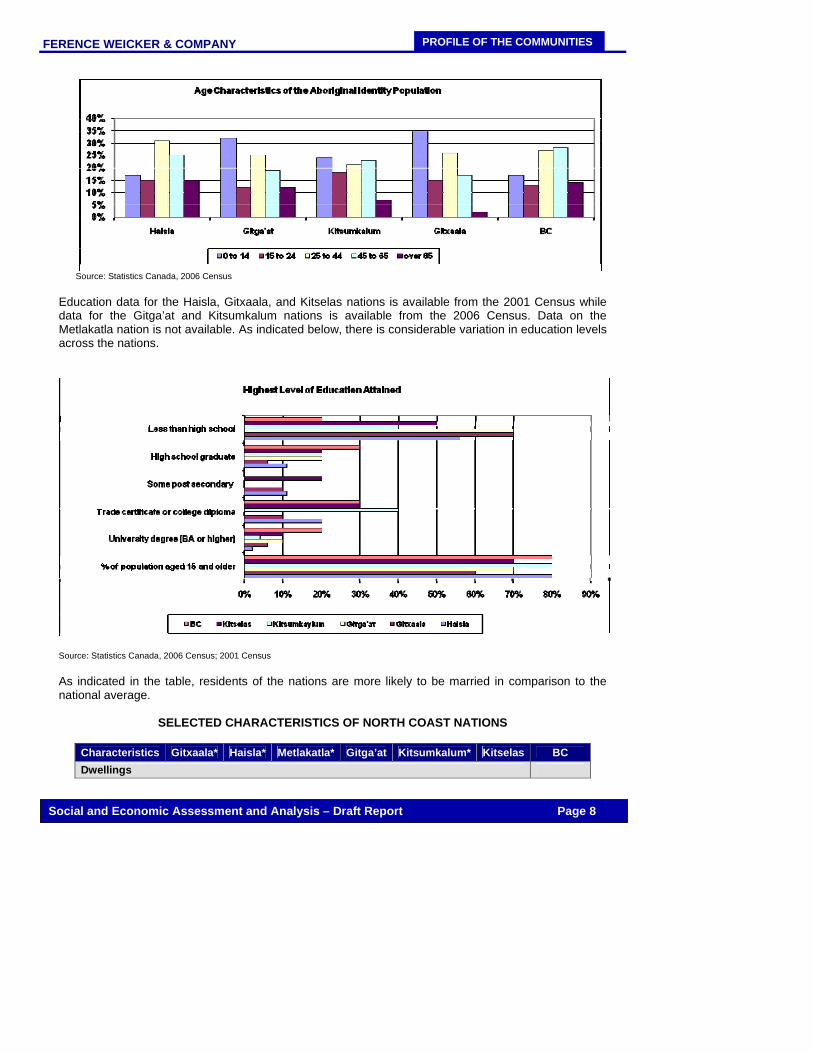
Source: INAC 2008 The 2006 Census data is available on the age characteristics of the Aboriginal identity population for four nations. The following table illustrates the age distribution for the Haisla, Gitga’at, Kitskumkalum and Gitxaala nations. The communities tend to be very young on average. Gitxaala is the youngest community, with more than 30% of the population under the age of 15 and only 2% of the population over the age of 60.
FERENCE WEICKER & COMPANY
PROFILE OF THE COMMUNITIES
Social and Economic Assessment and Analysis – Draft Report Page 8
Source: Statistics Canada, 2006 Census Education data for the Haisla, Gitxaala, and Kitselas nations is available from the 2001 Census while data for the Gitga’at and Kitsumkalum nations is available from the 2006 Census. Data on the Metlakatla nation is not available. As indicated below, there is considerable variation in education levels across the nations.
Source: Statistics Canada, 2006 Census; 2001 Census As indicated in the table, residents of the nations are more likely to be married in comparison to the national average.
SELECTED CHARACTERISTICS OF NORTH COAST NATIONS
Characteristics Gitxaala* Haisla* Metlakatla* Gitga’at Kitsumkalum* Kitselas BC Dwellings
FERENCE WEICKER & COMPANY
PROFILE OF THE COMMUNITIES
Social and Economic Assessment and Analysis – Draft Report Page 9
Total private dwellings 105 182 48 45 84 35 1,788,474
Total number of census families 415 - - - 285 - 195,400
Marital status (Aboriginal Identity Population) Total pop.(over age of 15) 270 430 - 110 220 100 140,820
Single 50% 47% - 50% 43% 35% 54% Married 35% 36% - 36% 39% 50% 29% Separated 4% 3% - 5% 5% 10% 5% Divorced 4% 7% - 0 5% 10% 8% Widowed 4% 7% - 9% 5% 10% 4% Language (Aboriginal Identity Population) Total AB identity pop. 415 510 155 285 135 196,075
English 88% 100% - 87% 93% 96% 85% French 0 0 - 0 0 0 0 Aboriginal language (s) 12% 25% - 13% 7% 11% 1%
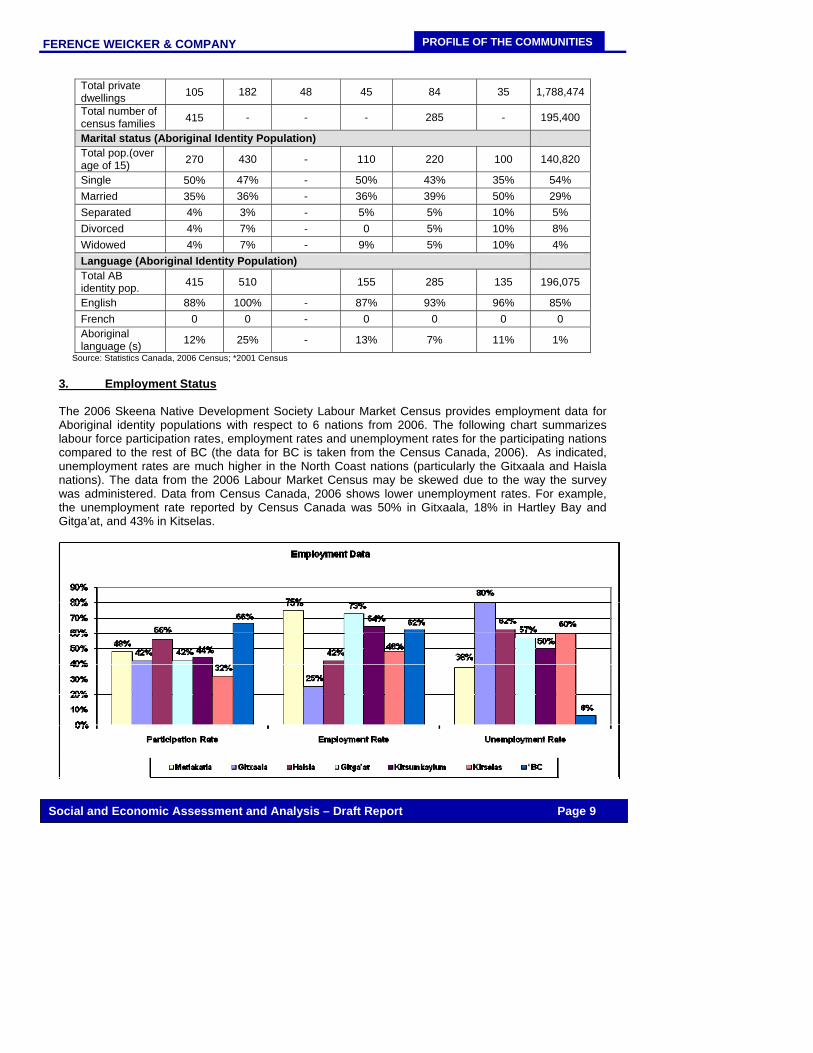
Source: Statistics Canada, 2006 Census; *2001 Census 3. Employment Status The 2006 Skeena Native Development Society Labour Market Census provides employment data for Aboriginal identity populations with respect to 6 nations from 2006. The following chart summarizes labour force participation rates, employment rates and unemployment rates for the participating nations compared to the rest of BC (the data for BC is taken from the Census Canada, 2006). As indicated, unemployment rates are much higher in the North Coast nations (particularly the Gitxaala and Haisla nations). The data from the 2006 Labour Market Census may be skewed due to the way the survey was administered. Data from Census Canada, 2006 shows lower unemployment rates. For example, the unemployment rate reported by Census Canada was 50% in Gitxaala, 18% in Hartley Bay and Gitga’at, and 43% in Kitselas.
FERENCE WEICKER & COMPANY
PROFILE OF THE COMMUNITIES
Social and Economic Assessment and Analysis – Draft Report Page 10
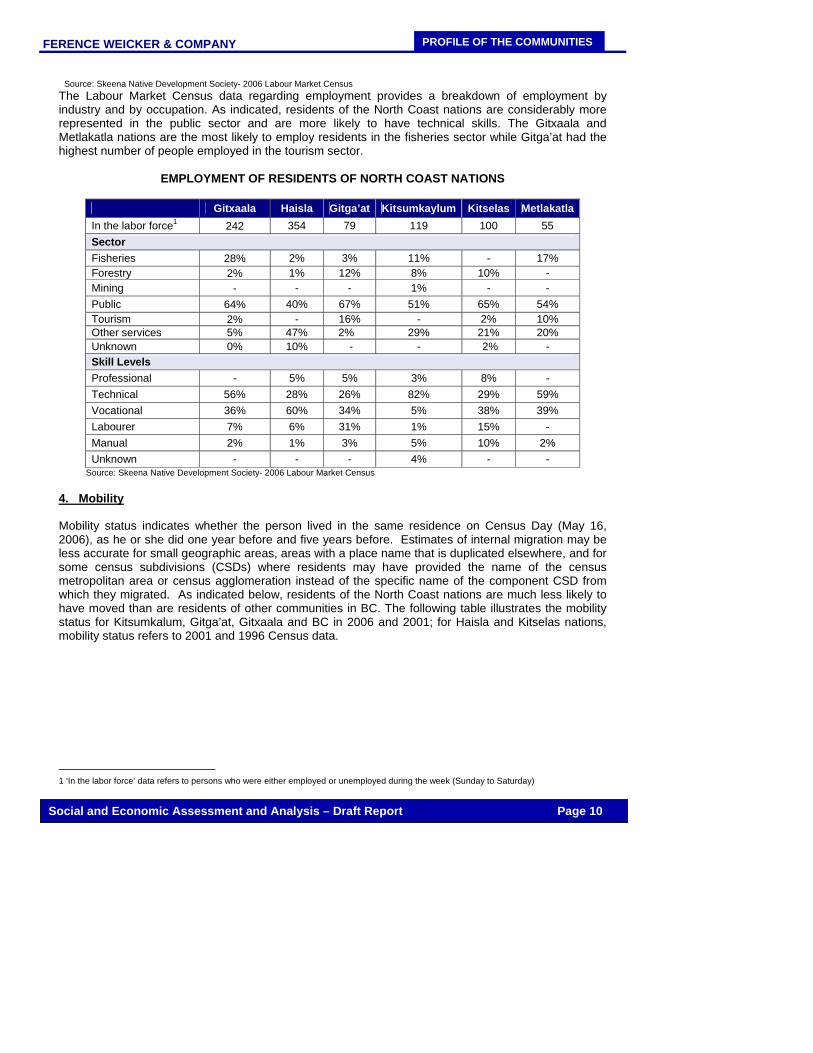
Source: Skeena Native Development Society- 2006 Labour Market Census The Labour Market Census data regarding employment provides a breakdown of employment by industry and by occupation. As indicated, residents of the North Coast nations are considerably more represented in the public sector and are more likely to have technical skills. The Gitxaala and Metlakatla nations are the most likely to employ residents in the fisheries sector while Gitga’at had the highest number of people employed in the tourism sector.
EMPLOYMENT OF RESIDENTS OF NORTH COAST NATIONS
Gitxaala Haisla Gitga’at Kitsumkaylum Kitselas Metlakatla In the labor force1 242 354 79 119 100 55 Sector Fisheries 28% 2% 3% 11% - 17% Forestry 2% 1% 12% 8% 10% - Mining - - - 1% - - Public 64% 40% 67% 51% 65% 54% Tourism 2% - 16% - 2% 10% Other services 5% 47% 2% 29% 21% 20% Unknown 0% 10% - - 2% - Skill Levels Professional - 5% 5% 3% 8% - Technical 56% 28% 26% 82% 29% 59% Vocational 36% 60% 34% 5% 38% 39% Labourer 7% 6% 31% 1% 15% - Manual 2% 1% 3% 5% 10% 2% Unknown - - - 4% - -
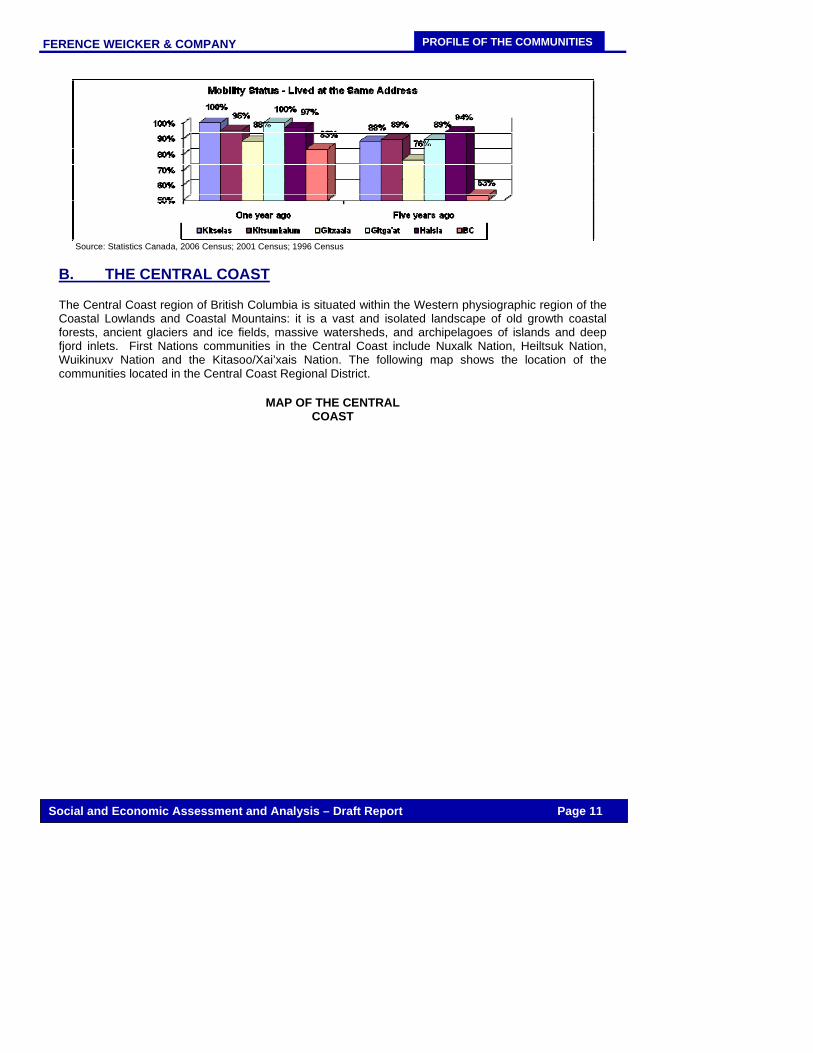
Source: Skeena Native Development Society- 2006 Labour Market Census 4. Mobility Mobility status indicates whether the person lived in the same residence on Census Day (May 16, 2006), as he or she did one year before and five years before. Estimates of internal migration may be less accurate for small geographic areas, areas with a place name that is duplicated elsewhere, and for some census subdivisions (CSDs) where residents may have provided the name of the census metropolitan area or census agglomeration instead of the specific name of the component CSD from which they migrated. As indicated below, residents of the North Coast nations are much less likely to have moved than are residents of other communities in BC. The following table illustrates the mobility status for Kitsumkalum, Gitga’at, Gitxaala and BC in 2006 and 2001; for Haisla and Kitselas nations, mobility status refers to 2001 and 1996 Census data.
1 ‘In the labor force’ data refers to persons who were either employed or unemployed during the week (Sunday to Saturday)
FERENCE WEICKER & COMPANY
PROFILE OF THE COMMUNITIES
Social and Economic Assessment and Analysis – Draft Report Page 11
Source: Statistics Canada, 2006 Census; 2001 Census; 1996 Census B. THE CENTRAL COAST
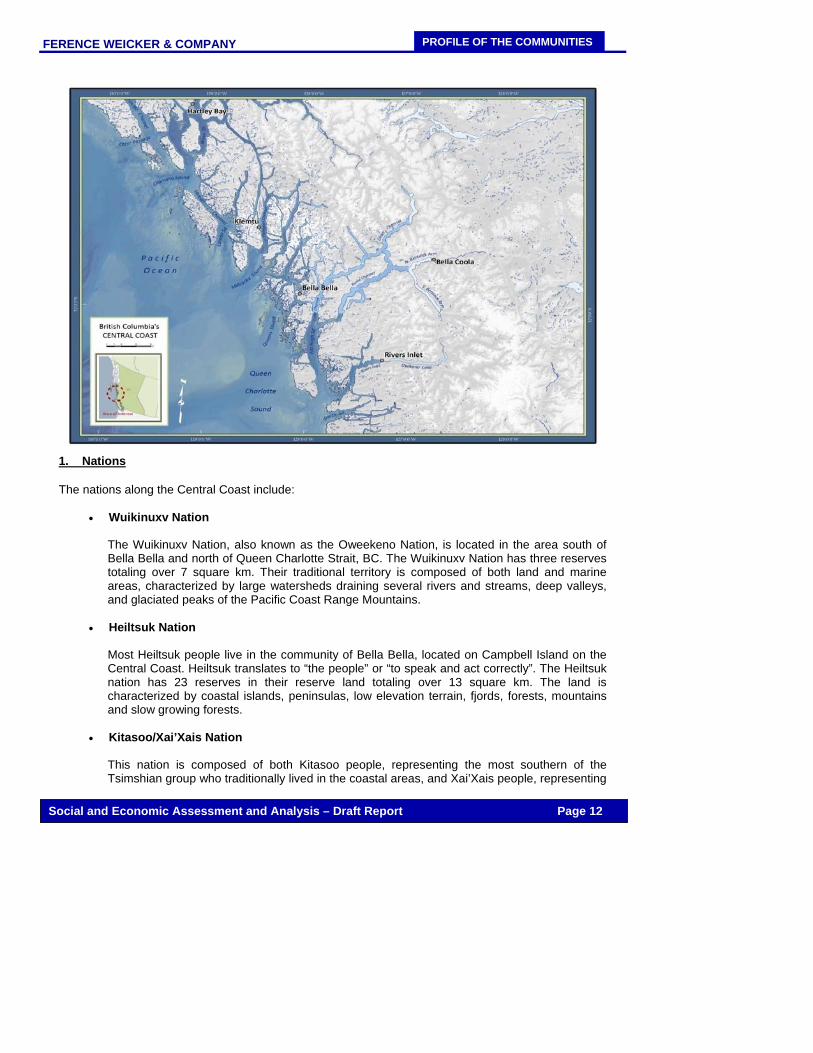
The Central Coast region of British Columbia is situated within the Western physiographic region of the Coastal Lowlands and Coastal Mountains: it is a vast and isolated landscape of old growth coastal forests, ancient glaciers and ice fields, massive watersheds, and archipelagoes of islands and deep fjord inlets. First Nations communities in the Central Coast include Nuxalk Nation, Heiltsuk Nation, Wuikinuxv Nation and the Kitasoo/Xai’xais Nation. The following map shows the location of the communities located in the Central Coast Regional District.
MAP OF THE CENTRAL COAST
FERENCE WEICKER & COMPANY
PROFILE OF THE COMMUNITIES
Social and Economic Assessment and Analysis – Draft Report Page 12
1. Nations The nations along the Central Coast include:
• Wuikinuxv Nation
The Wuikinuxv Nation, also known as the Oweekeno Nation, is located in the area south of Bella Bella and north of Queen Charlotte Strait, BC. The Wuikinuxv Nation has three reserves totaling over 7 square km. Their traditional territory is composed of both land and marine areas, characterized by large watersheds draining several rivers and streams, deep valleys, and glaciated peaks of the Pacific Coast Range Mountains.
• Heiltsuk Nation
Most Heiltsuk people live in the community of Bella Bella, located on Campbell Island on the Central Coast. Heiltsuk translates to “the people” or “to speak and act correctly”. The Heiltsuk nation has 23 reserves in their reserve land totaling over 13 square km. The land is characterized by coastal islands, peninsulas, low elevation terrain, fjords, forests, mountains and slow growing forests.
• Kitasoo/Xai’Xais Nation
This nation is composed of both Kitasoo people, representing the most southern of the Tsimshian group who traditionally lived in the coastal areas, and Xai’Xais people, representing

FERENCE WEICKER & COMPANY
PROFILE OF THE COMMUNITIES
Social and Economic Assessment and Analysis – Draft Report Page 13
the most northern Heiltsuk group who primarily resided in the inlets. The main reserve of Klemtu is located on Swindle Island, 57 km northwest of Bella Bella. The Kitasoo/Xai’Xais people have 9 reserves on 11 square km (1,103.4 hectares).
• Nuxalk Nation
What is now known as the Nuxalk Nation is a mixture of many villages that were distributed throughout the territory, including the four largest villages of Talyumc to the south, Nutl'l (Kimsquit) to the north, Kwalhtna to the west and Qomqots to the east. The Nuxalk nation has 7 reserves in their traditional territory totaling almost 19 square km.
2. Demographic Profiles of Residents According to the available secondary data, the Central Coast nations have all seen increases in total membership. From 1997 to 2005, the Heiltsuk nation grew by approximately 7%; the Nuxalk nation increased by 15%; the Kitasoo/Xai’Xais nation grew by 12%; and the Wuikinuxv nation increased by approximately 28%. For the same period, BC’s population grew by approximately 8%.
Source: Community Socioeconomic Profiles, Prepared for Integrated Marine Use Planning, July 2007 The registered population living on and off-reserve varies from 59% of the Kitasoo population living on-reserve while 51% of the Heiltsuk and 47% of the Nuxalk are living on-reserve to 29% of the Wuikinuxv nation living on-reserve. The following table summarizes the registered population living on and off-reserve and other by gender.
On-reserve Off-reserve Other Community Male Female Male Female Male Female
Total Registered Population
Heiltsuk 540 520 1032 N/A N/A 2092 Nuxalk 288 399 297 363 16 10 1473 Kitasoo 161 139 75 115 6 8 505
Wuikinuxv 43 37 86 91 9 14 280 Source: INAC 2008
FERENCE WEICKER & COMPANY
PROFILE OF THE COMMUNITIES
Social and Economic Assessment and Analysis – Draft Report Page 14
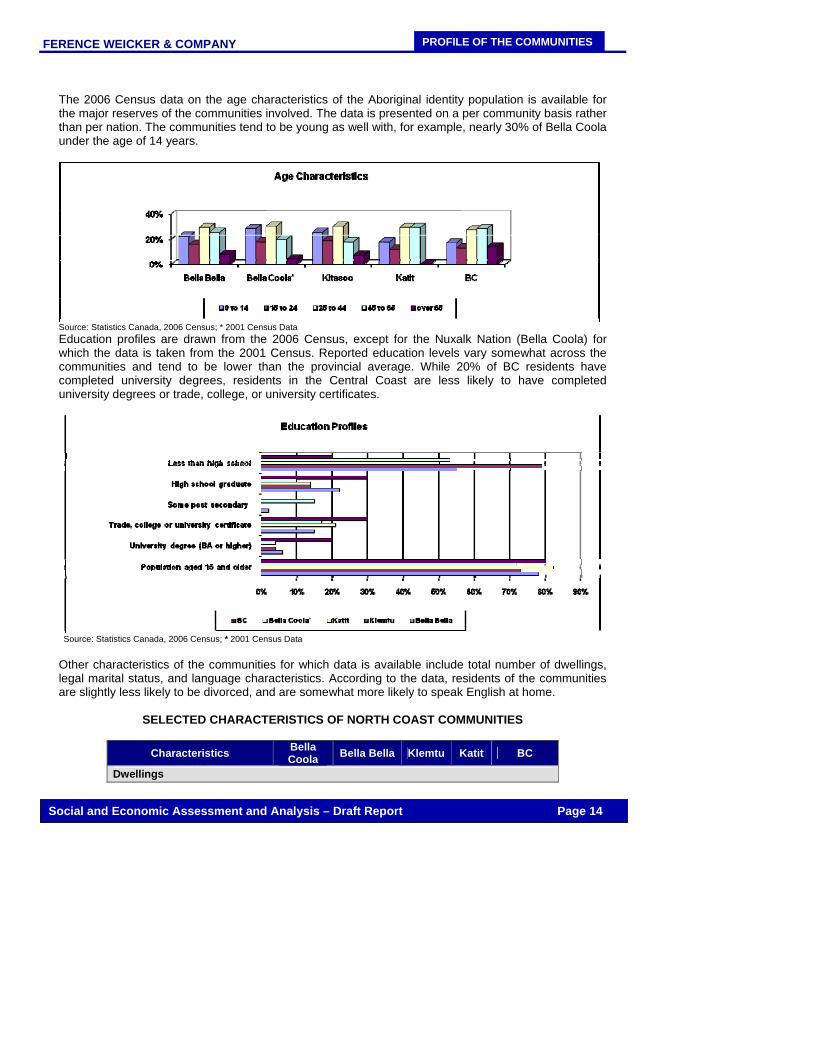
The 2006 Census data on the age characteristics of the Aboriginal identity population is available for the major reserves of the communities involved. The data is presented on a per community basis rather than per nation. The communities tend to be young as well with, for example, nearly 30% of Bella Coola under the age of 14 years.
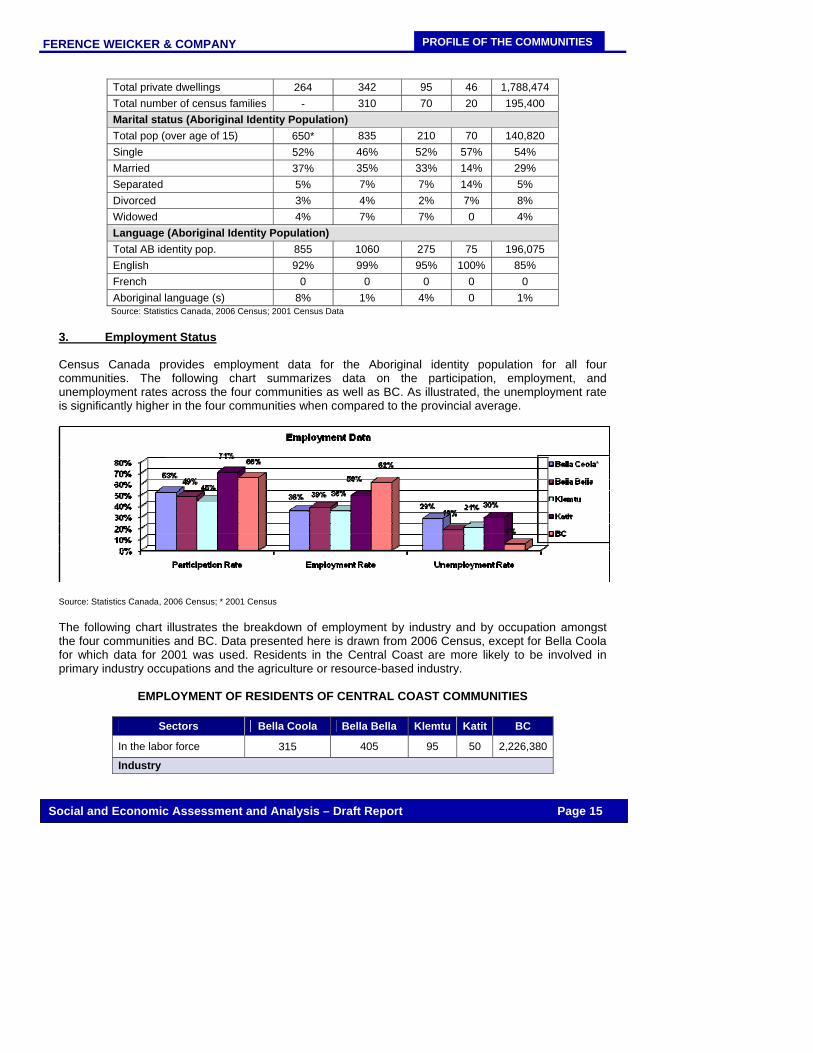
Source: Statistics Canada, 2006 Census; * 2001 Census Data Education profiles are drawn from the 2006 Census, except for the Nuxalk Nation (Bella Coola) for which the data is taken from the 2001 Census. Reported education levels vary somewhat across the communities and tend to be lower than the provincial average. While 20% of BC residents have completed university degrees, residents in the Central Coast are less likely to have completed university degrees or trade, college, or university certificates.
Source: Statistics Canada, 2006 Census; * 2001 Census Data Other characteristics of the communities for which data is available include total number of dwellings, legal marital status, and language characteristics. According to the data, residents of the communities are slightly less likely to be divorced, and are somewhat more likely to speak English at home.
SELECTED CHARACTERISTICS OF NORTH COAST COMMUNITIES
Characteristics Bella Coola Bella Bella Klemtu Katit BC
Dwellings
FERENCE WEICKER & COMPANY
PROFILE OF THE COMMUNITIES
Social and Economic Assessment and Analysis – Draft Report Page 15
Total private dwellings 264 342 95 46 1,788,474 Total number of census families - 310 70 20 195,400 Marital status (Aboriginal Identity Population) Total pop (over age of 15) 650* 835 210 70 140,820 Single 52% 46% 52% 57% 54% Married 37% 35% 33% 14% 29% Separated 5% 7% 7% 14% 5% Divorced 3% 4% 2% 7% 8% Widowed 4% 7% 7% 0 4% Language (Aboriginal Identity Population) Total AB identity pop. 855 1060 275 75 196,075 English 92% 99% 95% 100% 85% French 0 0 0 0 0 Aboriginal language (s) 8% 1% 4% 0 1%
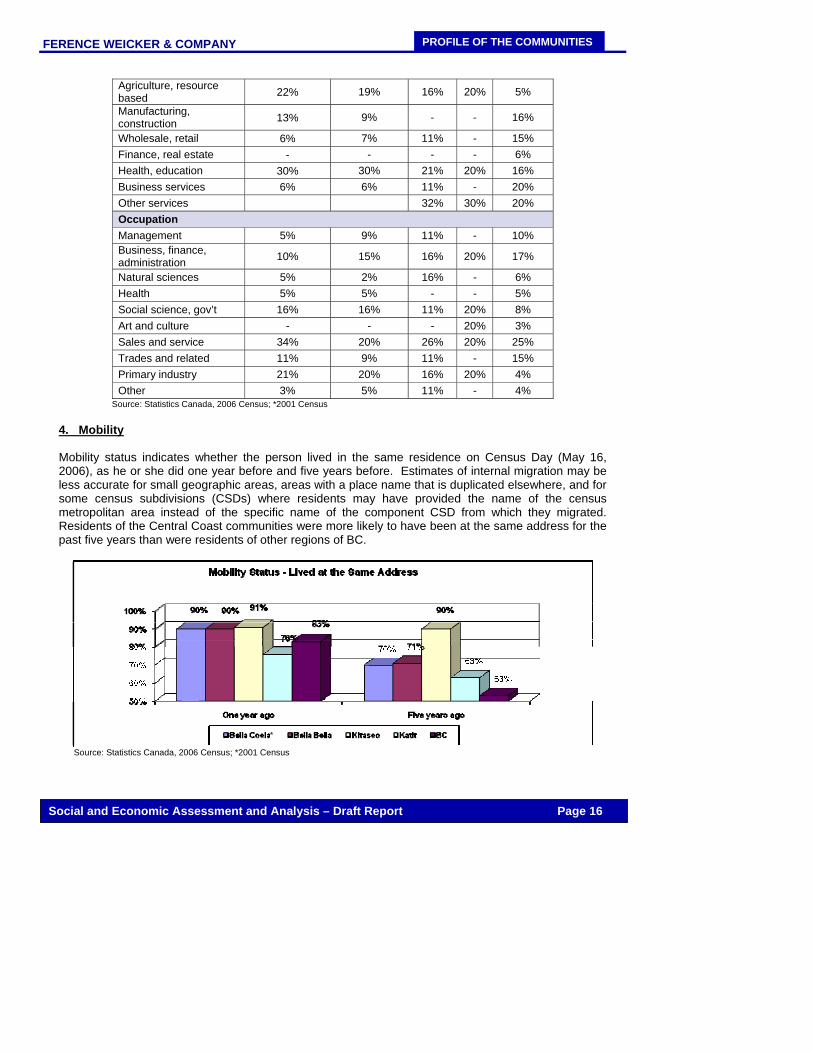
Source: Statistics Canada, 2006 Census; 2001 Census Data 3. Employment Status Census Canada provides employment data for the Aboriginal identity population for all four communities. The following chart summarizes data on the participation, employment, and unemployment rates across the four communities as well as BC. As illustrated, the unemployment rate is significantly higher in the four communities when compared to the provincial average.
Source: Statistics Canada, 2006 Census; * 2001 Census The following chart illustrates the breakdown of employment by industry and by occupation amongst the four communities and BC. Data presented here is drawn from 2006 Census, except for Bella Coola for which data for 2001 was used. Residents in the Central Coast are more likely to be involved in primary industry occupations and the agriculture or resource-based industry.
EMPLOYMENT OF RESIDENTS OF CENTRAL COAST COMMUNITIES
Sectors Bella Coola Bella Bella Klemtu Katit BC
In the labor force 315 405 95 50 2,226,380
Industry
FERENCE WEICKER & COMPANY
PROFILE OF THE COMMUNITIES
Social and Economic Assessment and Analysis – Draft Report Page 16
Agriculture, resource based 22% 19% 16% 20% 5%
Manufacturing, construction 13% 9% - - 16%
Wholesale, retail 6% 7% 11% - 15% Finance, real estate - - - - 6% Health, education 30% 30% 21% 20% 16% Business services 6% 6% 11% - 20% Other services 32% 30% 20% Occupation Management 5% 9% 11% - 10% Business, finance, administration 10% 15% 16% 20% 17%
Natural sciences 5% 2% 16% - 6% Health 5% 5% - - 5% Social science, gov’t 16% 16% 11% 20% 8% Art and culture - - - 20% 3% Sales and service 34% 20% 26% 20% 25% Trades and related 11% 9% 11% - 15% Primary industry 21% 20% 16% 20% 4% Other 3% 5% 11% - 4%
Source: Statistics Canada, 2006 Census; *2001 Census 4. Mobility Mobility status indicates whether the person lived in the same residence on Census Day (May 16, 2006), as he or she did one year before and five years before. Estimates of internal migration may be less accurate for small geographic areas, areas with a place name that is duplicated elsewhere, and for some census subdivisions (CSDs) where residents may have provided the name of the census metropolitan area instead of the specific name of the component CSD from which they migrated. Residents of the Central Coast communities were more likely to have been at the same address for the past five years than were residents of other regions of BC.
Source: Statistics Canada, 2006 Census; *2001 Census
FERENCE WEICKER & COMPANY
PROFILE OF THE COMMUNITIES
Social and Economic Assessment and Analysis – Draft Report Page 17
C. CHARACTERISTICS OF THE RESIDENTS SURVEYED The community survey commenced in June 2008 and was administered in nine communities along the North and Central Coast. Our role was to provide training to socioeconomic planners and community researchers to administer the survey and as the survey was underway we monitored the progress of the research being undertaken in the communities. In total, 1,331 residents were surveyed and data was collected on key issues including residence, employment, generational changes, economic development opportunities and demographic characteristics. The following section summarizes some of the data collected from residents in terms of their demographic characteristics, employment status, income, and mobility. 1. Demographic Characteristics
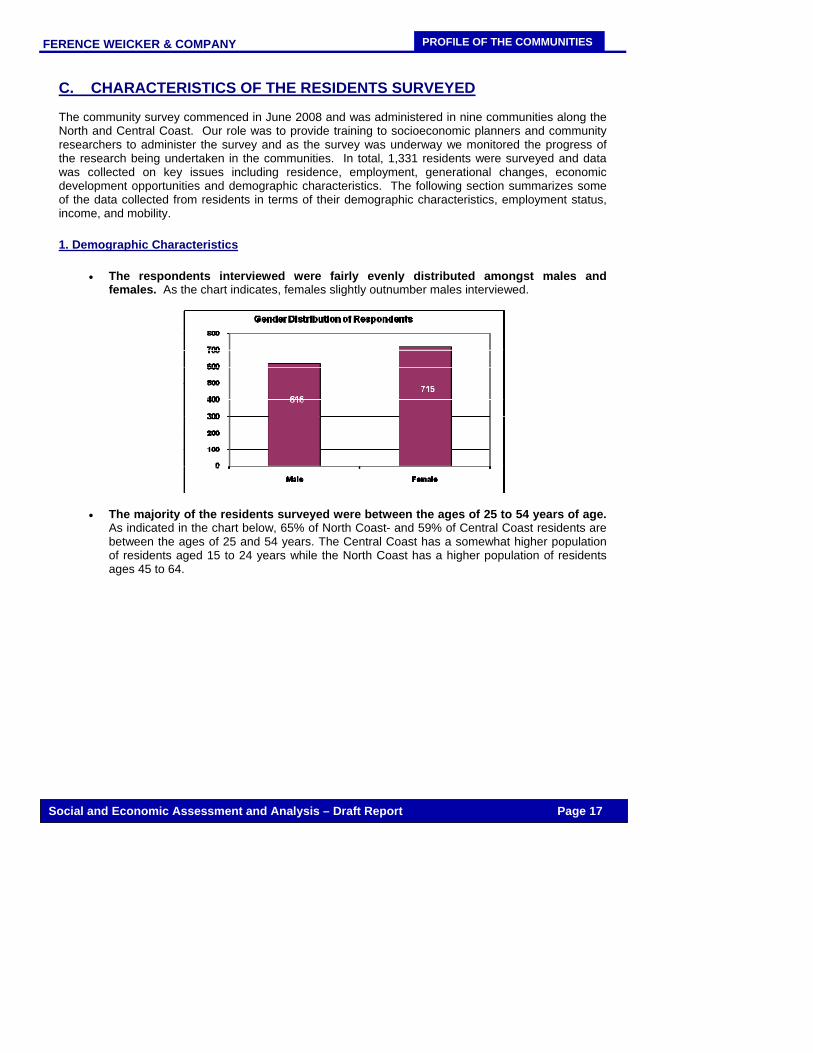
• The respondents interviewed were fairly evenly distributed amongst males and females. As the chart indicates, females slightly outnumber males interviewed.
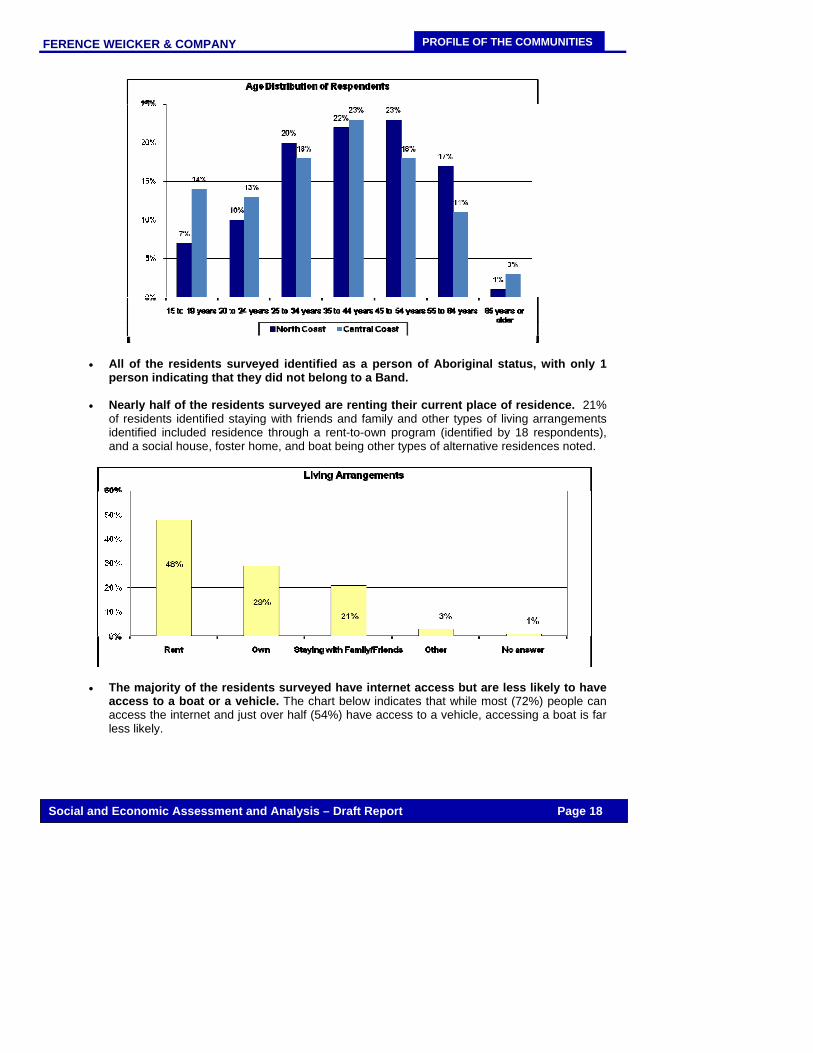
• The majority of the residents surveyed were between the ages of 25 to 54 years of age.
As indicated in the chart below, 65% of North Coast- and 59% of Central Coast residents are between the ages of 25 and 54 years. The Central Coast has a somewhat higher population of residents aged 15 to 24 years while the North Coast has a higher population of residents ages 45 to 64.
FERENCE WEICKER & COMPANY
PROFILE OF THE COMMUNITIES
Social and Economic Assessment and Analysis – Draft Report Page 18
• All of the residents surveyed identified as a person of Aboriginal status, with only 1 person indicating that they did not belong to a Band.
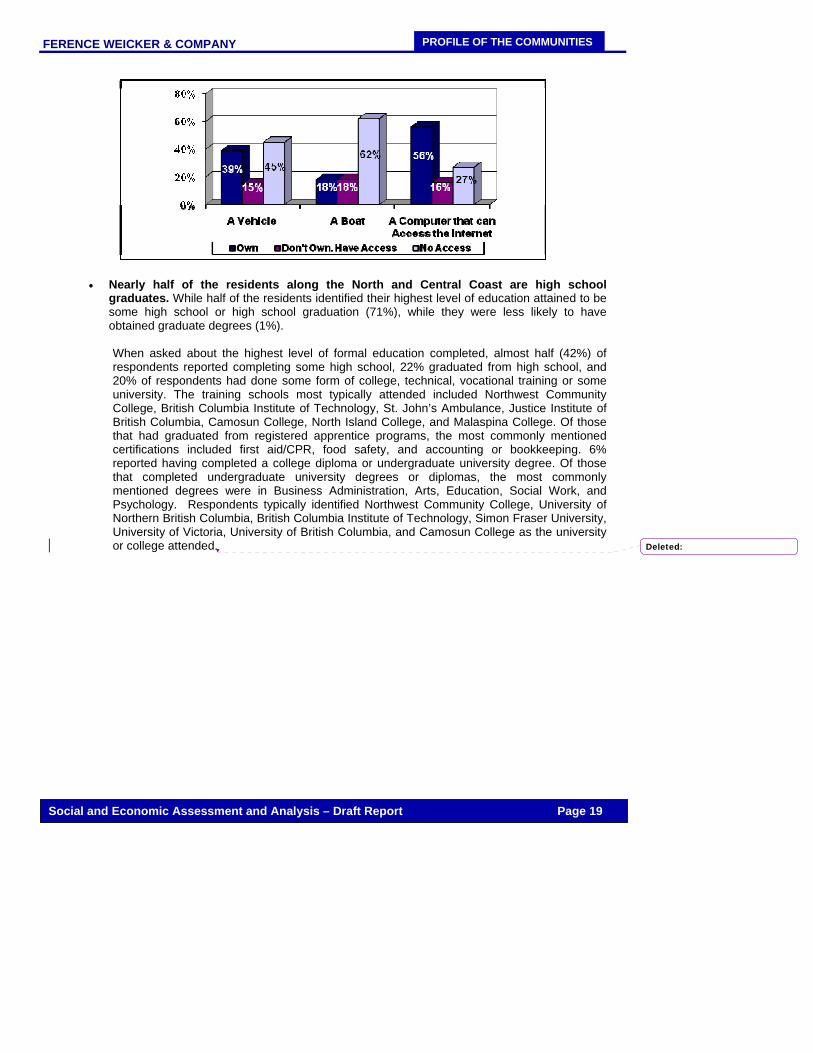
• Nearly half of the residents surveyed are renting their current place of residence. 21%
of residents identified staying with friends and family and other types of living arrangements identified included residence through a rent-to-own program (identified by 18 respondents), and a social house, foster home, and boat being other types of alternative residences noted.
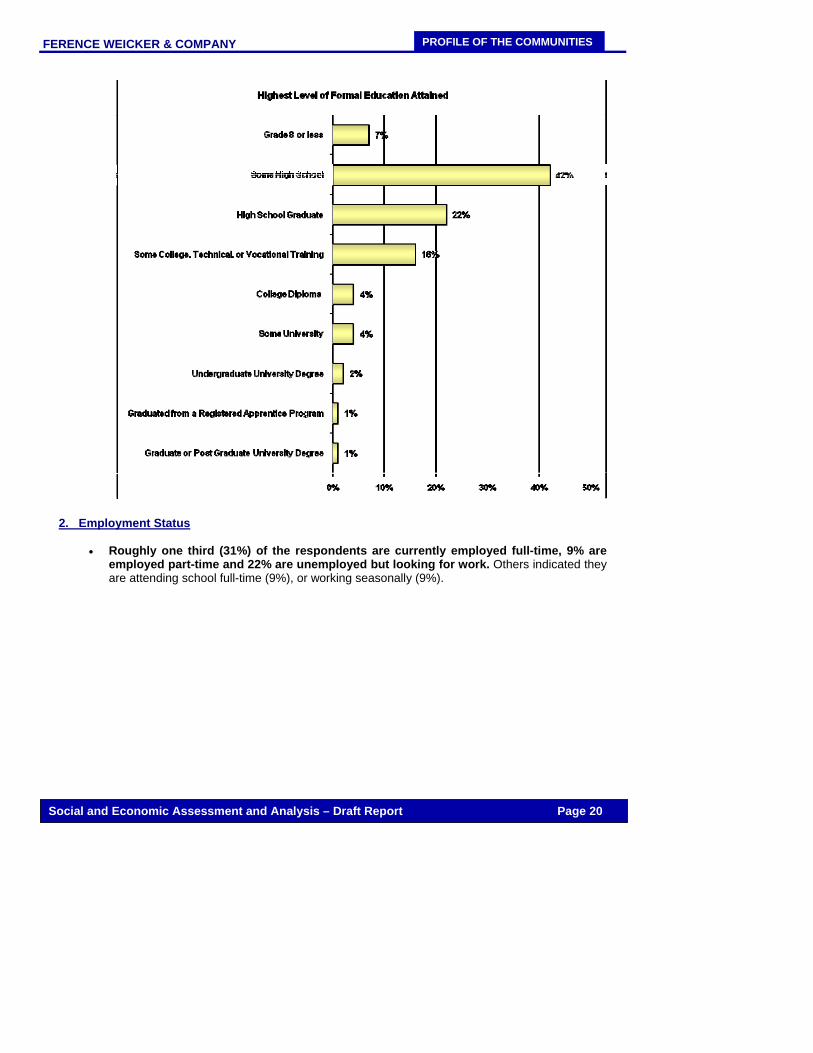
• The majority of the residents surveyed have internet access but are less likely to have access to a boat or a vehicle. The chart below indicates that while most (72%) people can access the internet and just over half (54%) have access to a vehicle, accessing a boat is far less likely.
FERENCE WEICKER & COMPANY
PROFILE OF THE COMMUNITIES
Social and Economic Assessment and Analysis – Draft Report Page 19
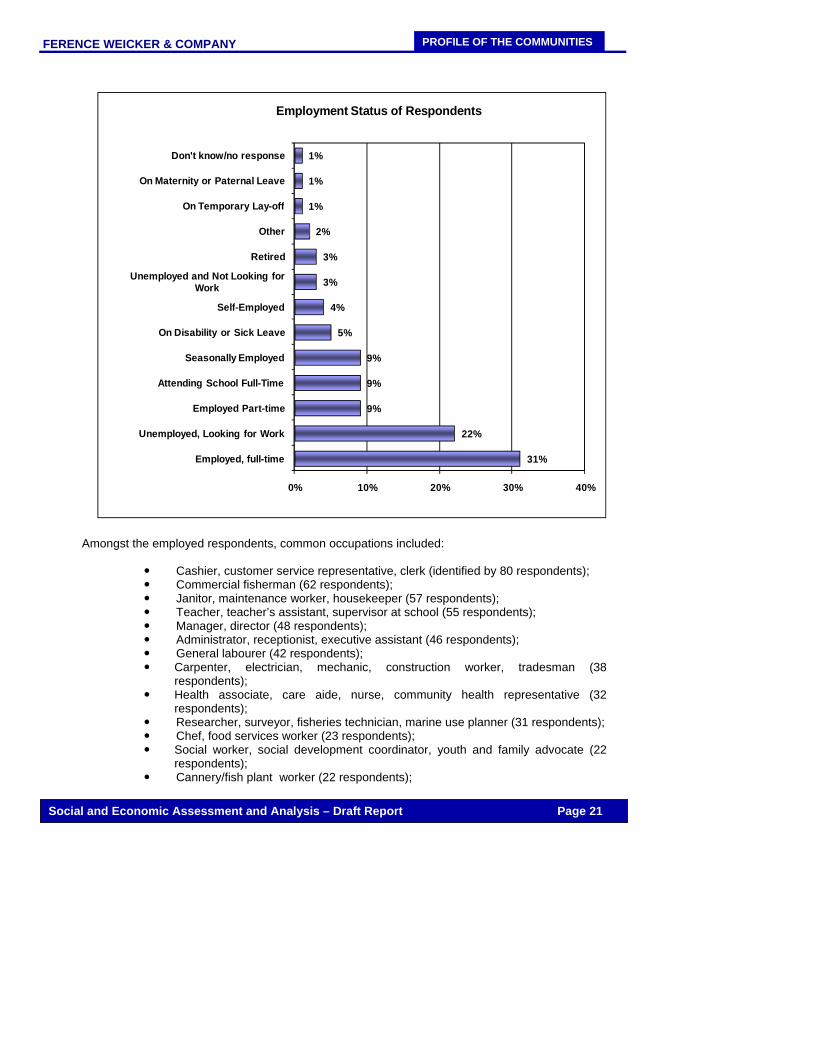
• Nearly half of the residents along the North and Central Coast are high school graduates. While half of the residents identified their highest level of education attained to be some high school or high school graduation (71%), while they were less likely to have obtained graduate degrees (1%).
When asked about the highest level of formal education completed, almost half (42%) of respondents reported completing some high school, 22% graduated from high school, and 20% of respondents had done some form of college, technical, vocational training or some university. The training schools most typically attended included Northwest Community College, British Columbia Institute of Technology, St. John’s Ambulance, Justice Institute of British Columbia, Camosun College, North Island College, and Malaspina College. Of those that had graduated from registered apprentice programs, the most commonly mentioned certifications included first aid/CPR, food safety, and accounting or bookkeeping. 6% reported having completed a college diploma or undergraduate university degree. Of those that completed undergraduate university degrees or diplomas, the most commonly mentioned degrees were in Business Administration, Arts, Education, Social Work, and Psychology. Respondents typically identified Northwest Community College, University of Northern British Columbia, British Columbia Institute of Technology, Simon Fraser University, University of Victoria, University of British Columbia, and Camosun College as the university or college attended.
Deleted:
FERENCE WEICKER & COMPANY
PROFILE OF THE COMMUNITIES
Social and Economic Assessment and Analysis – Draft Report Page 20
2. Employment Status
• Roughly one third (31%) of the respondents are currently employed full-time, 9% are employed part-time and 22% are unemployed but looking for work. Others indicated they are attending school full-time (9%), or working seasonally (9%).
FERENCE WEICKER & COMPANY
PROFILE OF THE COMMUNITIES
Social and Economic Assessment and Analysis – Draft Report Page 21
Amongst the employed respondents, common occupations included:
Cashier, customer service representative, clerk (identified by 80 respondents); Commercial fisherman (62 respondents); Janitor, maintenance worker, housekeeper (57 respondents); Teacher, teacher’s assistant, supervisor at school (55 respondents); Manager, director (48 respondents); Administrator, receptionist, executive assistant (46 respondents); General labourer (42 respondents); Carpenter, electrician, mechanic, construction worker, tradesman (38
respondents); Health associate, care aide, nurse, community health representative (32
respondents); Researcher, surveyor, fisheries technician, marine use planner (31 respondents); Chef, food services worker (23 respondents); Social worker, social development coordinator, youth and family advocate (22
respondents); Cannery/fish plant worker (22 respondents);
31%
22%
9%
9%
9%
5%
4%
3%
3%
2%
1%
1%
1%
0% 10% 20% 30% 40%
Employed, full-time
Unemployed, Looking for Work
Employed Part-time
Attending School Full-Time
Seasonally Employed
On Disability or Sick Leave
Self-Employed
Unemployed and Not Looking for Work
Retired
Other
On Temporary Lay-off
On Maternity or Paternal Leave
Don't know/no response
Employment Status of Respondents
FERENCE WEICKER & COMPANY
PROFILE OF THE COMMUNITIES
Social and Economic Assessment and Analysis – Draft Report Page 22
Shore worker (19 respondents); Bartender, barista, waitress (13 respondents); Accounting/finance (11 respondents); Early childhood educator, babysitter (11 respondents); Carver, basket weaver, artist (10 respondents); and Fishing or tour guide (9 respondents).
• Of the residents who are currently employed, just under half (46%) work on-reserve
while 38% work off-reserve and 4% work at other locations including both on-reserve and off-reserve places and commercial fishing grounds. Most common locations of off-reserve employment included Prince Rupert (identified by 142 respondents), Terrace (35 respondents), Bella Coola (12 respondents), Campbell River (8 respondents), Nanaimo (5 respondents), and Victoria (5 respondents). Residents worked an average of 26 weeks over the past 12 months. 20% of residents noted they worked at more than one organization over the past year (an average of 1.25 organizations).
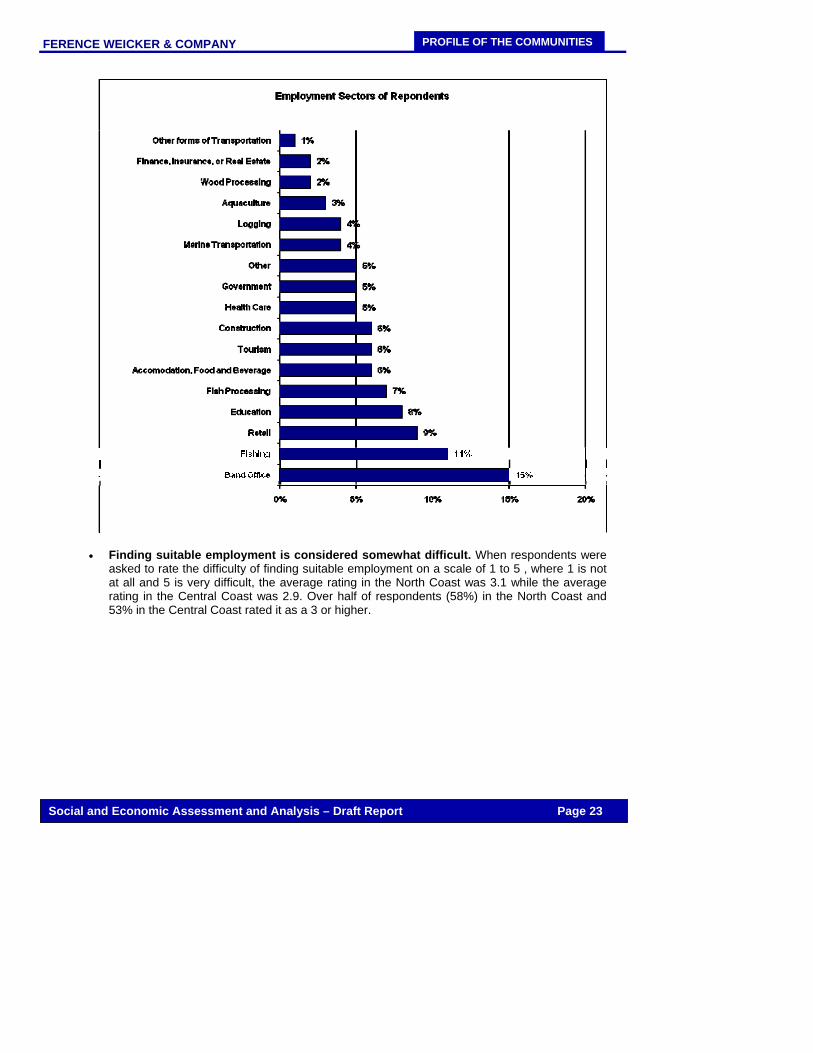
• Over the past 12 months, residents most commonly reported working in the Band
office, fishing, retail, and education sector. The types of fisheries identified included salmon (identified by 27 respondents), herring (13 respondents), gillnet fishing (8 respondents), crab (7 respondents), halibut (7 respondents), cod (4 respondents), seine fishing (4 respondents), roe on kelp (3 respondents), sea cucumber (3 respondents), sport fishing (2 respondents), clamming (2 respondents), groundfish (1 respondent), trout (1 respondent), seaweed (1 respondent), and eel grass (1 respondent). An additional ten residents noted they worked in the commercial fishing sector but did not specify the type of fishery.
Those residents having worked in the aquaculture sector identified shellfish farming (10 respondents), fish farming (6 respondents), and oolichans (1 respondent) as types of aquaculture operations they were employed in. The 80 respondents who worked in tourism worked for a variety of operations including eco/adventure/marine/sport/bear tours (identified by 13 respondents), hotel maintenance and/or meal preparation (10 respondents), ferry service (3 respondent), and working for airlines like Harbour Air and Pacific Air Seaplanes (2 respondents). Other types of organizations identified included Seashore Charters, Moby Dick Inn, Pacific Inn, Aboriginal Journeys Wildlife & Adventure Tours, and Kermodei Tourism.
FERENCE WEICKER & COMPANY
PROFILE OF THE COMMUNITIES
Social and Economic Assessment and Analysis – Draft Report Page 23
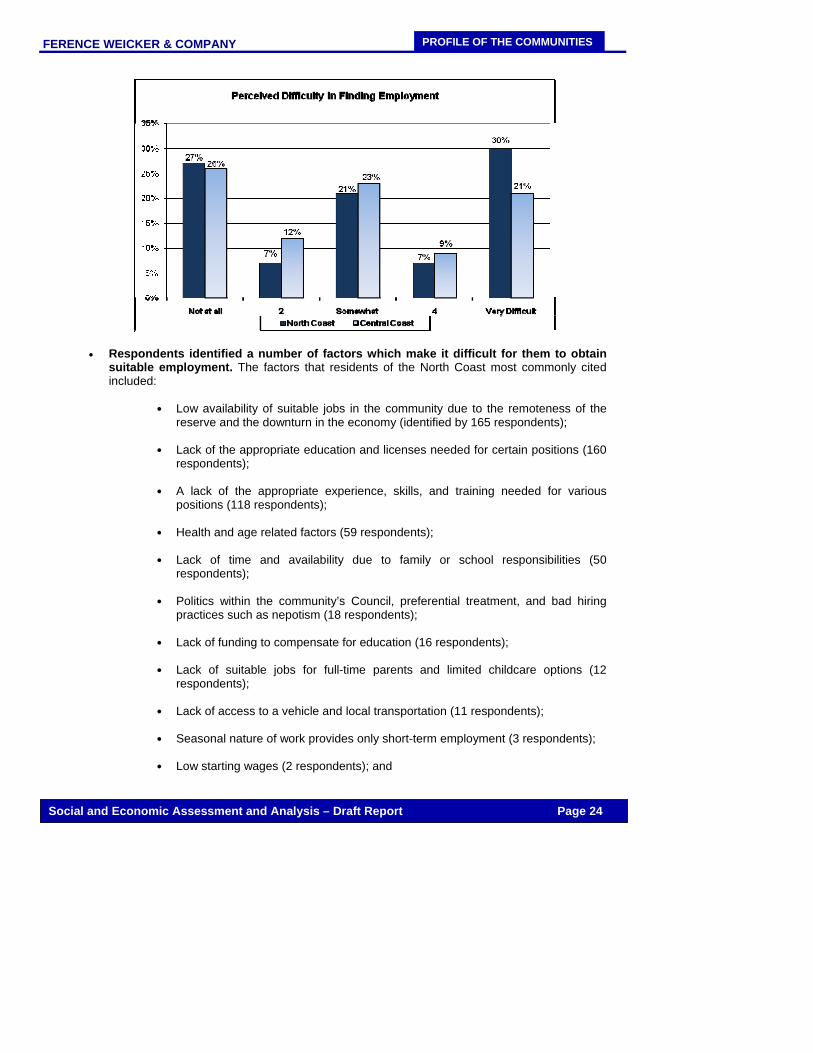
• Finding suitable employment is considered somewhat difficult. When respondents were asked to rate the difficulty of finding suitable employment on a scale of 1 to 5 , where 1 is not at all and 5 is very difficult, the average rating in the North Coast was 3.1 while the average rating in the Central Coast was 2.9. Over half of respondents (58%) in the North Coast and 53% in the Central Coast rated it as a 3 or higher.
FERENCE WEICKER & COMPANY
PROFILE OF THE COMMUNITIES
Social and Economic Assessment and Analysis – Draft Report Page 24
• Respondents identified a number of factors which make it difficult for them to obtain
suitable employment. The factors that residents of the North Coast most commonly cited included:
Low availability of suitable jobs in the community due to the remoteness of the
reserve and the downturn in the economy (identified by 165 respondents);
Lack of the appropriate education and licenses needed for certain positions (160 respondents);
A lack of the appropriate experience, skills, and training needed for various positions (118 respondents);
Health and age related factors (59 respondents);
Lack of time and availability due to family or school responsibilities (50 respondents);
Politics within the community’s Council, preferential treatment, and bad hiring practices such as nepotism (18 respondents);
Lack of funding to compensate for education (16 respondents);
Lack of suitable jobs for full-time parents and limited childcare options (12 respondents);
Lack of access to a vehicle and local transportation (11 respondents);
Seasonal nature of work provides only short-term employment (3 respondents);
Low starting wages (2 respondents); and
FERENCE WEICKER & COMPANY
PROFILE OF THE COMMUNITIES
Social and Economic Assessment and Analysis – Draft Report Page 25
Lack of job postings (1 respondent).
The factors that residents of the Central Coast most commonly cited included:
Low availability of suitable jobs in the community (identified by 103 respondents);
A lack of the appropriate experience and skills needed for various positions (59
respondents);
Lack of the appropriate education needed for certain positions and lack of funding available to obtain education (28 respondents);
Health related factors (24 respondents);
The seasonal nature of the jobs, which provides only short-term employment (3 respondents);
Lack of licenses needed for many jobs (3 respondent);
The community’s isolated location (2 respondents);
Limited childcare options for full-time parents (2 respondents);
Politics within the community’s Council, preferential treatment, and bad hiring practices such as nepotism (2 respondents); and
Lack of Band membership (1 respondent).
When North Coast residents were asked to identify the type of job they would like to get, they identified:
A job in the trades (identified by 94 respondents); Any kind of work that is available (76 respondents); Working in the field of administration or business (76 respondents); A job related to the marine sector (75 respondents); Working with children, youth, or elders in the community (49 respondents); Working in the hospitality, food, and tourism industry (42 respondents); Working in health care (32 respondents); Working in the retail, service, or sales fields (24 respondents); A job related to education (17 respondents); Working related to logging or forestry (17 respondents); Working outdoors (10 respondents); Working at the local Band office (3 respondents); Working in the mining field (3 respondents); Working as a computer programmer or web designer (2 respondents); Working in landscaping (2 respondents); Working as an engineer (2 respondents); Working as an archaeologist (1 respondent); Working as a coast guard watchman (1 respondent); and Working in law enforcement (1 respondent).
FERENCE WEICKER & COMPANY
PROFILE OF THE COMMUNITIES
Social and Economic Assessment and Analysis – Draft Report Page 26
When Central Coast residents were asked to identify the type of job they would like to get, they identified:
Working with youth and elders in the community (identified by 35 respondent); A job in the trades (21 respondents); Working in the administration or business field (20 respondents); A job related to the marine sector (17 respondents); Working in health care (17 respondents); A job related to education (12 respondents); Working in logging or forestry (11 respondents); and Working in the hospitality and tourism industry (5 respondents).
3. Personal Income
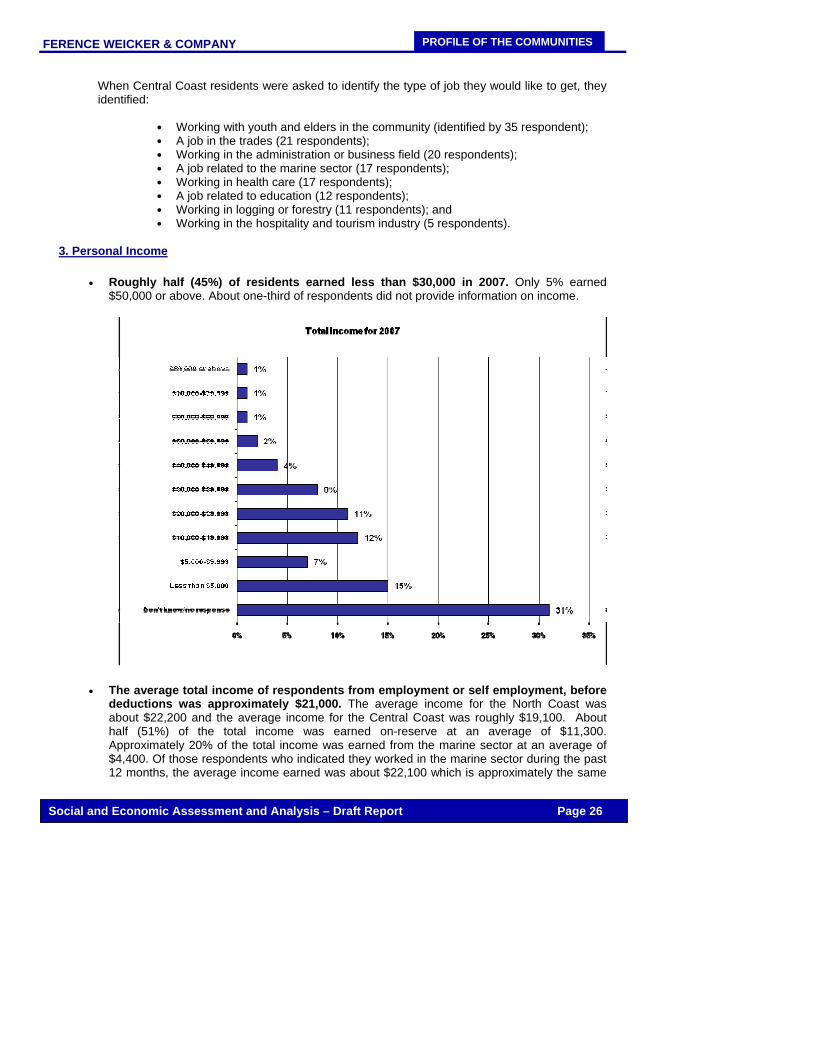
• Roughly half (45%) of residents earned less than $30,000 in 2007. Only 5% earned $50,000 or above. About one-third of respondents did not provide information on income.
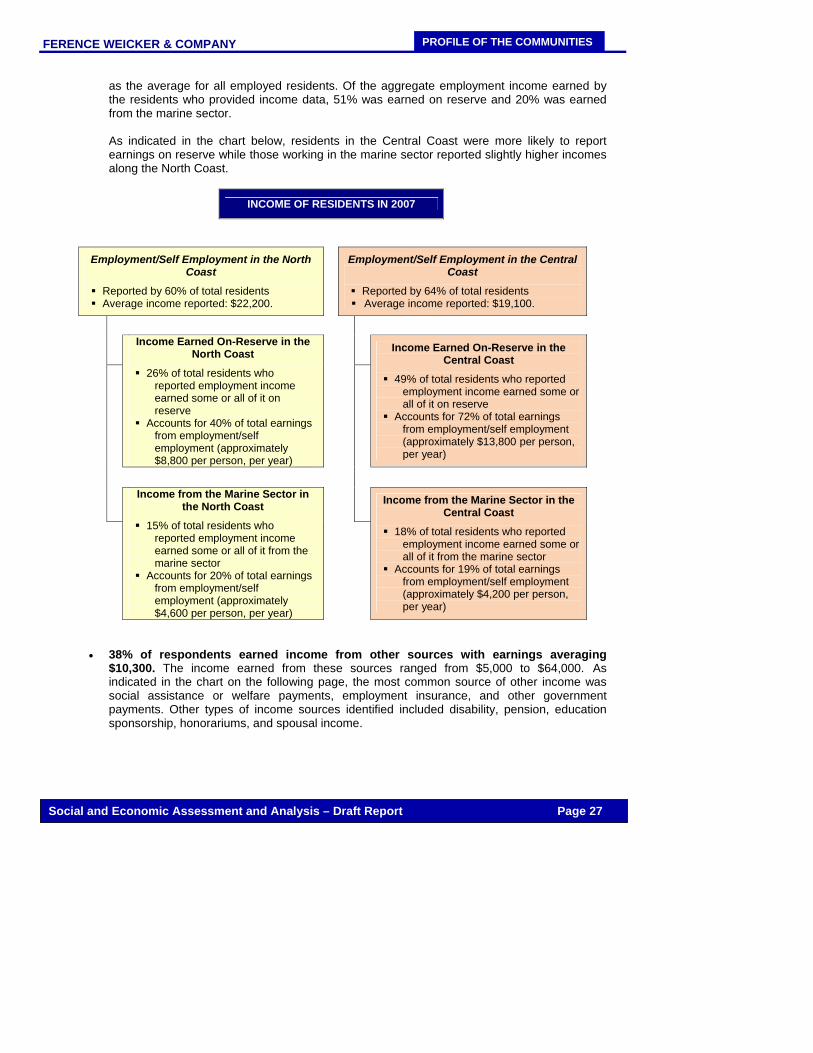
• The average total income of respondents from employment or self employment, before deductions was approximately $21,000. The average income for the North Coast was about $22,200 and the average income for the Central Coast was roughly $19,100. About half (51%) of the total income was earned on-reserve at an average of $11,300. Approximately 20% of the total income was earned from the marine sector at an average of $4,400. Of those respondents who indicated they worked in the marine sector during the past 12 months, the average income earned was about $22,100 which is approximately the same
FERENCE WEICKER & COMPANY
PROFILE OF THE COMMUNITIES
Social and Economic Assessment and Analysis – Draft Report Page 27
as the average for all employed residents. Of the aggregate employment income earned by the residents who provided income data, 51% was earned on reserve and 20% was earned from the marine sector. As indicated in the chart below, residents in the Central Coast were more likely to report earnings on reserve while those working in the marine sector reported slightly higher incomes along the North Coast.
INCOME OF RESIDENTS IN 2007
Employment/Self Employment in the North Coast
Reported by 60% of total residents Average income reported: $22,200.
Employment/Self Employment in the Central Coast
Reported by 64% of total residents Average income reported: $19,100.
Income Earned On-Reserve in the North Coast
26% of total residents who reported employment income earned some or all of it on reserve
Accounts for 40% of total earnings from employment/self employment (approximately $8,800 per person, per year)
Income Earned On-Reserve in the Central Coast
49% of total residents who reported employment income earned some or all of it on reserve
Accounts for 72% of total earnings from employment/self employment (approximately $13,800 per person, per year)
Income from the Marine Sector in the North Coast
15% of total residents who reported employment income earned some or all of it from the marine sector
Accounts for 20% of total earnings from employment/self employment (approximately $4,600 per person, per year)
Income from the Marine Sector in the Central Coast
18% of total residents who reported employment income earned some or all of it from the marine sector
Accounts for 19% of total earnings from employment/self employment (approximately $4,200 per person, per year)
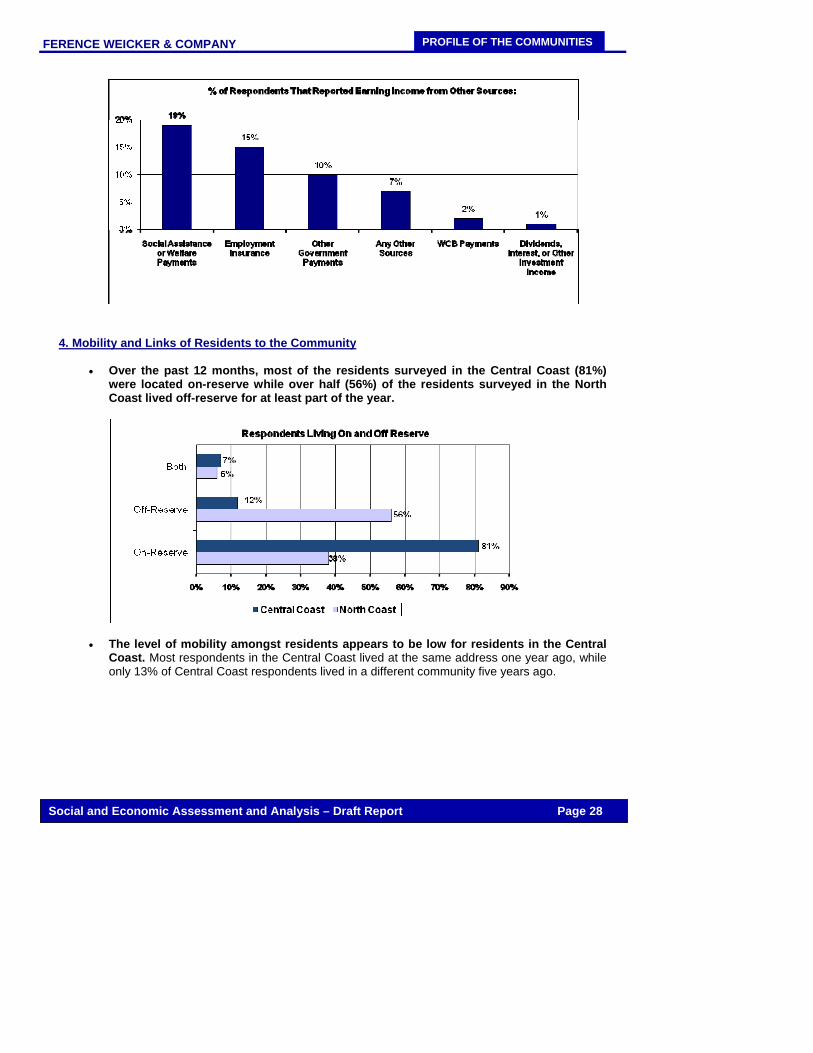
• 38% of respondents earned income from other sources with earnings averaging $10,300. The income earned from these sources ranged from $5,000 to $64,000. As indicated in the chart on the following page, the most common source of other income was social assistance or welfare payments, employment insurance, and other government payments. Other types of income sources identified included disability, pension, education sponsorship, honorariums, and spousal income.
FERENCE WEICKER & COMPANY
PROFILE OF THE COMMUNITIES
Social and Economic Assessment and Analysis – Draft Report Page 28
4. Mobility and Links of Residents to the Community
• Over the past 12 months, most of the residents surveyed in the Central Coast (81%) were located on-reserve while over half (56%) of the residents surveyed in the North Coast lived off-reserve for at least part of the year.
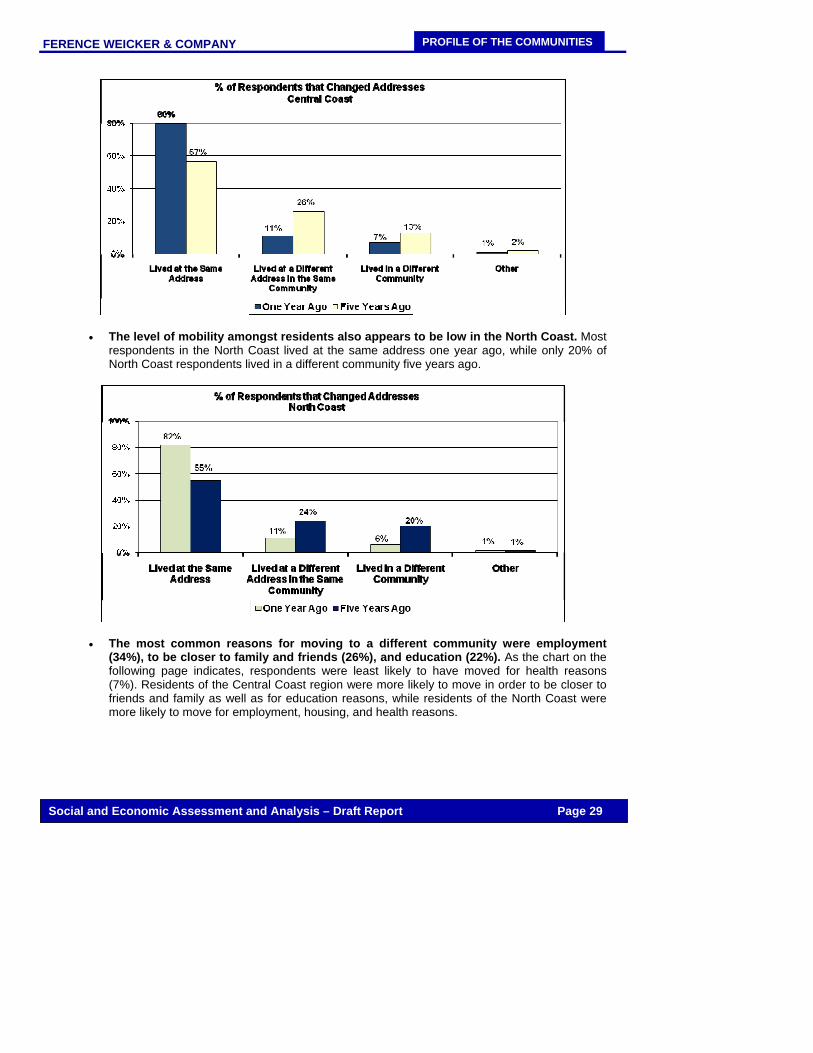
• The level of mobility amongst residents appears to be low for residents in the Central Coast. Most respondents in the Central Coast lived at the same address one year ago, while only 13% of Central Coast respondents lived in a different community five years ago.
FERENCE WEICKER & COMPANY
PROFILE OF THE COMMUNITIES
Social and Economic Assessment and Analysis – Draft Report Page 29
• The level of mobility amongst residents also appears to be low in the North Coast. Most respondents in the North Coast lived at the same address one year ago, while only 20% of North Coast respondents lived in a different community five years ago.
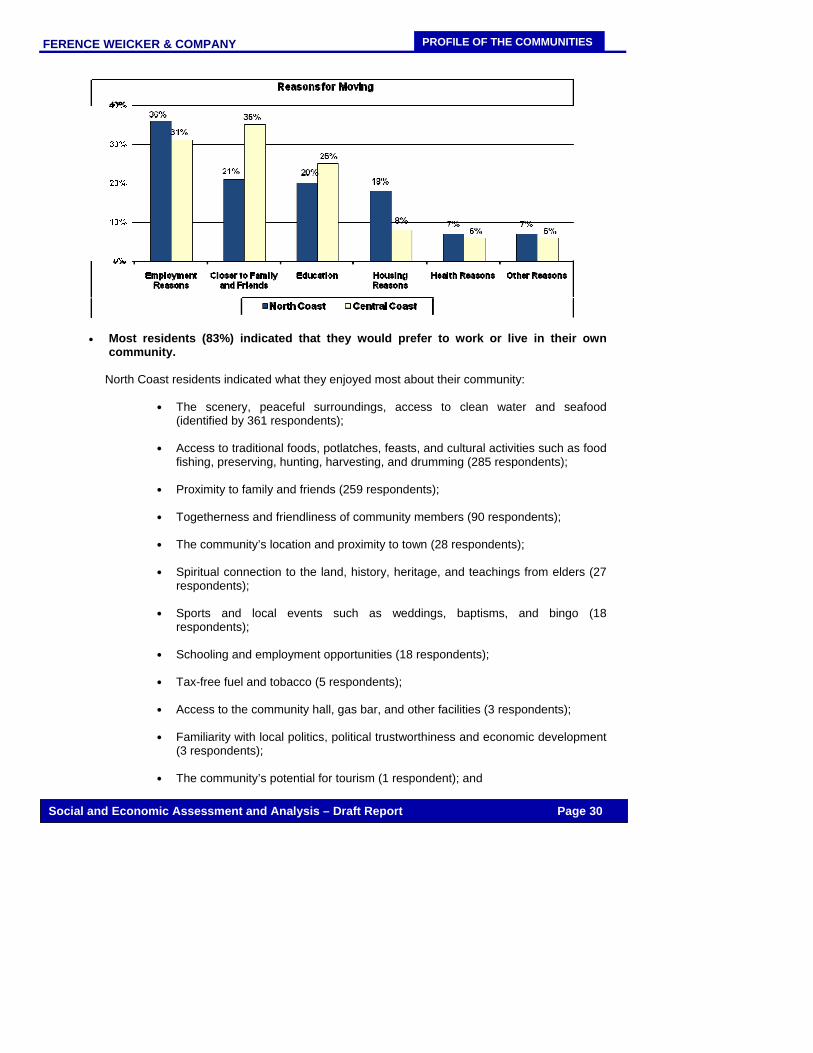
• The most common reasons for moving to a different community were employment (34%), to be closer to family and friends (26%), and education (22%). As the chart on the following page indicates, respondents were least likely to have moved for health reasons (7%). Residents of the Central Coast region were more likely to move in order to be closer to friends and family as well as for education reasons, while residents of the North Coast were more likely to move for employment, housing, and health reasons.
FERENCE WEICKER & COMPANY
PROFILE OF THE COMMUNITIES
Social and Economic Assessment and Analysis – Draft Report Page 30
• Most residents (83%) indicated that they would prefer to work or live in their own community.
North Coast residents indicated what they enjoyed most about their community:
The scenery, peaceful surroundings, access to clean water and seafood (identified by 361 respondents);
Access to traditional foods, potlatches, feasts, and cultural activities such as food fishing, preserving, hunting, harvesting, and drumming (285 respondents);
Proximity to family and friends (259 respondents);
Togetherness and friendliness of community members (90 respondents);
The community’s location and proximity to town (28 respondents);
Spiritual connection to the land, history, heritage, and teachings from elders (27 respondents);
Sports and local events such as weddings, baptisms, and bingo (18 respondents);
Schooling and employment opportunities (18 respondents);
Tax-free fuel and tobacco (5 respondents);
Access to the community hall, gas bar, and other facilities (3 respondents);
Familiarity with local politics, political trustworthiness and economic development (3 respondents);
The community’s potential for tourism (1 respondent); and
FERENCE WEICKER & COMPANY
PROFILE OF THE COMMUNITIES
Social and Economic Assessment and Analysis – Draft Report Page 31
Participation in youth-oriented organizations (1 respondent).
Central Coast residents indicated what they enjoyed most about their community:
Proximity to family and friends (identified by 167 respondents);
Access to traditional foods, potlatches, feasts, and cultural activities such as food
fishing, preserving, hunting, harvesting, and drumming (137 respondents);
The scenery, surroundings, access to clean water, and spiritual values (45 respondents);
Togetherness of the community and feeling of belonging (40 respondents);
Local halls, community centers, and programs such as basketball and bingo (16 respondents);
Isolation and calm of the community (10 respondents);
Employment opportunities (8 respondents);
Proximity to fishing and hunting grounds (6 respondents); and
Health benefits and access to medical help (3 respondents).
FERENCE WEICKER & COMPANY
Social and Economic Assessment and Analysis – Draft Report Page 32
SECTOR LINKAGES
III. CHARACTERISTICS OF THE MARINE SECTORS The following section provides an overview of the key marine sectors in the North and Central Coast including the commercial fishing, aquaculture and seafood processing, marine tourism, marine transportation and energy sectors. A. OVERVIEW OF THE KEY SECTORS The economy of the Central and North Coast has been built largely on fishing, forestry, mining, smelting, and tourism-related activities and, as such, has been strongly impacted by cycles in the resource industries. While fishing and forestry-related activities have been declining in economic importance, there have been significant new investments related to transportation, tourism, mining, and energy. In addition, the public sector is an important source of jobs and income for local communities, particularly in the Central Coast. Some of the key recent and planned investments in the Central and North Coast regions include:
• Expansion of port facilities in areas such as Prince Rupert and Kitimat; • Development of a new cruise ship terminal in Prince Rupert; • Storage facilities to accommodate new and proposed pipelines; • Various hydroelectric projects including run-of-the-river projects; • Mineral exploration and development projects; • Development of wind farms; • Residential developments; and • Improvements to the road infrastructure.
In the first quarter of 2008, there were 31 major projects either proposed or underway in the North Coast Development Region of BC2: primarily energy, mining, transportation and warehousing projects. The value of started and proposed projects totals about $17 billion, which represents approximately 11% of the provincial total3. With these projects, there has been a significant increase in employment related to construction which has helped to offset declines in other sectors particularly in manufacturing related to the resource industries. Unemployment rates in the region declined steadily from 12.6% in 2002 to 6.7% in 2006 which, although improving faster than the rest of the province, was still well above the provincial average. However, in 2007, unemployment increased to 8%. The public sector continues to be the most stable source of jobs and income for local communities4. 1. Commercial Fishing, Aquaculture and Seafood Processing Commercial fishing refers to the activity of capturing fish and other seafood for profit, mostly from wild fisheries. Aquaculture is defined as the farming of finfish, shellfish and aquatic plants in both freshwater and saltwater environments. Seafood processing involves handling seafood from both the wild harvest and the aquaculture operations and producing fresh, frozen, canned and smoked products. BC is home to prime fishing grounds, world famous salmon rearing rivers, and ocean farming areas. BC seafood products encompass more than 90 species of wild and cultured fish, shellfish and marine plants. BC is also the fourth largest producer of farmed salmon in the world. 2 North Coast Development Region is larger than the PNCIMA 3 BC Stats 4 Ibid
FERENCE WEICKER & COMPANY
Social and Economic Assessment and Analysis – Draft Report Page 33
SECTOR LINKAGES
In recent years, the BC seafood industry has produced 300,000 to 350,000 tonnes of output worth $600 to $700 million at the primary landed or farm gate level and approximately $1.1 billion to $1.2 billion at the wholesale (processed) level. Approximately 20% to 30% of the volume and 30% to 40% of the value are tied to aquaculture production, mainly farmed salmon production5. In 2006, BC was the leading seafood exporter among Canadian provinces and territories with sales of $987 million, which accounted for 24 percent of total Canadian seafood exports6. The following table outlines the GDP and employment figures for the commercial fishery, aquaculture and seafood processing sectors in 2005:
GDP AND EMPLOYMENT BY SECTOR (2007)7
Sector GDP ($1997 million) Employment Capture/Commercial Fishing 135 2,000
Aquaculture 71 2,100 Seafood Processing 173 3,700
The BC seafood sector was once dominated by wild (capture) salmon and herring species, but their importance has declined over the past 20 years. In 1990, salmon was the major seafood species harvested in the province, accounting for about 55% of the total value of the commercial catch. By 2005, the species made up just 10% of the total value of the catch. This represents a significant shift in the nature of the industry. Herring used to be the second most important species, based on landed value. It now accounts for 10% of the total value of landings. The halibut fishery is becoming increasingly important, as is the harvesting of prawns, sablefish and hake8. The fishery of the North and Central Coast is renowned for its many salmon runs and the cultures that built on top of them throughout the region. Nevertheless, in response to declines in salmon stocks, the commercial fishery in BC has been diversifying through placing an increasing emphasis on the harvest of species other than salmon. Other activities have included retiring vessels from the active fleet, ] and developing new markets for products already being harvested. Major commercial fisheries include halibut, herring and herring roe, sea urchin, cod, crab, and shellfish. In 2005, 62% of the salmon catch and 38% of the shellfish catch were landed in the North Coast region9. The number of commercial fishing licenses held by Central and North Coast nations in 2006-2007 is summarized in the following tables.
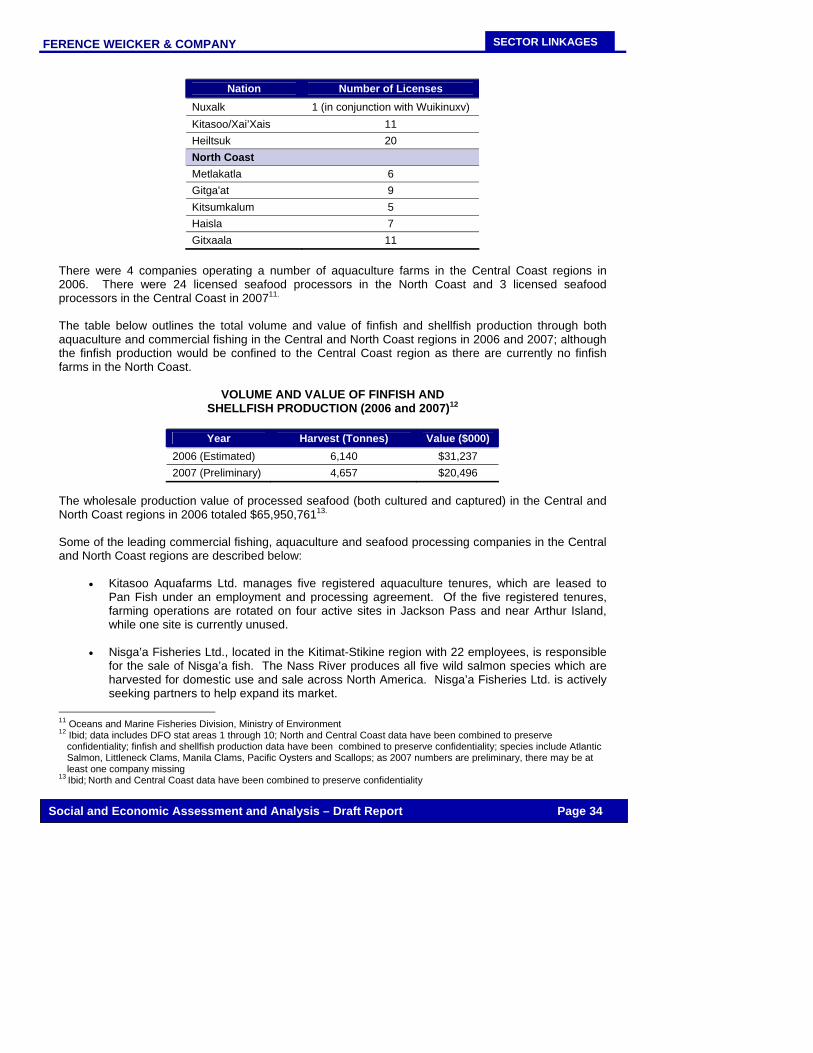
COMMERCIAL FISHING LICENSES FOR CENTRAL AND NORTH COAST NATIONS IN 2006 - 200710
Nation Number of Licenses
Central Coast Wuikinuxv 6
5 Economic Contribution of the Oceans Sector in British Columbia, GSGislason & Associates Ltd., 2007 6 http://www.canadaspacificgateway.ca/en/invest/sectors.html 7 British Columbia's Fisheries and Aquaculture Sector, BC Stats, 2007 8 http://www.guidetobceconomy.org/major_industries/fishing.htm 9 Ibid, data for the Central Coast is not available but perhaps Central Coast is included in the definition of North Coast 10 Community Socioeconomic Profiles, Central Coast Area Technical Team, 2007; North Coast Socioeconomic profiles, 2009
FERENCE WEICKER & COMPANY
Social and Economic Assessment and Analysis – Draft Report Page 34
SECTOR LINKAGES
Nation Number of Licenses Nuxalk 1 (in conjunction with Wuikinuxv) Kitasoo/Xai’Xais 11 Heiltsuk 20 North Coast Metlakatla 6 Gitga'at 9 Kitsumkalum 5 Haisla 7 Gitxaala 11
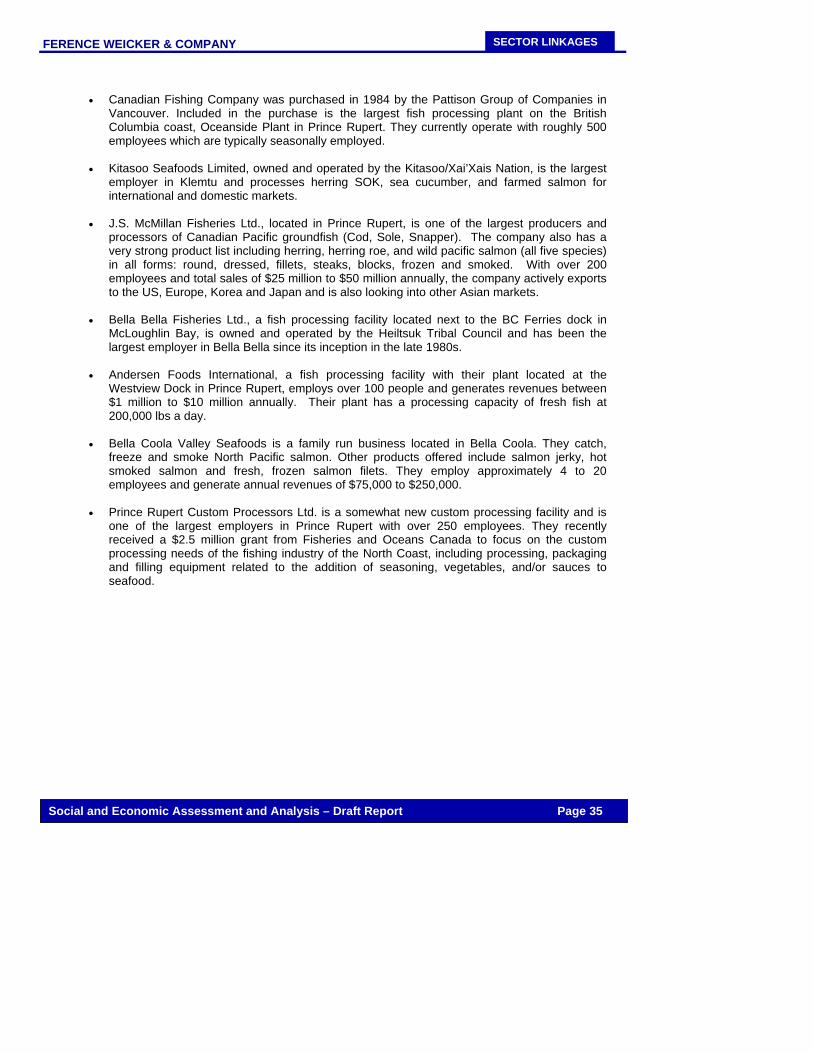
There were 4 companies operating a number of aquaculture farms in the Central Coast regions in 2006. There were 24 licensed seafood processors in the North Coast and 3 licensed seafood processors in the Central Coast in 200711. The table below outlines the total volume and value of finfish and shellfish production through both aquaculture and commercial fishing in the Central and North Coast regions in 2006 and 2007; although the finfish production would be confined to the Central Coast region as there are currently no finfish farms in the North Coast.
VOLUME AND VALUE OF FINFISH AND
SHELLFISH PRODUCTION (2006 and 2007)12
Year Harvest (Tonnes) Value ($000) 2006 (Estimated) 6,140 $31,237 2007 (Preliminary) 4,657 $20,496
The wholesale production value of processed seafood (both cultured and captured) in the Central and North Coast regions in 2006 totaled $65,950,76113. Some of the leading commercial fishing, aquaculture and seafood processing companies in the Central and North Coast regions are described below:
• Kitasoo Aquafarms Ltd. manages five registered aquaculture tenures, which are leased to Pan Fish under an employment and processing agreement. Of the five registered tenures, farming operations are rotated on four active sites in Jackson Pass and near Arthur Island, while one site is currently unused.
• Nisga’a Fisheries Ltd., located in the Kitimat-Stikine region with 22 employees, is responsible
for the sale of Nisga’a fish. The Nass River produces all five wild salmon species which are harvested for domestic use and sale across North America. Nisga’a Fisheries Ltd. is actively seeking partners to help expand its market.
11 Oceans and Marine Fisheries Division, Ministry of Environment 12 Ibid; data includes DFO stat areas 1 through 10; North and Central Coast data have been combined to preserve confidentiality; finfish and shellfish production data have been combined to preserve confidentiality; species include Atlantic Salmon, Littleneck Clams, Manila Clams, Pacific Oysters and Scallops; as 2007 numbers are preliminary, there may be at least one company missing 13 Ibid; North and Central Coast data have been combined to preserve confidentiality
FERENCE WEICKER & COMPANY
Social and Economic Assessment and Analysis – Draft Report Page 35
SECTOR LINKAGES
• Canadian Fishing Company was purchased in 1984 by the Pattison Group of Companies in
Vancouver. Included in the purchase is the largest fish processing plant on the British Columbia coast, Oceanside Plant in Prince Rupert. They currently operate with roughly 500 employees which are typically seasonally employed.
• Kitasoo Seafoods Limited, owned and operated by the Kitasoo/Xai’Xais Nation, is the largest employer in Klemtu and processes herring SOK, sea cucumber, and farmed salmon for international and domestic markets.
• J.S. McMillan Fisheries Ltd., located in Prince Rupert, is one of the largest producers and processors of Canadian Pacific groundfish (Cod, Sole, Snapper). The company also has a very strong product list including herring, herring roe, and wild pacific salmon (all five species) in all forms: round, dressed, fillets, steaks, blocks, frozen and smoked. With over 200 employees and total sales of $25 million to $50 million annually, the company actively exports to the US, Europe, Korea and Japan and is also looking into other Asian markets.
• Bella Bella Fisheries Ltd., a fish processing facility located next to the BC Ferries dock in
McLoughlin Bay, is owned and operated by the Heiltsuk Tribal Council and has been the largest employer in Bella Bella since its inception in the late 1980s.
• Andersen Foods International, a fish processing facility with their plant located at the Westview Dock in Prince Rupert, employs over 100 people and generates revenues between $1 million to $10 million annually. Their plant has a processing capacity of fresh fish at 200,000 lbs a day.
• Bella Coola Valley Seafoods is a family run business located in Bella Coola. They catch, freeze and smoke North Pacific salmon. Other products offered include salmon jerky, hot smoked salmon and fresh, frozen salmon filets. They employ approximately 4 to 20 employees and generate annual revenues of $75,000 to $250,000.
• Prince Rupert Custom Processors Ltd. is a somewhat new custom processing facility and is one of the largest employers in Prince Rupert with over 250 employees. They recently received a $2.5 million grant from Fisheries and Oceans Canada to focus on the custom processing needs of the fishing industry of the North Coast, including processing, packaging and filling equipment related to the addition of seasoning, vegetables, and/or sauces to seafood.
FERENCE WEICKER & COMPANY
Social and Economic Assessment and Analysis – Draft Report Page 36
SECTOR LINKAGES
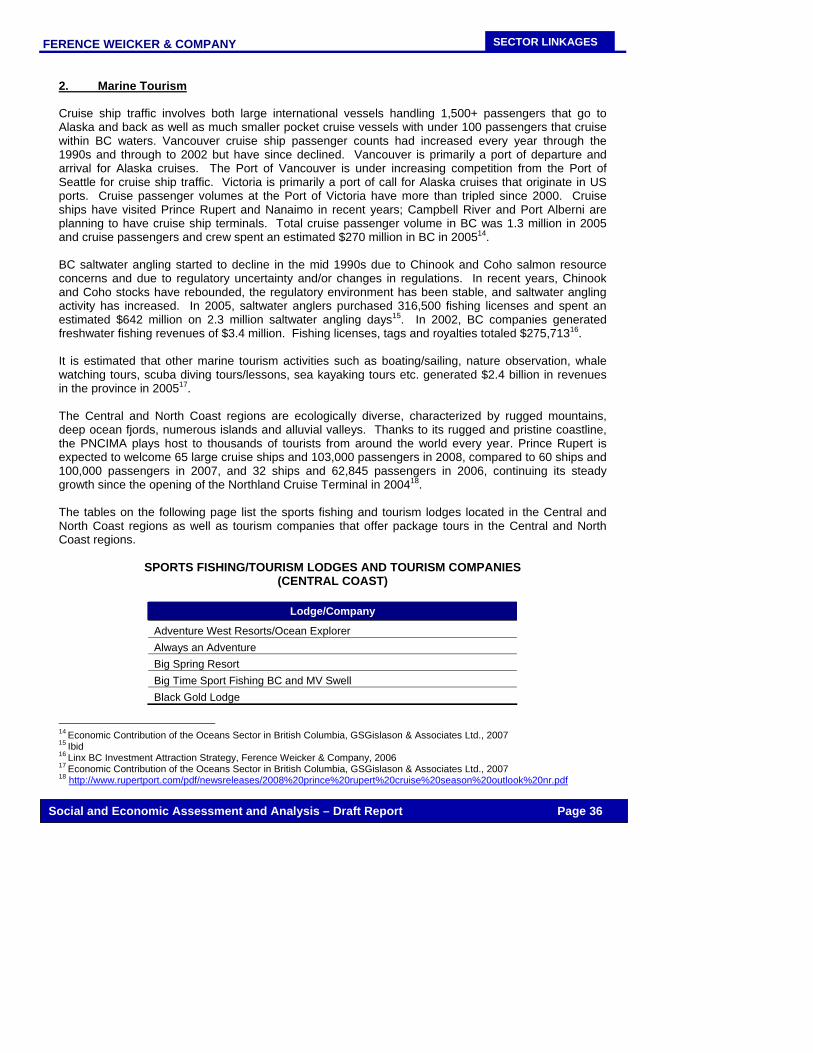
2. Marine Tourism Cruise ship traffic involves both large international vessels handling 1,500+ passengers that go to Alaska and back as well as much smaller pocket cruise vessels with under 100 passengers that cruise within BC waters. Vancouver cruise ship passenger counts had increased every year through the 1990s and through to 2002 but have since declined. Vancouver is primarily a port of departure and arrival for Alaska cruises. The Port of Vancouver is under increasing competition from the Port of Seattle for cruise ship traffic. Victoria is primarily a port of call for Alaska cruises that originate in US ports. Cruise passenger volumes at the Port of Victoria have more than tripled since 2000. Cruise ships have visited Prince Rupert and Nanaimo in recent years; Campbell River and Port Alberni are planning to have cruise ship terminals. Total cruise passenger volume in BC was 1.3 million in 2005 and cruise passengers and crew spent an estimated $270 million in BC in 200514. BC saltwater angling started to decline in the mid 1990s due to Chinook and Coho salmon resource concerns and due to regulatory uncertainty and/or changes in regulations. In recent years, Chinook and Coho stocks have rebounded, the regulatory environment has been stable, and saltwater angling activity has increased. In 2005, saltwater anglers purchased 316,500 fishing licenses and spent an estimated $642 million on 2.3 million saltwater angling days15. In 2002, BC companies generated freshwater fishing revenues of $3.4 million. Fishing licenses, tags and royalties totaled $275,71316. It is estimated that other marine tourism activities such as boating/sailing, nature observation, whale watching tours, scuba diving tours/lessons, sea kayaking tours etc. generated $2.4 billion in revenues in the province in 200517. The Central and North Coast regions are ecologically diverse, characterized by rugged mountains, deep ocean fjords, numerous islands and alluvial valleys. Thanks to its rugged and pristine coastline, the PNCIMA plays host to thousands of tourists from around the world every year. Prince Rupert is expected to welcome 65 large cruise ships and 103,000 passengers in 2008, compared to 60 ships and 100,000 passengers in 2007, and 32 ships and 62,845 passengers in 2006, continuing its steady growth since the opening of the Northland Cruise Terminal in 200418. The tables on the following page list the sports fishing and tourism lodges located in the Central and North Coast regions as well as tourism companies that offer package tours in the Central and North Coast regions.
SPORTS FISHING/TOURISM LODGES AND TOURISM COMPANIES (CENTRAL COAST)
Lodge/Company
Adventure West Resorts/Ocean Explorer Always an Adventure Big Spring Resort Big Time Sport Fishing BC and MV Swell Black Gold Lodge
14 Economic Contribution of the Oceans Sector in British Columbia, GSGislason & Associates Ltd., 2007 15 Ibid 16 Linx BC Investment Attraction Strategy, Ference Weicker & Company, 2006 17 Economic Contribution of the Oceans Sector in British Columbia, GSGislason & Associates Ltd., 2007 18 http://www.rupertport.com/pdf/newsreleases/2008%20prince%20rupert%20cruise%20season%20outlook%20nr.pdf
FERENCE WEICKER & COMPANY
Social and Economic Assessment and Analysis – Draft Report Page 37
SECTOR LINKAGES
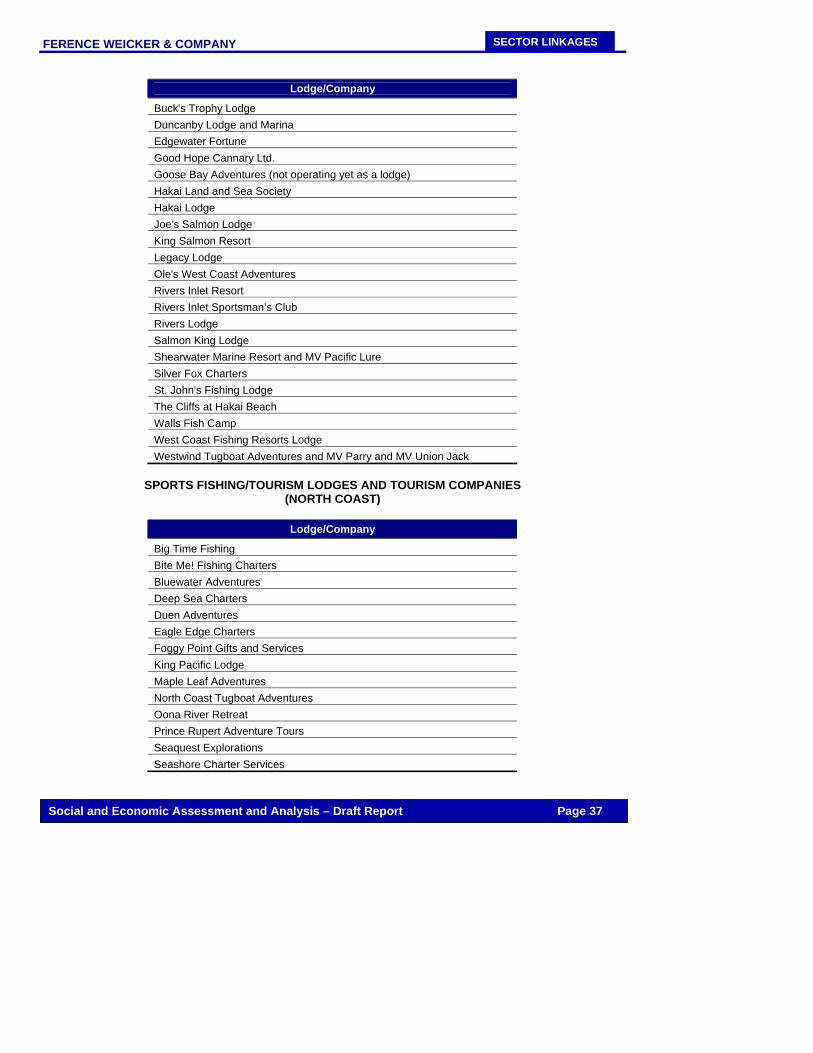
Lodge/Company
Buck's Trophy Lodge Duncanby Lodge and Marina Edgewater Fortune Good Hope Cannary Ltd. Goose Bay Adventures (not operating yet as a lodge) Hakai Land and Sea Society Hakai Lodge Joe's Salmon Lodge King Salmon Resort Legacy Lodge Ole's West Coast Adventures Rivers Inlet Resort Rivers Inlet Sportsman’s Club Rivers Lodge Salmon King Lodge Shearwater Marine Resort and MV Pacific Lure Silver Fox Charters St. John's Fishing Lodge The Cliffs at Hakai Beach Walls Fish Camp West Coast Fishing Resorts Lodge Westwind Tugboat Adventures and MV Parry and MV Union Jack
SPORTS FISHING/TOURISM LODGES AND TOURISM COMPANIES
(NORTH COAST)
Lodge/Company
Big Time Fishing Bite Me! Fishing Charters Bluewater Adventures Deep Sea Charters Duen Adventures Eagle Edge Charters Foggy Point Gifts and Services King Pacific Lodge Maple Leaf Adventures North Coast Tugboat Adventures Oona River Retreat Prince Rupert Adventure Tours Seaquest Explorations Seashore Charter Services
FERENCE WEICKER & COMPANY
Social and Economic Assessment and Analysis – Draft Report Page 38
SECTOR LINKAGES
Lodge/Company
Silverback Fishing Adventures Skeena Wilderness Fishing Charters Ltd. Tantalus Adventures Terry’s Fishing Charters The Experience Saltwater Charters The Ocean Light West Coast Resorts
3. Marine Transportation At a crossroads to Asia and the world, BC offers a supply chain delivery system unmatched on the West Coast of North America. With faster sailing times to Asia boasting the shortest transportation routes with a 58-hour transport lead over other West Coast ports, world-class year-round ice-free container ports in the Vancouver region and Prince Rupert, and direct rail access to the heart of North America from its ports, BC is uniquely positioned to become a hub of international trade and commerce19. In 2006, BC’s international trade was valued at more than $78 billion. The province’s two main trading ports - Vancouver and Prince Rupert - handled more than half of this amount, transporting more than 125 million tonnes of cargo20. By 2020, container traffic to BC is expected to increase from 2 million to 9 million Twenty-foot Equivalent Units (TEUs)21. In 2007, BC announced legislation to provide a 10-year extension to its tax relief initiative for port operators to encourage new investments in port infrastructure and secure the competitive position of BC’s major industrial ports. Prince Rupert is emerging as an important deep sea port where commodities shipped via the northern rail line are loaded for transport to Asia and other destinations. The Port of Prince Rupert also provides the shortest direct rail route to large US mid-west and eastern consumer markets from the West Coast at less than 100 hours to Chicago (100 percent pre-cleared at customs)22. Numerous industrial marine development proposals are currently being pursued within the PNCIMA area of BC. Several new terminal and marine transportation projects for North Coast ports in Prince Rupert, Kitimat and Stewart are at various levels of development. Recent and ongoing major projects include:
• Development of Prince Rupert Container Terminal (Phase I) with an estimated investment
value of $150 million;
• Development of Prince Rupert Container Terminal (Phase II) with an estimated investment value of $500 million;
• Building of a new rail line by the Canadian National Railway Company to transport goods from the new terminals with an estimated investment value of $193 million; and
• Expansion of Ridley Terminals with an estimated investment value of $15 million.
19 http://www.canadaspacificgateway.ca/en/invest/advantage/location.html 20 http://www.canadaspacificgateway.ca/en/invest/supply_chain/goods.html 21 http://www.canadaspacificgateway.ca/en/invest/sectors.html#supply_chain 22 http://www.canadaspacificgateway.ca/en/invest/supply_chain.html
FERENCE WEICKER & COMPANY
Social and Economic Assessment and Analysis – Draft Report Page 39
SECTOR LINKAGES
4. Energy BC is emerging as a global leader in the development of environmental technologies and innovative energy management. In 2007, the Provincial Government announced the BC Energy Plan, which aims to have the province reach electricity self-sufficiency by 2016, using 90% renewable energy23. Hence, there are significant opportunities in the province for investment into renewable technologies, including the areas of run-of-river hydroelectricity, bio-energy, wave energy, as well as tidal and wind power. There is significant potential for wind farms in offshore areas of BC in the Hecate Strait off the coasts of the Queen Charlotte Islands and Stephens and Porcher Islands. The North Coast of BC is recognized as among the best wind energy resources on the planet. Katabatic Power is currently in development on two promising sites - the Mount Hays and the Banks Island Wind Farms. NaiKun Wind Development has proposed to construct and operate a renewable wind energy farm off the north-west coast of BC. The proposed project site is located in Hecate Strait, between Haida Gwaii (the Queen Charlotte Islands) and Prince Rupert. The Haida Energy Field harbours some of the strongest, most consistent winds in Canada. Mountainous BC is ideal for run-of-the-river hydroelectricity, which diverts a portion of a river's water and uses it to rotate a waterwheel or turbine before the water returns to the river. No dams or reservoirs are required because the project harnesses the river's natural gradient. Currently, 35 run-of-the-river projects generate 3.5% of the province's electricity, and another 39 are in the process of development24. There are two hydroelectricity projects currently operating in the Central and North Coast regions - Brown Lake in Prince Rupert and Ocean Falls - Link Lake in Bella Bella. Two run-of-the-river hydroelectricity projects have signed Electricity Purchase Agreements with BC Hydro - Anyox and Kitsalut River in Alice Arm and Maroon Creek in Terrace25. Run-of-the-river hydroelectricity projects currently under development in the region include Nascall River between Bella Coola and Bella Bella on Dean Channel. The BC government has indicated that the province has significant ocean energy potential, including over 6,000 MW of wave energy potential and 2,000 MW of tidal energy potential26. There are currently two large-scale tidal power projects in operation in the world - one in Brittany, France and one at Annapolis Royal, Nova Scotia. There is a small demonstration tidal power project near Race Rocks just outside Victoria. Currently, biofuels come from food crops, such as soybeans and corn, and from cellulosic materials, such as wood chips, grass, and cornstalks. Unfortunately, rising demand for food crops in order to produce ethanol is driving prices for the food crops themselves, while cellulosic materials require special processing methods, which have been demonstrated at small plants but have yet to be proved commercially. In contrast to biofuels from food crops or cellulosic materials, certain algae produce and accumulate oil naturally. As a result, algal hydrocarbons can be utilized for not only bio-diesel fuel in internal combustion engines, for heating or electricity generation, but also can further serve as feedstock in the synthetic chemistry and pharmaceutical industries.
23 http://www.ippbc.com/EN/2008./private_companies_look_to_bc_rivers_for_a_new_form_of_green_energy./ 24 Ibid 25 http://www.ippbc.com/media/IPPBC%20Map%20of%20IPPs%20in%20BC%20v4.pdf 26 Economic Contribution of the Oceans Sector in British Columbia, GSGislason & Associates Ltd., 2007
FERENCE WEICKER & COMPANY
Social and Economic Assessment and Analysis – Draft Report Page 40
SECTOR LINKAGES
Vancouver-based International Energy Inc. is currently developing leading edge technologies for the production of biofuels derived directly from green microalgae, which can accumulate up to 30% of their biomass in the form of valuable biofuels. Biofuel derived from algae may have the potential to become a significant alternative energy source in the Central and North Coast regions. The Geological Survey of Canada suggests that there are substantial amounts of oil and gas in the Queen Charlotte Basin in the waters off Northern BC. The Queen Charlotte Basin is one of several basins offshore that have oil and gas potential (the other basins are the Winona, the Tofino, and the Georgia). The Queen Charlotte Basin appears to be the most promising and has gone through some exploration work. The Queen Charlotte Basin may contain 9.8 billion barrels (bbls) of oil and 26 trillion cubic feet (tcf) of gas27. While strong opposition to offshore oil and gas development still exists from environmental, non-governmental organizations and many First Nations communities, the BC government has proposed Pacific Coast oil and gas production by 2010. The establishment of the BC Offshore Oil and Gas Division has reinforced this priority. However, interest in offshore oil and gas development is limited by the moratorium on exploration and lack of a clear path to secure government and public support as well as a lack of a responsible approach. While economic reports on offshore oil and gas development predict significant economic benefits, the actual amount of oil and gas off the BC coast is still in question. B. CHARACTERISTICS OF THE MARINE BUSINESSES SURVEYED 1. Description of Businesses The following section summarizes the characteristics of the businesses including the number identified and the number interviewed by sector and by region, as well as the legal structure and revenues of the businesses surveyed. We developed a list of 133 active businesses in the region through an extensive search into licensing information, business directories and referrals. The businesses were contacted a minimum of three times each and were encouraged to participate. The characteristics of the 99 businesses that were eventually surveyed are summarized below.
• The businesses surveyed are drawn from a variety of sectors, of which marine tourism is the most common. As the chart below indicates, marine tourism comprised the majority of both the number of businesses surveyed and the number of businesses active in the marine sector. Those businesses that identified working in more than one sector have been included in the sector totals for each category.
27 Ibid
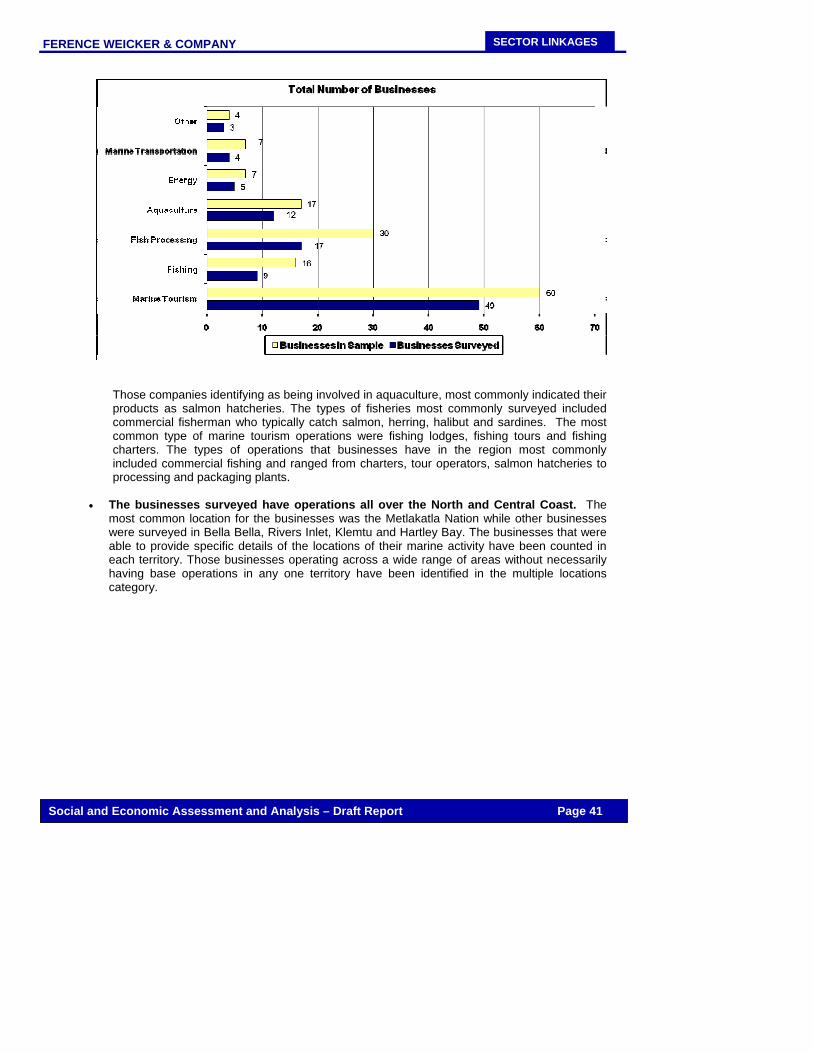
FERENCE WEICKER & COMPANY
Social and Economic Assessment and Analysis – Draft Report Page 41
SECTOR LINKAGES
Those companies identifying as being involved in aquaculture, most commonly indicated their products as salmon hatcheries. The types of fisheries most commonly surveyed included commercial fisherman who typically catch salmon, herring, halibut and sardines. The most common type of marine tourism operations were fishing lodges, fishing tours and fishing charters. The types of operations that businesses have in the region most commonly included commercial fishing and ranged from charters, tour operators, salmon hatcheries to processing and packaging plants.
• The businesses surveyed have operations all over the North and Central Coast. The most common location for the businesses was the Metlakatla Nation while other businesses were surveyed in Bella Bella, Rivers Inlet, Klemtu and Hartley Bay. The businesses that were able to provide specific details of the locations of their marine activity have been counted in each territory. Those businesses operating across a wide range of areas without necessarily having base operations in any one territory have been identified in the multiple locations category.
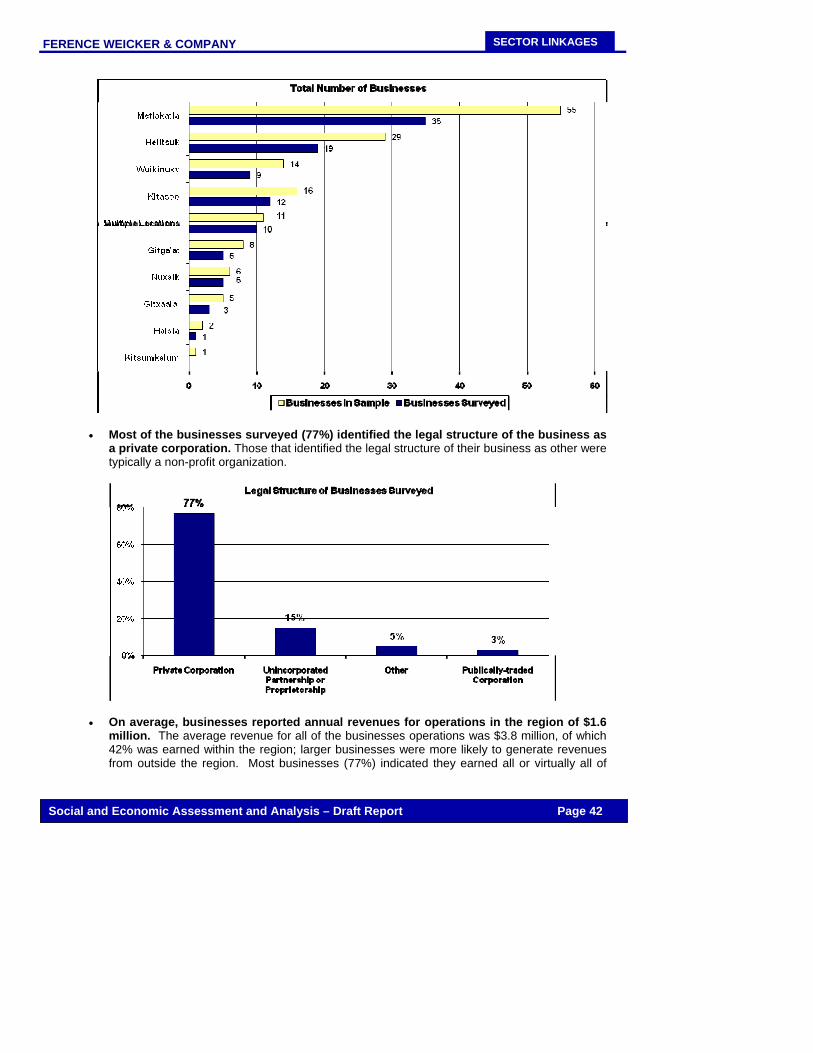
FERENCE WEICKER & COMPANY
Social and Economic Assessment and Analysis – Draft Report Page 42
SECTOR LINKAGES
• Most of the businesses surveyed (77%) identified the legal structure of the business as a private corporation. Those that identified the legal structure of their business as other were typically a non-profit organization.
• On average, businesses reported annual revenues for operations in the region of $1.6 million. The average revenue for all of the businesses operations was $3.8 million, of which 42% was earned within the region; larger businesses were more likely to generate revenues from outside the region. Most businesses (77%) indicated they earned all or virtually all of
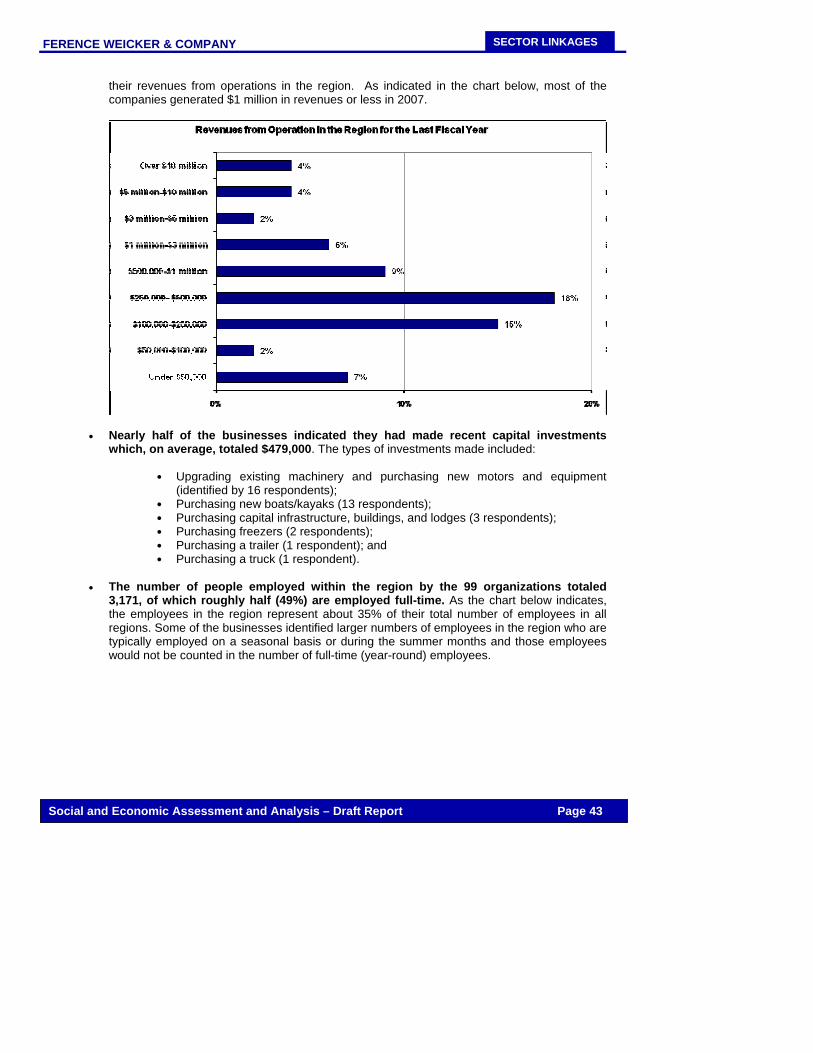
FERENCE WEICKER & COMPANY
Social and Economic Assessment and Analysis – Draft Report Page 43
SECTOR LINKAGES
their revenues from operations in the region. As indicated in the chart below, most of the companies generated $1 million in revenues or less in 2007.
• Nearly half of the businesses indicated they had made recent capital investments which, on average, totaled $479,000. The types of investments made included:
Upgrading existing machinery and purchasing new motors and equipment
(identified by 16 respondents); Purchasing new boats/kayaks (13 respondents); Purchasing capital infrastructure, buildings, and lodges (3 respondents); Purchasing freezers (2 respondents); Purchasing a trailer (1 respondent); and Purchasing a truck (1 respondent).
• The number of people employed within the region by the 99 organizations totaled
3,171, of which roughly half (49%) are employed full-time. As the chart below indicates, the employees in the region represent about 35% of their total number of employees in all regions. Some of the businesses identified larger numbers of employees in the region who are typically employed on a seasonal basis or during the summer months and those employees would not be counted in the number of full-time (year-round) employees.
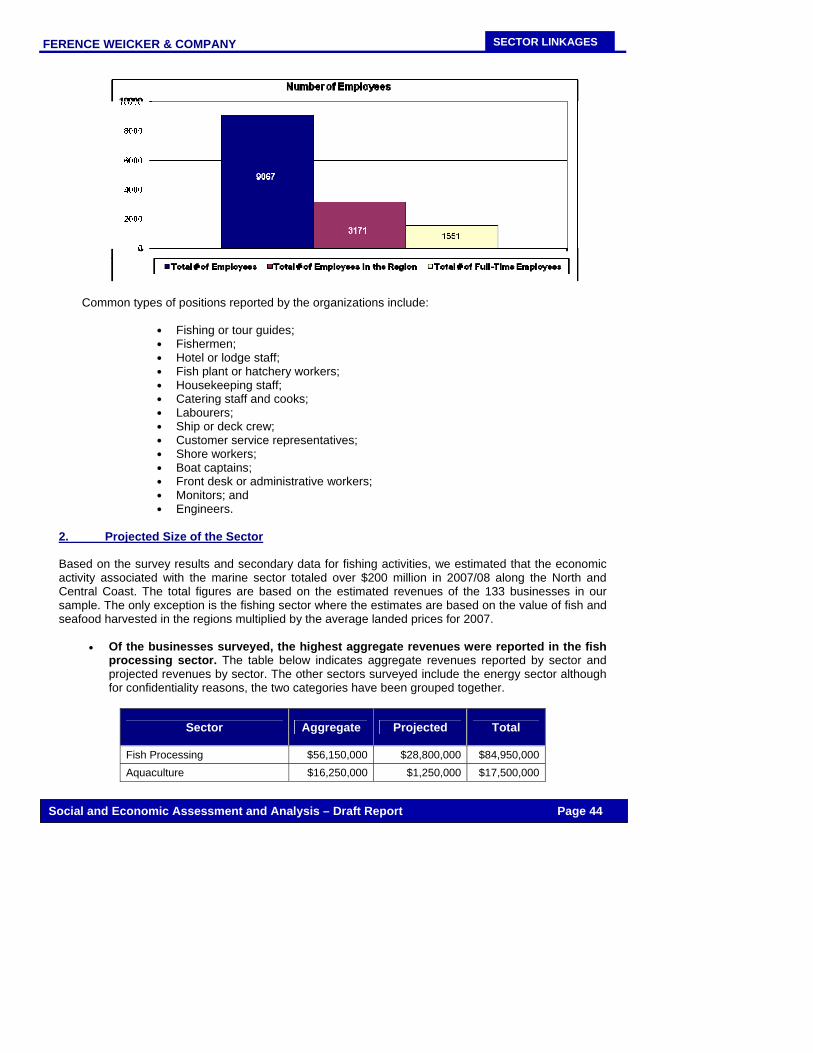
FERENCE WEICKER & COMPANY
Social and Economic Assessment and Analysis – Draft Report Page 44
SECTOR LINKAGES
Common types of positions reported by the organizations include:
Fishing or tour guides; Fishermen; Hotel or lodge staff; Fish plant or hatchery workers; Housekeeping staff; Catering staff and cooks; Labourers; Ship or deck crew; Customer service representatives; Shore workers; Boat captains; Front desk or administrative workers; Monitors; and Engineers.
2. Projected Size of the Sector Based on the survey results and secondary data for fishing activities, we estimated that the economic activity associated with the marine sector totaled over $200 million in 2007/08 along the North and Central Coast. The total figures are based on the estimated revenues of the 133 businesses in our sample. The only exception is the fishing sector where the estimates are based on the value of fish and seafood harvested in the regions multiplied by the average landed prices for 2007.
• Of the businesses surveyed, the highest aggregate revenues were reported in the fish processing sector. The table below indicates aggregate revenues reported by sector and projected revenues by sector. The other sectors surveyed include the energy sector although for confidentiality reasons, the two categories have been grouped together.
Sector Aggregate Projected Total
Fish Processing $56,150,000 $28,800,000 $84,950,000Aquaculture $16,250,000 $1,250,000 $17,500,000
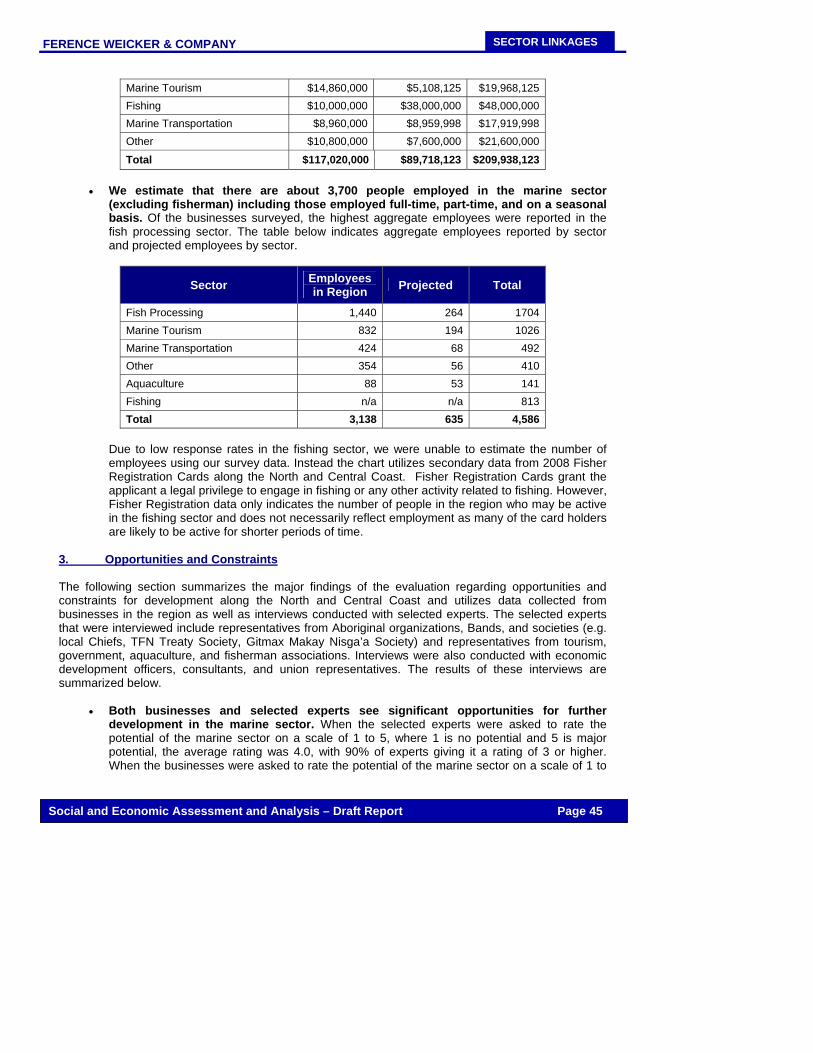
FERENCE WEICKER & COMPANY
Social and Economic Assessment and Analysis – Draft Report Page 45
SECTOR LINKAGES
Marine Tourism $14,860,000 $5,108,125 $19,968,125Fishing $10,000,000 $38,000,000 $48,000,000Marine Transportation $8,960,000 $8,959,998 $17,919,998Other $10,800,000 $7,600,000 $21,600,000
Total $117,020,000 $89,718,123 $209,938,123
• We estimate that there are about 3,700 people employed in the marine sector (excluding fisherman) including those employed full-time, part-time, and on a seasonal basis. Of the businesses surveyed, the highest aggregate employees were reported in the fish processing sector. The table below indicates aggregate employees reported by sector and projected employees by sector.
Sector Employees in Region Projected Total
Fish Processing 1,440 264 1704Marine Tourism 832 194 1026Marine Transportation 424 68 492Other 354 56 410Aquaculture 88 53 141Fishing n/a n/a 813Total 3,138 635 4,586
Due to low response rates in the fishing sector, we were unable to estimate the number of employees using our survey data. Instead the chart utilizes secondary data from 2008 Fisher Registration Cards along the North and Central Coast. Fisher Registration Cards grant the applicant a legal privilege to engage in fishing or any other activity related to fishing. However, Fisher Registration data only indicates the number of people in the region who may be active in the fishing sector and does not necessarily reflect employment as many of the card holders are likely to be active for shorter periods of time.
3. Opportunities and Constraints The following section summarizes the major findings of the evaluation regarding opportunities and constraints for development along the North and Central Coast and utilizes data collected from businesses in the region as well as interviews conducted with selected experts. The selected experts that were interviewed include representatives from Aboriginal organizations, Bands, and societies (e.g. local Chiefs, TFN Treaty Society, Gitmax Makay Nisga’a Society) and representatives from tourism, government, aquaculture, and fisherman associations. Interviews were also conducted with economic development officers, consultants, and union representatives. The results of these interviews are summarized below.
• Both businesses and selected experts see significant opportunities for further development in the marine sector. When the selected experts were asked to rate the potential of the marine sector on a scale of 1 to 5, where 1 is no potential and 5 is major potential, the average rating was 4.0, with 90% of experts giving it a rating of 3 or higher. When the businesses were asked to rate the potential of the marine sector on a scale of 1 to
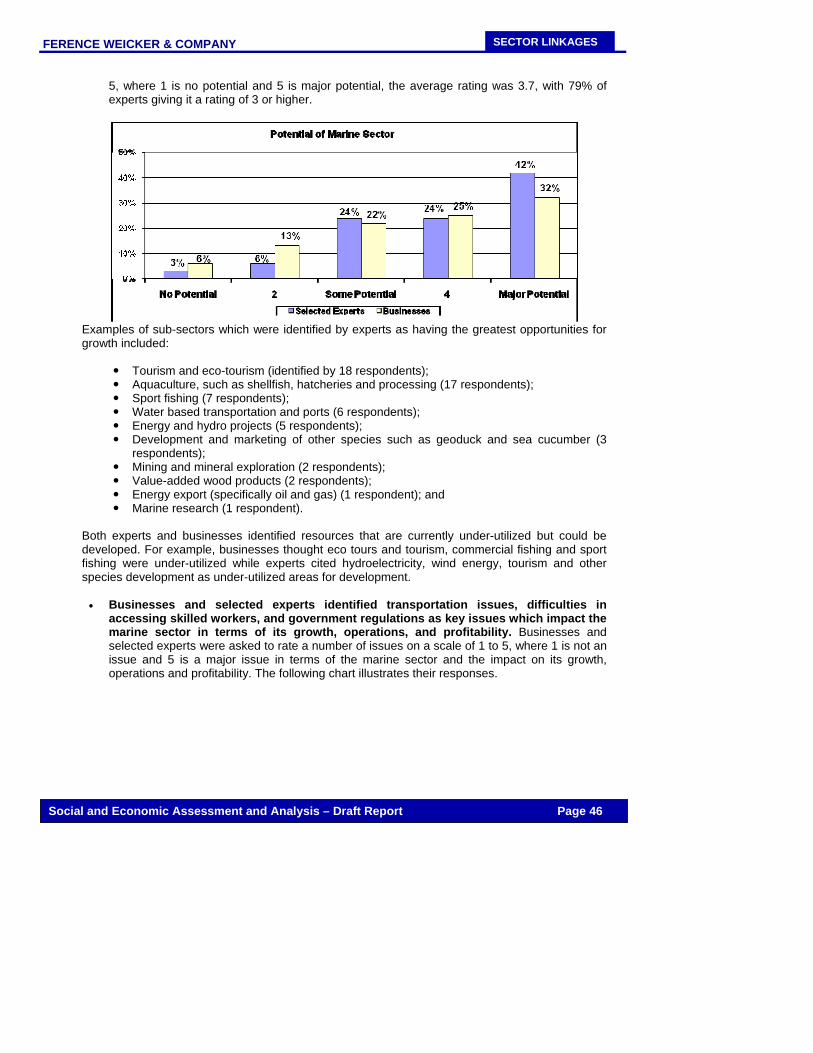
FERENCE WEICKER & COMPANY
Social and Economic Assessment and Analysis – Draft Report Page 46
SECTOR LINKAGES
5, where 1 is no potential and 5 is major potential, the average rating was 3.7, with 79% of experts giving it a rating of 3 or higher.
Examples of sub-sectors which were identified by experts as having the greatest opportunities for growth included:
Tourism and eco-tourism (identified by 18 respondents); Aquaculture, such as shellfish, hatcheries and processing (17 respondents); Sport fishing (7 respondents); Water based transportation and ports (6 respondents); Energy and hydro projects (5 respondents); Development and marketing of other species such as geoduck and sea cucumber (3
respondents); Mining and mineral exploration (2 respondents); Value-added wood products (2 respondents); Energy export (specifically oil and gas) (1 respondent); and Marine research (1 respondent).
Both experts and businesses identified resources that are currently under-utilized but could be developed. For example, businesses thought eco tours and tourism, commercial fishing and sport fishing were under-utilized while experts cited hydroelectricity, wind energy, tourism and other species development as under-utilized areas for development. • Businesses and selected experts identified transportation issues, difficulties in
accessing skilled workers, and government regulations as key issues which impact the marine sector in terms of its growth, operations, and profitability. Businesses and selected experts were asked to rate a number of issues on a scale of 1 to 5, where 1 is not an issue and 5 is a major issue in terms of the marine sector and the impact on its growth, operations and profitability. The following chart illustrates their responses.
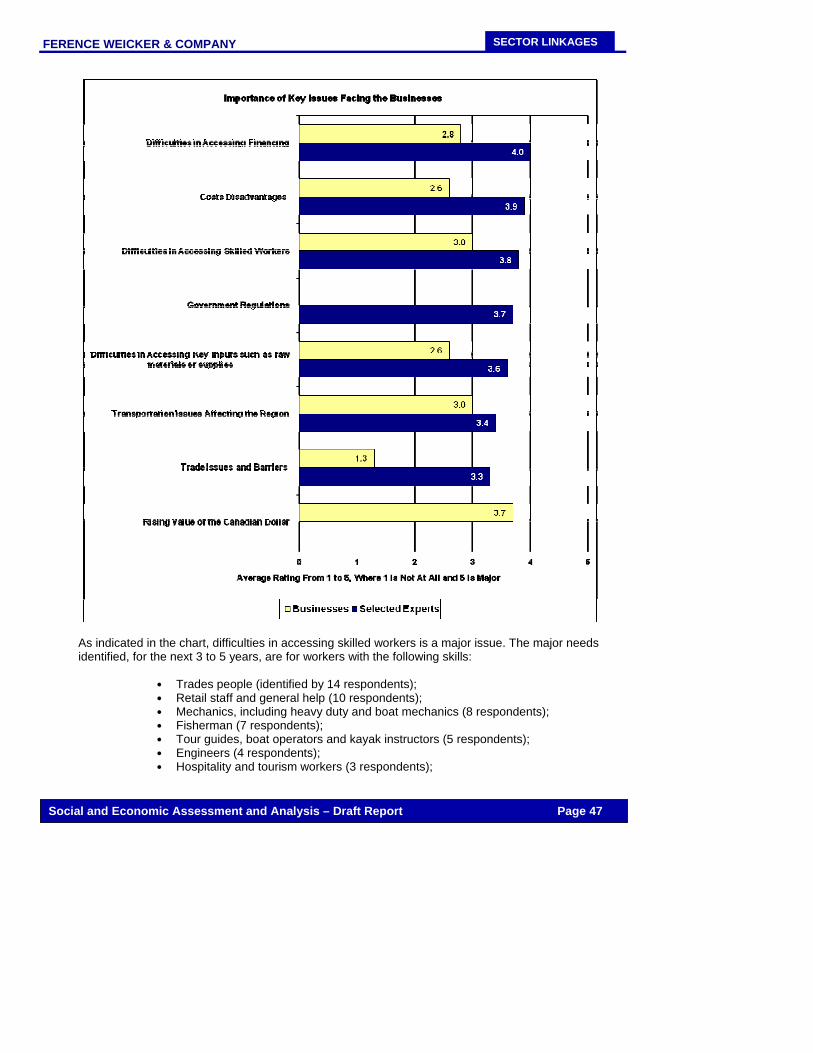
FERENCE WEICKER & COMPANY
Social and Economic Assessment and Analysis – Draft Report Page 47
SECTOR LINKAGES
As indicated in the chart, difficulties in accessing skilled workers is a major issue. The major needs identified, for the next 3 to 5 years, are for workers with the following skills:
Trades people (identified by 14 respondents); Retail staff and general help (10 respondents); Mechanics, including heavy duty and boat mechanics (8 respondents); Fisherman (7 respondents); Tour guides, boat operators and kayak instructors (5 respondents); Engineers (4 respondents); Hospitality and tourism workers (3 respondents);
FERENCE WEICKER & COMPANY
Social and Economic Assessment and Analysis – Draft Report Page 48
SECTOR LINKAGES
Business professionals and managers (3 respondents); Biologists (2 respondents); Technicians (2 respondents); and Pilots (1 respondent).
Key factors were identified as contributing to a shortage of workers include:
Competition from other employers in different regions such as Alberta, coupled
with a small working population (identified by 13 respondents); A lack of local training and educational facilities (8 respondents); The seasonal nature of the work (6 respondents); Remoteness of the communities which makes it difficult to attract and retain
workers (6 respondents); A declining interest in the fishing industry (5 respondents); The low wages associated with many of the jobs offered (5 respondents); and An aging workforce (2 respondents).
Other major issues that businesses and the sector are facing include:
Declining fish stocks (identified by 18 respondents); The rising cost of fuel (14 respondents); A lack of tourism promotion and marketing (12 respondents); A lack of strategic planning with regards to the environment and local industry
(10 respondents); Limited funding opportunities and low investor confidence (7 respondents); Staffing shortages (7 respondents); Poor transportation infrastructure (5 respondents); Resistance from the local community and the limits of First Nations treaties (5
respondents); and Licensing restrictions (2 respondents).
• The businesses and selected experts recommended a number of actions that should
be undertaken by the communities, industry, government, and others to promote further development in the marine sector. The most common recommendations included:
Promote and market the tourism industry and increase the number of cruise ship
stops (identified by 24 respondents); Develop a long-term strategic plan to address depleting fish stocks and reduce
the mismanagement of local resources (14 respondents); Reduce the cost of fuel (14 respondents); Increase collaboration between local First Nation communities, industry officials
and federal/provincial governments (8 respondents); Provide more funding and seed money for businesses (8 respondents); Police the waters to stop illegal fishing practices (5 respondents); Address transportation and shipping costs (4 respondents); Provide more training and educational opportunities to the local communities (3
respondents); Develop alternative energy projects (2 respondents); and Optimize and increase hatchery production (2 respondents).
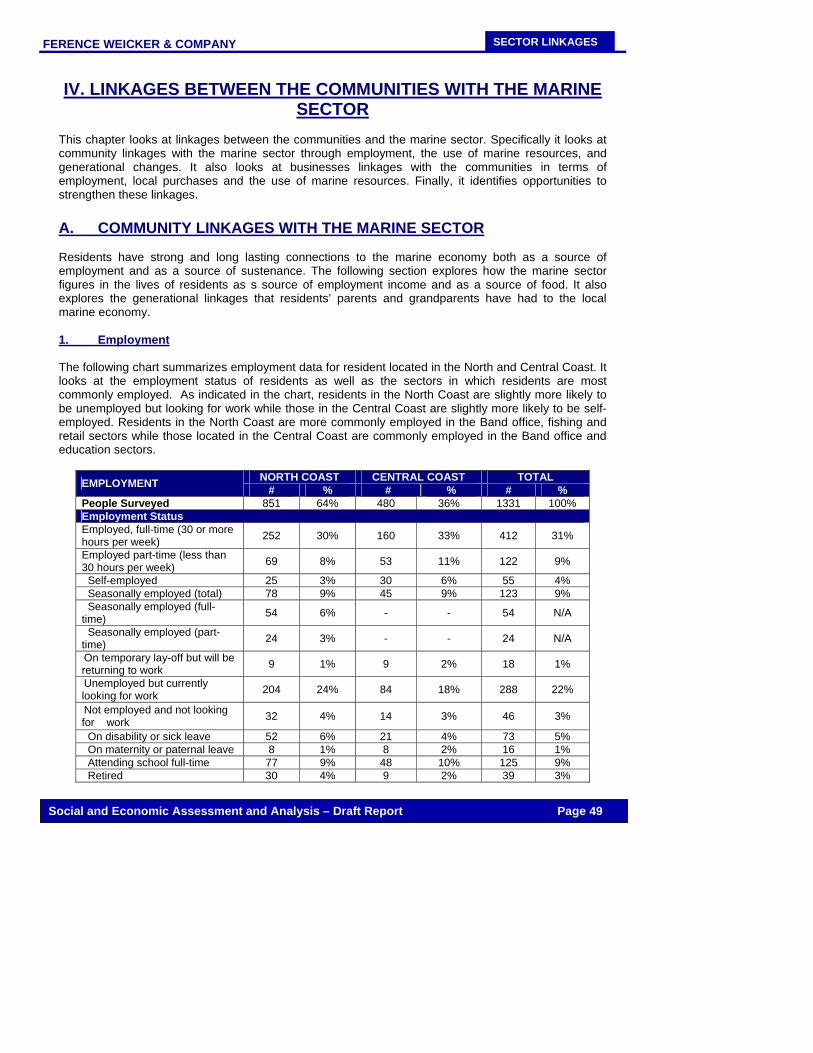
FERENCE WEICKER & COMPANY
Social and Economic Assessment and Analysis – Draft Report Page 49
SECTOR LINKAGES
IV. LINKAGES BETWEEN THE COMMUNITIES WITH THE MARINE SECTOR
This chapter looks at linkages between the communities and the marine sector. Specifically it looks at community linkages with the marine sector through employment, the use of marine resources, and generational changes. It also looks at businesses linkages with the communities in terms of employment, local purchases and the use of marine resources. Finally, it identifies opportunities to strengthen these linkages. A. COMMUNITY LINKAGES WITH THE MARINE SECTOR
Residents have strong and long lasting connections to the marine economy both as a source of employment and as a source of sustenance. The following section explores how the marine sector figures in the lives of residents as s source of employment income and as a source of food. It also explores the generational linkages that residents’ parents and grandparents have had to the local marine economy.
1. Employment The following chart summarizes employment data for resident located in the North and Central Coast. It looks at the employment status of residents as well as the sectors in which residents are most commonly employed. As indicated in the chart, residents in the North Coast are slightly more likely to be unemployed but looking for work while those in the Central Coast are slightly more likely to be self-employed. Residents in the North Coast are more commonly employed in the Band office, fishing and retail sectors while those located in the Central Coast are commonly employed in the Band office and education sectors.
NORTH COAST CENTRAL COAST TOTAL EMPLOYMENT # % # % # % People Surveyed 851 64% 480 36% 1331 100% Employment Status Employed, full-time (30 or more hours per week) 252 30% 160 33% 412 31%
Employed part-time (less than 30 hours per week) 69 8% 53 11% 122 9%
Self-employed 25 3% 30 6% 55 4% Seasonally employed (total) 78 9% 45 9% 123 9% Seasonally employed (full-time) 54 6% - - 54 N/A
Seasonally employed (part-time) 24 3% - - 24 N/A
On temporary lay-off but will be returning to work 9 1% 9 2% 18 1%
Unemployed but currently looking for work 204 24% 84 18% 288 22%
Not employed and not looking for work 32 4% 14 3% 46 3%
On disability or sick leave 52 6% 21 4% 73 5% On maternity or paternal leave 8 1% 8 2% 16 1% Attending school full-time 77 9% 48 10% 125 9% Retired 30 4% 9 2% 39 3%
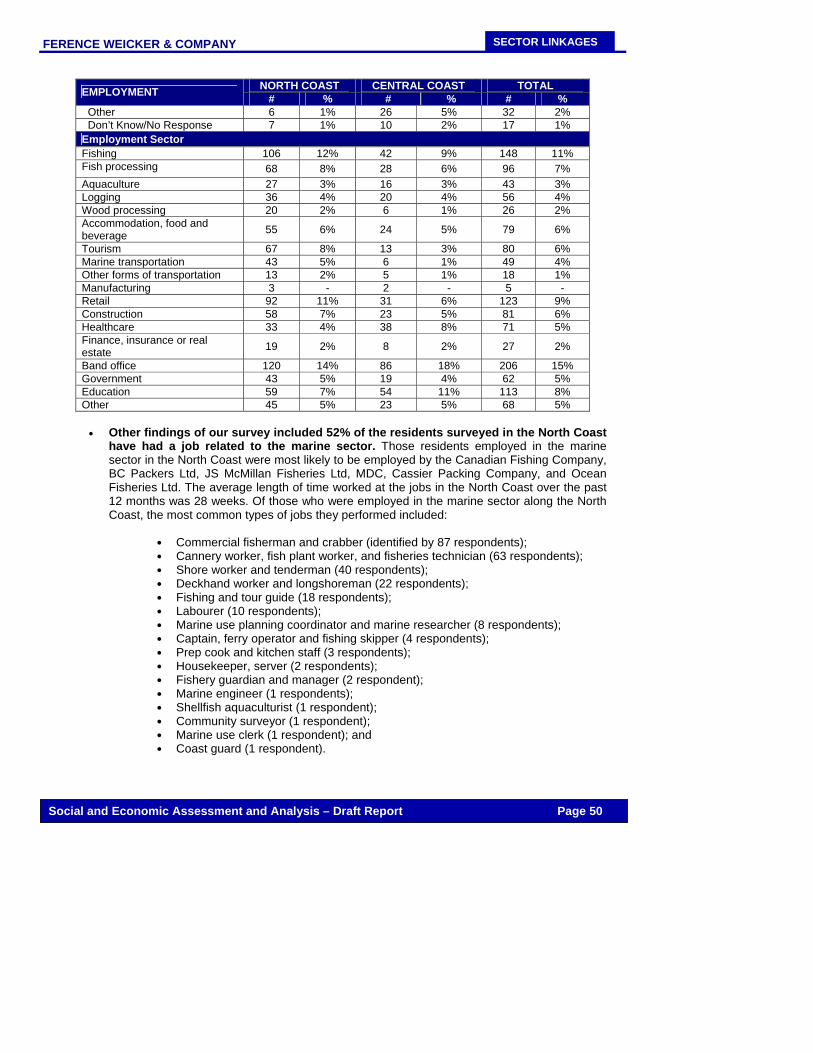
FERENCE WEICKER & COMPANY
Social and Economic Assessment and Analysis – Draft Report Page 50
SECTOR LINKAGES
NORTH COAST CENTRAL COAST TOTAL EMPLOYMENT # % # % # % Other 6 1% 26 5% 32 2% Don’t Know/No Response 7 1% 10 2% 17 1% Employment Sector Fishing 106 12% 42 9% 148 11% Fish processing 68 8% 28 6% 96 7% Aquaculture 27 3% 16 3% 43 3% Logging 36 4% 20 4% 56 4% Wood processing 20 2% 6 1% 26 2% Accommodation, food and beverage 55 6% 24 5% 79 6%
Tourism 67 8% 13 3% 80 6% Marine transportation 43 5% 6 1% 49 4% Other forms of transportation 13 2% 5 1% 18 1% Manufacturing 3 - 2 - 5 - Retail 92 11% 31 6% 123 9% Construction 58 7% 23 5% 81 6% Healthcare 33 4% 38 8% 71 5% Finance, insurance or real estate 19 2% 8 2% 27 2%
Band office 120 14% 86 18% 206 15% Government 43 5% 19 4% 62 5% Education 59 7% 54 11% 113 8% Other 45 5% 23 5% 68 5%
• Other findings of our survey included 52% of the residents surveyed in the North Coast
have had a job related to the marine sector. Those residents employed in the marine sector in the North Coast were most likely to be employed by the Canadian Fishing Company, BC Packers Ltd, JS McMillan Fisheries Ltd, MDC, Cassier Packing Company, and Ocean Fisheries Ltd. The average length of time worked at the jobs in the North Coast over the past 12 months was 28 weeks. Of those who were employed in the marine sector along the North Coast, the most common types of jobs they performed included:
Commercial fisherman and crabber (identified by 87 respondents); Cannery worker, fish plant worker, and fisheries technician (63 respondents); Shore worker and tenderman (40 respondents); Deckhand worker and longshoreman (22 respondents); Fishing and tour guide (18 respondents); Labourer (10 respondents); Marine use planning coordinator and marine researcher (8 respondents); Captain, ferry operator and fishing skipper (4 respondents); Prep cook and kitchen staff (3 respondents); Housekeeper, server (2 respondents); Fishery guardian and manager (2 respondent); Marine engineer (1 respondents); Shellfish aquaculturist (1 respondent); Community surveyor (1 respondent); Marine use clerk (1 respondent); and Coast guard (1 respondent).

FERENCE WEICKER & COMPANY
Social and Economic Assessment and Analysis – Draft Report Page 51
SECTOR LINKAGES
• 51% of the residents surveyed in the Central Coast have had a job related to the marine sector. Those residents employed in the marine sector in the Central Coast were most likely to be employed by Bella Bella Fisheries Ltd, BC Packers Ltd, Canadian Fishing Company, Kitasoo Seafoods Ltd, HTC, and Marine Harvest Canada. The average length of time worked at the jobs in the Central Coast over the past 12 months was 24 weeks. Of those who were employed in the marine sector along the Central Coast, the most common types of jobs they performed included:
Cannery worker, fish plant worker, and fisheries technician (58 respondents); Commercial fisherman (identified by 48 respondents); Deckhand worker and longshoreman (15 respondents); Fishing or tour guide (7 respondents); Marine use planning coordinator and co-management (6 respondents); Captain and crew boat operator (5 respondents); Shore worker (4 respondents); Clam harvester and digger (4 respondents); Fish washer, grader, and butcher (4 respondents); Fish enhancement worker (2 respondents); Hatchery worker (2 respondents); Prawn harvester (1 respondent); Labourer (1 respondents); and Net repairer (1 respondent).
• Residents who reported working in the marine sector over the past 12 months had an
average income of $23,138, which is slightly higher than the average for all employed residents.
INCOME NORTH COAST CENTRAL COAST TOTAL Average reported income in 2007 $22,200 $19,100 $21,000 Average income from those employed in the marine sector $23,600 $22,600 $23,100
2. Use of Marine Resources By First Nations Residents
• Residents in the North Coast reported that about 35% of their meals, in a typical month, include seafood (e.g. salmon, halibut, shellfish, seaweed etc) and that 78% of the seafood consumed in a month is non-commercially harvested. About half (49%) of the residents surveyed played a role in the harvesting and processing of the seafood they consume by catching it, cleaning it, smoking it, freezing it, and/or canning it. Respondents indicated a number of factors which make it difficult for them to participate in non commercial marine harvesting and processing. Factors such as lack of transportation and access to a boat and/or smokehouse, health related constraints, time constraints due to family and work responsibilities, and the lack of fish were most commonly mentioned. However, respondents still spend a significant amount of time on non-commercial harvesting, averaging 89 hours over the past year. Time spent on these activities ranged from 1 hour to 2,184 hours. It should be mentioned that not all residents spent time on this activity and the average number may be slightly inflated due to some larger estimates over 500 hours in a year.
• Similarly, residents in the Central Coast reported that merely 34% of meals consumed
in a typical month include seafood, of which 77% is non-commercially harvested. Also, just under a quarter (21%) of the residents surveyed played a role in the harvesting and
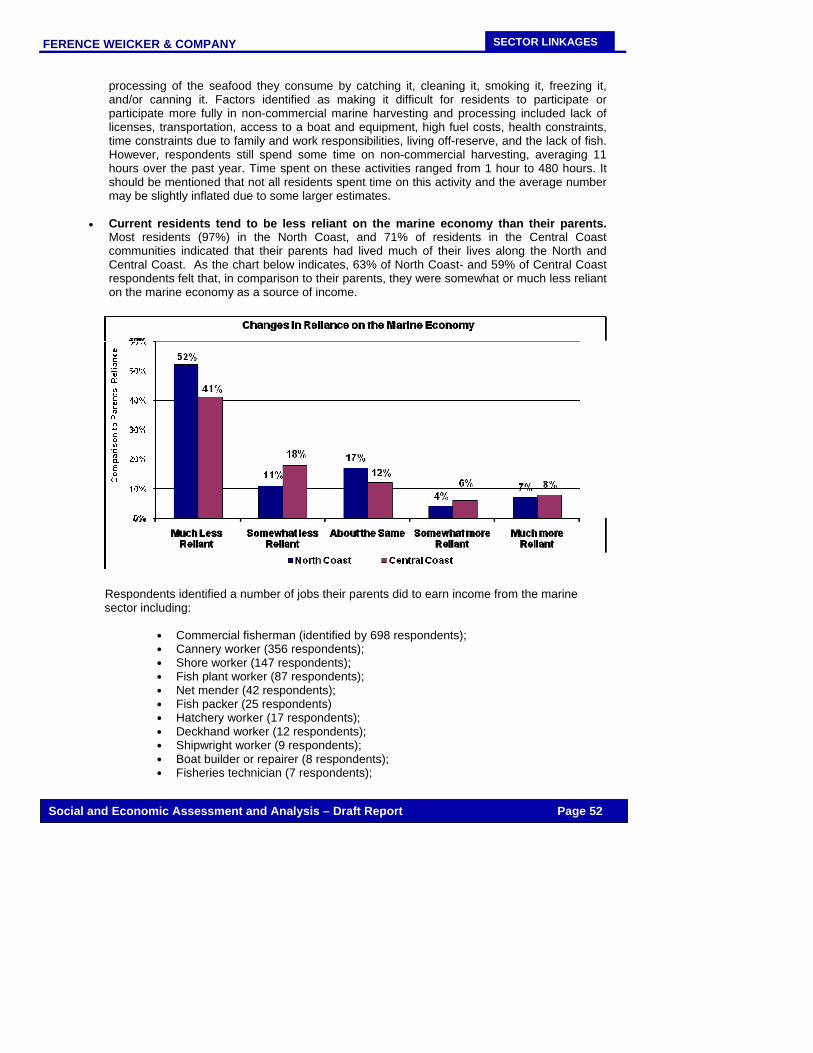
FERENCE WEICKER & COMPANY
Social and Economic Assessment and Analysis – Draft Report Page 52
SECTOR LINKAGES
processing of the seafood they consume by catching it, cleaning it, smoking it, freezing it, and/or canning it. Factors identified as making it difficult for residents to participate or participate more fully in non-commercial marine harvesting and processing included lack of licenses, transportation, access to a boat and equipment, high fuel costs, health constraints, time constraints due to family and work responsibilities, living off-reserve, and the lack of fish. However, respondents still spend some time on non-commercial harvesting, averaging 11 hours over the past year. Time spent on these activities ranged from 1 hour to 480 hours. It should be mentioned that not all residents spent time on this activity and the average number may be slightly inflated due to some larger estimates.
• Current residents tend to be less reliant on the marine economy than their parents.
Most residents (97%) in the North Coast, and 71% of residents in the Central Coast communities indicated that their parents had lived much of their lives along the North and Central Coast. As the chart below indicates, 63% of North Coast- and 59% of Central Coast respondents felt that, in comparison to their parents, they were somewhat or much less reliant on the marine economy as a source of income.
Respondents identified a number of jobs their parents did to earn income from the marine sector including:
Commercial fisherman (identified by 698 respondents); Cannery worker (356 respondents); Shore worker (147 respondents); Fish plant worker (87 respondents); Net mender (42 respondents); Fish packer (25 respondents) Hatchery worker (17 respondents); Deckhand worker (12 respondents); Shipwright worker (9 respondents); Boat builder or repairer (8 respondents); Fisheries technician (7 respondents);
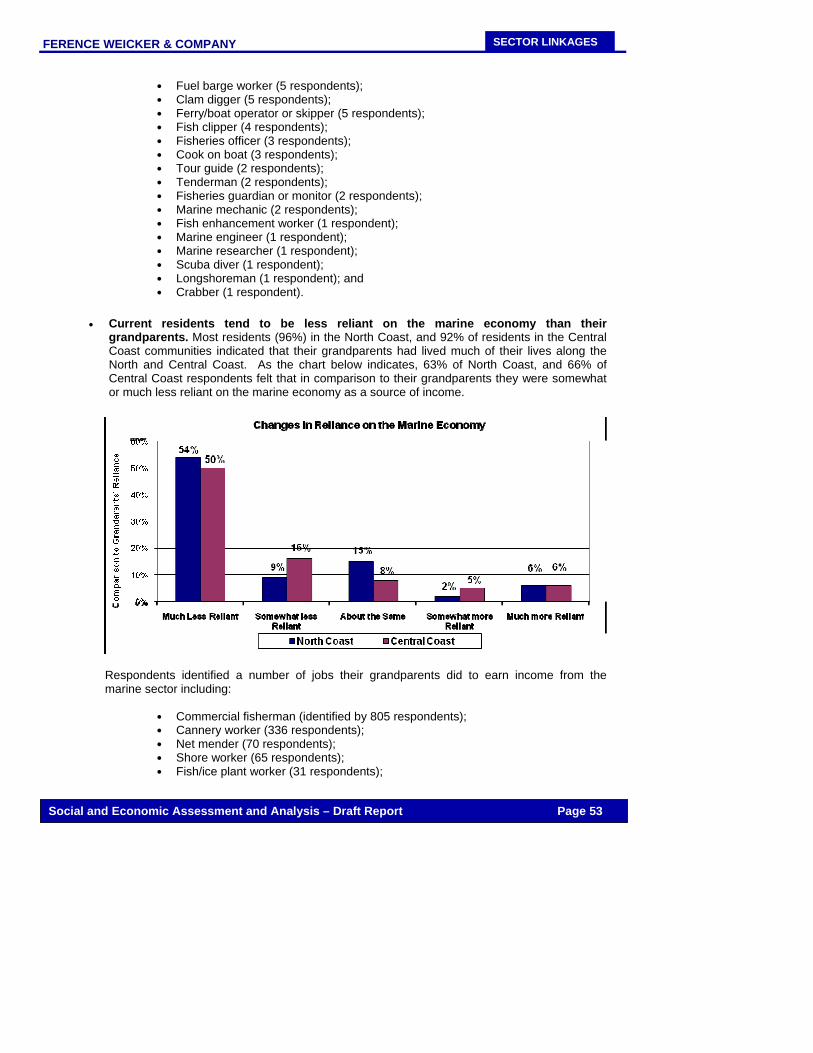
FERENCE WEICKER & COMPANY
Social and Economic Assessment and Analysis – Draft Report Page 53
SECTOR LINKAGES
Fuel barge worker (5 respondents); Clam digger (5 respondents); Ferry/boat operator or skipper (5 respondents); Fish clipper (4 respondents); Fisheries officer (3 respondents); Cook on boat (3 respondents); Tour guide (2 respondents); Tenderman (2 respondents); Fisheries guardian or monitor (2 respondents); Marine mechanic (2 respondents); Fish enhancement worker (1 respondent); Marine engineer (1 respondent); Marine researcher (1 respondent); Scuba diver (1 respondent); Longshoreman (1 respondent); and Crabber (1 respondent).
• Current residents tend to be less reliant on the marine economy than their
grandparents. Most residents (96%) in the North Coast, and 92% of residents in the Central Coast communities indicated that their grandparents had lived much of their lives along the North and Central Coast. As the chart below indicates, 63% of North Coast, and 66% of Central Coast respondents felt that in comparison to their grandparents they were somewhat or much less reliant on the marine economy as a source of income.
Respondents identified a number of jobs their grandparents did to earn income from the marine sector including:
Commercial fisherman (identified by 805 respondents); Cannery worker (336 respondents); Net mender (70 respondents); Shore worker (65 respondents); Fish/ice plant worker (31 respondents);
FERENCE WEICKER & COMPANY
Social and Economic Assessment and Analysis – Draft Report Page 54
SECTOR LINKAGES
Fish packer (8 respondents); Deckhand worker (7 respondents); Boat builder (6 respondents); Trapper (5 respondents); Shipwright worker (5 respondents); Hatchery worker (4 respondents); Fish clipper (3 respondents); Longshoreman (3 respondents); Fuel barge worker (3 respondents); Fisheries officer or guardian (2 respondents); Clam digger (2 respondents); Steam ship navigator or crew boat operator (2 respondents); Fishing tool carver (1 respondent); Lighthouse operator (1 respondent); Cook on boat (1 respondent); Tenderman (1 respondent); and Marine architect (1 respondent).
• When asked about changes in the use of traditional marine resources at cultural events, respondents indicated there was now a higher dependence on, and use of, processed or store-bought foods instead of traditional foods. In addition, they noted a decrease in the amounts and types of marine resources served at gatherings like traditional potlatches (e.g. serve chicken or beef stew instead of traditional foods such as salmon, cod, herring, steelhead, abalone, ooligans etc.).
Respondents cited a number of reasons for the changes including:
Noticeable depletion and lack of marine resources available due to the harmful
effects of overfishing, mismanagement, logging, modern technology, unmonitored waste disposals, and pollution ( identified by 164 respondents);
High prices of fuel and lack of access to marine vessels are disabling residents’ access to fishing and harvesting (83 respondents);
Food is cheaper and more convenient to purchase at a Band store (39 respondents);
Changes in preferences and tastes within the community due to generational influences and assimilation (31 respondents);
Strict government fishing restrictions, bylaws, quotas, and health standards disable residents from fishing and harvesting as much as they would like to (24 respondents);
Lack of time to prepare traditional foods and lack of storage space (21 respondents);
The younger generation’s lack of knowledge and interest in traditional fishing and harvesting practices (16 respondents);
Increasing number of shellfish and sea food allergies within the community (8 respondents);
Less sharing of traditional foods within the community due to the shortage of marine resources (3 respondents); and
Competition with commercial fishing and fish farms make it harder for residents to access primary resources (1 respondent).
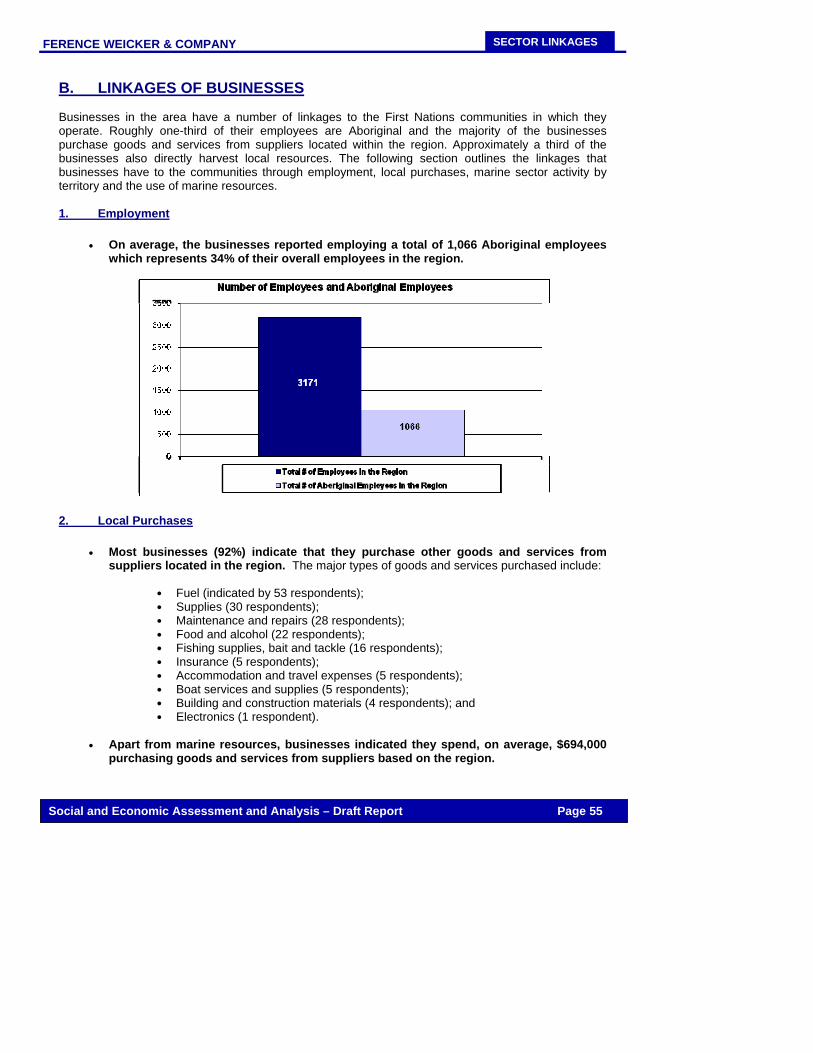
FERENCE WEICKER & COMPANY
Social and Economic Assessment and Analysis – Draft Report Page 55
SECTOR LINKAGES
B. LINKAGES OF BUSINESSES Businesses in the area have a number of linkages to the First Nations communities in which they operate. Roughly one-third of their employees are Aboriginal and the majority of the businesses purchase goods and services from suppliers located within the region. Approximately a third of the businesses also directly harvest local resources. The following section outlines the linkages that businesses have to the communities through employment, local purchases, marine sector activity by territory and the use of marine resources. 1. Employment
• On average, the businesses reported employing a total of 1,066 Aboriginal employees which represents 34% of their overall employees in the region.
2. Local Purchases
• Most businesses (92%) indicate that they purchase other goods and services from suppliers located in the region. The major types of goods and services purchased include:
Fuel (indicated by 53 respondents); Supplies (30 respondents); Maintenance and repairs (28 respondents); Food and alcohol (22 respondents); Fishing supplies, bait and tackle (16 respondents); Insurance (5 respondents); Accommodation and travel expenses (5 respondents); Boat services and supplies (5 respondents); Building and construction materials (4 respondents); and Electronics (1 respondent).
• Apart from marine resources, businesses indicated they spend, on average, $694,000
purchasing goods and services from suppliers based on the region.
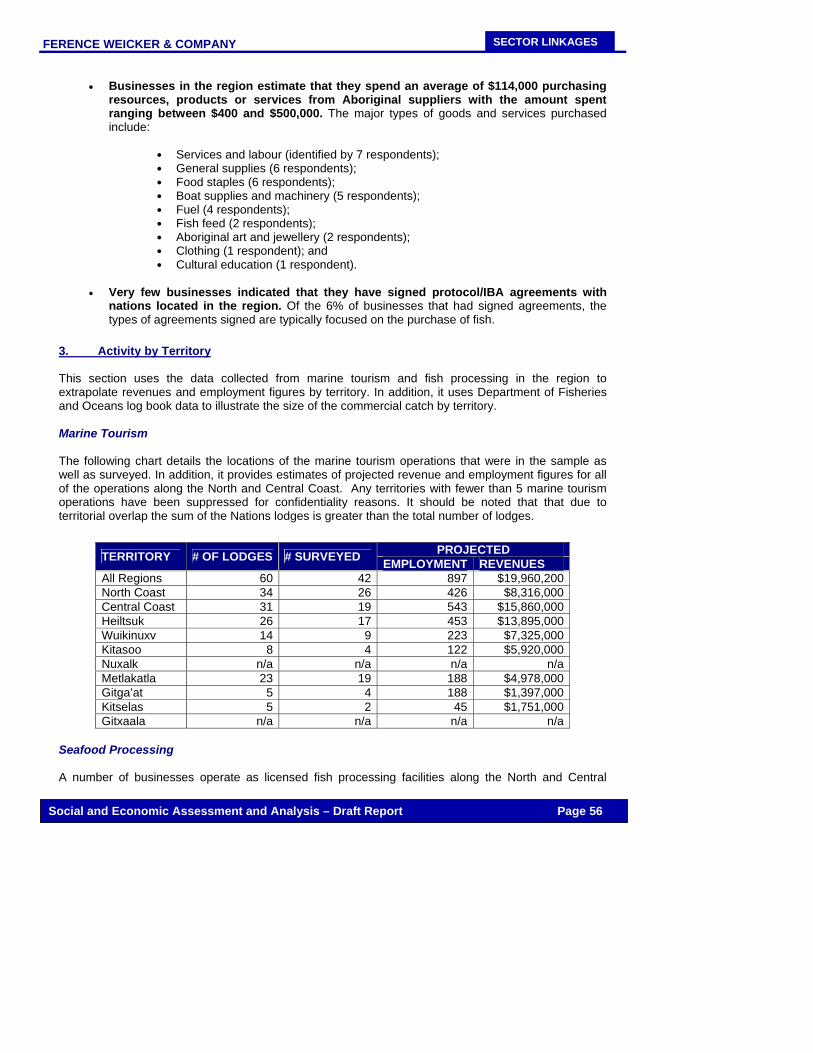
FERENCE WEICKER & COMPANY
Social and Economic Assessment and Analysis – Draft Report Page 56
SECTOR LINKAGES
• Businesses in the region estimate that they spend an average of $114,000 purchasing resources, products or services from Aboriginal suppliers with the amount spent ranging between $400 and $500,000. The major types of goods and services purchased include:
Services and labour (identified by 7 respondents); General supplies (6 respondents); Food staples (6 respondents); Boat supplies and machinery (5 respondents); Fuel (4 respondents); Fish feed (2 respondents); Aboriginal art and jewellery (2 respondents); Clothing (1 respondent); and Cultural education (1 respondent).
• Very few businesses indicated that they have signed protocol/IBA agreements with
nations located in the region. Of the 6% of businesses that had signed agreements, the types of agreements signed are typically focused on the purchase of fish.
3. Activity by Territory This section uses the data collected from marine tourism and fish processing in the region to extrapolate revenues and employment figures by territory. In addition, it uses Department of Fisheries and Oceans log book data to illustrate the size of the commercial catch by territory. Marine Tourism The following chart details the locations of the marine tourism operations that were in the sample as well as surveyed. In addition, it provides estimates of projected revenue and employment figures for all of the operations along the North and Central Coast. Any territories with fewer than 5 marine tourism operations have been suppressed for confidentiality reasons. It should be noted that that due to territorial overlap the sum of the Nations lodges is greater than the total number of lodges. Seafood Processing A number of businesses operate as licensed fish processing facilities along the North and Central
PROJECTED TERRITORY # OF LODGES # SURVEYED EMPLOYMENT REVENUES All Regions 60 42 897 $19,960,200North Coast 34 26 426 $8,316,000Central Coast 31 19 543 $15,860,000Heiltsuk 26 17 453 $13,895,000Wuikinuxv 14 9 223 $7,325,000Kitasoo 8 4 122 $5,920,000Nuxalk n/a n/a n/a n/aMetlakatla 23 19 188 $4,978,000Gitga’at 5 4 188 $1,397,000Kitselas 5 2 45 $1,751,000Gitxaala n/a n/a n/a n/a

FERENCE WEICKER & COMPANY
Social and Economic Assessment and Analysis – Draft Report Page 57
SECTOR LINKAGES
Coast. As the table indicates, our sample revealed 24 operations with 5 of the processors located in the Central Coast and 19 located along the North Coast. The majority of sector revenues are associated with the operations along the North Coast.
LICENSED 2007 PROCESSORS PROJECTED REGION # OF PROCESSORS # SURVEYED EMPLOYMENT REVENUE North Coast 19 12 1,454 $77,800,000Central Coast 5 4 250 $7,150,000All Regions 24 17 1,704 $84,950,000
Fishing The following chart uses 2008 Fisher Registration Card data to provide a rough estimate of the number of employees in the fishing sector by territory. Although fisher registration data indicates the number of people in the region who may be active in the fishing sector it does not necessarily reflect employment as many of the card holders are likely to be active for shorter periods of time. It should be noted that only communities that lie within SOI boundaries of participating North and Central Coast communities were included in the chart. Due to territorial overlap, the sum of the territories is larger than the sum of the regions.
TERRITORY # OF 2008 FISHER REGISTRATION CARDS
All Regions 811North Coast 693Central Coast 118Heiltsuk 69Kitasoo 2Nuxalk 49Wuikinuxv 0Gitga'at 7Gitxaala 624Haisla 7Kitselas 27Kitsumkalum 27Metlakatla 680
This section uses Department of Fisheries and Oceans log book data to compile commercial catch data in First Nation territories along the North and Central Coast. The tables typically use data compiled for the period of 2000-2006 although the groundfish catch data goes further back to 1993 and 1996. The Schedule 2 Catch primarily targets dogfish and lingcod but also includes tuna, skates, sole, flounder and Pacific cod. The Zn Catch is typically referring to rockfish while the Ground Trap Catch includes trawl, halibut by hook and line, sablefish by trap and hook and line, rockfish and other species by hook and line. The tables on the following pages provide the annual average catch by kilogram for the North and Central Coast. As indicated, red urchin catch for 2000 to 2005 along the North and Central Coast accounted for a large portion all of BC’s catch with most being caught in the Gitxaala, Gitga’at, and Kitasoo traditional territories. Much of BC’s Pink salmon in 2000 to 2006 is also caught in the North and Central Coast, particularly in Gitxaala, Metlakatla, and the Heiltsuk traditional territories.
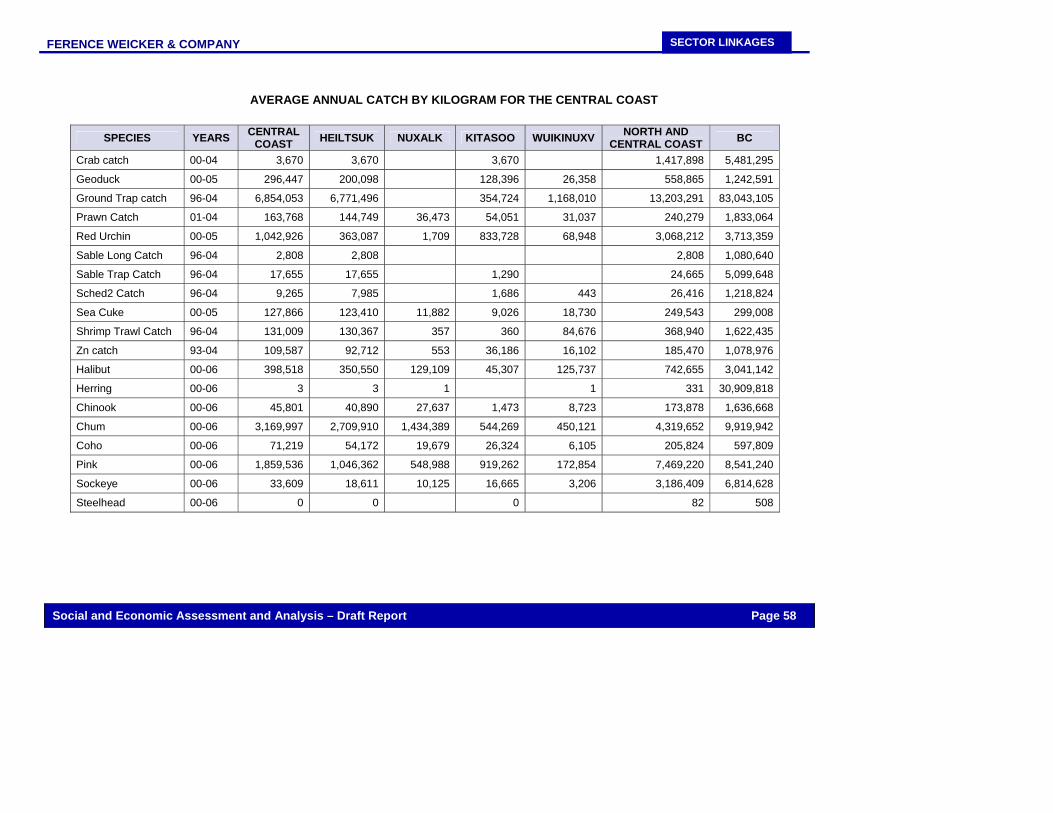
FERENCE WEICKER & COMPANY
SECTOR LINKAGES
Social and Economic Assessment and Analysis – Draft Report Page 58
AVERAGE ANNUAL CATCH BY KILOGRAM FOR THE CENTRAL COAST
SPECIES YEARS CENTRAL COAST HEILTSUK NUXALK KITASOO WUIKINUXV NORTH AND
CENTRAL COAST BC
Crab catch 00-04 3,670 3,670 3,670 1,417,898 5,481,295
Geoduck 00-05 296,447 200,098 128,396 26,358 558,865 1,242,591
Ground Trap catch 96-04 6,854,053 6,771,496 354,724 1,168,010 13,203,291 83,043,105
Prawn Catch 01-04 163,768 144,749 36,473 54,051 31,037 240,279 1,833,064
Red Urchin 00-05 1,042,926 363,087 1,709 833,728 68,948 3,068,212 3,713,359
Sable Long Catch 96-04 2,808 2,808 2,808 1,080,640
Sable Trap Catch 96-04 17,655 17,655 1,290 24,665 5,099,648
Sched2 Catch 96-04 9,265 7,985 1,686 443 26,416 1,218,824
Sea Cuke 00-05 127,866 123,410 11,882 9,026 18,730 249,543 299,008
Shrimp Trawl Catch 96-04 131,009 130,367 357 360 84,676 368,940 1,622,435
Zn catch 93-04 109,587 92,712 553 36,186 16,102 185,470 1,078,976
Halibut 00-06 398,518 350,550 129,109 45,307 125,737 742,655 3,041,142
Herring 00-06 3 3 1 1 331 30,909,818
Chinook 00-06 45,801 40,890 27,637 1,473 8,723 173,878 1,636,668
Chum 00-06 3,169,997 2,709,910 1,434,389 544,269 450,121 4,319,652 9,919,942
Coho 00-06 71,219 54,172 19,679 26,324 6,105 205,824 597,809
Pink 00-06 1,859,536 1,046,362 548,988 919,262 172,854 7,469,220 8,541,240
Sockeye 00-06 33,609 18,611 10,125 16,665 3,206 3,186,409 6,814,628
Steelhead 00-06 0 0 0 82 508
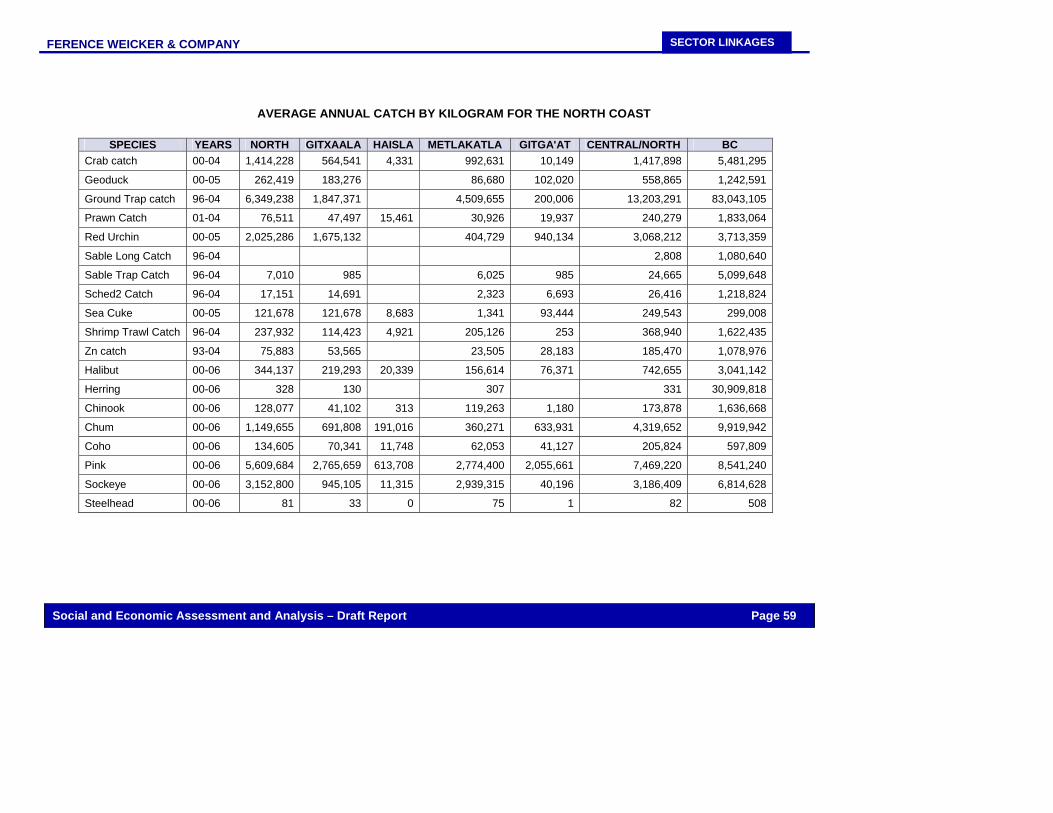
FERENCE WEICKER & COMPANY
SECTOR LINKAGES
Social and Economic Assessment and Analysis – Draft Report Page 59
AVERAGE ANNUAL CATCH BY KILOGRAM FOR THE NORTH COAST
SPECIES YEARS NORTH GITXAALA HAISLA METLAKATLA GITGA'AT CENTRAL/NORTH BC Crab catch 00-04 1,414,228 564,541 4,331 992,631 10,149 1,417,898 5,481,295
Geoduck 00-05 262,419 183,276 86,680 102,020 558,865 1,242,591
Ground Trap catch 96-04 6,349,238 1,847,371 4,509,655 200,006 13,203,291 83,043,105
Prawn Catch 01-04 76,511 47,497 15,461 30,926 19,937 240,279 1,833,064
Red Urchin 00-05 2,025,286 1,675,132 404,729 940,134 3,068,212 3,713,359
Sable Long Catch 96-04 2,808 1,080,640
Sable Trap Catch 96-04 7,010 985 6,025 985 24,665 5,099,648
Sched2 Catch 96-04 17,151 14,691 2,323 6,693 26,416 1,218,824
Sea Cuke 00-05 121,678 121,678 8,683 1,341 93,444 249,543 299,008
Shrimp Trawl Catch 96-04 237,932 114,423 4,921 205,126 253 368,940 1,622,435
Zn catch 93-04 75,883 53,565 23,505 28,183 185,470 1,078,976
Halibut 00-06 344,137 219,293 20,339 156,614 76,371 742,655 3,041,142
Herring 00-06 328 130 307 331 30,909,818
Chinook 00-06 128,077 41,102 313 119,263 1,180 173,878 1,636,668
Chum 00-06 1,149,655 691,808 191,016 360,271 633,931 4,319,652 9,919,942
Coho 00-06 134,605 70,341 11,748 62,053 41,127 205,824 597,809
Pink 00-06 5,609,684 2,765,659 613,708 2,774,400 2,055,661 7,469,220 8,541,240
Sockeye 00-06 3,152,800 945,105 11,315 2,939,315 40,196 3,186,409 6,814,628
Steelhead 00-06 81 33 0 75 1 82 508
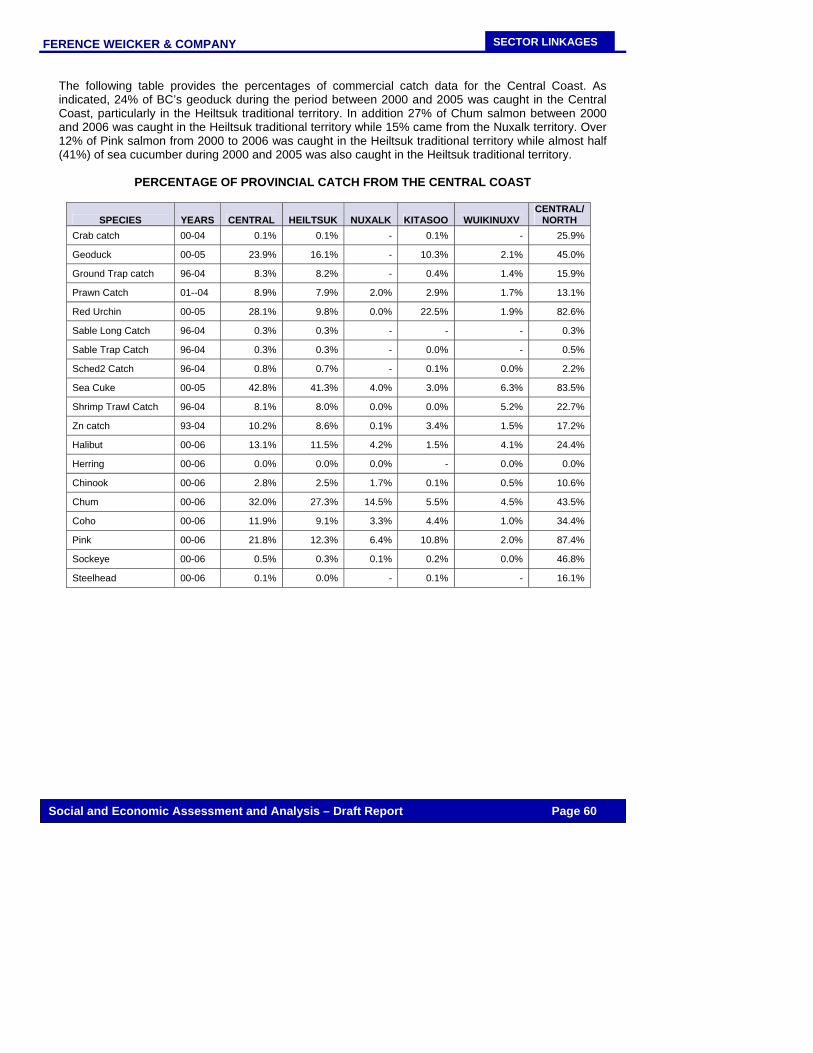
FERENCE WEICKER & COMPANY
Social and Economic Assessment and Analysis – Draft Report Page 60
SECTOR LINKAGES
The following table provides the percentages of commercial catch data for the Central Coast. As indicated, 24% of BC’s geoduck during the period between 2000 and 2005 was caught in the Central Coast, particularly in the Heiltsuk traditional territory. In addition 27% of Chum salmon between 2000 and 2006 was caught in the Heiltsuk traditional territory while 15% came from the Nuxalk territory. Over 12% of Pink salmon from 2000 to 2006 was caught in the Heiltsuk traditional territory while almost half (41%) of sea cucumber during 2000 and 2005 was also caught in the Heiltsuk traditional territory.
PERCENTAGE OF PROVINCIAL CATCH FROM THE CENTRAL COAST
SPECIES YEARS CENTRAL HEILTSUK NUXALK KITASOO WUIKINUXV CENTRAL/
NORTH Crab catch 00-04 0.1% 0.1% - 0.1% - 25.9%
Geoduck 00-05 23.9% 16.1% - 10.3% 2.1% 45.0%
Ground Trap catch 96-04 8.3% 8.2% - 0.4% 1.4% 15.9%
Prawn Catch 01--04 8.9% 7.9% 2.0% 2.9% 1.7% 13.1%
Red Urchin 00-05 28.1% 9.8% 0.0% 22.5% 1.9% 82.6%
Sable Long Catch 96-04 0.3% 0.3% - - - 0.3%
Sable Trap Catch 96-04 0.3% 0.3% - 0.0% - 0.5%
Sched2 Catch 96-04 0.8% 0.7% - 0.1% 0.0% 2.2%
Sea Cuke 00-05 42.8% 41.3% 4.0% 3.0% 6.3% 83.5%
Shrimp Trawl Catch 96-04 8.1% 8.0% 0.0% 0.0% 5.2% 22.7%
Zn catch 93-04 10.2% 8.6% 0.1% 3.4% 1.5% 17.2%
Halibut 00-06 13.1% 11.5% 4.2% 1.5% 4.1% 24.4%
Herring 00-06 0.0% 0.0% 0.0% - 0.0% 0.0%
Chinook 00-06 2.8% 2.5% 1.7% 0.1% 0.5% 10.6%
Chum 00-06 32.0% 27.3% 14.5% 5.5% 4.5% 43.5%
Coho 00-06 11.9% 9.1% 3.3% 4.4% 1.0% 34.4%
Pink 00-06 21.8% 12.3% 6.4% 10.8% 2.0% 87.4%
Sockeye 00-06 0.5% 0.3% 0.1% 0.2% 0.0% 46.8%
Steelhead 00-06 0.1% 0.0% - 0.1% - 16.1%
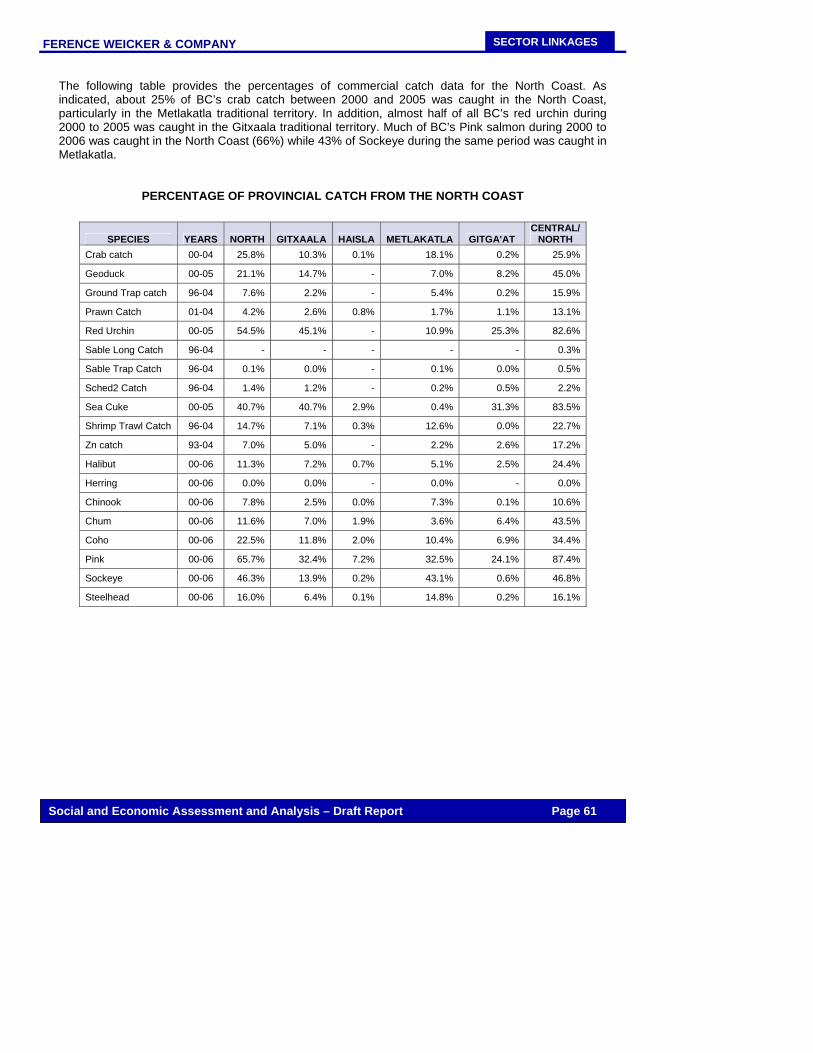
FERENCE WEICKER & COMPANY
Social and Economic Assessment and Analysis – Draft Report Page 61
SECTOR LINKAGES
The following table provides the percentages of commercial catch data for the North Coast. As indicated, about 25% of BC’s crab catch between 2000 and 2005 was caught in the North Coast, particularly in the Metlakatla traditional territory. In addition, almost half of all BC’s red urchin during 2000 to 2005 was caught in the Gitxaala traditional territory. Much of BC’s Pink salmon during 2000 to 2006 was caught in the North Coast (66%) while 43% of Sockeye during the same period was caught in Metlakatla.
PERCENTAGE OF PROVINCIAL CATCH FROM THE NORTH COAST
SPECIES YEARS NORTH GITXAALA HAISLA METLAKATLA GITGA'AT CENTRAL/
NORTH Crab catch 00-04 25.8% 10.3% 0.1% 18.1% 0.2% 25.9%
Geoduck 00-05 21.1% 14.7% - 7.0% 8.2% 45.0%
Ground Trap catch 96-04 7.6% 2.2% - 5.4% 0.2% 15.9%
Prawn Catch 01-04 4.2% 2.6% 0.8% 1.7% 1.1% 13.1%
Red Urchin 00-05 54.5% 45.1% - 10.9% 25.3% 82.6%
Sable Long Catch 96-04 - - - - - 0.3%
Sable Trap Catch 96-04 0.1% 0.0% - 0.1% 0.0% 0.5%
Sched2 Catch 96-04 1.4% 1.2% - 0.2% 0.5% 2.2%
Sea Cuke 00-05 40.7% 40.7% 2.9% 0.4% 31.3% 83.5%
Shrimp Trawl Catch 96-04 14.7% 7.1% 0.3% 12.6% 0.0% 22.7%
Zn catch 93-04 7.0% 5.0% - 2.2% 2.6% 17.2%
Halibut 00-06 11.3% 7.2% 0.7% 5.1% 2.5% 24.4%
Herring 00-06 0.0% 0.0% - 0.0% - 0.0%
Chinook 00-06 7.8% 2.5% 0.0% 7.3% 0.1% 10.6%
Chum 00-06 11.6% 7.0% 1.9% 3.6% 6.4% 43.5%
Coho 00-06 22.5% 11.8% 2.0% 10.4% 6.9% 34.4%
Pink 00-06 65.7% 32.4% 7.2% 32.5% 24.1% 87.4%
Sockeye 00-06 46.3% 13.9% 0.2% 43.1% 0.6% 46.8%
Steelhead 00-06 16.0% 6.4% 0.1% 14.8% 0.2% 16.1%
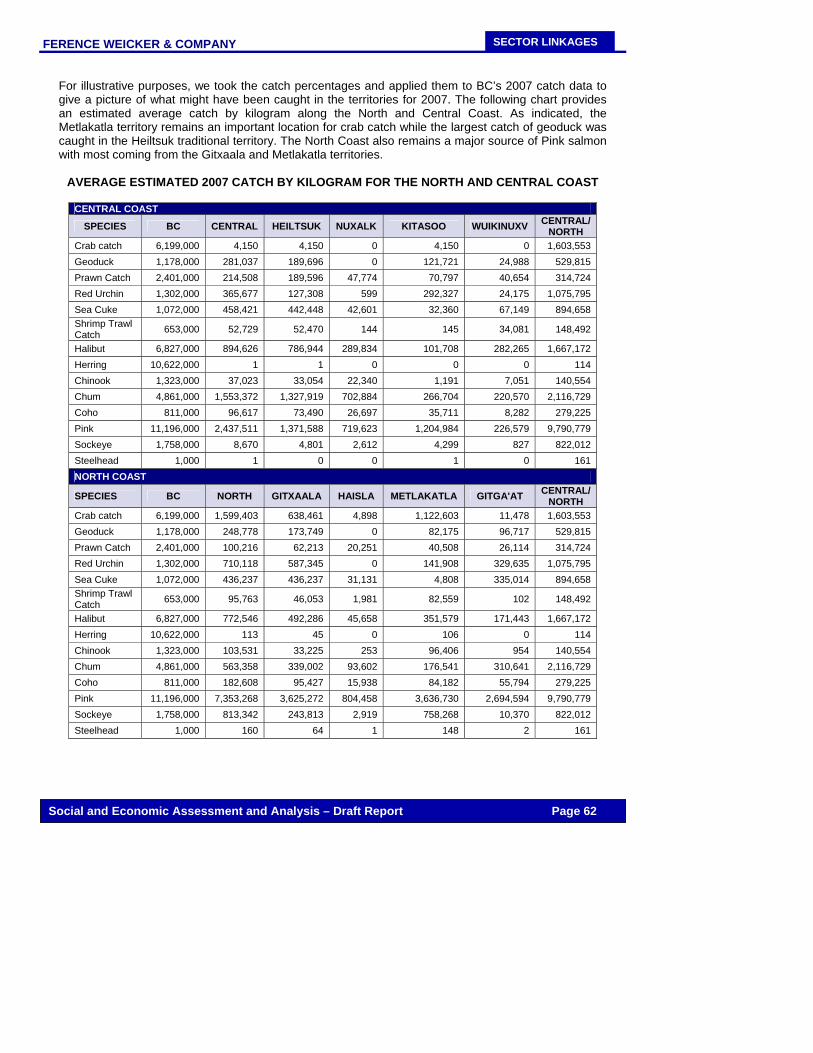
FERENCE WEICKER & COMPANY
Social and Economic Assessment and Analysis – Draft Report Page 62
SECTOR LINKAGES
For illustrative purposes, we took the catch percentages and applied them to BC’s 2007 catch data to give a picture of what might have been caught in the territories for 2007. The following chart provides an estimated average catch by kilogram along the North and Central Coast. As indicated, the Metlakatla territory remains an important location for crab catch while the largest catch of geoduck was caught in the Heiltsuk traditional territory. The North Coast also remains a major source of Pink salmon with most coming from the Gitxaala and Metlakatla territories.
AVERAGE ESTIMATED 2007 CATCH BY KILOGRAM FOR THE NORTH AND CENTRAL COAST
CENTRAL COAST
SPECIES BC CENTRAL HEILTSUK NUXALK KITASOO WUIKINUXV CENTRAL/ NORTH
Crab catch 6,199,000 4,150 4,150 0 4,150 0 1,603,553 Geoduck 1,178,000 281,037 189,696 0 121,721 24,988 529,815 Prawn Catch 2,401,000 214,508 189,596 47,774 70,797 40,654 314,724 Red Urchin 1,302,000 365,677 127,308 599 292,327 24,175 1,075,795 Sea Cuke 1,072,000 458,421 442,448 42,601 32,360 67,149 894,658 Shrimp Trawl Catch 653,000 52,729 52,470 144 145 34,081 148,492
Halibut 6,827,000 894,626 786,944 289,834 101,708 282,265 1,667,172 Herring 10,622,000 1 1 0 0 0 114 Chinook 1,323,000 37,023 33,054 22,340 1,191 7,051 140,554 Chum 4,861,000 1,553,372 1,327,919 702,884 266,704 220,570 2,116,729 Coho 811,000 96,617 73,490 26,697 35,711 8,282 279,225 Pink 11,196,000 2,437,511 1,371,588 719,623 1,204,984 226,579 9,790,779 Sockeye 1,758,000 8,670 4,801 2,612 4,299 827 822,012 Steelhead 1,000 1 0 0 1 0 161 NORTH COAST
SPECIES BC NORTH GITXAALA HAISLA METLAKATLA GITGA'AT CENTRAL/ NORTH
Crab catch 6,199,000 1,599,403 638,461 4,898 1,122,603 11,478 1,603,553 Geoduck 1,178,000 248,778 173,749 0 82,175 96,717 529,815 Prawn Catch 2,401,000 100,216 62,213 20,251 40,508 26,114 314,724 Red Urchin 1,302,000 710,118 587,345 0 141,908 329,635 1,075,795 Sea Cuke 1,072,000 436,237 436,237 31,131 4,808 335,014 894,658 Shrimp Trawl Catch 653,000 95,763 46,053 1,981 82,559 102 148,492
Halibut 6,827,000 772,546 492,286 45,658 351,579 171,443 1,667,172 Herring 10,622,000 113 45 0 106 0 114 Chinook 1,323,000 103,531 33,225 253 96,406 954 140,554 Chum 4,861,000 563,358 339,002 93,602 176,541 310,641 2,116,729 Coho 811,000 182,608 95,427 15,938 84,182 55,794 279,225 Pink 11,196,000 7,353,268 3,625,272 804,458 3,636,730 2,694,594 9,790,779 Sockeye 1,758,000 813,342 243,813 2,919 758,268 10,370 822,012 Steelhead 1,000 160 64 1 148 2 161
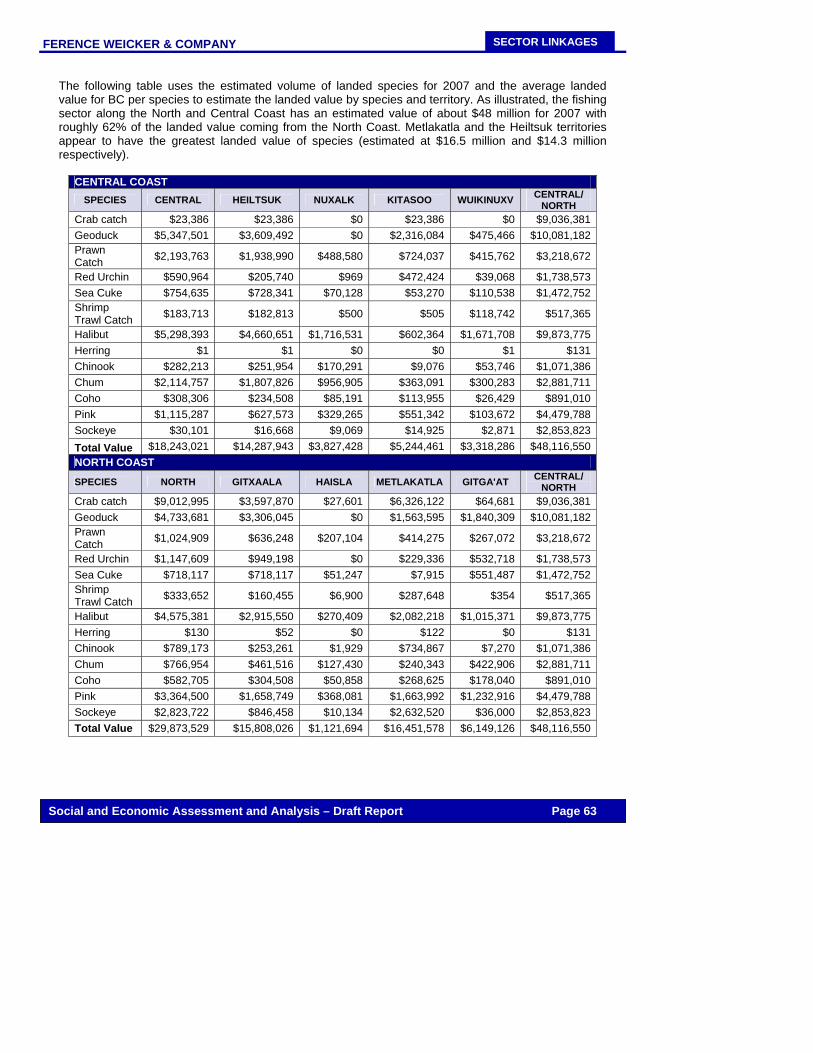
FERENCE WEICKER & COMPANY
SECTOR LINKAGES
Social and Economic Assessment and Analysis – Draft Report Page 63
The following table uses the estimated volume of landed species for 2007 and the average landed value for BC per species to estimate the landed value by species and territory. As illustrated, the fishing sector along the North and Central Coast has an estimated value of about $48 million for 2007 with roughly 62% of the landed value coming from the North Coast. Metlakatla and the Heiltsuk territories appear to have the greatest landed value of species (estimated at $16.5 million and $14.3 million respectively).
CENTRAL COAST SPECIES CENTRAL HEILTSUK NUXALK KITASOO WUIKINUXV CENTRAL/
NORTH Crab catch $23,386 $23,386 $0 $23,386 $0 $9,036,381 Geoduck $5,347,501 $3,609,492 $0 $2,316,084 $475,466 $10,081,182 Prawn Catch $2,193,763 $1,938,990 $488,580 $724,037 $415,762 $3,218,672
Red Urchin $590,964 $205,740 $969 $472,424 $39,068 $1,738,573 Sea Cuke $754,635 $728,341 $70,128 $53,270 $110,538 $1,472,752 Shrimp Trawl Catch $183,713 $182,813 $500 $505 $118,742 $517,365
Halibut $5,298,393 $4,660,651 $1,716,531 $602,364 $1,671,708 $9,873,775 Herring $1 $1 $0 $0 $1 $131 Chinook $282,213 $251,954 $170,291 $9,076 $53,746 $1,071,386 Chum $2,114,757 $1,807,826 $956,905 $363,091 $300,283 $2,881,711 Coho $308,306 $234,508 $85,191 $113,955 $26,429 $891,010 Pink $1,115,287 $627,573 $329,265 $551,342 $103,672 $4,479,788 Sockeye $30,101 $16,668 $9,069 $14,925 $2,871 $2,853,823 Total Value $18,243,021 $14,287,943 $3,827,428 $5,244,461 $3,318,286 $48,116,550 NORTH COAST
SPECIES NORTH GITXAALA HAISLA METLAKATLA GITGA'AT CENTRAL/ NORTH
Crab catch $9,012,995 $3,597,870 $27,601 $6,326,122 $64,681 $9,036,381 Geoduck $4,733,681 $3,306,045 $0 $1,563,595 $1,840,309 $10,081,182 Prawn Catch $1,024,909 $636,248 $207,104 $414,275 $267,072 $3,218,672
Red Urchin $1,147,609 $949,198 $0 $229,336 $532,718 $1,738,573 Sea Cuke $718,117 $718,117 $51,247 $7,915 $551,487 $1,472,752 Shrimp Trawl Catch $333,652 $160,455 $6,900 $287,648 $354 $517,365
Halibut $4,575,381 $2,915,550 $270,409 $2,082,218 $1,015,371 $9,873,775 Herring $130 $52 $0 $122 $0 $131 Chinook $789,173 $253,261 $1,929 $734,867 $7,270 $1,071,386 Chum $766,954 $461,516 $127,430 $240,343 $422,906 $2,881,711 Coho $582,705 $304,508 $50,858 $268,625 $178,040 $891,010 Pink $3,364,500 $1,658,749 $368,081 $1,663,992 $1,232,916 $4,479,788 Sockeye $2,823,722 $846,458 $10,134 $2,632,520 $36,000 $2,853,823 Total Value $29,873,529 $15,808,026 $1,121,694 $16,451,578 $6,149,126 $48,116,550
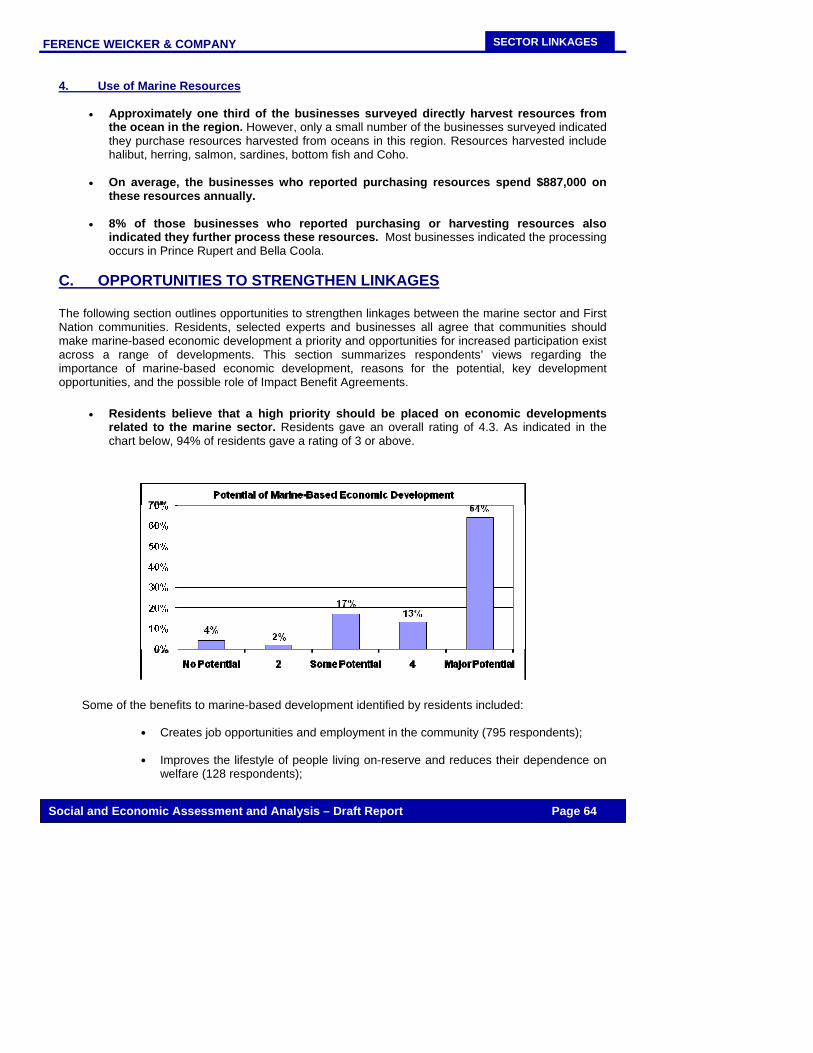
FERENCE WEICKER & COMPANY
SECTOR LINKAGES
Social and Economic Assessment and Analysis – Draft Report Page 64
4. Use of Marine Resources
• Approximately one third of the businesses surveyed directly harvest resources from the ocean in the region. However, only a small number of the businesses surveyed indicated they purchase resources harvested from oceans in this region. Resources harvested include halibut, herring, salmon, sardines, bottom fish and Coho.
• On average, the businesses who reported purchasing resources spend $887,000 on
these resources annually. • 8% of those businesses who reported purchasing or harvesting resources also
indicated they further process these resources. Most businesses indicated the processing occurs in Prince Rupert and Bella Coola.
C. OPPORTUNITIES TO STRENGTHEN LINKAGES The following section outlines opportunities to strengthen linkages between the marine sector and First Nation communities. Residents, selected experts and businesses all agree that communities should make marine-based economic development a priority and opportunities for increased participation exist across a range of developments. This section summarizes respondents’ views regarding the importance of marine-based economic development, reasons for the potential, key development opportunities, and the possible role of Impact Benefit Agreements.
• Residents believe that a high priority should be placed on economic developments related to the marine sector. Residents gave an overall rating of 4.3. As indicated in the chart below, 94% of residents gave a rating of 3 or above.
Some of the benefits to marine-based development identified by residents included:
Creates job opportunities and employment in the community (795 respondents);
Improves the lifestyle of people living on-reserve and reduces their dependence on welfare (128 respondents);
FERENCE WEICKER & COMPANY
SECTOR LINKAGES
Social and Economic Assessment and Analysis – Draft Report Page 65
Improves residents’ access to traditional food and marine resources (115
respondents);
Enhances familiarity with the traditional territory and practices (77 respondents);
Increases economic development and stimulates tourism (68 respondents);
Facilitates community togetherness and builds the community profile and self-sufficiency (66 respondents);
Facilitates emphasis on better marine management and restoration practices (56
respondents);
Educates and enhances the skills of the local working population (38 respondents);
Improves the living standards and health of people living on-reserve (33 respondents);
Encourages migration to the area (2 respondents);
Facilitates family unity through collective participation in preparing traditional foods
(1 respondent); and
Reduces non-member harvesting within the community grounds (1 respondent).
• There are a number of factors that constrain First Nations participation in the marine
economy. Factors such as a lack of training, education, and certification, limited access to capital, depleting fish stocks, poor transportation in the area, and a lack of strategic planning and development limit their ability to participate. Businesses identified a number of factors that constrain First Nations participation in the marine economy including:
Lack of skills, certifications and access to training programs (identified by 16 respondents);
Lack of education (12 respondents); Lack of motivation and willingness to take opportunities (7 respondents); Limited access to start-up capital and business loans (4 respondents); Lack of willingness to relocate (3 respondents); Lack of exposure to business and entrepreneurial opportunities due to the
isolation of the reserves (1 respondent); and Cultural mismatch (e.g. sport fishing does not fit in with their belief system) (1
respondent).
Experts identified a number of factors that constrain First Nations participation in the marine economy including:
Lack of industry-related training and education (identified by 19 respondents); Limited access to start-up capital and business loans (8 respondents);

FERENCE WEICKER & COMPANY
SECTOR LINKAGES
Social and Economic Assessment and Analysis – Draft Report Page 66
Political issues at the local level and conflict between tribes due to unclear rules regarding land boundaries (4 respondents);
Lack of willingness to participate in marine-based economic development (3 respondents);
Lack of natural resources and depleting fish stocks (3 respondents); Low wages and only seasonal work opportunities (2 respondents); Poor transportation in the area as well as high costs of commuting (1
respondent); Fisheries reluctance to include First Nations’ input into commercial fishing (1
respondent); and Fear within tribes that participation in marine-based economic development will
degrade their traditional territories, natural environment and cultural framework (1 respondent).
• Local residents, businesses, and selected experts all provided recommendations for
increasing the involvement of First Nations people. Businesses identified a range of opportunities that currently exist to increase participation of First Nations people and organizations in the marine sector including:
Expand eco-based tourism in the community to attract visitors year-round and provide more employment opportunities in the tourism sector (e.g. tour operators/guides) (identified by 12 respondents);
Increase commercial and sports fishing (9 respondents); Offer more skills training, programs, and excursions for the young First Nations
population (4 respondents); Improve community infrastructure (e.g. build bridges) and implement more
frequent transportation and ferry service (4 respondents); More employment opportunities in the trades sector (2 respondents); Create and enhance aquaculture developments in the community, such as fish
farms (2 respondents); Increase hatcheries in the community (2 respondents); Provide more employment opportunities in the marine sector (e.g. crews on boat)
(2 respondents); and More support and collaboration with First Nations people (1 respondent).
Experts also identified a range of opportunities that currently exist to increase participation of First Nations people and organizations in the marine sector including:
Educate First Nations people about employment opportunities and provide management training (identified by 10 respondents);
Create and enhance aquaculture developments in the community, such as fish farms (5 respondents);
Increase hatcheries in the community (4 respondents); Expand cultural and eco-tourism in the community to attract visitors year-round
(4 respondents); Increase commercial fishing (3 respondents); Involve First Nations in decision making process and encourage self reliance (3
respondents); Provide capital and financing (2 respondents); Provide employment opportunities in the marine sector (2 respondents);
FERENCE WEICKER & COMPANY
SECTOR LINKAGES
Social and Economic Assessment and Analysis – Draft Report Page 67
Provide employment opportunities in the logging and wood processing sector (1 respondent);
Diversify marine resources in order to encourage self reliance (1 respondent); and
Increase community licensing support (1 respondent).
In addition, experts suggested specific steps that could be taken to increase the participation of First Nations as employers, producers, or suppliers including:
Increasing education and training opportunities in key sectors (22 respondents); Increasing access to funding opportunities and start-up loans (5 respondents); Developing the infrastructure in the area including transportation systems (4
respondents); Increasing partnerships with the aquaculture industry (3 respondents); Diversifying the marine industry and market new sea products (2 respondents);
and Removing government dependency (2 respondents).

APPENDICES
FERENCE WEICKER & COMPANY
APPENDICES
Turning Point- Social and Economic Assessment and Analysis Page A - 1
GUIDE TO THE IN-PERSON INTERVIEWS What is the Purpose and Focus of the Survey? This project is being undertaken on behalf of an alliance of First Nations on British Columbia’s North and Central Coast. The Coastal First Nations, in collaboration with the Tsimshian Stewardship Committee, are working with Oceans Canada to develop an Integrated Marine Use Planning process in the Pacific North Coast Integrated Management Area (PNCIMA). The results of the survey will serve as an important input for the planning process. More specifically, the survey will provide information about:
Employment of people in the community The linkages with the marine sector (e.g. fishing, fish processing, aquaculture, marine tourism,
marine transportation) The linkages of past generations to the marine sector Perceptions regarding economic development in the area The characteristics of residents (e.g. education, age, gender, income)
What is My Role in the Survey? Your role is to:
Find members of the target group within your community with whom you will conduct interviews; Enter the responses of each respondent into the Excel file provided to you;
E-mail the Excel file to your respective socioeconomic planners after you have completed and
entered the results of the first 5 questionnaires. She/he will review the results of the initial interviews to confirm that we are getting the information that we will need for the report.
Continue to enter the results as you complete interviews into the same file and periodically
(about every two weeks) e-mail a copy of the file to your respective socioeconomic planners. How Do I Prepare for My Role? You should:
Read through the entire questionnaire and become familiar with it before doing the first interview. It is useful to conduct several practice interviews with family or friends.
Have enough blank copies of the questionnaire so that a new questionnaire is filled out for each
interview. Who Do I Interview? The primary focus is residents in the community who are aged 18 years and older. You may also be asked to conduct interviews with Band members, who are living off-reserve. How Long Will The Interview Take To Complete?
FERENCE WEICKER & COMPANY
APPENDICES
Turning Point- Social and Economic Assessment and Analysis Page A - 2
This questionnaire takes between 20 and 25 minutes to complete (but can take more or less time depending on the interviewer and the person being interviewed.) How Do I Follow This Questionnaire and Conduct This Interview?
Please read the questions as they are written. If the question is not clearly understood, please repeat the question again, emphasizing the
words that you think will help the person to understand the question.
Unless otherwise noted, one response only is required for each question. When there are questions with an option for more than one answer (e.g., “Check all that apply”), note all the answers given by the person being interviewed.
Sometimes there are questions that ask for more detail – in these cases, try to ask the person
who is answering the questionnaire to be as specific as possible, and then try to write down what they said as accurately and completely as you can.
Only read bolded words aloud. Those words that are not bolded are simply directions and/or
information for the interviewer.
You may see questions with a long list of possible answers, but only read lists that are bolded. Lists that are not bolded mean we want to see what the person answering the questionnaire will say on his or her own, without a list to choose from, so please do not read this list out loud. Instead, listen to what the person being interviewed says, and then try to match it up with the most appropriate category on the list.
If you think an answer fits but are not sure, you can read the answer you feel is the best match
and ask them if that is the right one to match their answer. If their answer is not on the list at all, or is not close to one of the categories, there is usually a category called ‘Other’ – you can record it there, writing down specifically what they said.
Each question has a Don’t Know/No Response answer. It is not necessary to read this answer,
but you can use it where the person has volunteered that they don’t know or are unwilling to provide a reply.
In most cases, the questions on the survey are asked and answered in sequence. At certain points in the questionnaire, how a person answers a question will determine the next question they get – you can tell which questions these are, because they have instructions written in bold, capital letters. Sometimes the instructions will tell you to “skip to” a question that is later in the questionnaire. This is entirely based on the person’s answer. Most of the time, if you read through the questionnaire, it is easy to see the logic behind why certain questions are skipped for people, depending on their answers. How Do I Enter the Completed Questionnaires
Use the excel file provided to enter the completed questionnaires. The survey question numbers will correspond to the excel sheet (e.g. in the questionnaire,
section A, question 1 will be titled A1 in the excel sheet).
FERENCE WEICKER & COMPANY
APPENDICES
Turning Point- Social and Economic Assessment and Analysis Page A - 3
Rating questions (e.g. “On a scale of 1 to 5”) will require you to select the appropriate response from a drop down menu.
You should ensure that all of the answers contained in the survey, get entered into the excel
sheet. What Do I Do With The Completed Forms? We would like you to e-mail a brief progress report (typically after four weeks) to your respective socioeconomic planners at least two times from the time you start the interviewing to the time that you have completed all of the interviews. This e-mail report should give:
The total number of interviews completed (for men and women separately) Any difficulties in doing the interviews About how long they are taking (as a general average time) How many people have been asked to do the survey How many people refused to do the survey Any issues with entering the surveys into excel
Who Do I Contact If I Have Any Questions? If you have any questions about the questionnaire, or the project in general, please feel free to contact
Janine Bedford, Senior Consultant Ference Weicker & Company 550 – 475 West Georgia St. Vancouver, BC V7H 1P7 Telephone (toll-free): 1-866-680-3926 (ext. 303) Fax: (604) 688-2369 [email protected]
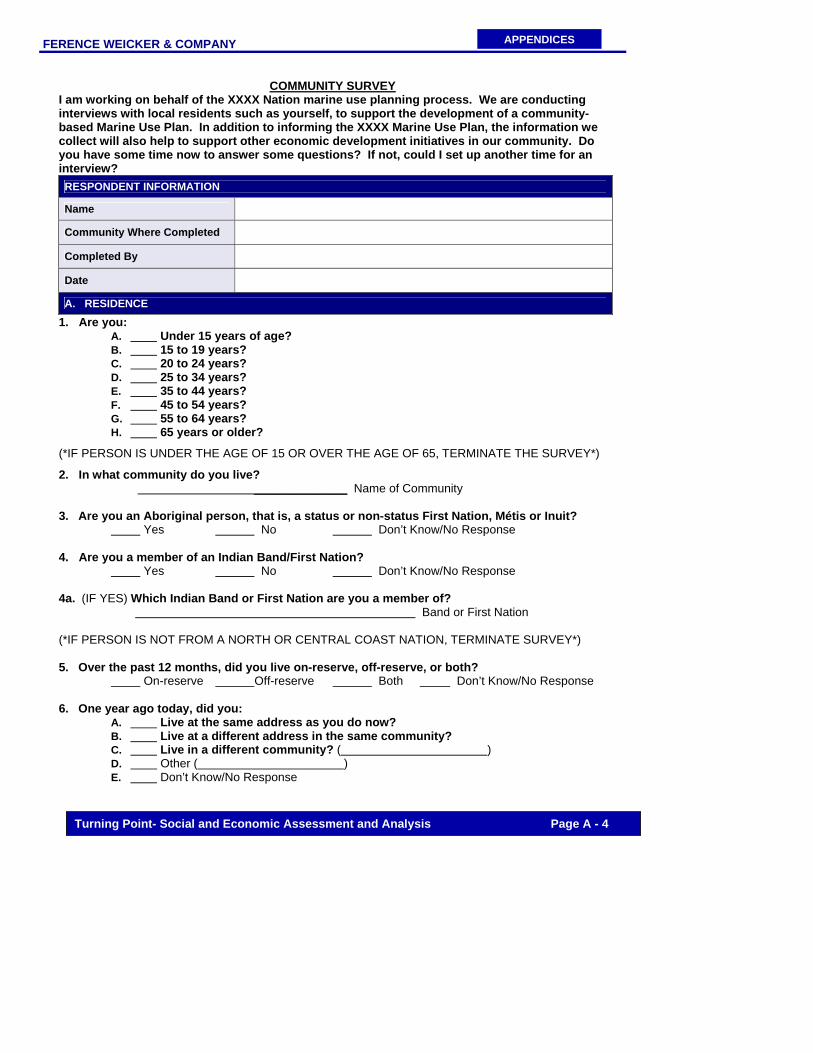
FERENCE WEICKER & COMPANY
APPENDICES
Turning Point- Social and Economic Assessment and Analysis Page A - 4
COMMUNITY SURVEY I am working on behalf of the XXXX Nation marine use planning process. We are conducting interviews with local residents such as yourself, to support the development of a community-based Marine Use Plan. In addition to informing the XXXX Marine Use Plan, the information we collect will also help to support other economic development initiatives in our community. Do you have some time now to answer some questions? If not, could I set up another time for an interview? RESPONDENT INFORMATION
Name
Community Where Completed
Completed By
Date
A. RESIDENCE
1. Are you: A. Under 15 years of age? B. 15 to 19 years? C. 20 to 24 years? D. 25 to 34 years? E. 35 to 44 years? F. 45 to 54 years? G. 55 to 64 years? H. 65 years or older?
(*IF PERSON IS UNDER THE AGE OF 15 OR OVER THE AGE OF 65, TERMINATE THE SURVEY*)
2. In what community do you live? ______________ Name of Community 3. Are you an Aboriginal person, that is, a status or non-status First Nation, Métis or Inuit?
Yes No Don’t Know/No Response
4. Are you a member of an Indian Band/First Nation? Yes No Don’t Know/No Response
4a. (IF YES) Which Indian Band or First Nation are you a member of? Band or First Nation (*IF PERSON IS NOT FROM A NORTH OR CENTRAL COAST NATION, TERMINATE SURVEY*) 5. Over the past 12 months, did you live on-reserve, off-reserve, or both?
On-reserve Off-reserve Both Don’t Know/No Response 6. One year ago today, did you:
A. Live at the same address as you do now? B. Live at a different address in the same community? C. Live in a different community? ( ) D. Other ( ) E. Don’t Know/No Response
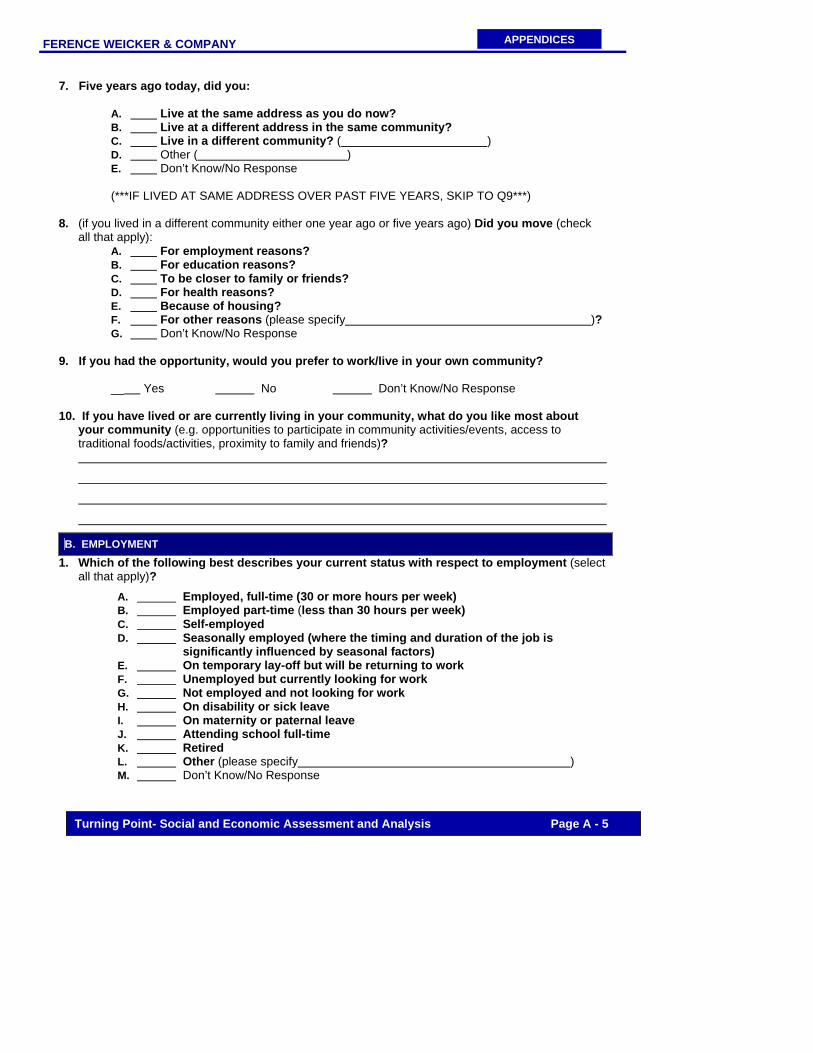
FERENCE WEICKER & COMPANY
APPENDICES
Turning Point- Social and Economic Assessment and Analysis Page A - 5
7. Five years ago today, did you:
A. Live at the same address as you do now? B. Live at a different address in the same community? C. Live in a different community? ( ) D. Other ( ) E. Don’t Know/No Response
(***IF LIVED AT SAME ADDRESS OVER PAST FIVE YEARS, SKIP TO Q9***)
8. (if you lived in a different community either one year ago or five years ago) Did you move (check all that apply):
A. For employment reasons? B. For education reasons? C. To be closer to family or friends? D. For health reasons? E. Because of housing? F. For other reasons (please specify )? G. Don’t Know/No Response
9. If you had the opportunity, would you prefer to work/live in your own community?
__ Yes No Don’t Know/No Response
10. If you have lived or are currently living in your community, what do you like most about
your community (e.g. opportunities to participate in community activities/events, access to traditional foods/activities, proximity to family and friends)?
B. EMPLOYMENT 1. Which of the following best describes your current status with respect to employment (select
all that apply)?
A. Employed, full-time (30 or more hours per week) B. Employed part-time (less than 30 hours per week) C. Self-employed D. Seasonally employed (where the timing and duration of the job is
significantly influenced by seasonal factors) E. On temporary lay-off but will be returning to work F. Unemployed but currently looking for work G. Not employed and not looking for work H. On disability or sick leave I. On maternity or paternal leave J. Attending school full-time K. Retired L. Other (please specify ) M. Don’t Know/No Response

FERENCE WEICKER & COMPANY
APPENDICES
Turning Point- Social and Economic Assessment and Analysis Page A - 6
1a. (if currently employed) What is your current occupation (e.g. carpenter, clerk, manager,
fishermen, teacher, driver, nurse, general labourer, etc.)?
1b. Is the job located on-reserve?
A. On-reserve B. Off-reserve C. Other ( ) D. Don’t Know/no response
1c. (if off-reserve) Where off-reserve is the job located?
2. Approximately how many weeks did you work in total over the past 12 months? Number of weeks worked over past 12 months
(**IF NONE, SKIP TO QUESTION B3**)
2a. How many different organizations did you work for during this time period (count self- employment as 1 organization)? Number of organizations worked for 2b. During the past 12 months, did you work for any organizations involved in the following sectors (select all that apply)?
A. Fishing (what type of fishery ) B. Fish processing C. Aquaculture(type of aquaculture ) D. Logging E. Wood processing F. Accommodation, food and beverage G. Tourism (type of operation ) H. Marine transportation I. Other forms of transportation J. Manufacturing K. Retail L. Construction M. Healthcare N. Finance, insurance or real estate O. Band office P. Government Q. Education R. Other ( ) S. Don’t Know/no response
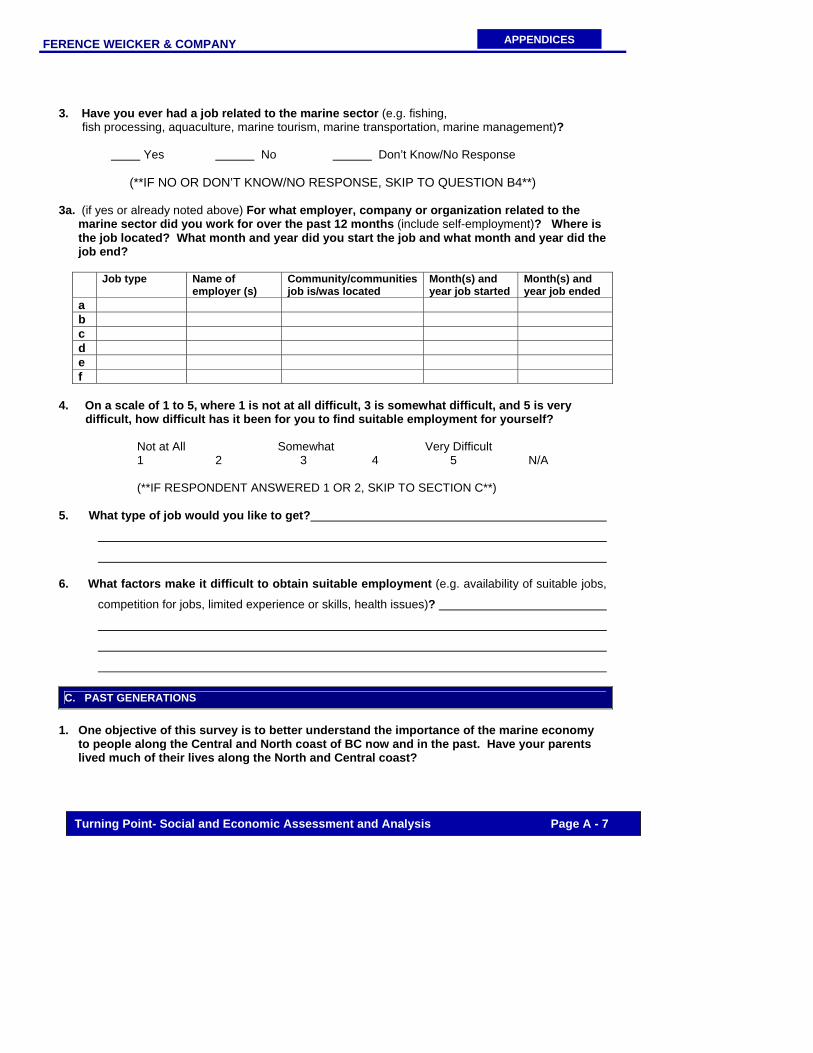
FERENCE WEICKER & COMPANY
APPENDICES
Turning Point- Social and Economic Assessment and Analysis Page A - 7
3. Have you ever had a job related to the marine sector (e.g. fishing, fish processing, aquaculture, marine tourism, marine transportation, marine management)?
Yes No Don’t Know/No Response
(**IF NO OR DON’T KNOW/NO RESPONSE, SKIP TO QUESTION B4**) 3a. (if yes or already noted above) For what employer, company or organization related to the
marine sector did you work for over the past 12 months (include self-employment)? Where is the job located? What month and year did you start the job and what month and year did the job end?
Job type Name of
employer (s) Community/communities job is/was located
Month(s) and year job started
Month(s) and year job ended
a b c d e f
4. On a scale of 1 to 5, where 1 is not at all difficult, 3 is somewhat difficult, and 5 is very difficult, how difficult has it been for you to find suitable employment for yourself?
Not at All Somewhat Very Difficult 1 2 3 4 5 N/A
(**IF RESPONDENT ANSWERED 1 OR 2, SKIP TO SECTION C**)
5. What type of job would you like to get?
6. What factors make it difficult to obtain suitable employment (e.g. availability of suitable jobs,
competition for jobs, limited experience or skills, health issues)?
C. PAST GENERATIONS
1. One objective of this survey is to better understand the importance of the marine economy
to people along the Central and North coast of BC now and in the past. Have your parents lived much of their lives along the North and Central coast?

FERENCE WEICKER & COMPANY
APPENDICES
Turning Point- Social and Economic Assessment and Analysis Page A - 8
Yes No Don’t Know/No Response 1a. (IF YES) What jobs did your parents do to earn income from the marine sector?
1b. Would you say that, in comparison to your parents, you are (or will be) much less reliant,
somewhat less reliant, about the same, somewhat more reliant or much more reliant on the marine economy as a source of income?
A. Much less reliant on the marine economy than your parents B. Somewhat less reliant C. About the same D. Somewhat more reliant E. Much more reliant on the marine economy F. Don’t Know/no response
2. Did your grandparents live much of their lives along the North and Central Coast?
Yes No Don’t Know/No Response
2a. (IF YES) What jobs did your grandparents do to earn income from the marine sector?
2b. Would you say that, in comparison to your grandparents, you are (or will be) much less
reliant, somewhat less reliant, about the same, somewhat more reliant or much more reliant on the marine economy as a source of income?
A. Much less reliant on the marine economy than your grandparents B. Somewhat less reliant C. About the same D. Somewhat more reliant E. Much more reliant on the marine economy F. Don’t know or no response
3. In a typical month, what percentage of your meals include seafood (e.g. salmon, halibut, shellfish, seaweed, sea cucumber)?
_______________ % of meals in a month
4. What percentage of the seafood you eat in a month is non-commercially harvested? _______________ % that is non-commercially harvested
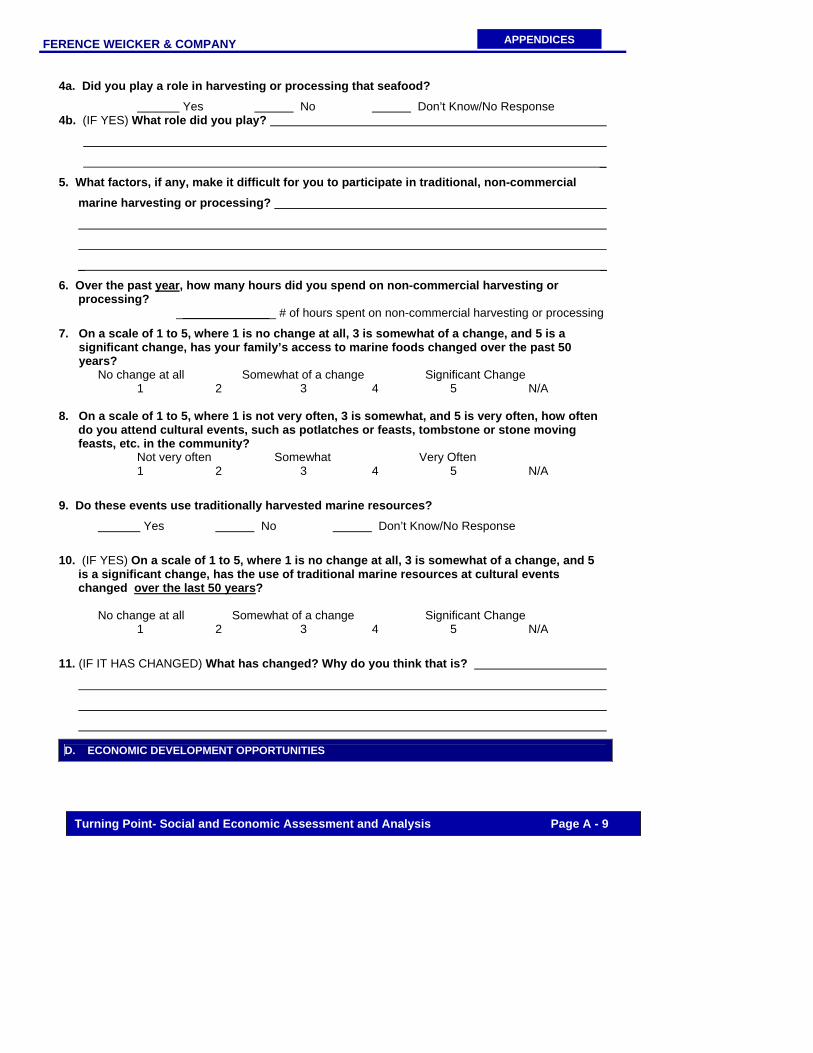
FERENCE WEICKER & COMPANY
APPENDICES
Turning Point- Social and Economic Assessment and Analysis Page A - 9
4a. Did you play a role in harvesting or processing that seafood? Yes No Don’t Know/No Response
4b. (IF YES) What role did you play?
_
5. What factors, if any, make it difficult for you to participate in traditional, non-commercial marine harvesting or processing?
_ _ 6. Over the past year, how many hours did you spend on non-commercial harvesting or
processing? _______________ # of hours spent on non-commercial harvesting or processing
7. On a scale of 1 to 5, where 1 is no change at all, 3 is somewhat of a change, and 5 is a significant change, has your family’s access to marine foods changed over the past 50 years?
No change at all Somewhat of a change Significant Change 1 2 3 4 5 N/A
8. On a scale of 1 to 5, where 1 is not very often, 3 is somewhat, and 5 is very often, how often
do you attend cultural events, such as potlatches or feasts, tombstone or stone moving feasts, etc. in the community?
Not very often Somewhat Very Often 1 2 3 4 5 N/A
9. Do these events use traditionally harvested marine resources? Yes No Don’t Know/No Response
10. (IF YES) On a scale of 1 to 5, where 1 is no change at all, 3 is somewhat of a change, and 5
is a significant change, has the use of traditional marine resources at cultural events changed over the last 50 years?
No change at all Somewhat of a change Significant Change 1 2 3 4 5 N/A
11. (IF IT HAS CHANGED) What has changed? Why do you think that is?
D. ECONOMIC DEVELOPMENT OPPORTUNITIES

FERENCE WEICKER & COMPANY
APPENDICES
Turning Point- Social and Economic Assessment and Analysis Page A - 10
1. On a scale of 1 to 5, where 1 is no priority at all, 3 is somewhat of a priority, and 5 is a major priority, how much of a priority do you think your community should place on marine-based economic development?
No Priority Somewhat Major Priority 1 2 3 4 5 N/A
2. What are some of the benefits to marine-based development in your community (i.e. what do
you hope that this would do for the community)?
3. What are some of the problems with these types of developments in your community?
_
(**IF NO PRIORITY AT ALL, SKIP TO SECTION E**)
4. What types of marine-related businesses do you think should be established or expanded in
your community? (e.g. commercial fishing, nature-based tourism and related activities,
aquaculture, processing, supporting industries such as fuel docks, restaurants, etc.)
5. What do you think makes it difficult to develop businesses and jobs in your community (e.g.
not many people interested in building businesses or community organizations, limited access to
capital, hard to get products to market, shortage of qualified workers, high costs, difficult to access
primary resources, etc.)?
6. What are the two or three things that the community, industry and/or government could do to improve the local economy and benefit the community?
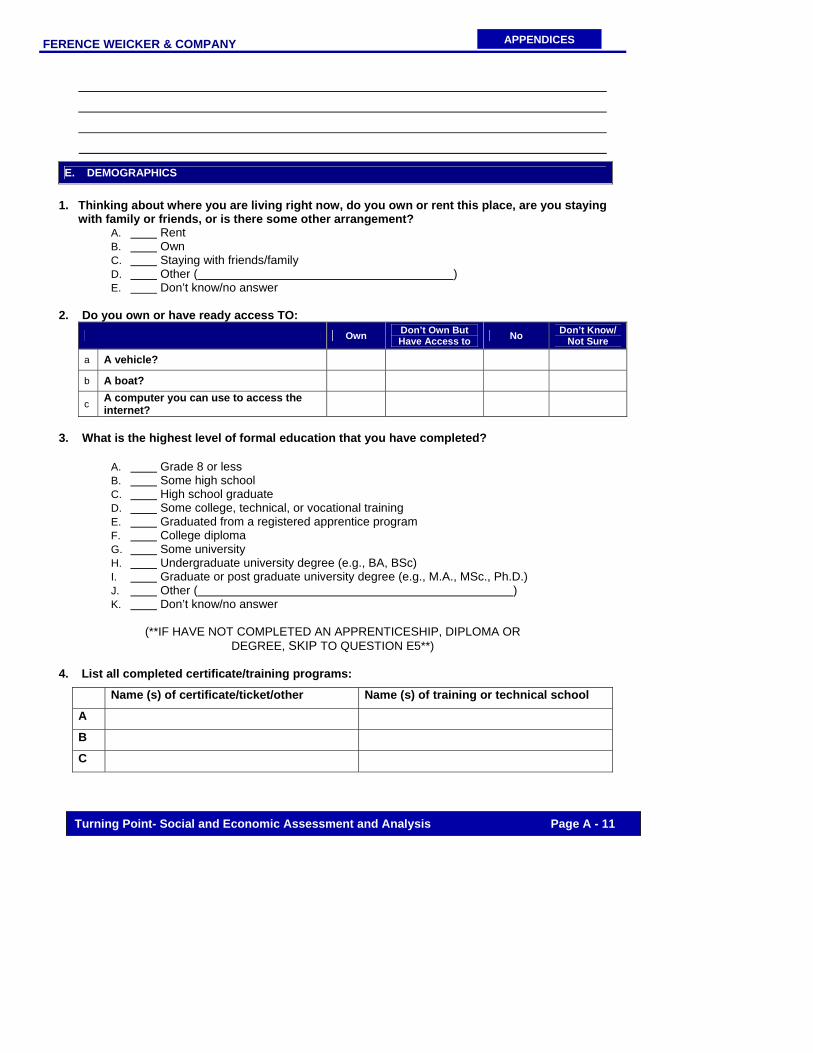
FERENCE WEICKER & COMPANY
APPENDICES
Turning Point- Social and Economic Assessment and Analysis Page A - 11
E. DEMOGRAPHICS
1. Thinking about where you are living right now, do you own or rent this place, are you staying
with family or friends, or is there some other arrangement? A. Rent B. Own C. Staying with friends/family D. Other ( ) E. Don’t know/no answer
2. Do you own or have ready access TO:
Own Don’t Own But Have Access to No Don’t Know/
Not Sure
a A vehicle?
b A boat?
c A computer you can use to access the internet?
3. What is the highest level of formal education that you have completed?
A. Grade 8 or less B. Some high school C. High school graduate D. Some college, technical, or vocational training E. Graduated from a registered apprentice program F. College diploma G. Some university H. Undergraduate university degree (e.g., BA, BSc) I. Graduate or post graduate university degree (e.g., M.A., MSc., Ph.D.) J. Other ( ) K. Don’t know/no answer
(**IF HAVE NOT COMPLETED AN APPRENTICESHIP, DIPLOMA OR
DEGREE, SKIP TO QUESTION E5**)
4. List all completed certificate/training programs:
Name (s) of certificate/ticket/other Name (s) of training or technical school
A
B
C

FERENCE WEICKER & COMPANY
APPENDICES
Turning Point- Social and Economic Assessment and Analysis Page A - 12
D
E
F
4a. If completed, what degree/diploma did you obtain and from where?
Name (s) of diploma/degree Name(s) of university or college A
B
C
D
E
F
5. In 2007, approximately what was your total income from employment or self-employment
before deductions (read list if necessary – take only one answer)?
A. Less than $5,000 B. $5,000-$9,999 C. $10,000-$19,999 D. $20,000-$29,999 E. $30,000-$39,999 F. $40,000-$49,999 G. $50,000-$59,999 H. $60,000-$69,999 I. $70,000-$79,999 J. $80,000K or above K. Don’t know/no answer
5a. Approximately what percent of this income, if any, was earned on-reserve? % of income earned on reserve 5b. Approximately what percent of this income was earned from the marine sector (e.g. from
fishing, fish processing, aquaculture, marine tourism, marine transportation)? % of income earned from the marine sector 6. Did you also earn income last year from (check all that apply):
A. Employment insurance? B. Social assistance or welfare payments? C. WCB payments? D. Other government payments?
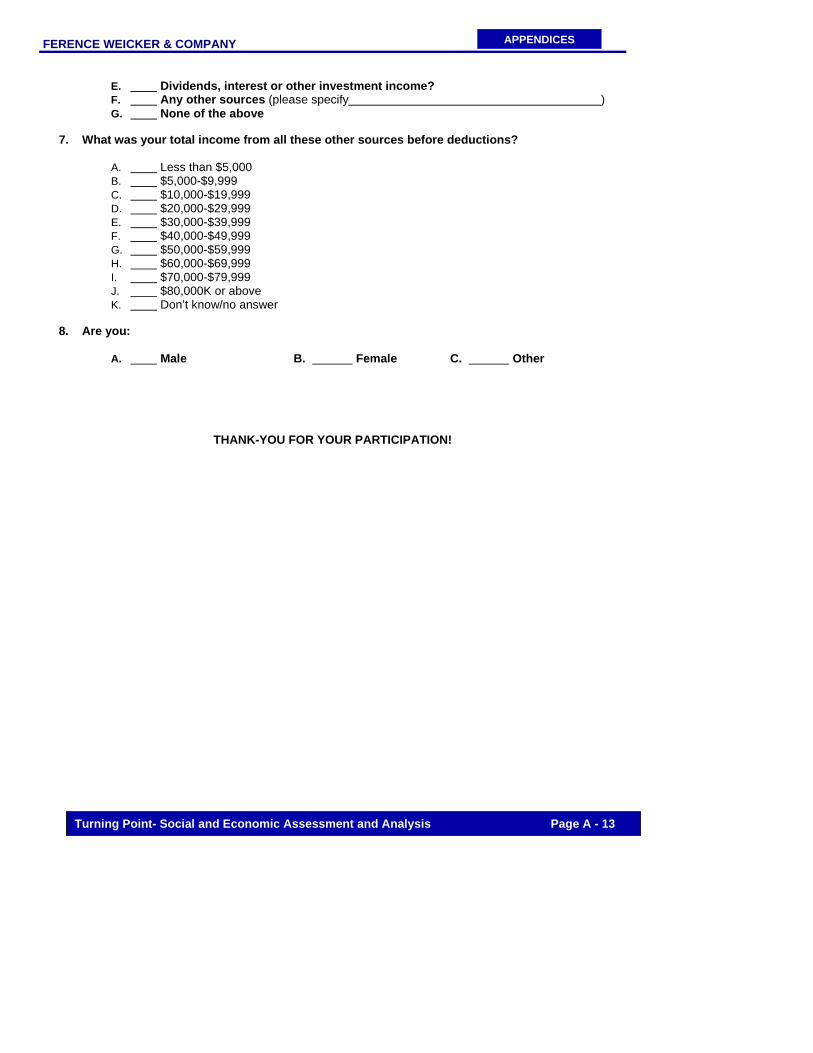
FERENCE WEICKER & COMPANY
APPENDICES
Turning Point- Social and Economic Assessment and Analysis Page A - 13
E. Dividends, interest or other investment income? F. Any other sources (please specify ) G. None of the above
7. What was your total income from all these other sources before deductions?
A. Less than $5,000 B. $5,000-$9,999 C. $10,000-$19,999 D. $20,000-$29,999 E. $30,000-$39,999 F. $40,000-$49,999 G. $50,000-$59,999 H. $60,000-$69,999 I. $70,000-$79,999 J. $80,000K or above K. Don’t know/no answer
8. Are you:
A. Male B. Female C. Other
THANK-YOU FOR YOUR PARTICIPATION!
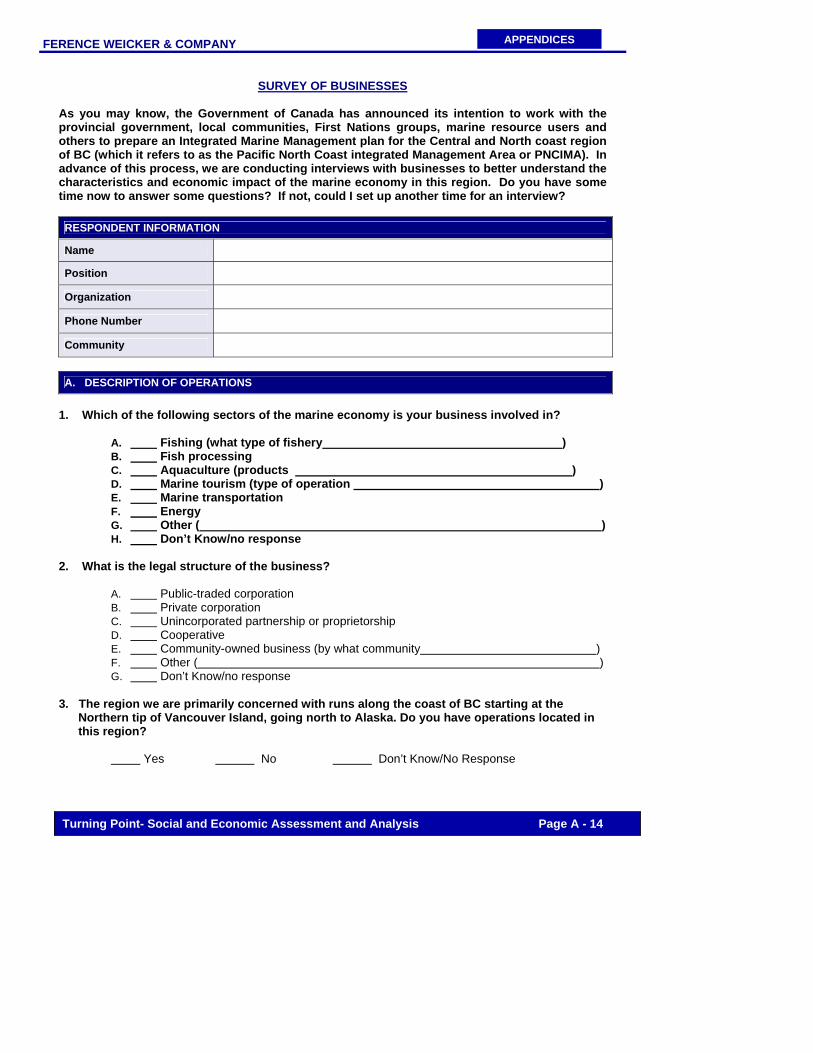
FERENCE WEICKER & COMPANY
Turning Point- Social and Economic Assessment and Analysis Page A - 14
APPENDICES
SURVEY OF BUSINESSES
As you may know, the Government of Canada has announced its intention to work with the provincial government, local communities, First Nations groups, marine resource users and others to prepare an Integrated Marine Management plan for the Central and North coast region of BC (which it refers to as the Pacific North Coast integrated Management Area or PNCIMA). In advance of this process, we are conducting interviews with businesses to better understand the characteristics and economic impact of the marine economy in this region. Do you have some time now to answer some questions? If not, could I set up another time for an interview? RESPONDENT INFORMATION
Name
Position
Organization
Phone Number
Community
A. DESCRIPTION OF OPERATIONS
1. Which of the following sectors of the marine economy is your business involved in?
A. Fishing (what type of fishery ) B. Fish processing C. Aquaculture (products ) D. Marine tourism (type of operation ) E. Marine transportation F. Energy G. Other ( ) H. Don’t Know/no response
2. What is the legal structure of the business?
A. Public-traded corporation B. Private corporation C. Unincorporated partnership or proprietorship D. Cooperative E. Community-owned business (by what community ) F. Other ( ) G. Don’t Know/no response
3. The region we are primarily concerned with runs along the coast of BC starting at the
Northern tip of Vancouver Island, going north to Alaska. Do you have operations located in this region?
Yes No Don’t Know/No Response

FERENCE WEICKER & COMPANY
Turning Point- Social and Economic Assessment and Analysis Page A - 15
APPENDICES
3a. What operations does your business have in this region?
4. Approximately how many people do you typically employ in this region? Number of employees 4a. How many would that be on a full-time equivalent basis? Number of FTE employees 4b. What types of positions account for the majority of this employment?
4c. How many employees does your company have in total in all regions? Number of employees in all regions 5. Does your organization directly harvest resources (e.g. fish or shellfish) from the ocean in this
region? Yes No Don’t Know/No Response
5a. What resources do you harvest (be specific – e.g. what fish or shellfish species)?
Approximately what volumes (note units of measurement)?
Resources Volumes
a
b
c
d
e
6. Do you purchase resources harvested from the oceans in this region?
Yes No Don’t Know/No Response

FERENCE WEICKER & COMPANY
Turning Point- Social and Economic Assessment and Analysis Page A - 16
APPENDICES
6a. What resources do you purchase (be specific – e.g. fish species)? Approximately what volumes of these resources do you purchase?
Resources Volumes
a
b
c
d
e
6b. Approximately how much does your business spend annually purchasing these resources? $ Purchase of products and services
**IF NO RESOURCES ARE HARVESTED OR PURCHASED, SKIP TO QUESTION E8**
7. Do you further process these resources (that you harvest or purchase from others)?
Yes No Don’t Know/No Response 7a. Where does this processing occur?
8. (apart from marine resources) Do you purchase other goods and services from suppliers based
in the region? Yes No Don’t Know/No Response
8a. What are the major types of goods and services that you purchase?
8b. Approximately how much does your business spend annually purchasing goods and
services from suppliers based in the region? $ Purchase of goods and services
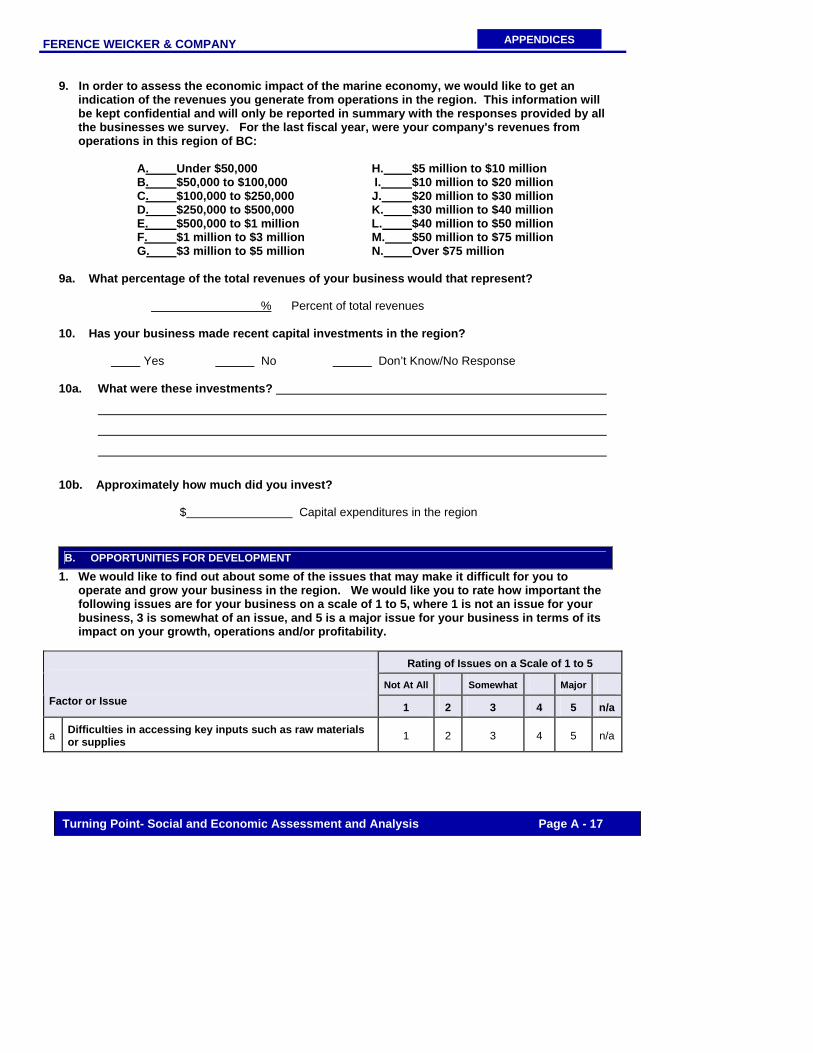
FERENCE WEICKER & COMPANY
Turning Point- Social and Economic Assessment and Analysis Page A - 17
APPENDICES
9. In order to assess the economic impact of the marine economy, we would like to get an indication of the revenues you generate from operations in the region. This information will be kept confidential and will only be reported in summary with the responses provided by all the businesses we survey. For the last fiscal year, were your company's revenues from operations in this region of BC:
A. Under $50,000 H. $5 million to $10 million B. $50,000 to $100,000 I. $10 million to $20 million C. $100,000 to $250,000 J. $20 million to $30 million D. $250,000 to $500,000 K. $30 million to $40 million E. $500,000 to $1 million L. $40 million to $50 million F. $1 million to $3 million M. $50 million to $75 million G. $3 million to $5 million N. Over $75 million
9a. What percentage of the total revenues of your business would that represent?
% Percent of total revenues
10. Has your business made recent capital investments in the region?
Yes No Don’t Know/No Response 10a. What were these investments?
10b. Approximately how much did you invest? $ Capital expenditures in the region B. OPPORTUNITIES FOR DEVELOPMENT
1. We would like to find out about some of the issues that may make it difficult for you to operate and grow your business in the region. We would like you to rate how important the following issues are for your business on a scale of 1 to 5, where 1 is not an issue for your business, 3 is somewhat of an issue, and 5 is a major issue for your business in terms of its impact on your growth, operations and/or profitability.
Rating of Issues on a Scale of 1 to 5
Not At All Somewhat Major
Factor or Issue 1 2 3 4 5 n/a
a Difficulties in accessing key inputs such as raw materials or supplies 1 2 3 4 5 n/a
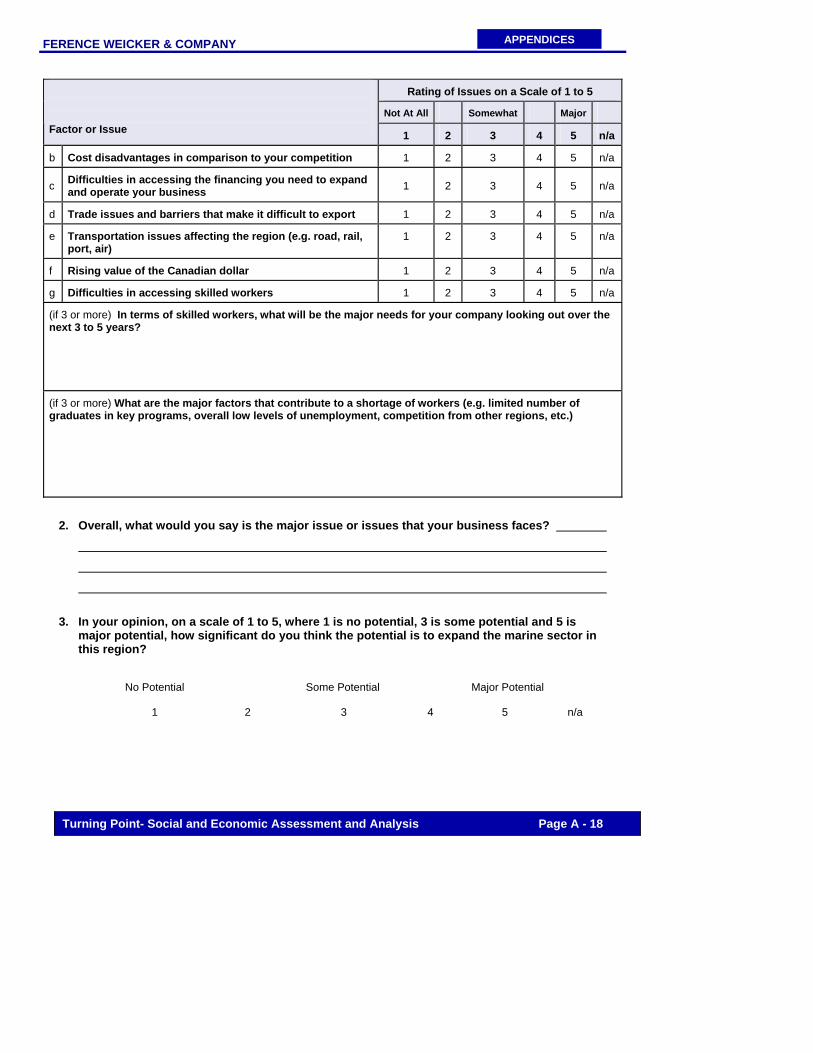
FERENCE WEICKER & COMPANY
Turning Point- Social and Economic Assessment and Analysis Page A - 18
APPENDICES
Rating of Issues on a Scale of 1 to 5
Not At All Somewhat Major
Factor or Issue 1 2 3 4 5 n/a
b Cost disadvantages in comparison to your competition 1 2 3 4 5 n/a
c Difficulties in accessing the financing you need to expand and operate your business 1 2 3 4 5 n/a
d Trade issues and barriers that make it difficult to export 1 2 3 4 5 n/a
e Transportation issues affecting the region (e.g. road, rail, port, air)
1 2 3 4 5 n/a
f Rising value of the Canadian dollar 1 2 3 4 5 n/a
g Difficulties in accessing skilled workers 1 2 3 4 5 n/a
(if 3 or more) In terms of skilled workers, what will be the major needs for your company looking out over the next 3 to 5 years?
(if 3 or more) What are the major factors that contribute to a shortage of workers (e.g. limited number of graduates in key programs, overall low levels of unemployment, competition from other regions, etc.)
2. Overall, what would you say is the major issue or issues that your business faces?
3. In your opinion, on a scale of 1 to 5, where 1 is no potential, 3 is some potential and 5 is
major potential, how significant do you think the potential is to expand the marine sector in this region?
No Potential Some Potential Major Potential 1 2 3 4 5 n/a

FERENCE WEICKER & COMPANY
Turning Point- Social and Economic Assessment and Analysis Page A - 19
APPENDICES
3a. Why is that?
**IF 2 OR LESS, SKIP TO QUESTION 2**
3b. For what types of products or services do you see the greatest opportunities for growth?
For example, are there under-utilized resources that could be developed?
4. Given the opportunities and issues that you have identified, what, if any, actions do you
think could be undertaken by the community, industry, government and others to promote further development of the marine sector? For example, what are the three actions that would have the greatest positive impact on the sector?
C. PARTICIPATION OF FIRST NATIONS Lastly, we have a few questions regarding the participation of Aboriginal people in the marine sector. 1. Roughly how many of your employees in this region are Aboriginal? Number of Aboriginal employees 1a. Has your business signed any protocol or IBA (Impact Benefit Agreements) agreements with
any of the nations?
Yes No Don’t Know/No Response 1b. (IF YES) What agreements have you signed?

FERENCE WEICKER & COMPANY
Turning Point- Social and Economic Assessment and Analysis Page A - 20
APPENDICES
2. Approximately how much does your business spend annually purchasing resources, products or services from Aboriginal suppliers?
$ Purchase of products and services from Aboriginal suppliers 2a. What are the major goods and services that you purchase (be specific)?
3. What opportunities do you see to increase the participation of First Nations people and
organizations in the marine sector?
4. In your opinion, what factors constrain the participation of First Nations people in the marine
economy?
5. Lastly, what, if any, actions do you think could be undertaken to increase the participation of First Nations people as employees or suppliers. For example, what are the two or three actions that would have the greatest positive impact on their participation?
THANK-YOU FOR YOUR PARTICIPATION!
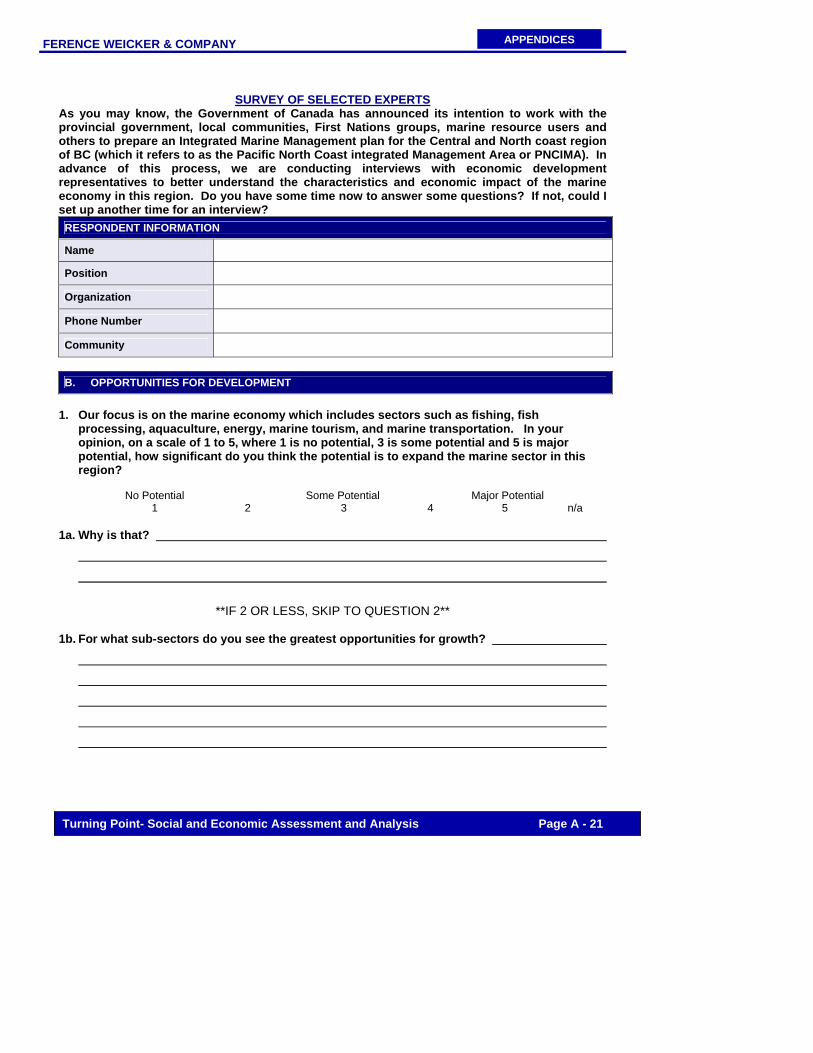
FERENCE WEICKER & COMPANY
Turning Point- Social and Economic Assessment and Analysis Page A - 21
APPENDICES
SURVEY OF SELECTED EXPERTS
As you may know, the Government of Canada has announced its intention to work with the provincial government, local communities, First Nations groups, marine resource users and others to prepare an Integrated Marine Management plan for the Central and North coast region of BC (which it refers to as the Pacific North Coast integrated Management Area or PNCIMA). In advance of this process, we are conducting interviews with economic development representatives to better understand the characteristics and economic impact of the marine economy in this region. Do you have some time now to answer some questions? If not, could I set up another time for an interview? RESPONDENT INFORMATION
Name
Position
Organization
Phone Number
Community
B. OPPORTUNITIES FOR DEVELOPMENT
1. Our focus is on the marine economy which includes sectors such as fishing, fish
processing, aquaculture, energy, marine tourism, and marine transportation. In your opinion, on a scale of 1 to 5, where 1 is no potential, 3 is some potential and 5 is major potential, how significant do you think the potential is to expand the marine sector in this region?
No Potential Some Potential Major Potential 1 2 3 4 5 n/a 1a. Why is that?
**IF 2 OR LESS, SKIP TO QUESTION 2** 1b. For what sub-sectors do you see the greatest opportunities for growth?
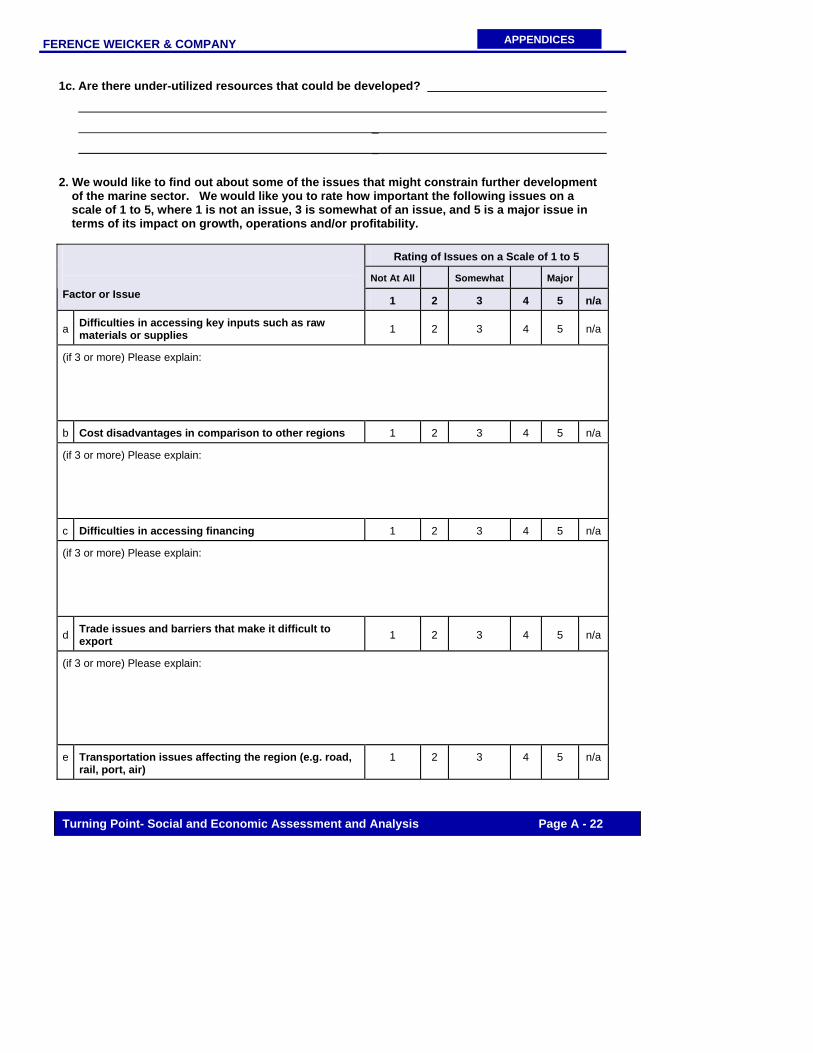
FERENCE WEICKER & COMPANY
Turning Point- Social and Economic Assessment and Analysis Page A - 22
APPENDICES
1c. Are there under-utilized resources that could be developed?
_
_
2. We would like to find out about some of the issues that might constrain further development
of the marine sector. We would like you to rate how important the following issues on a scale of 1 to 5, where 1 is not an issue, 3 is somewhat of an issue, and 5 is a major issue in terms of its impact on growth, operations and/or profitability.
Rating of Issues on a Scale of 1 to 5
Not At All Somewhat Major
Factor or Issue 1 2 3 4 5 n/a
a Difficulties in accessing key inputs such as raw materials or supplies 1 2 3 4 5 n/a
(if 3 or more) Please explain:
b Cost disadvantages in comparison to other regions 1 2 3 4 5 n/a
(if 3 or more) Please explain:
c Difficulties in accessing financing 1 2 3 4 5 n/a
(if 3 or more) Please explain:
d Trade issues and barriers that make it difficult to export 1 2 3 4 5 n/a
(if 3 or more) Please explain:
e Transportation issues affecting the region (e.g. road, rail, port, air)
1 2 3 4 5 n/a

FERENCE WEICKER & COMPANY
Turning Point- Social and Economic Assessment and Analysis Page A - 23
APPENDICES
Rating of Issues on a Scale of 1 to 5
Not At All Somewhat Major
Factor or Issue 1 2 3 4 5 n/a
(if 3 or more) Please explain:
f Government regulations 1 2 3 4 5 n/a
(if 3 or more) Please explain:
g Difficulties in accessing skilled workers 1 2 3 4 5 n/a
(if 3 or more) In terms of skilled workers, what will be the major needs for the sector looking out over the next 3 to 5 years?
(if 3 or more) What are the major factors that contribute to a shortage of workers (e.g. limited number of graduates in key programs, overall low levels of unemployment, competition from other regions, etc.)
3. Overall, what would you say is the major issue or issues that the sector faces?
4. Given the opportunities and issues that you have identified, what, if any, actions do you
think could be undertaken by the community, industry, government and others to promote

FERENCE WEICKER & COMPANY
Turning Point- Social and Economic Assessment and Analysis Page A - 24
APPENDICES
further development of the marine sector? For example, what are the three actions that
would have the greatest positive impact on the sector?
B. PARTICIPATION OF FIRST NATIONS
Lastly, we have a few questions regarding the participation of Aboriginal people in the marine sector. 1. What opportunities do you see to increase the participation of First Nations people and
organizations in the marine sector?
2. In your opinion, what factors constrain the participation of First Nations people in the marine
economy?
3. What role, if any, do you think IBA’s (Impact Benefit Agreements) could play in furthering the
participation of First Nations in the marine economy?
4. Whose responsibility do you think it is to accommodate First Nations?
5. Lastly, what, if any, actions do you think could be undertaken to increase the participation of
First Nations people as employees, producers or suppliers. For example, what are the two

FERENCE WEICKER & COMPANY
Turning Point- Social and Economic Assessment and Analysis Page A - 25
APPENDICES
or three actions that would have the greatest positive impact on their participation?
THANK-YOU FOR YOUR PARTICIPATION!!!
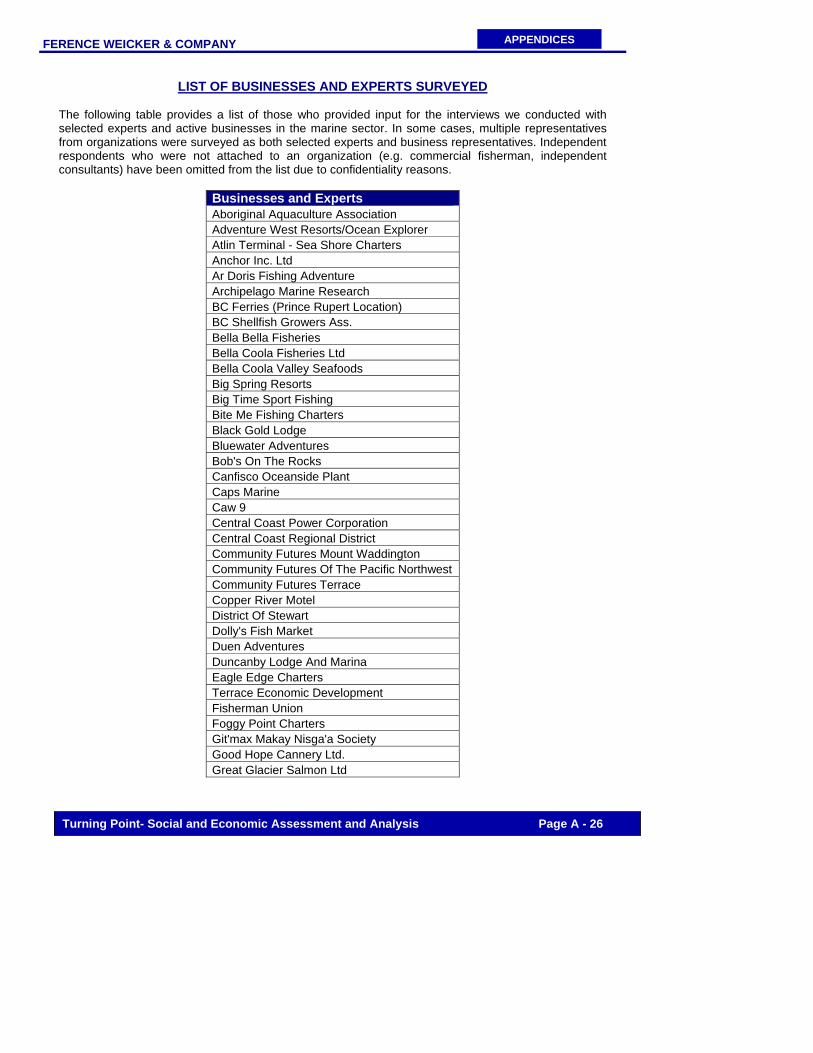
FERENCE WEICKER & COMPANY
Turning Point- Social and Economic Assessment and Analysis Page A - 26
APPENDICES
LIST OF BUSINESSES AND EXPERTS SURVEYED
The following table provides a list of those who provided input for the interviews we conducted with selected experts and active businesses in the marine sector. In some cases, multiple representatives from organizations were surveyed as both selected experts and business representatives. Independent respondents who were not attached to an organization (e.g. commercial fisherman, independent consultants) have been omitted from the list due to confidentiality reasons.
Businesses and Experts Aboriginal Aquaculture Association Adventure West Resorts/Ocean Explorer Atlin Terminal - Sea Shore Charters Anchor Inc. Ltd Ar Doris Fishing Adventure Archipelago Marine Research BC Ferries (Prince Rupert Location) BC Shellfish Growers Ass. Bella Bella Fisheries Bella Coola Fisheries Ltd Bella Coola Valley Seafoods Big Spring Resorts Big Time Sport Fishing Bite Me Fishing Charters Black Gold Lodge Bluewater Adventures Bob's On The Rocks Canfisco Oceanside Plant Caps Marine Caw 9 Central Coast Power Corporation Central Coast Regional District Community Futures Mount Waddington Community Futures Of The Pacific Northwest Community Futures Terrace Copper River Motel District Of Stewart Dolly's Fish Market Duen Adventures Duncanby Lodge And Marina Eagle Edge Charters Terrace Economic Development Fisherman Union Foggy Point Charters Git'max Makay Nisga'a Society Good Hope Cannery Ltd. Great Glacier Salmon Ltd
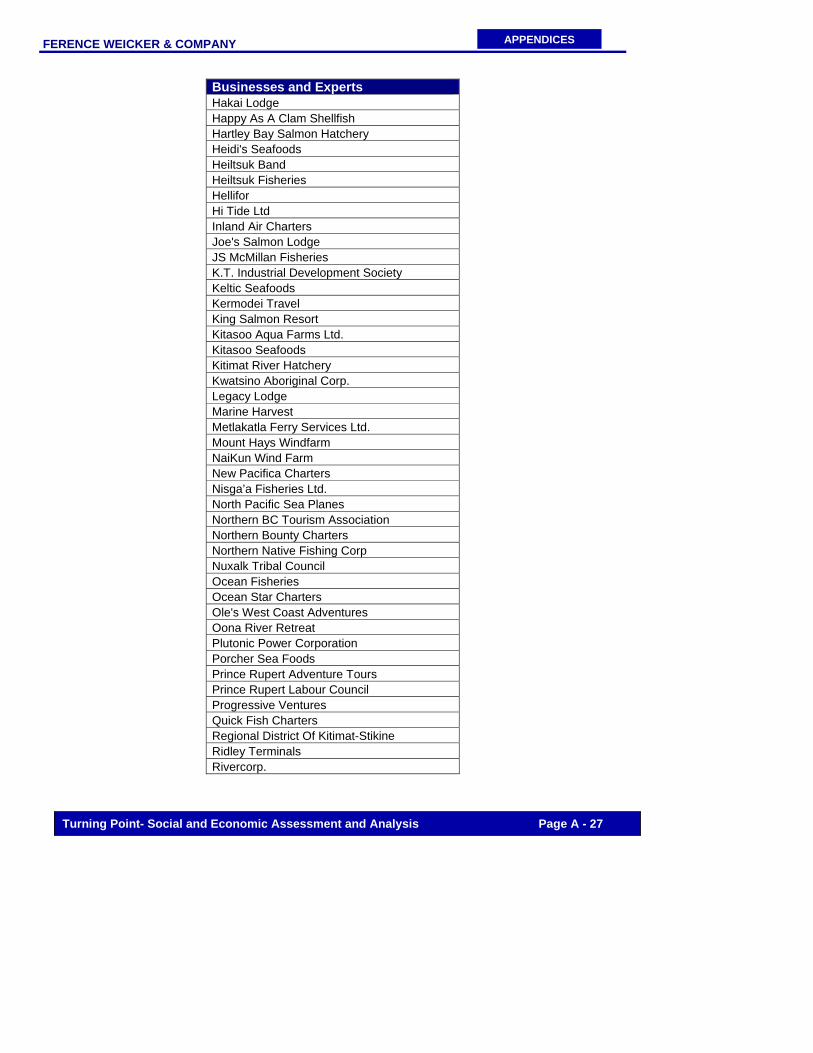
FERENCE WEICKER & COMPANY
Turning Point- Social and Economic Assessment and Analysis Page A - 27
APPENDICES
Businesses and Experts Hakai Lodge Happy As A Clam Shellfish Hartley Bay Salmon Hatchery Heidi's Seafoods Heiltsuk Band Heiltsuk Fisheries Hellifor Hi Tide Ltd Inland Air Charters Joe's Salmon Lodge JS McMillan Fisheries K.T. Industrial Development Society Keltic Seafoods Kermodei Travel King Salmon Resort Kitasoo Aqua Farms Ltd. Kitasoo Seafoods Kitimat River Hatchery Kwatsino Aboriginal Corp. Legacy Lodge Marine Harvest Metlakatla Ferry Services Ltd. Mount Hays Windfarm NaiKun Wind Farm New Pacifica Charters Nisga’a Fisheries Ltd. North Pacific Sea Planes Northern BC Tourism Association Northern Bounty Charters Northern Native Fishing Corp Nuxalk Tribal Council Ocean Fisheries Ocean Star Charters Ole's West Coast Adventures Oona River Retreat Plutonic Power Corporation Porcher Sea Foods Prince Rupert Adventure Tours Prince Rupert Labour Council Progressive Ventures Quick Fish Charters Regional District Of Kitimat-Stikine Ridley Terminals Rivercorp.
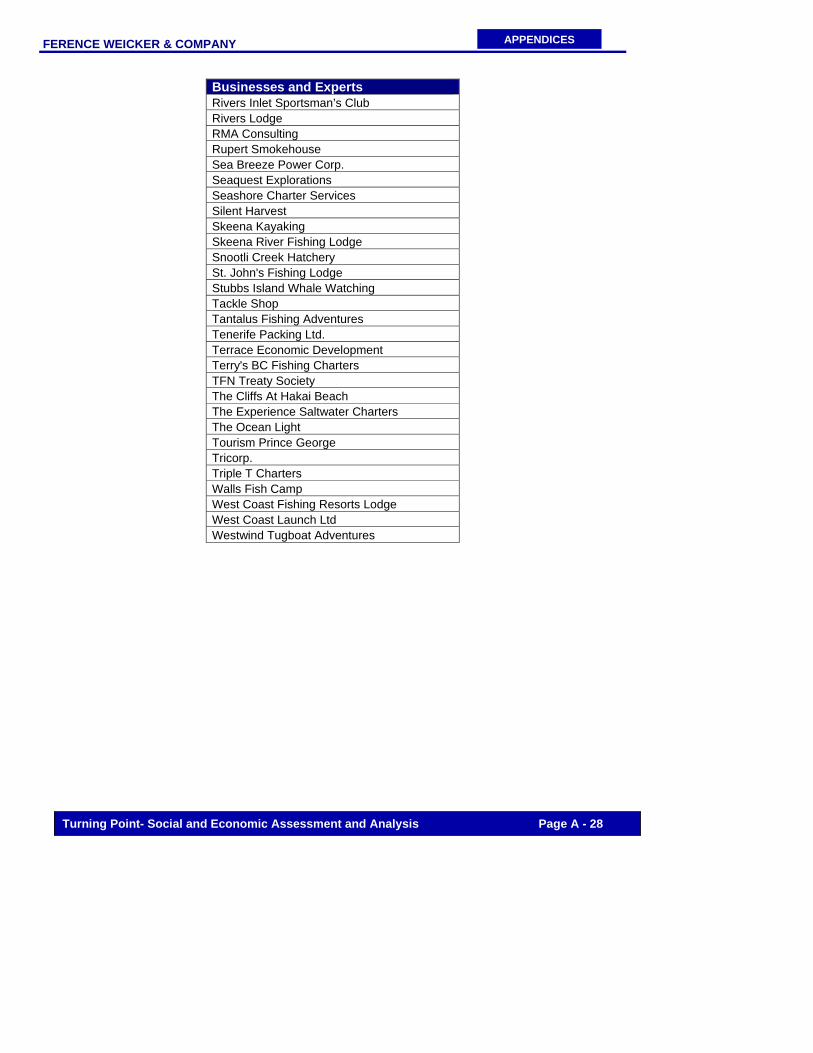
FERENCE WEICKER & COMPANY
Turning Point- Social and Economic Assessment and Analysis Page A - 28
APPENDICES
Businesses and Experts Rivers Inlet Sportsman’s Club Rivers Lodge RMA Consulting Rupert Smokehouse Sea Breeze Power Corp. Seaquest Explorations Seashore Charter Services Silent Harvest Skeena Kayaking Skeena River Fishing Lodge Snootli Creek Hatchery St. John's Fishing Lodge Stubbs Island Whale Watching Tackle Shop Tantalus Fishing Adventures Tenerife Packing Ltd. Terrace Economic Development Terry's BC Fishing Charters TFN Treaty Society The Cliffs At Hakai Beach The Experience Saltwater Charters The Ocean Light Tourism Prince George Tricorp. Triple T Charters Walls Fish Camp West Coast Fishing Resorts Lodge West Coast Launch Ltd Westwind Tugboat Adventures
FERENCE WEICKER & COMPANY
Turning Point- Social and Economic Assessment and Analysis Page A - 29
APPENDICES
Methodology
The following outlines the methodology used, including our assumptions and the limitations of the data. Commercial Fishing Sector In estimating the size of the commercial fishing sector we:
• Developed a potential population list of people working in the commercial fishing sector. The list was primarily developed through referrals as many of the commercial fishing sector employees in the region operate independently.
• Conducted surveys with businesses and fisherman in the sector to collect data on revenue and employment figures, the use of resources, and opportunities for development. Due to a low response rate, we were unable to use this data to extrapolate the number of people employed in this sector.
• We then utilized the Fisher Registration Card data as another possible indicator of employment in the sector. This data was provided to us and was compiled by community, territory, area and PNCIMA region. The Fisher Registration Card data reflects the number of people who are active in the sector but may not necessarily reflect employment in the sector as card holders are more likely to be active for shorter periods of time.
• Used secondary data from the Department of Fisheries and Oceans log book data to illustrate the size of the commercial catch by territory. The data used was primarily for the period of 2000-2006 although the groundfish catch data goes further back to 1993 and 1996.
• Developed estimates of the fishing sector revenues based on the value of fish and seafood harvested in the regions multiplied by the average landed prices for 2007. Specifically, we used the estimated volume of landed species for 2007 and the average landed value for BC per species to estimate the landed value by species and territory.
Fish Processing Sector In estimating the size of the fish processing sector we:
• Developed a potential population list of active businesses in the sector using 2006 licensing data provided by the Oceans and Marine Fisheries Branch as well as an extensive search through other databases and information available online.
• Conducted surveys with businesses in the sector and obtained data on key indicators such as revenue and employment data.
• Removed any major outliers in the data. We then used the revenue and employment data obtained from the businesses to develop averages. These averages were applied to the remaining sample of businesses in the sector and were then used to project the total size of the sector by revenue and employment.
• We also used our sample to estimate revenues by area.
Marine Tourism Sector In estimating the size of the marine tourism sector we:
• Developed a potential population list of active businesses in the sector. • Conducted surveys with businesses in the sector and obtained data on key indicators such as
revenue and employment data.
FERENCE WEICKER & COMPANY
Turning Point- Social and Economic Assessment and Analysis Page A - 30
APPENDICES
• Used secondary DFO sport lodge data to supplement our sample and ensure that it was representative. This data also provided specific information on the territories where sport fishing and other marine tourism operations may be active and specified that activity by territory.
• We then removed any major outliers in the data and used the data to develop averages of employees and revenue per company. These averages were applied to the remaining sample of marine tourism operations which were then used to project the total size of the sector by revenue and employment. We also used the survey data and secondary sources to estimate sector revenue and employment by territory.
Marine Transportation Sector In estimating the size of the marine transportation sector we:
• Developed a potential population list of active businesses in the sector. Due to the variation in characteristics of businesses in this sector, it was challenging to develop a comprehensive list. Moreover, much of the activity in this sector is outside the region.
• Conducted surveys with marine transportation businesses. Although we contacted the businesses a number of times, response rates were low.
• Used the data to compile averages which were applied to the remaining sample of businesses in the sector and were then used to project a rough estimate of the sector. Due to the low response rate, these numbers were reported in the Other category which compiled figures from the energy sector and other sectors.
Energy Sector In estimating the size of the energy sector we:
• Used a number of sources including BC’s water licences database to develop a potential population list of operations in the sector, including those in the start-up phase.
• Conducted surveys with 5 operations in the energy sector. We identified 7 operations in the energy sector some of which are still in the planning stages. These operations include wind farm developments which typically utilize offshore wind energy as well as other operations which include run-of-river hydro development projects.
• Used the data to compile averages and provide a rough estimate of revenues and employment. These averages were applied to the remaining sample of businesses in the sector and were then used to project the total size of the sector by revenue and employment.
• Due to the limited number of operations that reported revenue and employment date and for confidentiality reasons, these numbers were reported in the Other category which included the marine transportation sector and other sectors.
Limitations of the Data
• The businesses, experts and residents participating in the survey may not necessarily be
representative of the population. Specifically, when projecting revenue and employment data, there is an assumption that the businesses are all approximately the same size, which may not be necessarily true.
• It is often challenging for businesses to allocate their activities by territory and even in some cases by region.

FERENCE WEICKER & COMPANY
Turning Point- Social and Economic Assessment and Analysis Page A - 31
APPENDICES
• In developing the population lists by sector, a major focus was ensuring the lists were representative of the active businesses in the region. However, the lists are not exhaustive.
• The data assumes that 2008 was a typical year for revenue, employment and catch data.
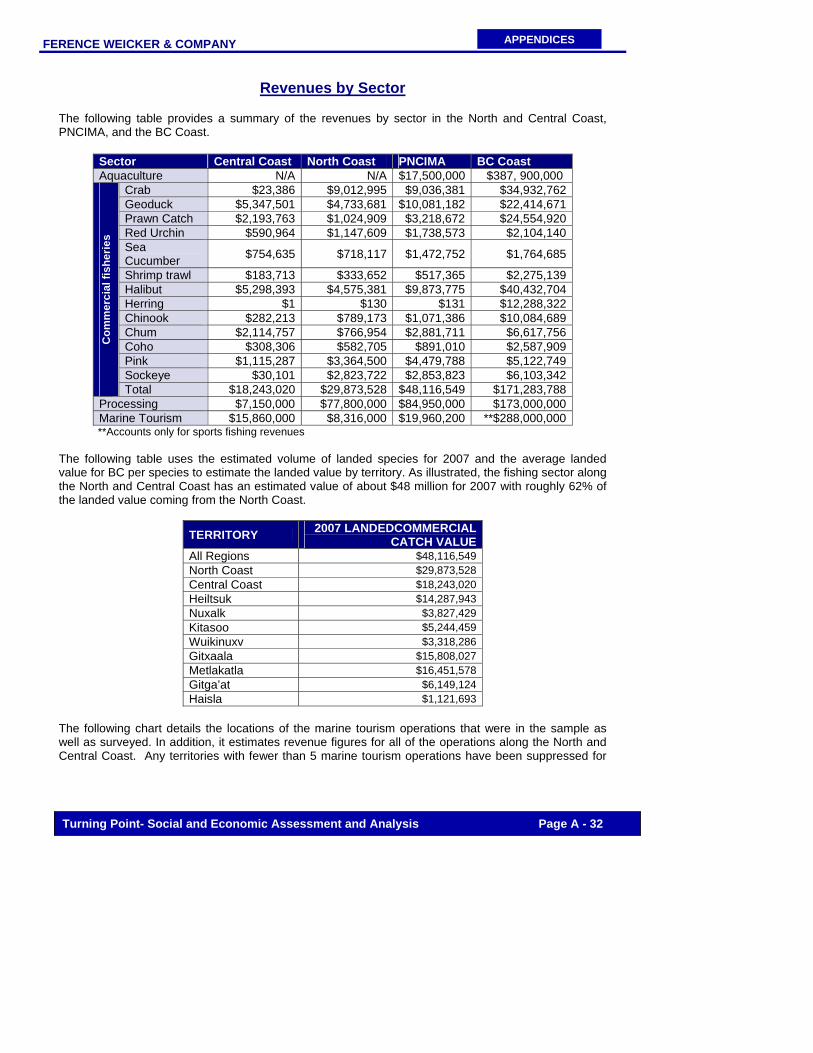
FERENCE WEICKER & COMPANY
Turning Point- Social and Economic Assessment and Analysis Page A - 32
APPENDICES
Revenues by Sector The following table provides a summary of the revenues by sector in the North and Central Coast, PNCIMA, and the BC Coast.
Sector Central Coast North Coast PNCIMA BC Coast Aquaculture N/A N/A $17,500,000 $387, 900,000
Crab $23,386 $9,012,995 $9,036,381 $34,932,762Geoduck $5,347,501 $4,733,681 $10,081,182 $22,414,671Prawn Catch $2,193,763 $1,024,909 $3,218,672 $24,554,920Red Urchin $590,964 $1,147,609 $1,738,573 $2,104,140Sea Cucumber $754,635 $718,117 $1,472,752 $1,764,685
Shrimp trawl $183,713 $333,652 $517,365 $2,275,139Halibut $5,298,393 $4,575,381 $9,873,775 $40,432,704Herring $1 $130 $131 $12,288,322Chinook $282,213 $789,173 $1,071,386 $10,084,689Chum $2,114,757 $766,954 $2,881,711 $6,617,756Coho $308,306 $582,705 $891,010 $2,587,909Pink $1,115,287 $3,364,500 $4,479,788 $5,122,749Sockeye $30,101 $2,823,722 $2,853,823 $6,103,342
Com
mer
cial
fish
erie
s
Total $18,243,020 $29,873,528 $48,116,549 $171,283,788Processing $7,150,000 $77,800,000 $84,950,000 $173,000,000Marine Tourism $15,860,000 $8,316,000 $19,960,200 **$288,000,000 **Accounts only for sports fishing revenues
The following table uses the estimated volume of landed species for 2007 and the average landed value for BC per species to estimate the landed value by territory. As illustrated, the fishing sector along the North and Central Coast has an estimated value of about $48 million for 2007 with roughly 62% of the landed value coming from the North Coast.
TERRITORY 2007 LANDEDCOMMERCIAL CATCH VALUE
All Regions $48,116,549North Coast $29,873,528Central Coast $18,243,020Heiltsuk $14,287,943Nuxalk $3,827,429Kitasoo $5,244,459Wuikinuxv $3,318,286Gitxaala $15,808,027Metlakatla $16,451,578Gitga’at $6,149,124Haisla $1,121,693
The following chart details the locations of the marine tourism operations that were in the sample as well as surveyed. In addition, it estimates revenue figures for all of the operations along the North and Central Coast. Any territories with fewer than 5 marine tourism operations have been suppressed for
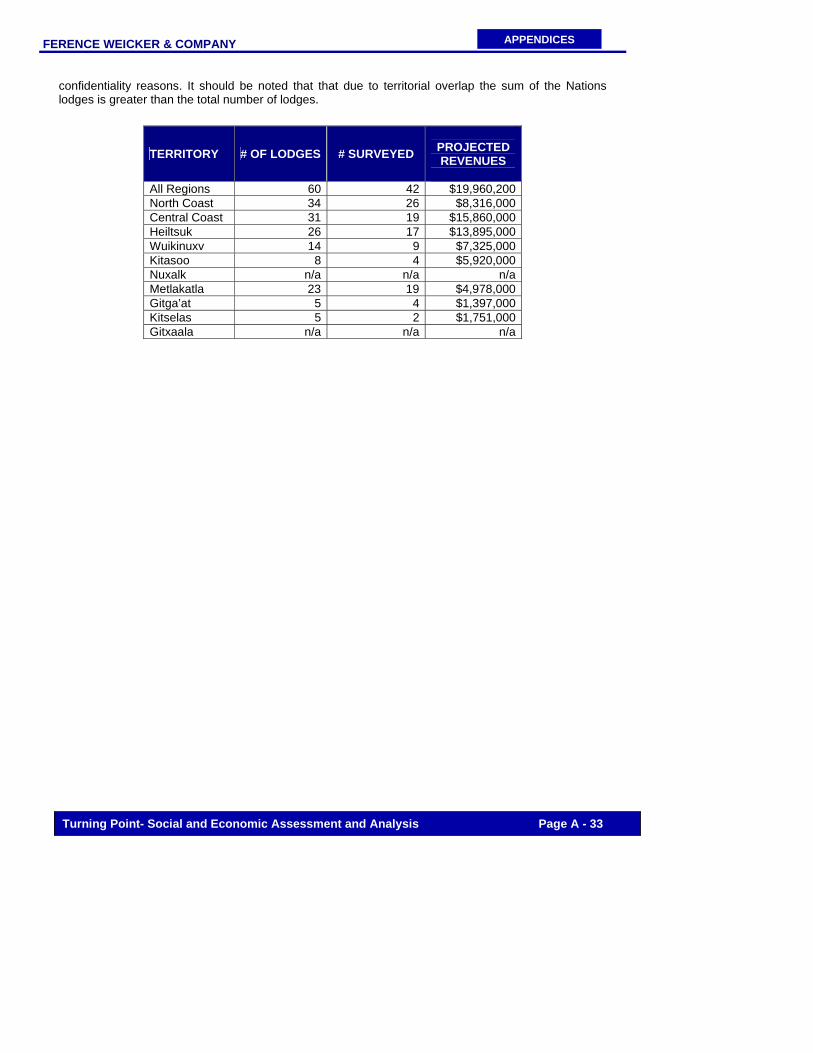
FERENCE WEICKER & COMPANY
Turning Point- Social and Economic Assessment and Analysis Page A - 33
APPENDICES
confidentiality reasons. It should be noted that that due to territorial overlap the sum of the Nations lodges is greater than the total number of lodges.
TERRITORY # OF LODGES # SURVEYED
PROJECTED REVENUES
All Regions 60 42 $19,960,200North Coast 34 26 $8,316,000Central Coast 31 19 $15,860,000Heiltsuk 26 17 $13,895,000Wuikinuxv 14 9 $7,325,000Kitasoo 8 4 $5,920,000Nuxalk n/a n/a n/aMetlakatla 23 19 $4,978,000Gitga’at 5 4 $1,397,000Kitselas 5 2 $1,751,000Gitxaala n/a n/a n/a