Embed Size (px)
Citation preview

Ferroelectric Hydration Shells around Proteins: Electrostatics of the Protein-WaterInterface
David N. LeBard†,‡ and Dmitry V. Matyushov*,†
Center for Biological Physics, Arizona State UniVersity, PO Box 871604, Tempe, Arizona 85287-1604
ReceiVed: January 25, 2010; ReVised Manuscript ReceiVed: May 3, 2010
Numerical simulations of hydrated proteins show that protein hydration shells are polarized into a ferroelectriclayer with large values of the average dipole moment magnitude and the dipole moment variance. Theemergence of the new polarized mesophase dramatically alters the statistics of electrostatic fluctuations at theprotein-water interface. The linear response relation between the average electrostatic potential and its variancebreaks down, with the breadth of the electrostatic fluctuations far exceeding the expectations of the linearresponse theories. The dynamics of these non-Gaussian electrostatic fluctuations are dominated by a slow(=1 ns) component that freezes in at the temperature of the dynamical transition of proteins. The ferroelectricshell propagates 3-5 water diameters into the bulk.
1. Introduction
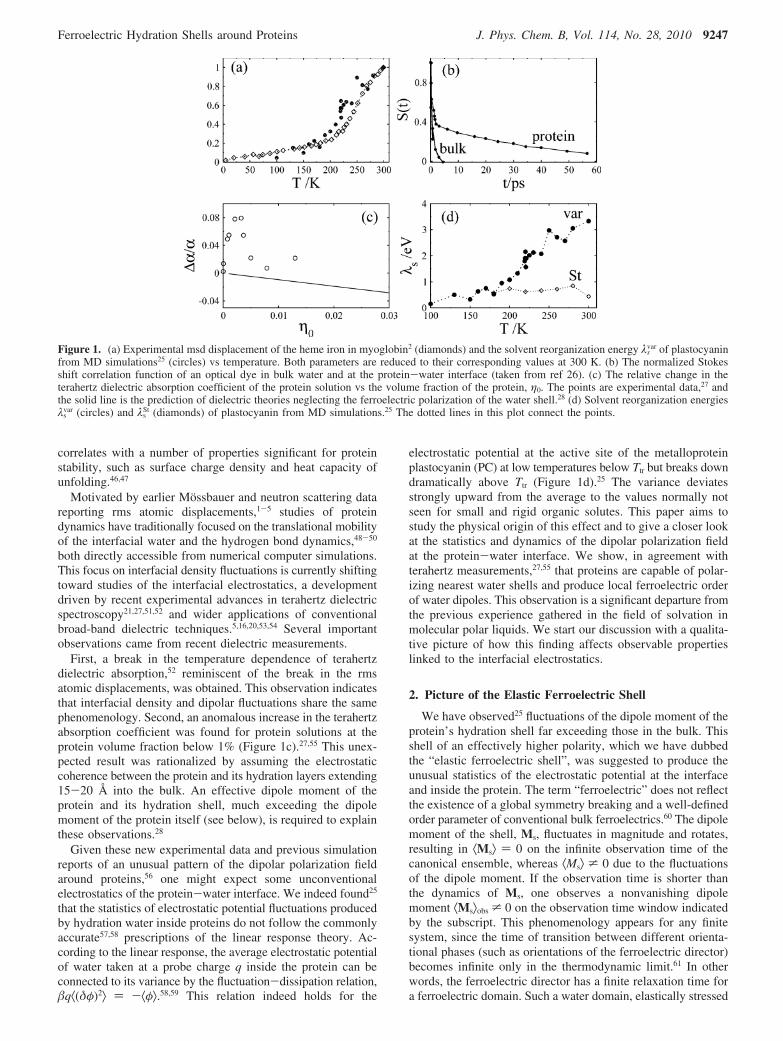
Despite several decades of intense research, the propertiesand principal relaxation modes of the protein-water interfaceremain a subject of intense interest and controversy. Severalkey phenomenological observations have been made, whichgave initial insights into the nuclear modes and relaxation timesinvolved in the interfacial dynamics and energetics. Thecombined results of Mossbauer and neutron scattering measure-ments have shown that rms displacements of the protein atomschange dramatically at the transition temperature Ttr= 200-240K1-6 and to a lesser extent at a lower temperature, T tr′ = 150K.7-9 The upper-temperature transition, labeled (somewhatbroadly4) as the dynamical transition in proteins, marks an onsetof anharmonic protein motions active at high temperatures, incontrast to purely phonon modes below Ttr (Figure 1a). Incontrast, the low-temperature crossover at T tr′ appears whenhydrogen bonds of the interfacial water start to break, allowingwater rotations, also reflected by a change in the temperatureslope of the heat capacity of partially hydrated proteins.10 Thisis followed by the onset of water translations at about =160K,7 accompanied by a striking increase in the thermal expansioncoefficient of the hydration layer.11
Which relaxation process/nuclear mode becomes active athigh temperatures above Ttr is still debated.5,8,12-15 The currentlyprevailing view4,5,16 assigns the transition to the appearance, withincreasing temperature, of a -relaxation process17 of thehydration shell in the observation window fixed by the instru-ment resolution. A nuclear mode producing this -relaxationhas not been clearly identified, but its collective nature, involvingboth the hydration shell and some surface motions of the protein,has been emphasized. Indeed, the transition temperature is thesame for the protein and water components of the protein-waterinterface when their corresponding signals are recorderedseparately.18,19 In addition, the collective relaxation processdisappears when partially hydrated proteins are confined in arigid matrix mostly affecting the hydration shells20 or when the
size of the polypeptide is reduced below some critical value.21
It appears that this collective process does not require thepresence of the protein tertiary and even secondary structure21
and is probably generic to the interface between water and aflexible polymer with a chemically heterogeneous surface.16,22
Even more generally, the observation of the dynamical transitionin nonaqueous solvents (glycerol23 and chloroform24) puts underquestion the necessity of the presence of water. The transitionmight be a general property of the interface between a mobilepolar liquid and a more rigid polymer/colloid particle made ofa less elastic material.
The dynamics of the protein-water and DNA-water inter-faces were also probed by employing optical dyes linked to thebiopolymer’s surface.26,29-32 The recordered property in this caseis the Stokes shift dynamics, that is, the change in the positionof the emission peak caused by the nuclear modes adjusting toa dipole moment created by dye’s photoexcitation.33 It wasobserved that, unlike for dyes dissolved in homogeneous polarsolvents,33 the Stokes shift dynamics of dyes at the water-biopolymer interface shows a slow =20-200 ps component(Figure 1b). It was suggested that this component is either areflection of the same collective interfacial mode recordered byscattering experiments or a result of a slow water exchangebetween solvation shells.30,34 Alternatively, the emergence ofslow relaxation can be caused by waters pushed by proteinconformational motions.31,35,36 Indeed, when the observationwindow is broadened, one can observe increasingly slowerrelaxation components32 reflecting a hierarchy of successivelyslower conformational motions of a biopolymer.
Given the importance of the protein-water interface to anumber of protein functions, including folding and hydrophobiccollapse,37,38 the density profile of water at the protein surfacehas attracted much attention.37,39,40 It was suggested that partialorcompletedewettingofhydrophobicpatchesat theprotein-waterinterface might be critical for folding.41 Attraction interactions,existing also for hydrophobic residues, eliminate dewetting,42-45
and the resulting density profile of interfacial water is anaveraged reflection of the heterogeneous patchwork of hydro-phobic and hydrophilic residues.37,40 As a reflection of a partiallybroken network of hydrogen bonds, the compressibility of theprotein solution is higher than that of bulk water40 and also
* Corresponding author. E-mail: [email protected].† Arizona State University.‡ Current address: Institute for Computational Molecular Science, Temple
University.
J. Phys. Chem. B 2010, 114, 9246–92589246
10.1021/jp1006999 2010 American Chemical SocietyPublished on Web 06/28/2010
correlates with a number of properties significant for proteinstability, such as surface charge density and heat capacity ofunfolding.46,47
Motivated by earlier Mossbauer and neutron scattering datareporting rms atomic displacements,1-5 studies of proteindynamics have traditionally focused on the translational mobilityof the interfacial water and the hydrogen bond dynamics,48-50
both directly accessible from numerical computer simulations.This focus on interfacial density fluctuations is currently shiftingtoward studies of the interfacial electrostatics, a developmentdriven by recent experimental advances in terahertz dielectricspectroscopy21,27,51,52 and wider applications of conventionalbroad-band dielectric techniques.5,16,20,53,54 Several importantobservations came from recent dielectric measurements.
First, a break in the temperature dependence of terahertzdielectric absorption,52 reminiscent of the break in the rmsatomic displacements, was obtained. This observation indicatesthat interfacial density and dipolar fluctuations share the samephenomenology. Second, an anomalous increase in the terahertzabsorption coefficient was found for protein solutions at theprotein volume fraction below 1% (Figure 1c).27,55 This unex-pected result was rationalized by assuming the electrostaticcoherence between the protein and its hydration layers extending15-20 Å into the bulk. An effective dipole moment of theprotein and its hydration shell, much exceeding the dipolemoment of the protein itself (see below), is required to explainthese observations.28
Given these new experimental data and previous simulationreports of an unusual pattern of the dipolar polarization fieldaround proteins,56 one might expect some unconventionalelectrostatics of the protein-water interface. We indeed found25
that the statistics of electrostatic potential fluctuations producedby hydration water inside proteins do not follow the commonlyaccurate57,58 prescriptions of the linear response theory. Ac-cording to the linear response, the average electrostatic potentialof water taken at a probe charge q inside the protein can beconnected to its variance by the fluctuation-dissipation relation,q⟨(δφ)2⟩ ) -⟨φ⟩.58,59 This relation indeed holds for the
electrostatic potential at the active site of the metalloproteinplastocyanin (PC) at low temperatures below Ttr but breaks downdramatically above Ttr (Figure 1d).25 The variance deviatesstrongly upward from the average to the values normally notseen for small and rigid organic solutes. This paper aims tostudy the physical origin of this effect and to give a closer lookat the statistics and dynamics of the dipolar polarization fieldat the protein-water interface. We show, in agreement withterahertz measurements,27,55 that proteins are capable of polar-izing nearest water shells and produce local ferroelectric orderof water dipoles. This observation is a significant departure fromthe previous experience gathered in the field of solvation inmolecular polar liquids. We start our discussion with a qualita-tive picture of how this finding affects observable propertieslinked to the interfacial electrostatics.
2. Picture of the Elastic Ferroelectric Shell
We have observed25 fluctuations of the dipole moment of theprotein’s hydration shell far exceeding those in the bulk. Thisshell of an effectively higher polarity, which we have dubbedthe “elastic ferroelectric shell”, was suggested to produce theunusual statistics of the electrostatic potential at the interfaceand inside the protein. The term “ferroelectric” does not reflectthe existence of a global symmetry breaking and a well-definedorder parameter of conventional bulk ferroelectrics.60 The dipolemoment of the shell, Ms, fluctuates in magnitude and rotates,resulting in ⟨Ms⟩ ) 0 on the infinite observation time of thecanonical ensemble, whereas ⟨Ms⟩ * 0 due to the fluctuationsof the dipole moment. If the observation time is shorter thanthe dynamics of Ms, one observes a nonvanishing dipolemoment ⟨Ms⟩obs * 0 on the observation time window indicatedby the subscript. This phenomenology appears for any finitesystem, since the time of transition between different orienta-tional phases (such as orientations of the ferroelectric director)becomes infinite only in the thermodynamic limit.61 In otherwords, the ferroelectric director has a finite relaxation time fora ferroelectric domain. Such a water domain, elastically stressed
Figure 1. (a) Experimental msd displacement of the heme iron in myoglobin2 (diamonds) and the solvent reorganization energy λsvar of plastocyanin
from MD simulations25 (circles) vs temperature. Both parameters are reduced to their corresponding values at 300 K. (b) The normalized Stokesshift correlation function of an optical dye in bulk water and at the protein-water interface (taken from ref 26). (c) The relative change in theterahertz dielectric absorption coefficient of the protein solution vs the volume fraction of the protein, η0. The points are experimental data,27 andthe solid line is the prediction of dielectric theories neglecting the ferroelectric polarization of the water shell.28 (d) Solvent reorganization energiesλs
var (circles) and λsSt (diamonds) of plastocyanin from MD simulations.25 The dotted lines in this plot connect the points.
Ferroelectric Hydration Shells around Proteins J. Phys. Chem. B, Vol. 114, No. 28, 2010 9247
by motions of the protein, is what the elastic ferroelectric shellis describing.
We prefer the usage of the term “ferroelectric” in contrast to“polarized” (even though both terms are used interchangeablyin the paper) because the polarization of the water cluster doesnot seem to be directly linked to the electric field of the proteinand is, in fact, fairly insensitive to the overall protein chargeand the surface charge density. Although a complete set ofconditions responsible for the appearance of the ferroelectricshell is currently hard to track down, these are most likely relatedto the size, elasticity, and chemical heterogeneity of the proteinsurface. Whereas all of them can potentially contribute to theobservables, one property of the protein electrostatics, thevariance of the protein dipole moment, emerges from ouranalysis as a key parameter controlling the dipole momentfluctuations of the hydration shell.
Before going into a more detailed discussion, we brieflysummarize the electrostatic parameters recordered from thesimulation trajectories. Since we want to connect our observa-tions to experimentally measurable properties of redox proteins,we consider an electrochemical half reaction in which theoxidation state of the copper metal in the active site of theplastocyanin redox protein is changed by depositing an electronfrom the oxidized (Ox) to reduced (Red) form. The depositionof an electron changes partial charges of a number of atoms inthe protein’s active site. These atoms can therefore be assigneddifference charges ∆qj such that Σj∆qj ) -1.66 These differencecharges of the active site (denoted by “0”) interact with thepartial charges of the medium (denoted as “m”) producing theCoulomb interaction energy V0m. The medium is composed ofthe protein matrix (“p”) and the hydration water (solvent, “s”)such that the overall Coulomb energy is: V0m ) V0p + V0s.
The average interaction energy, Ei ) ⟨V0m⟩i, can be calculatedin each redox state enumerated as i ) 1 and 2. Since ∆qj arethe difference charges between two redox states, Ei are Coulombcomponents of the average optical (vertical) transition energiesbetween the two redox states.58,59,62-64 The difference of E2 andE1, known in spectroscopy as the Stokes shift, defines the Stokesshift reorganization energy λSt ) (E2 - E1)/2.63 On the otherhand, one can calculate the variance of the interaction potentialV0m in each state. This variance, according to the linear responseapproximation, is independent of the state used for the ensembleaverage, ⟨(δV0m)2⟩1 ) ⟨(δV0m)2⟩2. Moreover, the static limit ofthe fluctuation-dissipation theorem65 gives an alternative defini-tion of the reorganization energy, labeled as λvar, from thetemperature-reduced variance58,59
where ) 1/(kBT) is the inverse temperature.The two definitions are, of course, identical within the linear
response approximation and λvar ) λSt. What was instead foundfrom MD simulations of plastocyanin,25,66 reaction center proteinof bacterial photosynthesis,67 and some other protein complexes58,68
is that at T > Ttr (Figure 1d)
Before presenting our quantitative findings below, we explainhere this observation in terms of a qualitative picture of theferroelectric elastic shell.
In the present paper, we report the statistics of electrostaticfluctuations due to both water and protein motions. Correspond-
ingly, the Stokes shift reorganization energy is a sum of thewater (s) and protein (p) components,
The variance reorganization energy contains, apart from thedirect contributions from the water (λs
var) and protein (λpvar)
fluctuations, the cross term λspvar from cross-correlations between
V0s and V0p
Further, the Stokes shift reorganization energy of eachcomponent, protein and water, is related in the linear responseapproximation to the corresponding direct variance and thecross-correlation term
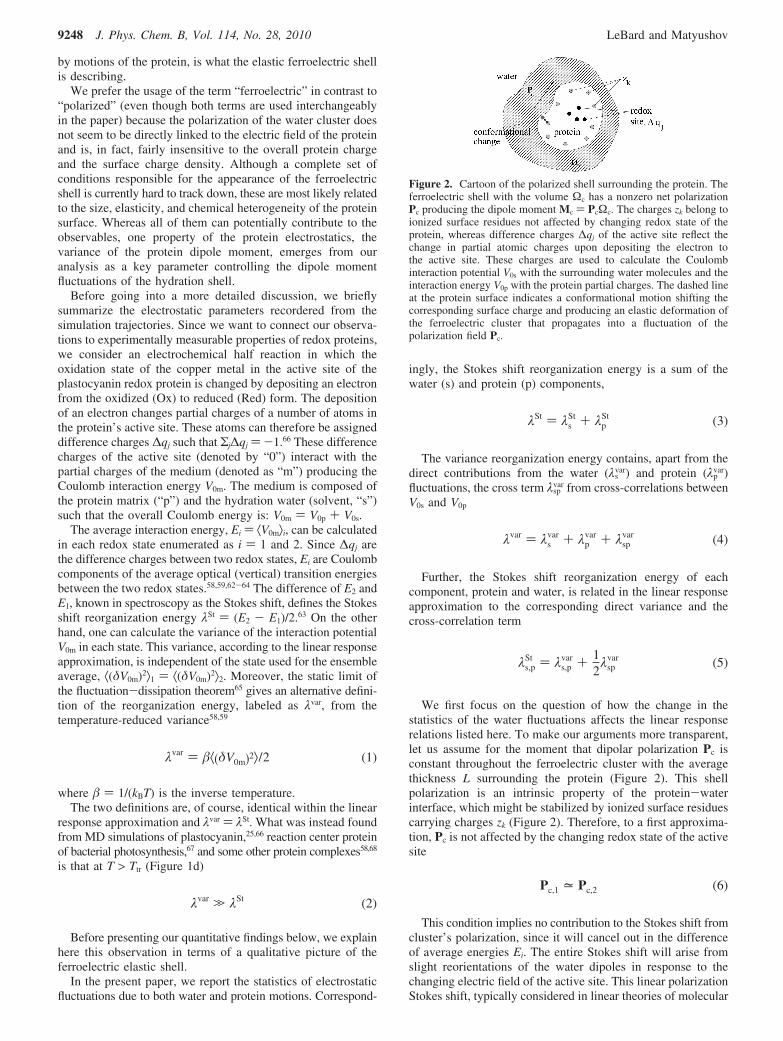
We first focus on the question of how the change in thestatistics of the water fluctuations affects the linear responserelations listed here. To make our arguments more transparent,let us assume for the moment that dipolar polarization Pc isconstant throughout the ferroelectric cluster with the averagethickness L surrounding the protein (Figure 2). This shellpolarization is an intrinsic property of the protein-waterinterface, which might be stabilized by ionized surface residuescarrying charges zk (Figure 2). Therefore, to a first approxima-tion, Pc is not affected by the changing redox state of the activesite
This condition implies no contribution to the Stokes shift fromcluster’s polarization, since it will cancel out in the differenceof average energies Ei. The entire Stokes shift will arise fromslight reorientations of the water dipoles in response to thechanging electric field of the active site. This linear polarizationStokes shift, typically considered in linear theories of molecular
λvar ) ⟨(δV0m)2⟩/2 (1)
λvar . λSt (2)
Figure 2. Cartoon of the polarized shell surrounding the protein. Theferroelectric shell with the volume Ωc has a nonzero net polarizationPc producing the dipole moment Mc ) PcΩc. The charges zk belong toionized surface residues not affected by changing redox state of theprotein, whereas difference charges ∆qj of the active site reflect thechange in partial atomic charges upon depositing the electron tothe active site. These charges are used to calculate the Coulombinteraction potential V0s with the surrounding water molecules and theinteraction energy V0p with the protein partial charges. The dashed lineat the protein surface indicates a conformational motion shifting thecorresponding surface charge and producing an elastic deformation ofthe ferroelectric cluster that propagates into a fluctuation of thepolarization field Pc.
λSt ) λsSt + λp
St (3)
λvar ) λsvar + λp
var + λspvar (4)
λs,pSt ) λs,p
var + 12
λspvar (5)
Pc,1 = Pc,2 (6)
9248 J. Phys. Chem. B, Vol. 114, No. 28, 2010 LeBard and Matyushov
redox reactions,69 can be adequately calculated by standardmodels of polar solvent response, as we indeed found forhydrated plastocyanin.64,66
As we show below, the polarization field Pc is not static andchanges both in magnitude and orientation. The relaxation ofPc might come from both the internal dynamics of water70,71
and low-frequency vibrations of the protein elastically stressingthe hydration shell.72 The amplitudes of the protein vibrationsincrease sharply above Ttr, and so do the elastic motions of thehydration shell. The electrostatic effect of these collectivemotions, involving hundreds of water molecules (⟨NI⟩ = 510waters in the first solvation layer of plastocyanin), develops intoa gigantic66 reorganization energy λs
var. Since, as we have statedabove, these collective motions do not affect λs
St, the linearresponse equality between λs
var and λsSt breaks down, and one
arrives at inequality 2.One can estimate the result of fluctuations of the ferroelectric
shell on the second-cumulant reorganization energy by averagingover the orientations of Pc in eq 1. This yields
The second term in this equation includes the total dipolemoment Mc ) ⟨PcΩc⟩ of the polarized cluster with the volumeΩc and the electric field E0(r) of the difference charges ∆qj
averaged over the cluster’s volume
The parameter P2 is the second-order (nematic) orderparameter of the polarization vector Pc defined relative to somechosen direction (the protein dipole moment, frozen on the timescale of water fluctuations, is used in the analysis below).
The notion of the constant polarization Pc is an oversimpli-fication used here to outline the physical picture of the shellpolarization. The emergence of a net water polarization is reallyan interfacial phenomenon, with the polarization Pc(r) decayingapproximately as 1/r2 with the distance r from the protein surfaceto the bulk. Most of the water polarization occurs in the firstsolvation layer, and this effect propagates into the adjacent watershells. The subensemble of ⟨NI⟩ = 510 water molecules in thefirst solvation layer has a strong tendency to in-plane alignmentof the dipoles73 and to form 1D dipolar chains.74,75 Whether thesoft nuclear mode producing the net ferroelectric dipole can betraced back to a uniform polarization76 or to an alignment of1D dipolar chains,74 there is a tendency to a ferroelectrictransition of pseudospins describing water orientations in thesurface layer.74-77 Typically, expected signatures of suchtransitions (even though not in the thermodynamic limit) includecritical slowing down of the principal nuclear mode and peaksin second cumulants of thermodynamic parameters.78 We have,indeed, found25 a critical slowing of the collective componentof the Stokes shift dynamics and a sharp spike in λs
var, bothsingularities seen at Ttr. The nanometer size of proteins mightbe an important factor in creating the net dipolar interfacialpolarization. On one hand, the size of a typical protein issufficiently large to put several hundreds of waters in its firsthydration layer. On the other hand, the finite size of this clustereliminates long-wavelength phonons destroying the long-rangeorder in infinite 2D systems.
3. Results of Numerical Simulations
We have previously proposed25 two plausible scenarios toexplain inequality 2. The first mechanism was based on theobservation that the density of the first hydration layer dropswith increasing temperature, and the variance of the number offirst-layer waters increases. Both trends point to the formationof a high-temperature hydrophobic interface characterized byenhanced fluctuations of the water density in the first solvationlayer.79,80 The second mechanism anticipated fluctuations of thepolarized (ferroelectric) shell induced by low-frequency proteinmotions with their amplitudes enhanced above Ttr. Since long-ranged dipolar forces produce little effect on the interfacialdensity profile,81 these two mechanisms can be viewed asessentially uncoupled. As described above, we currently favorthe second scenario and present new simulation results and dataanalysis in support of this mechanism.
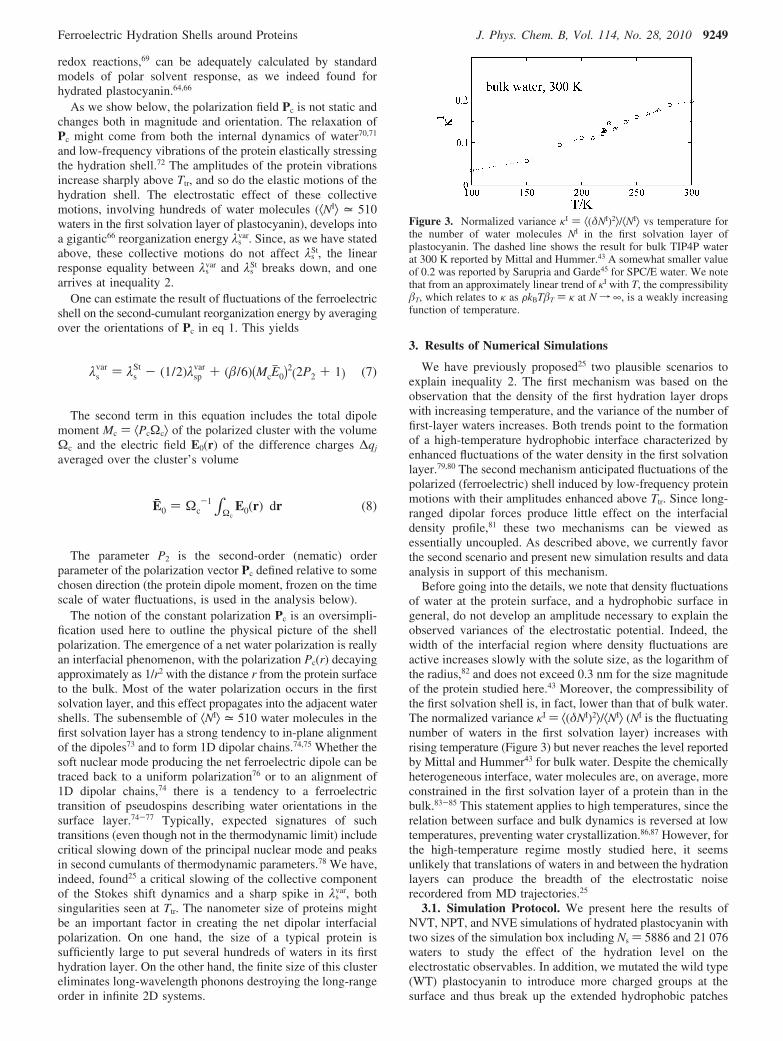
Before going into the details, we note that density fluctuationsof water at the protein surface, and a hydrophobic surface ingeneral, do not develop an amplitude necessary to explain theobserved variances of the electrostatic potential. Indeed, thewidth of the interfacial region where density fluctuations areactive increases slowly with the solute size, as the logarithm ofthe radius,82 and does not exceed 0.3 nm for the size magnitudeof the protein studied here.43 Moreover, the compressibility ofthe first solvation shell is, in fact, lower than that of bulk water.The normalized variance κI ) ⟨(δNI)2⟩/⟨NI⟩ (NI is the fluctuatingnumber of waters in the first solvation layer) increases withrising temperature (Figure 3) but never reaches the level reportedby Mittal and Hummer43 for bulk water. Despite the chemicallyheterogeneous interface, water molecules are, on average, moreconstrained in the first solvation layer of a protein than in thebulk.83-85 This statement applies to high temperatures, since therelation between surface and bulk dynamics is reversed at lowtemperatures, preventing water crystallization.86,87 However, forthe high-temperature regime mostly studied here, it seemsunlikely that translations of waters in and between the hydrationlayers can produce the breadth of the electrostatic noiserecordered from MD trajectories.25
3.1. Simulation Protocol. We present here the results ofNVT, NPT, and NVE simulations of hydrated plastocyanin withtwo sizes of the simulation box including Ns ) 5886 and 21 076waters to study the effect of the hydration level on theelectrostatic observables. In addition, we mutated the wild type(WT) plastocyanin to introduce more charged groups at thesurface and thus break up the extended hydrophobic patches
λsvar ) λs
St - (1/2)λspvar + (/6)(McEj0)2(2P2 + 1) (7)
E0 ) Ωc-1 ∫Ωc
E0(r) dr (8)
Figure 3. Normalized variance κI ) ⟨(δNI)2⟩/⟨NI⟩ vs temperature forthe number of water molecules NI in the first solvation layer ofplastocyanin. The dashed line shows the result for bulk TIP4P waterat 300 K reported by Mittal and Hummer.43 A somewhat smaller valueof 0.2 was reported by Sarupria and Garde45 for SPC/E water. We notethat from an approximately linear trend of κI with T, the compressibilityT, which relates to κ as FkBTT ) κ at N f ∞, is a weakly increasingfunction of temperature.
Ferroelectric Hydration Shells around Proteins J. Phys. Chem. B, Vol. 114, No. 28, 2010 9249

(Figure 4 and Supporting Information). These mutations andthe variations of the hydrostatic pressure were carried out todistinguish between the hydrophobicity and ferroelectric shellscenarios. The mutated (Mut) protein was hydrated with Ns )6217 waters. Details of the simulation protocol are given in theSupporting Information. Briefly, AMBER 9.0 package was usedto produce MD trajectories with the standard (tinfoil) imple-mentation of the Ewald sums used to treat the Coulombinteractions. To speed up the analysis, the electrostatic interac-tions were cut off at the half of the box size with the use of thetransformation to the standard tinfoil condition according to ref88 (Tables S1 and S2 in the Supporting Information). Thiscorrection is included in the interaction potential V0s of theactive-site charges ∆qj with the hydration waters.
In addition to plastocyanin simulations, we have carried outsimulations of two other globular proteins, lysozyme andubiquitin (see Supporting Information for the details of thesimulation protocol). These two proteins do not carry redoxactivity and, therefore, are not used for the reorganization energycalculations. The statistics and dynamics of the dipolar fluctua-tions of their hydration shells are distinctly different from theredox-active plastocyanin, and these data are used in analyzingthe origins of the non-Gaussian electrostatics found for the latter.
3.2. Dependence on Hydrostatic Pressure. Hydrostaticpressure in NPT simulations was varied with the goal of testingthe effects of weak dewetting89 and related enhanced densityfluctuations79 on the protein electrostatics. Both positive andnegative hydrostatic pressures were studied, with the latter range(existing in metastable liquids90,91) explored given that surfacedewetting is enhanced at these conditions.89 The results of NPTsimulations for the wild-type and mutant proteins are shown inFigure 5. The overall outcome is little sensitivity, withinsimulation uncertainties, of λs (either from the Stokes shift orthe variance) to hydrostatic pressure; λs
var increases with increas-ing pressure, in accord with the increasing number of first-shellwaters (insets in Figure 5).
Both the water and protein components of λvar increase intheir magnitudes for the mutated compared to the wild-typeprotein (Figure 5). These trends are consistent with a largerdensity of surface partial charges for the mutated protein,producing a denser hydration layer with stronger fluctuationsof the electrostatic potential. The overall reorganization energyλvar is, however, not that different between the two forms ofthe protein because of a negative compensating contribution
from the cross term, λspvar, which makes the total reorganization
energy of the mutant at some pressure points even lower thanthe protein and water components separately.
3.3. Formation of the Ferroelectric Water Shell. The firstand second cumulants of the dipole moment of waters in thefirst shell and in the entire simulation box are listed in Table 1(the pressure dependence of the dipole moments can be foundin Tables S3 and S4 in the Supporting Information). The firsthydration shell is defined as the water layer of thickness 2.87Å surrounding the van der Waals surface of the protein. Thevalues obtained for plastocyanin do not depend much on thestatistical ensemble (NVE, NVT, and NPT) used in simulationsand are also little sensitive to the electrostatic surface mutations,except for the variance of the first-shell dipole, which is smallerin the stiffer hydration shell of the mutant. A significantdifference, however, exists between the first-shell dipolarfluctuations of plastocyanin and two non-redox proteins, lysozymeand ubiquitin, studied here. The variances of first-shell dipolesof these proteins are much smaller than that for plastocyanin,implying that the local polarities of their hydration shells aremuch lower.
Both cumulants ⟨Ms⟩ and ⟨(δMs)2⟩1/2 scale as the square rootof the number of waters Ns
1/2 and, therefore, cannot be comparedbetween different systems. The ratio κG ) (⟨(δMs)2⟩1/2)/⟨Ms⟩ is, however, close to κG ) (3π/8)1/2 ) 1.09, expected for theisotropic Maxwell distribution for all proteins studied here. Forthe first-shell dipole Ms
I of plastocyanin, this ratio, κG = 1.14,reflects a highly anisotropic distribution of the first-shell dipolealong the direction of the protein dipole, ep ) Mp/Mp. Thecorresponding distribution function P(M|) of the parallel projectionM| ) Ms
I · ep strongly deviates from the isotropic Maxwell distribu-tion, but at the same time is symmetric in respect to the inversionM| f -M| (Figure 6). This nematic symmetry suggests that theanisotropy of Ms
I is most likely caused by the elongated shape ofthe protein and not by the pinning field of the protein dipole, whichwould create an inversion anisotropy. The distribution function,P(M|), is not significantly affected by the increase of the overallnumber of waters in the simulation cell from Ns ) 5886 to 21 076(cf. solid to dashed lines in Figure 6), although it is somewhatsharper in the NVE than in the NPT protocol. Nevertheless, these
Figure 4. Comparison of the surface charge distribution in the mutantand the wild-type plastocyanin. The PC backbone is given in gray(cartoon representation), and the copper atom is the purple sphere. AllASP/GLU residues are shown in red, and all LYS residues are shownin blue.
Figure 5. Pressure results for the wild-type (upper panel) and mutated(lower panel) plastocyanin. The points show the total reorganizationenergy λvar (circles) arising from fluctuations of both the protein andwater subsystems, as well as individual protein (diamonds) and water(up triangles) components. The protein-water cross-term (eq 4) is notshown. Solid squares are λSt, and the insets show the pressuredependence of the average number of first-shell waters.
9250 J. Phys. Chem. B, Vol. 114, No. 28, 2010 LeBard and Matyushov

results testify to a relatively low sensitivity of the first-shell structureto the size of the simulation box.
We found that both the dynamics and statistics of the first-shell dipole moment of lysozyme and ubiquitin are distinctlydifferent from plastocyanin. There are noticeable, although muchsmaller, deviations of the distribution functions P(M|) and P(M⊥)(M⊥ is the component of Ms
I perpendicular to ep) from theMaxwell distribution (Figure 7). A part of it comes frominsufficient statistical sampling. The dynamics of Ms
I(t) for theseproteins are extremely slow, with characteristic relaxation timesof 1600 ps (Lys) and 400 ps (Ub) (Figure 8). As a result, Ms
I(t)of lysozyme and ubiquitin do not average to zero on the 25 nslength of the MD trajectory (Figure 7). The nonvanishing first-shell dipole ⟨Ms
I(t)⟩ of ubiquitin is smaller than of lysozyme,and the distribution P(M|) is closer to Maxwellian. However,the first hydration shells of both these proteins will appearferroelectric on a subnanosecond observation window.
We have also found that the dipolar dynamics of bothlysozyme and ubiquitin are significantly faster in NVT/NPTsimulations as compared with the NVE protocol (see FigureS1 in the Supporting Information), which is most likely anartifact of the thermostats employed in the NVT/NPT simula-tions. As a result of faster relaxation, the distribution function,P(M|), of Lys obtained in the NVT ensemble shifts closer tothe Maxwell distribution (Figure 7). Note that we found no suchensemble effects on the dynamics of plastocyanin, which aremuch faster than those of lysozyme and ubiquitin (see below).
3.4. Propagation of the Shell Polarization into the Bulk.Since the statistics of electrostatic fluctuations are stronglyinfluenced by thermal motions of the ferroelectric cluster, the
question of its spatial extent into the bulk water becomes criticalfor the development of the physical picture of the water-proteininterface. To study this aspect of the dipolar polarization, wehave calculated the dipolar properties originating from the waterslocated within the layer of thickness r from the protein surface.A water molecule is assigned to the layer if the separation ofits oxygen atom from the nearest protein atom is within the rdistance. The results for the water shell dipole are summarizedin Figure 9, where the average dipoles are given in panels aand c and the variances are shown in b and d.
Both the average dipole moment and its variance increasewith the layer thickness r (Figure 9a-b). This increase comesfrom the growing number of waters in the shell, since theaverage dipole moment per water molecule at distance r, ⟨ms(r)⟩) dMs(r)/dNs(r), actually decays with r (Figure 9c). A similartrend is seen for the distance-dependent Kirkwood factor, gK(r)) ⟨Ms
2(r)⟩/(⟨Ns(r)⟩ms2), where ms ) 2.35 D is the dipole moment
of a TIP3P water molecule (Figure 9d). The statistics of theshell dipole are little affected by temperature. Both the average
TABLE 1: Dipole Moments (D) of the Hydration Shell and Protein at 300 K and 1 atma
system ⟨MsI⟩ ⟨(δMs
I)2⟩1/2 ⟨Ms⟩ ⟨(δMs)2⟩1/2 ⟨Mp⟩ ⟨(δMp)2⟩1/2 ⟨NI⟩
WT/Ox (NVT, Ns ) 5886) 414 464 1152 1242 246 127 509WT/Ox (NPT, Ns ) 21 076) 582 662 2564 2737 249 155 510WT/Ox (NVE, Ns ) 21 076) 485 557 2678 2899 239 218 511Mut/Ox (NPT, Ns ) 6217) 316 389 1227 1319 328 223 568Ub (NVE, Ns ) 27 918) 48 50 996 1074 256 30 334Lys (NVE, Ns ) 27 673) 77 71b 950 1055 150 38 468Lys (NVT, Ns ) 27 673) 67 69 824 893 162 73c 464Lys (NPT, Ns ) 27 673) 67 65 835 904 172 117 459
a The data are obtained for wild-type (WT) and mutated (Mut) plastocyanin (PC) in oxidized (Ox) redox state and for lysozyme (Lys) andubiquitin (Ub) proteins. NVE, NVT, and NPT denote the statistical ensembles used in the simulation protocol. The last column lists the averagenumber of waters in the first solvation layer, ⟨NI⟩. b The Kirkwood factor of the first hydration layer of lysozyme is 1.95. A somewhat lowervalue of 1.45 was reported for TIP3P waters in the first solvation layer of myoglobin (Glass et al. J. Chem. Theory Comput. 2010, 6, 1390).c Previous NVT simulations of lysozyme in SPC/E water (Smith et al. J. Phys. Chem. 1993, 97, 2009) reported ⟨(δMp)2⟩1/2 ) 64 D.
Figure 6. Distribution function P(M|) of the parallel projection M| )Ms
I · ep of the first-shell water dipole on the direction of the proteindipole ep ) Mp/Mp. The solid line refers to Ns ) 5886 waters in thesimulation box; the dashed lines represent Ns ) 21 076 (NPT). Theresults of the NVE simulations with the same number of particles arealso shown. The symmetry with respect to inversion M| f -M|indicates that the water shell is not pinned by the electric field of theprotein dipole.
Figure 7. Distributions functions P(M|,⊥) of parallel, M| (a), andperpendicular, M⊥ (b), projections of the first-shell dipole on the proteindipole of lysozyme (Lys, points) and ubiquitin (Ub, solid lines). Thedistribution in panel a marked as Lys/NVT refers to the NVT simulationof lysozyme; all other distributions are from the NVE simulations. Thedashed-dotted lines in both panels refer to the isotropic Maxwelldistribution (M).
Ferroelectric Hydration Shells around Proteins J. Phys. Chem. B, Vol. 114, No. 28, 2010 9251

and the variance of MsI are almost independent of temperature
(Figure 9f), and Ms(r) is nearly the same at high and lowtemperatures (cf. dotted and solid lines in Figure 9a). Thehydration shell also becomes slightly more dense when thenumber of waters in the simulation box is increased from Ns )5886 to Ns ) 21 076. This is reflected by higher ⟨ms(r)⟩ (Figure9c) and gK(r) (Figure 9d). Nevertheless, the polarization densityof the water shell P(r) ) dMs(r)/(4πr2dr) remains fairlyconsistent between the two simulations (cf. solid line with pointsin Figure 9e) and decays approximately as 1/r2 into the bulk.Virtually no polarization is detected beyond r = 10 Å (Figure9c), which incorporates =2300 waters into the ferroelectriccluster.
The variance reorganization energy λsvar(r) can also be
calculated by counting the fluctuations of the Coulomb potentialarising from a given water layer. No correction for the cutoff
of the interaction potential is taken in this case. These resultsare therefore only qualitative and are meant to show thecharacteristic length on which the variance of electrostaticfluctuations builds up. The functions λs
var(r) obtained in twooxidation states of the protein basically follow the trend seenfor the shell water dipole, extending the radius of theirconvergence to about five solvation layers from the proteinsurface. Nevertheless, at least half of λs
var(r) is produced byfluctuations of the first solvation layer alone, again emphasizingthe interfacial nature of the reorganization energy λs
var (eq 7).Further, the water reorganization energy of the mutant is muchhigher than that of the wild-type protein, reaching a giganticmagnitude comparable in the past only to the report by Tan etal.68 It appears that more tightly bound hydration shells of themutant produce more electrostatic noise, at the same timeleading to a stronger compensation between protein and waterfluctuations in the overall reorganization energy λvar (Figure 5and Tables S1 and S2 in the Supporting Information).
The Stokes shift reorganization energy λsSt is much lower than
λsvar and is comparable to the latter only at low temperatures
below Ttr (cf. dashed-dotted and dotted lines in Figure 10a).Importantly, λs
St(r) does not share the long-range character ofλs
var(r) and mostly reaches its bulk value within the first twosolvation layers (Figure 11). Therefore, the dramatic distinctionin the magnitudes of λs
St and λsvar is also reflected in different
length scales involved. Although λsSt is clearly a short-range
Figure 8. Normalized self-correlation functions of dipole momentsof lysozyme (Lys) and ubiquitin (Ub). The solid lines show thecorrelation functions Cs
I(t) of the first-shell dipole; the dashed-dottedlines show the correlation functions of the first-shell unit vector eI(t)) Ms
I(t)/MsI(t). The dotted lines refer to the correlation function Cs(t)
of the entire dipole moment of the simulation box.
Figure 9. Dependence of the water dipole moment on the thicknessof the water shell (a-e) and the variation of the first-shell dipole withtemperature (NVT simulations,25 panel f). All results are from MDsimulations of PC. The dipole moment per water molecule residing atdistance r from the protein surface ⟨ms(r)⟩ ) dMs(r)/dNs(r) is shown inpanel c, and the distance-dependent Kirkwood factor, in panel d. Thedistance-dependent dipolar polarization P(r) ) dMs(r)/(4πr2 dr) isshown in panel e. Panel f shows the average (⟨Ms
I⟩, open squares) andvariance (⟨(δMs
I)2⟩, closed squares, in 106 D2) of the first-shell dipolevs temperature. The solid and dashed lines correspond to the wild typeand mutant proteins, respectively, obtained from simulations withsmaller simulation cells (Ns ) 5886 (WT) and 6217 (Mut)). Open circlesrefer to simulations of WT/Ox PC with Ns ) 21 076 waters in thesimulation cell. The dotted line in panel a shows the water dipolemoment around WT/Ox PC at 150 K.
Figure 10. Reorganization energies λsvar(r) and λs
St(r) calculated fromthe water shell of thickness r around the wild-type plastocyanin (a)and its mutant (b). “Ox” and “Red” specify the oxidation states. Thedotted line in panel a shows λs
var(r) of PC/Ox at T ) 150 K.
Figure 11. Reorganization energies λsvar(r) and λs
St(r) obtained for Redand Ox states of wild-type plastocyanin (solid lines). The dashed-dottedlines show λs
var(r) for the mutant protein. All parameters are calculatedfor a shell of waters inside the thickness r from the protein surface andreduced to their corresponding values at r ) 20 Å. The vertical dashedline indicates the thickness of two solvation shells around the proteinwithin which λs
St(r) nearly reaches its bulk value. The data are obtainedfrom NPT simulations with Ns ) 5886 waters in the simulation box.
9252 J. Phys. Chem. B, Vol. 114, No. 28, 2010 LeBard and Matyushov
property, as is typical for solvation of small molecules, largeincrease in λs
var at T > Ttr originates from a collective mode linkedto long-ranged fluctuations of the shell dipole moment. Thismode dynamically freezes below Ttr, and λs
var(r) not onlybecomes close to λs
St(r) in magnitude, but also loses its long-range length scale.
3.5. Shell Dynamics. We now turn to the dynamics of theferroelectric water shell. This issue is critical for our entirediscussion since the results shown in the previous sectionsnaturally raise a number of questions: (i) Why have any of thelong-ranged dipolar structures not been detected by X-raycrystallography and NMR?84 and (ii) Why was the spatiallyextended water polarization observed on a very short time scaleof the terahertz dielectric response27 and has it not been detectedby conventional dielectric spectroscopy20 at lower frequencies?
To address these questions and get a better grasp of the natureof the dynamical transition in the spectrum of electrostaticfluctuations, we have looked at the dynamics of three relevantdipole moment vectors: dipole moment of the protein Mp(t),dipole moment of the first-shell waters Ms
I(t), and dipole momentof all water molecules in the simulation box Ms(t). Theseobservables are compared with the dynamics of the Coulombinteractions of the active site with the protein and water thermalbath.
The trajectories of all three dipole moment magnitudes ofhydrated plastocyanin are shown in Figure 12a-b. All dipolesexperience rapid fluctuations on a time scale of=1 ps, consistentwith both the time scale of hydrogen-bond dynamics in water70,71
and the peak of the normal-mode density of states of plasto-cyanin (Figure 12c). This type of vibrational density of statesis typically observed for hydrated proteins.92,93 The physicalpicture arising here is that of low-frequency vibrations of theprotein pushing hydration water and producing amplifiedfluctuations of the ferroelectric shell, which follows essentiallyadiabatically the protein motions. These vibrations also includemotions of R-helices with the corresponding fluctuations of theirlarge dipoles.
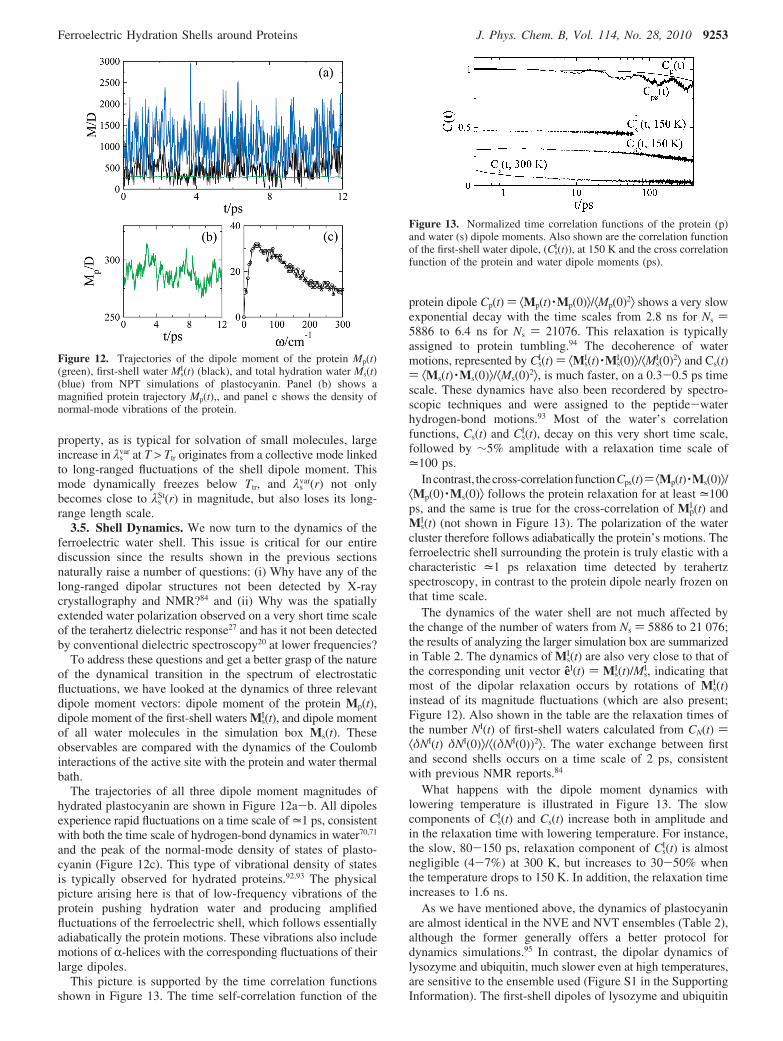
This picture is supported by the time correlation functionsshown in Figure 13. The time self-correlation function of the
protein dipole Cp(t) ) ⟨Mp(t) ·Mp(0)⟩/⟨Mp(0)2⟩ shows a very slowexponential decay with the time scales from 2.8 ns for Ns )5886 to 6.4 ns for Ns ) 21076. This relaxation is typicallyassigned to protein tumbling.94 The decoherence of watermotions, represented by Cs
I(t) ) ⟨MsI(t) ·Ms
I(0)⟩/⟨MsI(0)2⟩ and Cs(t)
) ⟨Ms(t) ·Ms(0)⟩/⟨Ms(0)2⟩, is much faster, on a 0.3-0.5 ps timescale. These dynamics have also been recordered by spectro-scopic techniques and were assigned to the peptide-waterhydrogen-bond motions.93 Most of the water’s correlationfunctions, Cs(t) and Cs
I(t), decay on this very short time scale,followed by ∼5% amplitude with a relaxation time scale of=100 ps.
Incontrast, thecross-correlationfunctionCps(t)) ⟨Mp(t) ·Ms(0)⟩/⟨Mp(0) ·Ms(0)⟩ follows the protein relaxation for at least =100ps, and the same is true for the cross-correlation of Mp
I (t) andMs
I(t) (not shown in Figure 13). The polarization of the watercluster therefore follows adiabatically the protein’s motions. Theferroelectric shell surrounding the protein is truly elastic with acharacteristic =1 ps relaxation time detected by terahertzspectroscopy, in contrast to the protein dipole nearly frozen onthat time scale.
The dynamics of the water shell are not much affected bythe change of the number of waters from Ns ) 5886 to 21 076;the results of analyzing the larger simulation box are summarizedin Table 2. The dynamics of Ms
I(t) are also very close to that ofthe corresponding unit vector eI(t) ) Ms
I(t)/MsI, indicating that
most of the dipolar relaxation occurs by rotations of MsI(t)
instead of its magnitude fluctuations (which are also present;Figure 12). Also shown in the table are the relaxation times ofthe number NI(t) of first-shell waters calculated from CN(t) )⟨δNI(t) δNI(0)⟩/⟨(δNI(0))2⟩. The water exchange between firstand second shells occurs on a time scale of 2 ps, consistentwith previous NMR reports.84
What happens with the dipole moment dynamics withlowering temperature is illustrated in Figure 13. The slowcomponents of Cs
I(t) and Cs(t) increase both in amplitude andin the relaxation time with lowering temperature. For instance,the slow, 80-150 ps, relaxation component of Cs
I(t) is almostnegligible (4-7%) at 300 K, but increases to 30-50% whenthe temperature drops to 150 K. In addition, the relaxation timeincreases to 1.6 ns.
As we have mentioned above, the dynamics of plastocyaninare almost identical in the NVE and NVT ensembles (Table 2),although the former generally offers a better protocol fordynamics simulations.95 In contrast, the dipolar dynamics oflysozyme and ubiquitin, much slower even at high temperatures,are sensitive to the ensemble used (Figure S1 in the SupportingInformation). The first-shell dipoles of lysozyme and ubiquitin
Figure 12. Trajectories of the dipole moment of the protein Mp(t)(green), first-shell water Ms
I(t) (black), and total hydration water Ms(t)(blue) from NPT simulations of plastocyanin. Panel (b) shows amagnified protein trajectory Mp(t),, and panel c shows the density ofnormal-mode vibrations of the protein.
Figure 13. Normalized time correlation functions of the protein (p)and water (s) dipole moments. Also shown are the correlation functionof the first-shell water dipole, (Cs
I(t)), at 150 K and the cross correlationfunction of the protein and water dipole moments (ps).
Ferroelectric Hydration Shells around Proteins J. Phys. Chem. B, Vol. 114, No. 28, 2010 9253

do not average to zero on the 25 ns length of the simulationtrajectory. The slow components make ∼75% of Cs
I(t) for bothproteins, with the relaxation times of 1600 ps (Lys) and 400 ps(Ub) (Figure 8). Nevertheless, for all protein studied, thecorrelation functions of the unit vectors eI(t) are very close tothe Cs
I(t) functions, indicating that the dipolar relaxation occursin all cases by rotations of the dipole moment Ms
I(t).It seems plausible that a nuclear mode responsible for the
slow portion of the dipole relaxation is the main contributor tothe dynamics of electrostatic fluctuations and the dynamicalfreezing of the reorganization energy λs
var below Ttr (Figure 1d).This is suggested by the dramatic difference in the relaxationpatterns of the dipole moment and the electrostatic potential ofplastocyanin. In contrast to protein and water dipoles, whichrelax on quite distinct time scales, the time correlation functionsof the Coulomb interaction energies V0p(t) and V0s(t) are fairlyclose to each other (Figure 14).
The relative weights of the fast and slow relaxation compo-nents are also remarkably different between the dipole momentand Coulomb interaction energies. Most of the water dipolearound plastocyanin relaxes on a really short time scale (Figure13). In contrast, the slow relaxation tail of 0.5-2 ns, barelyseen in functions Cs(t) and CN(t) (Table 2), becomes a dominantcomponent of the relaxation functions CV(t) ) ⟨δV0a(t) δV0a(0)⟩/⟨(δV0a(0))2⟩ calculated for interactions of the active site withthe protein (a ) p) and water (a ) w). This long-time relaxationalso amounts to ∼60% of the variance reorganization energyλs
var. Not surprisingly, this slow relaxation freezes in at lowtemperatures, eliminating, on a fixed observation window, muchof the breadth of the electrostatic noise observed at hightemperatures (Figure 1d). Consistent with the highly correlateddynamics of V0p(t) and V0s(t), there is a substantial compensationbetween the positive protein, λp
var, and water, λsvar, components
of λvar and a negative cross-correlation term λspvar (Figure 5 and
Table 3).
4. Discussion
The current view of the dynamics of the protein-waterinterface highlights the primary role of water translations andcorresponding hydrogen-bond fluctuations. These fluctuationslubricate and enhance the mobility of protein’s surface groups(e.g. amino acid side chains), driving anharmonic proteinfluctuations above the temperature Ttr of the dynamical transi-tion. Density modes, and corresponding relaxation via surfacediffusion, are relatively short-ranged and thus local. What wereport here carries quite a different meaning. We found a (first-order25) transition of a mesoscopic layer of waters surroundingthe protein to an orientationally cooperative (ferroelectric) clusterwith a very substantial average magnitude of its dipole moment.The polarization mode driving this transition involves hundredsof water molecules coupled in their rotational motions by long-ranged Coulomb interactions. The concept of slaving the proteindynamics by water5 gains a new dimension in this picture. It isnot that single-particle dynamics of individual interfacial watersthat slave conformational protein dynamics, but concertedfluctuations of a large polarized cluster comparable in size tothe size of the protein itself. When, with increasing temperature,the characteristic relaxation time of the principal polarizationmode appears in the observation window of a laboratory/numerical experiment, one observes a kinetic transition leadingto a dramatic rise in the breadth of electrostatic fluctuations andmagnitudes of atomic displacements (Figure 1).
The appearance of a new mesophase reveals itself in thebreakdown (eq 2, Table 3) of the linear response relationsbetween electrostatic observables obtained from statisticalaverages and variances. These observations pose two major
TABLE 2: Relaxation Times (τ, ps) and RelativeAmplitudes (A) of the Normalized Time CorrelationFunctions of Water Dipole, the Number of First-ShellWaters, and Electrostatic Interactions Obtained from NVT(20 ns)/NVE (25 ns) Simulations of WT/Ox Plastocyaninwith Ns ) 21076 Waters in the Simulation Box
observable ensemble relaxation times and amplitudes
eI NVT τeI 0.03 1.5 85
AeI 0.81 0.12 0.07
NVE τeI 0.08 3.2 140
AeI 0.85 0.10 0.05
MsI NVT τM
I 0.04 1.4 85AM
I 0.79 0.14 0.07NVE τM
I 0.08 2.1 139AM
I 0.83 0.11 0.06Ms NVT τM 0.006 0.62 4.8 × 10⁸
AM 0.75 0.21 0.04NVE τM 0.1 3.1 1203
AM 0.92 0.05 0.03NI NVE τN
I 0.53 41 2593AN
I 0.80 0.15 0.05V0s
a NVE τp 0.35 46 650Ap 0.23 0.12 0.65
V0pa NVE τw 0.25 11 548
Aw 0.39 0.21 0.40V0,ps
b NVE τpw 0.62 9.5 539Apw 0.22 0.27 0.51
a Coulomb interaction energy of the active site with the partialcharges of water, V0s, and protein, V0p. b Relaxation parameters ofthe cross-correlation function between Coulomb interaction energieswith protein and water.
Figure 14. Normalized Stokes shift correlation function CV(t) )⟨δV0a(t) δV0a(0)⟩/⟨(δV0a(0))2⟩, a ) s, p, obtained for the Coulombinteraction energy of the active site with the protein (p, dashed-dottedline) and water (s, solid lines). The dashed line line marked as “ps”refers to the normalized cross-correlation function between protein andwater Coulomb energies. The water component of the Stokes shiftcorrelation function is shown for NPT and NVE simulations (Ns )21 076); the rest of the data are from the NVE trajectory.
TABLE 3: Components of λvar and λSt (eV) from CoulombInteractions with the Protein (p) and Water (s)
system λvar λsvar λp
var λspvar λSt λp
St λsSt
WT/Ox (NPT,Ns ) 5886)
8.4 8.6 1.2 -1.4 1.07 0.60 0.47
WT/Ox (NVT,Ns ) 5886)
7.7 5.6 1.6 0.5 0.69 0.29 0.40
Mut/Ox (NPT,Ns ) 6217)
7.0 11.7 7.5 -12.2 1.37 0.88 0.49
WT/Ox (NPT,Ns ) 21 076)
5.2 7.2 2.5 -4.5
WT/Ox (NVT,Ns ) 21 076)
7.2 6.7 1.4 -0.9
WT/Ox (NVE,Ns ) 21 076)
7.6 7.2 1.5 -1.1
9254 J. Phys. Chem. B, Vol. 114, No. 28, 2010 LeBard and Matyushov
questions: (i) Does the presence of a protein solute induce theformation of the cooperative ferroelectric cluster in its solvationshell? and (ii) Whether the elastic stress of this cluster producedby the protein conformations/vibrations is responsible for thenon-Gaussian statistics of the electrostatic fluctuations? A partialanswer to the first question may be sought from simulations ofmodel dipolar fluids.96,97 A transition to a bulk liquid ferroelectricwas found in these systems at a dipolar strength of about ∼m2/σ3 = 7 (m is the solvent dipole moment and σ is the effectivediameter).98,99 A macroscopic ferroelectric phase has, of course,not been observed for bulk water. However, the presence of alarge solute might lower the local free energy minimum of theferroelectric phase, positioned above the paraelectric minimumof bulk water, toward a stable ferroelectric subensemble. Thereduced dipole moment of water, m2/σ3, is =5.8 for the TIP3Pforce field and =10 based on more recent ab initio estimates.100
This value falls rather close to the critical value of ferroelectrictransition found in simple dipolar fluids, and one can hypothesizethat this mesophase can be stabilized within a subensemble ofthe hydration shell waters.
The question of how generic the ferroelectric shell envelopingthe protein can be obviously needs further studies. What wehave found from this and some previous studies is that enhanceddipolar fluctuations of the water shell have been observed forredox-active proteins58,66,68,101 but are significantly reduced forubiquitin and lysozyme (Table 1), which are not redox-activein natural systems. What is a set of key parameters of the proteinfold/charge distribution that are responsible for very large valuesof ⟨(δMs
I)2⟩ is not clear, but Table 1 indicates that the vibrationalmodulation of the protein dipole might be an important indicator.One can speculate that the modulation of the protein electrostat-ics by low-frequency conformational modes might be behind alarge breadth of the electrostatic noise observed for redox-activeproteins.
A connection between the protein rigidity103 and the dipolemoment fluctuations is in line with the current interpretation ofthe dynamical transition in proteins.5 One can extract theconformational component of the mean-square displacement ofmyoglobin iron ⟨δx2⟩c in Figure 1a by subtracting the linearlyextrapolated low-temperature component due to protein vibra-tions. It was then shown that the corresponding Lamb-Mossbauerfactor fc ) exp[-k0
2⟨δx2⟩c] (k0 is the wavevector of the gammaradiation) can be exceptionally well reproduced by the dipolemoment variance5
Here, M ) Mp + MsI is the dipole moment of the protein
and its first hydration layer. Further, the nonergodic average⟨...⟩obs is carried out on the times shorter than the instrumentaltime of τobs ) 140 ns. Equation 9 shows that configurational,anharmonic flexibility of the protein detected at T > Ttr can begauged by the dipole moment fluctuations.
The dynamics and statistics of the shell dipole moment turnedout to be protein-specific, as indicated by a dramatic distinctionbetween the redox-active plastocyanin and redox-inactivelysozyme and ubiquitin (cf. Figure 6 and Figure 7). Althoughthe distributions of the first-shell dipoles of the latter twoproteins are qualitatively close to the prediction of the Maxwelldistribution, there is a qualitative difference in the case ofplastocyanin. The hydration shell around this protein breaks intooppositely oriented dipolar domains with a resulting anisotropyof the dipole moment distribution function.
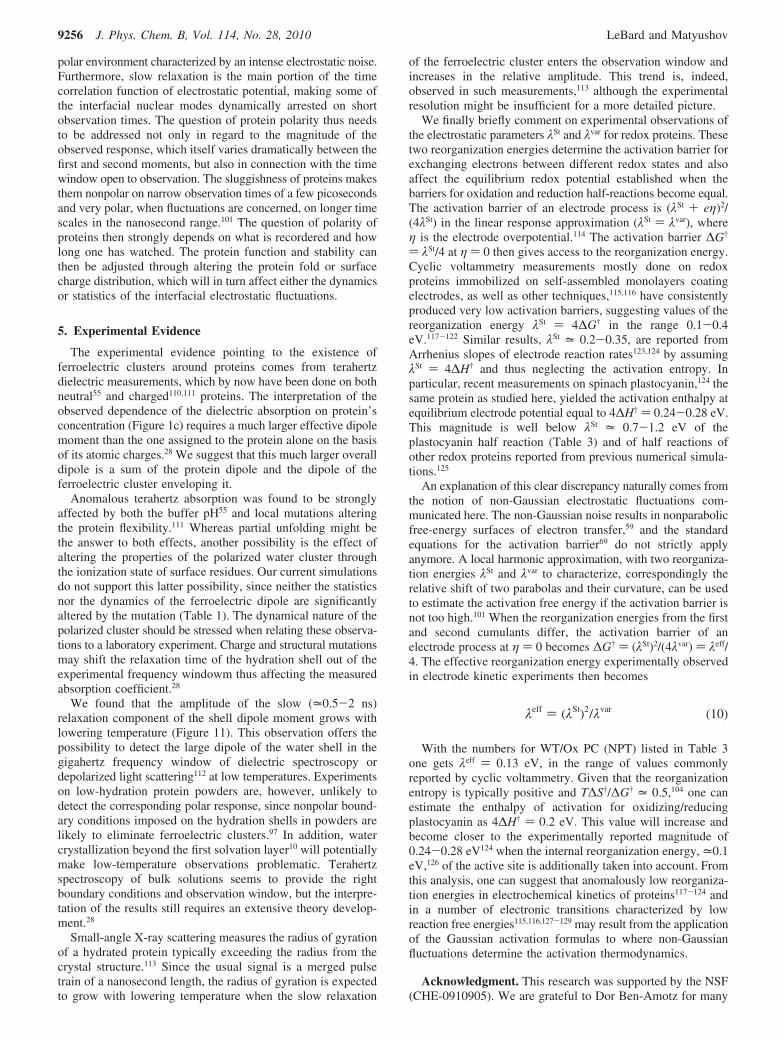
Inequality 2 has been recordered by now in numericalsimulations of several hydrated solutes.58,66,68,101,102,104 The resultscollected from the literature are summarized in Table 4. It isstill not entirely clear if a significant upward deviation of thenon-Gaussianity parameter λvar/λSt from unity signifies theappearance of a ferroelectric water cluster. Note that shortsimulations tend to lose slow dynamics, mainly contributing toλvar (Figure 14), and thus underestimate non-Gaussianity. Wealso want to emphasize that the last entry in Table 4 is a largenonprotein solute. We have also previously found λs
var/λsSt = 1.5
for a small hydrated charge-transfer molecule.104 It might turnout that non-Gaussian electrostatic fluctuation is a generalproperty of hydration amplified by large solutes.105
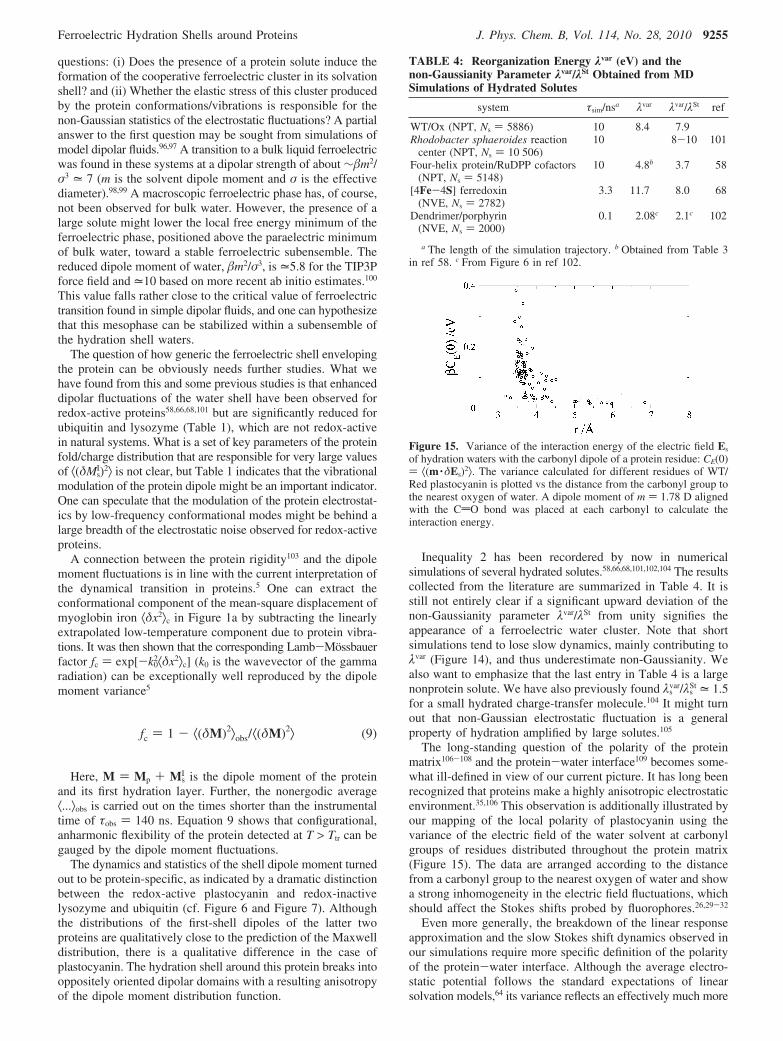
The long-standing question of the polarity of the proteinmatrix106-108 and the protein-water interface109 becomes some-what ill-defined in view of our current picture. It has long beenrecognized that proteins make a highly anisotropic electrostaticenvironment.35,106 This observation is additionally illustrated byour mapping of the local polarity of plastocyanin using thevariance of the electric field of the water solvent at carbonylgroups of residues distributed throughout the protein matrix(Figure 15). The data are arranged according to the distancefrom a carbonyl group to the nearest oxygen of water and showa strong inhomogeneity in the electric field fluctuations, whichshould affect the Stokes shifts probed by fluorophores.26,29-32
Even more generally, the breakdown of the linear responseapproximation and the slow Stokes shift dynamics observed inour simulations require more specific definition of the polarityof the protein-water interface. Although the average electro-static potential follows the standard expectations of linearsolvation models,64 its variance reflects an effectively much more
fc ) 1 - ⟨(δM)2⟩obs/⟨(δM)2⟩ (9)
TABLE 4: Reorganization Energy λvar (eV) and thenon-Gaussianity Parameter λvar/λSt Obtained from MDSimulations of Hydrated Solutes
system τsim/nsa λvar λvar/λSt ref
WT/Ox (NPT, Ns ) 5886) 10 8.4 7.9Rhodobacter sphaeroides reaction
center (NPT, Ns ) 10 506)10 8-10 101
Four-helix protein/RuDPP cofactors(NPT, Ns ) 5148)
10 4.8b 3.7 58
[4Fe-4S] ferredoxin(NVE, Ns ) 2782)
3.3 11.7 8.0 68
Dendrimer/porphyrin(NVE, Ns ) 2000)
0.1 2.08c 2.1c 102
a The length of the simulation trajectory. b Obtained from Table 3in ref 58. c From Figure 6 in ref 102.
Figure 15. Variance of the interaction energy of the electric field Es
of hydration waters with the carbonyl dipole of a protein residue: CE(0)) ⟨(m ·δEs)2⟩. The variance calculated for different residues of WT/Red plastocyanin is plotted vs the distance from the carbonyl group tothe nearest oxygen of water. A dipole moment of m ) 1.78 D alignedwith the CdO bond was placed at each carbonyl to calculate theinteraction energy.
Ferroelectric Hydration Shells around Proteins J. Phys. Chem. B, Vol. 114, No. 28, 2010 9255
polar environment characterized by an intense electrostatic noise.Furthermore, slow relaxation is the main portion of the timecorrelation function of electrostatic potential, making some ofthe interfacial nuclear modes dynamically arrested on shortobservation times. The question of protein polarity thus needsto be addressed not only in regard to the magnitude of theobserved response, which itself varies dramatically between thefirst and second moments, but also in connection with the timewindow open to observation. The sluggishness of proteins makesthem nonpolar on narrow observation times of a few picosecondsand very polar, when fluctuations are concerned, on longer timescales in the nanosecond range.101 The question of polarity ofproteins then strongly depends on what is recordered and howlong one has watched. The protein function and stability canthen be adjusted through altering the protein fold or surfacecharge distribution, which will in turn affect either the dynamicsor statistics of the interfacial electrostatic fluctuations.
5. Experimental Evidence
The experimental evidence pointing to the existence offerroelectric clusters around proteins comes from terahertzdielectric measurements, which by now have been done on bothneutral55 and charged110,111 proteins. The interpretation of theobserved dependence of the dielectric absorption on protein’sconcentration (Figure 1c) requires a much larger effective dipolemoment than the one assigned to the protein alone on the basisof its atomic charges.28 We suggest that this much larger overalldipole is a sum of the protein dipole and the dipole of theferroelectric cluster enveloping it.
Anomalous terahertz absorption was found to be stronglyaffected by both the buffer pH55 and local mutations alteringthe protein flexibility.111 Whereas partial unfolding might bethe answer to both effects, another possibility is the effect ofaltering the properties of the polarized water cluster throughthe ionization state of surface residues. Our current simulationsdo not support this latter possibility, since neither the statisticsnor the dynamics of the ferroelectric dipole are significantlyaltered by the mutation (Table 1). The dynamical nature of thepolarized cluster should be stressed when relating these observa-tions to a laboratory experiment. Charge and structural mutationsmay shift the relaxation time of the hydration shell out of theexperimental frequency windowm thus affecting the measuredabsorption coefficient.28
We found that the amplitude of the slow (=0.5-2 ns)relaxation component of the shell dipole moment grows withlowering temperature (Figure 11). This observation offers thepossibility to detect the large dipole of the water shell in thegigahertz frequency window of dielectric spectroscopy ordepolarized light scattering112 at low temperatures. Experimentson low-hydration protein powders are, however, unlikely todetect the corresponding polar response, since nonpolar bound-ary conditions imposed on the hydration shells in powders arelikely to eliminate ferroelectric clusters.97 In addition, watercrystallization beyond the first solvation layer10 will potentiallymake low-temperature observations problematic. Terahertzspectroscopy of bulk solutions seems to provide the rightboundary conditions and observation window, but the interpre-tation of the results still requires an extensive theory develop-ment.28
Small-angle X-ray scattering measures the radius of gyrationof a hydrated protein typically exceeding the radius from thecrystal structure.113 Since the usual signal is a merged pulsetrain of a nanosecond length, the radius of gyration is expectedto grow with lowering temperature when the slow relaxation
of the ferroelectric cluster enters the observation window andincreases in the relative amplitude. This trend is, indeed,observed in such measurements,113 although the experimentalresolution might be insufficient for a more detailed picture.
We finally briefly comment on experimental observations ofthe electrostatic parameters λSt and λvar for redox proteins. Thesetwo reorganization energies determine the activation barrier forexchanging electrons between different redox states and alsoaffect the equilibrium redox potential established when thebarriers for oxidation and reduction half-reactions become equal.The activation barrier of an electrode process is (λSt + eη)2/(4λSt) in the linear response approximation (λSt ) λvar), whereη is the electrode overpotential.114 The activation barrier ∆G†
) λSt/4 at η ) 0 then gives access to the reorganization energy.Cyclic voltammetry measurements mostly done on redoxproteins immobilized on self-assembled monolayers coatingelectrodes, as well as other techniques,115,116 have consistentlyproduced very low activation barriers, suggesting values of thereorganization energy λSt ) 4∆G† in the range 0.1-0.4eV.117-122 Similar results, λSt = 0.2-0.35, are reported fromArrhenius slopes of electrode reaction rates123,124 by assumingλSt ) 4∆H† and thus neglecting the activation entropy. Inparticular, recent measurements on spinach plastocyanin,124 thesame protein as studied here, yielded the activation enthalpy atequilibrium electrode potential equal to 4∆H† ) 0.24-0.28 eV.This magnitude is well below λSt = 0.7-1.2 eV of theplastocyanin half reaction (Table 3) and of half reactions ofother redox proteins reported from previous numerical simula-tions.125
An explanation of this clear discrepancy naturally comes fromthe notion of non-Gaussian electrostatic fluctuations com-municated here. The non-Gaussian noise results in nonparabolicfree-energy surfaces of electron transfer,59 and the standardequations for the activation barrier69 do not strictly applyanymore. A local harmonic approximation, with two reorganiza-tion energies λSt and λvar to characterize, correspondingly therelative shift of two parabolas and their curvature, can be usedto estimate the activation free energy if the activation barrier isnot too high.101 When the reorganization energies from the firstand second cumulants differ, the activation barrier of anelectrode process at η ) 0 becomes ∆G† ) (λSt)2/(4λvar) ) λeff/4. The effective reorganization energy experimentally observedin electrode kinetic experiments then becomes
With the numbers for WT/Ox PC (NPT) listed in Table 3one gets λeff ) 0.13 eV, in the range of values commonlyreported by cyclic voltammetry. Given that the reorganizationentropy is typically positive and T∆S†/∆G† = 0.5,104 one canestimate the enthalpy of activation for oxidizing/reducingplastocyanin as 4∆H† ) 0.2 eV. This value will increase andbecome closer to the experimentally reported magnitude of0.24-0.28 eV124 when the internal reorganization energy, =0.1eV,126 of the active site is additionally taken into account. Fromthis analysis, one can suggest that anomalously low reorganiza-tion energies in electrochemical kinetics of proteins117-124 andin a number of electronic transitions characterized by lowreaction free energies115,116,127-129 may result from the applicationof the Gaussian activation formulas to where non-Gaussianfluctuations determine the activation thermodynamics.
Acknowledgment. This research was supported by the NSF(CHE-0910905). We are grateful to Dor Ben-Amotz for many
λeff ) (λSt)2/λvar (10)
9256 J. Phys. Chem. B, Vol. 114, No. 28, 2010 LeBard and Matyushov

useful comments on the manuscript. CPU time was providedby ASU’s Center for High Performance Computing and by anumber of allocations through the TeraGrid Advanced SupportProgram (TG-MCB080071, TG-MCB080116N, TG-ASC090088).
Supporting Information Available: Additional informationas noted in text. This material is available free of charge viathe Internet at http://pubs.acs.org.
References and Notes
(1) Parak, F. G. Rep. Prog. Phys. 2003, 66, 103.(2) Fenimore, P. W.; Frauenfelder, H.; McMahon, B. H.; Young, R. D.
Proc. Natl. Acad. Sci. 2004, 101, 14408.(3) Caliskan, G.; Briber, R.; Thirumalai, D.; Garcia-Sakai, V.;
Woodson, S.; Sokolov, A. J. Am. Chem. Soc. 2006, 128, 32.(4) Doster, W. Eur. Biophys. J. 2008, 37, 591.(5) Frauenfelder, H.; Chen, G.; Berendzen, J.; Fenimore, P. W.;
Jansson, H.; McMahon, B. H.; Stroe, I. R.; Swenson, J.; Young, R. D. Proc.Natl. Acad. Sci. 2009, 106, 5129.
(6) Doster, W. Biochim. Biophys. Acta 2010, 1804, 3.(7) Zanotti, J.-M.; Bellissent-Funel, M.-C.; Chen, S.-H. Europhys. Lett.
2005, 71, 91.(8) Khodadadi, S.; Pawlus, S.; Roh, J. H.; Sakai, V. G.; Mamontov,
E.; Sokolov, A. P. J. Chem. Phys. 2008, 128, 195106.(9) Zanotti, J.-M.; Gibrat, G.; Bellissent-Funel, M.-C. Phys. Chem.
Chem. Phys. 2008, 10, 4865.(10) Miyazaki, Y.; Matsua, T.; Suga, H. J. Phys. Chem. B 2000, 104,
8044.(11) Doster, W.; Busch, S.; Gaspar, A. M.; Appavou, M.-S.; Wutke,
J.; Scheer, H. Phys. ReV. Lett. 2010, 104, 098101.(12) Chen, S.-H.; Liu, L.; Fratini, E.; Baglioni, P.; Mamontov, E. Proc.
Natl. Acad. Sci. 2006, 103, 9012.(13) Kumar, P.; Yan, Z.; Xu, L.; Mazza, M. G.; Buldyrev, S. V.; Chen,
S.-H.; Sastry, S.; Stanley, H. E. Phys. ReV. Lett. 2006, 97, 177802.(14) Pawlus, S.; Khodadadi, S.; Sokolov, A. P. Phys. ReV. Lett. 2008,
100, 108103.(15) Ngai, K. L.; Capaccioli, S.; Shinyashiki, N. J. Phys. Chem. B 2008,
112, 3826.(16) Khodadadi, S.; Pawlus, S.; Sokolov, A. P. J. Phys. Chem. B 2008,
112, 14273.(17) For supercolled liquids close to the glass transition, the slowest
relaxation process is called the R process. It roughly corresponds tomolecular rotation in molecular liquids and is often non-Arrhenius.Secondary relaxation processes occurring on shorter time scales are broadlyassigned to -relaxation. The notion of a -process controlling protein rmsatomic displacements and emerging in the observation window at Ttr hasnot been entirely settled. Non-Arrhenius relaxation is seen by broad-banddielectric measurements,20 and an R-process fits well the protein rmsdisplacements.4
(18) Wood, K.; Frolich, A.; Paciaroni, A.; Moulin, M.; Hartlein, M.;Zaccai, G.; Tobias, D. J.; Weik, M. J. Am. Chem. Soc. 2008, 130, 4586.
(19) Chu, X.-Q.; Faraone, A.; Kim, C.; Fratini, E.; Baglioni, P.; Leao,J. B.; Chen, S.-H. J. Phys. Chem. B 2009, 113, 5001.
(20) Schiro, G.; Cupane, A.; Vitrano, E.; Bruni, F. J. Phys. Chem. B2009, 113, 9606.
(21) He, Y.; Ku, P. I.; Knab, J. R.; Chen, J. Y.; Markelz, A. G. Phys.ReV. Lett. 2008, 101, 178103.
(22) Johnson, M. E.; Malardier-Jugroot, C.; Murarka, R. K.; Head-Gordon, T. J. Phys. Chem. B 2009, 113, 4082.
(23) Paciaroni, A.; Cinelli, S.; Onori, G. Biophys. J. 2002, 83, 1157.(24) Backus, E. H. G.; Bloem, R.; Pfister, R.; Moretto, A.; Crisma,
M.; Toniolo, C.; Hamm, P. J. Phys. Chem. B 2009, 113, 13405.(25) LeBard, D. N.; Matyushov, D. V. Phys. ReV. E 2008, 78, 061901.(26) Pal, S. K.; Zewail, A. H. Chem. ReV. 2004, 104, 2099.(27) Ebbinghaus, S.; Kim, S. J.; Heyden, M.; Yu, X.; Heugen, U.;
Gruebele, M.; Leitner, D. M.; Havenith, M. Proc. Natl. Acad. Sci. 2007,104, 20749.
(28) Matyushov, D. V. Phys. ReV. E 2010, 81, 021914.(29) Nilsson, L.; Halle, B. Proc. Natl. Acad. Sci. 2005, 102, 13867.(30) Zhang, L.; Wang, L.; Kao, Y.-T.; Qiu, W.; Yang, Y.; Okobiah,
O.; Zhong, D. Proc. Natl. Acad. Sci. 2007, 104, 18461.(31) Li, T.; Hassanali, A. A.; Singer, S. J. J. Phys. Chem. B 2008,
112, 16121.(32) Sen, S.; Andreatta, D.; Ponomarev, S. Y.; Beveridge, D. L.; Berg,
M. A. J. Am. Chem. Soc. 2009, 131, 1724.(33) Jimenez, R.; Fleming, G. R.; Kumar, P. V.; Maroncelli, M. Nature
1994, 369, 471.(34) Nandi, N.; Bhattacharyya, K.; Bagchi, B. Chem. ReV. 2000, 100,
2013.(35) Golosov, A. A.; Karplus, M. J. Phys. Chem. B 2007, 111, 1482.
(36) Halle, B.; Nilsson, L. J. Phys. Chem. B 2009, 113, 8210.(37) Zhou, R.; Huang, X.; Margulis, C. J.; Berne, B. J. Proc. Natl.
Acad. Sci. 2004, 305, 1605.(38) Berne, B. J.; Weeks, J. D.; Zhou, R. Annu. ReV. Phys. Chem. 2009,
60, 85.(39) Makarov, V. A.; Andrews, B. K.; Pettitt, B. M. Biopolymers 1998,
45, 469.(40) Giovambattista, N.; Lopez, C. F.; Rossky, P. J.; Debenedetti, P. G.
Proc. Natl. Acad. Sci. 2008, 105, 2274.(41) ten Wolde, P. R.; Chandler, D. Proc. Natl. Acad. Sci. 2002, 99,
6539.(42) Choudhury, N.; Pettitt, B. J. Am. Chem. Soc. 2007, 129, 4847.(43) Mittal, J.; Hummer, G. Proc. Natl. Acad. Sci. 2008, 105, 20130.(44) Willard, A. P.; Chandler, D. Faraday Trans. 2009, 141, 209.(45) Sarupria, S.; Garde, S. Phys. ReV. Lett. 2009, 103, 037803.(46) Dadarlat, V. M.; Post, C. B. Proc. Natl. Acad. Sci. 2003, 100,
14778.(47) Dadarlat, V. M.; Post, C. B. Biophys. J. 2006, 91, 4544.(48) Tarek, M.; Tobias, D. J. Phys. ReV. Lett. 2002, 88, 138101.(49) Tournier, A. L.; Xu, J.; Smith, J. C. Biophys. J. 2003, 85, 1871.(50) Tarek, M.; Tobias, D. J. Eur. Biophys J. 2008, 37, 701.(51) Bergner, A.; Heugen, U.; Brundermann, E.; Schwaab, G.; Ha-
venith, M.; Chamberlin, D. R.; Haller, E. E. ReV. Sci. Instrum. 2005, 76,063110.
(52) Knab, J. R.; Chen, J.-Y.; He, Y.; Markelz, A. G. Proc. IEEE 2007,95, 1605.
(53) Oleinikova, A.; Sasisanker, P.; Weingartner, H. J. Phys. Chem. B2004, 108, 8467.
(54) Mijovic, J.; Bian, Y.; Gross, R. A.; Chen, B. Macromolecules2005, 38, 10812.
(55) Ebbinghaus, S.; Kim, S. J.; Heyden, M.; Yu, X.; Gruebele, M.;Leitner, D. M.; Havenith, M. J. Am. Chem. Soc. 2008, 130, 2374.
(56) Higo, J.; Sasai, M.; Shirai, H.; Nakamura, H.; Kugimiya, T. Proc.Natl. Acad. Sci. 2001, 98, 5961.
(57) Kuharski, R. A.; Bader, J. S.; Chandler, D.; Sprik, M.; Klein,M. L.; Impey, R. W. J. Chem. Phys. 1988, 89, 3248.
(58) Blumberger, J.; Sprik, M. Theor. Chem. Acc. 2006, 115, 113.(59) Matyushov, D. V. Acc. Chem. Res. 2007, 40, 294.(60) Landau, L. D.; Lifshitz, E. M. Electrodynamics of continuous
media; Pergamon: Oxford, 1984.(61) Palmer, R. G. AdV. Phys. 1982, 31, 669.(62) Marcus, R. A. J. Phys. Chem. 1989, 93, 3078.(63) Small, D. W.; Matyushov, D. V.; Voth, G. A. J. Am. Chem. Soc.
2003, 125, 7470.(64) LeBard, D. N.; Matyushov, D. V. J. Chem. Phys. 2008, 128,
155106.(65) Hansen, J. P.; McDonald, I. R. Theory of Simple Liquids;
Academic Press: Amsterdam, 2003.(66) LeBard, D. N.; Matyushov, D. V. J. Phys. Chem. B 2008, 112,
5218.(67) LeBard, D. N.; Kapko, V.; Matyushov, D. V. J. Phys. Chem. B
2008, 112, 10322.(68) Tan, M.-L.; Dolan, E.; Ichiye, T. J. Phys. Chem. B 2004, 108,
20435.(69) Marcus, R. A.; Sutin, N. Biochim. Biophys. Acta 1985, 811, 265.(70) Luzar, A.; Chandler, D. Phys. ReV. Lett. 1996, 76, 928.(71) Laage, D.; Hynes, J. T. Science 2006, 311, 832.(72) Shenogina, N.; Keblinski, P.; Garde, S. J. Chem. Phys. 2008, 129,
155105.(73) Lee, C. Y.; McCammon, J. A.; Rossky, P. J. J. Chem. Phys. 1984,
80, 4448.(74) Kofinger, J.; Hummer, G.; Dellago, C. Proc. Natl. Acad. Sci. 2008,
105, 13218.(75) Mikami, F.; Matsuda, K.; Kataura, H.; Maniwa, Y. ACS Nano
2009, 3, 1279.(76) Fedichev, P. O.; Menshikov, L. I. Cornell University Library arXiv
database. http://arxiv.org/abs/cond-mat/0601129.(77) Mazza, M. G.; Stokely, K.; Pagnotta, S. E.; Bruni, F.; Stanley,
H. E.; Franzese, G. Cornell University Library arXiv database. http://arxiv.org/abs/0907.1810.
(78) Blinc, R.; Zeks, B. Soft modes in ferroelectrics and antiferro-electrics; North-Holland Publishing Co.: Amsterdam, 1974.
(79) Chandler, D. Nature 2005, 437, 640.(80) Patel, A. J.; Varilly, P.; Chandler, D. J. Phys. Chem. B 2010, 114,
1632.(81) Rodgers, J. M.; Weeks, J. D. Proc. Natl. Acad. Sci. 2008, 105,
19136.(82) Henderson, J. R.; Lekner, J. Mol. Phys. 1978, 36, 781.(83) Makarov, V. A.; Andrews, B. K.; Smith, P. E.; Pettitt, B. M.
Biophys. J. 2000, 79, 2966.(84) Halle, B. Philos. Trans. R. Soc. London 2004, 359, 1207.(85) Kinoshita, M.; Suzuki, M. J. Chem. Phys. 2009, 130, 014707.
Ferroelectric Hydration Shells around Proteins J. Phys. Chem. B, Vol. 114, No. 28, 2010 9257

(86) Qvist, J.; Persson, E.; Mattea, C.; Halle, B. Faraday Trans. 2009,141, 131.
(87) Swenson, J.; Teixeira, J. J. Chem. Phys. 2010, 132, 014508.(88) Roberts, J. E.; Schnitker, J. J. Phys. Chem. 1995, 99, 1322.(89) Rajamani, S.; Truskett, T. M.; Garde, S. Proc. Natl. Acad. Sci.
2005, 102, 9475.(90) Landau, L. D.; Lifshits, E. M. Statistical Physics; Elsevier: New
York, 1980; pp 44 and 260.(91) Debenedetti, P. G. Metastable Liquids: Concepts and Principles;
Princeton University Press: Princeton, NJ, 1996.(92) Elber, R.; Karplus, M. Phys. ReV. Lett. 1986, 56, 394.(93) Hunt, N. T.; Kattner, L.; Shanks, R. P.; Wynne, K. J. Am. Chem.
Soc. 2007, 129, 3168.(94) Rudas, T.; Schroder, C.; Boresch, S.; Steinhauser, O. J. Chem.
Phys. 2006, 124, 234908.(95) Allen, M. P.; Tildesley, D. J. Computer Simulation of Liquids;
Clarendon Press: Oxford, 1996.(96) Wei, D.; Patey, G. N. Phys. ReV. Lett. 1992, 68, 2043.(97) Wei, D.; Patey, G. N.; Perera, A. Phys. ReV. E 1993, 47, 506.(98) Weis, J.-J. J. Chem. Phys. 2005, 123, 044503.(99) Matyushov, D. V. J. Phys. Chem. B 2006, 110, 10095.
(100) Sharma, M.; Resta, R.; Car, R. Phys. ReV. Lett. 2007, 98, 247401.(101) LeBard, D. N.; Matyushov, D. V. J. Phys. Chem. B 2009, 113,
12424.(102) Paulo, P. M. R.; Lopes, J. N. C.; Costa, S. M. B. J. Phys. Chem.
B 2008, 14779.(103) Zaccai, G. Science 2000, 288, 1604.(104) Ghorai, P. K.; Matyushov, D. V. J. Phys. Chem. A 2006, 110,
8857.(105) Martin, D. R.; Matyushov, D. V. Phys. ReV. E 2008, 78, 041206.(106) Smith, P. E.; Brunne, R. M.; Mark, A. E.; van Gunsteren, W. F.
J. Phys. Chem. 1993, 97, 2009.(107) Simonson, T. Rep. Prog. Phys. 2003, 66, 737.(108) Simonson, T. Photosynth. Res. 2008, 97, 21.(109) Glass, D. G.; Krishnan, M.; Nutt, D. R.; Smith, J. C. J. Chem.
Theory Comput. 2010, 6, 1390.(110) Kim, S. J.; Born, B.; Havenith, M.; Gruebele, M. Angew. Chem.,
Int. Ed. 2008, 47, 6486.
(111) Born, B.; Kim, S. J.; Ebbinghaus, S.; Grueble, M.; Havenith, M.Faraday Discuss. 2009, 141, 161.
(112) Perticaroli, S.; Comez, L.; Paolantoni, M.; Sassi, P.; Lupi, L.;Fioretto, D.; Paciaroni, A.; Morresi, A. J. Phys. Chem. B 2010, 114, 8262.
(113) Qin, Z.; Ervin, J.; Larios, E.; Gruebele, M.; Kihara, H. J. Phys.Chem. B 2002, 106, 13040.
(114) Schmickler, W. Interfacial Electrochemistry; Oxford UniversityPress: New York, 1996.
(115) Kummerle, R.; Gaillard, J.; Kyritsis, P.; Moulis, J.-M. J. Biol.Inorg. Chem. 2001, 6, 446.
(116) Jasaitis, A.; Rappaport, F.; Pilet, E.; Liebl, U.; Vos, M. H. Proc.Natl. Acad. Sci. 2005, 102, 10882.
(117) Hirst, J.; Armstrong, F. A. Anal. Chem. 1998, 70, 5062.(118) Chi, Q.; Zhang, J.; Andersen, J. E. T.; Ulstrup, J. J. Phys. Chem.
B 2001, 105, 4669.(119) Jeuken, L. J. C.; McEvoy, J. P.; Armstrong, F. A. J. Phys. Chem.
B 2002, 106, 2304.(120) Hildebrandt, P.; Murgida, D. H. Bioelectrochem. 2002, 55, 139.(121) Guo, Y.; Zhao, J.; Yin, X.; Gao, X.; Tian, Y. J. Phys. Chem. C
2008, 112, 6013.(122) Khostariya, D. E.; Dolidze, T. D.; Shushanyan, M.; Davis, K. L.;
Waldeck, D. H.; van Eldik, R. Proc. Natl. Acad. Sci. 2010, 107, 2757.(123) Monari, S.; Battistuzzi, G.; Borsari, M.; Millo, D.; Gooijer, C.;
van der Zwan, G.; Ranieri, A.; Sola, M. J. Appl. Electrochem. 2008, 38,885.
(124) Ranieri, A.; Battistuzzi, G.; Borsari, M.; Casalini, S.; Fontanesi,C.; Monari, S.; Siwek, M. J.; Sola, M. J. Electroanal. Chem. 2009, 626,123.
(125) Blumberger, J. Phys. Chem. Chem. Phys. 2008, 10, 5651.(126) Cascella, M.; Magistrato, A.; Tavernelli, I.; Carloni, P.; Rothlis-
berger, U. Proc. Natl. Acad. Sci. 2006, 103, 19641.(127) Winkler, J. R.; Malmstrom, B. G.; Gray, H. B. Biophys. Chem.
1995, 54, 199.(128) Jasaitis, A.; Johansson, M. P.; Wikstrom, M.; Vos, M. H.;
Verkhovsky, M. I. Proc. Natl. Acad. Sci. 2007, 104, 20811.(129) Takayama, S. J.; Irie, K.; Tai, H.; Kawahara, T.; Hirota, S.; Takabe,
T.; Alcaraz, L. A.; Donaire, A.; Yamamoto, Y. J. Biol. Inorg. Chem. 2009,14, 821.
JP1006999
9258 J. Phys. Chem. B, Vol. 114, No. 28, 2010 LeBard and Matyushov


![FERROELECTRIC RAM [FRAM]](https://img.pdfslide.net/doc/110x75/56816799550346895ddcd567/ferroelectric-ram-fram.jpg)


![FERROELECTRIC RAM [FRAM] - Study Mafiastudymafia.org/wp...FERROELECTRIC-RAM-FRAM-Report.pdf · A Seminar report On FERROELECTRIC RAM [FRAM] Submitted in partial fulfillment of the](https://img.pdfslide.net/doc/110x75/5b94f2f009d3f2130d8dd6e1/ferroelectric-ram-fram-study-a-seminar-report-on-ferroelectric-ram-fram.jpg)