Embed Size (px)
Citation preview

Wor
king
Pap
ers
du C
EPED
Centre Population et Développement
UMR 196 CEPED, Université Paris Descartes, INED, IRD
http://www.ceped.org/wp
Fertility at District Level in India:
Lessons from the 2011 Census
Christophe Z Guilmoto and Irudaya Rajan
June 2013 • 30

CEPED • Centre Population et Développement UMR 196 CEPED, Université Paris Descartes, INED, IRD
19 rue Jacob 75006 PARIS, France
http://www.ceped.org/ • [email protected]
Les Working Papers du CEPED constituent des documents de travail portant sur des recherches menées par des
chercheurs du CEPED ou associés. Rédigés pour une diffusion rapide, ces papiers n’ont pas été formellement relus et
édités. Certaines versions de ces documents de travail peuvent être soumises à une revue à comité de lecture.
Les droits d’auteur sont détenus par les auteurs.
CEPED Working Papers are working papers on current research conducted by CEPED-affiliated researchers. Written for timely
dissemination, these papers have not been formally edited or peer reviewed. Versions of these working papers are sometimes
submitted for publication in peer-reviewed journals.
Copyrights are held by the authors.
Contact • Corresponding Author: Christophe Z Guilmoto Researcher in Demography, IRD/CEPED, Paris.
Irudaya Rajan Professor at Centre for Development Studies, Thiruvananthapuram, India.
Citation recommandée • Recommended citation Guilmoto CZ and Rajan I, « Fertility at District Level in India: Lessons from the 2011 Census », Working Paper du CEPED,
n°30, UMR 196 CEPED, Université Paris Descartes, INED, IRD), Paris, June 2013.
Available on http://www.ceped.org/wp
1
Fertility at District Level in India:
Lessons from the 2011 Census
Christophe Z Guilmoto* and Irudaya Rajan**
Abtsract
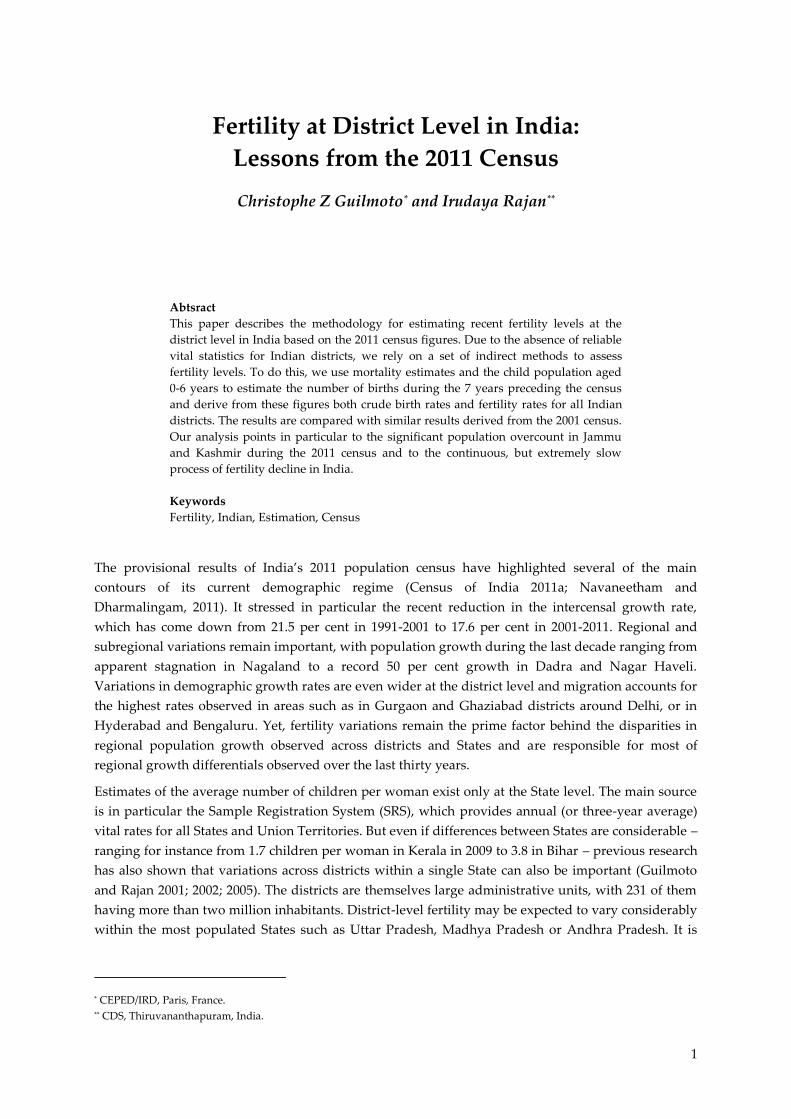
This paper describes the methodology for estimating recent fertility levels at the
district level in India based on the 2011 census figures. Due to the absence of reliable
vital statistics for Indian districts, we rely on a set of indirect methods to assess
fertility levels. To do this, we use mortality estimates and the child population aged
0-6 years to estimate the number of births during the 7 years preceding the census
and derive from these figures both crude birth rates and fertility rates for all Indian
districts. The results are compared with similar results derived from the 2001 census.
Our analysis points in particular to the significant population overcount in Jammu
and Kashmir during the 2011 census and to the continuous, but extremely slow
process of fertility decline in India.
Keywords
Fertility, Indian, Estimation, Census
The provisional results of India’s 2011 population census have highlighted several of the main
contours of its current demographic regime (Census of India 2011a; Navaneetham and
Dharmalingam, 2011). It stressed in particular the recent reduction in the intercensal growth rate,
which has come down from 21.5 per cent in 1991-2001 to 17.6 per cent in 2001-2011. Regional and
subregional variations remain important, with population growth during the last decade ranging from
apparent stagnation in Nagaland to a record 50 per cent growth in Dadra and Nagar Haveli.
Variations in demographic growth rates are even wider at the district level and migration accounts for
the highest rates observed in areas such as in Gurgaon and Ghaziabad districts around Delhi, or in
Hyderabad and Bengaluru. Yet, fertility variations remain the prime factor behind the disparities in
regional population growth observed across districts and States and are responsible for most of
regional growth differentials observed over the last thirty years.
Estimates of the average number of children per woman exist only at the State level. The main source
is in particular the Sample Registration System (SRS), which provides annual (or three-year average)
vital rates for all States and Union Territories. But even if differences between States are considerable –
ranging for instance from 1.7 children per woman in Kerala in 2009 to 3.8 in Bihar – previous research
has also shown that variations across districts within a single State can also be important (Guilmoto
and Rajan 2001; 2002; 2005). The districts are themselves large administrative units, with 231 of them
having more than two million inhabitants. District-level fertility may be expected to vary considerably
within the most populated States such as Uttar Pradesh, Madhya Pradesh or Andhra Pradesh. It is
* CEPED/IRD, Paris, France. ** CDS, Thiruvananthapuram, India.

Christophe Z Guilmoto and Irudaya Rajan • Working Paper 30, June 2013
2
therefore of primary importance to get an exhaustive picture of fertility levels across Indian districts to
understand the pace of fertility transition across the country and its regions.
Demographic sources at the district level remain, unfortunately, limited. Sixty years after
Independence, the quality of the civil registration system in India is still appalling. In fact, not only
does a significant proportion of the population fail to register births, but many local authorities do not
compile, tabulate or publish birth registration statistics on an annual basis. Even the Office of Register
General of India has ceased to publish a regular series of vital statistics as it used to in the past. As a
result, existing demographic estimates are based only on sample surveys or a sample registration. The
most famous population sources for estimating fertility in India – the SRS (Sample Registration
System) and the NFHS (National family and Health Survey) – do not go beneath the State level. In the
recent past, there have been several district-level demographic surveys such as the District Level
Household and Facility Survey (with the last round in 2007-08) and more recently, the annual Health
Survey launched in 2010. But these sources do not cover India entirely or do not provide adequate
fertility measurements. The Census of India remains therefore the only source for both simultaneous
and exhaustive figures on fertility differentials at the district level.
This paper will start with a presentation of our methodology. We hope that by describing our
estimation technique in detail, we will encourage other scholars to review and improve on this
procedure. In the second part, we discuss the quality of our results and stress the difficulties
encountered in collecting data in some parts of India, where census figures may be overstated. As a
conclusion, we review the distribution of fertility on the eve of the 2011 Census and its regional
distribution.
From census children to recent births per woman
As mentioned in our introduction, the Census of India is the only source that provides an exhaustive
picture of India’s population in the absence of reliable birth registration data. Two types of
information can be used for estimating fertility from the census. The first type relates to the
information canvassed by the census on the births during the last 12 months preceding the census. In
theory, this should provide a rather reliable estimate of birth rates during the previous year provided
that births are properly reported. A more serious limitation of this source is that the so-called “fertility
tables” are published rather late by the census, with direct estimates based on recent births not
available before several years. The second type of census variable available for indirect estimation
purposes is the child population distribution. Provisional figures have already been published at the
district level in 2011. Here, we use the distribution of the population aged 0-6 years, following an
estimation method inaugurated by the late P. N. Mari Bhat back in 1996 (Bhat, 1996), using 1991
census data.
Fertility at District Level in India: Lessons from the 2011 Census
3
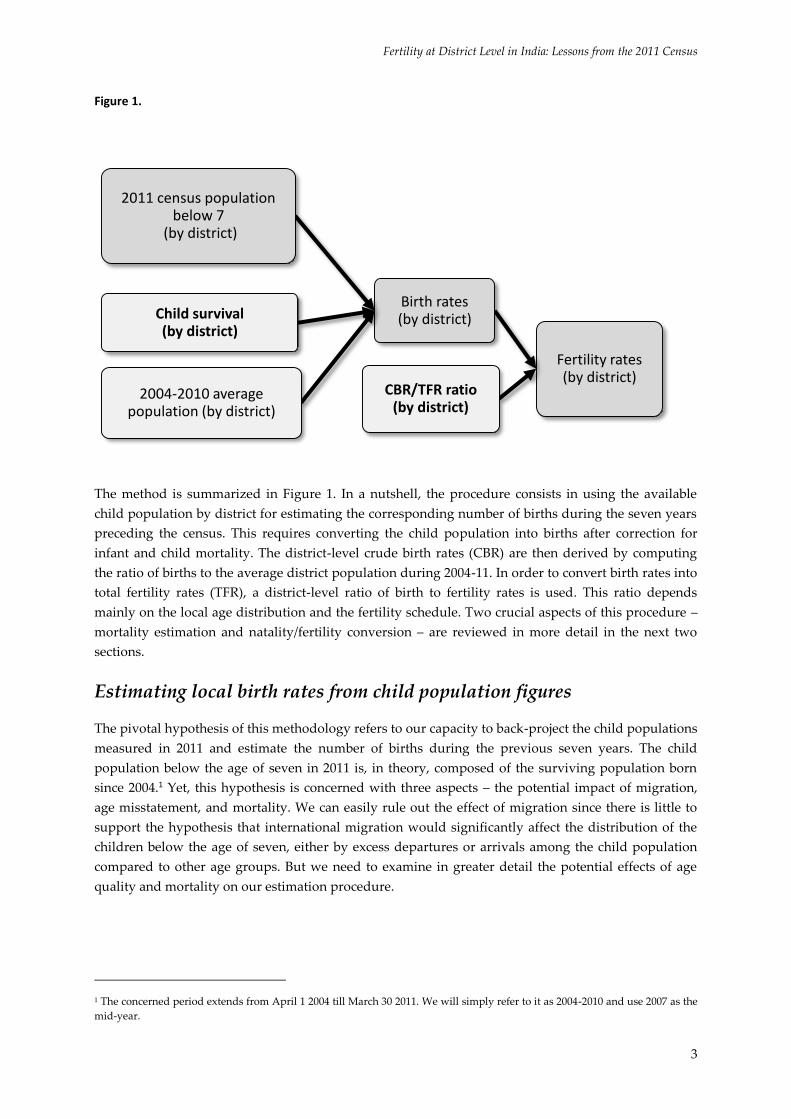
Figure 1.
The method is summarized in Figure 1. In a nutshell, the procedure consists in using the available
child population by district for estimating the corresponding number of births during the seven years
preceding the census. This requires converting the child population into births after correction for
infant and child mortality. The district-level crude birth rates (CBR) are then derived by computing
the ratio of births to the average district population during 2004-11. In order to convert birth rates into
total fertility rates (TFR), a district-level ratio of birth to fertility rates is used. This ratio depends
mainly on the local age distribution and the fertility schedule. Two crucial aspects of this procedure –
mortality estimation and natality/fertility conversion – are reviewed in more detail in the next two
sections.
Estimating local birth rates from child population figures
The pivotal hypothesis of this methodology refers to our capacity to back-project the child populations
measured in 2011 and estimate the number of births during the previous seven years. The child
population below the age of seven in 2011 is, in theory, composed of the surviving population born
since 2004.1 Yet, this hypothesis is concerned with three aspects – the potential impact of migration,
age misstatement, and mortality. We can easily rule out the effect of migration since there is little to
support the hypothesis that international migration would significantly affect the distribution of the
children below the age of seven, either by excess departures or arrivals among the child population
compared to other age groups. But we need to examine in greater detail the potential effects of age
quality and mortality on our estimation procedure.
1 The concerned period extends from April 1 2004 till March 30 2011. We will simply refer to it as 2004-2010 and use 2007 as the
mid-year.
Fertility rates(by district)
Birth rates(by district)
2011 census population below 7
(by district)
Child survival (by district)
2004-2010 average population (by district)
CBR/TFR ratio (by district)

Christophe Z Guilmoto and Irudaya Rajan • Working Paper 30, June 2013
4
Age reporting in India
Identifying the distribution of the population under age 7 with the number of births during 2004-10
assumes that ages are properly reported in the census. This is a rather dubious assumption in the
Indian context where many people have no exact knowledge of their biological age or of their year of
birth. Moreover, systematic attempts by census takers to properly assess age for all individuals would
greatly extend the duration of the enumeration. The figures given below indicate that only few
enumerators have taken the trouble to estimate the exact age of the respondents using traditional
calendars. They often prefer to round off the age based on guesswork. Take for instance the case of
preferred rounding of ages ending with 0 or 5. Using the 2001 Census tables published by single year
of age, we can compute the ratio of the population of any single year to the average population
returning the lower and higher adjacent ages. This ratio should be 100 per cent in the absence of age
attraction, but in 2001 it was above 200 per cent for all ages ending 0 or 5 above 20 years, reaching, for
instance, 750 per cent for age 50 – meaning that there are 7.5 more people aged 50 than people aged 49
or 51 years.
In the case of children, the situation is however far less dramatic than among adults in terms of quality
of age reporting. The population aged exactly 5 years in 2001 represents 105.6 per cent of the average
population aged 4 or 6 years. This demonstrates that the attraction of age 5 is almost negligible. In fact,
2001 data suggest that no major attraction or repulsion effect is visible before age 7. Since we do not
yet have the population distribution by single age for 2011, we are forced to presume a similar pattern
for 2011, with relatively reasonable good quality in age reporting before age 7.2
A different way of assessing the quality of the age data is using other age estimates. One such source
relates to the figures computed by the Population Division of United Nations in their latest 2010
revision of the World Population Prospects (United Nations Population Division 2011). From this
series, we can, for instance, compute the proportion aged 0-6 years by interpolating the five-year age
distribution estimated in 2000 and 2005 by the Population Division. We obtain a proportion of 16.4 per
cent in 2001 according to the Population Division estimates, as against a lower figure of 15.9 per cent
according to the 2001 census tabulations by single year of age. The relative difference between these
estimates and the census figures was therefore less than 3 per cent in 2001. In 2011, the same exercise
leads to a greater difference of 9 per cent between the provisional census figure and the Population
Division estimate for India. Yet, the latter figure is likely to be biased since the Population Division
estimate was prepared before the 2011 provisional results were published.3 We also observe that the
age distribution of population below 7 during both the NFHS-3 survey (in 2005-06) and the DLHS (in
2002-2004) was slightly higher at 15.7 per cent and 15.0 per cent respectively, than the average 2001
and 2011 proportion at 14.5 per cent. These comparisons with United Nations estimates and survey
data suggest an underestimation of the child population by the census that could be of order of up to 5
per cent.
2 The pattern of age attraction among children was almost identical in 2001 compared to the 1991 results. This indicates that the
progress in quality of age reporting during the 2001 census was very slow. 3 The United Nations figures are based on a total population estimate of 1.31 billion in 2010 –100 million inhabitants more than
the provisional results from the census taken a year later.
Fertility at District Level in India: Lessons from the 2011 Census
5
Mortality correction
The child population recorded in 2011 by the census is composed of survivors of births that took place
from 2004 to 2010. It is therefore necessary to form proper estimates of the intensity of infant and child
mortality during that period to compute births by back projection. Assuming that the child population
is correctly estimated by the census, the volume of births during 2004-2010 is equal to the 2011 child
population divided by the survival rate from birth to age 0-6 years.
We need to first assess not only the mortality levels for India, but also for its States and districts,
keeping in mind that child mortality risks may be, for instance, six times higher in Uttar Pradesh than
in Kerala and that inter-district differentials are bound to be as sizeable.4 In view of the fact that no
district-level mortality estimates exist for this period, we have two tasks before us: computing State-
level survival rates during 2004-2010 and estimating the extent of district differentials. Mortality
analysis in India is hardly equipped with better data than fertility estimation in the absence of vital
registration statistics. Note in comparison that the completeness of birth and death registration has
been close to 100 per cent in neighbouring Sri Lanka for the last 20 years, allowing, for instance, child
mortality to be monitored at the district level (Chaudhuri et al., 2006).
We start our analysis from estimates available at the State level. The SRS is probably a better source
than the NFHS-3 for our purpose since it provides annual infant and child mortality figures for the
major States. We therefore use the average mortality below 5 years for the period 2004-2010 for
assessing mortality levels for the larger States. For smaller units without annual mortality estimates,
we use the 2005-07 average. We then convert mortality rates under five into person-years from birth to
age 7. This can be done using model life tables that are most appropriate for the Indian mortality
regime, i.e., the South Asia life tables derived by the United Nations (United Nations, 1982). Mortality
rates are thus converted into State-level survival rates from birth to age 0-6 years, using which we can
transform populations under 7 into births during 2004-2010.
4 This differential refers to the State-level variation in under-five mortality estimated during the NFHS-3 survey round. The
pronounced spatial clustering of infant and child mortality below the State level) has been documented by Singh et al. (2011).

Christophe Z Guilmoto and Irudaya Rajan • Working Paper 30, June 2013
6
Figure 2. Estimation of district-level child survival estimation
Whenever necessary, ratios for new 2011 administrative units have been estimated by averaging
original 2001 districts. It may be noted that most new 2011 districts stem from 2001 districts that have
been bifurcated.5 In such cases, the parameters from the original 2001 districts are simply imputed to
the new 2011 districts. As noted further below, this strategy is far from perfect when 2001 districts
have been precisely bifurcated because of the internal heterogeneity of their constituents (rural/urban,
developed/backward) – since mortality and other rates are very likely to vary within these
heterogeneous districts. When new 2011 districts have been carved from two or more 2001 districts,
we use a ratio obtained by averaging the values of the original districts.
The estimation of district-level survival rates is more demanding, since we have no data at this level
for this period. The DHLS surveys do not provide usable mortality estimates at the district level and
the ongoing Annual Health Survey has covered less than half of India’s districts. We are therefore
compelled to use the estimates of infant mortality derived from the 2001 Census by Irudaya Rajan et
al. (2008). The idea consists in using this source to calculate the relative intensity of infant mortality by
comparing State and district level estimates and then applying similar ratios to the 2004-2010 rates. In
other words, a ratio of relative mortality based on estimated infant mortality in 2001 is computed for
each district (see Figure 2). These differentials are by no means negligible since district-level ratios
vary from 43 per cent to 178 per cent of the respective 2001 State-level mortality estimates.6
This procedure yields finally a series of estimated 2004-2010 births for all districts. Birth rates are then
computed by estimating the average 2004-2010 population in each district.
5 See Census of India (2011b) for details on administrative changes between 2001 and 2011. 6 For instance, in Madhya Pradesh, infant mortality was estimated to be 36 per cent lower in Gwalior than in the State as a
whole, but 25 per cent higher in some districts of the nearby Bundelkhand region. Similarly, Mangalore registered a mortality
level less than half of Karnataka’s value as against districts such as Bellary or Koppal in the Deccan where mortality rates are
40per cent above the State average.
Child survival (by district)
Estimated child survival (by State)
SRS 2004-2010 infant mortality (by State)
UN South Asia life tables
District* mortality variation
2001 infant mortality (by district)

Fertility at District Level in India: Lessons from the 2011 Census
7
From birth to fertility
Crude birth rates (CBRs) are important dimensions of population dynamics since they are the major
determinants of variations in population growth across Indian districts. The other two components of
the local demographic growth equation – viz., death and net migration rates – are not available at this
scale of analysis. Moreover, the volume of births is also affected by several structural features of
regional populations. Populations with distorted sex ratios or with a large proportion of youth will be
characterized, ceteris paribus, by a deficit of women of childbearing age and consequently by lower
birth rates. Demographic structures therefore play a significant role in areas characterized by heavy
in- or out-migration, by skewed sex ratios or by young populations. The average number of children
per woman (or total fertility rates, TFR) is therefore a much better estimate of reproductive behaviour
than CBRs.
The TFRs are computed from age specific fertility rates, which census data does not provide yet. We
will therefore use available age and fertility data to model the impact of population structures on the
fertility-natality ratio in each State and district. The procedure (see Figure 3) is as follows: we first
select from a fixed fertility schedule for each State and apply it to the specific age and sex structure of
each district to compute a theoretical number of births and the corresponding birth rates. We use these
two parameters (fixed fertility and resulting birth rates) to compute a fertility/birth rates ratio at the
district level. This ratio will allow us to finally convert CBRs into TFRs.
The parameters used here stem from different sources. The age schedule of fertility comes from the
age specific fertility rates at the State level based on the SRS series for 2005-09. For smaller units, we
can use only the 2005-07 period. These age-specific fertility rates are then applied to the age and sex
distributions to estimate the number of births and the birth rates.7 Here, we use the age and sex
structure available at the district level from the 2001 census after correction for district changes.
Borrowing age and sex structures from the 2001 census may be questionable in view of the potential
changes in terms of population composition during the previous decade. This is especially true in
districts that have experienced rapid population growth fuelled by migration or for new 2011
administrative units that may have population compositions quite distinct from that in 2001.
However, significant population recomposition or redistribution corresponds probably to less than 20
districts and we can therefore assume that the fertility/birth rates ratios as computed here are the best
available instruments to convert CBRs into TFR levels.
7 The NFHS-3 offers another set of age-specific fertility rates, but we have opted for the SRS rates as they are more recent and
cover more States and Union Territories. However, using different fertility schedules results only in very moderate variations.

Christophe Z Guilmoto and Irudaya Rajan • Working Paper 30, June 2013
8
Figure 3. Estimation of the ratio of birth rates to fertility rates
Consistency checks
Before commenting on the results shown in the Appendix, we first need to check the consistency of
these estimates and compare them to other available sources on fertility in India. Here we use both
State- and district-level fertility estimates. But this systematic verification has compelled us to conduct
a more methodical review of data for one particular region, namely the State of Jammu and Kashmir
where the quality of the 2011 census figures is a source of serious concern. 8
What is the matter with Jammu and Kashmir?
As shown further below, our census-based estimates fall in line with other fertility estimates available
in India since 2005. Yet, we encountered several difficulties regarding district-level estimates from
Jammu and Kashmir and this has led us to re-examine the consistency of the 2011 census results in
this State.
The perplexing census data from Jammu and Kashmir
Provisional census data were published within a month following the 2011 census. So far, the quality
of these data has not been subjected to a thorough statistical review and no result from the post-
enumeration survey has been published. We are therefore encouraged to take census results at face
value. Yet, the provisional census results in Jammu and Kashmir were fairly intriguing for at least
three reasons and this could have alerted demographers of the possibility of serious data issues:
1. The census-based population growth rate of 21.5 per cent during 2001-11 was significantly higher
in Jammu and Kashmir than the SRS-based rates of natural increase (birth rates minus death rates)
of 14.0 per cent
8 We have benefited notably from exchanges with Bashir Ahmad, Kamala Visweswaram and PM Kulkarni on this issue.
CBR/TFR ratio (by district)
Simulated CBR (by district*)
2001 age distribution of women aged 15-49
(by district)
NFHS-3 fertility schedule (by State)
Assumed TFR (by district)

Fertility at District Level in India: Lessons from the 2011 Census
9
2. The proportion of population below 7 increased from 14.6per cent to 16.0per cent in Jammu and
Kashmir, whereas it decreased significantly everywhere else in India during 2001-11.
3. The child sex ratio decreased considerably from 941 to 859 girls per 1000 boys under 7, by far the
largest decline observed among the States between 2001 and 2011.
The first anomaly was hardly acknowledged by any observer even if the difference between the
census-based decadal population growth and the corresponding SRS estimate was more than 7 per
cent. Census figures tend to inspire more trust than vital rates derived from regional SRS samples. For
instance, the observed population growth in 2001-2011 was also unexpectedly high in Tamil Nadu
compared to SRS-based estimates of the natural increase, but the gap between demographic growth
and natural increase was simply ascribed to immigration to Tamil Nadu.9 A similar logic would imply
massive immigration in Jammu and Kashmir during 2001-2011, but that seems quite implausible in a
period otherwise characterized by prolonged political disturbances. A sudden rise in fertility would
be another hypothesis, which will be explored below. But if we trust SRS trends, an equally logical
explanation for this elevated intercensal growth would be a 2001 census underestimation or a 2011
census overcount.
The second anomaly relates to the unexpected rise in the proportion of the child population in Jammu
and Kashmir, which became the third largest among the States and Union territories in 2011. This was
noted by the Census of India (2011.a), but no comment was offered. Such a rise in the proportion of
young population can only stem for a rebound of fertility rates in Jammu and Kashmir. Yet, no other
fertility estimate confirms any downturn in fertility decline in the State (discussed below in more
detail). Another possible explanation for this discrepancy could be an inflated child population during
the 2011 census, or on the contrary, a serious understatement of the population aged 7 years or more
in 2001.
The third anomaly is the sudden plunge in child sex ratios. Many in the State opined at once that
prenatal sex selection had suddenly shot up in Jammu and Kashmir and this hypothesis received a
large echo in the regional, national and international press, encouraging activists to focus on the “new
evil of gender discrimination”. Yet, this decrease in sex ratio is contradictory to that obtained from
other sources. While rather low in the mid-2000s, SRB levels did increase in Jammu and Kashmir from
838 in 2004-06 to 873 in 2008-10 according to the SRS estimates. The neighbouring States of Punjab or
Haryana had also recorded higher birth masculinity during the same period. Birth registration data
from Jammu and Kashmir also pointed to SRB levels of around 900 in 2007, significantly higher than
the census-based sex ratio of the 0-6 year population (859). The SRS estimates for the population aged
less than 5 years are also higher, since they averaged 889 in 2004-2010 without any discernible
declining trend. However, there is no obvious technical explanation for this significant decline in child
sex ratio except a sudden change in sex-selective underenumeration.
Child population and fertility estimates
The second abnormality noted earlier – the apparent rise in the proportion of the child population
between 2001 and 2011 – has a direct bearing on our estimates for Jammu and Kashmir. Any rise in
the child population translates mechanically into a parallel rise in CBR and TFR estimates at both the
district and State levels. Our estimated TFR level of 3.7 children per woman derived from the census
age distribution in Jammu and Kashmir is one of the highest in the country and represents a
9 See Navaneetham and Dharmalingam (2011). For Tamil Nadu, this corresponds to a net migration influx of about 3-4 million
people during 2001-11 (Kulkarni 2011).

Christophe Z Guilmoto and Irudaya Rajan • Working Paper 30, June 2013
10
significant increase from the 3.0 estimate of ten years earlier. The recent estimates of fertility in Jammu
and Kashmir point, on the contrary, to a gradual decline in TFR levels in Jammu and Kashmir,
reaching respectively 2.4 children per woman in the NFHS-3 survey and an average of 2.25 for the six
annual SRS estimates from 2004 to 2009. As a matter of fact, the latest SRS estimate for Jammu and
Kashmir puts fertility at 2.0 children per woman in 2010, signalling a continual decline in fertility rates
in the State.
The gap between our census-based fertility estimate and other figures for the State amounts therefore
to at least 1.4 children per woman (more than 60 per cent in relative terms). Our district-level
estimates for Jammu and Kashmir further show that fertility level is supposed to have increased
during 2001-2011 in almost all districts. This again conflicts with what we know of regional trends,
characterized by a regular decline in fertility levels in Jammu and Kashmir according to the SRS
annual series. However, we also observe that the three districts in which fertility had in fact decreased
at almost the same pace as elsewhere in India were Kathua, Jammu and Samba. These are three
adjacent districts are located in the extreme south of the Jammu region and notably characterized by
the lowest proportion of Muslim population in the State (below 10 per cent in all the districts).10
We should add here that the most spectacular decline in child sex ratios from 2001 to 2011 have been
also recorded in the districts of the Kashmir Valley such as Pulwama (-210 girls per 1000 boys),
Budgam (-172), Kupwara (-167), or Ganderbal (-151). On the contrary, the child sex ratio has remained
almost stable between 2001 and 2011 in the three districts of Kathua, Jammu and Samba which are
distinguished by normal fertility trends,
At this point, we should depart from statistics and come back to the real world. Wild rumours started
to circulate long before the final operations of the 2011 census were held in Jammu and Kashmir. It
was held that there was a plan to exaggerate the share of the Jammu region within the State by
inflating census results in Jammu by, for instance, counting migrants and non-residents. At a time
coinciding with the start of the house listing operations in May 2010, Syed Ali Shah Geelani spoke
about “a planned conspiracy to change the Muslim majority of the state” through the census. 11 This
obviously did not happen since the population growth was lowest in Jammu. But this rumour may
also have, on the contrary, encouraged people in the rest of the State to react.
Child population overcount
We already mentioned several hypotheses accounting for these census anomalies. One of them would
be a severe underestimation of the population in 2001, in part due to the census boycott supported by
Kashmiri separatists.12 But any such undercount does not explain the rise in child population, unless
all fertility levels and trends from 2001 to 2010 given by the SRS are equally wrong. The other
hypothesis of a real rise in fertility during the last decade is also contradicted by all available fertility
measurement available from the SRS and from the NFHS. We are left with a third scenario,
10 Figures are taken from the 2001 census. The overall Muslim population in the State was 67per cent. 11 A few days earlier, he had stressed that the "Although the census is no alternative to self-determination, the local government
employees must discharge their duties honestly to defeat the RSS-BJP designs to change the demography of Jammu and
Kashmir". See “J&K skeptical about Census, senses ‘conspiracy’”, The Asian Age, 18 May 2010; IANS 13 May 2010. 12 See Peerzada Arshad Hamid, “Counting Kashmiris” in Himal, April 2011.

Fertility at District Level in India: Lessons from the 2011 Census
11
corresponding to an unusual population overestimation in 2011.13 Let us now examine this hypothesis
in greater detail.
According to the scenario emerging from our observations, the apparent surplus in demographic
growth and fertility rates could have proceeded instead from a deliberate over-reporting of children in
Jammu and Kashmir. The fear of a census conspiracy to inflate Jammu’s population could have
induced people in the rest of the State, especially in the Kashmir Valley, to overstate their own
household population by adding non-existent children. In this hypothesis, many people in the
Kashmir region would have resorted to a systematic exaggeration of their household population in
order to boost the overall share of this region within Jammu and Kashmir. Adding non-existent
children to one’s family is probably the easiest procedure to inflate a population total during the
census, since there are far less columns to fill up in the questionnaire. Most variables for children such
as mother tongue, occupation, education, or migration status can be quickly entered in the census
schedule as 0, or duplicated from the mother’s response. Incidentally, sex ratio levels suggest that in
trying to inflate their child population, many households seem to have invented boys rather than girls
– as if reporting non-existent boys was easier or more spontaneous.
Additional effort and data would be needed to confirm this wide over-reporting and to understand its
demographic impact and exact motives. While the regional Government has already challenged the
veracity of the census figures14, its only concern relates to the child sex ratio rather than the entire
child population in Kashmir. We have moreover no guarantee that this systematic overcount has not
affected older age groups as well. Yet, the scale of this exaggeration brings with it an uncomfortable
implication, namely that the active cooperation or initiative of local enumerators in the process of
census manipulation cannot be ruled out. The proportion of non-existent children entered in the
census may be as much as 60 per cent of the expected number of children if we follow SRS fertility
estimates. It is difficult to believe that census personnel could have failed entirely to detect these
systematic misstatements, especially for preschool age children who are usually at home during the
visit of the census enumerators.
Demographers will be able confirm the true level of population overstatement during the 2011 census
only after the publication of data on the detailed age and sex structure. However, a few preliminary
conclusions may be drawn from our finding. Since it is most likely that the published figures reflect a
severe exaggeration of the real child population, fertility rates derived from the child population in
Jammu and Kashmir are gross over-estimates. There is little to be done with such inconsistent and
unreliable figures. In addition, the dramatic decline in child sex ratio in Jammu and Kashmir is most
probably an additional casualty of these manipulations. The efforts to track prenatal sex selection in
Jammu and Kashmir may be simply misplaced and should be redirected to States where the situation
is more likely to have significantly deteriorated – like Maharashtra or Rajasthan. A further implication
concerns the impact on the decennial population growth rate. After correction for the fertility
overstatement, an alternative 2011 population total would in fact be in the range of 11.75 million – as
against the published provisional total of 12.55.15 The decennial population growth rate would be
reduced from the published figure of 23.7 per cent to an estimated growth rate of 16.2 per cent – a
13 Dr. Bashir Ahmad Bhat (Population Research Centre, Srinagar) is the first scholar to raise the possibility of a census over-
count in May 2011. See his “Where have they gone? Searching Missing Girls in Jammu and Kashmir”, Greater Kashmir, 12 May
2011. 14 See Muddasir Ali “Govt ‘challenges’ Census figures. Orders Fresh Survey Of Births During Past 5 Years”, Greater Kashmir, 3
May 2011. 15 This alternative population figure is obtained by reducing the child population below 7 years according an assumed fertility
level of 2.3 children per woman.
Christophe Z Guilmoto and Irudaya Rajan • Working Paper 30, June 2013
12
value significantly closer to the SRS-estimated natural rate of increase of 14.0 per cent from 2001 to
2010.16 Since the inflation in population numbers during the census has apparently been concentrated
among the Muslim population as seems to have been the case, we may also expect a jump in the
proportion of the Muslims in the State according to the official census returns. This increase may
artificially raise the proportion of Muslims from 67 per cent in 2001 to about 70 per cent of the State
population in 2011, a bogus trend likely to launch another futile round of controversies about religious
demographic differentials in Jammu and Kashmir and in India.17 We finally add that the countrywide
fertility estimate is only marginally affected by the removal of Jammu and Kashmir districts from our
estimate since the State accounts only for 1 per cent of India’s total population and its presumed TFR
level, according to the SRS or NFHS figures, is very close to the national average.
In view of the aforementioned difficulties and the doubt over the quality of census data, we have
decided to exclude Jammu and Kashmir from the purview of our estimation exercise. We do not want
to circulate any potentially misleading fertility estimates related to Jammu and Kashmir in view of the
data issues exposed here. Neither do we wish to feed pointless discussion about an alleged fertility
rise in Jammu and Kashmir. Biased estimates of child sex ratio levels from the 2011 census in Jammu
and Kashmir have already polluted the debate on prenatal sex selection and we want to warn census
data users against any unqualified use of the population figures for the State. We have, however,
retained in our results the three districts in which fertility appear to be reasonably well estimated,
namely, Jammu, Kathua and Samba.
Census-based and other fertility estimates
The previous discussion focused on issues related to 2011 census data for Jammu and Kashmir. We
have also checked the reliability of our fertility estimates for the rest of India. The first validity check
consists in comparing them with the annual TFR estimates from the SRS. Figure 4 plots our census-
based estimates against SRS estimates for large States, for which annual SRS estimates are based on
larger samples. This comparison demonstrates the very high consistency level at the State level
between our TFR estimates and the SRS measurements in these “large States”. The correlation
coefficient (r²) is as high as 0.95 for these 19 States. There significant variations for some States – such
as Bihar – but the agreement between the two series is obviously very strong.
Including all the 34 regional units for which SRS provides TFR estimates leads to a weaker, but still
highly significant correlation (r²=0.76). For smaller States and Union Territories, the correspondence
between both sources appears far less convincing although it is difficult to identify the origin of the
gap between the two series. The largest variation between both sets of TFR estimates correspond to
the North-eastern States from Meghalaya to Tripura where census-based estimates are consistently
higher than SRS values. The limited sample size for some smaller regional units tends to affect the
quality of SRS figures, but the quality of our own census-based estimates may also be more fragile in
smaller States.18 We applied the same comparison procedure to the earlier fertility estimates from the
16 The overall impact of this demographic overcount of India’s population total remains modest since Jammu and Kashmir
accounts for 1 per cent of India’s population. 17 Incidentally, a previous controversy had engulfed the Census of India in 2004 when unadjusted religious figures exaggerated
the Muslim population growth in India… because they forgot to control for the absence of the census in Jammu and Kashmir in
1991. See Bhagat (2004). 18 In 2007, the SRS sample covered populations smaller than 40,000 people in States such as Arunachal Pradesh, Meghalaya or
Mizoram. Comparatively, the sample ranged in bigger States from one to six lakhs.

Fertility at District Level in India: Lessons from the 2011 Census
13
NFHS-3 round, which are available for 28 States. The correlation coefficient is again very significant
(r²=.86), but even higher when the analysis is restricted to the larger States.
Figure 4. Fertility estimates for larger States, Census (2004-10) vs. SRS (2005-09)
Our 2011 TFR estimates can also be juxtaposed with the estimates derived from the 2001 census at the
district level, after the necessary correction for changes in the administrative geography. Here, we use
our own district-level fertility estimates published ten years ago (Guilmoto and Rajan 2002). Since
fertility decline is not uniform across the country, we use a logarithmic regression rather than a linear
model.19 The correlation analysis demonstrates a very strong relationship between the 2001 and 2011
estimates at the district level, with r²=.91. There are still 25 districts where fertility appears to have
increased during the last ten years, a rather unexpected result in a country that has recorded a
sustained fertility decline in 2001-2011. We cannot examine all such odd cases, but the two extreme
examples described below may reflect the kind of issues encountered in our estimation procedure. In
the district of Mewat (Haryana) formed in 2005, fertility has seemingly risen by more than one child
per women during the period 2001-2011. However, the 2001 estimate relates to the district’s original
components in 2001 (viz., Gurgaon and Faridabad). There is nothing surprising in this case since the
new district was precisely carved out of two highly urbanized districts of Haryana adjacent to Delhi to
isolate the far less developed rural areas of Mewat, mainly populated by the underprivileged Muslim
Meo community –among whom we can indeed expect fertility to be far higher than among the middle
19 Low-fertility areas in South India have, for instance, recorded slower fertility decline during 2001-2011 than other districts.
The linear regression used here is based on the logarithm of fertility estimates rather than on original fertility estimates.
y = 0,961x + 0,0744R² = 0,9489
1,5
2,0
2,5
3,0
3,5
4,0
4,5
1,5 2,0 2,5 3,0 3,5 4,0 4,5
SRS
(20
05
-09
)
Census (2004-2011)

Christophe Z Guilmoto and Irudaya Rajan • Working Paper 30, June 2013
14
classes living in Gurgaon or Faridabad.20 Kurung Kumey (Arunachal Pradesh) is the only other
district in the country where fertility appears to have increased by one child per woman during 2001-
2011 and is again a new district unit. It is composed of the least developed circles in the northwestern
part of the original Lower Subansiri district – from which it was carved out in 2001. In addition, the
size of the district’s population makes our procedure less reliable since Kurung Kumey has one of the
lowest district population (and density) found in India.21 These two examples probably summarize
some of the comparison issues we may face when assessing the recent change in fertility levels. This
should encourage us to take due account of intercensal redistricting and of the overall population size
of districts in many parts of India when discussing the quality of census-based estimates and
decennial trends.
A final test is conducted using the recently published district-level data from the Annual Health
Survey (AHS). The first AHS round was conducted in 284 districts of 9 States in 2010-11 and it
provides, for the first time, a set of detailed demographic indicators at the district level. From this
source, we now have district-level crude birth rates, though TFR estimates are not available. After
adjusting for district changes, we have once again regressed these CBR estimates against our census-
based CBR estimates. Results are unfortunately rather disappointing since the correlation coefficient
(r²) between the two series of CBR estimates is only 0.49 for the 281 comparable districts. A closer look
at these two series indicates that discrepancies are modest at the State level. But when crude birth
rates are compared at the district level, the relative variations in the estimated CBR values between
these two sources are often sizeable, ranging from -32 per cent to +36 per cent. All this reflects serious
discrepancies between census- and AHS-based estimates. Since we have previously observed a
relatively high level of correspondence between our census-based estimates and others sources, the
source of the observed discrepancy may therefore point to potential quality issues for the AHS figures
at the district level. In this regard, a similar regression between census-based child sex ratios from
both sources (2011 census estimates and AHS) yield similarly mediocre results, with a coefficient
correlation (r²) of 0.53. A proper assessment of the quality of the AHS statistics would however require
a more in-depth analysis based on detailed results from the Annual Health Survey.
Fertility differentials and trends
Fertility according to our estimates had reached 2.66 children during the seven years preceding the
2011 census. This figure is very close to the corresponding SRS TFR average of 2.72 for 2005-2009. It is
also almost similar to the projected value of 2.65 for 2006-10 in 2002 by Mari Bhat (Bhat 2009).
However, regional differentials are still extremely important. Fertility does vary today from 1 to 3
within India. India’s fertility trend is the composite product of distinct regional fertility trajectories,
ranging from early decliners like South Kerala and West Tamil Nadu to latecomers like North Bihar
and West Rajasthan. We offer here a brief analysis of our results, stressing the regional diversity and
the overall slow rate of fertility decline as seen from an Asian perspective.
20 On Mewat’s disadvantaged socioeconomic situation, see IHD (2008). Conversely, Gurgaon district has now the highest
Internet penetration in the country according to 2011 figures. 21 The population below 7 years recorded in Kurung Kumey was 15,540 children in 2011. On Kurung Kumey’s
sociodemographic characteristics, see also IIPS (2010).

Fertility at District Level in India: Lessons from the 2011 Census
15
A complex map of fertility variations in India
On the one hand, fertility has gone below the replacement level of 2.1 children per woman in no less
than 12 States and Union Territories in the country (see Table 1). In terms of districts, 174 out of 621
have today fertility levels below 2.1, accounting for 28 per cent of all Indian districts. The vast majority
of them are located in the five Southern States and Union Territories and in the North-western States
of Punjab and Himachal Pradesh. East India is represented by West Bengal, where almost half of
districts in West Bengal fall into the below-replacement category, as well as Odisha and Tripura. West
India consists mostly of Maharashtra and Goa, with less than 10 per cent of districts in Gujarat
reporting TFR level below 2.1.
But as State-level results indicate, a few regions such as Kerala, Tamil Nadu or Goa have even
recorded fertility levels close to 1.5 children per woman. A closer look indicates that there are indeed a
small number of districts (24) where fertility averages below 1.5 children per woman according to the
2011 census. The lowest fertility level in India is estimated in Kolkata (1.2), but several other districts
of Kerala, Tamil Nadu and other States also report unusually low fertility levels. Several of them are
big cities like Kolkata, New Delhi, Chennai, Kollam, Mumbai, Thiruvananthapuram, and Coimbatore.
But this list also includes typically rural districts such as Pathanamthitta, Idukki, Alappuzha and
Kottayam in Kerala, Chikmagalur and Hassan in Karnataka, and Kaniyakumari and Namakkal in
Tamil Nadu. This category comes close to the “lowest-low fertility”, a notion referring to cases of
fertility dropping below 1.3 children per woman. This situation has been observed in some highly
developed countries in East Asia (parts of China, South Korea, Japan, Taiwan, etc.) and in Europe
(Germany, Poland, Russia, Italy, Spain, etc.). It may be noted that in these districts, the pace of fertility
decline has slowed down to 0.3 child per woman during 2001-2011 – as against -0.5 in India as a
whole. It is difficult to predict future fertility trends in these areas, but lowest-low fertility is a distinct
possibility in more than a dozen Indian districts by 2020.22
22 For a detailed discussion of TFR trends, see also Haub (2011). See also the analysis of fertility trends in South Asia by Basu
(2009).

Christophe Z Guilmoto and Irudaya Rajan • Working Paper 30, June 2013
16
Table 1. State level estimates of crude birth rates and total fertility rates, 2011 and 2011
State CBR TFR Change CBR TFR Change
2011 2011 2001 2011 2011 2001
Andaman & Nicobar 15.7 1.68 2.32 -0.6 Lakshadweep 16.6 2.06 2.69 -0.6
Andhra Pradesh 16.2 1.79 2.31 -0.5 Madhya Pradesh 24.3 3.17 3.86 -0.7
Arunachal Pradesh 23.7 3.29 3.92 -0.6 Maharashtra 17.9 2.16 2.56 -0.4
Assam 23.7 2.89 3.19 -0.3 Manipur 20.0 2.48 2.59 -0.1
Bihar 29.7 4.24 4.54 -0.3 Meghalaya 31.3 4.34 4.45 -0.1
Chandigarh 17.4 1.99 2.25 -0.3 Mizoram 24.1 2.90 3.36 -0.5
Chhatisgarh 23.2 2.96 3.60 -0.6 Nagaland 21.1 2.82 3.16 -0.3
Dadra & Nagar Haveli 25.1 3.07 3.61 -0.5 Odisha 19.7 2.36 2.82 -0.5
Daman & Diu 18.3 2.14 2.48 -0.3 Puducherry 16.4 1.66 1.82 -0.2
Delhi 18.7 2.21 2.62 -0.4 Punjab 16.7 2.05 2.42 -0.4
Goa 14.3 1.54 1.79 -0.2 Rajasthan 25.4 3.42 4.22 -0.8
Gujarat 20.1 2.38 2.57 -0.2 Sikkim 15.5 1.87 3.03 -1.2
Haryana 21.2 2.66 3.22 -0.6 Tamil Nadu 14.9 1.62 1.85 -0.2
Himachal Pradesh 17.6 1.99 2.39 -0.4 Tripura 18.9 2.21 2.48 -0.3
Jammu & Kashmir 2.98 Uttar Pradesh 24.8 3.59 4.36 -0.8
Jharkhand 25.8 3.48 4.07 -0.6 Uttarakhand 21.0 2.58 3.63 -1.0
Karnataka 17.8 2.04 2.40 -0.4 West Bengal 17.3 2.02 2.62 -0.6
Kerala 14.7 1.58 1.70 -0.1 INDIA 21.2 2.66 3.16 -0.5
TFR= total fertility rates in children per woman
CBR= Crude birth rates in per 1000 population
2001 figures derived from Guilmoto and Rajan (2012)
On the other hand, Bihar and Meghalaya are the only States where average fertility still stands at
above four children per women. In four isolated districts of the latter State, estimated fertility levels
are even higher than five children per women. These are States where fertility decline appears to have
been rather modest during the previous decade. But as usual, these State-level means tend to conceal
the large amount of intra-regional heterogeneity. The number of districts with fertility estimates above
4 is more numerous (72), and are scattered across many other regions in the country. Apart from Bihar
and the Northeastern States, several of these high-fertility districts are located in West Rajasthan,
Madhya Pradesh, Uttar Pradesh and Jharkhand. We recognize here the contours of the high-fertility
area of North-Central India, extending from the Indo-Gangetic plains to drier areas of the Deccan
Plateau. Unsurprisingly, fertility decline has been slightly slower than average over the past ten years
in these 72 districts.
The largest number of States and districts lie between these two extremes, with fertility ranging from
replacement level to four children per woman. These are also the areas where fertility decline has
proceeded at a faster pace during the intercensal period (-0.6 child in ten years). Unlike Bihar, several
“Empowered Action Group” States such as Rajasthan, Uttar Pradesh and Madhya Pradesh emerge as
States with the fastest speed of fertility decline during the previous decade. But this intermediary
category is a mixed combination of districts. On one side, it includes districts where women will very
soon have, or already have in 2012, less than 2.1 children on average in view of the speed of their
recent fertility decline. Among these are several advanced districts in the otherwise lagging States
such as Assam, Uttar Pradesh, Madhya Pradesh or Chhatisgarh. In particular, we notice distinct urban

Fertility at District Level in India: Lessons from the 2011 Census
17
effects at work in areas such as Durg, Bhopal, Indore, Lucknow or Kanpur where the fertility level
was below 2.5 on the eve of the 2011 census. On the other side, we also find a large number of districts
with higher than average fertility levels and where below-replacement levels are unlikely to be
attained within the next ten years in spite of the real progress achieved during the last decade.
Is there a “Hindu rate of fertility decline”?
A more general observation relates to the moderate momentum of fertility decline across Indian
districts. According to our estimates, only 6 per cent of all districts have recorded a reduction of more
than one child per woman within the intercensal period. While it is auspicious to see that most of
these 37 districts are in States with high fertility average levels such as Madhya Pradesh, Rajasthan,
and especially Uttar Pradesh, it is surprising to find that there has been no acceleration in fertility
decline in India. This does not square with the appreciable rate of social and economic change that has
otherwise characterized India since the end of the 20th century.
Sustained urbanization, rapid progress in education, economic development, and poverty reduction
are distinct features of India’s last decade. Consider, for instance, the tripling of India’s GDP from
2000 to 2010, the decline in female illiteracy from 61 per cent in 1991 to 46 per cent in 2001 and 35 per
cent in 2011, the surprising increase in the proportion of households possessing mobile phones in 2011
(60 per cent), or the regular reduction in the share of the population below the poverty line since the
1990s. These obvious achievements seem to have no parallel with the fertility trends. In fact, when
seen from a historical perspective, fertility reduction seems to be more determined by its date of
inception than by the rate of its decline as noted earlier (Guilmoto and Rajan 2001; Bhat 2009). States
where fertility started to decrease earlier, as in South India, are still those in which fertility level is the
lowest. The geography of fertility has remained roughly the same, and little seems to have taken place
by way of regional convergence.
To view Indian fertility trends from a larger perspective, we compare them with trends observed
elsewhere in Asia. We use the fertility estimates brought out by the Population Division of the United
Nations to compare the fertility levels since 1960 with selected countries in South, Southeast and East
Asia.23 Trends are difficult to compare because of variations across countries in terms of 1) date of
inception of fertility decline, and 2) fertility level at this date. For instance, the inception of fertility
decline can be dated to 1960 in Sri Lanka and South Korea, 1965 in Malaysia, 1970 in India, China and
Thailand, 1975 in Indonesia, Myanmar (Burma, Uzbekistan and Indonesia, 1980 in Bangladesh, 1985 in
Iran and Nepal, and 1990 in Pakistan. 24 Similarly, pretransitionnal fertility levels ranged from 5.3 to
7.1 children per woman.25 To standardize the series, we have therefore plotted the trends in terms of 1)
years since the start of sustained fertility decline, and 2) overall fertility reduction since the start of the
decline.
23 We retained only countries of more than 10 million inhabitants and without early fertility decline. 24 The start of a sustained fertility decline is defined as the five-year period in 1950-2010 during which fertility levels decreased
by at least 5 per cent during two successive five-year periods We have removed Cambodia ( for its erratic trends during the
1970s) and Afghanistan (for its very recent TFR decline) from the list. 25 In fact, there is no discernible relation between the pace of fertility decline and any other characteristic such as the subregion
in Asia, the date of inception of fertility decline, or the fertility level at that period, the political regime, or the religious
composition of the population.

Christophe Z Guilmoto and Irudaya Rajan • Working Paper 30, June 2013
18
Figure 5. Fertility reduction since the onset of fertility decline in selected Asian countries, computed from
United Nations estimates for 1960-2010
The chart in Figure 5 represents the reduction in TFR since the five-year period preceding fertility
decline. It is seen, for instance, that fertility decreased by three children in China during the first ten
years following the onset of fertility decline, but this decline took forty years to happen in India.
Figure 5 confirms the rather slow profile of India’s fertility trajectory over the last 40 years. 26 We first
note that the Indian fertility curve is almost a perfect straight line, corresponding to a TFR decline of
0.74 children per women every ten years since 1970. There is only a slight deceleration during the last
decade, which corresponds to the low-fertility plateau in South India and elsewhere. In most countries
where fertility has declined for more than 30 years such as China, South Korea or Vietnam, fertility
has already stopped decreasing. Yet, the most obvious feature of fertility decline in India illustrated by
this comparative analysis is that fertility has diminished faster everywhere else in Asia than in India.
India’s fertility trajectory stands clearly apart from trends observed, for instance, in South Korea,
Vietnam, Iran, Thailand, Bangladesh, or China. Over the first three decades following the inception of
fertility transition, TFR levels in the latter countries is seen to have decreased by at least 1.5 children
26 James stresses that the relative rate of fertility decline in India has recently quickened (2011: 577). We use, on the contrary, a
measure of absolute decline measured in births per woman rather than in percentages.
-6
-5
-4
-3
-2
-1
0
0 10 20 30 40
Cu
mu
late
d f
ert
ility
re
du
ctio
n in
ch
ildre
n p
er
wo
man
Years since the onset of fertility decline
South Korea Uzbekistan
Bangladesh India
Iran Nepal
Pakistan Sri Lanka
Indonesia Malaysia
Myanmar Philippines
Thailand Viet Nam
China

Fertility at District Level in India: Lessons from the 2011 Census
19
more than India. The comparison with other countries also shows India’s fertility decline to be
significantly slower than its neighbours such as Burma, Nepal, Sri Lanka and even Pakistan where the
outset of fertility decline came especially late.
The reduction of fertility in almost all countries except India has proceeded at a pace equal or greater
than one child per decade during the period examined here. In this respect, the only two countries
closest to India in terms of slow fertility decline are Malaysia and the Philippines, and it is interesting
to examine their situation. For one thing, Malaysia is hardly comparable with India, since it became a
pronatalist country during the 1980s (Jones and Leete 2002). Its government started then to de-
emphasize the family planning programme introduced earlier. This explains why the pace of fertility
decline among the ethnic Malay majority has decelerated. As for the Philippines, where fertility
started its decline after 1970 like India, it is one country where fertility decline has consistently fallen
short of expectations (Costello and Casterline 2009). Many factors have been put forward to explain
the rather slow reduction in family size in the Philippines: sluggish economic progresses, opposition
of the Catholic Church to modern contraception, weak family planning campaigns and lukewarm
support to it by political leaders, prohibition of abortion, and insularity and spatial fragmentation.
These are real obstacles to sustained fertility decline in this country, but as readers may easily notice,
none of these conditions applies to India. On the contrary, India’s governments have long supported
family planning efforts. Economic growth in India has been sustained, no organized or political
religious force has opposed modern contraception or family planning campaigns, and abortion has
been legalized for more than 30 years.
These are, of course, superficial comments on far more complex issues that have plagued India’s
demographic modernization since the 1960s when the country first launched its birth planning
campaigns. A complementary analysis of regional trends in India (not reproduced here) suggests that
the pace of fertility decline has not been more rapid even in “success States” such as Kerala, Andhra
Pradesh, Punjab or Odisha where replacement-level is already or almost attained. The examination of
State-level trends always point to rates of fertility decline ranging from -0.5 to -0.8 child per decade,
i.e. rates that are significantly slower that was has been observed in other Asian countries. At both the
national and regional level, trends have therefore been moderate and correspond to what could be
dubbed a typical “Hindu rate of fertility decline”.27
If India’s fertility level still appears moderate compared to levels observed in other developing
countries, it is more due to the early date of inception in the 1960s (its family policy programme was
one of the first in the world) than to the pace of this decline ever since that period. As the international
comparison demonstrates, many countries such as Bangladesh, Vietnam, Uzbekistan, Burma or Iran,
which started their fertility decline at higher TFR levels and later than India, now have lower fertility
rates. The fertility rates of Cambodia and Nepal are also likely to catch up with India’s.
There are many structural checks accounting for the slow diffusion of the small-family norm in the
country. When examined in parallel with the case of the Philippines, several factors can be easily ruled
out. The growth in GDP between 5 and 10 per cent per year observed in India since the mid-1990s
belies, for instance, a strictly economic explanation for the slow reduction of fertility levels. The recent
spurt in economic growth seems to have had no singular influence of fertility trajectories in States
such as Gujarat or Maharashtra. Inversely, local studies can also document the presence of fast fertility
decline without corresponding economic development, as Säävälä (2010) shows for Andhra Pradesh.
Similarly, governments in India have supported family planning more strongly than in the
27 We borrow here from the expression of the “Hindu rate of growth” popularized by the late Raj Krishna.

Christophe Z Guilmoto and Irudaya Rajan • Working Paper 30, June 2013
20
Philippines. Yet, the impact of the excesses committed during the Emergency may, in fact, be blamed
for a brief stalling of fertility decline around 1980 and perhaps, also for long-term political misgivings
from politicians about overt support of family planning. Finally, when compared with the
Archipelago of the Philippines, geography may not be a decisive factor in a country like India with
high population density and where, in spite of inadequate communication infrastructures, most
inhabitants live not far from a town with many modern health facilities.
Family planning campaigns and economic development have therefore had only a limited influence
on fertility reduction. This leaves us with explanations revolving more around the slow change in the
demand for small families than around supply factors related to costs and availability of birth control
methods. Furthermore, this slow fertility decline may not be readily associated with economic
indicators such as poverty rates or average income, but are rather linked to traditional lifestyles and
values cantered on family building and women’s subordination. Alaka Basu (2009) has rightly pointed
out that “South Asian patterns of patriarchy and gender inequality and cultural prescriptions about
the need for women to become wives and mothers” may account for a slower pace of fertility decline
and that sub-replacement fertility in India may not resemble the experience of industrialized
countries. The process of “social modernization” has probably less affected social structures in India
than elsewhere. The rapid transformations affecting its urban middle classes are more representative
of their political strength and media visibility than of their demographic and sociological weight.
In retrospect, the resilience of India’s traditional institutions – a huge resource in times of social,
political and economic upheavals – has indeed offered a formidable resistance to the joint onslaught of
government and market forces. Many government initiatives and other transformations fuelled by
economic growth have in fact contributed to the promotion of the Malthusian norms, directly or
indirectly. But fertility, like other crucial dimensions of social development such as female
employment and literacy levels, has moved very slowly over the last 50 years in spite of the many
economic and social incentives for smaller families. While in many countries, age-old family systems
have given way to new social arrangements centred on nuclear households and supported by the
development of new economic opportunities, the process has taken more time in India. The drive
towards lower fertility has been undoubtedly slowed down by the strength of local social institutions
protecting traditional family systems.
Conclusion
The need for subregional monitoring of fertility trends has not changed since our previous analysis in
2002. Neither has the situation of civil registration in India improved during the interval. This is a
disappointing observation in view of the need for birth certificates for school registration and of recent
efforts made to establish a population register and to provide identity cards. To estimate fertility
differentials, we have therefore been obliged to use census data and indirect techniques. The results of
this exercise (see Appendix) appear to be, on the whole, quite reliable as the very strong
correspondence of State-level TFR levels with other sources of fertility estimates suggest. Its major
outcome is an in-depth picture of fertility trends at the district-level.
If sustained, the current rate of fertility decline in India should bring the national TFR average down
to replacement-level before the end of the decade. This corresponds to the TFR projected by Bhat
(2009), but it points to a faster rate of decline than foreseen by the Population Division of the United
Nations. Our estimates also confirm the overall slow decline of fertility across India, where many
districts witnessed, during the intercensal period, a decrease in TFR levels greater than one child per

Fertility at District Level in India: Lessons from the 2011 Census
21
woman. This slow decline stands in opposition with historical trends observed elsewhere in Asia since
the 1960s, where TFRs have usually diminished at a significantly faster rhythm. Neighbouring
countries with higher fertility rates such as Pakistan, Nepal or even Afghanistan have reported during
the last ten years a fertility decline faster than India’s.28 Fertility rates in Bangladesh, Sri Lanka, Bhutan
and the Maldives are already below India’s. This Indian specificity may be partly a consequence of
India’s diversity, since the decline in one region may not coincide with the decline in other regions.
Yet, even when fertility trajectories are examined at the State level, swift TFR decreases have remained
uncommon. It may also be emphasized that while the impact of demographic change on economic
growth is regularly stressed (James 2011, Bloom 2011), the experience of the last twenty years suggests
that the reverse influence of economic development on fertility decline – a central tenet of the original
theory of demographic transition – appears minimal in India.
Along the way, fertility estimation has also allowed us to spot us a major unanticipated discrepancy in
2001 census figures, namely, the most probable over-enumeration of the child population in Jammu
and Kashmir. This is not a common feature of censuses since quality issues usually relate to
underenumeration of specific groups (male migrants, minorities, homeless in cities, etc.) or to well-
known response biases such as age misstatement. Population over-enumeration is a less common
phenomenon and quite difficult to confirm in countries with no reliable civil registration system.
Many observers could wrongly infer from the rising proportions of the child population that fertility
has indeed increased in Jammu and Kashmir over the last ten years. But thanks to the SRS statistics,
the various inconsistencies of the census results in this State could be detected. For want of
disaggregated age and sex series, we have been unable to probe the adult population. But it is
perfectly possible that population above age 7 may also have been affected by over-reporting. This is
unlikely to be as severe as for the child population since the gap in Jammu and Kashmir between the
corrected population growth rate in 2001-11 (16.2 per cent) and the corresponding SRS-based rates of
natural increase (14.0 per cent) appears comparable to what could be observed in other States. Even if
this persisting difference between corrected census rates and SRS figures could be entirely ascribed to
exaggeration of the population above age 7, this would lead to an over-enumeration of about two
lakhs in this population. This represents an over-enumeration rate of 2 per cent for the population age
7 or more, a level far less catastrophic for demographic estimation than the possible exaggeration of
the child population mentioned here.
Another lesson drawn from this exercise is that statisticians and demographers should remain vigilant
and always question data before using them. A thorough review of the quality and consistency of the
data they manipulate remains the best insurance against sociological inanities. Surveys and censuses
are not machine-based operations beyond human agency. A survey remains a volatile confrontation
between State-sponsored categories and etic concepts, between enumerators equipped with tools that
are presumed all-terrain and context-free and myriads of agents actively promoting their local social
and political agenda through this encounter. Many social issues are at stake during demographic data
collection. The current caste census will, in fact, soon offer its own mishmash of exaggerations,
misstatements and statistical ambiguities. Ever since the so-called Stamp’s law of statistics was put
forward,29 the Indian census has become far more democratic and manipulation is often now more a
28 More evidence on these fertility declines can be found in Demographic and Health Surveys conducted in Afghanistan in 2010,
in Nepal in 2011, and in Pakistan in 2007. 29 The following quotation attributed to Harold Cox refers to India in the 1880s: “when you are a bit older, you will not quote
Indian statistics with that assurance. The Government are very keen on amassing statistics - they collect them, add them, raise
them to the nth power, take the cube root and prepare wonderful diagrams. But what you must never forget is that every one of
these figures comes in the first place from the chowkidar, who just puts down what he damn pleases” (Stamp, 1929: 258–259).
Christophe Z Guilmoto and Irudaya Rajan • Working Paper 30, June 2013
22
political statement than the outcome of statistical incomprehension. In case of discrepancies, it is often
found easier to dismiss statistical data than engage them, leading researchers to either credulously
accept statistics or indiscriminately ignore them. But in spite of a large level of “statistical noise”
typical of Indian data, demographers can still detect trends or irregularities. Data from the 2011 census
and other large-scale surveys will no doubt provide some more illustrations of these anomalies and
this should encourage demographers to practice their skills before other social scientists and data
users attempt to put the data to contribution.
References
Basu, Alaka Malwade, 2009. On The Prospects For Endless Fertility Decline In South Asia, in Completing the
Fertility Transition, Population Bulletin of the United Nations, United Nations, New York, 554-561.
Bhagat, R.B., 2004, “Census 2001 and Religion Data: Fact and Fiction”, Economic and Political Weekly, 25 September,
39, 39, 4292-4294.
Bhat, P. N. Mari, 1996. “Contours of Fertility Decline in India: A District Level Study Based on the 1991 census” in
K Srinivasan (ed.). Population Policy and Reproductive Health. Hindustan Publishing Corporation, New Delhi, 96-
179.
Bhat, P.N. Mari, 2009. India’s Changing Dates with Replacement Fertility: A Review of Recent Fertility Trends
and Future Prospects, in Completing the Fertility Transition, Population Bulletin of the United Nations, United
Nations, New York, 376-391.
Bloom, David E., 2011. Population Dynamics in India and Implications for Economic Growth, PGDA Working Paper
No. 65, Harvard University.
Census of India, 2011a. Provisional Population Totals, Paper 1 of 2011 India, Series-1, Office of the Registrar General
& Census Commissioner, New Delhi.
Census of India, 2011b, Administrative Atlas of India, Office of the Registrar General & Census Commissioner, New
Delhi.
Chaudhury, Raqul, H., Gunasekera, P. et al., 2006, `District-level Variations in Infant Mortality in Sri Lanka: A
Challenge to Achieving the Millennium Development Goals on Child Survival', Regional Health Forum 10(1): 96-
103.
Costello, Marilou, and Casterline, John B., 2009. Fertility decline in the Philippines: Current status, future
prospects. , in Completing the Fertility Transition, Population Bulletin of the United Nations, United Nations, New
York, 479-496.
Dyson, Tim, 2009. On The Future Of Human Fertility In India, in Completing the Fertility Transition, Population
Bulletin of the United Nations, United Nations, New York,392-408
Guilmoto, C. Z. and S. Irudaya Rajan, 2001. «Spatial Patterns of Fertility Change in Indian Districts», Population
and Development Review, 27, 4, 713-738
Guilmoto, C. Z. and S. Irudaya Rajan, 2002. «District Level Estimates of Fertility from India's 2001 Census»,
Economic and Political Weekly, February 16, XXXVII, 7, 665-672.
Guilmoto, C. Z. and S. Irudaya Rajan (eds), 2005. «Fertility transition in South India” Sage Publications, New
Delhi.
Haub, Carl, 2011, Future Fertility Prospects For India, Expert Paper, Population Division, United Nations, New
York.
Institute for Human Development (IHD), 2008. A Baseline Survey of Minority Concentration Districts of India. Mewat
(Haryana), IHD, New Delhi.

Fertility at District Level in India: Lessons from the 2011 Census
23
International Institute for Population Sciences (IIPS), 2010. District Level Household and Facility Survey (DLHS-3),
2007-08:India. Arunachal Pradesh. Mumbai: IIPS.
Irudaya Rajan, S., et al., 2008. Infant and Child Mortality in India: District Level Estimates, Population Foundation of
India. New Delhi
James, K. S., 2011. “India's Demographic Change: Opportunities and Challenges”, Science, 333, 576-580.
Jones, G. and Leete, R. 2002. “Asia’s Family Planning Programs as Low Fertility Is Attained” Studies in Family
Planning, 33: 114–126.
Kulkarni, P. M. 2011, Deciphering the 2011 Census Results, lecture delivered at the APAC, Chennai.
Navaneetham, K. and A. Dharmalingam, 2011, “Demography and Development: Preliminary Interpretations of
the 2011 Census”, Economic and Political Weekly, April 16, xlvI, 16, 13-17.
Säävälä, Minna, 2010. Below Replacement-Level Fertility in Conditions of Slow Social and Economic
Development: A Review of the Evidence From South India, Finnish Yearbook of Population Research, XLV, 45–66.
Singh, A, et al., 2011. “Infant and Child Mortality in India in the Last Two Decades: A Geospatial Analysis”. PLoS
ONE 6(11): e26856. doi:10.1371/journal.pone.0026856
Stamp, Josiah, 1929. Some Economic Factors in Modern Life. King & Son Ltd, London.
United Nations Population Division, 2011. World population prospects: The 2010 revision, http://esa.un.org/unpd/wpp/index.htm
United Nations. 1982. Model Life Tables for Developing Countries. Department of Economic and Social Affairs,
Population Division, New York.

Christophe Z Guilmoto and Irudaya Rajan • Working Paper 30, June 2013
24
Appendix
Crude birth rates (CBR) and total fertility rates (TFR), Indian districts and States, 2001 and 2011 censuses
Name CBR 2011
TFR 2011
TFR 2001
INDIA 21.2 2.7 3.2
Jammu & Kashmir 3.0
Kathua 20.9 2.8 3.1
Jammu 16.4 2.1 2.7
Samba 18.9 2.5 2.9
Himachal Pradesh 17.6 2.0 2.4
Chamba 21.1 2.6 2.9
Kangra 16.4 1.8 2.2
Lahul & Spiti 13.9 1.7 2.0
Kullu 18.4 2.1 2.6
Mandi 17.3 1.9 2.4
Hamirpur 16.2 1.8 2.2
Una 17.7 2.0 2.5
Bilaspur 17.1 1.9 2.3
Solan 18.4 2.1 2.5
Sirmaur 20.7 2.6 3.1
Shimla 15.9 1.8 2.2
Kinnaur 14.9 1.9
Punjab 16.7 2.1 2.4
Gurdaspur 16.1 2.0 2.4
Kapurthala 15.5 1.9 2.2
Jalandhar 15.1 1.8 2.1
Hoshiarpur 15.8 1.9 2.3
Shahid Bhagat Singh Nagar
14.9 1.9 2.2
Fatehgarh Sahib 15.8 1.9 2.3
Ludhiana 16.4 2.0 2.3
Moga 16.1 2.0 2.4
Firozpur 18.9 2.4 2.8
Muktsar 18.0 2.2 2.6
Faridkot 16.9 2.1 2.4
Bathinda 16.9 2.1 2.4
Mansa 16.8 2.1 2.7
Patiala 17.3 2.1 2.3
Amritsar 16.8 2.1 2.7
Tarn Taran 18.4 2.3 2.7
Rupnagar 15.5 1.9 2.4
Sahibzada Ajit Singh Nagar
18.2 2.2 2.4
Sangrur 16.8 2.1 2.5
Barnala 16.9 2.1 2.5
Chandigarh 17.4 2.0 2.2
Chandigarh 17.4 2.0 2.2
Uttaranchal 21.0 2.6 3.6
Uttarkashi 21.7 2.7 3.6
Chamoli 19.9 2.4 3.0
Rudraprayag 19.4 2.2 3.2
Tehri Garhwal 20.2 2.4 3.2
Dehradun 19.1 2.2 2.6
Garhwal 17.7 2.0 2.8
Pithoragarh 19.7 2.4 3.1
Bageshwar 20.3 2.5 3.3
Almora 18.5 2.3 3.0
Champawat 22.5 2.7 3.8
Nainital 20.9 2.5 3.3
Udham Singh Nagar 22.7 3.0 3.9
Hardwar 24.7 3.3 4.1
Haryana 21.2 2.7 3.2
Panchkula 18.8 2.2 2.8
Ambala 17.0 2.0 2.4
Yamunanagar 18.8 2.3 2.8
Kurukshetra 19.4 2.3 2.7
Kaithal 20.4 2.6 3.1
Karnal 20.9 2.6 3.0
Panipat 22.8 2.9 3.5
Sonipat 20.2 2.7 3.1
Jind 19.9 2.6 3.3
Fatehabad 20.6 2.5 3.2
Sirsa 19.1 2.3 2.9
Hisar 19.4 2.4 3.1
Bhiwani 20.4 2.5 3.3
Rohtak 18.8 2.4 3.0
Jhajjar 19.2 2.4 3.1

Fertility at District Level in India: Lessons from the 2011 Census
25
Mahendragarh 19.2 2.4 3.3
Rewari 20.3 2.5 3.1
Gurgaon 24.5 3.2 4.5
Mewat 38.0 4.9 3.7
Faridabad 22.1 2.8 3.7
Palwal 27.2 3.5 3.7
Delhi 18.7 2.2 2.6
North West 19.7 2.4 2.8
North 17.7 2.1 2.1
North East 21.4 2.6 3.2
East 17.4 2.0 2.5
New Delhi 11.6 1.4 1.9
Central 14.8 1.7 1.9
West 17.7 2.1 2.4
South West 18.7 2.2 2.7
South 18.9 2.2 2.7
Rajasthan 25.4 3.4 4.2
Ganganagar 20.0 2.5 3.4
Hanumangarh 21.0 2.7 3.4
Bikaner 27.2 3.6 4.4
Churu 25.0 3.3 4.2
Jhunjhunun 20.9 2.8 3.8
Alwar 26.1 3.6 4.5
Bharatpur 27.9 4.1 4.9
Dhaulpur 29.9 4.5 5.7
Karauli 27.3 4.1 4.9
Sawai Madhopur 24.6 3.5 4.4
Dausa 26.3 3.7 4.6
Jaipur 22.8 2.9 3.8
Sikar 22.5 3.0 3.9
Nagaur 24.6 3.3 4.2
Jodhpur 26.9 3.7 4.4
Jaisalmer 32.8 4.8 5.8
Barmer 32.7 4.9 5.7
Jalor 29.1 4.1 5.2
Sirohi 27.7 3.8 4.7
Pali 23.7 3.4 4.4
Ajmer 23.9 3.2 3.7
Tonk 23.5 3.2 4.2
Bundi 23.2 3.1 4.0
Bhilwara 24.7 3.3 4.0
Rajsamand 25.2 3.3 3.9
Dungarpur 29.5 3.9 4.5
Banswara 30.9 4.2 4.8
Chittaurgarh 22.6 2.8 3.8
Kota 21.1 2.6 3.5
Baran 24.4 3.3 4.0
Jhalawar 23.9 3.2 4.0
Udaipur 27.6 3.5 4.1
Pratapgarh 29.1 3.8 4.2
Uttar Pradesh 24.8 3.6 4.4
Saharanpur 24.0 3.5 4.0
Muzaffarnagar 24.9 3.7 4.4
Bijnor 24.4 3.6 4.6
Moradabad 26.7 4.0 5.0
Rampur 26.9 4.1 5.1
Jyotiba Phule Nagar 26.4 3.9 4.9
Meerut 22.8 3.3 3.9
Baghpat 23.0 3.5 3.9
Ghaziabad 24.3 3.3 3.9
Gautam Buddha Nagar 26.0 3.6 4.4
Bulandshahr 24.9 3.8 4.4
Aligarh 25.5 3.9 4.5
Mahamaya Nagar 25.7 3.9 4.4
Mathura 25.8 3.9 4.6
Agra 23.9 3.5 3.8
Firozabad 24.8 3.7 4.8
Mainpuri 24.4 3.7 4.4
Budaun 30.1 4.7 5.5
Bareilly 25.2 3.7 4.9
Pilibhit 24.5 3.6 4.9
Shahjahanpur 27.8 4.1 4.8
Kheri 26.9 3.9 4.7
Sitapur 28.0 4.1 4.7
Hardoi 27.8 4.2 4.8
Unnao 22.2 3.3 4.1
Lucknow 18.9 2.5 3.1
Rae Bareli 22.7 3.2 4.3
Farrukhabad 26.0 3.9 4.3
Kannauj 25.2 3.8 4.4
Etawah 23.0 3.4 4.0
Auraiya 23.2 3.5 4.1
Kanpur Dehat 22.2 3.4 4.2
Kanpur Nagar 16.3 2.2 2.6

Christophe Z Guilmoto and Irudaya Rajan • Working Paper 30, June 2013
26
Jalaun 21.6 3.1 3.7
Jhansi 20.4 2.7 3.4
Lalitpur 29.1 4.1 4.9
Hamirpur 21.7 3.3 4.2
Mahoba 23.5 3.4 4.5
Banda 26.9 4.0 4.6
Chitrakoot 29.5 4.4 5.2
Fatehpur 23.6 3.6 4.5
Pratapgarh 22.2 3.1 4.2
Kaushambi 28.1 4.3 4.8
Allahabad 23.8 3.4 4.2
Bara Banki 26.1 3.8 4.7
Faizabad 23.0 3.3 4.0
Ambedkar Nagar 22.2 3.1 4.2
Sultanpur 23.8 3.3 4.4
Bahraich 31.8 4.6 5.2
Shrawasti 31.6 4.5 4.8
Balrampur 31.4 4.7 4.9
Gonda 27.1 3.9 4.7
Siddharthnagar 31.2 4.6 5.1
Basti 24.9 3.6 4.7
Sant Kabir Nagar 26.5 3.9 4.9
Mahrajganj 25.8 3.7 5.0
Gorakhpur 21.6 3.0 4.3
Kushinagar 25.6 3.6 4.7
Deoria 23.3 3.3 4.4
Azamgarh 24.3 3.4 4.5
Mau 24.0 3.4 4.6
Ballia 21.8 3.1 3.8
Jaunpur 23.4 3.3 4.3
Ghazipur 24.1 3.5 4.3
Chandauli 25.6 3.6 4.5
Varanasi 21.3 3.0 4.1
Sant Ravidas Nagar (Bhadohi)
26.1 3.6 4.4
Mirzapur 26.2 3.8 4.7
Sonbhadra 27.9 3.9 4.8
Etah 26.5 4.1 4.9
Kanshiram Nagar 28.8 4.4 4.9
Bihar 29.7 4.2 4.5
Pashchim Champaran 32.2 4.6 5.0
Purba Champaran 32.7 4.7 4.9
Sheohar 32.0 4.7 5.1
Sitamarhi 32.1 4.6 5.1
Madhubani 28.9 4.0 4.3
Supaul 31.8 4.4 4.7
Araria 34.2 4.9 4.9
Kishanganj 34.9 5.2 5.3
Purnia 33.2 4.8 5.0
Katihar 33.3 4.9 5.3
Madhepura 33.6 4.7 4.8
Saharsa 33.0 4.6 4.6
Darbhanga 29.2 4.2 4.5
Muzaffarpur 28.8 4.1 4.6
Gopalganj 27.4 3.9 4.4
Siwan 26.1 3.7 4.6
Saran 27.3 4.0 4.7
Vaishali 28.0 4.1 4.6
Samastipur 30.4 4.4 4.9
Begusarai 29.9 4.3 4.8
Khagaria 34.9 5.1 5.1
Bhagalpur 28.9 4.3 4.5
Banka 29.6 4.2 4.8
Munger 26.4 3.9 4.0
Lakhisarai 30.2 4.3 4.7
Sheikhpura 30.6 4.4 4.7
Nalanda 28.7 4.0 4.2
Patna 25.6 3.5 3.9
Bhojpur 26.5 3.8 4.2
Buxar 27.4 4.0 4.4
Kaimur (Bhabua) 30.3 4.5 4.8
Rohtas 27.1 3.8 4.5
Aurangabad 29.1 4.0 4.3
Gaya 29.0 4.0 4.4
Nawada 27.3 3.8 4.3
Jamui 29.6 4.1 4.5
Jehanabad 28.4 3.9 4.1
Arwal 28.9 3.9 4.1
Sikkim 15.5 1.9 3.0
North District 15.6 2.2 3.4
West District 17.0 2.1 3.5
South District 15.8 1.9 3.4
East District 14.6 1.7 2.5
Arunachal Pradesh 23.7 3.3 3.9

Fertility at District Level in India: Lessons from the 2011 Census
27
Tawang 18.4 2.8 3.8
West Kameng 20.6 2.9 3.4
East Kameng 30.7 4.4 4.4
Papum Pare 22.5 2.7 3.5
Upper Subansiri 23.7 3.5 4.1
West Siang 18.7 2.7 3.8
East Siang 18.7 2.5 3.7
Upper Siang 19.8 3.1 4.0
Changlang 27.0 3.6 4.4
Tirap 26.7 3.9 4.4
Lower Subansiri 21.1 2.9 3.4
Kurung Kumey 34.3 4.7 3.4
Dibang Valley 21.2 3.0 3.9
Lower Dibang Valley 21.7 3.1 3.9
Lohit 25.2 3.5 4.2
Anjaw 24.8 3.5 4.2
Nagaland 21.1 2.8 3.2
Mon 22.7 3.4 3.4
Mokokchung 14.2 1.7 2.0
Zunheboto 20.3 2.8 3.5
Wokha 17.5 2.3 3.2
Dimapur 20.6 2.6 3.3
Phek 25.5 3.4 3.8
Tuensang 26.7 3.7 3.4
Longleng 18.9 2.7 3.4
Kiphire 25.1 3.5 3.4
Kohima 21.0 2.7 3.0
Peren 23.8 3.1 3.0
Manipur 20.0 2.5 2.6
Senapati 20.2 2.6 2.2
Tamenglong 20.4 2.7 2.8
Churachandpur 19.6 2.5 2.5
Bishnupur 18.9 2.4 2.5
Thoubal 24.2 3.1 3.3
Imphal West 17.2 2.0 2.2
Imphal East 20.4 2.5 2.6
Ukhrul 20.0 2.8 3.1
Chandel 17.8 2.1 2.8
Mizoram 24.1 2.9 3.4
Mamit 28.6 3.7 3.3
Kolasib 24.5 3.0 3.4
Aizawl 20.5 2.3 3.0
Champhai 27.2 3.4 3.5
Serchhip 21.9 2.8 3.3
Lunglei 23.6 2.9 3.5
Lawngtlai 30.8 4.0 4.2
Saiha 25.3 3.3 4.0
Tripura 18.9 2.2 2.5
West Tripura 16.5 1.9 2.3
South Tripura 19.3 2.3 2.6
Dhalai 23.0 2.8 2.8
North Tripura 21.9 2.6 2.8
Meghalaya 31.3 4.3 4.5
West Garo Hills 28.5 3.9 4.1
East Garo Hills 30.3 4.1 4.4
South Garo Hills 31.7 4.6 4.6
West Khasi Hills 37.7 5.8 5.5
Ribhoi 33.5 4.8 5.4
East Khasi Hills 27.3 3.5 3.6
Jaintia Hills 37.7 5.6 5.4
Assam 23.7 2.9 3.2
Kokrajhar 23.4 2.9 3.3
Dhubri 31.8 4.1 4.3
Goalpara 27.6 3.5 3.9
Barpeta 27.8 3.6 3.8
Morigaon 28.3 3.6 3.9
Nagaon 26.4 3.3 3.6
Sonitpur 22.5 2.7 3.0
Lakhimpur 23.9 2.8 3.3
Dhemaji 24.1 2.9 3.5
Tinsukia 21.0 2.5 2.9
Dibrugarh 18.2 2.1 2.4
Sivasagar 18.5 2.1 2.4
Jorhat 16.7 1.9 2.2
Golaghat 19.2 2.3 2.7
Karbi Anglong 31.4 3.9 3.7
Dima Hasao 23.8 2.9 3.1
Cachar 23.6 2.9 3.1
Karimganj 28.2 3.7 3.6
Hailakandi 27.9 3.7 3.8
Bongaigaon 26.2 3.3 3.5
Chirang 23.4 2.8 3.2
Kamrup 20.7 2.4 2.6
Kamrup Metropolitan 15.6 1.8 2.6

Christophe Z Guilmoto and Irudaya Rajan • Working Paper 30, June 2013
28
Nalbari 18.9 2.2 2.7
Baksa 19.8 2.4 3.0
Darrang 27.8 3.4 3.4
Udalguri 21.2 2.6 3.2
West Bengal 17.3 2.0 2.6
Darjiling 15.2 1.6 2.1
Jalpaiguri 18.1 2.1 2.8
Koch Bihar 18.6 2.3 3.0
Uttar Dinajpur 24.6 3.2 4.3
Dakshin Dinajpur 17.2 2.1 3.3
Maldah 23.0 2.9 4.0
Murshidabad 22.2 2.7 3.5
Birbhum 19.8 2.3 3.0
Barddhaman 16.0 1.8 2.3
Nadia 15.2 1.7 2.4
North Twenty Four Parganas
13.9 1.6 2.1
Hugli 14.0 1.6 2.0
Bankura 17.4 2.1 2.6
Puruliya 21.0 2.7 3.1
Haora 15.8 1.8 2.1
Kolkata 9.9 1.2 1.4
South Twenty Four Parganas
19.0 2.2 3.0
Paschim Medinipur 17.4 2.0 2.6
Purba Medinipur 17.3 2.0 2.6
Jharkhand 25.8 3.5 4.1
Garhwa 29.5 4.2 5.3
Chatra 30.2 4.3 4.6
Kodarma 29.7 4.0 4.5
Giridih 30.5 4.2 4.7
Deoghar 29.2 4.1 4.5
Godda 29.3 4.0 4.2
Sahibganj 31.3 4.2 4.5
Pakur 32.3 4.3 4.4
Dhanbad 20.9 2.9 3.4
Bokaro 21.6 2.9 3.5
Lohardaga 27.1 3.9 4.6
Purbi Singhbhum 19.5 2.4 2.7
Palamu 27.5 3.9 4.9
Latehar 31.1 4.4 4.9
Hazaribagh 25.7 3.5 4.1
Ramgarh 21.6 3.0 4.1
Dumka 25.8 3.4 3.6
Jamtara 26.1 3.4 3.6
Ranchi 21.5 2.8 3.5
Khunti 25.3 3.3 3.5
Gumla 26.9 3.8 4.0
Simdega 24.5 3.5 4.0
Pashchimi Singhbhum 27.5 3.6 3.5
Saraikela-Kharsawan 23.7 3.1 3.5
Odisha 19.7 2.4 2.8
Bargarh 16.8 2.1 2.5
Jharsuguda 16.9 2.1 2.6
Sambalpur 17.7 2.1 2.6
Debagarh 20.5 2.5 3.1
Sundargarh 19.3 2.3 2.7
Kendujhar 23.1 2.8 3.0
Mayurbhanj 21.4 2.7 3.0
Baleshwar 19.1 2.3 2.9
Bhadrak 18.9 2.3 2.9
Kendrapara 17.0 2.0 2.6
Jagatsinghapur 14.3 1.7 2.3
Cuttack 15.4 1.8 2.4
Jajapur 18.1 2.2 2.6
Dhenkanal 18.1 2.1 2.7
Anugul 18.5 2.2 2.9
Nayagarh 17.2 2.1 2.5
Khordha 16.2 1.9 2.4
Puri 15.8 1.8 2.4
Ganjam 18.4 2.2 2.9
Gajapati 24.1 2.9 3.3
Kandhamal 24.7 3.0 3.6
Baudh 22.6 2.8 3.2
Subarnapur 19.2 2.5 2.8
Balangir 21.2 2.7 2.8
Nuapada 23.1 2.9 3.0
Kalahandi 23.0 2.8 3.2
Rayagada 25.1 2.9 3.3
Nabarangapur 28.6 3.5 3.4
Koraput 26.2 3.0 3.1
Malkangiri 30.0 3.5 3.3
Chhatisgarh 23.2 3.0 3.6
Koriya 22.7 3.0 3.4
Surguja 25.6 3.4 3.9

Fertility at District Level in India: Lessons from the 2011 Census
29
Jashpur 22.7 3.1 3.3
Raigarh 20.9 2.7 3.2
Korba 22.7 2.9 3.5
Janjgir - Champa 21.9 3.1 3.5
Bilaspur 25.5 3.3 3.6
Kabeerdham 30.1 3.9 3.8
Rajnandgaon 22.3 2.8 3.3
Durg 20.5 2.5 2.9
Raipur 24.1 3.0 3.4
Mahasamund 20.7 2.7 3.1
Dhamtari 20.0 2.5 3.3
Uttar Bastar Kanker 20.9 2.6 3.2
Bastar 24.6 3.1 3.5
Narayanpur 26.7 3.3 3.5
Dakshin Bastar Dantewada
23.1 2.8 3.6
Bijapur 25.0 3.0 3.6
Madhya Pradesh 24.3 3.2 3.9
Sheopur 28.1 3.8 4.6
Morena 25.5 3.6 4.2
Bhind 23.6 3.3 4.0
Gwalior 20.5 2.6 3.3
Datia 23.1 3.1 4.0
Shivpuri 28.0 3.8 5.1
Tikamgarh 26.2 3.4 4.5
Chhatarpur 26.7 3.8 5.0
Panna 26.9 3.6 4.7
Sagar 24.8 3.3 4.2
Damoh 25.1 3.3 4.0
Satna 24.8 3.3 4.3
Rewa 24.3 3.2 4.4
Umaria 26.2 3.4 4.0
Neemuch 20.8 2.5 3.3
Mandsaur 21.1 2.6 3.5
Ratlam 24.3 3.1 3.7
Ujjain 22.0 2.8 3.5
Shajapur 23.0 3.0 4.1
Dewas 23.5 3.0 3.8
Dhar 26.9 3.5 4.1
Indore 20.8 2.4 2.9
West Nimar 26.3 3.5 4.3
Barwani 32.8 4.4 5.1
Rajgarh 24.7 3.3 4.2
Vidisha 27.0 3.7 4.5
Bhopal 20.7 2.4 3.0
Sehore 24.9 3.4 4.6
Raisen 25.5 3.5 4.5
Betul 21.5 2.9 3.9
Harda 24.0 3.3 4.2
Hoshangabad 21.4 2.9 3.7
Katni 24.7 3.1 3.6
Jabalpur 19.2 2.3 2.9
Narsimhapur 21.1 2.7 3.5
Dindori 25.5 3.2 3.2
Mandla 22.7 2.9 3.4
Chhindwara 20.9 2.8 3.5
Seoni 21.1 2.7 3.4
Balaghat 20.0 2.5 3.1
Guna 28.0 3.8 4.6
Ashoknagar 27.6 3.7 4.6
Shahdol 24.2 3.1 3.6
Anuppur 22.7 2.9 3.6
Sidhi 28.3 3.9 4.7
Singrauli 29.6 4.0 4.7
Jhabua 35.4 5.0 5.4
Alirajpur 33.4 4.7 5.4
East Nimar 26.2 3.5 3.9
Burhanpur 25.5 2.9 2.9
Gujarat 20.1 2.4 2.6
Kachchh 24.9 3.1
Banas Kantha 26.5 3.3 3.9
Patan 21.8 2.6 3.1
Mahesana 17.7 2.0 2.5
Sabar Kantha 22.6 2.7 2.9
Gandhinagar 18.4 2.0 2.4
Ahmadabad 17.9 2.0 2.3
Surendranagar 21.4 2.7 3.4
Rajkot 17.9 2.1 1.9
Jamnagar 18.4 2.2 2.4
Porbandar 16.8 2.0 2.5
Junagadh 17.2 2.1 2.6
Amreli 17.1 2.2 2.5
Bhavnagar 20.4 2.6 3.0
Anand 18.8 2.2 2.4

Christophe Z Guilmoto and Irudaya Rajan • Working Paper 30, June 2013
30
Kheda 19.5 2.3 2.6
Panch Mahals 23.9 3.1 3.5
Dohad 32.4 4.2 4.3
Vadodara 18.3 2.1 2.4
Narmada 20.7 2.6 2.8
Bharuch 17.5 2.1 2.5
The Dangs 28.5 3.6 3.8
Navsari 15.1 1.8 2.0
Valsad 19.3 2.2 2.5
Surat 19.8 2.2 2.5
Tapi 16.3 1.8 2.5
Daman & Diu 18.3 2.1 2.5
Diu 19.1 2.1 2.9
Daman 18.0 2.2 2.3
Dadra & Nagar Haveli 25.1 3.1 3.6
Dadra & Nagar Haveli 25.1 3.1 3.6
Maharashtra 17.9 2.2 2.6
Nandurbar 22.9 2.9 3.3
Dhule 20.3 2.6 2.7
Jalgaon 19.0 2.4 2.7
Buldana 19.7 2.6 3.0
Akola 17.5 2.2 2.7
Washim 19.4 2.5 3.0
Amravati 16.2 2.0 2.5
Wardha 14.6 1.7 2.3
Nagpur 16.1 1.8 2.2
Bhandara 15.7 1.9 2.4
Gondiya 16.1 1.9 2.5
Gadchiroli 17.0 2.0 2.9
Chandrapur 15.7 1.8 2.4
Yavatmal 18.0 2.2 2.9
Nanded 20.9 2.8 3.3
Hingoli 21.7 2.9 3.4
Parbhani 21.8 3.0 3.3
Jalna 23.1 3.2 3.2
Aurangabad 22.7 2.8 3.1
Nashik 21.1 2.6 3.1
Thane 18.7 2.1 2.6
Mumbai Suburban 14.2 1.6 2.0
Mumbai 12.0 1.4 1.6
Raigarh 17.3 2.0 2.3
Pune 18.2 2.0 2.3
Ahmadnagar 18.2 2.3 2.7
Bid 21.0 3.0 3.2
Latur 19.7 2.6 3.1
Osmanabad 18.5 2.6 3.0
Solapur 18.6 2.4 2.7
Satara 15.4 1.9 2.3
Ratnagiri 13.4 1.6 2.1
Sindhudurg 11.8 1.4 1.8
Kolhapur 15.5 1.8 2.3
Sangli 15.8 1.9 2.3
Andhra Pradesh 16.2 1.8 2.3
Adilabad 17.1 2.0 2.7
Nizamabad 16.5 1.8 2.5
Karimnagar 13.1 1.5 2.2
Medak 18.3 2.2 2.9
Hyderabad 16.0 1.6 1.9
Rangareddy 19.6 2.0 2.6
Mahbubnagar 20.4 2.4 3.1
Nalgonda 16.1 1.8 2.6
Warangal 14.4 1.6 2.5
Khammam 15.0 1.6 2.3
Srikakulam 15.6 1.8 2.4
Vizianagaram 15.9 1.8 2.5
Visakhapatnam 16.1 1.7 2.2
East Godavari 14.7 1.6 2.1
West Godavari 14.2 1.6 2.0
Krishna 13.8 1.5 1.9
Guntur 14.7 1.6 1.9
Prakasam 16.8 1.9 2.3
Sri Potti Sriramulu Nellore
15.3 1.7 2.0
Y.S.R. 17.1 1.9 2.3
Kurnool 19.0 2.2 3.0
Anantapur 16.9 1.9 2.4
Chittoor 16.0 1.8 2.2
Karnataka 17.8 2.0 2.4
Belgaum 19.9 2.4 2.7
Bagalkot 22.4 2.7 3.1
Bijapur 22.6 3.0 3.0
Bidar 20.0 2.7 3.4
Raichur 22.5 2.9 3.3
Koppal 22.8 2.9 3.4

Fertility at District Level in India: Lessons from the 2011 Census
31
Gadag 18.8 2.3 2.6
Dharwad 18.0 2.1 2.5
Uttara Kannada 15.5 1.7 2.2
Haveri 18.6 2.2 2.6
Bellary 22.6 2.7 3.1
Chitradurga 17.0 2.0 2.3
Davanagere 16.6 1.9 2.4
Shimoga 15.4 1.7 2.0
Udupi 12.8 1.2 1.5
Chikmagalur 13.4 1.4 1.9
Tumkur 14.6 1.7 2.2
Bangalore 17.5 1.7 1.9
Mandya 13.7 1.5 1.9
Hassan 13.2 1.5 1.9
Dakshina Kannada 14.8 1.5 1.7
Kodagu 14.1 1.5 2.0
Mysore 15.2 1.7 2.1
Chamarajanagar 14.5 1.6 2.0
Gulbarga 22.1 3.0 3.5
Yadgir 25.9 3.5 3.5
Kolar 16.5 1.9 2.5
Chikkaballapura 15.5 1.8 2.5
Bangalore Rural 16.3 1.9 2.2
Ramanagara 14.3 1.6 2.2
Goa 14.3 1.5 1.8
North Goa 13.7 1.5 1.7
South Goa 15.0 1.6 1.8
Lakshadweep 16.6 2.1 2.7
Lakshadweep 16.6 2.1 2.7
Kerala 14.7 1.6 1.7
Kasaragod 17.1 1.8 1.9
Kannur 15.4 1.6 1.7
Wayanad 16.3 1.7 2.0
Kozhikode 15.6 1.6 1.7
Malappuram 20.4 2.2 2.4
Palakkad 15.3 1.6 1.8
Thrissur 13.7 1.5 1.6
Ernakulam 13.0 1.5 1.5
Idukki 13.0 1.4 1.6
Kottayam 12.4 1.4 1.6
Alappuzha 12.7 1.4 1.5
Pathanamthitta 11.0 1.3 1.5
Kollam 13.2 1.4 1.6
Thiruvananthapuram 12.9 1.4 1.6
Tamil Nadu 14.9 1.6 1.8
Thiruvallur 16.4 1.7 1.9
Chennai 13.6 1.4 1.3
Kancheepuram 16.5 1.7 1.9
Vellore 16.1 1.8 1.9
Tiruvannamalai 16.2 1.9 2.1
Viluppuram 17.2 2.0 2.1
Salem 14.6 1.6 1.9
Namakkal 12.9 1.5 1.7
Erode 12.4 1.4 1.6
The Nilgiris 12.3 1.3 1.6
Dindigul 14.4 1.6 1.8
Karur 14.3 1.6 1.8
Tiruchirappalli 14.4 1.6 1.8
Perambalur 15.5 1.8 2.0
Ariyalur 15.6 1.8 2.1
Cuddalore 15.6 1.7 2.1
Nagapattinam 14.6 1.6 1.9
Thiruvarur 13.7 1.5 1.8
Thanjavur 14.1 1.5 1.8
Pudukkottai 16.0 1.7 2.0
Sivaganga 14.9 1.6 1.9
Madurai 15.0 1.6 1.8
Theni 14.1 1.6 1.8
Virudhunagar 14.6 1.6 1.9
Ramanathapuram 14.7 1.6 2.1
Thoothukkudi 15.0 1.6 1.8
Tirunelveli 15.1 1.7 1.9
Kanniyakumari 13.2 1.4 1.6
Dharmapuri 17.0 1.9 2.6
Krishnagiri 17.3 2.0 2.6
Coimbatore 13.5 1.4 1.7
Tiruppur 14.6 1.6 1.6
Puducherry 16.4 1.7 1.8
Yanam 19.7 2.0 2.5
Puducherry 16.2 1.6 1.8
Mahe 16.7 1.6 1.5
Karaikal 16.7 1.7 1.9
Andaman & Nicobar Islands
15.7 1.7 2.3

Christophe Z Guilmoto and Irudaya Rajan • Working Paper 30, June 2013
32
Nicobars 16.2 1.8 2.2
North & Middle Andaman
16.3 1.7 2.3
South Andaman 15.4 1.6 2.3