Embed Size (px)
Citation preview

European University Institute (EUI, Florence)
Gulf Research Center Foundation (GRCF, Geneva)
Social and Economic Survey Research Institute (SESRI) – Qatar University
Fertility in Qatar and in Other GCC States:
Some Elements of Comparison
Françoise De Bel-Air
Please do not quote, cite or distribute without permission
This publication was made possible by the NPRP award [NPRP 9-190-5-022] from the Qatar National Research Fund (a member of The Qatar Foundation). The statements
made herein are solely the responsibility of the authors.
2
TABLE OF CONTENTS
LIST OF TABLES .................................................................................................... 3
LIST OF FIGURES .................................................................................................. 4
I. INTRODUCTION .............................................................................................. 5
II. GULF FERTILITY DATA .................................................................................. 6
III. FERTILITY PATTERNS AND CHARACTERISTICS .................................. 10
IV. PROXIMATE DETERMINANTS OF FERTILITY ......................................... 16
Marriage patterns and divorce ........................................................................... 16
Birth control ........................................................................................................ 19
V. FERTILITY DIFFERENTIALS ......................................................................... 20
VI. CONCLUSION ............................................................................................ 23
VII. BIBLIOGRAPHIC REFERENCES .............................................................. 24
VIII. APPENDICES ............................................................................................. 25

3
LIST OF TABLES Table II-1: Current characteristics of GCC nationals' fertility: A review of data and indices available in GCC States' publications .......................................................... 8 Table III-1: Total Fertility Rates in GCC countries (children per women, Gulf nationals, 1995-2016) ............................................................................................ 11 Table III-2: Age-Specific Fertility Rates in GCC States (Women nationals, 2014-2016) ...................................................................................................................... 13 Table III-3: Age-Specific Fertility Rates in GCC Countries (c. 2000; c. 2015) ....... 14 Table IV-1: Percentage ever-married women in young age groups: recent evolution (women nationals, selected GCC countries) .......................................... 17 Table V-1: Oman: Total Fertility Rates by activity status and employment sector (2003, 2010) .......................................................................................................... 21
4
LIST OF FIGURES
Figure III-1: Qatari females’ Total Fertility Rates: a comparison with other Gulf nationals (2014-2015) ............................................................................................ 10 Figure III-2: Evolution of the Total Fertility Rates in GCC countries (Gulf nationals, 1995-2016) ............................................................................................................ 11 Figure III-3: Age-Specific Fertility Rates in Qatar and in other GCC States (Women nationals, 2014-2016) ............................................................................................ 12 Figure III-4: Evolution of ASFR by age group (Bahrain, 1993-2014) ..................... 15 Figure III-5: Evolution of ASFR by age group (Oman, 2006-2015) ........................ 15 Figure IV-6: Proportion of unmarried females by ten-year age group (selected GCC countries, 2010) ............................................................................................ 18 Figure IV-7: Number of divorces per 100 marriages registered the same year (male nationals, 2010-2015). ................................................................................. 19 Figure V-8: Oman: Evolution of Marital Fertility Rates by education level (1993; 2003; 2010) ............................................................................................................ 22
5
I. INTRODUCTION
The generalisation of the decrease in Arab fertility after the mid-1980s took observers by surprise (Fargues, 1988). Improvements in the education of men and women since the 1960s, the gradual disappearance of early marriage and the spread of modern methods of contraception all went to explain this trend, even though the speed and patterns of change differed from one country to another. The results of the Child Health Surveys in the late 1980s in the Gulf States1 highlighted the comparatively high levels of fertility in the Arabian Peninsula. Yet, it also confirmed the extension of the decreasing trend to the socially-conservative region, albeit coupled with distinct patterns and rhythms of change in each of the six GCC countries. This came as a surprise, as elsewhere: in line with local governments’ pro-natalist policies, several factors were indeed expected to keep fertility levels steadily high in the Arabian Peninsula, the cradle of Islam. As explained in Courbage (1995), first, the region’s demographic weight remained weak (16 million of nationals only in the GCC region in 1990-1995)2, if compared to other Arab (Egypt) and non-Arab (Turkey) Sunni Muslim countries, or Shi’ite Iran, competing with Saudi Arabia over regional hegemony. Second, demographic competition sustained high fertility among nationals, as a reaction to the large presence of foreign workers (36 percent of the GCC population in 1990-95)3 and in the context of the “demographic struggle for power” (Bookman, 1992) between the various ethnic and sectarian components of Gulf States’ heterogeneous populations. Third, since the early 1970 especially, the oil rent had been generously redistributed to the population in cash and in kind (social infrastructures, free health, education and housing, easy access to domestic labour, extended maternity rights and incentives for governmental sector’s employees, for instance). This partly offset the costs of bringing up large families and slowed down Gulf women’s access to the labour market, hence freezing the effect of the oil-wealth-induced fast-pace industrialization, urbanization and profound socio-cultural changes on reproductive behaviours (Fargues, 2000: 102-107). Nevertheless, Gulf nationals’ fertility started decreasing in the late 1980s. The generalisation of female education contributed to delaying marriage and to promoting the use of modern contraception (on Saudi Arabia: Khraif, 2001; Abdul Salam, 2013). Yet, at that very moment, the drop of oil prices, and consequently, of GDP per capita must also have significantly impacted reproductive patterns (Courbage, 1995: 442). The Gulf Family Health Survey (GFHS) program conducted in Gulf States between 1995 and 19984 confirmed the drop in fertility levels (Annexed Table 1).
1 Conducted by the League of Arab States: Ministry of Health, Saudi Arabia Child Health Survey, Riyadh, 1991; Ministry of Health, Oman Child Health Survey, Muscat, 1992; Kuwait Child Health Survey, Kuwait, 1991; Ministry of Health, United Arab Emirates Child Health Survey, Abu Dhabi, 1991; Ministry of Health, Bahrain Child Health Survey, Manama, 1992; Ministry of Health, Qatar Child Health Survey, Doha, 1991. 2 http://gulfmigration.eu/evolution-of-population-figures-share-of-non-nationals-and-demographic-growth-rates-in-gcc-countries-since-the-1970s-national-statistics-1970-2010/ 3 http://gulfmigration.eu/evolution-of-population-figures-share-of-non-nationals-and-demographic-growth-rates-in-gcc-countries-since-the-1970s-national-statistics-1970-2010/ 4 A program executed by the Council of Health Ministers of the GCC States.

6
As of 2017, the region was endowed with about a third of the world’s proven oil reserves and 22 percent of all proven natural gas reserves.5 After almost a decade of record-high oil prices (2003-2011), IMF estimated that the six GCC countries still ranked among the top-20 world highest GDP per capita in 2016,6 as direct hydrocarbon producers or as beneficiaries of the regional economic growth. The pace of urbanisation and industrialisation, economic reforms and incentives for nationals to take up employment, as well as social development and education of local populations, especially women, all tremendously accelerated over the 2000s. Has this context of economic growth and social change impacted fertility trends and characteristics in the six Gulf States, and how? Demographic growth and fertility evolve slowly, in comparison to economic and political factors. Therefore, are there any signs that the post-Arab uprisings context of diminishing oil rent and drastic economic restructuring, domestic political volatility and regional conflicts, could accelerate, or reverse some of these trends?
The paper explores the patterns and characteristics of fertility in each of the six GCC states since the mid-1990s. After describing and assessing the data available and explaining the limits they pose to a comprehensive study of Gulf States’ fertility, we proceed to describing the main trends of reproduction, their most recent characteristics and patterns of evolution in each of the six countries. A third section examines proximate determinants of fertility (marriage patterns, birth control), as well as some of its differentials, only available for Oman. The paper concludes that GCC countries all have distinct fertility patterns and trends, and Qatar’s fertility is of intermediate intensity and calendar, when compared to other GCC countries. Surprisingly, fertility levels have increased significantly in certain countries over the past decade (Oman) and moderately and more recently in others (Emirate of Dubai and Bahrain). Moreover, the negative correlation usually observed between females’ education level and activity status is progressively fading in Oman, like in Qatar. Such findings are in line with evolutions recently uncovered in other Arab countries.
II. GULF FERTILITY DATA
Sources available to researchers to study Gulf nationals’ fertility are limited in number and in scope. UN sources in the region (e.g., the Economic and Social Commission for West Asia (UNESCWA), UN databases, World Bank, and the Population Reference Bureau (PRB)) do not routinely publish fertility data disaggregated by nationality (Shah 2017: 6-8). The publications of the GCC Stat Center offer disaggregated data, yet limited in number. On fertility, the Center only provides figures of births by nationality (nationals/ foreign nationals) since 2007, if transmitted by national statistical institutes or administrative registration bodies.
5 BP Statistical Review of World Energy, June 2017, https://www.bp.com/content/dam/bp/en/corporate/pdf/energy-economics/statistical-review-2017/bp-statistical-review-of-world-energy-2017-full-report.pdf, pp. 12; 26. 6 At Purchasing Power Parity (in international $). https://en.wikipedia.org/wiki/List_of_countries_by_GDP_(PPP)_per_capita#cite_note-IMF_2016-5.

7
GCC countries’ statistical offices only supply a limited range of data on fertility patterns and trends. Survey programmes conducted in the late 1980s and in the mid-1990s were the first sources of demographic and fertility data in Saudi Arabia and Oman, while smaller states (Bahrain, Kuwait) had already well-established statistical apparatuses and civil registration systems.
To date, the situation has evolved, on the technical and political levels. First, while all six countries now have dedicated modern statistical apparatuses, administrative records have become more widely used and provide more accurate population figures than population counts such as censuses. This was illustrated in the case of Kuwait, a pioneer in demographic data collection and dissemination, since the inception in 1957 of the Central Statistical Office (CSO) within the Planning Ministry. The CSO conducts population and housing censuses. Yet, since 1995 a growing discrepancy was witnessed, between CSO' data, and figures produced by the Public Authority for Civil Information (PACI), an independent government body in charge of 1- centralising all population and labour force data in order to manage a fully computerised population register and 2- issuing mandatory civil identification cards to every resident of the country. Full computerisation of events registration by PACI suggested the Authority’s better data accuracy (Shah, 2010).7 Second, modern and technologically-advanced countries like Qatar and the UAE conceal population data essential to researchers and only release population figures aggregated by nationality. While Qatar publishes comparatively abundant data on fertility trends and behaviours, the UAE only released very few and scattered demographic and vital statistics, be it at the federal level or at the level of each Emirate. No census was conducted at the federal level since 2005. Some Emirates held population censuses (Abu Dhabi in 2011, Sharjah in 2015, Ajman in 2017), but results other than global population figures have not been made available to the public. The two countries’ reluctance to disclose some or any population figures may well be due to the extent of the “demographic imbalance” between national and foreign populations (UAE: 11 percent of nationals; Qatar: 12 percent only). 8 The concealment of data reflects the sensitivity of the issue in both countries.
7 PACI's database is connected electronically with other administrations and bodies registering demographic events and professional/ residency issues (births and death; departures and arrivals; end of service, residency and ID deliveries, etc.). PACI’s records of residents’ movements is thus regularly updated, which limits the risk of population overcount. Therefore, it is more likely that residents were undercounted during CSO- Ministry of Planning's census operations (Shah 2010, chapter 1). 8 http://gulfmigration.eu/qatar-population-nationality-qatari-non-qatari-five-year-age-group-2015/
8
Tabl
e II-
1: C
urre
nt c
hara
cter
istic
s of
GCC
nat
iona
ls' f
ertil
ity: A
revi
ew o
f dat
a an
d in
dice
s av
aila
ble
in G
CC S
tate
s'
publ
icat
ions
tota
lsu
rviv
ing
tota
lsu
rviv
ing
Nat.
of
child
Nat.
of
mot
her
Nat.
of
child
Nat.
of
mot
her
NbM
eta
data
Bahr
ain
Yes
Yes
Yes
NoNo
NoNo
Yes
Yes
NoYe
sYe
sYe
sYe
sYe
sYe
sYe
sYe
sNo
NoKu
wai
tYe
sYe
sYe
sNo
NoNo
NoYe
s(1)
Yes
NoNo
(2)
Yes
Yes
Yes
NoYe
sYe
sYe
sNo
NoOm
anYe
sYe
sYe
sYe
sNo
NoNo
Yes
Yes
NoNo
Yes
NoNo
NoNo
Yes
Yes
Yes
Yes
Yes
Qata
rNo
Yes
Yes (
9)No
NoNo
NoYe
sYe
sYe
sYe
sYe
sYe
sYe
sYe
sYe
sYe
sYe
sYe
sNo
Yes
Saud
i Ar
abia
Yes
Yes
Yes
Yes
Yes
Yes
Yes
Yes (
3)No
NoNo
NoNo
NoNo
NoYe
sNo
Yes
Yes
No
UAE
No (4
)No
(5)
No (5
)No
NoNo
NoYe
sNo
NoNo
NoNo
NoNo
NoYe
s (6)
NoYe
s (7)
NoNo
Abu
Dhab
iYe
sYe
sNo
(5)
NoNo
NoNo
Yes
NoNo
NoNo
NoNo
NoNo
Yes
NoYe
sNo
NoDu
bai
Yes
No (8
)No
(8)
NoNo
NoNo
Yes
NoNo
NoNo
NoNo
NoNo
Yes
Yes
Yes
NoNo
Deta
iled
avai
labl
e so
urce
s: se
e ta
bles
in te
xt(1
) Sou
rce:
PAC
I onl
y.(2
) Kuw
aiti
child
ren
of K
uwai
ti m
othe
rs o
nly.
(3) S
AMA
Annu
al St
atist
ics o
nly.
(4
) no
rece
nt d
ata (
last
dat
a: ce
nsus
2005
- est
imat
es fo
r 200
6-20
16).
(5) l
ast d
ata:
cens
us 20
05.
(6) s
tops
in 20
10.
(7) 2
007-
2010
onl
y.(8
) Agr
egat
ed d
ata o
nly s
ince
2005
(Tot
al p
opul
atio
n).
(9) 1
0-ye
ar ag
e gr
oups
.
Adju
sted
dat
a/ in
dice
s Diffe
rent
ial
ra
tes
Live-
birth
s by
child
's ch
arac
ter
-istic
(s)
TFR
ASFR
CBR
Thes
e an
d ot
her p
ublic
atio
ns
MFR
Raw
dat
a
Num
ber o
f liv
e-bi
rths d
ecla
red
year
n b
y na
tiona
lity
Num
ber o
f liv
e-bi
rths b
y m
othe
r's ag
e gr
oup
(yea
r n)
Live-
birth
s by
pla
ce o
f bi
rth
(insid
e co
untry
/ ab
road
)
Child
ren
ever
-bo
rn b
y mot
her's
ag
e gr
oup
at ti
me
of su
rvey
Child
ren
born
du
ring y
ear/
five
ye
ars p
rece
ding
su
rvey
by
mot
her's
age
grou
p at
tim
e of
su
rvey
Cens
uses
and
surv
eys
Tota
l po
pula
tion
by
natio
nalit
y
Wom
en
aged
15+
by
natio
nalit
y an
d ag
e gr
oup
Ever
-m
arrie
d w
omen
ag
ed 15
+ by
na
tiona
lity
and
age
grou
p
Civi
l sta
tus/
adm
inist
rativ
e re
gist
ratio
n
Num
ber
of li
ve -
birth
s de
clare
d ye
ar n
w
ith
dela
y
Live-
birth
s by
mot
her's
ch
arac
ter
-istic
(s)
9
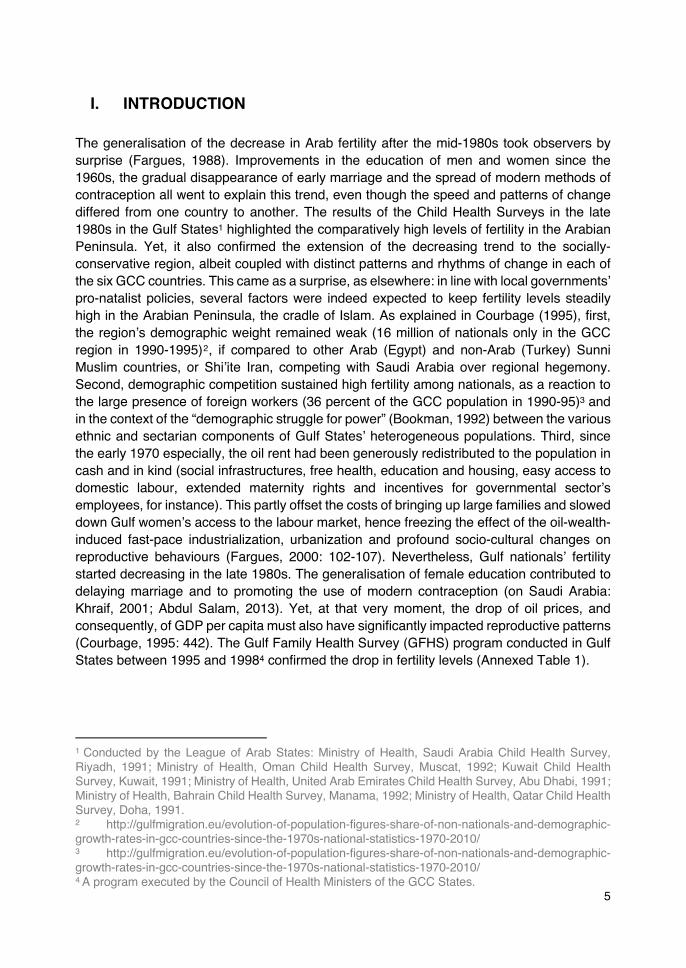
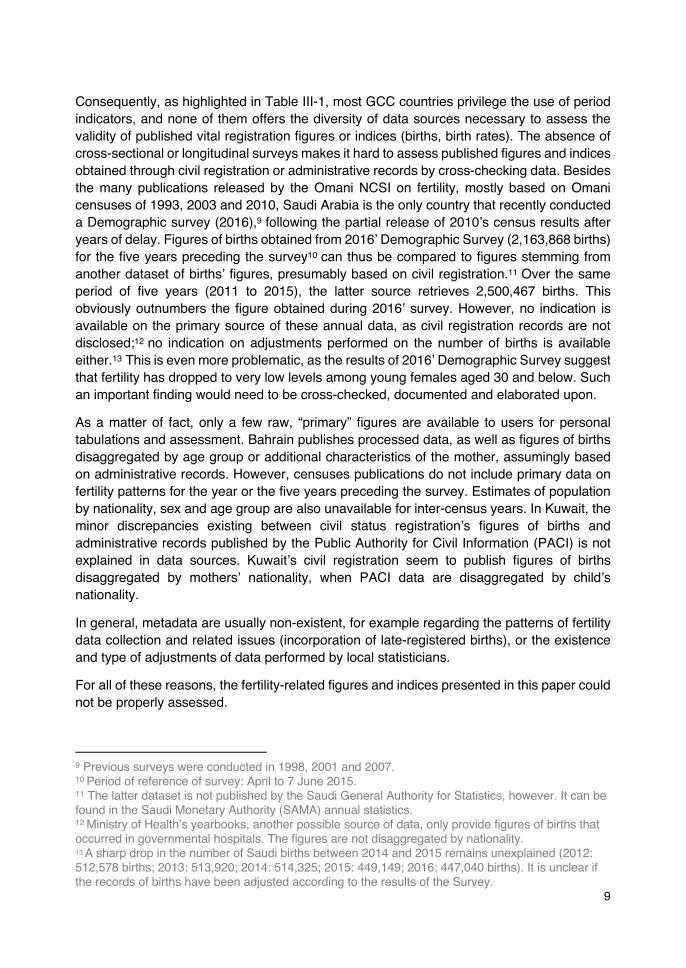
Consequently, as highlighted in Table III-1, most GCC countries privilege the use of period indicators, and none of them offers the diversity of data sources necessary to assess the validity of published vital registration figures or indices (births, birth rates). The absence of cross-sectional or longitudinal surveys makes it hard to assess published figures and indices obtained through civil registration or administrative records by cross-checking data. Besides the many publications released by the Omani NCSI on fertility, mostly based on Omani censuses of 1993, 2003 and 2010, Saudi Arabia is the only country that recently conducted a Demographic survey (2016),9 following the partial release of 2010’s census results after years of delay. Figures of births obtained from 2016’ Demographic Survey (2,163,868 births) for the five years preceding the survey10 can thus be compared to figures stemming from another dataset of births’ figures, presumably based on civil registration.11 Over the same period of five years (2011 to 2015), the latter source retrieves 2,500,467 births. This obviously outnumbers the figure obtained during 2016’ survey. However, no indication is available on the primary source of these annual data, as civil registration records are not disclosed;12 no indication on adjustments performed on the number of births is available either.13 This is even more problematic, as the results of 2016’ Demographic Survey suggest that fertility has dropped to very low levels among young females aged 30 and below. Such an important finding would need to be cross-checked, documented and elaborated upon.
As a matter of fact, only a few raw, “primary” figures are available to users for personal tabulations and assessment. Bahrain publishes processed data, as well as figures of births disaggregated by age group or additional characteristics of the mother, assumingly based on administrative records. However, censuses publications do not include primary data on fertility patterns for the year or the five years preceding the survey. Estimates of population by nationality, sex and age group are also unavailable for inter-census years. In Kuwait, the minor discrepancies existing between civil status registration’s figures of births and administrative records published by the Public Authority for Civil Information (PACI) is not explained in data sources. Kuwait’s civil registration seem to publish figures of births disaggregated by mothers’ nationality, when PACI data are disaggregated by child’s nationality.
In general, metadata are usually non-existent, for example regarding the patterns of fertility data collection and related issues (incorporation of late-registered births), or the existence and type of adjustments of data performed by local statisticians.
For all of these reasons, the fertility-related figures and indices presented in this paper could not be properly assessed.
9 Previous surveys were conducted in 1998, 2001 and 2007. 10 Period of reference of survey: April to 7 June 2015. 11 The latter dataset is not published by the Saudi General Authority for Statistics, however. It can be found in the Saudi Monetary Authority (SAMA) annual statistics. 12 Ministry of Health’s yearbooks, another possible source of data, only provide figures of births that occurred in governmental hospitals. The figures are not disaggregated by nationality. 13 A sharp drop in the number of Saudi births between 2014 and 2015 remains unexplained (2012: 512,578 births; 2013: 513,920; 2014: 514,325; 2015: 449,149; 2016: 447,040 births). It is unclear if the records of births have been adjusted according to the results of the Survey.
10
III. FERTILITY PATTERNS AND CHARACTERISTICS
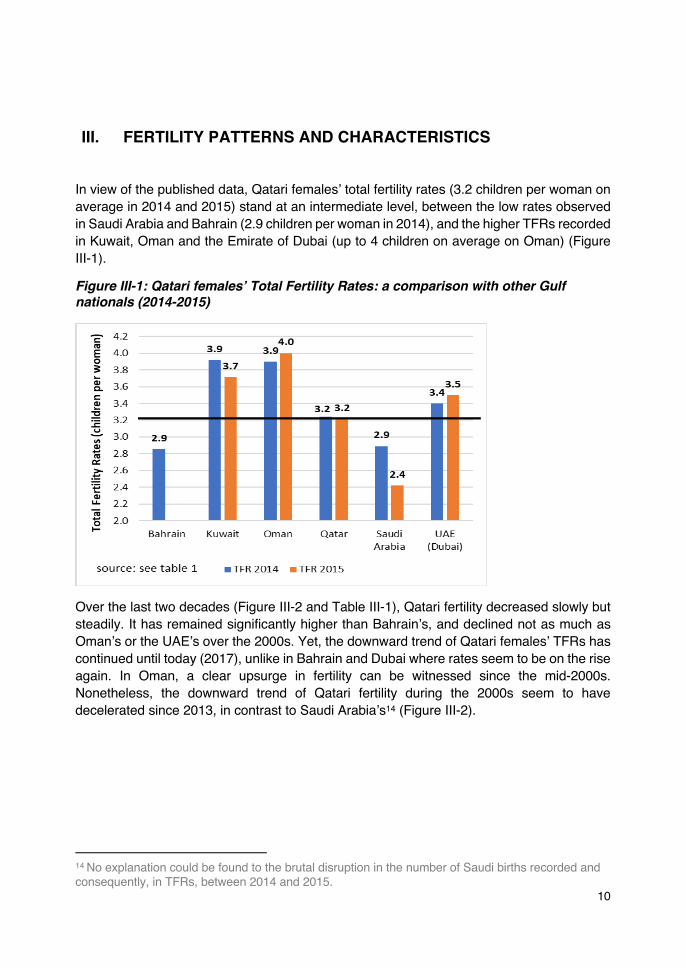
In view of the published data, Qatari females’ total fertility rates (3.2 children per woman on average in 2014 and 2015) stand at an intermediate level, between the low rates observed in Saudi Arabia and Bahrain (2.9 children per woman in 2014), and the higher TFRs recorded in Kuwait, Oman and the Emirate of Dubai (up to 4 children on average on Oman) (Figure III-1).
Figure III-1: Qatari females’ Total Fertility Rates: a comparison with other Gulf nationals (2014-2015)
Over the last two decades (Figure III-2 and Table III-1), Qatari fertility decreased slowly but steadily. It has remained significantly higher than Bahrain’s, and declined not as much as Oman’s or the UAE’s over the 2000s. Yet, the downward trend of Qatari females’ TFRs has continued until today (2017), unlike in Bahrain and Dubai where rates seem to be on the rise again. In Oman, a clear upsurge in fertility can be witnessed since the mid-2000s. Nonetheless, the downward trend of Qatari fertility during the 2000s seem to have decelerated since 2013, in contrast to Saudi Arabia’s14 (Figure III-2).
14 No explanation could be found to the brutal disruption in the number of Saudi births recorded and consequently, in TFRs, between 2014 and 2015.

11
Figure III-2: Evolution of the Total Fertility Rates in GCC countries (Gulf nationals, 1995-2016)
Table III-1: Total Fertility Rates in GCC countries (children per women, Gulf nationals, 1995-2016)
2,0
2,5
3,0
3,5
4,0
4,5
5,0
5,5
6,0
1995
1996
1997
1998
1999
2000
2001
2002
2003
2004
2005
2006
2007
2008
2009
2010
2011
2012
2013
2014
2015
2016To
tal F
ertil
ity R
ates
(chi
ldre
n pe
r wom
an)
Bahrain Kuwait OmanQatar Saudi Arabia UAE (Dubai)
Sources: see table.
1995 1996 1997 1998 1999 2000 2001 2002 2003 2004 2005 2006 2007 2008 2009 2010 2011 2012 2013 2014 2015 2016Bahrain 3.5 3.3 3.4 3.3 3.4 3.2 3.0 2.4 2.6 2.7 2.7 2.7 2.7 2.8 2.8 2.7 2.6 2.7 2.7 2.9Kuwait 4.1 4.1 4.1 4.0 3.9 3.9 3.7Oman 6.0 5.2 4.8 4.8 4.6 4.7 4.2 3.6 3.6 3.6 3.5 3.5 3.1 3.3 3.3 3.7 3.7 3.7 3.9 3.9 4.0 4.0Qatar 4.4 4.1 4.2 4.0 3.9 3.8 3.6 3.4 3.2 3.1 3.2 3.2Saudi Arabia 3.6 3.5 3.5 3.4 3.3 3.2 3.2 3.1 3.0 3.0 2.9 2.4 2.4UAE (Dubai) 3.2 3.2 3.2 3.2 3.2 3.4 3.5UAE 4.9 4.8 4.7 4.8 4.1 3.6 3.5 3.6Sources: Bahrain: Ministry of Health in Statistical Yearbooks, CIOsince 2001: birth registration became based on actual registered birth instead of registered birth.Kuwait: Annual Bulletin for Vital Statistics-Births and Deaths, CSB/ MoP.Oman: Ministry of Health birth registration in Statistical Yearbooks, NCSI.Qatar: civil registration data and surveys/census data, in Women & Men in Qatar 2008, 2010, 2012, 2014 and 2016, MDPS.Saudi Arabia: undisclosed source of data, https://www.stats.gov.sa/en/854-0, GAStat.UAE (Dubai): Health Authority registration of births in Statistical Yearbooks, DSC.

12
In most GCC countries including Qatar, fertility rates peak in the age group 25-29 years (Figure III-3Table III-2). This suggests that the first child is conceived immediately after marriage. However, Figure III-3 also underlines the heterogeneity of fertility patterns within the region. While the peak of fertility is delayed in Saudi Arabia and Dubai (30-34 years), Bahrain’s age-specific fertility rates are comparatively low at every age, and decrease rapidly after age 30. Kuwait’s comparatively high fertility is concentrated in young age groups (25-34 years) and sharply decelerates at later ages. Oman, Dubai and Saudi Arabia have higher fertility rates than other GCC states at “older” age groups (after age 40). This suggests, especially for Saudi Arabia, a very rapid transition and marked changes of fertility behaviour between young age groups (below 35), and previous generations aged 40 and more. In Saudi Arabia, indeed, fertility rates among “older” women are the highest in the region, while fertility rates at younger age groups (below 35) are the lowest (Figure III-3). Generational gaps in fertility behaviours seem more contrasted in Saudi Arabia than elsewhere in the Gulf.15 Qatar also displays distinct fertility characteristics: moderately-high fertility rates at peak-ages (179 per thousand at ages 25 to 35, to be compared to 230 per thousand in Kuwait for instance- Table III-2) and intermediate patterns of fertility decrease among older age groups.
Figure III-3: Age-Specific Fertility Rates in Qatar and in other GCC States (Women nationals, 2014-2016)
15 Another indication of the generational gap is the large difference between current fertility (2.4 children per woman) and cumulative fertility among older age groups (45-49 years): 4.7 children per women in 2016. Data on cumulative fertility is unavailable for the other GCC states.
0
50
100
150
200
250
15 - 19 20 - 24 25 - 29 30 - 34 35 - 39 40 - 44 45 - 49
Age-
Spec
ific
Fert
ility
Rat
es (p
er 1
000)
Bahrain (2014) Kuwait (2015)
Oman (2016) Qatar (2015)
Saudi Arabia (2016) UAE (Dubai) (2015)
13
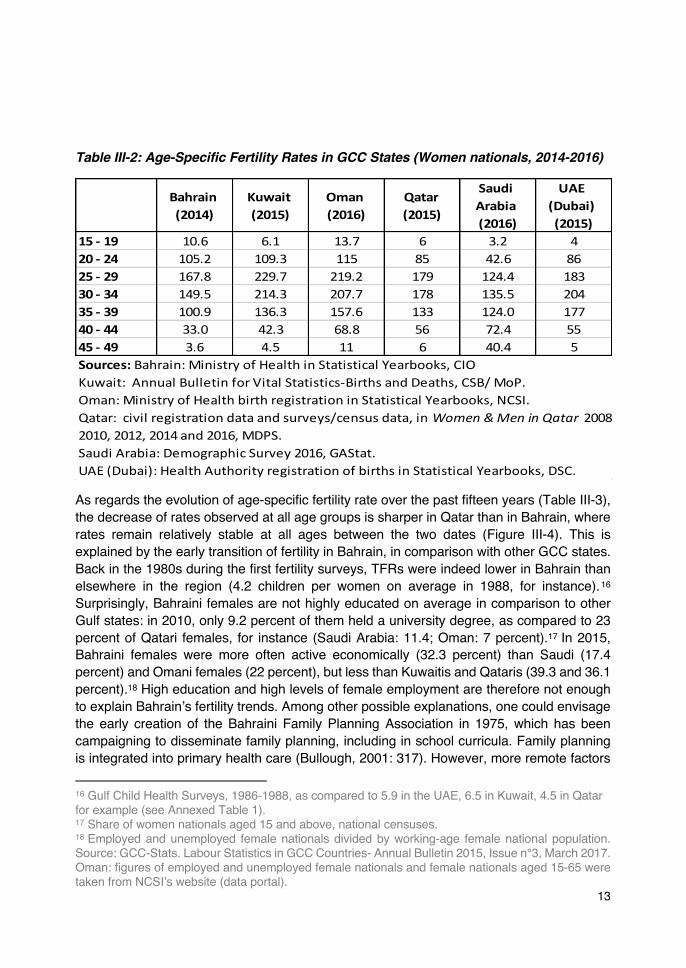
Table III-2: Age-Specific Fertility Rates in GCC States (Women nationals, 2014-2016)
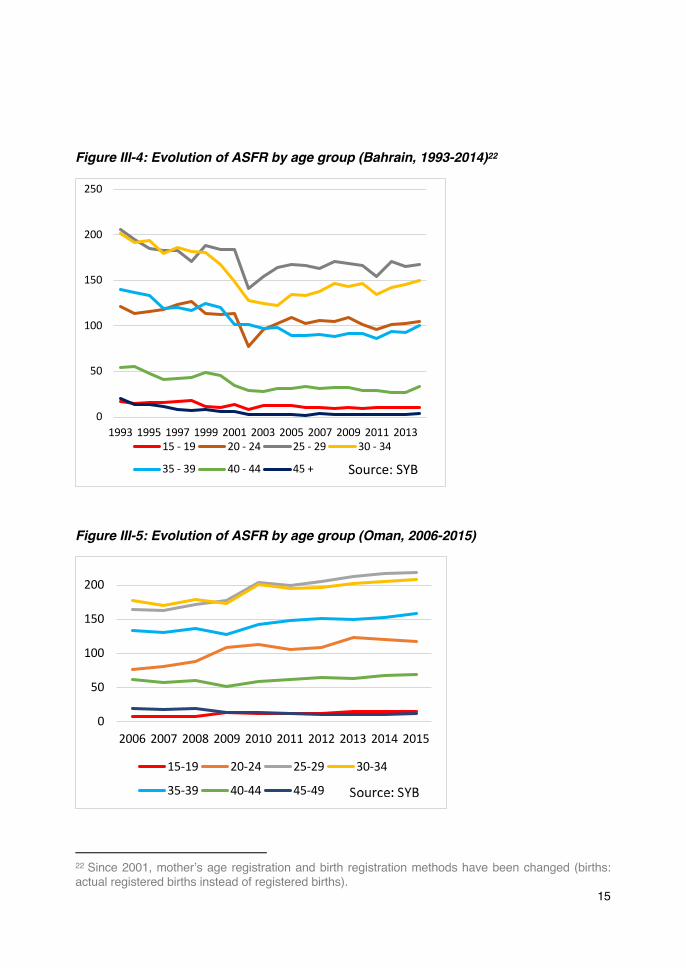
As regards the evolution of age-specific fertility rate over the past fifteen years (Table III-3), the decrease of rates observed at all age groups is sharper in Qatar than in Bahrain, where rates remain relatively stable at all ages between the two dates (Figure III-4). This is explained by the early transition of fertility in Bahrain, in comparison with other GCC states. Back in the 1980s during the first fertility surveys, TFRs were indeed lower in Bahrain than elsewhere in the region (4.2 children per women on average in 1988, for instance).16 Surprisingly, Bahraini females are not highly educated on average in comparison to other Gulf states: in 2010, only 9.2 percent of them held a university degree, as compared to 23 percent of Qatari females, for instance (Saudi Arabia: 11.4; Oman: 7 percent).17 In 2015, Bahraini females were more often active economically (32.3 percent) than Saudi (17.4 percent) and Omani females (22 percent), but less than Kuwaitis and Qataris (39.3 and 36.1 percent).18 High education and high levels of female employment are therefore not enough to explain Bahrain’s fertility trends. Among other possible explanations, one could envisage the early creation of the Bahraini Family Planning Association in 1975, which has been campaigning to disseminate family planning, including in school curricula. Family planning is integrated into primary health care (Bullough, 2001: 317). However, more remote factors
16 Gulf Child Health Surveys, 1986-1988, as compared to 5.9 in the UAE, 6.5 in Kuwait, 4.5 in Qatar for example (see Annexed Table 1). 17 Share of women nationals aged 15 and above, national censuses. 18 Employed and unemployed female nationals divided by working-age female national population. Source: GCC-Stats. Labour Statistics in GCC Countries- Annual Bulletin 2015, Issue n°3, March 2017. Oman: figures of employed and unemployed female nationals and female nationals aged 15-65 were taken from NCSI’s website (data portal).
Bahrain (2014)
Kuwait (2015)
Oman (2016)
Qatar (2015)
Saudi Arabia (2016)
UAE (Dubai) (2015)
15 - 19 10.6 6.1 13.7 6 3.2 420 - 24 105.2 109.3 115 85 42.6 8625 - 29 167.8 229.7 219.2 179 124.4 18330 - 34 149.5 214.3 207.7 178 135.5 20435 - 39 100.9 136.3 157.6 133 124.0 17740 - 44 33.0 42.3 68.8 56 72.4 5545 - 49 3.6 4.5 11 6 40.4 5Sources: Bahrain: Ministry of Health in Statistical Yearbooks, CIOKuwait: Annual Bulletin for Vital Statistics-Births and Deaths, CSB/ MoP.Oman: Ministry of Health birth registration in Statistical Yearbooks, NCSI.Qatar: civil registration data and surveys/census data, in Women & Men in Qatar 2008, 2010, 2012, 2014 and 2016, MDPS.Saudi Arabia: Demographic Survey 2016, GAStat.UAE (Dubai): Health Authority registration of births in Statistical Yearbooks, DSC.
14
may also have created a context prone to limiting the size of families. Bahrain’s population melting-pot of various origins, religions and sects19 may have created a society more open to change. The country’s early oil exploitation (the 1930s) and the rapid and durable onset of social and political activism, as well as early economic diversification away from oil20 and labour nationalisation also created a Bahraini urban proletariat, suffering from unemployment or employed in low-skilled, low-paid activities (Louër 2008), unlike elsewhere in the region. Bahrain is indeed among the poorest Gulf states.21
Yet, the stability of Age-Specific Fertility Rates (ASFR) may also suggest that Bahrain’s fertility has reached a bottom low. The clear decrease of rates at young ages recorded in Kuwait and Saudi Arabia contrasts with the higher rates witnessed at ages 30 and above, in 2015-2016 (Table III-3). This may confirm our earlier hypothesis of a rapid and drastic change in fertility patterns among young generations, especially in Saudi Arabia. Oman displays a unique pattern of fertility increase at all ages between 2003 and 2016, yet especially marked for age groups 20 to 40 years (Table III-3 and Figure III-5).
Table III-3: Age-Specific Fertility Rates in GCC Countries (c. 2000; c. 2015)
19 Bahrainis of South Asian and Arab or non-Arab Middle Eastern descent are many. The bulk of the population is Shiite, and Bahraini Sunnis follow the Maliki school of jurisprudence. Bahrain’s more socially- conservative neighbours Qatar and Saudi Arabia follow the Hanbali rite and the Wahhabi tradition. 20 Bahrain was never endowed with vast oil reserves. 21 GDP per capita around US $25,000 for 2010-2014, a level similar to that of Saudi Arabia and Oman, http:// data.worldbank.org/indicator/NY.GDP.PCAP.CD
2000 2014 2002 2015 2003 2016 2001 2015 2004 201615 - 19 11 10.6 19.2 6.1 10.3 13.7 13 6 12.3 3.220 - 24 113.2 105.2 171.3 109.3 89.5 115 111 85 67.8 42.625 - 29 184.7 167.8 253.7 229.7 188.6 219.2 225 179 268.0 124.430 - 34 167.7 149.5 206.0 214.3 182.1 207.7 214 178 134.6 135.535 - 39 120.4 100.9 126.5 136.3 129.4 157.6 161 133 109.5 124.040 - 44 45.7 33.0 46.7 42.3 58.9 68.8 80 56 65.5 72.445 - 49 6.2 3.6 5.7 4.5 18.8 11 13 6 24.1 40.4Sources: Bahrain: Ministry of Health in Statistical Yearbooks, CIOKuwait: Annual Bulletin for Vital Statistics-Births and Deaths, CSB/ MoP.Oman: Ministry of Health birth registration in Statistical Yearbooks, NCSI.Qatar: 2001: indirect estimates from Census 1997 and Qatar Family Health Survey 1998, in Women and Men in Qatar, 2004 and 2006; 2015: civil registration data and surveys/census data, in Women & Men in Qatar 2008, 2010, 2012, 2014 and 2016, MDPS.Saudi Arabia: 2004: Census data; 2016: Demographic Survey 2016, GAStat.
Bahrain Kuwait Oman Saudi Arabia Qatar
15
Figure III-4: Evolution of ASFR by age group (Bahrain, 1993-2014)22
Figure III-5: Evolution of ASFR by age group (Oman, 2006-2015)
22 Since 2001, mother’s age registration and birth registration methods have been changed (births: actual registered births instead of registered births).
0
50
100
150
200
250
1993 1995 1997 1999 2001 2003 2005 2007 2009 2011 201315 - 19 20 - 24 25 - 29 30 - 34
35 - 39 40 - 44 45 + Source: SYB
0
50
100
150
200
2006 2007 2008 2009 2010 2011 2012 2013 2014 2015
15-19 20-24 25-29 30-34
35-39 40-44 45-49
16
IV. PROXIMATE DETERMINANTS OF FERTILITY
Marriage patterns and divorce In the region, child-bearing must occur within marriage. Thus, the variables which determine the formation (timing, intensity)23 and stability of marital unions (divorce, remarriage) are very important in determining fertility. This is suggested by the large gap witnessed between marital and total fertility rates: the former stood at 4.58 children per woman in Saudi Arabia (2016 data), as compared to 2.71 children per woman for the total fertility rate. In Oman, marital fertility rates peaked at 6.65 children per married woman in 2010, while the TFR stood at 3.71 children per woman.24 Comparable data were not available for the other four countries.
The proportion of currently married women of child-bearing ages is thus important since it has a major role in determining fertility levels and differentials. The Cm index sums up the impact of marriage on fertility.25 Index values of Cm revealed that marriage did effectively inhibit fertility in the Gulf (Saudi Arabia: 0.558 in 2016; Kuwait: 0.545 in 2015 and Oman: 0.531 in 2010). This means that 44%, 45% and 47% of, respectively, Saudi, Kuwaiti and Omani potential fertility (if all women were married by age 15) was reduced by marriage patterns. Moreover, the impact of marriage on fertility patterns has been growing since the late 1980s, up from 0.667 (Saudi Arabia), 0.668 (Kuwait) and 0.790 (Oman).26
Is the fastest decline in ASFR observed at young ages (below 30 years) in Qatar thus linked to a delay in marriage? Actually, the proportion of ever-married women in young age group 15 to 24 years27 has remained stable over the 2000s in Qatar. Therefore, the drop in early fertility observed in Qatar between 2001 and 2015 (Table III-3) probably happened after marriage and was not caused by a delay in the timing of unions. A delay in the first birth after marriage, or a longer spacing between the first and second births may have occurred.
23 Polygamy does not seem very frequent in Gulf States on average: the ratio of married female nationals per 100 male nationals was 100.4 in Saudi Arabia (2016), 103 in Kuwait (2015) and 105 in Qatar (2010). The ratio was 114 females per 100 males in Oman (2010). However, some of the polygamous marriages may happen between a Gulf man and a foreign woman, which cannot be captured with existing data. 24 NCSI. The Fertility of Omani Women from the Facts of Population Censuses, Muscat: NCSI, 2012, p. 37 (in Arabic) and General Authority for Statistics (GAStat). Demographic Survey 2016, Riyadh: GAStat, 2017. 25 The Cm Index of marriage is the weighted average of the age-specific proportion of females currently married, with the distribution of TMFR by age of women used as weights. It equals 1 if all women of 15–49 years old are married (i.e.: maximum impact of marriage on fertility) and 0 in absence of marriage. 26 Child Health Surveys’ data (1986-87) in Courbage, 1995: Table 2. 27 Since 2010, Qatar statistics only publishes data on population by marital status by aggregate, 10-year age groups. Therefore, data available for the other countries (five-year age groups) were reformatted to allow comparison with Qatar (Table IV-1 and Figure IV-1).
17
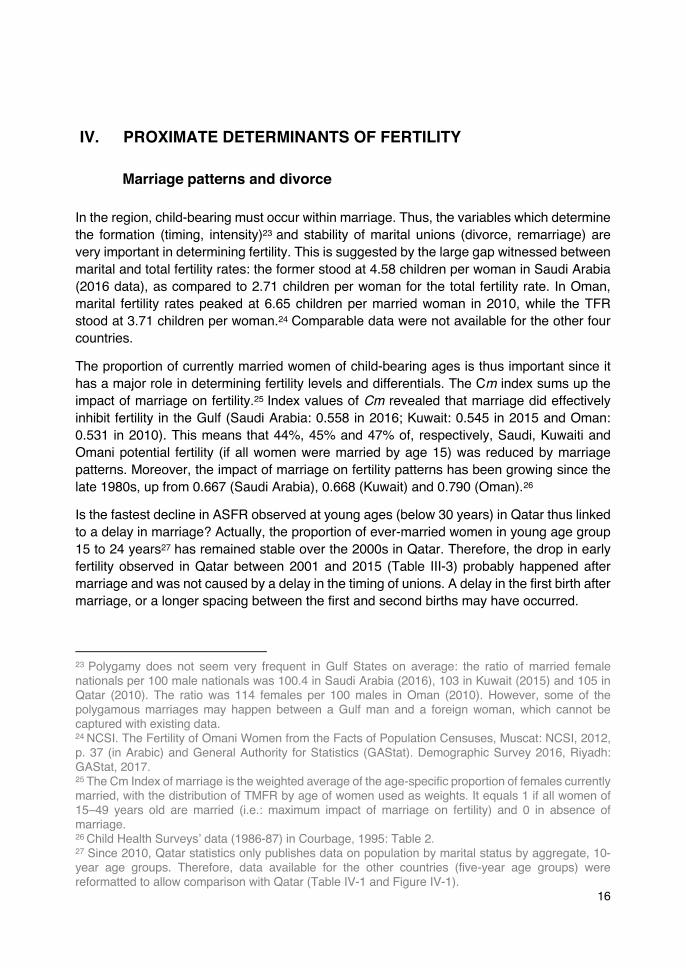
In Bahrain, the share of young females already married below age 34 has not declined during the 2000s, and even increased slightly among the youngest (from 18 to 22 percent of the women aged 15 to 24). In view of the stability of fertility rates at these ages, this suggests that marriage could start being disconnected from immediate childbearing in that country.
Table IV-1: Percentage ever-married women in young age groups: recent evolution (women nationals, selected GCC countries)
In Saudi Arabia, the delay in first marriage may well explain the marked drop in early total fertility, below 30 years of age. As pointed out in Table IV-1, the share of ever-married Saudi women in young age groups (below 25) decreased significantly between 1992 and 2010, from 41 down to 23 percent of the age category (14.3 percent in 2016). Early marriage below 20 years of age, especially, witnessed a sharp fall: the share of ever-married Saudi females aged 15 to 19 dropped from 21.3 in 1992 to a mere 2.9 percent in 2016.28
In Oman, it is puzzling to see that marriage patterns do not explain the rise in fertility at all ages, especially young ones (Table IV-1 and Figure III-5). Notwithstanding a slight rise in the share of females married early, below 25 years of age (Table IV-1), celibacy has increased at all other ages between 2003’ and 2010’ censuses. Combined together, the nuptiality and fertility patterns thus suggest that two separate dynamics may have occurred together during the decade of the 2000s: among certain sectors of the Omani population, a revival of early marriage coupled with increasingly intense fertility; among other sectors of the population, a rise in female celibacy, hence, non-exposure to the risk of pregnancy.
Nonetheless, despite the apparent diversity of cases before the end of the decade, by 2010 the gap between the four countries seems to have eventually closed. Around three quarters of all female nationals were not celibate anymore (between 71 and 77 percent of females, Table IV-1). Moreover, the general stability of early marriage indices over the 2000s makes one wonder if, and how, early marriage and early fertility could evolve in the near future.
28 Source: Saudi census 1992 and Demographic Survey 2016.
Age group 1991 2001 2010 2004 2010 1992 2004 2010 2003 201015-24 22.5 17.7 21.9 17.2 17.9 41 23.7 22.7 16.5 17.825-34 78.5 74.6 75.8 72 70.7 92.4 83.5 77 79.7 73.5Source: censuses, given dates.
Oman QatarBahrain Saudi Arabia

18
Figure IV-1: Proportion of unmarried females by ten-year age group (selected GCC countries, 2010)
That said, female celibacy has become a reality in the Gulf. Figure IV-1 indicates that in Bahrain, as well as in Qatar, 15 percent of women aged 35 to 44, and above 10 percent of those aged 45 and beyond were found unmarried as of 2010. The prevalence of female celibacy in Bahrain could explain the low levels of total fertility at older ages in the country, coupled with a lower fertility within marriage. In Qatar, the higher, yet relatively modest rates of fertility at ages 35 and beyond may be better explained by the delay in marriage and onset of female celibacy. In Saudi Arabia, the sharp slope of the curve confirms the rapidity of the transition, from a regime of early and intense marriage among females aged 40 and beyond, to a pattern of later marriage and consequently, lower total fertility at younger ages. However, an increasing number of females could also remain unmarried in the Kingdom, like in Bahrain and in Qatar. In 2016, 22 percent of females aged 30-34 years had never married, up from 13 percent in 2010; at age 35 to 39, 13 percent were celibate, up from 6 percent in 2010.
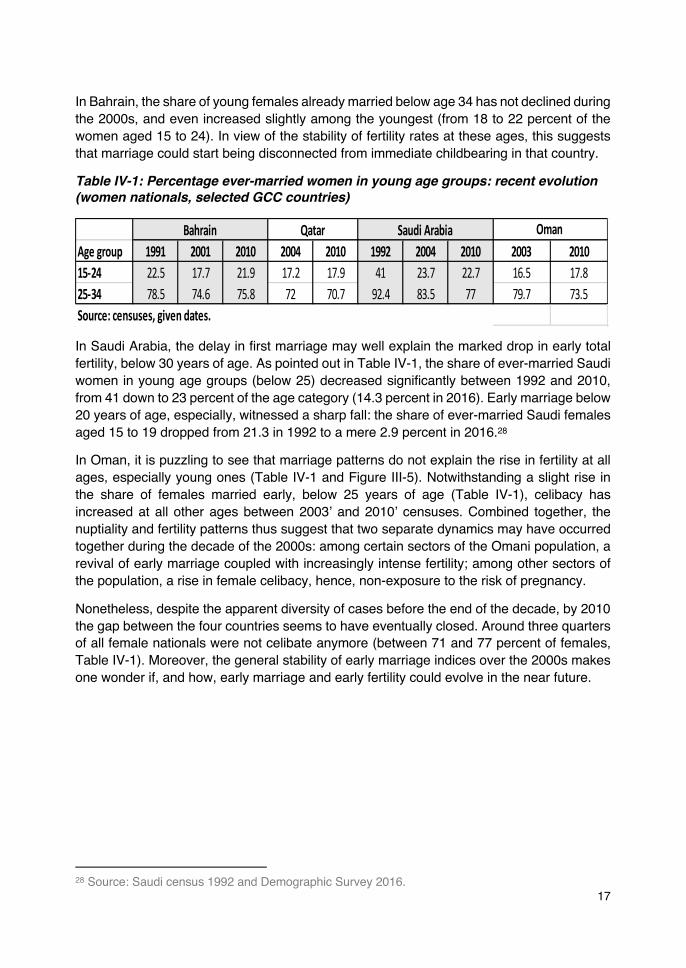
Besides a decreasing intensity and later timing, Gulf marriage has another characteristic, its instability, which keeps a sizeable number of females away from childbearing. Divorces are frequent. They interrupted 14 (Oman) to 49 percent of marriages (Kuwait) in 2016. 29 Moreover, their frequency seems to have risen since 2010, especially in Saudi Arabia where they disrupted almost 30 percent of male nationals’ marriages in 2014, a 8 percent jump in
29 Number of divorces per 100 marriages concluded the same year (male nationals).
0
10
20
30
40
50
60
70
80
90
15-24 25-34 35-44 45-54 55-64
% u
nmar
ried
fem
ale
in a
ge g
roup
Bahrain (2010) Saudi Arabia (2010) Qatar (2010) Oman (2010)
Source: Censuses 2010
19
four years. Moreover, divorces usually happen very rapidly after marriage, most of them during the first year of union.30 Women remarry less than men, which keeps them away from childbearing: in Kuwait where divorces were found particularly frequent (Figure IV-2), 4 to 13 percent of Kuwaiti women were recorded as divorced in 2015, from age group 20-24 to 45-49. Divorced males made up 1 to 7 percent only of the same age groups. That same year, 5 percent of all Kuwaiti males aged 15 and above were recorded as divorced or widower, as compared to 14.5 percent of female nationals.
Figure IV-2: Number of divorces per 100 marriages registered the same year (male nationals, 2010-2015).
Birth control Contraception is another of the main proximate determinants of fertility. Data for the mid-1990s indicated that the percentage of contraception users among interviewed married women ranged between 24 percent (Oman) and 62 percent (Bahrain).31 Users of modern methods made up from 87 percent of all users in Saudi Arabia and the UAE, to 30 percent
30 For instance, in Saudi Arabia: 60 percent of divorces registered in 2014 took place during the first year of union (http://www.arabnews.com/saudi-arabia/news/722051). This may be linked to disagreements during the period separating the establishment of the marriage contract and the effective cohabitation of the spouses, for example regarding economic claims of the bride to the groom. 31 Percentage of women (all ages) currently in union who are using a contraceptive method (Gulf Fertility Health Surveys, 1995-1996) in Tabutin and Schoumaker 2005, Table A8.
10
15
20
25
30
35
40
45
50
2010 2011 2012 2013 2014 2015
Divo
rces
per
100
mar
riage
s (m
ale
natio
nals
)
Bahrain Kuwait Oman
Qatar KSA UAESource: Marriage and divorce statistics, given countries
20
only in Bahrain. This confirms the Bahraini families’ inclination towards controlling their fertility, yet without depending on State’s intervention, and/or medicalisation of reproduction.
Unfortunately, recent data are not available on the prevalence of birth control in Gulf States, except in Saudi Arabia. The Demographic Survey conducted in 2016 revealed a low rate of contraceptive use in 2016 (24.6 percent of Saudi females),32 of whom 85 percent used modern methods. In 1996, during the Gulf Fertility Survey, the contraceptive prevalence among Saudi married females was 32 percent. Demographic Survey 2016 shows that the share of users was increasing with age, and culminated in age group 35-39 years. Expectedly, highly-educated females were more frequent users (35 percent of married PhD holders), as opposed to 10 percent of illiterate married women.
In Saudi Arabia, birth control methods are made available in private facilities (pharmacies and hospitals), but the Kingdom has no official population control policy. The conception and implementation of a family planning policy is, nevertheless, under discussion in the Shoura Council.33 More generally, to the exception of Oman where a family planning policy was launched in 1994 (Safar, 2013), all Gulf States governments expressed natalist concerns and their policy, until 2015 at least, has been to raise fertility rates among nationals. This may explain the dearth of data on the topic in Gulf official statistics. However, all governments also actively support family planning (but not birth control), to the exception of Saudi Arabia and the UAE, 34 where contraceptives are delivered by private health facilities. It is thus likely that the prevalence of contraception has increased since the 1990s in all countries in the region, to supplement the action of marriage on inhibiting fertility. Interestingly, the sharpest drop in fertility happened in Saudi Arabia, where contraceptives seem less easy to obtain than elsewhere. Fertility rates also went up in Oman, the only country having a set policy to lower fertility.
V. FERTILITY DIFFERENTIALS No recent data on fertility differentials could be found in the existing publications, except for a limited set of data available on Oman. As seen earlier, the six GCC countries display distinct patterns of fertility behaviours and determinants. Therefore, the dynamics observed in Oman may not apply to the other countries.
First, women’s economic participation is strongly correlated with their fertility in Oman, much like in Qatar (preliminary report). Employed females have a significantly lower TFR than housewives in 2003, as well as more recently in 2010. The sector of employment also matters: those working for the government have a TFR twice as high as those working in the private sector. This suggests that several factors may be at play to influence fertility choices. In the private sector, women’s career goals and demands may be most often incompatible
32 Percentage of women aged 15 to 49, currently married (includes the pregnant women). 33 http://www.arabianbusiness.com/saudi-arabia-mulls-birth-control-policy-576866.html 34 World Population Policy Database UN/DESA, Government views and policies, https://esa.un.org/poppolicy/cprofile.aspx?CountryProfileReport; https://esa.un.org/poppolicy/about_database.aspx

21
with raising large families. In the governmental sector, external conditions granted to women (stability of income, better work conditions, possibilities for maternity leave, for instance) may act as incentives for those who desire large families. No data is available on the age structure of the two populations, however, which may also affect fertility differentials by activity patterns. It is also worth noting that fertility rates have increased for all categories between 2003 and 2010, but more significantly for the well-offs (those employed, those employed in the public sector, and the housewives) (Table V-1). An increase in the fertility of nationals in middle- and upper-income categories during the 2000s was also noticed in other Middle Eastern countries (Egypt, Jordan) (De Bel-Air 2017).
Table V-1: Oman: Total Fertility Rates by activity status and employment sector (2003, 2010)
No recent data is available to confirm or contradict the finding. Back in 1998, the Saudi Demographic Survey, however, indicated the expected inverse relation between the level of income and the TFR: low income level females gave birth to 5.6 children on average, when high income Saudi couples had 4.04 children on average35 (Khraif 2001).
Two decades ago, in 1999, the Saudi National Demographic Survey also indicated an inverse relation between spouses’ education attainment and average fertility: educated women had almost four children less than their illiterate counterparts (6.52, as compared to 2.68 among tertiary-educated and holders of a high-school diploma) (Khraif 2001). Since the 2000s, however, the impact of education on fertility levels seems to be fading in Oman. Similar changes in fertility patterns were found across the Middle East (De Bel-Air 2017), and in Qatar (Qatar report). As is usually expected, a negative correlation, with the most educated women having the lowest level of fertility, was observed in 1993. Low-educated married females had a marital fertility rate (MFR)36 of 8.8 children on average, in marked contrast to those holding a university degree who had given birth to 5 children. However, the trend reversed during the 2000s. In 2010, those holding a General Degree (Baccalaureate)
35 National Demographic Survey 1999, Ministry of Planning, Saudi Arabia. 36 No TFR available.
Activity statusEmployed 2.9 3.3Unemployed 1.6 2Housewife 4.5 4.9Other 1.2 1Employment sectorEmployed (public sector) 3.3 4.1Employed (private sector) 1.8 1.9Other 2.8 2.7Source: population censuses 2003 and 2010 in: NCSI. The Fertility of Omani Women from the Facts of Population Censuses , Muscat: NCSI, 2012, p. 31 (in Arabic)
2003 2010

22
were displaying the same marital fertility rates than the illiterate married women. The MFR of the most educated among these females (holding a technical university degree (Diploma) or tertiary-educated) increased within the seventeen-year period, by one child on average. The less-educated women, by contrast, saw their MFR decrease by almost two children per married woman on average over these years. As of 2010, the education gap had almost closed and the fertility of the less educated (7 children per married woman) was very close to that of the most educated (6 children) (Figure V-1).
Figure V-1: Oman: Evolution of Marital Fertility Rates by education level (1993; 2003; 2010)
Given the absence of comparative data for earlier periods, and other GCC countries, it is difficult to figure out if such dynamics are limited to the Omani context, and to the current period. One explanation for such a paradoxical finding may be of a politico-economic nature: in a context of economic globalisation and receding rentier allocations from the States to citizens, especially in Oman, marriage, and consequently, fertility, could have become an economic privilege. The stabilisation of the proportions of married at an early age during the 2000s (between 2003 and 2010), as described earlier, is compatible with “expensive” marriages, affordable only by educated, wealthy citizens. As a matter of facts, bride prices (mahr) have soared over the last decades (Safar, forthcoming chapter). At the same time, the economic boom of the 2000s has opened opportunities to the regime’s clients, when low-educated, non-politically connected Omanis were shunning low-wage private sector
8,87,8
6,45,2 5
6,5 6,3 6 5,35,1
7 6,6 6,8 6,3 6
0123456789
10
Illiterate/reads and
writes
Below generaldegree
Generaldegree
Diploma Universityand above
Mar
ital F
ertil
ity R
ate
(chi
ldre
n pe
r mar
ried
wom
an)
Education level
1993 2003 2010Source: censuses in: NCSI. The Fertility of Omani Women from the Facts of Population Censuses, Muscat: NCSI, 2012, p. 28.
23
jobs, originally staffed by foreigners.37 The paradoxical concomitance of infrequent early marriages and female celibacy, with an increase in marital fertility at all ages, could be consistent with the existence of a socio-economic gap within the population. On the one hand, unemployment or low-wage private employment, competition with foreign labourers, either leading to celibacy, delayed marriage or to endogamous, mahr-free marriages. In this context, fertility may be reduced, a “malthusianism of poverty”: gradual State’s disengagement from the provision of social services indeed happened in the realm of economic reform measures, which mostly hit poor citizens, dependent on governmental infrastructures. On the other hand, educated females who could select wealthy husbands, and give birth to their ideal number of children, be they employed in the public sector, or housewives. Fertility patterns and trends could therefore reflect lines of division within Gulf populations, at the regional and national levels. This paradoxical trend was effectively noticeable in other countries in the Arab region.
VI. CONCLUSION
The analysis of data on fertility trends, characteristics and proximate determinants in GCC countries highlighted the following main points:
- Each of the six countries all have distinct fertility patterns and trends; - Qatar’s fertility is of intermediate intensity and calendar, when compared to other
GCC countries;
- The decline in ASFR observed below 30 years in Qatar probably happened within marriage, rather than due to delayed marriage, unlike in Bahrain or Saudi Arabia;
- Fertility levels (TFR and MFR) have increased significantly in certain countries over the past decade (Oman) and moderately and more recently in others (TFR, Emirate of Dubai and Bahrain);
- The negative correlation usually observed between females’ education level and activity status is progressively fading in Oman, like in Qatar and in other Middle Eastern countries.
However, such conclusions are partial and rely on a lot of assumptions. As pointed out in section I, more data are needed to confirm these tentative conclusions, in every country. Especially, demographic surveys would be extremely useful to complete and assess the period indicators obtained from vital statistics and administrative records.
37 Clientelism, unemployment and the low quality of private sector’s jobs were among the claims of Omani protesters during 2011’s demonstrations.

24
VII. BIBLIOGRAPHIC REFERENCES
Abdul Salam, A. “Nuptiality and fertility in Saudi Arabia: An appraisal of census data,” Middle East Fertility Society Journal, n°18, 2013, pp. 147–153.
Bookman, M.Z. The Demographic Struggle for Power, London: Frank Cass, 1992.
Bullough, V. (Ed.). Encyclopedia of Birth Control, Santa Barbara: ABC Clio, 2001.
Courbage, Y. « Baisse de la fécondité dans la Péninsule arabique, » Population, 50ᵉ année, n°2, 1995, pp. 415-445.
De Bel-Air, F. “Fertility and Marriage in the Middle East: Paradoxical Trends,” Orient XXI, 6 June 2017. https://www.academia.edu/33465481/Fertility_and_Marriage_in_the_Middle_East_Paradoxical_Trends
Fargues, Ph. Générations arabes, Paris : Fayard, 2000.
Fargues, Ph. “La baisse de la fécondité arabe”, Population, n°6, 1988, pp. 975-1004.
Khraif RM. “Fertility in Saudi Arabia: levels and determinants”, Paper presented at XXIV General Population Conference at Salvador – Brazil, 18–24 August 2001.
Louër, L. “The Political Impact of Labour Migration in Bahrain,” City & Society 20, Issue 1, 2008, pp. 32-53.
Safar, J. « Le programme d’espacement des naissances au sultanat d’Oman », Arabian Humanities, 1, 2013.
Safar, J. “The Soaring Bride-Price (mahr) in a Context of Modernization: A Complex Variable That is Affecting the Formation of the Gulf Family: The Case of Oman”. To be published in a forthcoming volume on Arab families of the Arabian Peninsula, co-edited by Elizabeth Wanucha and Zahra Babar
Shah, N. Population of Kuwait. Structure and Dynamics, Kuwait: Kuwait University Academic Publication Council, 2010.
Shah, N. M. “Dangers of Using Aggregated Data for Understanding SocioDemographic Realities of the Gulf Region,” Explanatory Note No. 01/2017, Gulf Labour Market and Migration (GLMM) programme of the Migration Policy Center (MPC) and the Gulf Research Center (GRC), http:// gulfmigration.eu
Tabutin, D. and Schoumaker, B. “The Demography of the Arab World and the Middle East from the 1950s to the 2000s - A Survey of Changes and a Statistical Assessment,” Population (English edition), 2005/5 Vol. 60, pp. 505-615.

25
VIII. APPENDICES
civil status
surveys/censuses
civil status
surveys/censuses
civil status
surveys/censuses
civil status
surveys/censuses
civil status
surveys/censuses
civil status
surveys/censuses
civil status
surveys/censuses
1965 7.5
1970 7.3
1975 7.2
1980 6.6
1985 6.5 1985 5.26 1985 7.06
1986 6.51 1986 5.8/4.451987 7.84 1987 6.46 1987 5.91
1988 4.2
1990 5.21
1991 3.9
1992 3.9
1993 3.8
1994 3.6
1995 3.5 3.2 1995 5.3 1995 7 1995 4.98 1995 4.9
1996 3.4 1996 4.1 1996 5.2 1996 4.1 1996 5.7
1997 3.4 1997 4.8 1997 4.81998 3.3 1998 4.8
1999 3.35 1999 4.6 1999 4.54
2000 3.24 2000 4.3 2000 4.7 2000 4.42 2000 4.9
2001 3 2001 4.2 2001 4.82 2001 4.75
2002 2.44 2002 3.64 2002 4.7
2003 2.58 2003 4.064 2003 3.56 2003 4.1 2003 4.8
2004 2.68 2004 3.19 2004 4.2 2004 3.6 3.46 2004 4.05
2005 2.74 2005 4.1 2005 3.14 2005 4.23 2005 3.53 2005 3.6
2006 2.69 2006 4 2006 3.19 2006 4.29 2006 3.46 2006 3.5
2007 2.71 2007 3.13 2007 4.56 4.04 2007 3.39 3.28 2007 3.50
2008 2.77 2008 3.3 2008 3.9 2008 3.31 2008 3.46
2009 2.8 2009 3.3 2009 3.8 2009 3.24 2009 3.2 2009 3.51
2010 2.74 2010 3.7 3.7 2010 3.59 2010 3.17 2.8 2010 3.2 2010 3.56
2011 2.57 2011 3.7 2011 3.7 2011 3.38 2011 3.1 2011 3.2 2011 3.8
2012 2.74 2012 3.6 2012 3.7 2012 3.2 2012 3.03 2012 3.2 2012 3.8
2013 2.74 2013 3.6 2013 3.9 2013 3.1 2013 2.96 2013 3.2 2013 3.4
2014 3.5 2014 3.9 2014 3.2 2014 2.89 2014 3.4 2014 3.8
2015 3.71 2015 4 2015 3.22 2015 2.42 2015 3.5 2015 3.8
2016 4 2016 2.36 2.71 2016 3.7
Sources :
1985-1987: Chi ld Health Surveys
1995-1996: GFHS Surveys .
Bahra in: Statis tica l Yearbooks , CIO http://www.cio.gov.bh/cio_ara/Engl i sh/Publ ications/Statis tica l%20Abstract/ABS2009/Ch3/3.pd
Kuwait: 1965-1985 CSO ; 1995-2014 DV&HS
Oman: NCSI https ://www.ncs i .gov.om/El ibrary/LibraryContentDoc/bar_Omani%20ferti l i ty_27c1b5f2-c3f1-4d62-ad55-e657ae18b98d.pdf
Qatar: QSA/ MDPS http://www.mdps.gov.qa/en/statis tics1/Statis ticsSi te/Pages/default.aspx
Qatar: MDPS - women and men statis tica l profi les 2006; 2016
Saudi Arabia (civi l s tatus): SAMA, http://www.sama.gov.sa/en-us/economicreports/pages/yearlystatis tics .aspx
Saudi Arabia (censuses and surveys): GAS, https ://www.stats .gov.sa/en/854-0 + GFHS 1996
Saudi Arabia (1985; 1987; 1999): Khrei f, R. "Ferti l i ty in Saudi Arabia : levels and determinants", A paper presented at XXIV Genera l Population Conference; Sa lvador – Brazi l ; 18-24 August 2001, p. 7.
UAE: Dubai only, Dubai Statis tics Center - Vi ta l Statis tics System for the Emirate of Dubai
UAE: Abu Dhabi , SCAD, Statis tica l Yearbooks (Population and Vi ta l s tatis tics ) from Health Authori ty AD.
UAE 2000-2010: Al Awad, M. The Population of Dubai , WP 16-08, Dubai : Dubai Economic Counci l , 2008; and Federa l Competi tiveness and Statis tics Authori ty (FCSA).
UAE
Annexed Table 1: Total Fertility Rates of GCC National Populations (Children per woman) 1965-2016Saudi ArabiaQatarOmanKuwaitBahrain UAE (Dubai) UAE (Abu Dhabi)


![One size symbols? Not fit for all! · Banes, D. and Zahid, A. Tawasol Symbols, The Arabic Symbol Dictionary. Funded by an NPRP award [NPRP 6 - 1046 - 2 - 427] from the Qatar National](https://img.pdfslide.net/doc/110x75/5f0a27b27e708231d42a474e/one-size-symbols-not-fit-for-all-banes-d-and-zahid-a-tawasol-symbols-the.jpg)


![Psicoanálisis y Pediatría [Francoise Dolto]](https://img.pdfslide.net/doc/110x75/5572144f497959fc0b943bbe/psicoanalisis-y-pediatria-francoise-dolto.jpg)