Embed Size (px)
Citation preview
5/10/2011
1
Field Assessment and Analytical Assessment of the Hydraulic
Relationship between the Trinity and p yEdwards Aquifers
Presented to
Society of American Military EngineersS A t i TSan Antonio, Texas
May 10, 2011
byRonald T. Green, Ph.D., P.G.
Southwest Research Institute
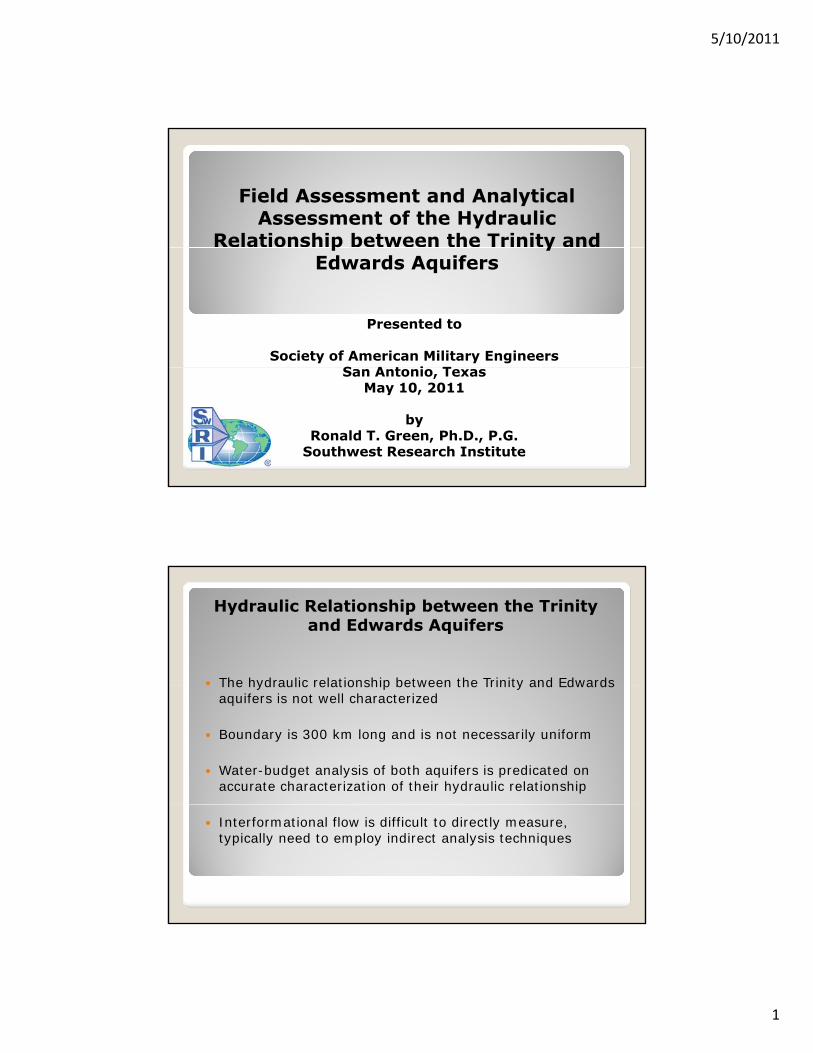
Hydraulic Relationship between the Trinity and Edwards Aquifers
The hydraulic relationship between the Trinity and Edwards The hydraulic relationship between the Trinity and Edwards aquifers is not well characterized
Boundary is 300 km long and is not necessarily uniform
Water-budget analysis of both aquifers is predicated on accurate characterization of their hydraulic relationship
Interformational flow is difficult to directly measure, typically need to employ indirect analysis techniques
5/10/2011
2
HHydraulic Relationship between the Trinity and Edwards Aquifers
Working hypothesis:• Edwards Aquifer and Trinity Aquifer are hydraulically
dconnected
• The southern portion of the Contributing Zone of the Edwards Aquifer (i.e., upper Glen Rose) is more hydraulically similar to the Edwards Aquifer than previously characterized
• Flow is from the Trinity Aquifer (upper Glen Rose) to the Edwards Aquifer
• Quantity of inflow from the Trinity Aquifer(upper Glen Rose) to the Edwards Aquifer is greater than previously characterized
Hydraulic Relationship between the Trinity and Edwards Aquifers
Lines of reasoning in this evaluation:
• The southern portion of the Contributing Zone of the Edwards The southern portion of the Contributing Zone of the Edwards Aquifer (i.e., Glen Rose) is more hydraulically similar to the Edwards Aquifer than previously characterized
Gain/loss study of Helotes Creek
• Flow is from the Trinity Aquifer (upper Glen Rose) to the Edwards Aquifer
Tracer studies in Panther Spring Creek & Camp Bullis (EAA)
• Quantity of inflow from the Trinity Aquifer (upper Glen Rose) to the Edwards Aquifer is greater than previously characterized
Water budget analysis for Uvalde pool
5/10/2011
3
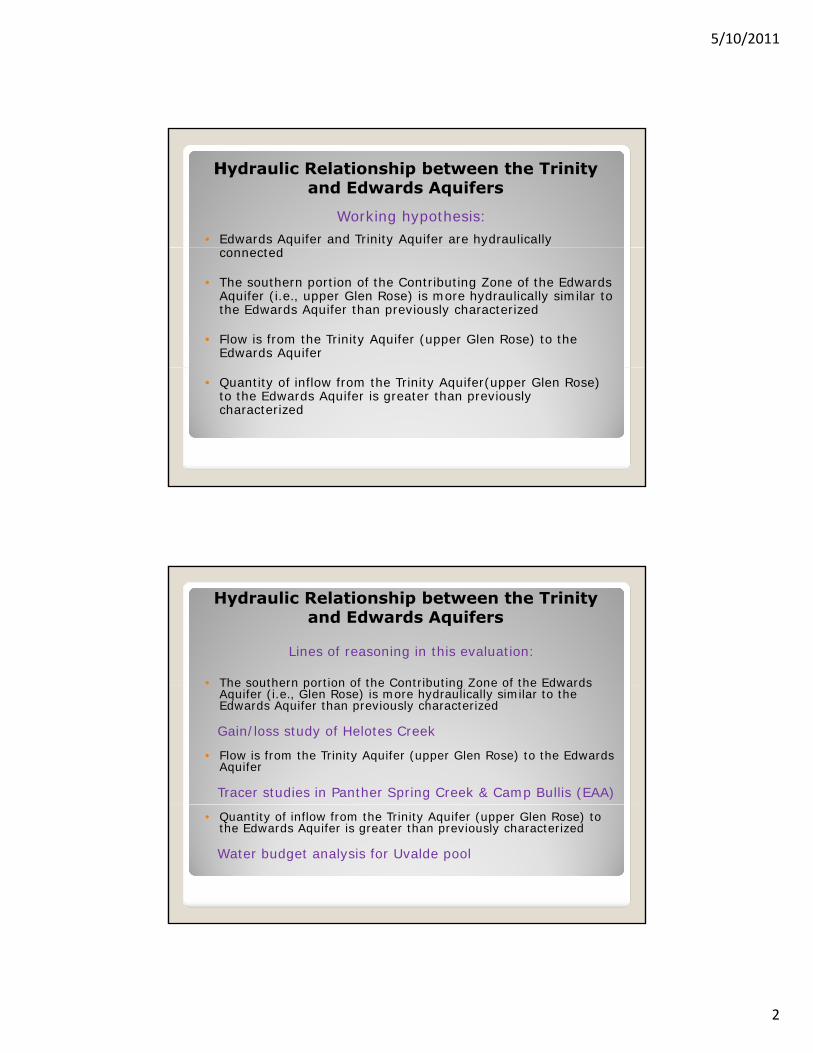
Gain/loss study of Helotes Creek
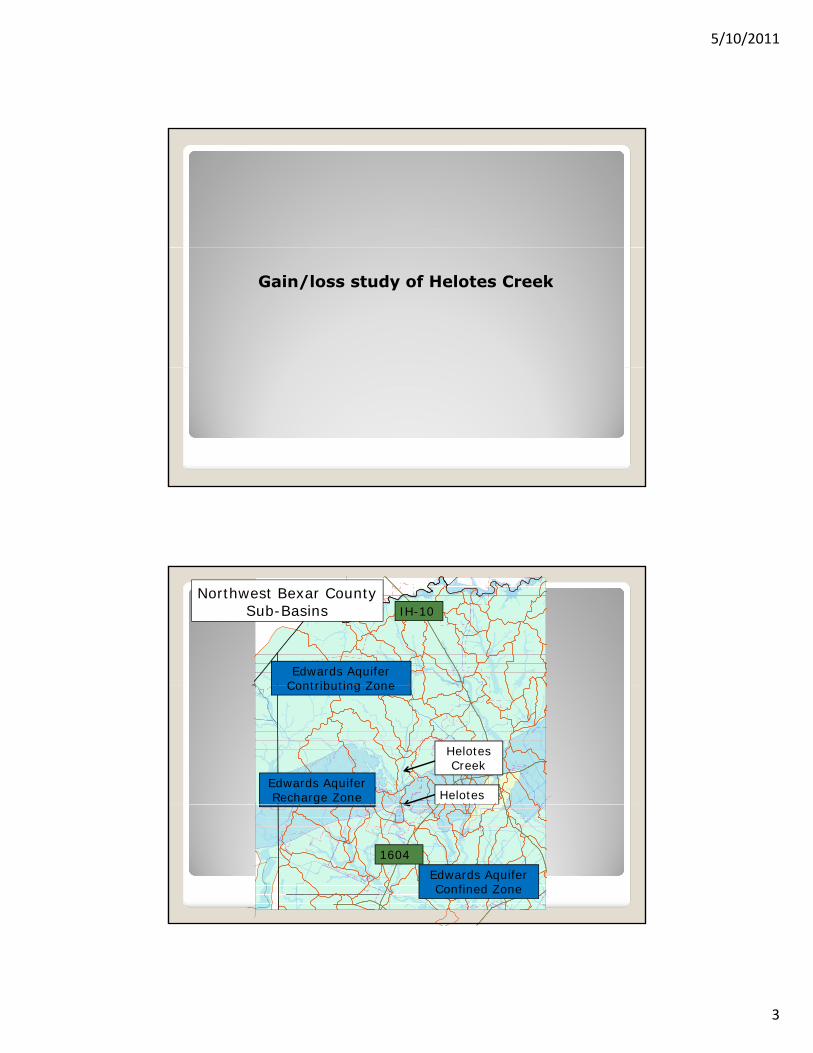
¯ IH-10
Edwards Aquifer Contributing Zone
Northwest Bexar CountySub-Basins
Helotes
Contributing Zone
Edwards Aquifer Recharge Zone Helotes
Helotes Creek
0 7,000 14,000 21,000 28,0003,500
Feet
1604
Edwards Aquifer Confined Zone
5/10/2011
4
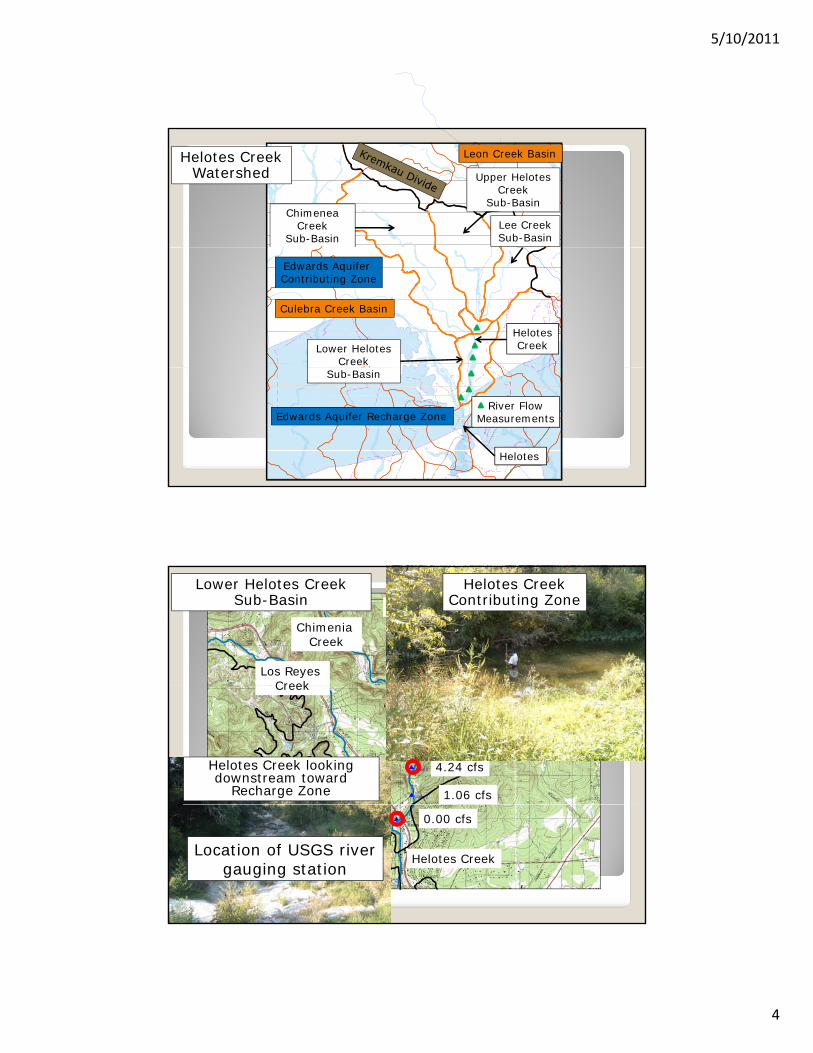
¯Leon Creek Basin
ChimeneaCreek
Sub-Basin
Upper Helotes Creek
Sub-Basin
Lee Creek Sub-Basin
Helotes Creek Watershed
Culebra Creek Basin
Lower Helotes Creek
Edwards Aquifer Contributing Zone
Helotes Creek
0 3,400 6,800 10,200 13,6001,700Feet
Helotes
Sub-Basin
Edwards Aquifer Recharge Zone
Helotes
River Flow Measurements
Lower Helotes Creek Sub-Basin
ChimeniaCreek
Lee Creek
Helotes Creek
Los Reyes Creek
Edwards AquiferContributing Zone
Helotes Creek Contributing Zone
0.94 cfs
3.05 cfs
2.47 cfs
1.06 cfs
4.24 cfs
Creek
Helotes Creek looking downstream toward
Recharge Zone
0.00 cfs
Edwards AquiferRecharge Zone Helotes Creek
Location of USGS river gauging station
5/10/2011
5
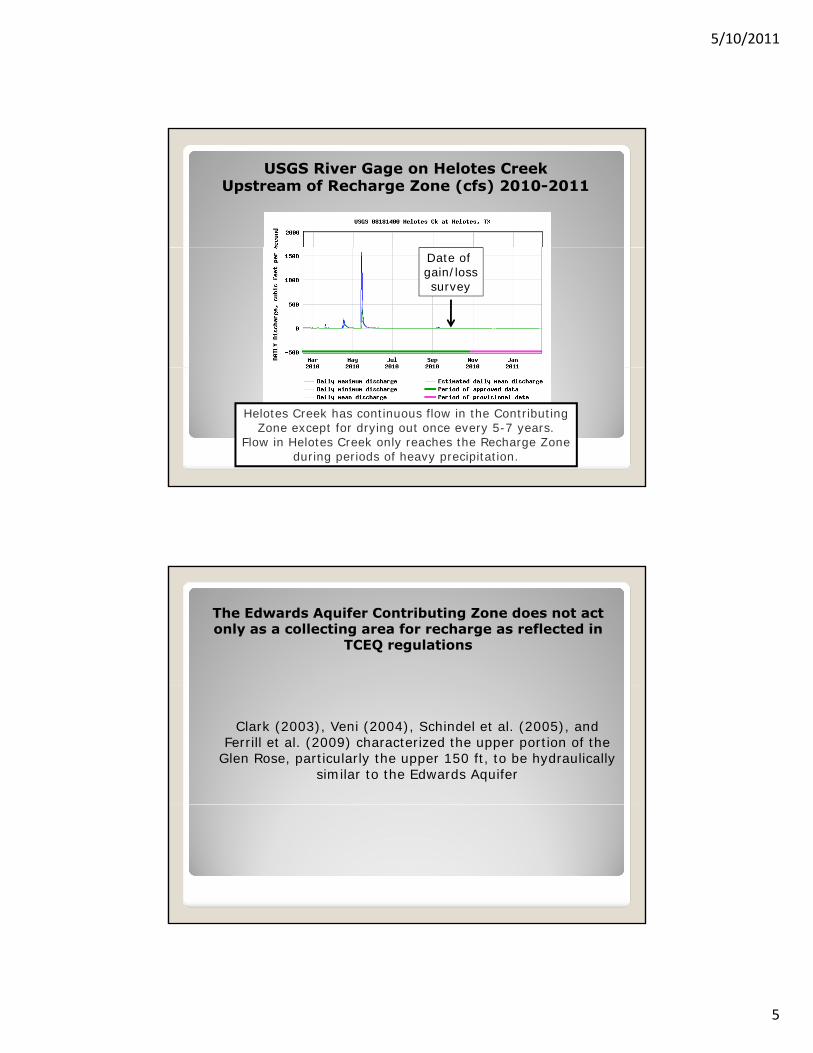
USGS River Gage on Helotes Creek Upstream of Recharge Zone (cfs) 2010-2011
Date of gain/losssurvey
Helotes Creek has continuous flow in the ContributingZone except for drying out once every 5-7 years.
Flow in Helotes Creek only reaches the Recharge Zoneduring periods of heavy precipitation.
The Edwards Aquifer Contributing Zone does not act only as a collecting area for recharge as reflected in
TCEQ regulations
Clark (2003), Veni (2004), Schindel et al. (2005), and Ferrill et al. (2009) characterized the upper portion of the
Glen Rose, particularly the upper 150 ft, to be hydraulically similar to the Edwards Aquifer

5/10/2011
6
Other localities with river loss in the Edwards Aquifer Contributing Zone
Slade et al., 2002
Locations of river gauging stations in the western Edwards Aquifer do not account for all recharge
12
5/10/2011
7
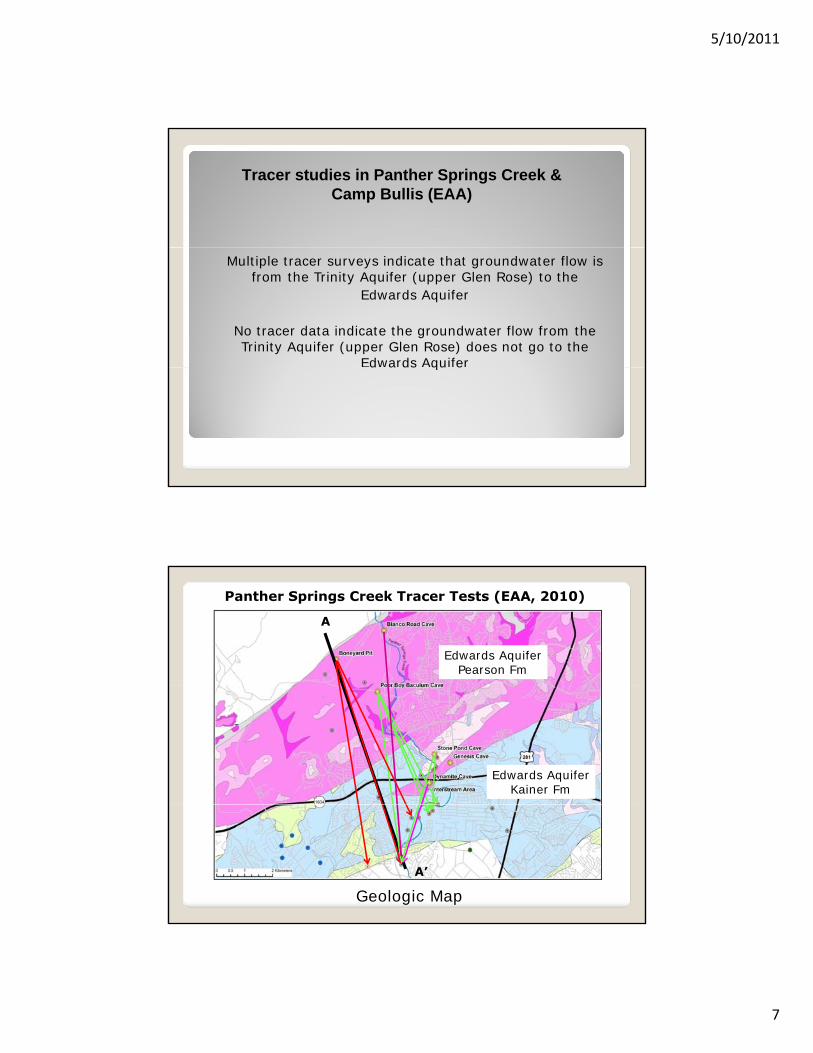
Tracer studies in Panther Springs Creek & Camp Bullis (EAA)
Multiple tracer surveys indicate that groundwater flow is from the Trinity Aquifer (upper Glen Rose) to the
Edwards Aquifer
No tracer data indicate the groundwater flow from the Trinity Aquifer (upper Glen Rose) does not go to the
Edwards Aquifer d a ds qu e
A
Panther Springs Creek Tracer Tests (EAA, 2010)
Edwards AquiferPearson Fm
Edwards AquiferKainer Fm
A’
Geologic Map
5/10/2011
8
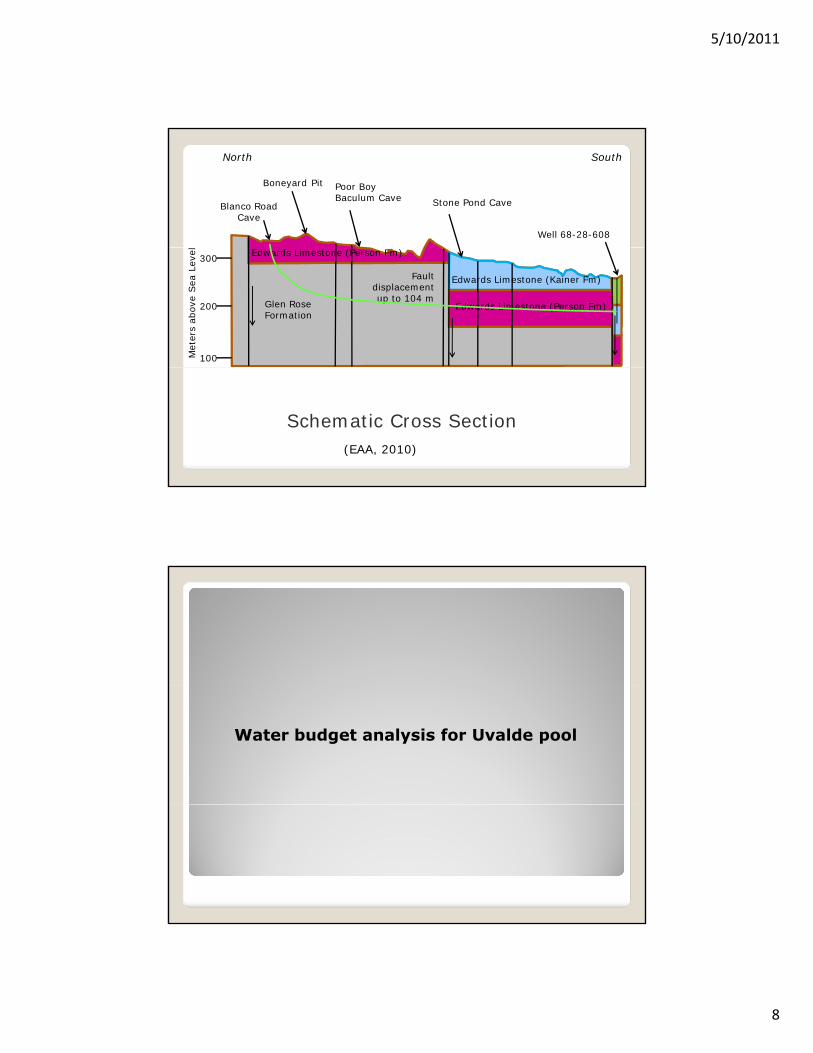
North South
Stone Pond Cave
Well 68-28-608
Poor BoyBaculum Cave
Boneyard Pit
Blanco RoadCave
Glen Rose Formation
Edwards Limestone (Person Fm)
Edwards Limestone (Person Fm)
Edwards Limestone (Kainer Fm)
300
200
100Met
ers
abov
e Sea
Lev
el
Fault displacement up to 104 m
Schematic Cross Section(EAA, 2010)
Water budget analysis for Uvalde pool
5/10/2011
9
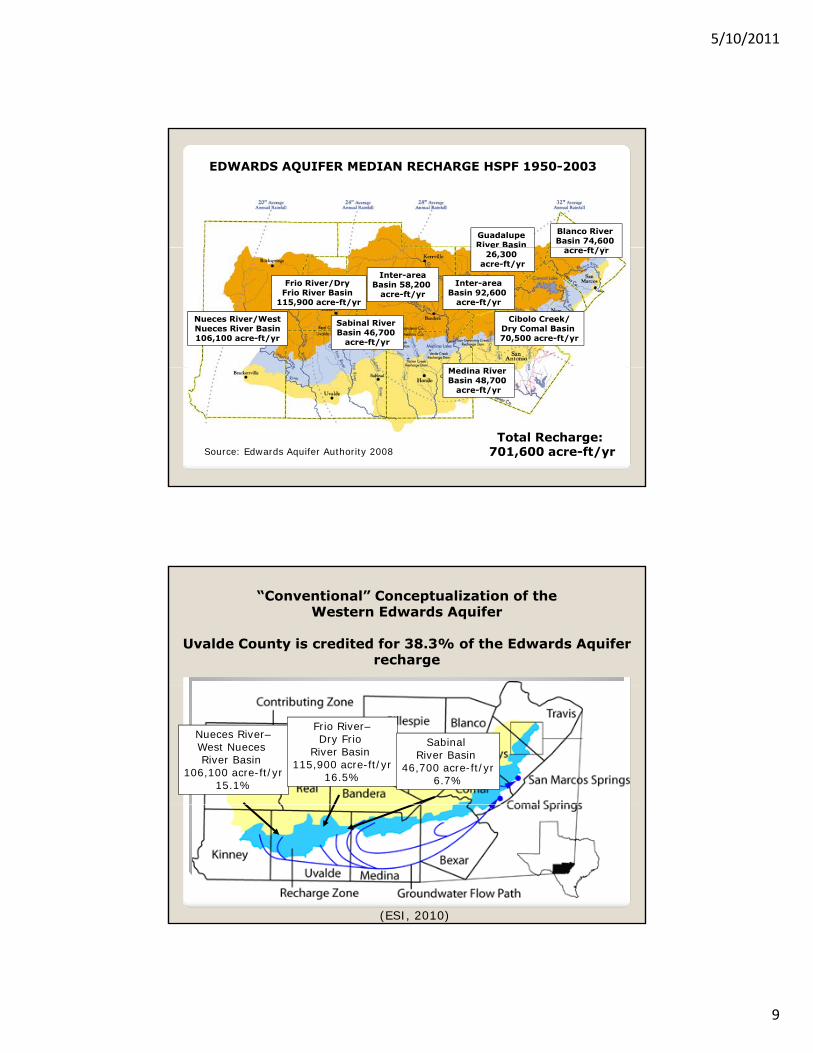
EDWARDS AQUIFER MEDIAN RECHARGE HSPF 1950-2003
Blanco River Basin 74,600
ft/
Guadalupe River Basin
Nueces River/West Nueces River Basin 106,100 acre-ft/yr
Frio River/Dry Frio River Basin
115,900 acre-ft/yr
Sabinal River Basin 46,700
acre-ft/yr
acre-ft/yre as
26,300 acre-ft/yr
Cibolo Creek/Dry Comal Basin 70,500 acre-ft/yr
Inter-areaBasin 92,600
acre-ft/yr
Inter-areaBasin 58,200
acre-ft/yr
Source: Edwards Aquifer Authority 2008
Medina River Basin 48,700
acre-ft/yr
Total Recharge: 701,600 acre-ft/yr
“Conventional” Conceptualization of the Western Edwards Aquifer
Uvalde County is credited for 38.3% of the Edwards Aquifer recharge
Nueces River–West Nueces River Basin
106,100 acre-ft/yr15.1%
Frio River–Dry Frio
River Basin 115,900 acre-ft/yr
16.5%
Sabinal River Basin
46,700 acre-ft/yr6.7%
18
(ESI, 2010)
5/10/2011
10
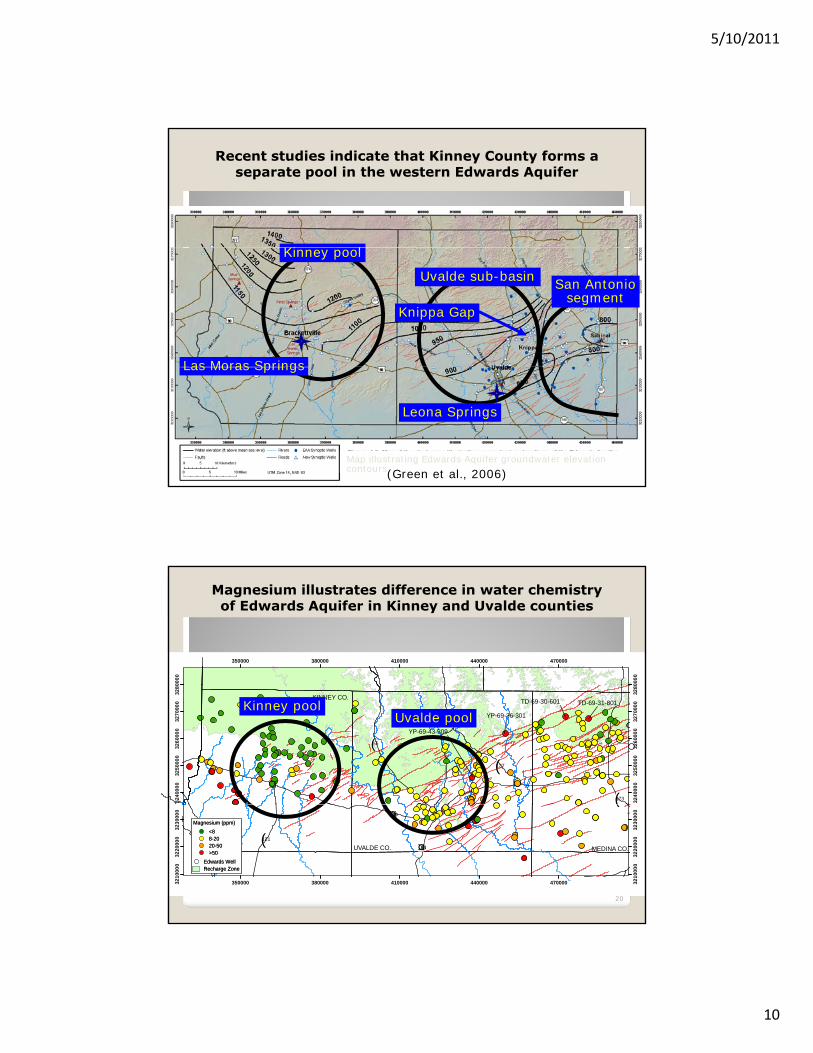
Recent studies indicate that Kinney County forms a separate pool in the western Edwards Aquifer
Ki l
Knippa Gap
Las Moras Springs
Kinney pool
Uvalde sub-basin San Antoniosegment
19Map illustrating Edwards Aquifer groundwater elevation contours
Leona Springs
Las Moras Springs
(Green et al., 2006)
Magnesium illustrates difference in water chemistry of Edwards Aquifer in Kinney and Uvalde counties
350000 380000 410000 440000 470000
000
0
000
0
324
000
0
324
000
0
325
000
0
325
000
0
326
000
0
326
000
0
327
000
0
327
000
0
328
0
328
0
YP-69-36-301
YP-69-43-309
TD-69-31-801KINNEY CO.
TD-69-30-601
!(55
!(127
!(173
Uvalde poolKinney pool
20
350000 380000 410000 440000 470000321
000
0
321
000
0
322
000
0
322
000
0
323
000
0
323
000
0
UVALDE CO. MEDINA CO.
£¤90
£¤83!(131
(
>50
<88-2020-50
Magnesium (ppm)
Edwards WellRecharge Zone
>50
<88-2020-50
Magnesium (ppm)
Edwards WellRecharge Zone
5/10/2011
11
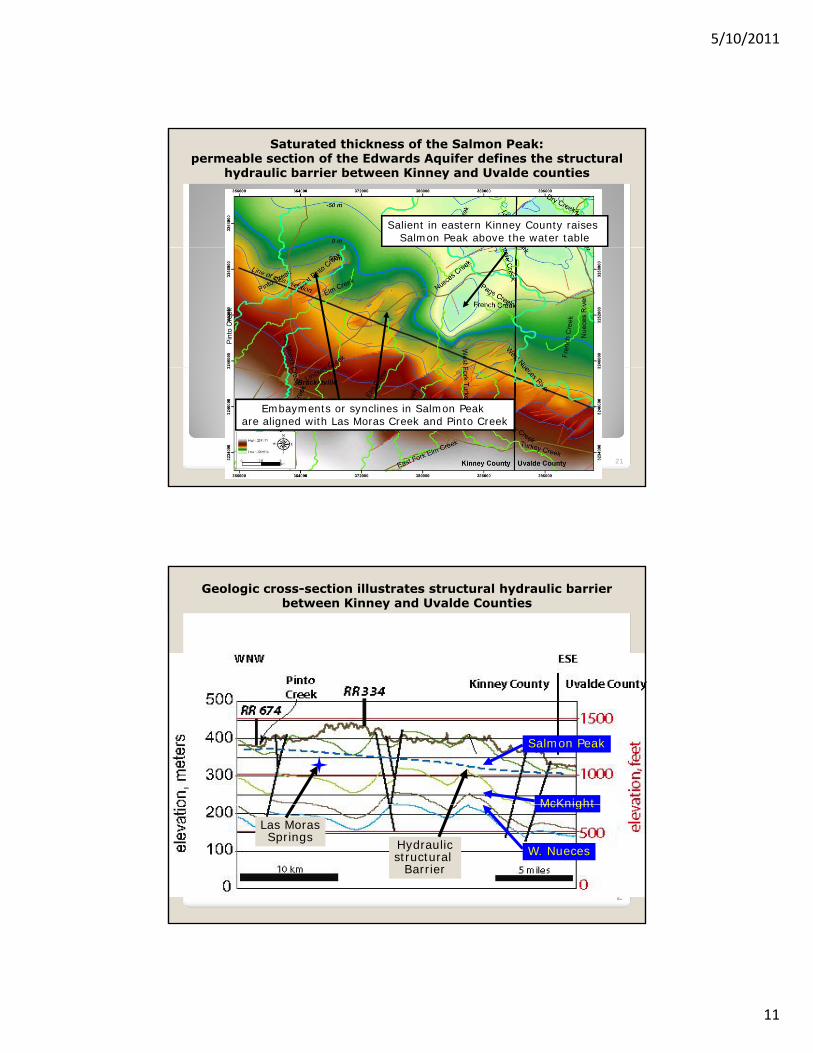
Saturated thickness of the Salmon Peak:permeable section of the Edwards Aquifer defines the structural
hydraulic barrier between Kinney and Uvalde counties
Salient in eastern Kinney County raises Salmon Peak above the water table
21
Embayments or synclines in Salmon Peak are aligned with Las Moras Creek and Pinto Creek
Geologic cross-section illustrates structural hydraulic barrier between Kinney and Uvalde Counties
Salmon Peak
McKnight
22
McKnight
W. NuecesHydraulicstructural
Barrier
Las MorasSprings

5/10/2011
12
Western Uvalde County forms a separate sub-basinNot as separate as a pool (i.e., Kinney pool)
Not as hydraulically connected as within San Antonio pool
Uvalde sub-basin formed by:Uvalde sub-basin formed by:
Uvalde salient – a structural high in the bedrock
A high density of igneous intrusions
Knippa Gap
Uvalde pool
23
Facies change in the Edwards limestones – from Maverick Basin to the Devils River Trend Leona Springs
(Green et al., 2006)
Revised conceptual model is a Uvalde pool thathas high flow capacity, but limited storage
24
5/10/2011
13
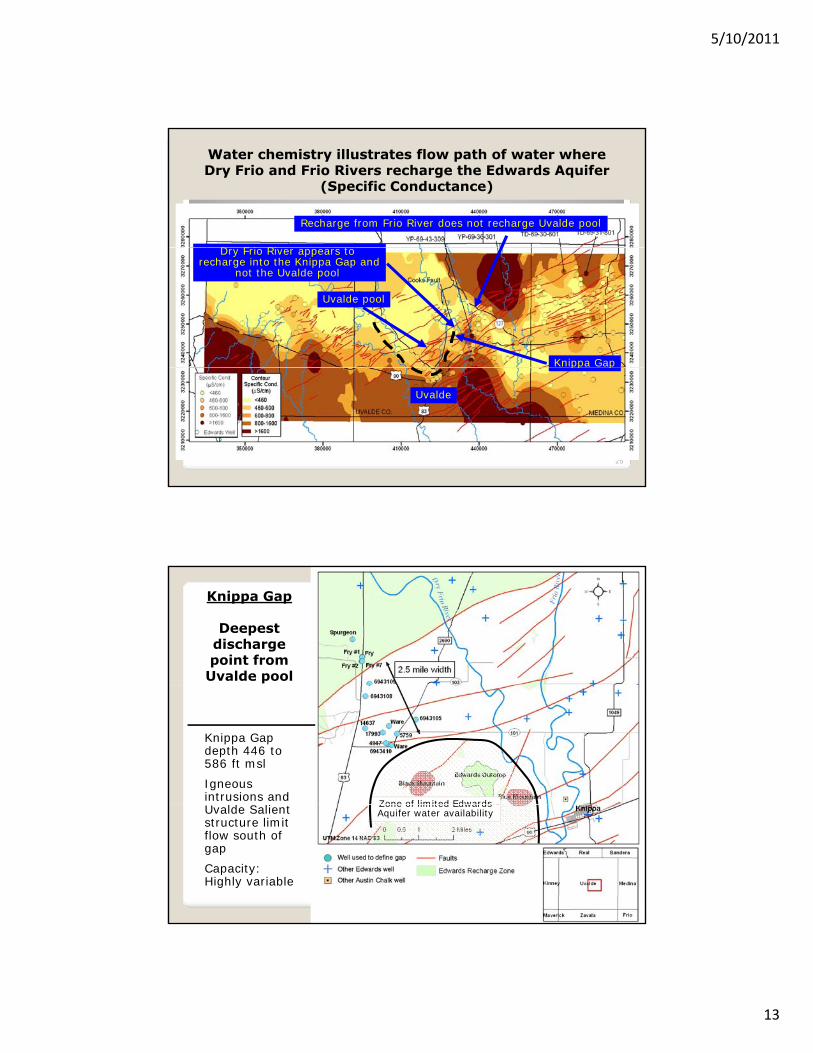
Water chemistry illustrates flow path of water where Dry Frio and Frio Rivers recharge the Edwards Aquifer
(Specific Conductance)
Recharge from Frio River does not recharge Uvalde pool
D F i Ri t
Knippa Gap
Uvalde pool
Dry Frio River appears to recharge into the Knippa Gap and
not the Uvalde pool
25
pp p
Uvalde
Knippa Gap
Deepest discharge point from Uvalde pool
Knippa Gap depth 446 to 586 ft msl
Igneous intrusions and
ld S l Zone of limited Edwards
26
Uvalde Salient structure limit flow south of gap
Capacity: Highly variable
Zone of limited Edwards Aquifer water availability

5/10/2011
14
Leona Gravels in the Leona River Floodplain Subsurface discharge
via the Buda Limestone and the Austin Chalk
J27 Drought of record = 811 ft1957
Uvalde
1000 ft
0 ft
Uvalde Index Well (J27)
Del Rio
90 SN
835 ft
900 ft
Leona Springs at Hwy 90840 ft mslAustin
810 ft
Ft Inge
Buda
27
-1000 ft
EdwardsAquifer
Buda
840 ft mslAustinChalk
Eagleford? Leona Springs at Ft Inge800 ft msl
Kdr
Leona River
Nueces River south of UvaldeDischarge to the Nueces River
is via the Austin Chalk at springs south of Uvalde
28
Nueces RiverSprings
No baseflow in Nueces River
5/10/2011
15
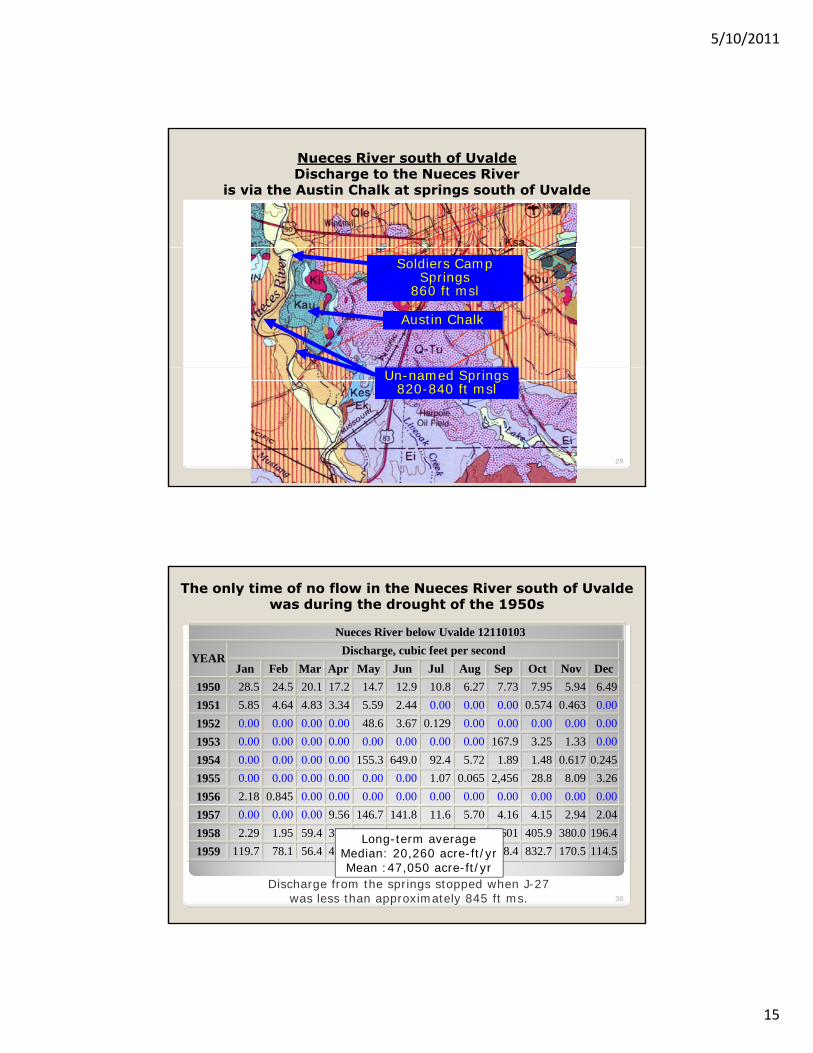
Nueces River south of UvaldeDischarge to the Nueces River
is via the Austin Chalk at springs south of Uvalde
Soldiers Camp Springs
860 ft msl
Austin Chalk
29
Un-named Springs820-840 ft msl
The only time of no flow in the Nueces River south of Uvalde was during the drought of the 1950s
Nueces River below Uvalde 12110103
Discharge, cubic feet per second YEAR
Jan Feb Mar Apr May Jun Jul Aug Sep Oct Nov Dec
1950 28 5 24 5 20 1 17 2 14 7 12 9 10 8 6 27 7 73 7 95 5 94 6 491950 28.5 24.5 20.1 17.2 14.7 12.9 10.8 6.27 7.73 7.95 5.94 6.49
1951 5.85 4.64 4.83 3.34 5.59 2.44 0.00 0.00 0.00 0.574 0.463 0.00
1952 0.00 0.00 0.00 0.00 48.6 3.67 0.129 0.00 0.00 0.00 0.00 0.00
1953 0.00 0.00 0.00 0.00 0.00 0.00 0.00 0.00 167.9 3.25 1.33 0.00
1954 0.00 0.00 0.00 0.00 155.3 649.0 92.4 5.72 1.89 1.48 0.617 0.245
1955 0.00 0.00 0.00 0.00 0.00 0.00 1.07 0.065 2,456 28.8 8.09 3.26
1956 2.18 0.845 0.00 0.00 0.00 0.00 0.00 0.00 0.00 0.00 0.00 0.00
30
1957 0.00 0.00 0.00 9.56 146.7 141.8 11.6 5.70 4.16 4.15 2.94 2.04
1958 2.29 1.95 59.4 31.5 17.1 3,496 194.4 44.0 1,601 405.9 380.0 196.4
1959 119.7 78.1 56.4 41.4 58.0 615.0 378.2 152.9 318.4 832.7 170.5 114.5
Discharge from the springs stopped when J-27
was less than approximately 845 ft ms.
Long-term averageMedian: 20,260 acre-ft/yrMean :47,050 acre-ft/yr
5/10/2011
16
880
890
900
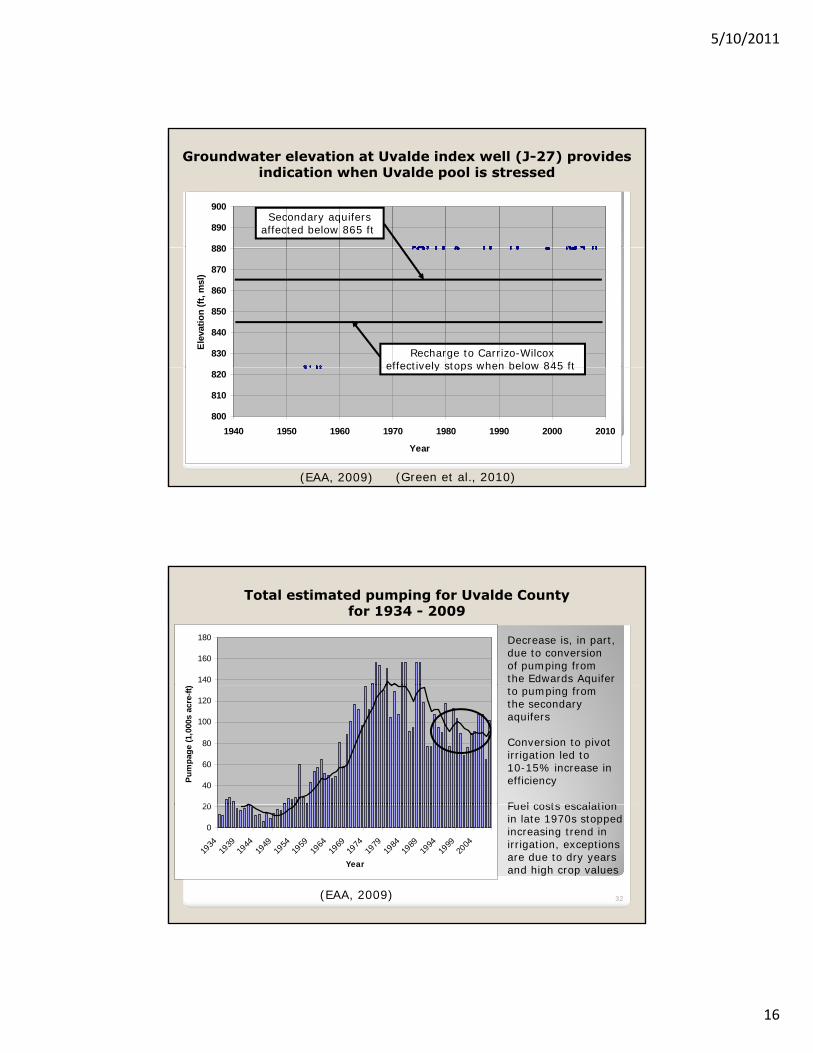
Groundwater elevation at Uvalde index well (J-27) provides indication when Uvalde pool is stressed
Secondary aquifersaffected below 865 ft
830
840
850
860
870
880
Ele
vati
on
(ft
, msl
)
Recharge to Carrizo-Wilcoxeffectively stops when below 845 ft
31
800
810
820
1940 1950 1960 1970 1980 1990 2000 2010
Year
(EAA, 2009)
effectively stops when below 845 ft
(Green et al., 2010)
Total estimated pumping for Uvalde County for 1934 - 2009
140
160
180 Decrease is, in part,due to conversionof pumping fromthe Edwards Aquifer
20
40
60
80
100
120
Pu
mp
age
(1,0
00s
acre
-ft) to pumping from
the secondary aquifers
Conversion to pivot irrigation led to 10-15% increase in efficiency
Fuel costs escalation
32
0
20
1934
1939
1944
1949
1954
1959
1964
1969
1974
1979
1984
1989
1994
1999
2004
Year
(EAA, 2009)
Fuel costs escalationin late 1970s stoppedincreasing trend in irrigation, exceptionsare due to dry yearsand high crop values
5/10/2011
17
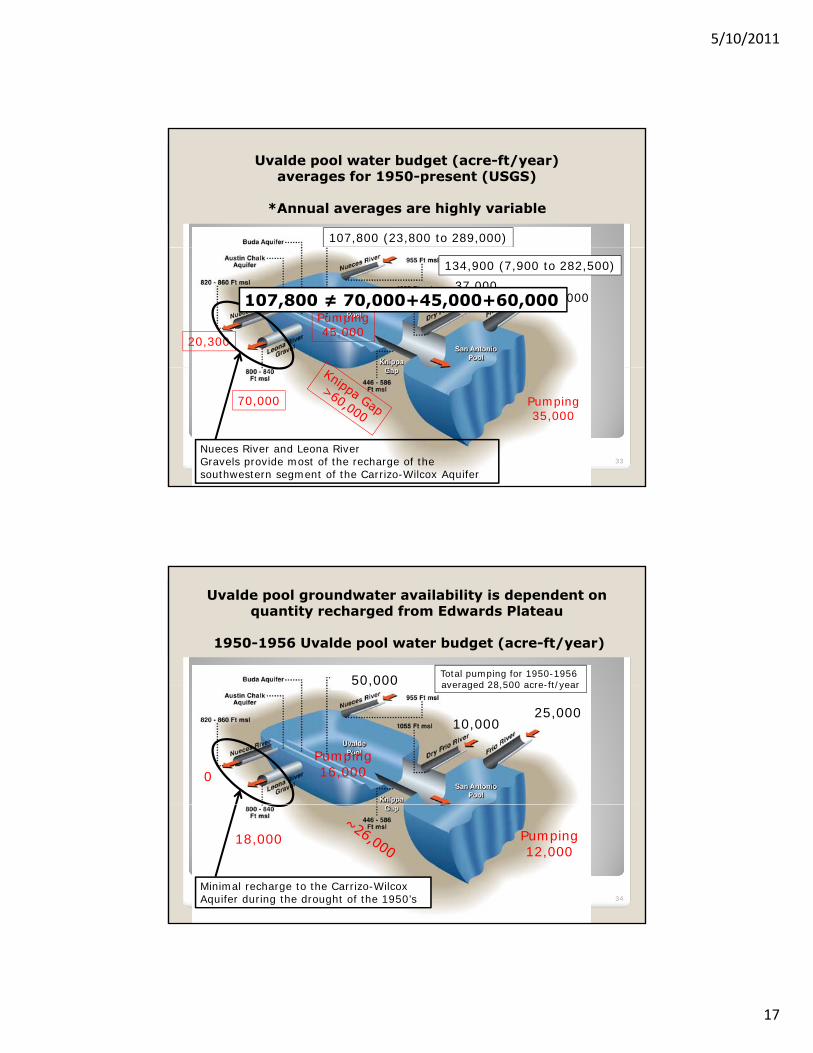
Uvalde pool water budget (acre-ft/year)averages for 1950-present (USGS)
*Annual averages are highly variable
107,800 (23,800 to 289,000)
37,00098,000
20,300
Pumping45,000
134,900 (7,900 to 282,500)
107,800 ≠ 70,000+45,000+60,000
33
70,000 Pumping35,000
Nueces River and Leona River Gravels provide most of the recharge of the southwestern segment of the Carrizo-Wilcox Aquifer
Uvalde pool groundwater availability is dependent on quantity recharged from Edwards Plateau
1950-1956 Uvalde pool water budget (acre-ft/year)
50,000 Total pumping for 1950-1956 averaged 28 500 acre-ft/year,
10,00025,000
0
Pumping16,000
averaged 28,500 acre-ft/year
34
18,000 Pumping12,000
Minimal recharge to the Carrizo-Wilcox Aquifer during the drought of the 1950’s
5/10/2011
18
Summary
The upper Trinity Aquifer (top 150 ft of the Glen Rose) is more hydraulically similar to Edwards Aquifer than previously thoughtpreviously thought
Protecting the southern Edwards Aquifer Contributing Zone is critically important to protecting Edwards Aquifer
Kinney County forms a separate pool in the Edwards Aquifer
Western Uvalde County (west of Knippa Gap) forms a pool that is not separate, but hydraulically restricted from San Antonio pool of the Edwards Aquifer
Ronald T. Green, Ph.D., P.G.Institute ScientistGeosciences and Engineering Divisiong gSouthwest Research Institute6220 CulebraSan Antonio, Texas 782381.210.522.5305 (office)1.210.522.5184 (fax)1.210.316.9242 (cell)[email protected]
3636
Contact Information