Embed Size (px)
Citation preview

U.S. Department of the InteriorU.S. Geological Survey
Circular 1332
The Quality of Our Nation’s Waters
National Water-Quality Assessment Program
Quality of Water from Domestic Wells in Principal Aquifers of the United States, 1991–2004Overview of Major Findings

Front cover. Photographs from iStock Photos (middle photograph) and U.S. Geological Survey.

Quality of Water from Domestic Wells in Principal Aquifers of the United States, 1991–2004
Overview of Major Findings
By Leslie A. DeSimone, Pixie A. Hamilton, and Robert J. Gilliom
National Water-Quality Assessment Program
Circular 1332
U.S. Department of the InteriorU.S. Geological Survey

ii
U.S. Department of the InteriorKEN SALAZAR, Secretary
U.S. Geological SurveySuzette M. Kimball, Acting Director
U.S. Geological Survey, Reston, Virginia: 2009
For product and ordering information: World Wide Web: http://www.usgs.gov/pubprod Telephone: 1-888-ASK-USGS
For more information on the USGS—the Federal source for science about the Earth, its natural and living resources, natural hazards, and the environment: World Wide Web: http://www.usgs.gov Telephone: 1-888-ASK-USGS
Any use of trade, product, or firm names is for descriptive purposes only and does not imply endorsement by the U.S. Government.
Although this report is in the public domain, permission must be secured from the individual copyright owners to reproduce any copyrighted materials contained within this report.
Suggested reference:DeSimone, L.A., Hamilton, P.A., Gilliom, R.J., 2009, Quality of water from domestic wells in principal aquifers of the United States, 1991–2004—Overview of major findings: U.S. Geological Survey Circular 1332, 48 p.
Library of Congress Cataloging-in-Publication Data
Quality of water from domestic wells in principal aquifers of the United States, 1991–2004—Overview of major findings/ by Leslie A. DeSimone,... [et al.]. Includes bibliographical references.2009922297
ISBN: 9781411323506

Foreword iii
ForewordThe U.S. Geological Survey (USGS) is committed to providing the Nation with reliable scientific
information that helps to enhance and protect the overall quality of life and that facilitates effective management of water, biological, energy, and mineral resources (http://www.usgs.gov/). Informa-tion on the Nation’s water resources is critical to ensuring long-term availability of water that is safe for drinking and recreation and is suitable for industry, irrigation, and fish and wildlife. Population growth and increasing demands for water make the availability of that water, now measured in terms of quantity and quality, even more essential to the long-term sustainability of our communities and ecosystems.
The USGS implemented the National Water-Quality Assessment (NAWQA) Program in 1991 to support national, regional, state, and local information needs a
y (http://water.usgs.gov/nawqa). The Nour Nation’s streams and ground water?
nd decisions related to water-quality management and polic AWQA Program is designed to answer: What is the quality of How are conditions changing over time? How do natural features and human activities affect the quality of streams and ground water, and where are those effects most pronounced? By combining information on water chemistry, physical characteristics, stream habitat, and aquatic life, the NAWQA Program aims to provide science-based insights for current and emerging water issues and priorities. From 1991–2001, the NAWQA Program completed interdisciplinary assessments and established a baseline understanding of water-quality conditions in 51 of the Nation’s river basins and aquifers, referred to as Study Units (http://water.usgs.gov/nawqa/studyu.html).
National and regional assessments are ongoing in the second decade (2001–2012) of the NAWQA Program as 42 of the 51 Study Units are selectively reassessed. These assessments extend the findings in the Study Units by determining status and trends at sites that have been consistently monitored for more than a decade, and filling critical gaps in characterizing the quality of surface water and ground water. For example, increased emphasis has been placed on assessing the quality of source water and finished water associated with many of the Nation’s largest community water systems. During the second decade, NAWQA is addressing five national priority topics that build an understanding of how natural features and human activities affect water quality, and establish links between sources of contaminants, the transport of those contaminants through the hydrologic system, and the potential effects of contaminants on humans and aquatic ecosystems. Included are studies of the fate of agricultural chemicals, effects of urbanization on stream ecosystems, bioac-cumulation of mercury in stream ecosystems, effects of nutrient enrichment on aquatic ecosystems, and transport of contaminants to public-supply wells. In addition, national syntheses of information on pesticides, volatile organic compounds (VOCs), nutrients, trace elements, and aquatic ecology are continuing.
The USGS aims to disseminate credible, timely, and relevant science information to address prac-tical and effective water-resource management and strategies that protect and restore water quality. We hope this NAWQA publication will provide you with insights and information to meet your needs, and will foster increased citizen awareness and involvement in the protection and restoration of our Nation’s waters.
The USGS recognizes that a national assessment by a single program cannot address all water-resource issues of interest. External coordination at all levels is critical for cost-effective manage-ment, regulation, and conservation of our Nation’s water resources. The NAWQA Program, therefore, depends on advice and information from other agencies—Federal, state, regional, interstate, tribal, and local—as well as nongovernmental organizations, industry, academia, and other stakeholder groups. Your assistance and suggestions are greatly appreciated.
Matthew C. Larsen Associate Director for Water

iv
This report is one of a series of publications, The Quality of Our Nation’s Waters, which describes major findings of the NAWQA Program on water-quality issues of regional and national concern. This report presents a national assessment of the quality of water in private domestic wells based on samples from about 2,100 wells located in 48 states and tapping 30 regional aquifers used for water supply. Compared to previous investigations of domestic well water quality, “Quality of Water from Domestic Wells in Principal Aquifers of the United States, 1991–2004—Overview of Major Findings” greatly expands the number of contaminants assessed in domestic wells and improves geographic coverage of wells sampled. Other reports in this series focus on specific water-quality constituents of concern, such as pesticides and volatile organic compounds in ground water and surface water, as well as on the effects of contaminants and habitat conditions on aquatic ecosystem health. Each report builds toward a more comprehensive understanding of regional and national water resources.
The information in this series is intended primarily for those interested or involved in resource management and protection, conservation, regulation, and policymaking at regional and national levels. In addition, the information is relevant to those at a local level who wish to know more about the general quality of streams and ground water in areas near where they live and how that quality compares with other areas across the Nation.
Donna N. Myers
NAWQA Program Chief U.S. Geological Survey
Introduction to this report and the NAWQA series
The Quality of Our Nation’s Waters

Contents v
Contents
Summary of Major Findings and Implications .................................................................................... 1
Introduction ............................................................................................................................................... 7
NAWQA’s Approach to Assessing the Quality of Water from Domestic Wells .......................... 11
Major Findings ........................................................................................................................................ 17
More than one in five (23 percent) domestic wells contained one or more contaminants at a concentration greater than a human-health benchmark ......... 17
Contaminants most often found at concentrations greater than human-health benchmarks were inorganic chemicals, with all but nitrate derived primarily from natural sources ....................................................................................................... 18
Nitrate is the only contaminant derived primarily from man-made sources that was found at concentrations greater than a human-health benchmark in more than 1 percent of wells .................................................................................................... 25
Man-made organic compounds were detected in more than half (60 percent) of the sampled wells, but concentrations were seldom greater than human- health benchmarks (less than 1 percent of wells) ...................................................... 28
Microbial contaminants were detected in as many as one-third of the approximately 400 wells sampled .................................................................................. 31
About half (48 percent) of the sampled wells contained at least one contaminant at a level or concentration outside the range of values recommended by USEPA for the aesthetic quality of water ..................................................................... 32
Contaminants usually co-occurred with other contaminants as mixtures .......................... 35
References Cited .................................................................................................................................... 41
Abbreviations, Acronyms, and Units of Measure ............................................................................. 48

This page intentionally left blank

More than 43 million people—about 15 percent of the U.S. population—rely on domestic wells as their source of drinking water (Hutson and others, 2004). The quality and safety of water from domestic wells, also known as private wells, are not regulated by the Federal Safe Drinking Water Act or, in most cases, by state laws. Rather, individual homeowners are responsible for maintaining their domestic well systems and for monitoring water quality. The lack of regular monitoring of domestic wells makes periodic assessments at national, regional, and local scales important sources for providing information about this key source of drinking water.
This study from the National Water-Quality Assessment (NAWQA) Program of the U.S. Geological Survey (USGS) assesses water-quality conditions for about 2,100 domestic wells. The sampled wells are located in 48 states and in parts of 30 regionally extensive aquifers used for water supply in the United States. As many as 219 properties and contaminants, including pH, major ions, nutrients, trace elements, radon, pesticides, and volatile organic compounds (VOCs), were measured. Fecal indicator bacteria and additional radionuclides were analyzed for a smaller number of wells. The large number of contaminants assessed and the broad geographic coverage of the present study provides a foundation for an improved understanding of the quality of water from the major aquifers tapped by domestic supply wells in the United States.
Major findings and implications of this study are summarized on pages 2–5 and results are described in greater detail in the remainder of the report.
Additional Information
For more information on domestic well water quality, refer to DeSimone (2009).The report is available at http://pubs.usgs.gov/sir/2008/5227.
Summary of Major Findings and Implications

2 Quality of Water from Domestic Wells in Principal Aquifers of the United States, 1991–2004
Major Findings
• Morethanoneinfive(23percent)sampleddomesticwellscontainedoneormorecontaminantsataconcentrationgreaterthanahuman-healthbenchmark(p17).Concentrations of at least one chemical contaminant were greater than human-health benchmarks—U.S. Environmental Protection Agency (USEPA) Maximum Contaminant Levels (MCLs) or USGS Health-Based Screening Levels (HBSLs)—in 23 percent of 1,389 domestic wells sampled in this study for which all contaminants were measured. Concentrations of at least one chemical contaminant were greater than an established MCL in 13 percent of the 1,389 wells. These results do not include microbial contaminants, which were measured in only about 400 wells.
• Contaminantsmostoftenfoundatconcentrationsgreaterthanhuman-healthbenchmarkswereinorganicchemicals,withallbutnitratederivedprimarilyfromnaturalsources(p.18–24).The contaminants most frequently found at concentrations greater than benchmarks were radon, several trace elements (including arsenic and uranium), nitrate, and fluoride. Each of these was individually greater than its benchmark in about 1 to 7 percent of wells nationally (using the higher of two USEPA proposed MCLs for radon). Except for nitrate, these contaminants in ground water all originate primarily from natural geologic sources. Regional patterns in concentrations were apparent for many contaminants, such as radon, as the result of the geographic distributions of natural sources.
• Nitrateistheonlycontaminantderivedprimarilyfromman-madesourcesthatwasfoundatconcentrationsgreaterthanahuman-healthbenchmarkinmorethan1percentofwells(p.25–27).Nitrate was measured at concentrations greater than the USEPA MCL of 10 milligrams per liter as N in 4.4 percent of all wells and was most frequently found at these concentrations in wells in agricultural areas. Nitrate occurs naturally, but elevated concentrations usually originate from man-made sources, including fertilizers, livestock, and septic systems. Nitrate concentrations followed regional patterns consistent with those found in other studies and were highest in the upper Midwest, Great Plains, and the Central Valley in California. A separate analysis of domestic wells in areas of relatively intense agricultural land use showed that concentrations of nitrate were greater than the MCL in nearly 25 percent of about 400 wells sampled in those areas.
• Man-madeorganiccompoundsweredetectedinmorethanhalf(60percent)ofthesampledwells,butconcentrationswereseldomgreaterthanhuman-healthbenchmarks(lessthan1percentofwells)(p.28–30).Low-level occurrences of man-made organic compounds in 60 percent of the wells sampled—including herbicides, insecticides, solvents, disinfection by-products, gasoline hydrocarbons and oxygenates, refrigerants, and fumigants—indicate the diverse industrial, agricultural, and urban sources that can affect the quality of the

Summary of Major Findings and Implications 3
source water to domestic wells. Only 7 of the 168 organic compounds that were analyzed—two insecticides, one herbicide, two solvents, and two fumigants—were found in one or more wells at concentrations greater than human-health benchmarks, and organic compounds were found in less than 1 percent of sampled wells at these concentrations.
• Microbialcontaminantsweredetectedinasmanyasone-thirdoftheapproximately400wellssampled(p.31).Escherichia coli (E. coli) was detected in 7.9 percent of 397 sampled wells. E. coli typically is not harmful but is an indicator of fecal contamination and, therefore, the possible presence of pathogens. Total coliform bacteria, a broader group that includes bacteria from soil, water, and animal feces, were detected in 34 percent of 378 sampled wells.
• Abouthalf(48percent)ofthesampledwellscontainedatleastonecontaminantatalevelorconcentrationoutsidetherangeofvaluesrecommendedbyUSEPAfortheaestheticqualityofwater(p.32–34).Values or concentrations of pH, dissolved solids, iron, and manganese in samples collected prior to any in-home treatment were individually outside the ranges defined by USEPA Secondary Maximum Contaminant Levels (SMCLs) in 15 to 21 percent of wells. Fluoride was greater than its SMCL in 4 percent of wells. Low pH was prevalent in aquifers in the eastern United States. About 60 percent of the sampled wells, mostly in the central United States, contained water that generally is considered to be “hard.” Undesirable effects of elevated values or concentrations of these properties and contaminants include corrosion or scale deposition in pipes and plumbing, laundry staining, unpleasant water color or taste, and teeth staining.
• Contaminantsusuallyco-occurredwithothercontaminantsasmixtures(p.35–39).Contaminants found in domestic wells usually co-occurred with other contaminants as mixtures, rather than alone, which is a potential concern because the total toxicity of a mixture can be greater than that of any single contaminant. Although only 4 percent of domestic wells contained mixtures of two or more contaminants at concentrations individually greater than human-health benchmarks (excluding microbial contaminants), most of the sampled wells (73 percent) contained mixtures of multiple contaminants with concentrations greater than one-tenth of their individual benchmarks. The most common mixtures were composed of inorganic contaminants, including nitrate, arsenic, radon, and uranium. Unique mixtures composed of specific combinations of two or more of these four contaminants were found in 12 to 32 percent of wells at concentrations greater than one-tenth of their individual benchmarks. Nitrate or radon, each at concentrations greater than one-tenth of respective benchmarks, co-occurred with the organic contaminants atrazine, deethylatrazine, or chloroform in 10 to 15 percent of wells.
Summary of Major Findings and Implications

4 Quality of Water from Domestic Wells in Principal Aquifers of the United States, 1991–2004
Implications
• The presence of contaminants at levels greater than human-health benchmarks in 23 percent of domestic wells, which are not routinely monitored by public agencies, underscores the importance of public education, testing, and additional assessment regarding the water quality of domestic wells.
• Naturally occurring contaminants, such as arsenic and radon, may be present in ground water at concentrations of potential concern for human health in relatively undeveloped settings that otherwise may not be perceived as vulnerable to contamination. Moreover, traditional well-head protection approaches to preventing contamination generally are not effective for contaminants that occur naturally in ground water.
• Contaminants from man-made sources, such as nitrate and selected organic compounds that persist in ground water, may be present from previous land uses, pointing to the importance of public education and water-quality testing in areas where land use has changed.
• The widespread occurrence and variety of man-made organic compounds detected in domestic wells, although usually at levels below available human-health benchmarks, indicates the presence of contaminant sources and transport pathways for all principal aquifers. The ubiquitous presence of sources and transport pathways needs to be considered for long-term monitoring and protection of water quality. Continued water-quality assessment, monitoring, and research are needed to more fully understand natural and man-made factors and transport mechanisms associated with the movement of contaminants to domestic wells.
• The common occurrence of mixtures of multiple contaminants in domestic wells requires further investigation to evaluate the potential significance to human health. The combined toxicity of contaminant mixtures can be greater than that of any single contaminant and the potential for additive or synergistic effects of mixtures of contaminants at low levels is not well understood. Available human-health benchmarks do not allow full assessment of the potential health effects of contaminant mixtures because benchmarks have been established for only a few specific mixtures and are not yet available for all individual contaminants.
• Regional patterns in concentrations of naturally occurring trace elements and radionu-clides indicate that customized approaches for monitoring, management, and treat-ment for some specific geographic areas could be effective. Contaminant occurrence, however, also can vary over short distances and with depth within aquifers because of variability in contaminant sources, aquifer characteristics, and geochemical condi-tions, again pointing to the importance of water-quality testing of individual wells.
• The greatest potential for successfully addressing water-quality concerns for domestic wells is with targeted approaches in specific areas where (1) concentrations of specific contaminants are highest in relation to human-health benchmarks, and (2) high pro-portions of the population depend on domestic wells. Improved information is needed on the number of people consuming water from domestic wells in specific regions and aquifers, and on water-quality conditions in the particular aquifer zones that are tapped by wells. Such information is essential for evaluating the potential human-health implications and possible mitigation approaches.

Understanding Study Results
Findings from this study are based on a synthesis of data from National Water-Quality Assessment (NAWQA) Program ground-water resource assessments of key hydrologic systems of the Nation. Several aspects of the original NAWQA study design and how results are interpreted in relation to potential human-health concerns are important to understand:
•The NAWQA assessments focused on ground-water aquifers used for water supply, and the sampled wells were selected to represent typical conditions in these aquifers. Because the sampled domestic wells are located only in NAWQA ground-water study areas, they may not be representative of all domestic wells throughout the United States.
•Water samples were collected prior to in-home plumbing or treatment, and thus represent the quality of source water from the domestic wells, rather than water consumed in homes after passing through distribution pipes and any treatment systems that may be used.
• In this report, following the terminology of the Safe Drinking Water Act, all constituents measured in water are referred to as “contaminants,” regardless of concentration or potential health effects. Thus, the presence of a contaminant does not necessarily mean that there is a human-health concern (see sidebar on top of page 13).
•U.S. Geological Survey (USGS) analytical methods were designed to measure contaminants at as low a concentration as possible, frequently resulting in detections at concentrations far below human-health benchmarks for drinking water (see sidebar on bottom of page 13).
•To place findings in a human health context, concentrations are compared to benchmark values for human health that include current (2009) U.S. Environmental Protection Agency (USEPA) Maximum Contaminant Levels (MCLs) and USGS Health-Based Screening Levels (HBSLs) (see sidebar on page 16).
Additional details on NAWQA’s approach to assessing the quality of water from domestic wells are described on pages 11–16.
Summary of Major Findings and Implications 5Summary of Major Findings and Implications

This page intentionally left blank

Introduction 7
IntroductionMore than 43 million people—about
15 percent of the population of the United States—rely on more than 15 million privately owned domestic wells for their drinking water (Solley and others, 1998; Hutson and others, 2004; U.S. Census Bureau, 2008). These wells are the sole source of drinking water and water for other household needs for most people in many rural areas (fig. 1).
Although most ground water in the United States is generally considered of good quality and safe to drink (U.S. Environmental Protection Agency, 2000, 2002), water-quality problems associated with domestic wells have been reported. For example, although few in number (averaging less than 20 outbreaks per year), 20 to 40 percent of the waterborne-disease outbreaks from drinking water that were reported to the U.S. Centers for Disease Control and Prevention (CDC) from 1999 to 2002 were attributed to contaminants in domestic well water, and gastrointestinal illness associated
Figure 1. In many parts of the United States, domestic wells supply drinking water for large percentages of the population. Nationwide, more than 43 million people rely on domestic wells. Data shown are from Solley and others (1998).
with domestic well water is likely underreported (Blackburn and others, 2004; Liang and others, 2006). Health risks associated with contaminants in domestic well water have also been noted to include exposure to elevated concentrations of nitrate, arsenic, radon, lead, and organic compounds (U.S. Centers for Disease Control and Prevention, 2003).
The quality and safety of water from privately owned domestic wells is not regulated under Federal or, in most cases, state laws. State and local regulations, where they exist, provide for a minimum amount of water testing (see sidebar on page 9). Individual homeowners are primarily responsible for maintaining their domestic well systems and for any water-quality monitoring that is conducted. Federal regulations under the Safe Drinking Water Act (SDWA) for public water supplies, although not directly applicable to the regulation of domestic wells, often are used to evaluate the implications of water-quality monitoring results
EXPLANATIONPopulation (1995) supplied by domestic wells, in percent of total county population
≥ 80≥ 60 and < 80≥ 40 and < 60≥ 20 and < 40< 20
8 Quality of Water from Domestic Wells in Principal Aquifers of the United States, 1991–2004
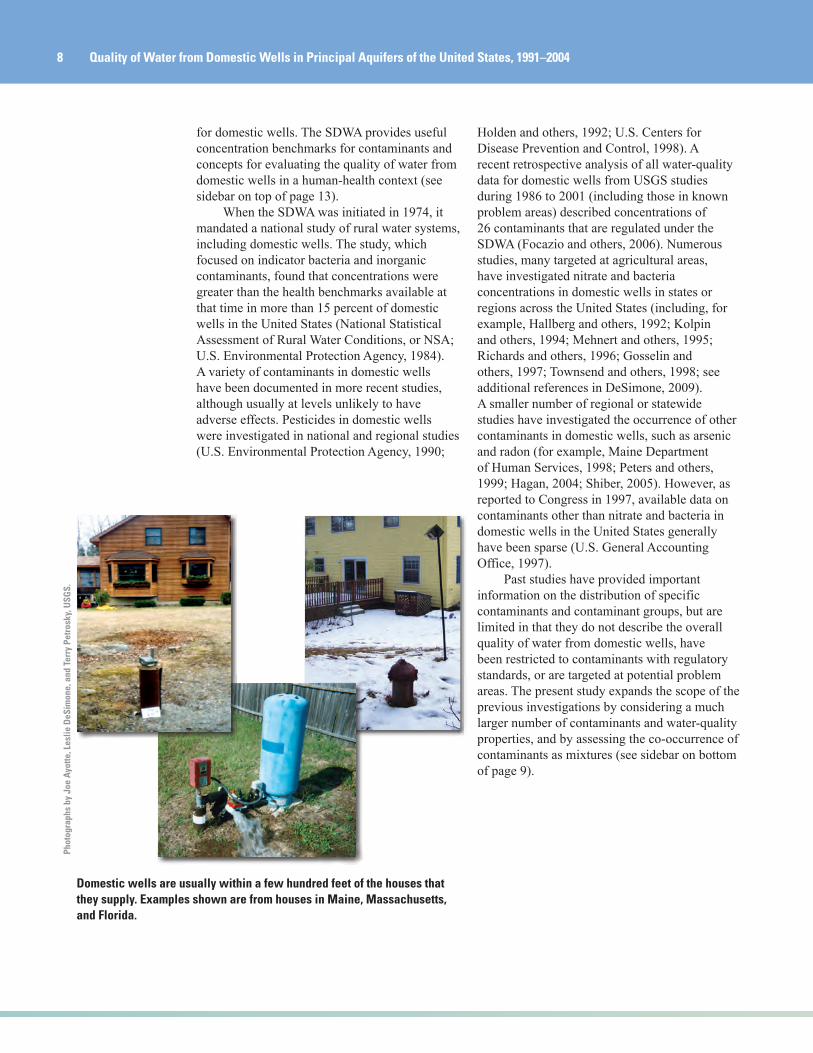
Domestic wells are usually within a few hundred feet of the houses that they supply. Examples shown are from houses in Maine, Massachusetts, and Florida.
for domestic wells. The SDWA provides useful concentration benchmarks for contaminants and concepts for evaluating the quality of water from domestic wells in a human-health context (see sidebar on top of page 13).
When the SDWA was initiated in 1974, it mandated a national study of rural water systems, including domestic wells. The study, which focused on indicator bacteria and inorganic contaminants, found that concentrations were greater than the health benchmarks available at that time in more than 15 percent of domestic wells in the United States (National Statistical Assessment of Rural Water Conditions, or NSA; U.S. Environmental Protection Agency, 1984). A variety of contaminants in domestic wells have been documented in more recent studies, although usually at levels unlikely to have adverse effects. Pesticides in domestic wells were investigated in national and regional studies (U.S. Environmental Protection Agency, 1990;
Holden and others, 1992; U.S. Centers for Disease Prevention and Control, 1998). A recent retrospective analysis of all water-quality data for domestic wells from USGS studies during 1986 to 2001 (including those in known problem areas) described concentrations of 26 contaminants that are regulated under the SDWA (Focazio and others, 2006). Numerous studies, many targeted at agricultural areas, have investigated nitrate and bacteria concentrations in domestic wells in states or regions across the United States (including, for example, Hallberg and others, 1992; Kolpin and others, 1994; Mehnert and others, 1995; Richards and others, 1996; Gosselin and others, 1997; Townsend and others, 1998; see additional references in DeSimone, 2009). A smaller number of regional or statewide studies have investigated the occurrence of other contaminants in domestic wells, such as arsenic and radon (for example, Maine Department of Human Services, 1998; Peters and others, 1999; Hagan, 2004; Shiber, 2005). However, as reported to Congress in 1997, available data on contaminants other than nitrate and bacteria in domestic wells in the United States generally have been sparse (U.S. General Accounting Office, 1997).
Past studies have provided important information on the distribution of specific contaminants and contaminant groups, but are limited in that they do not describe the overall quality of water from domestic wells, have been restricted to contaminants with regulatory standards, or are targeted at potential problem areas. The present study expands the scope of the previous investigations by considering a much larger number of contaminants and water-quality properties, and by assessing the co-occurrence of contaminants as mixtures (see sidebar on bottom of page 9).
Phot
ogra
phs
by J
oe A
yotte
, Les
lie D
eSim
one,
and
Ter
ry P
etro
sky,
USG
S.

Introduction 9
Water-Quality Testing in Domestic Wells
State and local regulations, where they exist, typically require a minimum amount of water testing for domestic wells. Regulations apply primarily at the time of well installation and are limited in scope. Less than half of the states require testing of water from new domestic wells, typically for bacteria and nitrate. County or other local testing requirements for new wells also may exist. Water-quality testing at the time of home sales is a condition of some home loans and is required by some states (Oregon Department of Human Services, 2003; Veterans Benefits Administration, 2005; New Jersey Department of Environmental Protection, 2008). A few states also conduct free voluntary testing programs or test high-risk wells (Riding and Quilter, 2004; State Water Resources Control Board, 2005; Florida Department of Health, 2006). Many health and environmental agencies and non-profit organizations advise homeowners on testing procedures and recommend annual test-ing (U.S. Environmental Protection Agency, 2002; National Ground Water Association, 2006).
These programs, regulations, and recommendations all contribute to the safety of drinking water supplied by domestic wells. However, the limited number of contaminants assessed, the small numbers of wells tested, and the infrequent and voluntary nature of the testing do not provide domestic well users with the same level of protection afforded to users of public water systems. On the other hand, enormous resources would be needed to monitor the millions of domestic wells in the United States in a manner similar to the monitoring conducted for public water systems, of which there were 170,000 in the United States in 2000—about 100 times fewer than the number of domestic wells (U.S. Environmental Protection Agency, 2001).
In the absence of routine monitoring of individual wells, water-quality information from a wide variety of sources is commonly used to assess the potential occurrence and distribution of contaminants in domestic wells. Sources of information for assessing specific aspects of domestic-well water quality include one-time statewide or regional surveys, voluntary testing programs, and ambient ground-water monitoring programs (see references in DeSimone, 2009). Results from these studies are useful for prioritizing contaminants for further study, identify-ing areas of concern, guiding local testing recommendations, and identifying factors that potentially affect the occurrence of contaminants in wells. However, differences in study designs and methods make available survey studies difficult to compare and extrapolate (Ray and Schock, 1996). Many statewide programs have targeted vulnerable aquifers and voluntary testing programs may be biased toward wells with higher contaminant concentrations (Peters and others, 1999).
Comparison With Previous Studies
Results of this study are generally consistent with previous studies of water quality in domestic wells, but they also more fully characterize a comprehensive suite of contaminants and contaminant mixtures than previously reported. Specifically, this study expands findings on domestic wells in several ways, including national-scale information about:
• low-level occurrences of pesticides and volatile organic compounds;
• a broad suite of naturally occurring trace elements and their potential significance to human health;
• water properties, such as pH and hardness, that affect the aesthetic quality of water;
• mixtures of contaminants, which may be more toxic than individual occurrences; and
• contaminant occurrence within regional aquifers, which provides a framework for understanding water-quality conditions within units of similar hydrogeology.
Detailed comparisons with previous regional, statewide, and national studies of the quality of water from domestic wells are provided in DeSimone (2009). Some examples include widespread detections of microbial contaminants in this study (34 percent of sampled wells) and the USEPA National Statistical Analysis (NSA) of Rural Water Conditions (42 percent), conducted in the late 1970s (U.S. Environmental Protection Agency, 1984). Both of these studies also reported dissolved solids, iron, and manganese as relatively common nuisance contaminants, and nitrate as one of the contaminants most frequently present at concentrations greater than human-health benchmarks (4 percent of wells with concentrations greater than the Maximum Contaminant Level (MCL) in the NSA, compared to 4.4 percent in the present study). Results of the present study indicate slightly lower concentrations of some contaminants than a previous national retrospective study by Focazio and others (2006), which most likely reflects differences in well selection and study design. Specifically, the present study includes wells targeted in hydrogeologic settings without regard to land use or known water-quality problems. Focazio and others (2006), by comparison, included all domestic wells available in the USGS water-data information system, regardless of study design or study objective, which could result in the inclusion of wells near contaminated sites or from studies that targeted agricultural areas.

Most of the domestic wells sampled in this study were drilled wells, which can penetrate hundreds of feet into consolidated sediments or bedrock.
10 Quality of Water from Domestic Wells in Principal Aquifers of the United States, 1991–2004
Types of Domestic Wells
There are several different types of domestic wells used by homeowners across the United States. The oldest wells were dug by hand. These wells typically are shallow and of large diameter (several feet), and may be lined with stones, brick, or tile. They typically extend only a short distance below the water table (Waller, 1991). Driven wells are constructed by driving small-diameter pipe into saturated unconsolidated sand and gravel. Driven wells typically are deeper than dug wells but are still relatively shallow. Most modern wells are drilled using truck-mounted machines and rotary or percussion methods. Drilled wells may be several hundred to more than a thousand feet in depth, and can penetrate consolidated sediments and bedrock. Drilled wells in unconsolidated sediments have well casing and a well screen to prevent collapse of the borehole; drilled wells in bedrock typically are cased through the overlying soil and thin sediment, where present, and are open holes below. The domestic wells included in this study were mostly (more than 90 percent) drilled wells, with steel or PVC casings 4 to 8 inches in diameter. A few dug and driven wells also were sampled. The wells averaged 174 ft in depth, with most (80 percent) between 50 and 335 ft in depth. The average age of the wells was about 20 years, with most between 10 and 45 years old.
Soil andunconsolidatedsediment
Wellcasing
Water table
Soil andunconsolidatedsediment
Wellcasing
Water table
Pressuretank
Basementof home
Pump
Electricalcontrol box
Bedrock
Soil andunconsolidatedsediment
Wellcasing
Open hole
Water table
Drilled well
Mod
ified
from
Uni
vers
ity o
f Rho
de Is
land
Coo
pera
tive
Exte
nsio
n Pr
ogra
m (2
003)
.
Not to scale

NAWQA’s Approach to Assessing the Quality of Water from Domestic Wells 11
This analysis provides an assessment of water-quality conditions for about 2,100 domestic wells across the United States. The wells are located in 48 states and represent selected parts of 30 regionally extensive aquifers used for water supply (fig. 2). As many as 219 properties and contaminants, including pH, major ions, nutrients, trace elements, radon, pesticides, and VOCs, were measured. Fecal indicator bacteria and additional radionuclides were analyzed for smaller numbers of wells (table 1). Data were collected using consistent sampling, analytical, and quality assurance methods. All constituents are considered contaminants by the SDWA (see sidebar on top of page 13), regardless of concentration or potential health effects. A subset of 1,389 of the sampled wells, located in 45 states and 25 principal aquifers, had uniform and complete chemical analyses (no data gaps for any contaminant groups). These 1,389 wells are used for analysis of contaminant co-occurrence and mixtures.
Findings from this study are based on a synthesis of data for domestic wells that were collected as part of multiple NAWQA ground-water assessments conducted across the Nation. Several aspects of the study design and data characteristics, as well as the approach to data analysis and interpretation, are important to consider when interpreting the findings in this report.
• Principal aquifers, which are regionally extensive aquifers used for potable water supply (U.S. Geological Survey, 2003; fig. 2), are used as a framework for regional synthesis of water-quality data within units of broadly similar permeability, rock type, geologic setting, and climate (Lapham and others, 2005). However, water-quality conditions vary substantially within principal aquifers, reflecting the heterogeneity of natural systems. In some areas, principal aquifers also may overlie or underlie less extensive local aquifers that have different water-quality characteristics, such that water-quality conditions described for a principal aquifer do not
Table 1. Physical properties and concentrations of inorganic, organic, and microbial contaminants were measured in as many as 2,160 domestic wells in this study.
Contaminant or contaminant groupApproximate numbers of
wells sampled1
Water properties2 2,050–2,140
Major ions 2,160
Trace elements
Arsenic and uranium 1,730–1,780
Boron, lithium, strontium, thallium, and vanadium 490–660
Iron and manganese 2,160
Other trace elements3 1,550–1,640
Nutrients 1,780–2,140
Radionuclides
Radon 1,960
Radionuclides other than radon 380–440
Organic compounds
Pesticides 1,370–2,120
Volatile organic compounds 1,540–1,960
Fecal indicator bacteria 380–400
Contaminant co-occurrence and mixtures 1,3901 Ranges indicate differences in number of samples for individual contaminants.2 Specific conductance, temperature, pH, dissolved oxygen, and alkalinity.3 Aluminum, antimony, barium, beryllium, cadmium, chromium, cobalt, copper, lead,
molybdenum, nickel, selenium, silver, and zinc.
NAWQA’s Approach to Assessing the Quality of Water from Domestic Wells
describe the quality of water from all domestic wells in the geographic area.
• NAWQA ground-water assessments, conducted from 1991 through 2004 in 51 study areas, focused on important water-supply aquifers that account for more than half of the Nation’s population and water use. The study areas represent typical hydrogeologic settings within the regionally extensive principal aquifers. All wells sampled in NAWQA ground-water assessments, including the domestic wells selected for this analysis, were randomly selected to represent typical aquifer conditions and were not focused in areas of known contamination. Because the sampled domestic wells are located only in the 51 study areas, they may not be representative of all domestic wells throughout the United States.

Phot
ogra
phs
by J
oe A
yotte
, Cat
hy M
unda
y, a
nd L
ane
Sim
mon
s, U
SGS.
12 Quality of Water from Domestic Wells in Principal Aquifers of the United States, 1991–2004
• Water samples were collected prior to any plumbing or treatment, and thus represent the quality of source water from the domestic wells rather than water consumed in homes after passing through distribution pipes and any treatment systems that may be used.
• Each well was sampled once during 1991–2004. Trends within the study period were not assessed, but broad changes were not expected because of the relatively slow movement of ground water.
• Detections of contaminants do not necessarily indicate a concern to human health, which depends on concentration, exposure, and toxicity. Samples were analyzed by methods with low detection levels—typically at concentrations 100 to 1,000 times lower than state and Federal standards and guidelines for drinking water. These low-level concentration data help to identify and better define the occurrence of a wide variety of contaminants in domestic wells (see sidebar on bottom of page 13).
• Comparisons between measured concentrations and human-health benchmarks, which include USEPA MCLs and USGS HBSLs, are used to provide a screening-level assessment of the potential significance to human health of a broad suite of contaminants (see sidebar on page 16).
Data used in the present study also have been selectively included in national-scale analyses of nutrients, pesticides, VOCs, trace elements, radionuclides, and microbial contaminants in the water resources of the United States and have been used to describe water-quality conditions in individual NAWQA assessment areas and in principal aquifers. These previous NAWQA studies are detailed investigations of the water quality of specific areas, the occurrence of specific contaminants in the environment, and the natural and human factors affecting water quality. Publications from these previous NAWQA studies can be accessed at http://water.usgs.gov/nawqa.
Water samples were collected prior to any treatment system that may have been in use and prior to most plumbing in the home.

Phot
ogra
ph b
y US
GS.
NAWQA’s Approach to Assessing the Quality of Water from Domestic Wells 13
What is a “Contaminant?”
A contaminant is defined by the Safe Drinking Water Act (SDWA) as “any physical, chemical, biological, or radiological substance or matter in water” (U.S. Senate, 2002). This broad definition of contaminant includes every substance that may be found dissolved or suspended in water—everything but the water molecule itself. The presence of a contaminant in water does not necessarily mean that there is a human-health concern.
Whether a particular contaminant in water is potentially harmful to human health depends on its toxicity and concentration in drinking water. In fact, many contaminants are beneficial at certain concentrations. For example, many naturally occurring inorganic contaminants, such as selenium, are required in small amounts for normal physiologic function, even though higher amounts may cause adverse health effects (Eaton and Klaassen, 2001). On the other hand, man-made organic contaminants, such as pesticides, are not required by humans and may or may not have adverse effects on people, depending on concentrations, exposure, and toxicity. As a first step toward evaluating whether a particular contaminant may adversely affect human health, its concentrations measured in water were compared to a U.S. Environmental Protection Agency (USEPA) Maximum Contaminant Level (MCL) or a U.S. Geological Survey (USGS) Health-Based Screening Level (HBSL). Concentrations greater than these water-quality benchmarks indicate the potential for human-health effects (see sidebar on page 16).
Contaminants originate from a wide range of natural and man-made sources. Most inorganic chemicals, nutrients, and microbial contaminants measured in this study occur naturally, although their concentrations in ground water may be altered by human activities. For example, nitrate is present from natural sources in many wells, but concentrations are often increased by contributions from man-made sources in agricultural and urban areas. In contrast, the organic contaminants measured in this study are all man-made, though some also may form in ground water through various chemical and biological transformation processes.
Importance of Low-Level Detections
Recent advances in laboratory analytical methods have given scientists increasingly refined tools to detect a wide range of chemicals in the environment at low concentrations. In particular, the analytical methods used in this study have low detection levels—often 100 to 1,000 times lower than state and Federal standards and guidelines for the protection of water quality. Detections of contaminants, therefore, do not necessarily indicate a concern to human health, but rather identify the environmental presence of a wide variety of chemicals not commonly monitored in water resources, and serve to track changes in their occurrence and concentrations over time. These findings complement ongoing drinking-water monitoring required by Federal, state, and local programs, which focus primarily on post-treatment compliance monitoring of contaminants regulated by USEPA in drinking water. Many of the chemicals analyzed by USGS are not included in other source-water and finished-water monitoring programs such as the Unregulated Contaminant Monitoring Program (U.S. Environmental Protection Agency, 2007) and the U.S. Department of Agriculture Pesticide Data Program (U.S. Department of Agriculture, 2008).
U.S. Geological Survey analyst at the National Water-Quality Laboratory in Lakewood, Colorado.

14 Quality of Water from Domestic Wells in Principal Aquifers of the United States, 1991–2004
Figure 2. Domestic wells sampled in this study are located in parts of 30 principal aquifers of the United States. (A) The 30 principal aquifers represented by wells in this study are shown. These are 30 of the more than 60 principal aquifers that have been mapped across the Nation (U.S. Geological Survey, 2003). Each principal aquifer is regionally extensive and has the potential to be used as a source of potable water. (B) Locations of domestic wells sampled in this study are shown by dots that are colored to correspond to the color-coding of principal aquifers (see explanation).
A
B
BR
BR
RG
OP
CV
BR
BR
SPf
M
WL
VRs
ET
NR
HP
F
NA
GwCL
MV
CL
TCSC
SD
LT
P
EM
PSPb
PBx
M
M
SD
O
O
CO
ETF
VRs
VRc
VRc
VRs
NEx
NA
EM
SC

Principal aquifers and well locations—Principal aquifers sampled in this study are shown with colored areas. Domestic well locations are shown with colored dots. The full spatial extent of some aquifers is not shown in areas where the aquifers partially underly other aquifers.
Coastal plain aquifers in semi-consolidated sand
Sandstone aquifers
Sandstone and carbonate-rock aquifers
Carbonate-rock aquifers
Crystalline-rock aquifers—Aquifers in New England and New York are present at depth; aquifers in Colorado are not shown
Basin-fill and other non-glacial sand and gravel aquifers
Glacial sand and gravel aquifers— Aquifers are discontinuous within area shown.
Basaltic-rock aquifers
EXPLANATION
Aquifer not known
NR Northern Rocky Mountains Intermontane Basins aquifer system
BR Basin and Range basin-fill aquifers
RG Rio Grande aquifer system
CC Calfornia Coastal Basin aquifer
SPf Snake River Plain basin-fill aquifersWL Willamette Lowland basin-fill aquifers
HP High Plains aquiferMV Mississippi River Valley alluvial aquifer
OS Other stream valley alluvial aquifers— Aquifer extent not shown
CL Coastal lowlands aquifer system NA North Atlantic Coastal Plain aquifer system
TC Texas coastal uplands aquifer systemSC Southeastern Coastal Plain aquifer system
EM Early Mesozoic basin aquifers
P Pennsylvanian aquifers
CO Cambrian-Ordovician aquifer system
LT Lower Tertiary aquifers and Upper Cretaceous aquifers
VRs Valley and Ridge sandstone and shale aquifers
ET Edwards-Trinity aquifer M Mississippian aquifers
SD Silurian-Devonian aquifersOP Ozark Plateaus aquifer systemO Ordovician aquifersF Floridan aquifer system
VRc Valley and Ridge carbonate-rock aquifers
SPb Snake River Plain basaltic-rock aquifers
New England crystalline-rock aquifers— Extent at depth of crystalline-rock aquifers in New York also is shown
NEx
Piedmont and Blue Ridge crystalline-rock aquifers
PBx
RFx Rocky Mountain Front Range crystalline-rock aquifers—Aquifer extent, in Colorado, not shown
NAWQA’s Approach to Assessing the Quality of Water from Domestic Wells 15

Human-Health Benchmarks Used in This Assessment
Concentrations of contaminants measured in this study were compared to human-health benchmarks to place concentration data in a human-health context. Specifically, concentrations were compared to U.S. Environmental Protection Agency (USEPA) Maximum Contaminant Levels (MCLs) or U.S. Geological Survey (USGS) Health-Based Screening Levels (HBSLs). USEPA MCLs are legally enforceable standards for drinking water that specify the maximum permissible level of a contaminant that is delivered by public water systems (U.S. Environmental Protection Agency, 2006a). HBSLs are non-enforceable benchmark concentrations that were developed by USGS in collaboration with USEPA and others, using standard USEPA methods and current toxicity information, for many unregulated contaminants for which MCLs have not been established (Toccalino and others, 2006; Toccalino, 2007; values used in this report were current as of March 2009, see http://water.usgs.gov/nawqa/HBSL). Unregulated contaminants include several (for example, boron and manganese) that USEPA has evaluated for regulation but determined that no regulatory action was appropriate (U.S. Environmental Protection Agency, 2003a, 2008a). HBSLs are equivalent to existing USEPA Lifetime Health Advisory and Cancer Risk concentration values (when they exist), except for unregulated compounds for which more recent toxicity information has become available. It is important to note that the presence of contaminants at concentrations greater than benchmarks does not necessarily indicate that adverse effects are certain to occur. Conversely, concentrations that are less than benchmarks do not guarantee that adverse effects will not occur, but indicate that adverse effects are unlikely. Human-health benchmarks were available for 154 of the 214 contaminants measured in this study.
Comparison of the water-quality data from domestic wells in this study to MCLs or HBSLs provides an initial perspective on the potential significance of contaminant occurrence to human health and can help prioritize further studies. A screening-level assessment of this kind also provides a perspective on areas where adverse effects of contaminants in domestic well water are more likely to occur and the contaminants that may be responsible for such effects (Gilliom and others, 2006). A screening-level assessment is not designed to evaluate specific effects of contaminants in domestic well water on human health, nor is it a substitute for a comprehensive risk assessment, which generally includes many additional factors, such as multiple avenues of exposure (Toccalino and others, 2006).
A concentration greater than one-tenth of a human-health benchmark was used in this study to provide an indication of contaminants that may approach concentrations of potential human-health concern, either individually or as mixtures, and to identify those that may warrant additional monitoring and study. Although a variety of criteria may be selected to identify contaminants that may be approaching concentrations of concern, a criterion of one-tenth of a benchmark is consistent with a number of state and Federal risk-assessment practices (for example, see U.S. Environmental Protection Agency, 1998).
16 Quality of Water from Domestic Wells in Principal Aquifers of the United States, 1991–2004
EXPLANATION
Human-health benchmarks used in this study
(number in parentheses)
MCLs (58)
HBSLs (96)
None available (60)
28 %
45 %
27 %

Major Findings 17
Concentrations of at least one chemical contaminant were greater than human-health benchmarks (USEPA MCLs or USGS HBSLs) in 23 percent of 1,389 domestic wells sampled in this study for which all contaminants were measured (fig. 3). Concentrations of at least one chemical contaminant were greater than an established MCL in 13 percent of the 1,389 wells. These results are based on the
Figure 3. Concentrations of at least one chemical contaminant were greater than a human-health benchmark in 23 percent of 1,389 domestic wells sampled in 25 principal aquifers. Human-health benchmarks include U.S. Environmental Protection Agency (USEPA) Maximum Contaminant Levels (MCLs) and U.S. Geological Survey Health-Based Screening Levels. Results are based on the USEPA proposed MCL for radon of 4,000 picocuries per liter. Microbial contaminants are not included.
Major Findings
More than one in five (23 percent) domestic wells contained one or more contaminants at a concentration greater than a human-health benchmark
proposed MCL for radon of 4,000 picocuries per liter (pCi/L). Microbial contaminants are not included because they were measured in only about 400 wells. Wells with contaminant concen-trations greater than human-health benchmarks were located throughout the United States and in nearly all of the principal aquifers included in the study (fig. 3).
EXPLANATION
No contaminant concentration greater than a human-health benchmark
At least one contaminant concentration greater than a human-health benchmark

Radon in water from domestic wells may present a health risk after it is released from solution during use, for example, in the shower. Red arrows represent ground-water and radon flow directions.
Mod
ified
from
Otte
n an
d ot
hers
(199
3).
18 Quality of Water from Domestic Wells in Principal Aquifers of the United States, 1991–2004
Major ions, trace elements, and radio-nuclides in ground water originate primarily from the geochemical weathering of rocks and minerals. The concentrations of these inor-ganic contaminants in ground water reflect, in large part, their abundance in aquifer materials, length of time that the water is in contact with those materials, and physical and geochemi-cal conditions, such as permeability, pH, and dissolved oxygen concentrations, that govern solubility and mobility. Natural water quality, therefore, varies from place to place and with the types of soils, rocks, and aquifer materials through which the ground water moves.
Inorganic contaminants measured in this study included 9 major ions, 23 trace elements,
6 nutrients (including nitrate), 4 radionuclides (including radon), and total dissolved solids. Human-health benchmarks were available for about two-thirds of these. The individual inor-ganic contaminants found in 1 percent or more of the domestic wells in this study at concentrations greater than available human-health benchmarks are listed in table 2. Several other inorganic contaminants were found at concentrations greater than benchmarks in less than 1 percent of wells, including antimony (0.06 percent, MCL), beryl-lium (0.06 percent, MCL), cadmium (0.1 percent, MCL), copper (0.06 percent, USEPA Action Level), molybdenum (0.6 percent, HBSL), nickel (0.06 percent, HBSL), selenium (0.2 percent, MCL), and radium-226 plus radium-228 (0.8 percent, MCL). The seven contaminants in table 2 that are derived primarily from natural sources—radon, strontium, arsenic, manganese, uranium, boron, and fluoride—are discussed in detail below. Nitrate, which has important man-made sources, is discussed on pages 25–27.
RadonRadon is a naturally occurring, radioac-
tive gas, and is part of the decay series of ura-nium, which occurs in trace amounts in aquifer sediment and rocks. Radon dissolved in water was detected in samples from nearly all wells. USEPA classifies radon as a human carcinogen (U.S. Environmental Protection Agency, 2006a), and people who are exposed to radon, mostly in the air but also through drinking water, may have an increased risk of getting cancer over their lifetime, especially lung cancer (National Research Council, 1999). Health effects from radon in drinking water are primarily through inhalation, after the gas is released from solu-tion—for example, in the shower.
Federal regulation of radon was proposed by USEPA in 1999 with an MCL of 4,000 pCi/L that would apply to public water systems or states that have programs to reduce radon risks from
Contaminants most often found at concentrations greater than human-health benchmarks were inorganic chemicals, with all but nitrate derived primarily from natural sources
Radon (using the higher of two proposed MCLs for radon), several trace elements (such as arsenic and uranium), nitrate, and fluoride occurred individually at concentrations greater than human-health benchmarks in about 1 to 7 percent of all domestic wells sampled in this study. The naturally occurring contaminants, in many cases, followed regional patterns that were related to the geologic and geochemical characteristics of the principal aquifers.

Major Findings 19
Figure 4. Concentrations of radon greater than the lower U.S. Environmental Protection Agency proposed Maximum Contaminant Level (MCL) of 300 picocuries per liter (pCi/L) were found in 65 percent of wells, which are located throughout the United States and in all 30 principal aquifers sampled. Concentrations greater than the proposed MCL of 4,000 pCi/L were found in 4.4 percent of wells, and generally were associated with crystalline-rock aquifers located in the Northeast, the central and southern Appalachians, and central Colorado.
all sources, and with a lower MCL of 300 pCi/L that would apply to systems or states that do not have such programs in place (U.S. Environmen-tal Protection Agency, 1999). Both proposed MCLs are used as human-health benchmarks in the present study. Several states also have their own standards or guidelines for radon in drink-ing water (Ayotte and others, 2007), including Connecticut (5,000 pCi/L), Maine (4,000 pCi/L), Massachusetts (10,000 pCi/L), and New Hamp-shire (2,000 pCi/L).
Concentrations of radon were greater than the lower of the proposed MCLs (300 pCi/L) in 65 percent of the domestic wells sampled in this study, and concentrations were greater than the higher of the proposed MCLs (4,000 pCi/L) in 4.4 percent of wells (table 2). The occurrence
of radon in ground water is controlled, in large part, by the presence of uranium-bearing rocks, and, although it was widely distributed, radon was found at higher concentrations in some areas of the United States than others (fig. 4). Concentrations were highest in crystalline-rock aquifers located in the Northeast, in the central and southern Appalachians, and in central Colorado; in these aquifers, about 30 percent of the sampled wells had concentrations greater than 4,000 pCi/L. High radon concentrations in ground water and their relation to regional aquifer lithology in these areas are well documented (Brutsaert and others, 1981; Hess and others, 1985; Loomis, 1987; Longtin, 1988; Lawrence and others, 1991; Senior, 1998; Ayotte and others, 2007).
Radon, in picocuries per liter
> 4,000
EXPLANATION
≤ 300> 300 and ≤ 4,000

20 Quality of Water from Domestic Wells in Principal Aquifers of the United States, 1991–2004
Table 2. Eight inorganic contaminants were found at concentrations greater than human-health benchmarks in 1 percent or more of domestic
[Human-health benchmarks: MCLs are U.S. Environmental Protection Agency Maximum Contaminant Levels for public water supplies and HBSLs are U.S. Geological Sources of contaminant in drinking water: modified from U.S. Environmental Protection Agency (2008b) and from references cited in the text. pCi/L, picocurie per
wells in this study. Except for nitrate, these contaminants are derived primarily from natural sources.
Survey Health-Based Screening Levels. Potential health effects: see references cited in footnotes. liter; µg/L, microgram per liter; mg/L, milligram per liter; 1 mg/L is equal to 1,000 µg/L]
ContaminantContaminant
typeNumber of
wells sampled
Frequency of concentrations
greater than benchmark
(percent of wells)
Human-health benchmark
Potential health effects from exposure above the human-health benchmark
Sources of contaminant in drinking waterPrincipal aquifers with concentrations most frequently
greater than human-health benchmarksValue Type
Radon Radionuclide 1,958 4.4 65
4,000 pCi/L300 pCi/L
Proposed MCLs
Increased risk of lung cancer 1,2 Radioactive decay of uranium in aquifer materials Crystalline rock aquifers in the Northeast, central and southern Appalachians, and central Colorado (about 30 percent of wells > 4,000 pCi/L).
Strontium Trace element 488 7.3 4,000 µg/L HBSL Abnormal bone development 3 Aquifer materials Some basin-fill and sandstone/carbonate-rock aquifers in the southwest and south-central United States.
Arsenic Trace element 1,774 6.8 10 µg/L MCL Skin damage or problems with circulatory systems, and may have increased risk of getting cancer 4,5
Aquifer materials; pesticide application in orchards; some industrial wastes Crystalline-rock aquifers in New England; basin-fill aquifers in the western and south-central United States, and basaltic-rock aquifer in Idaho (more than 10 percent of wells > 10 µg/L).
Manganese Trace element 2,159 5.2 300 µg/L HBSL Neurological effects 6 Aquifer materials; some industrial wastes Glacial aquifers; some sandstone aquifers in central Appalachian region; some coastal plain aquifers in Southeast (about 8 to 60 percent of wells > 300 µg/L). In all aquifers, in wells with low dissolved oxygen concentrations.
Nitrate Nutrient 2,132 4.4 10 mg/L as N
MCL Infants below the age of six months who drink water containing nitrate in excess of the MCL could become seriously ill and, if untreated, may die. Symptoms include shortness of breath and blue-baby syndrome 4,5
Fertilizer use; manure; sewage and septic-system effluent; aquifer materials Some basin-fill aquifers in the Southwest and Cailfornia; glacial aquifers in the Upper Midwest; some coastal-plain and crystalline-rock aquifers in the central Appalachian region (more than 10 percent of wells > 10 mg/L as N). Generally, in areas of agricultural land use.
Uranium Trace element 1,725 1.7 30 µg/L MCL Increased risk of cancer, kidney toxicity 4,5 Aquifer materials Basin-fill aquifers in the West; crystalline-rock aquifers in the Rocky Mountains and in the Northeast (about 3 to 26 percent of wells > 30 µg/L).
Boron Trace element 535 1.3 1,000 µg/L HBSL Gastrointestinal, reproductive, and developmental effects 7, 8
Aquifer materials; sewage or septic-system effluent; fertilizer application; some industrial wastes
Some basin-fill and sandstone aquifers in the west and south-central United States.
Fluoride Major ion 2,157 1.2 4 mg/L MCL Bone disease (pain and tenderness of the bones); children may get mottled teeth 4,5
Water additive which promotes strong teeth; aquifer materials; discharge from fertilizer and aluminum factories
Some basin-fill and sandstone aquifers in the western and south-central United States (about 4 percent of wells > 4 mg/L).
1 National Research Council, 1999, Risk Assessment of Radon in Drinking Water: Washington, D.C., National Academy Press, 296 p.2 U.S. Environmental Protection Agency, 1999, Proposed radon in drinking water rule: Washington, D.C., U.S. Environmental Protection Agency, Office of Water,
EPA 815- F-99-006, 6 p., accessed October 26, 2005, at http://www.epa.gov/safewater/radon/proposal.html.3 Agency for Toxic Substances and Disease Registry, 2004a. Toxicological profile for strontium: U.S. Department of Health and Human Services,
Public Health Service, accessed November 12, 2008, at http://www.atsdr.cdc.gov/toxprofiles/tp159.html.4 U.S. Environmental Protection Agency, 2008b, Drinking water contaminants, accessed November 25, 2008, at http://www.epa.gov/safewater/contaminants/index.html.5 U.S. Environmental Protection Agency, 2003b, Water on tap: What you need to know: Office of Water, EPA 816-K-03-007, accessed November 25, 2008, at
http://www.epa.gov/safewater/wot/pdfs/book_waterontap_full.pdf.
6 Agency for Toxic Substances and Disease Registry, 2008, Public health statement, manganese: U.S. Department of Health and Human Services, Public Health Service, September 2008, accessed November 12, 2008, at http://www.atsdr.cdc.gov/toxprofiles/tp151-c1-b.pdf.
7 World Health Organization, 2004, Guidelines for Drinking-Water Quality, 3d ed., Volume 1, Recommendations: World Health Organization, Geneva, Switzerland, 515 p.
8 U.S. Environmental Protection Agency, 2008a, Regulatory determinations support document for selected contaminants from the second drinking water contaminant candidate list (CCL 2), Chapter 3: Boron: Washington, D.C., U.S. Environmental Protection Agency, Office of Ground Water and Drinking Water, EPA Report 815-R-08-012, 4 p., accessed September 17, 2008, at http://www.epa.gov/safewater/ccl/pdfs/reg_determine2/report_ccl2-reg2_supportdocument_full.pdf.

Major Findings 21
Table 2. Eight inorganic contaminants were found at concentrations greater than human-health benchmarks in 1 percent or more of domestic
[Human-health benchmarks: MCLs are U.S. Environmental Protection Agency Maximum Contaminant Levels for public water supplies and HBSLs are U.S. Geological Sources of contaminant in drinking water: modified from U.S. Environmental Protection Agency (2008b) and from references cited in the text. pCi/L, picocurie per
wells in this study. Except for nitrate, these contaminants are derived primarily from natural sources.
Survey Health-Based Screening Levels. Potential health effects: see references cited in footnotes. liter; µg/L, microgram per liter; mg/L, milligram per liter; 1 mg/L is equal to 1,000 µg/L]
ContaminantContaminant
typeNumber of
wells sampled
Frequency of concentrations
greater than benchmark
(percent of wells)
Human-health benchmark
Potential health effects from exposure above the human-health benchmark
Sources of contaminant in drinking waterPrincipal aquifers with concentrations most frequently
greater than human-health benchmarksValue Type
Radon Radionuclide 1,958 4.4 65
4,000 pCi/L300 pCi/L
Proposed MCLs
Increased risk of lung cancer 1,2 Radioactive decay of uranium in aquifer materials Crystalline rock aquifers in the Northeast, central and southern Appalachians, and central Colorado (about 30 percent of wells > 4,000 pCi/L).
Strontium Trace element 488 7.3 4,000 µg/L HBSL Abnormal bone development 3 Aquifer materials Some basin-fill and sandstone/carbonate-rock aquifers in the southwest and south-central United States.
Arsenic Trace element 1,774 6.8 10 µg/L MCL Skin damage or problems with circulatory systems, and may have increased risk of getting cancer 4,5
Aquifer materials; pesticide application in orchards; some industrial wastes Crystalline-rock aquifers in New England; basin-fill aquifers in the western and south-central United States, and basaltic-rock aquifer in Idaho (more than 10 percent of wells > 10 µg/L).
Manganese Trace element 2,159 5.2 300 µg/L HBSL Neurological effects 6 Aquifer materials; some industrial wastes Glacial aquifers; some sandstone aquifers in central Appalachian region; some coastal plain aquifers in Southeast (about 8 to 60 percent of wells > 300 µg/L). In all aquifers, in wells with low dissolved oxygen concentrations.
Nitrate Nutrient 2,132 4.4 10 mg/L as N
MCL Infants below the age of six months who drink water containing nitrate in excess of the MCL could become seriously ill and, if untreated, may die. Symptoms include shortness of breath and blue-baby syndrome 4,5
Fertilizer use; manure; sewage and septic-system effluent; aquifer materials Some basin-fill aquifers in the Southwest and Cailfornia; glacial aquifers in the Upper Midwest; some coastal-plain and crystalline-rock aquifers in the central Appalachian region (more than 10 percent of wells > 10 mg/L as N). Generally, in areas of agricultural land use.
Uranium Trace element 1,725 1.7 30 µg/L MCL Increased risk of cancer, kidney toxicity 4,5 Aquifer materials Basin-fill aquifers in the West; crystalline-rock aquifers in the Rocky Mountains and in the Northeast (about 3 to 26 percent of wells > 30 µg/L).
Boron Trace element 535 1.3 1,000 µg/L HBSL Gastrointestinal, reproductive, and developmental effects 7, 8
Aquifer materials; sewage or septic-system effluent; fertilizer application; some industrial wastes
Some basin-fill and sandstone aquifers in the west and south-central United States.
Fluoride Major ion 2,157 1.2 4 mg/L MCL Bone disease (pain and tenderness of the bones); children may get mottled teeth 4,5
Water additive which promotes strong teeth; aquifer materials; discharge from fertilizer and aluminum factories
Some basin-fill and sandstone aquifers in the western and south-central United States (about 4 percent of wells > 4 mg/L).
1 National Research Council, 1999, Risk Assessment of Radon in Drinking Water: Washington, D.C., National Academy Press, 296 p.2 U.S. Environmental Protection Agency, 1999, Proposed radon in drinking water rule: Washington, D.C., U.S. Environmental Protection Agency, Office of Water,
EPA 815- F-99-006, 6 p., accessed October 26, 2005, at http://www.epa.gov/safewater/radon/proposal.html.3 Agency for Toxic Substances and Disease Registry, 2004a. Toxicological profile for strontium: U.S. Department of Health and Human Services,
Public Health Service, accessed November 12, 2008, at http://www.atsdr.cdc.gov/toxprofiles/tp159.html.4 U.S. Environmental Protection Agency, 2008b, Drinking water contaminants, accessed November 25, 2008, at http://www.epa.gov/safewater/contaminants/index.html.5 U.S. Environmental Protection Agency, 2003b, Water on tap: What you need to know: Office of Water, EPA 816-K-03-007, accessed November 25, 2008, at
http://www.epa.gov/safewater/wot/pdfs/book_waterontap_full.pdf.
6 Agency for Toxic Substances and Disease Registry, 2008, Public health statement, manganese: U.S. Department of Health and Human Services, Public Health Service, September 2008, accessed November 12, 2008, at http://www.atsdr.cdc.gov/toxprofiles/tp151-c1-b.pdf.
7 World Health Organization, 2004, Guidelines for Drinking-Water Quality, 3d ed., Volume 1, Recommendations: World Health Organization, Geneva, Switzerland, 515 p.
8 U.S. Environmental Protection Agency, 2008a, Regulatory determinations support document for selected contaminants from the second drinking water contaminant candidate list (CCL 2), Chapter 3: Boron: Washington, D.C., U.S. Environmental Protection Agency, Office of Ground Water and Drinking Water, EPA Report 815-R-08-012, 4 p., accessed September 17, 2008, at http://www.epa.gov/safewater/ccl/pdfs/reg_determine2/report_ccl2-reg2_supportdocument_full.pdf.

22 Quality of Water from Domestic Wells in Principal Aquifers of the United States, 1991–2004
ArsenicArsenic is a nonmetallic trace element
that has multiple geologic sources, including sulfide minerals and geothermal deposits; it also was used in some pesticides. Arsenic is toxic to humans and, in drinking water, can contribute to skin, bladder, and lung cancers (National Research Council, 2001). Arsenic was found at concentrations greater than the USEPA MCL of 10 micrograms per liter (µg/L) in 6.8 percent of wells nationwide (table 2). Arsenic concentrations were greater than the MCL in more than 10 percent of wells in several aquifer types, including crystalline-rock aquifers
in New England; basin-fill aquifers in California, Nevada, Arizona, New Mexico, Texas, and Nebraska; and the Snake River basaltic-rock aquifers in Idaho (fig. 5). These findings are consistent with previous national-scale studies of arsenic in ground water that showed elevated concentrations in the West, Midwest, and Northeast and the lowest concentrations in the Southeast (Welch and others, 2000). The percentages of domestic wells and public supply wells with arsenic concentrations greater than the MCL appear to be similar, based on findings of this study and the estimate of 7.6 percent for public supply systems in the United States (Focazio and others, 2000).
Figure 5. Concentrations of arsenic were greater than the U.S. Environmental Protection Agency Maximum Contaminant Level of 10 micrograms per liter in 6.8 percent of wells nationally and were found at these concentrations in wells in several aquifer types.
Arsenic, in micrograms per literEXPLANATION
> 10 ≥ 1 and ≤10 < 1

Phot
ogra
phs
by A
ndre
w Y
oung
, Brig
ham
You
ng U
nive
rsity
and
USG
S, fr
om U
SGS
Phot
ogra
phic
Lib
rary
.
Major Findings 23
Geochemical conditions and the distribution of arsenic in source rocks have important roles in controlling arsenic in ground water, through processes that differ among aquifers. For example, processes that result in elevated arsenic in ground water include arsenic release from iron oxides, which is favored by low dissolved oxygen concentrations and high pH, and is common in glacial aquifers and some crystalline-rock aquifers (Welch and others, 2000; Ayotte and others, 2003; Erickson and Barnes, 2005; Thomas, 2007). In addition, oxidation of sulfide minerals in some sandstone aquifers and mined areas, evaporative concentration in some basin-fill aquifers in the Southwest, and the effects of geothermal water locally in the West also may result in elevated arsenic concentrations in ground water (Welch and others, 2000; Ryker, 2001; Schreiber and others, 2003).
UraniumUranium is a metallic trace element that is
radioactive. Health effects of uranium in drinking water include possible harm to kidneys (World Health Organization, 2004). Concentrations of uranium were greater than the USEPA MCL of 30 µg/L in 1.7 percent of domestic wells (table 2). Concentrations varied regionally, with the highest concentrations occurring most frequently in basin-fill aquifers in the West and in crystalline-rock aquifers in the Rocky Mountains and the Northeast. Concentrations were generally less than 2 µg/L in the coastal plain and carbonate-rock aquifers in the Southeast and in the glacial aquifers in the east-central parts of the United States.
Uranium is a common trace element in many rock types, but is particularly enriched in certain types of rocks, such as granites (Hess and others, 1985). Like arsenic, its pres-ence in ground water is affected by geochemical conditions, including dissolved oxygen concen-trations. The combination of elevated source-rock concentrations and the conditions that favor uranium solubility—dissolved oxygen and carbonate alkalinity—have led to relatively high concentrations of uranium in ground water in various hydrogeologic settings, including the Central Valley of California, the Newark Basin sediments of northern New Jersey, and the crystalline-rock aquifers of New England (Szabo and Zapecza, 1991; Ayotte and others, 2007; Jurgens and others, 2008).
ManganeseManganese is one of the more abundant metallic elements and is a
minor constituent of many common minerals (Hem, 1985). Manganese is an essential trace element for human health but may have adverse neurological effects at high doses, although food is the primary source of exposure (Agency for Toxic Substances and Disease Registry, 2008). Manganese concentrations were greater than the HBSL of 300 µg/L in about 5 percent of wells. Manganese was present in samples from nearly every principal aquifer but occurred at elevated concentrations most often in the glacial aquifers, in sandstone aquifers in Pennsylvania and West Virginia, and in some coastal-plain aquifers in Louisiana and Texas. Relatively high concentrations of manganese coincided with low dissolved oxygen concentrations and low pH, because manganese-containing minerals are more soluble in water under these geochemical conditions. The distribution of relatively high manganese concentrations among principal aquifers also was documented by McMahon and Chapelle (2007), who showed through an analysis of geochemical conditions in domestic wells sampled by NAWQA that anoxic conditions occurred most frequently in ground water in the glacial and sandstone aquifers as compared to other aquifer types, nationally.
Major ions, trace elements, and radio-nuclides in ground water originate primarily from the dissolution and weathering of the rocks and miner-als that make up aquifers and soils. Example sources include arsenopyrite, a sulfide mineral containing arsenic; granite, an igneous rock sometimes enriched in uranium; fluorite, a com-mon fluoride mineral; pyrolusite, a manganese oxide; and borax, a sodium borate compound.
Granite
Fluorite Pyrolusite
Borax
Arsenopyrite

24 Quality of Water from Domestic Wells in Principal Aquifers of the United States, 1991–2004
FluorideFluoride is a naturally occurring ion that
is beneficial to people in small amounts, but potentially harmful if concentrations are too high. According to the CDC, small amounts of fluoride are beneficial to prevent tooth decay, and a con-centration range of 0.7 to 1.2 milligrams per liter (mg/L) in drinking water is recommended (U.S. Centers for Disease Control and Prevention, Fluoride Recommendations Work Group, 2001). Fluoride is often added to public drinking-water systems to raise the concentration to within that range. Most (85 percent or more) of the wells sampled in this study had fluoride concentrations lower than CDC’s recommended range.
USEPA has established two drinking-water benchmarks for fluoride: an MCL of 4 mg/L to prevent acute and chronic illness, such as bone damage, and a Secondary Maximum Contami-nant Level (SMCL) of 2 mg/L to prevent tooth staining (U.S. Environmental Protection Agency, 2006a). About 1 and 4 percent of the fluoride concentrations in the samples analyzed were greater than the MCL and SMCL, respectively.
StrontiumStrontium is a trace element that is geo-
chemically similar to calcium, a common constituent of ground water. Health effects of elevated doses of strontium include abnormal bone development (Agency for Toxic Substances and Disease Registry, 2004a). Concentrations of strontium were greater than the HBSL of
4,000 µg/L in 7.3 percent of the 488 wells in which it was measured. Relatively high concen-trations of strontium were most common in the southwestern and south-central United States—in the Basin and Range basin-fill aquifer in Arizona, the southern High Plains basin-fill aquifer, and the Edwards-Trinity sandstone/carbonate aquifer in Texas. Ground water in these aquifers were characterized by relatively high concentrations of dissolved solids.
Boron
Boron is an accessory element in several common minerals and a component of evaporate deposits; it is used in industry and in some cleaning agents. Health effects of elevated doses include gastrointestinal, reproductive, and developmental effects (World Health Organization, 2004; U.S. Environmental Protection Agency, 2008a). Concentrations of boron were greater than the HBSL of 1,000 µg/L in 1.3 percent of the 535 wells in which it was measured. Relatively high concentrations of boron occurred most often in basin-fill aquifers in California, the southern High Plains basin-fill aquifer, and the Lower Tertiary/Upper Cretaceous sandstone aquifers underlying the Yellowstone River Basin in Wyoming, where the high concentrations may be associated with evaporate deposits or saline ground water (Bartos and others, 2005; Bruce and others, 2007).

Major Findings 25
Nitrate is the most common nutrient in ground water and was the only nutrient that was found at concentrations with potential human-health effects. Excessive nitrate can result in restriction of oxygen transport in the blood-stream, which is of particular concern in infants who lack the enzyme needed to correct this condition (resulting in methemoglobinemia, or “blue baby syndrome”). Nitrate occurs naturally, but concentrations greater than 1 mg/L as N usually are indicative of human activities, such as fertilizer application, animal production, and
Figure 6. Concentrations of nitrate were greater than the U.S. Environmental Protection Agency Maximum Contaminant Level of 10 milligrams per liter (mg/L) as N in 4.4 percent of the wells. Elevated concentrations of nitrate occurred throughout the United States, but least commonly in the Southeast. Concentrations greater than 1 mg/L as N, which is usually indicative of human activities in many areas (Nolan and Hitt, 2003), were found in about 40 percent of wells located throughout the sampled areas.
Nitrate, in milligrams per liter as NEXPLANATION
> 10 > 1 and ≤10 ≤ 1
Nitrate is the only contaminant derived primarily from man-made sources that was found at concentrations greater than a human-health benchmark in more than 1 percent of wells
Nitrate was found at concentrations greater than the USEPA MCL in 4.4 percent of all wells, and most frequently in wells in agricultural areas. Concentrations greater than the MCL are primarily the result of man-made sources.
septic systems, in many parts of the United States (Nolan and Hitt, 2003).
Concentrations of nitrate were greater than the USEPA MCL of 10 mg/L as N in 4.4 percent of wells (fig. 6). Nitrate concentrations followed regional patterns consistent with those found in other NAWQA studies on nitrate occurrence in ambient ground water (Nolan and Hitt, 2006; McMahon and Chapelle, 2007). Concentrations were greater than the MCL most frequently in several aquifers, including the Basin and Range and Central Valley basin-fill aquifers
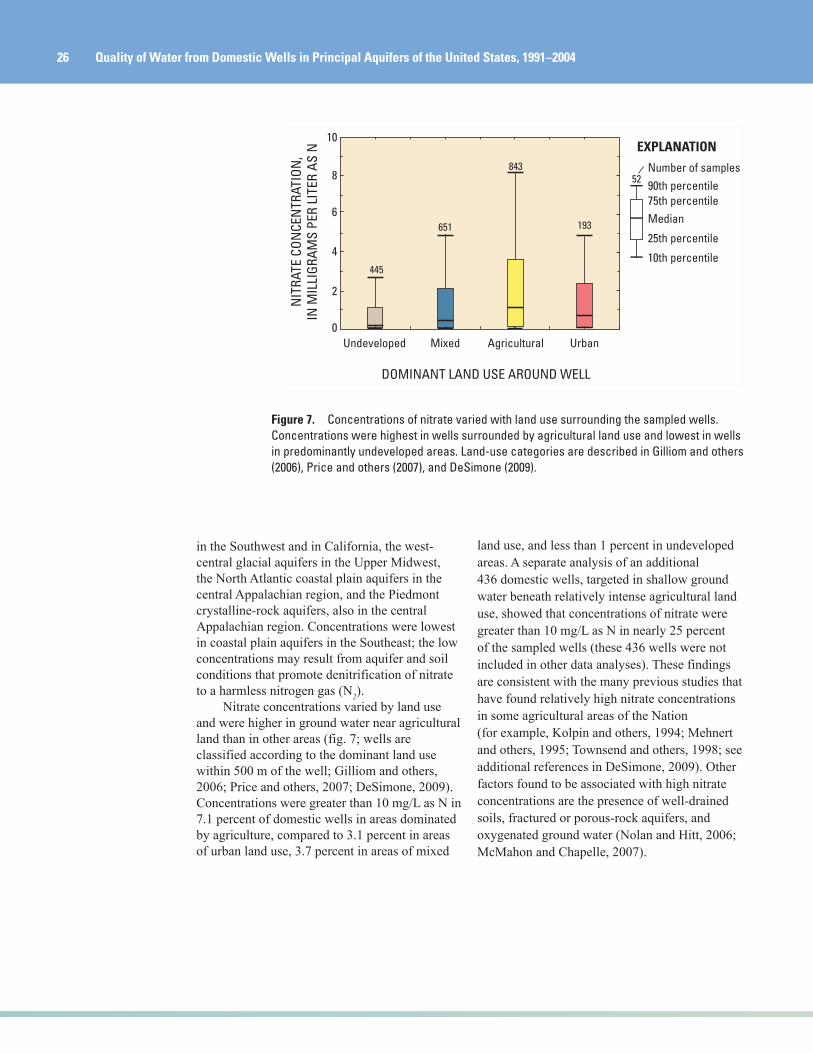
26 Quality of Water from Domestic Wells in Principal Aquifers of the United States, 1991–2004
Median
25th percentile
75th percentile90th percentile
10th percentile
Number of samples
EXPLANATION
52
Undeveloped
Mixed Agricultural Urban
445
651 193
843
10
0
8
6
4
2N
ITRA
TE C
ONCE
NTR
ATIO
N,
IN M
ILLI
GRAM
S PE
R LI
TER
AS N
DOMINANT LAND USE AROUND WELL
Figure 7. Concentrations of nitrate varied with land use surrounding the sampled wells. Concentrations were highest in wells surrounded by agricultural land use and lowest in wells in predominantly undeveloped areas. Land-use categories are described in Gilliom and others (2006), Price and others (2007), and DeSimone (2009).
in the Southwest and in California, the west-central glacial aquifers in the Upper Midwest, the North Atlantic coastal plain aquifers in the central Appalachian region, and the Piedmont crystalline-rock aquifers, also in the central Appalachian region. Concentrations were lowest in coastal plain aquifers in the Southeast; the low concentrations may result from aquifer and soil conditions that promote denitrification of nitrate to a harmless nitrogen gas (N2).
Nitrate concentrations varied by land use and were higher in ground water near agricultural land than in other areas (fig. 7; wells are classified according to the dominant land use within 500 m of the well; Gilliom and others, 2006; Price and others, 2007; DeSimone, 2009). Concentrations were greater than 10 mg/L as N in 7.1 percent of domestic wells in areas dominated by agriculture, compared to 3.1 percent in areas of urban land use, 3.7 percent in areas of mixed
land use, and less than 1 percent in undeveloped areas. A separate analysis of an additional 436 domestic wells, targeted in shallow ground water beneath relatively intense agricultural land use, showed that concentrations of nitrate were greater than 10 mg/L as N in nearly 25 percent of the sampled wells (these 436 wells were not included in other data analyses). These findings are consistent with the many previous studies that have found relatively high nitrate concentrations in some agricultural areas of the Nation (for example, Kolpin and others, 1994; Mehnert and others, 1995; Townsend and others, 1998; see additional references in DeSimone, 2009). Other factors found to be associated with high nitrate concentrations are the presence of well-drained soils, fractured or porous-rock aquifers, and oxygenated ground water (Nolan and Hitt, 2006; McMahon and Chapelle, 2007).

Major Findings 27
Although nitrate can occur naturally in ground water, high concentrations result primarily from human activities. Sources of nitrate to ground water include fertilizers, livestock, and septic systems.
Modified from Waller (1991).
Drainfield
Septic tank
Pumpinglevel
Water table
Percolation
EvaporationWell
Septic tank
Pumpinglevel
Water table
Percolation
Drainfield
Photograph by Jeff Vanuga, Natural Resources Conservation Service, U.S. Department of Agriculture.
Photograph by Tim McCabe, Natural Resources Conservation Service, U.S. Department of Agriculture.

28 Quality of Water from Domestic Wells in Principal Aquifers of the United States, 1991–2004
About 1 billion pounds of pesticides are used each year in the United States to con-trol weeds, insects, and other pests, primarily in agricultural and urban areas (Gilliom and others, 2006). VOCs are produced in large vol-umes and are associated with a myriad of prod-ucts, such as plastics, adhesives, paints, gasoline, fumigants, refrigerants, and dry-cleaning fluids (Zogorski and others, 2006). The concentrations of 168 organic compounds, including 83 pesti-cides and 85 VOCs, were measured in samples collected from the domestic wells in this study.
Organic compounds seldom were found at concentrations greater than human-health benchmarks, which were available for 80 percent of the compounds measured. Thus, the potential for adverse effects on human health from these compounds is expected to be low (see sidebars on bottom of page 13 and on page 16). Col-lectively, only 0.8 percent of wells contained any organic compound at concentrations greater than benchmarks (0.3 percent for compounds with MCLs and 0.5 percent for compounds with HBSLs). Only 3 percent of wells contained any organic compound at concentrations greater than one-tenth of a benchmark (2.3 percent for MCLs and 0.7 percent for HBSLs). Seven of the 168 organic compounds analyzed occurred at concentrations greater than an MCL or HBSL, each in less than 1 percent of wells, and these included two insecticides, one herbicide, two sol-vents, and two fumigants (table 3). Ten additional compounds were found at concentrations greater than one-tenth of benchmarks; each of these also was found in less than 1 percent of the wells at these concentrations.
A wide variety of organic compounds were detected at low concentrations. Twenty-three pesticides and VOCs were each detected at concentrations greater than 0.02 µg/L in 1 to 18 percent of wells (fig. 8). The most frequently detected compounds are derived from diverse sources and include six solvents,
Photograph used by courtesy of the United States Environmental Protection Agency Great Lakes National Program office
Sources of man-made organic compounds, such as pesticides and volatile organic compounds (VOCs), are various and widespread. Over a billion pounds of pesticides are applied each year in the United States to control weeds, insects, and other pests, particularly in agricultural and urban areas. VOCs are used in numerous industrial, commercial, and domestic activities, and sources to ground water include landfills, leaking storage tanks and spills, septic systems, leaking water and sewer lines, stormwater runoff, vehicular exhaust, and the atmosphere.
Man-made organic compounds were detected in more than half (60 percent) of the sampled wells, but concentrations were seldom greater than human-health benchmarks (less than 1 percent of wells)
Only seven man-made organic compounds were found at concentrations greater than a human-health benchmark in one or more wells, and none in more than 1 percent of wells. However, one or more compounds—including herbicides, insecticides, solvents, disinfection by-products, gasoline hydrocarbons and oxygenates, refrigerants, and fumigants—were detected at low levels in 60 percent of wells, indicating the diverse industrial, agricultural, and urban sources that can affect the quality of source water to domestic wells.
Photograph from EGDigital, iStock Photos

Major Findings 29
five herbicides plus an herbicide degradate, three trihalomethanes, two refrigerants, two VOCs used in organic synthesis, two gasoline hydrocarbons, one gasoline oxygenate, and one fumigant (fig. 8). If all detections are considered, including those as low as 0.001 µg/L, at least one pesticide or VOC was detected in 60 percent of the wells.
The frequency of detection of organic compounds in the domestic wells included in the present study is consistent with previous studies of low-level concentrations of organic compounds in ground water (Shapiro and others, 2004; Plummer and others, 2008) and of detection frequencies of pesticides and VOCs
from all well types sampled by the NAWQA Program (Gilliom and others, 2006; Zogorski and others, 2006). Detection frequencies for organic compounds may differ among supply well types, however, with less frequent detections in domestic wells than in public supply wells (Zogorski and others, 2006; P.E. Stackelberg, U.S. Geological Survey, written commun., 2008). The widespread occurrence of organic compounds suggests the pervasiveness of man-made sources and the potential for exposure to low-level mixtures of contaminants.
Two of the most frequently detected organic compounds were chloroform and atrazine. Chloroform, a by-product from the disinfection
Table 3. Seven organic compounds were found at least once at concentrations greater than available human-health benchmarks but each in less than 0.5 percent of wells. Ten additional compounds were found at concentrations greater than one-tenth of benchmarks. No compound was present at concentrations greater than one-tenth of benchmarks in more than 1 percent of wells.
[Human-health benchmarks: MCLs are U.S. Environmental Protection Agency Maximum Contaminant Levels for public water supplies and HBSLs are U.S. Geological Survey Health-Based Screening Levels. µg/L, microgram per liter]
Compound name UseNumber of
wells sampled
Frequency of concentrations
greater than benchmark
(percent of wells)
Frequency of concentrations less
than, but greater than one-tenth of, benchmark
(percent of wells)
Human-health benchmark
Value (µg/L)
Type
Dieldrin Insecticide 2,115 0.43 0.00 0.002 HBSL
Ethylene dibromide Fumigant 1,955 0.10 0.00 0.1 MCL
Trichloroethene Solvent 1,956 0.10 0.20 5 MCL
Dinoseb Herbicide 1,371 0.07 0.00 7 MCL
Diazinon Insecticide 2,115 0.05 0.09 1 HBSL
Dibromochloropropane (DBCP)
Fumigant 1,956 0.05 0.00 0.2 MCL
Perchloroethene Solvent 1,927 0.05 0.47 5 MCL
Atrazine Herbicide 2,116 0.00 0.85 3 MCL
Methylene chloride Solvent 1,956 0.00 0.26 5 MCL
Diuron Herbicide 1,374 0.00 0.15 2 HBSL
Chloroform Trihalomethane 1,956 0.00 0.15 80 1 MCL
1,2-Dichloroethane Solvent 1,945 0.00 0.10 5 MCL
1,2-Dichloropropane Fumigant 1,956 0.00 0.10 5 MCL
Alachlor Herbicide 2,115 0.00 0.09 2 MCL
Benzene Gasoline hydrocarbon
1,957 0.00 0.05 5 MCL
1,1-Dichloroethene Solvent 1,956 0.00 0.05 7 MCL
Vinyl chloride Organic synthesis 1,957 0.00 0.05 2 MCL1MCL is for sum of four trihalomethanes.

30 Quality of Water from Domestic Wells in Principal Aquifers of the United States, 1991–2004
of water, may originate in ground water from infiltration of treated wastewater or drinking water, from shock chlorination of domestic wells, from chemicals disposed of in septic systems, or from chemical spills (Ivahnenko and Zogorski, 2006). Chloroform was detected throughout the United States and in most principal aquifers sampled. Concentrations of chloroform were low and less than one-hundredth of the USEPA MCL, or undetected, in 90 percent
Figure 8. Six pesticides (brown text) and 17 volatile organic compounds (blue text) were detected in more than 1 percent of wells at concentrations greater than a common threshold of 0.02 micrograms per liter (µg/L). The wide variety of compounds detected, including herbicides, solvents, disinfection by-products, gasoline hydrocarbons and oxygenates, refrigerants, and fumigants, reflect the diverse industrial, agricultural, and domestic sources that can affect the quality of source water to domestic wells. Concentrations greater than 0.02 µg/L are shown here to eliminate the effects of different analytical detection limits among compounds.
DETECTION FREQUENCY AT CONCENTRATIONSGREATER THAN 0.02 MICROGRAMS PER LITER, IN PERCENT
0 1816141210862 4 20
Chloroform
Carbon disulfide
Deethylatrazine
Toluene
Chloromethane
Atrazine
Perchloroethene
Methyl tert-butyl ether
Methylene chloride
1,1,1-Trichloroethane
1,2,4-Trimethylbenzene
Dichlorodifluoromethane
Trichloroethene
Bromodichloromethane
1,1-Dichloroethane
1,2-Dichloropropane
Trichlorofluoromethane
Bentazon
Simazine
Iodomethane
Metolachlor
Prometon
Dibromochloromethane
of wells. Atrazine and its degradation product deethylatrazine were the most frequently detected pesticide compounds (fig. 8). Atrazine is a relatively persistent and mobile herbicide used primarily on corn, and hence, was most commonly detected in agricultural areas. Like chloroform, atrazine concentrations were less than one-hundredth of the USEPA MCL in most wells.

Major Findings 31
Bacteria of various kinds are ubiquitous in ground water, but some types indicate possible contamination by human or animal fecal matter. Two fecal indicator bacteria were measured in samples from about 400 wells, located in about half of the principal aquifers included in this study. Total coliform bacteria and E. coli are bacteria that live in the intestines of warm-blooded animals and are present in feces. Coliform bacteria are a broad group that also can live in water and soil and may be present in the environment from sources other than fecal or sewage contamination. These bacteria typically are not harmful but are used to signal the possible presence of pathogenic bacteria and (or) viruses that also can occur in feces and can cause illness. Federal drinking-water standards and those of many states use total coliform bacteria and E. coli bacteria as indicators of microbiological water quality.
Total coliform bacteria were detected in 34 percent of 397 domestic wells, and E. coli were detected in 7.9 percent of 378 domestic wells. Detections occurred in samples from at
least one well from each of 15 principal aquifers for which bacteria were measured. Detection frequencies varied among principal aquifers but were greatest in several carbonate-rock, crystalline-rock, and sandstone aquifers in the central Appalachian region. These aquifers generally are porous and fractured and can be associated with relatively rapid infiltration (Embrey and Runkle, 2006). Wells in which total coliform and E. coli were detected also tended to have more shallow depths to open intervals than wells in which they were not detected. Wells in which total coliform bacteria were detected were typically older and had higher percentages of agricultural land surrounding them than wells without total coliform detections. In the present study, available information about other well characteristics was limited, but several previous studies have shown that well type and construction characteristics are important factors for detections of total coliform bacteria (U.S. Environmental Protection Agency, 1984; Hallberg and others, 1992; U.S. Centers for Disease Control and Prevention, 1998).
Microbial contaminants were detected in as many as one-third of the approximately 400 wells sampled
Escherichia coli (E. coli), a coliform bacteria that typically is not harmful but is an indicator of fecal contamination, was detected in 7.9 percent of about 400 sampled wells. Total coliform bacteria, a broad group that includes bacteria from soil, water, and animal feces, were detected in 34 percent of the sampled wells.
Fecal indicator bacteria such as Escherichia coli, which were detected in 7.9 percent of the domestic wells sampled in this study, are commonly measured by membrane-filtration methods. A water sample is passed through a membrane filter, and the bacteria on the filter are cultured and counted, such as on the culture plates shown above.

32 Quality of Water from Domestic Wells in Principal Aquifers of the United States, 1991–2004
A number of contaminants or proper-ties can adversely affect the aesthetic quality of drinking water or can result in effects that are undesirable but are not health problems. The USEPA has established SMCLs as non-enforceable guidelines for these contaminants and properties in drinking water (U.S. Envi-ronmental Protection Agency, 1992, 2006a). Undesirable effects of elevated concentrations of these properties and contaminants include corro-sion or scale deposition in pipes and plumping, laundry staining, unpleasant water color or taste, and teeth staining.
Dissolved SolidsDissolved solids in water include major
ions, such as calcium, sodium, bicarbonate, sulfate, and chloride; nutrients, such as nitrogen and phosphorus; and trace elements, such as selenium, chromium, and arsenic. Dissolved solids originate primarily from the dissolution of soil and aquifer materials but can be aug-mented by the effects of human activities, such as irrigation, waste disposal, and road salting. The USEPA SMCL recommends dissolved sol-ids concentrations less than 500 mg/L to avoid unpleasant taste or color or greater costs because of mineral or sediment deposits in plumbing (U.S. Environmental Protection Agency, 1992).
Concentrations of dissolved solids were greater than the SMCL in 15 percent of the domestic wells. Relatively high concentra-tions (greater than the SMCL) occurred most frequently in the West, Southwest, and south-central United States, such as in some basin-fill, sandstone/carbonate, and sandstone aquifers underlying Texas, New Mexico, Arizona, Utah, and Wyoming. Such high concentrations are expected in these parts of the country because of easily eroded and soluble rock types and sedi-ments, a dry climate with low precipitation, and heavy irrigation seepage. Concentrations gener-
ally were less than the SMCL in the East, such as in the coastal plain and crystalline-rock aquifers, and in some of the glacial aquifers in the northern parts of the United States.
pHpH is a property of water and is an important
control on the solubility of many metals. Highly acidic (low pH) or alkaline (high pH) water can corrode pipes and may have an unpleasant taste (World Health Organization, 2004). The USEPA recommends a pH between 6.5 and 8.5 for drinking water (U.S. Environmental Protection Agency, 2006a). The pH of water from most of the domestic wells sampled in this study was within the recommended range; pH in 80 percent of the samples ranged from 6.1 to 7.6, with a median of 7.3. Water from about 14 percent of the wells was more acidic than recommended, and water from about 2 percent of wells was more alkaline than recommended. Low pH values occurred in the East (fig. 9); this pattern is similar to the geographic pattern in the acidity of precipitation across the United States (National Atmospheric Deposition Program, 2005). The wells with low pH generally were completed in crystalline-rock and coastal plain sand aquifers, which do not weather easily and have relatively little capacity to neutralize acid precipitation. These aquifers also had low concentrations of dissolved solids.
Iron and ManganeseIron and manganese were each detected
in about half of the wells. USEPA SMCLs for iron and manganese were established to prevent poor water taste and the staining of laundry and plumbing fixtures (U.S. Environmental Protection Agency, 1992). Concentrations of iron were greater than the SMCL of 300 µg/L in 19 percent of wells, and
About half (48 percent) of the sampled wells contained at least one contaminant at a level or concentration outside the range of values recommended by USEPA for the aesthetic quality of water
Dissolved solids, pH, iron, and manganese were found at levels outside of Secondary Maximum Contaminant Levels (SMCLs) recommended by USEPA for drinking water in 15 to 21 percent of wells. Collectively, 48 percent of the sampled wells contained at least one contaminant or property at levels outside of SMCLs. Regional patterns were apparent in dissolved solids, pH, and hardness.

Major Findings 33
Figure 9. The pH of water was outside of the range of 6.5 to 8.5 recommended by the U.S. Environmental Protection Agency Secondary Maximum Contaminant Level in 16 percent of wells. Low pH values occurred mostly in the East, consistent with the regional pattern of acid precipitation and the distribution of aquifers that are relatively resistant to weathering, with little buffering capacity.
pH, in standard units EXPLANATION
< 6.5 ≥ 6.5 and ≤ 8.5 > 8.5

34 Quality of Water from Domestic Wells in Principal Aquifers of the United States, 1991–2004
Figure 10. Hard water was prevalent in the east-central and western United States, reflecting the distribution of carbonate aquifers and aquifers with relatively high concentrations of dissolved solids.
concentrations of manganese were greater than the SMCL of 50 µg/L in 21 percent of wells. The elevated concentrations occurred throughout the United States; such concentrations were found in samples from nearly all principal aquifers. Iron and manganese are common elements in most aquifer materials but are mobilized under certain geochemical conditions, such as low dissolved oxygen concentrations and low pH.
Hardness
Hardness is a physical property that is used to describe the mineral content of water, and primarily reflects concentrations of dissolved calcium and magnesium. Water is considered “soft” if hardness is less than 60 mg/L as calcium carbonate (CaCO3), and “hard” if hardness is
Hardness, in milligrams per liter as calcium carbonateEXPLANATION
> 180 > 120 and ≤ 180 ≤ 60> 60 and ≤ 120
greater than 120 mg/L as CaCO3. Hard and very hard water (more than 180 mg/L as CaCO3) often requires treatment (Hem, 1985). Hard water is not a health risk, but it is a nuisance because it can cause mineral buildup in plumbing fixtures, pipes, and hot water heaters, and poor performance of soaps and detergents. Water that is too soft also can be a nuisance, because ions react with the soap to produce a residue that is difficult to wash off. Hardness varied regionally and among most aquifers (fig. 10). Hard water (>120 mg/L as CaCO3) was found in about 60 percent of the sampled wells and was prevalent in the east-central and western United States, reflecting the distribution of carbonate aquifers and aquifers with relatively high dissolved solids. Aquifers with hard water also contained relatively high alkalinity.

Major Findings 35
Contaminants generally do not occur in isolation in domestic or other supply wells but usually co-occur as mixtures with other contaminants. Contaminants co-occur as mixtures in part because well water itself is a mixture of ground water from multiple sources, and each source may contribute different and multiple contaminants. Sources of water may include recharge from precipitation or irrigation in different types of land-use settings, infiltration of surface water, or inflow from adjoining aquifers. Along the flow pathways by which ground water reaches a well, naturally occurring contaminants, such as trace elements, may be contributed by various minerals from the aquifer sediments and rocks. Man-made contaminants may be introduced from many sources, such as wastewater disposal, recharge in agricultural or urban areas, or chemical spills. Thus, the compositions of contaminant mixtures that occur in domestic wells depend on the unique sources and flow paths that affect each well.
Analysis of individual contaminants, as summarized in the previous sections, is essential for identifying those of potential concern for human health and for assessing where and why they occur. However, contaminants in mixtures—even at individual concentrations less than benchmarks for individual compounds—may present additional potential concerns for human health. The health effects of a mixture might be greater than, equal to, or less than the effects of its components individually (Carpenter and others, 2002). With a few exceptions for pesticides with common modes of action, however, health benchmarks generally
are not available for specific mixtures. The presence of mixtures in domestic wells also is important to homeowners investigating water treatment options because a single treatment device may not be available to remove all contaminants of potential concern in a mixture (U.S. Environmental Protection Agency, 2002).
The analysis in this study identified mixtures of naturally occurring contaminants that individually exceeded or approached levels of potential concern for human health, with additional consideration of all man-made organic compounds detected at any level. A concentration greater than one-tenth of a human-health benchmark was used to provide an indication of contaminants that may approach concentrations of potential human-health concern when occurring with other contaminants in mixtures, and to identify those mixtures that may warrant additional monitoring and study (see sidebar on page 16). The higher proposed USEPA MCL was used for radon in mixtures of contaminants at concentrations greater than benchmarks, and the lower proposed MCL was used for radon in mixtures of contaminants at concentrations greater than one-tenth of benchmarks. Fluoride was not included in analyses of mixtures at concentrations greater than one-tenth of benchmarks (but below benchmarks) because, as discussed on page 24, such concentrations for fluoride are often in a beneficial range. These analyses were used to identify mixtures of potential importance and to provide a perspective on patterns in co-occurrence that may be important as more is learned about sources and potential health effects of mixtures.
Contaminants usually co-occurred with other contaminants as mixtures
Mixtures of two or more contaminants with concentrations individually greater than their human-health benchmarks (excluding microbial contaminants) occurred in only 4 percent of wells, but mixtures of two or more contaminants at concentrations individually greater than one-tenth of their human-health benchmarks were found in 73 percent of the wells. Possible health effects of most of these mixtures have not been extensively studied and are largely unknown. Identification of the most common mixtures found in this study can be used to prioritize future investigations.

36 Quality of Water from Domestic Wells in Principal Aquifers of the United States, 1991–2004
Figure 11. Mixtures of two or more contaminants with concentrations individually greater than a benchmark were not common, occurring in 4 percent of wells. Mixtures of two or more contaminants with concentrations greater than one-tenth of individual benchmarks were found in 73 percent of wells. Contaminants included were major ions (except fluoride), trace elements, nitrate, radon, and organic compounds.
Occurrence and Distribution of Mixtures
Although samples from 23 percent of wells contained at least one contaminant individually greater than a human-health benchmark, mixtures of two or more contaminants with concentrations greater than their individual benchmarks were relatively uncommon, occurring in only 4 percent of wells (fig. 11). However, about 73 percent of wells had two or more contaminants greater than one-tenth of their individual benchmarks, and mixtures that additionally included detections of any organic contaminants (regardless of concentration) were found in 89 percent of wells. Most mixtures were primarily composed of naturally occurring inorganic contaminants.
Mixtures of contaminants at concentrations greater than one-tenth of their individual benchmarks occurred in most sampled areas, but mixtures with the largest number of contaminants
were most common in several aquifers in western and south-central United States, including the Basin and Range, Central Valley, and High Plains basin-fill aquifers and the Lower Tertiary/Upper Cretaceous sandstone aquifers (fig. 12). Mixtures of two or more contaminants at concentrations greater than individual benchmarks, although less frequent, were similarly distributed. This occurred, in large part, because the mixtures were composed mainly of naturally occurring trace elements and other inorganic contaminants frequently detected in those aquifers. These contaminants are likely associated with relatively old ground water, easily weathered aquifer materials, or evaporative concentration. Typically, these mixtures were found in water that also contained relatively high concentrations of dissolved solids.
Mixtures of contaminants
At concentrations greater than human-health benchmarks
EXPLANATION
At concentrations greater than one-tenth of human-health benchmarks
At concentrations greater than one-tenth of human-health benchmarks plus any detectable concentration of an organic compound
≥3 ≥4≥2≥1 ≥5
100
0
80
60
40
20
≥6
NUMBER OF CONTAMINANTS
FREQ
UEN
CY O
F OC
CURR
ENCE
,IN
PER
CEN
T OF
WEL
LS

Major Findings 37
Figure 12. Mixtures with the largest number of contaminants at concentrations greater than one-tenth of human-health benchmarks were most common in several aquifers in the western and south-central United States. Typically, these mixtures were found in water that also contained relatively high concentrations of dissolved solids. Contaminants included were major ions (except fluoride), trace elements, nitrate, radon, and organic compounds.
EXPLANATIONNumber of contaminants in a sampled well with concentrations
greater than one-tenth of human-health benchmarks
None12 to 3Greater than 6 4 to 6

38 Quality of Water from Domestic Wells in Principal Aquifers of the United States, 1991–2004
Table 4. Mixtures of contaminants at concentrations individually greater than one-tenth of human-health benchmarks that were found in 10 percent or more of wells and were composed of various combinations of six contaminants, most of which were derived primarily from natural sources.
[Contaminants included were major ions (except fluoride), trace elements, nitrate, radon, and organic compounds. --, not applicable]
Components of mixture
Frequency of mixtures with component concentrations
greater than one-tenth of benchmarks
(percent of wells)
Frequency of mixtures with
component concentrations
greater than benchmarks
(percent of wells)Nitrate Radon -- -- 32 0.1Arsenic Radon -- -- 30 0.1Nitrate Arsenic -- -- 24 0.2Uranium Radon -- -- 21 0.5Arsenic Uranium -- -- 21 0.3Nitrate Uranium -- -- 19 0.6Nitrate Arsenic Radon -- 18 0.0Nitrate Arsenic Uranium -- 16 0.1Arsenic Uranium Radon -- 16 0.0Nitrate Uranium Radon -- 15 0.0Arsenic Molybdenum -- -- 13 0.2Nitrate Arsenic Uranium Radon 12 0.0Radon Molybdenum -- -- 12 0.0Manganese Radon -- -- 11 0.1Uranium Molybdenum -- -- 11 0.1
Composition of MixturesThe composition of mixtures is described
in terms of the occurrence of unique mixtures, which are specific combinations of two, three, or more contaminants, regardless of the pres-ence of other contaminants. There were many unique mixtures (nearly 5,000) of contami-nants that occurred at concentrations greater than one-tenth of their individual benchmarks, but only 15 unique mixtures occurred in more than 10 percent of wells. The 15 mixtures were all composed of two or more of only six con-taminants––all inorganic and, except for nitrate, primarily derived from natural sources (table 4). The six contaminants were nitrate, arsenic, radon, and uranium, and, to a lesser extent, molybdenum and manganese. The most common unique mix-ture consisted of nitrate and radon (where radon was greater than 300 pCi/L), which occurred in 32 percent of sampled wells. These contami-nants also occurred in mixtures at concentrations greater than individual benchmarks, but none in more than 1 percent of wells.
Concentrations of most organic contaminants in mixtures were low compared to available benchmarks, but organic contaminants at low concentrations in certain mixtures may, nevertheless, be a concern. The appropriate level of concern is difficult to evaluate because of the lack of human-health benchmarks for some individual compounds and the potential for additive or synergistic effects for some mixtures. Eight unique mixtures of multiple contaminants with concentrations greater than one-tenth of human-health benchmarks, plus a detectable organic compound, occurred in 10 percent or more of wells (table 5). These mixtures were composed of combinations of two or three of the following: atrazine, deethylatrazine, chloroform, nitrate, or radon. Combinations of nitrate with atrazine and deethylatrazine, its degradation product, likely originate from similar sources of these contaminants (for example, agricultural activities); combinations of organic compounds with radon reflect the ubiquitous occurrence of radon at concentrations greater than the proposed MCL of 300 piC/L. Unique mixtures

Major Findings 39
Table 5. Eight mixtures of contaminants at concentrations individually greater than one-tenth of human-health benchmarks, plus organic compounds detected at any concentration, were found in 10 percent or more of wells.
[Contaminants included were major ions (except fluoride), trace elements, nitrate, radon, and organic compounds. --, not applicable]
Components of mixture
Frequency of mixtures with component concentrations greater than one-tenth of benchmarks, plus
organic compounds detected at any concentration
(percent of wells)
Radon Chloroform -- 15
Nitrate Deethylatrazine -- 14
Radon Deethylatrazine -- 13
Atrazine Deethylatrazine -- 12
Nitrate Atrazine -- 11
Nitrate Chloroform -- 11
Nitrate Radon Deethylatrazine 11
Nitrate Atrazine Deethylatrazine 10
containing only organic compounds were not common, except for the combination of atrazine and deethylatrazine. The common presence of the degradate deethylatrazine with its parent compound atrazine (in 84 percent of wells that contained atrazine) is consistent with previous findings on the prevalence of some pesticide degradates in ground water (Gilliom and others, 2006).
Assessing the Potential Significance of Mixtures to Human Health
Little is known about the potential health effects of most mixtures of contaminants. Depending on the specific compounds, the toxicity of a mixture may result from additive effects among the compounds, antagonistic effects (less than additive), or synergistic effects (greater than additive), or there may be no special effects that result from the mixture (independent effects). Additive or synergistic toxicity results in a mixture toxicity that is greater than that of any of its individual components.
Several combinations of organic compounds in mixtures for which possible health effects have been evaluated were identified in the sampled wells—specifically: atrazine and deethylat-razine; atrazine or simazine with nitrate; and
perchloroethene and three other solvents (Agency for Toxic Substances and Disease Registry, 2004b, 2004c). Combined concentrations of the contaminants in these mixtures, however, were less than available benchmarks, or no bench-marks were available for the mixtures. Atra-zine commonly co-occurred with its degradate deethylatrazine (84 percent of atrazine detec-tions) and with simazine (17 percent of atrazine detections), but combined concentrations were all less than a USEPA screening value of 12.5 µg/L for combined triazine concentrations in commu-nity public water systems (U.S. Environmental Protection Agency, 2006b). Nitrate (at concen-trations greater than 1 mg/L as N) co-occurred with atrazine, deethylatrazine, and (or) simazine in up to 14 percent of all sampled wells, and even more frequently in wells included in USGS targeted agricultural studies, but currently there are no numerical benchmarks for these mix-tures (Agency for Toxic Substances and Disease Registry, 2006). Similarly, although there are currently no benchmarks for mixtures of perchlo-rethene with trichloroethene, 1,1-dichloroethane, or 1,1,1-trichloroethane, which are considered to have additive toxic effects (Agency for Toxic Substances and Disease Registry, 2004c), one or more of these three solvents was present with 36 percent of perchlorethene detections.

40 Quality of Water from Domestic Wells in Principal Aquifers of the United States, 1991–2004 40 Quality of Water from Domestic Wells in Principal Aquifers of the United States, 1991–2004
More Information for Homeowners
Many government agencies and other organizations provide information for homeowners on domestic wells and water-quality testing. Local health departments also can provide information on domestic wells in many cases. These agencies and organizations include: the U.S. Environmental Protection Agency; the U.S. Centers for Disease Control and Prevention; the U.S. Department of Agriculture’s National Farm*A*Syst/Home*A*Syst Program and Cooperative State Research, Education, and Extension Service (CREES) National Water Program; state environmental and public health agencies; and several non-governmental organizations. Links to these sources of information on the World Wide Web are provided at http://water.usgs.gov/nawqa.
NAWQA Reports and Data are Readily Available
The U.S. Geological Survey (USGS) promotes public access to scientific information and strives to communicate and disseminate credible, timely, and relevant information about water resources. USGS Circulars from the National Water-Quality Assessment (NAWQA) Program, along with hundreds of other publications that describe individual study-unit and national-scale assessments, are available on the NAWQA Web site at http://water.usgs.gov/nawqa. The Web site also includes maps and water-quality data. The large NAWQA database on national water-quality conditions at http://water.usgs.gov/nawqa/data can be used for a wide range of analyses at national, regional, state, and local scales.

References Cited 41
References Cited
Agency for Toxic Substances and Disease Registry, 2004a, Toxicological profile for Strontium: U.S. Department of Health and Human Services, Public Health Service, accessed November 12, 2008, at http://www.atsdr.cdc.gov/toxprofiles/tp159.html.
Agency for Toxic Substances and Disease Registry, 2004b, Guidance manual for the assessment of joint toxic action of chemical mixtures: U.S. Department of Health and Human Services, Public Health Service, May 2004, 103 p., accessed January 25, 2007, at http://www.atsdr.cdc.gov/interaction profiles/IP-ga/ipga.pdf.
Agency for Toxic Substances and Disease Registry, 2004c, Interaction profile for: 1,1,1-trichloroethane, 1,1-dichloroethane, trichloroethylene, and tetrachloroethylene: U.S. Department of Health and Human Services, Public Health Service, May 2004, 103 p., accessed January 17, 2007, at http://www.atsdr.cdc.gov/interaction profiles/IP-vocs/ip02.pdf.
Agency for Toxic Substances and Disease Registry, 2006, Interaction profile for: atrazine, deethylatrazine, diazinon, nitrate, and simazine: U.S. Department of Health and Human Services, Public Health Service, August 2006, 68 p., accessed January 17, 2007, at http://www.atsdr.cdc.gov/interaction profiles/IP-10/ip10.pdf.
Agency for Toxic Substances and Disease Registry, 2008, Public health statement, manganese: U.S. Department of Health and Human Services, Public Health Service, September 2008, accessed November 12, 2008, at http://www.atsdr.cdc.gov/toxprofiles/tp151-c1-b.pdf.
Ayotte, J.D., Flanagan, S.M., and Morrow, W.S., 2007, Occurrence of uranium and 222Radon in glacial and bedrock aquifers in the northern United States, 1993–2003: U.S. Geological Survey Scientific Investigations Report 2007–5037, 85 p.
Ayotte, J.D., Montgomery, D.L., Flanagan, S.M., and Robinson, K.W., 2003, Arsenic in groundwater in eastern New England: occurrence, controls, and human health implications: Environmental Science and Technology, v. 37, no. 10, p. 2075–2083.
Bartos, T.T., Eddy-Miller, C.A., Norris, J.R., Gamper, M.E., and Hallberg, L.L., 2005, Water-quality characteristics of Quaternary unconsolidated-deposit aquifers and Lower Tertiary aquifers of the Bighorn Basin, Wyoming and Montana, 1999–2001: U.S. Geological Survey Scientific Investigations Report 2004–5252, 155 p.
Blackburn, B.G., Craun, G.F., Yoder, J.S., Hill, Vincent, Calderon, R.L., Chen, Nora, Lee, S.H., Levy, D.A., and Beach, M.J., 2004, Surveillance for waterborne-disease outbreaks associated with drinking water—United States, 2001–2002: U.S. Department of Health and Human Services, Centers for Disease Control and Prevention, Morbidity and Mortality Weekly Report, v. 53, no. SS-8, p. 23–45.
Bruce, B.W., Gurdak, J.J., and McMahon, P.B., 2007, Recepters—Quality of the used resource in the High Plains Aquifer, in McMahon, P.B., Dennehy, K.J., Bruce, B.W., Gurdak, J.J., and Qi, S.L., Water-quality assessment of the High Plains Aquifer, 1999–2004: U.S. Geological Survey Professional Paper 1749, chap. 3, p. 74–104.
Brutsaert, W.F., Norton, S.A., Hess, C.T., and Williams, J.S., 1981, Geologic and hydrologic factors controlling radon-222 in ground water in Maine: Ground Water, v. 19, p. 407–471.
Carpenter, D.O., Arcaro, Kathleen, and Spink, D.C., 2002, Understanding the human health effects of chemical mixtures: Environmental Health Perspectives, v. 110, supplement 1, p. 25–42.
DeSimone, L.A., 2009, Quality of water from domestic wells in principal aquifers of the United States, 1991–2004: U.S. Geological Survey Scientific Investigations Report 2008–5227, in press.

42 Quality of Water from Domestic Wells in Principal Aquifers of the United States, 1991–2004
Eaton, D.L., and Klaassen, C.D., 2001, Principles of toxicology, in Klaassen, C.D., ed., Casarett and Doull’s toxicology: the basic science of poisons (6th ed.): New York, McGraw-Hill, p. 1236.
Embrey, S.S., and Runkle, D.L., 2006, Microbial quality of the Nation’s ground-water resources, 1993–2004: U.S. Geological Survey Scientific Investigations Report 2006–5290, 34 p.
Erickson, M.L., and Barnes, R.J., 2005, Glacial sediment causing regional-scale elevated arsenic in drinking water: Ground Water, v. 43, no. 6, p. 796–805.
Florida Department of Health, 2006, Drinking water toxics program: Tallahassee, Fla., Florida Department of Health, Division of Environmental Health, accessed August 24, 2006, at http://www.doh.state.fl.us/environment/water/pdfs/brochure_toxics.pdf.
Focazio, M.J., Tipton, Deborah, Shapiro, S.D., and Geiger, L.H., 2006, The chemical quality of self-supplied domestic well water in the United States: Ground Water Monitoring and Remediation, v. 26, no. 3, p. 1–13.
Focazio, M.J., Welch, A.H., Watkins, S.A., Helsel, D.R., and Horn, M.A., 2000, A retrospective analysis on the occurrence of arsenic in ground-water resources of the United States and limitations in drinking-water-supply characterization: U.S. Geological Survey Water-Resources Investigations Report 99–4279, 22 p.
Gilliom, R.J., Barbash, J.E., Crawford, C.G., Hamilton, P.A., Martin, J.D., Nakagaki, Naomi, Nowell, L.H., Scott, J.C., Stackelberg, P.E., Thelin, G.P., and Wolock, D.M., 2006, Pesticides in the Nation’s streams and ground water, 1992–2001: U.S. Geological Survey Circular 1291, 172 p., available at http://ca.water.usgs.gov/pnsp/pubs/circ1291.
Gosselin, D.C., Headrick, Jacqueline, Tremblay, Rod, Chen, X.H., and Summerside, Scott, 1997, Domestic well water quality in rural Nebraska—Focus on nitrate-nitrogen, pesticides, and coliform bacteria: Ground Water Monitoring and Remediation, v. 17, p. 77–87.
Hagan, E.F., 2004, State ambient ground water quality monitoring program, arsenic speciation results (2002 & 2003): Idaho Department of Water Resources, Ground water quality technical brief, September 2004, 13 p., accessed September 14, 2006, at http://www.idwr.state.id.us/hydrologic/info/pubs/gwq/Arsenic_Technical_Brief_final.pdf.
Hallberg, G.R., Woida, K., Libra, R.D., Rex, K.D., Sesker, K.D., Kross, B.C., Seigley, L.S., Nations, B.K., Quade, D.J., Bruner, D.R., Nicholson, H.F., Johnson, J.K., and Cherryholmes, K.L., 1992, The Iowa state-wide rural well-water survey—Site and well characteristics and water quality: Iowa City, Iowa, Iowa Department of Water Resources, Technical Information Series 23, 43 p., accessed August 24, 2006, at http://www.igsb.uiowa.edu/gspubs/pdf/TIS-23.pdf.
Hem, J.D., 1985, Study and interpretation of the chemical characteristics of natural water (3d ed.): U.S. Geological Survey Water-Supply Paper 2254, 263 p.
Hess, C.T., Michel, J., Horton, T.R., Prichard, H.M., and Coniglio, W.A., 1985, The occurrence of radioactivity in public water supplies in the United States: Health Physics, v. 48, no. 5, p. 553–586.
Holden, L.R., Graham, J.A., Whitmore, R.W., Alexander, W.J., Pratt, R.W., Liddle, S.K., and Piper, L.L., 1992, Results of a national alachlor well water survey: Environmental Science and Technology, v. 26, p. 935–943.
Hutson, S.S., Barber, N.L., Kenney, J.F., Linsey, K.S., Lumia, D.S., and Maupin, M.A., 2004, Estimated use of water in the United States in 2000: U.S. Geological Survey Circular 1268, 46 p.
Ivahnenko, Tamara, and Zogorski, J.S., 2006, Sources and occurrence of chloroform and other trihalomethanes in drinking-water supply wells in the United States, 1986–2001: U.S. Geological Survey Scientific Investigations Report 2006–5015, 13 p.

References Cited 43
Jurgens, B.C., Burow, K.R., Dalgish, B.A., and Shelton, J.L., 2008, Hydrogeology, water chemistry, and factors affecting the transport of contaminants in the zone of contribution of a public-supply well in Modesto, Eastern San Joaquin Valley, California: U.S. Geological Survey Scientific Investigations Report 2008–5156, 78 p.
Kolpin, D.W., Barbash, J.E., and Gilliom, R.J., 1994, Occurrence of pesticides in shallow groundwater of the United States: Initial results from the National Water-Quality Assessment: Environmental Science and Technology, v. 32, p. 558–566.
Lapham, W.W., Hamilton, P.A., and Myers, D.N., 2005, National Water-Quality Assessment Program—Cycle II Regional assessments of aquifers: U.S. Geological Survey Fact Sheet 2005–3103, 4 p.
Lawrence, Errol, Poeter, Eileen, and Wanty, Richard, 1991, Geohydrologic, geochemical, and geologic controls on the occurrence of radon in ground water near Conifer, Colorado, U.S.A.: Journal of Hydrology, v. 127, p. 367–386.
Liang, J.L., Dziuban, E.J., Craun, G.F., Hill, Vincent, Moore, M.R., Gelting, R.J., Calderon, R.L., Beach, M.J., and Roy, S.L., 2006, Surveillance for waterborne-disease outbreaks associated with drinking water and water not intended for drinking—United States, 2003–2004: U.S. Department of Health and Human Services, Centers for Disease Control and Prevention, Morbidity and Mortality Weekly Report, v. 55, no. SS-12, p. 31–58.
Longtin, J.P., 1988, Occurrence of radon, radium, and uranium in groundwater: Journal of the American Water Works Association, v. 80, p. 84–93.
Loomis, D.P., 1987, Radon-222 concentration and aquifer lithology in North Carolina: Ground Water Monitoring Review: v. 7, no. 2, p. 33–39.
Maine Department of Human Services, 1998, The presence of MTBE and other gasoline compounds in Maine’s drinking water, a preliminary report: Augusta, Maine, Maine Department of Human Services, Bureau of Health, October 13, 1998, 24 p.
McMahon, P.B., and Chapelle, F.H., 2007, Redox processes and water quality of selected principal aquifer systems: Ground Water, v. 46, p. 259–271.
Mehnert, Edward, Schock, S.C., Barnhardt, M.L., Caughey, M.E., Chou, S.F.J., Dey, W.S., Dreher, G.B., and Ray, Chittaranjan, 1995, The occurrence of agricultural chemicals in Illinois’ rural, private wells—results from the pilot study: Ground Water Monitoring and Remediation, v. 15, p. 149–149.
National Atmospheric Deposition Program, 2005, 2000 Isopleth Maps, accessed October 5, 2005, at http://nadp.sws.uiuc.edu/isopleths/maps2000.
National Ground Water Association, 2006, Getting your water tested: Dublin, Ohio, National Ground Water Association, accessed February 17, 2006, at http://www.wellowner.org/awaterquality/testing.shmtl.
National Research Council, 1999, Risk Assessment of Radon in Drinking Water: Washington, D.C., National Academy Press, 296 p.
National Research Council, 2001, Arsenic In Drinking Water, 2001 update: Washington, D.C., National Academy Press, 225 p.
New Jersey Department of Environmental Protection, 2008, New Jersey Private Well Testing Act Program, Well test results for September 2002–April 2007: Trenton, N.J., New Jersey Department of Environmental Protection, 64 p., accessed September 18, 2008, at http://www.nj.gov/dep/pwta.
Nolan, B.T., and Hitt, K.J., 2003, Nutrients in shallow ground waters beneath relatively undeveloped areas in the conterminous United States: U.S. Geological Survey Water-Resources Investigations Report 02–4289, 17 p.
Nolan, B.T., and Hitt, K.J., 2006, Vulnerability of shallow groundwater and drinking-water wells to nitrate in the United States: Environmental Science and Technology, v. 40, no. 24, p. 7834–7840.

44 Quality of Water from Domestic Wells in Principal Aquifers of the United States, 1991–2004
Oregon Department of Human Services, 2003, Domestic well testing program: Portland, Oreg., accessed September 28, 2006, at http://Oregon.gov/DHS/ph/dwp/docs/dwtrules.pdf.
Otton, J.K., Gundersen, L.C.S., and Schumann, R.R., 1993, The geology of radon: U.S. Geological Survey General Interest Publication, 29 p.
Peters, S.C., Blum, J.D., Klaue, Bjoern, and Karagas, M.R., 1999, Arsenic in New Hampshire drinking water: Environmental Science and Technology, v. 33, no. 9, p. 1328–1333.
Plummer, L.N., Busenbery, Eurybiades, Eberts, S.M., Bexfield, L.M., Brown, C.J., Fahlquisht, L.S., Katz, B.G., and Landon, M.K., 2008, Low-level detections of halogenated volatile organic compounds in groundwater: use in vulnerability assessments: Journal of Hydrologic Engineering, v. 13, no. 11, p. 1049–1068.
Price, C.V., Nakagaki, N., Hitt, K.J., and Clawges, R.M., 2007, Enhanced historical land-use and land-cover data sets of the U.S. Geological Survey: U.S. Geological Survey Data Series 240 [digital data], available at http://pubs.usgs.gov/ds/2006/240.
Ray, Chittaranjan, and Schock, S.C., 1996, Comparability of large-scale studies of agricultural contamination of rural private wells: Ground Water Monitoring and Remediation, v. 16, p. 92–102.
Richards, R.P., Baker, D.B., Creamer, N.L., Kramer, J.W., Ewing, D.E., Merryfield, B.J., and Wallrabenstein, L.K., 1996, Well water quality, well vulnerability, and agricultural contamination in the Midwestern United States: Journal of Environmental Quality, v. 25, p. 389–402.
Riding, Rich, and Quilter, M.C., 2004, 2004 State of Utah ground-water program: Utah Department of Food and Agriculture, 15 p., accessed September 7, 2006, at http://www.ag.state.ut.us/conservation/gw_report.pdf.
Ryker, Sarah, 2001, Mapping arsenic in groundwater: Geotimes, November 2001, accessed December 2005, at http://www.agiweb.org/geotimes/nov01/feature_Asmap.html.
Schreiber, M.E., Gotkowitz, M.B., Simo, J.A., and Freiberg, P.G., 2003, Mechanisms of arsenic release to water from naturally occurring sources, eastern Wisconsin, in Welch, A.H., and Stollenwerk, K.G., eds., Arsenic in ground water—Occurrence and geochemistry: Boston, Mass., Kluwer Academic Publishers, chap. 9, p. 259–280.
Senior, L.A., 1998, Radon-222 in the ground water of Chester County, Pennsylvania: U.S. Geological Survey Water-Resources Investigations Report 98–4169, 79 p.
Shapiro, S.D., Busenberg, Eurybiades, Focazio, M.J., and Plummer, L.N., 2004, Historical trends in occurrence and atmospheric inputs of halogenated volatile organic compounds in untreated ground water used as a source of drinking water: Science of the Total Environment, v. 321, p. 201–271.
Shiber, J.G., 2005, Arsenic in domestic well water and health in central Appalachia, U.S.A.: Water, Air, and Soil Pollution, v. 160, p. 327–341.
Solley, W.B., Pierce, R.R., and Perlman, H.A., 1998, Estimated use of water in the United States in 1995: U.S. Geological Survey Circular 1200, 71 p., data accessed February 2006, at http://water.usgs.gov/watuse.
State Water Resources Control Board, 2005, Volunteer domestic well assessment project, El Dorado County Data Summary Report: Sacramento, Calif., California Environmental Protection Agency, State Water Resources Control Board, 23 p.
Szabo, Zoltan, and Zapecza, O.S., 1991, Geologic and geochemical factors controlling uranium, radium-226, and radon-222 in ground water, Newark Basin, New Jersey, in Gunderson, L.C.S., and Wanty, R.B., eds., Field studies of radon in rocks, soils, and water: U.S. Geological Survey Bulletin 1971, p. 243–265.

References Cited 45
Thomas, M.A., 2007, The association of arsenic with redox conditions, depth, and ground-water age in the glacial system of the northern United States: U.S. Geological Survey Scientific Investigations Report 2007–5036, 26 p.
Toccalino, P.L., 2007, Development and application of health-based screening levels for use in water-quality assessments: U.S. Geological Survey Scientific Investigations Report 2007–5106, 12 p.
Toccalino, P.L., Norman, J.E., Booth, N.L., and Zogorski, J.S., 2006, Health-based screening levels—A tool for evaluating what water-quality data may mean to human health: U.S. Geological Survey, National Water-Quality Assessment Program, accessed May 2007, at http://water.usgs.gov/nawqa/HBSL.
Toccalino, P.L., Norman, J.E., Phyllips, R.H., Kauffman, L.J., Stackelberg, P.E., Nowell, L.H., Krietzman, S.J., and Post, G.B., 2004, Application of health-based screening levels to ground-water quality data in a state-scale pilot effort: U.S. Geological Survey Scientific Investigations Report 2004–5174, 64 p.
Townsend, M.A., Young, D.P., and Healy, J., 1998, Results of agrichemical survey of ground water in Kansas, 1993–1994: Lawrence, Kans., Kansas Geological Survey Open-File Report 98–22, 46 p.
University of Rhode Island Cooperative Extension Program, 2003, Healthy drinking waters for Rhode Islanders, drinking water wells: University of Rhode Island, College of the Environment and Life Sciences Contribution 3969, Private Well Series, April 3003, 4 p., accessed November 28, 2008, at http://www.uri.edu/ce/wq/has/PDFs/Drinking.pdf.
U.S. Census Bureau, 2008, 1990 Census, accessed July 30, 2008, at http://www.census.gov/main/www/cen1990.html.
U.S. Centers for Disease Control and Prevention, 1998, A survey of the quality of water drawn from domestic wells in nine midwest states: U.S. Centers for Disease Control and Prevention, National Center for Environmental Health, accessed October 6, 1999, at http://www.cdc.gov/nceh/programs/emergenc/WellWater/MidwestWell.htm.
U.S. Centers for Disease Control and Prevention, Fluoride Recommendations Work Group, 2001, Recommendations for using fluoride to prevent and control dental caries in the United States: Morbidity and Mortality Weekly Report, 50(RR14), August 17, 2001, p. 1–42.
U.S. Centers for Disease Control and Prevention, 2003, Private well resources: U.S. Department of Health and Human Services, Centers for Disease Control and Prevention, accessed September 27, 2006, at http://www.cdc.gov/ncidod/dpd/healthywater/privatewell.htm.
U.S. Department of Agriculture, 2008, Agricultural Research Service (ARS), Pesticide properties database, accessed March 6, 2008, at http://www.ams.usda.gov/science/pdp.
U.S. Environmental Protection Agency, 1984, National statistical assessment of rural water conditions, Technical summary: Washington, D.C., U.S. Environmental Protection Agency, Office of Drinking Water, EPA570/9-84-004, 111 p.
U.S. Environmental Protection Agency, 1990, National Pesticide Survey, Summary results of EPA’s national survey of pesticides in drinking water wells: Washington, D.C., U.S. Environmental Protection Agency, Office of Water and Office of Pesticides and Toxic Substances, EPA 570/9-90-NPS5, 17 p., accessed October 3, 2006, at http://nepis.epa.gov/pubtitleOSWER.htm.
U.S. Environmental Protection Agency, 1992, Secondary drinking water regulations—Guidance for nuisance chemicals: Washington, D.C., U.S. Environmental Protection Agency, EPA810/K-92-001, accessed September 29, 2008, at http://www.epa.gov/safewater/consumer/2ndstandards.html.

46 Quality of Water from Domestic Wells in Principal Aquifers of the United States, 1991–2004
U.S. Environmental Protection Agency, 1998, Code of Federal Regulations, title 40—Pro-tection of environment, chapter 1—Envi-ronmental Protection Agency, subchapter E—Pesticide Programs, part 159—State-ments of policies and interpretations, sub-part D—Reporting requirements for risk/benefit information, 40 CFR 159.184: National Archives and Records Administra-tion, September 19, 1997; amended June 19, 1998, accessed February 12, 2007, at http://www.gpoaccess.gov/ecfr/index.html.
U.S. Environmental Protection Agency, 1999, Proposed radon in drinking water rule: Washington, D.C., U.S. Environmental Protection Agency, Office of Water, EPA 815-F-99-006, 6 p., accessed October 26, 2005, at http://www.epa.gov/safewater/radon/proposal.html.
U.S. Environmental Protection Agency, 2000, National water quality inventory, 1998 Report to Congress, Ground water and drinking water chapters: Washington, D.C., U.S. Environmental Protection Agency, Office of Water, EPA 816-R-00-013, 99 p., accessed September 28, 2006, at http://www.epa.gov/ogwde/protect/98_305b_all.pdf.
U.S. Environmental Protection Agency, 2001, Factoids: Drinking water and ground water statistics for 2000: Washington, D.C., U.S. Environmental Protection Agency, Office of Water, EPA 816-K-01-004, 10 p., accessed September 28, 2006, at http://www.epa.gov/safewater/data/pdsfs/data_factoids_2000.pdf
U.S. Environmental Protection Agency, 2002, Drinking water from household wells: Washington, D.C., U.S. Environmental Protection Agency, Office of Water, EPA 816-K-02-003, 19 p., accessed September 28, 2006, at http://www.epa.gov/safewater/privatewells/household_wells.pdf.
U.S. Environmental Protection Agency, 2003a, Announcement of regulatory determinations for priority contaminants on the drinking water contaminant candidate list: Washington, D.C., Federal Register, v. 68, no. 138, p. 42898–42905, accessed September 17, 2008, at http://edocket.access.gpo.gov/2003/pdf/03-18151.pdf.
U.S. Environmental Protection Agency, 2003b, Water on tap—what you need to know: Office of Water, EPA 816-K-03-007, accessed November 25, 2008, at http://www.epa.gov/safewater/wot/pdfs/book_waterontap_full.pdf.
U.S. Environmental Protection Agency, 2006a, 2006 Edition of the drinking water standards and health advisories: Washington, D.C., U.S. Environmental Protection Agency, Office of Water, EPA 822-R-06-013, 18 p.
U.S. Environmental Protection Agency, 2006b, Triazine cumulative risk assessment: Washington, D.C., U.S. Environmental Protection Agency, Office of Pesticide Programs, Health Effects Division, March 28, 2006, 67 p., available at http://www.epa.gov/oppsrrd1/REDs/triazine_cumulative_risk.pdf.
U.S. Environmental Protection Agency, 2007, Unregulated Contaminant Monitoring Program, accessed June 10, 2008, at http://www.epa.gov/safewater/ucmr/index.html.
U.S. Environmental Protection Agency, 2008a, Regulatory determinations support document for selected contaminants from the second drinking water contaminant candidate list (CCL 2), chap. 3, boron: Washington, D.C., U.S. Environmental Protection Agency, Office of Ground Water and Drinking Water, EPA Report 815-R-08-012, 4 p., accessed September 17, 2008, at http://www.epa.gov/safewater/ccl/pdfs/reg_determine2/report_ccl2-reg2_supportdocument_full.pdf.
U.S. Environmental Protection Agency, 2008b, Drinking water contaminants, accessed November 25, 2008, at http://www.epa.gov/safewater/contaminants/index.html.
U.S. General Accounting Office, 1997, Drinking water, Information on the quality of water found at community water systems and private wells: Washington, D.C., U.S. General Accounting Office, Resources, Community, and Economic Development Division, GAO/RCED-97-123, 47 p.
U.S. Geological Survey, 2003, Principal aquifers, in National Atlas of the United States of America, 1 sheet, 1:5,000,000 scale, available at http://www.nationalatlas.gov/wallmaps.html.

References Cited 47
U.S. Senate, 2002, Title XIV of the public health service act; safety of public water systems (Safe Drinking Water Act); Part A—definitions (as amended through P.L. 107–377): Updated December 31, 2002, accessed July 29, 2008, at http://epw.senate.gov/sdwa.pdf.
Veterans Benefits Administration, 2005, Lender’s handbook, VA pamphlet 26-7, revised: Washington, D.C., U.S. Department of Veterans Affairs, Veterans Benefits Administration, variously paginated.
Waller, R.M., 1991, Ground water and the rural homeowner: U.S. Geological Survey General Interest Publication, accessed November 28, 2008, at http://pubs.usgs.gov/gip/gw_ruralhomeowner.
Welch, A.H., Westjohn, D.B., Helsel, D.R., and Wanty, R.B., 2000, Arsenic in ground water of the United States—occurrence and geochemistry: Ground Water, v. 38, no. 4, p. 589–604.
World Health Organization, 2004, Guidelines for Drinking-Water Quality (3d ed.), volume 1, Recommendations: Geneva, Switzerland, World Health Organization, 515 p.
Zogorski, J.S., Carter, J.M., Ivahnenko, Tamara, Lapham, W.W., Moran, M.J., Rowe, B.L., Squillace, P.J., and Toccalino, P.L., 2006, Volatile organic compounds in the Nation’s ground water and drinking-water supply wells: U.S. Geological Survey Circular 1292, 101 p., available at http://water.usgs.gov/nawqa/vocs/national_assessment.

Abbreviations, Acronyms, and Units of MeasureCaCO3 calcium carbonate
CDC U.S. Centers for Disease Control and Prevention
CFU/100mL colony-forming units per 100 milliliters
ft foot
mi mile
mi2 square mile
HBSL Health-Based Screening Level
MCL Maximum Contaminant Level
mg/L milligrams per liter
µg/L micrograms per liter
NAWQA National Water-Quality Assessment
NPS National Pesticide Study
NSA National Statistical Analysis of Rural Water Conditions
pCi/L picocuries per liter
SDWA Safe Drinking Water Act
SMCL Secondary Maximum Contaminant Level
USEPA U.S. Environmental Protection Agency
USGS U.S. Geological Survey
VOCs volatile organic compounds
48 Quality of Water from Domestic Wells in Principal Aquifers of the United States, 1991–2004

Prepared by the Pembroke Publishing Service Center.
For more information concerning this report, contact:
DirectorU.S. Geological SurveyMassachusetts-Rhode Island Water Science Center10 Bearfoot RoadNorthborough, MA [email protected]
or visit our Web site at:http://ma.water.usgs.gov

Printed on recycled paperPrinted on recycled paper
DeSimone and others—
Quality of W
ater from D
omestic W
ells in Principal Aquifers of the U
nited States, 1991–2004—O
verview of M
ajor Findings—Circular 1332