Embed Size (px)
Citation preview

TR-345 2009
Field Demonstration of the Performance of a
Geotube® Dewatering System to Reduce Phosphorus and Other Substances from
Dairy Lagoon Effluent
Final Report July 2006
By: S. Mukhtar, Texas AgriLife Research
K. Wagner, Texas Water Resources Institute L. Gregory, Texas Water Resources Institute
Funded by the Texas State Soil and Water Conservation Board
under CWA Section 319, EPA TSSWCB Project # 03-10
Partners: Texas AgriLife Extension Service (formerly Texas Cooperative Extension) Texas Water Resources Institute
Ten Cate Nicolon – Miratech Division
Texas Water Resources Institute Technical Report January 2009

1
Field Demonstration of the Performance of a Geotube® Dewatering System to Reduce Phosphorus and Other Substances from
Dairy Lagoon Effluent

3
Field Demonstration of the Performance of a Geotube® Dewatering System to Reduce Phosphorus and Other Substances from
Dairy Lagoon Effluent
Final Report
July 2006
Funded by the Texas State Soil and Water Conservation Board under CWA Section 319, EPA TSSWCB Project #03‐10 Partners Texas Cooperative Extension Texas Water Resources Institute Ten Cate Nicolon – Miratech Division

Table of Contents Executive Summary 1 Introduction 2 Geotube® Dewatering System 3 Methods 6
Sampling 6 Calculations 8
Results 10 Solids and pH 10
Nutrients 11 Metals 11 Conductivity 11 Mass Balance 12
Economics 17 Conclusion 17 References 19 Acknowledgements 19 Appendix I 20 Appendix II 22

1
Executive Summary Two upper North Bosque River segments were designated as impaired in 1998 due to point source and nonpoint source (NPS) pollution of phosphorus (P) to these segments in the watershed. As a result, two Total Maximum Daily Loads (TMDLs) were applied which called for the reduction of annual loading and annual average soluble reactive P (SRP) concentrations by about 50%. This demonstration was conducted to evaluate the efficacy of a prospective new technology, the Geotube® dewatering system that may aid dairy farmers in reducing P from lagoon effluent to be applied to waste application fields and thus reducing NPS pollution. In this Geotube® dewatering system, effluent is pumped from the dairy lagoon using a PTO-driven chopper pump into a PVC pipe with a series of elbows that facilitate thorough mixing of the chemical pretreatment. Alum and a polymer are added to the effluent agglomerate solids and precipitate P as it flows through the elbows to the Geotubes®. Two 14’ x 50’ geotextile fabric tubes were installed on a 6 millimeter impermeable polyethylene sheet next to a primarily dairy lagoon that received flushed manure. After the tubes were filled, they were allowed to dewater for a period of 6 months. Rainwater typically sheds off of the tubes and does not soak into the tubes. At the first two sampling events in March and April 2005, samples of the dairy lagoon effluent, the lagoon effluent after the addition of the chemical pre-treatment, and the effluent dewatering from the tubes were taken and flow rates into the tube were measured. At the last sampling event in October 2005, samples of residuals and depth of the dewatered residuals were taken from both tubes. Samples from the three events were analyzed for concentration of solids, nutrients, metals and pH. Results showed that the Geotube® dewatering system performed very well in filtering solids from the dairy lagoon effluent, removing an average of 93.5% of the total solids between the two pumping and dewatering events of March and April. It was effective in removing nutrients and metals as well. The average percent reduction of SRP for the two events was very high at 85%. It should be noted that these findings were limited to the sampling of the tubes in March and April and the tubes continued to dewater for several months. Therefore, any changes in the concentration of the dewatering effluent, volatilizing solids and precipitating substances after the sampling events could not be accounted for. A brief economic analysis of this dewatering system was furnished by the technology provider. Cost estimates for a long-term dewatering system were $90,000 to treat 1.9 million gallons of dairy lagoon effluent containing 15+ years worth of nutrients and solids that settled to the bottom of the lagoon at a 2000 head lactating cow open-lot dairy. This estimate includes all capital and operating costs except removal of residual solids. Costs will vary depending on the size of the dairy and the length of time between lagoon treatments using Geotubes®.

2
Introduction Water quality degradation due to phosphorus (P) contribution as a nonpoint source pollutant from effluent and manure applied to waste application fields (WAFs) is a major concern in the Bosque River watershed. Point source pollutants have also been identified as contributors to the problem in the Bosque River. In 1998 two upper North Bosque River segments were designated as impaired segments on the Texas Clean Water Act, Section 303(d) list (TNRCC, 2001). This designation was the result of nutrient loading and aquatic plant growth in those segments. The changes in the status of the Bosque River segments prompted the Texas Commission on Environmental Quality (TCEQ) to apply TMDLs for P to the designated segments. In December of 2002, the Texas Commission on Environmental Quality approved the implementation plan of these two TMDLs, and these plans were approved as well by the Texas State Soil and Water Conservation Board (TSSWCB) in January, 2003. These TMDLs call for a reduction of the annual loading and annual average SRP concentrations by about 50%. The TCEQ has cited pollution from nonpoint source agricultural operations (by way of runoff) as the main source of contamination to water bodies. Reducing P from dairy effluent applied to WAFs is vital to protecting these water bodies. Runoff from WAFs is not strictly regulated because they are regarded as a nonpoint source. Currently, a number of dairy operations in the watersheds are using best management practices (BMPs) to remove P and SRP from the wastewater. However, to meet the goals of these TMDLs, new, more effective and more efficient BMPs will need to be adopted by the dairies. One prospective BMP is the use of a Geotube® dewatering system, to remove P and other constituents from the effluent being stored and treated in dairy lagoons. This report outlines the performance of a Geotube® dewatering system which was introduced for evaluation by the Miratech Division of Ten Cate Nicolon and General Chemical Corporation. This system uses a chemical pre-treatment to coagulate the solids from the lagoon effluent. The mixture is then pumped into two large geotextile filtration tubes situated on 6 millimeter impervious polyethylene sheeting. On the down slope end of each tube, a synthetic felt-like fabric was installed to prevent potential soil erosion from water leaving the tube. The synthetic fabric of the geotextile tube acts as a filter as the liquid is pumped into the tube and a high percentage of the solids are retained as the liquid weeps from the pores in the fabric (Worley, 2004). After the tubes are filled to a height of approximately 5’ with the mixture (Fig. 2.b), the pumping of effluent ceases and they are left to dewater for 6 months. After dewatering, the residuals are disposed of off-site. The dewatering system comprised of two 14’ X 50’ tubes was set-up to treat the effluent from the primary lagoon of a 2000-head lactating cow open-lot dairy in the Leon River watershed (which is adjacent to the Bosque River watershed). Manure from the milking parlor at this dairy was flushed into the primary lagoon. Effluent from this lagoon was conveyed to a secondary lagoon where it was recycled for flushing the parlor and irrigating hay and cropland at the dairy operation.

3
PTO Driven Chopper Pump
Lagoon
Tube 1
Tube 2
4” Vinyl Tube
4” PVC
6” PVC
1
2
a – Flow meter reading 1 – Alum pump 2 – Polymer pump
Sample (IF) Gate Valve Sample (IFCM)
Recirculation Tube
Garden Hose
a
a
6mil. Polyvinyl Sheet
6” Vinyl Tube
Geotube® Dewatering System For the sampling events on March 30, 2005 and April 6, 2005 the system’s configuration was as follows (Figs. 1, 2.a, and 3):
• The lagoon was agitated using a PTO-driven chopper pump for a minimum of 2 hours prior to pumping a well mixed raw effluent to the tubes (Fig 3).
• Effluent from the lagoon was pumped at approximately 400 gpm into a 6”
schedule 40 PVC pipe via a 6” reinforced vinyl fire hose. A total of 186,000 and 182,000 gallons of raw lagoon effluent was pumped into tube 1 and tube 2 for the two sampling events, respectively (volumes were estimated from the flow rate measurements).
• The pipe reduced from a 6” schedule 40 PVC to a 4” schedule 40 PVC.
• Alum and then a polymer were injected as a chemical pre-treatment into the
pipe as the liquid flowed through a series of 90° elbows which served to mix the liquid with the pre-treatment (Fig 2a).
• The pipe then divides in two, one pipe going to tube one and the other pipe
going to tube two, each filling their respective tubes with chemically treated effluent via a 4” reinforced vinyl fire hose.
Fig. 1. Schematic of the Geotube® Dewatering System Components (not to scale)

4
Fig. 2.a. Geotube® System Configuration
Fig. 2.b. Geotubes® Filled to Approximately 5’ in Height

5
Fig. 3. PTO Driven Chopper Pump in the Primary Lagoon

6
Methods Sampling Ten sets of 15 (250 mL) grab samples were taken at each of the sampling events of March 30 and April 6, 2005. However, on the second sampling event there was only enough effluent weeping from tube 2 to take two instead of three sets of effluent samples. Each set of 15 grab samples were mixed in the laboratory and analyzed as one composite sample. Additionally, four samples each from tubes 1 and 2 were randomly taken on October 3, after both tubes had dewatered for six months. These residual solids (RS) were taken from the entire profile after the tubes had dewatered (Figs. 4, 7, & 8).The sampling methods for influent, effluent, residual solids, and flow rates are as follows:
• Two sets of effluent from the lagoon being pumped into the system were taken from a port in the 4” PVC pipe. This was called influent (IF). (Fig. 1 & 5)
• Two sets of the liquid mixture were taken from a port in the 4” PVC pipe after
the chemical pretreatment of lagoon effluent. This was called influent with chemical (IFCM). (Fig. 1)
• Six sets (three from tube 1 and three from tube 2) of effluent weeping from the
tubes were taken by placing the bottles under the edge of the tube to catch the effluent (Fig. 6)
• Measurements of residual solids depth were taken at each of the four RS
sampling locations in each tube as well as a depth measurement taken in the center of each tube (Fig. 4). Each sample was mixed thoroughly in a plastic bucket and a portion of this sample was put into a freezer bag
• Samples were put on ice and transported to the laboratory within a few hours of
each sampling event for analysis of the following analytes: Total Solids (TS), Total Volatile Solids (TVS), Total Fixed Solids (TFS), Total Suspended Solids (TSS), Total Dissolved Solids (TDS), Soluble Reactive Phosphorus (SRP), Total Phosphorus (TP), Nitrate/Nitrite-Nitrogen (NNN), Total Kjeldahl Nitrogen (TKN), Potassium (K), Calcium (Ca), Magnesium (Mg), Sodium (Na), Manganese (Mn), Iron (Fe), and Copper (Cu). (Table 1)
• Flow rate measurements into tube 1 and tube 2 were made with a Greyline
PDFM 4 Doppler flow meter at approximately half hour intervals for the duration of the system’s operation (Fig. 1)

7
Table 1: Laboratory Analytical Methods Parameter Method Equipment Used Nitrite+Nitrate Nitrogen (NNN) EPA 351.2 Perstorp® or Lachat® QuickChem Autoanalyzer Total Kjeldahl Nitrogen (TKN) EPA 353.2 Perstorp® or Lachat® QuickChem Autoanalyzer Potassium (K) EPA 200.7 Spectro ® ICP Calcium (Ca) EPA 200.7 Spectro ® ICP Magnesium (Mg) EPA 200.7 Spectro ® ICP Sodium (Na) EPA 200.7 Spectro ® ICP Manganese (Mn) EPA 200.7 Spectro ® ICP Iron (Fe) EPA 200.7 Spectro ® ICP Copper (Cu) EPA 200.7 Spectro ® ICP Orthophosphate Phosphorus (SRP) EPA 365.2 Beckman® DU 640 Spectrophotometer Total Phosphorus (TP) EPA 365.2,4 Perstorp® or Lachat® QuickChem Autoanalyzer Total Suspended Solids (TSS) EPA 160.2 Sartorius® AC210P or Mettler® AT261 analytical balance, oven Total Solids (TS) SM 2540C Sartorius® AC210P or Mettler® AT261 analytical balance, oven
Volatile Solids (VS) EPA 160.4 Sartorius® AC210P or Mettler® AT261 analytical balance, oven, muffle furnace
Potential Hydrogen (pH) EPA 150.1 Accument® AB15 Plus pH meter Conductivity (Cond.) EPA 120.1 YSI® 3200 conductivity meter Aluminum (Al) EPA 200.7 Spectro ® ICP * Concentrations of Total Dissolved Solids were found by subtracting the concentrations of Total Suspended Solids from Total Solids.

8
Calculations
• Once the raw data was received from the lab, concentrations of samples treated as solids (IF, IFCM, and RS) were converted from mg/kg dry to mg/L as-is using their respective percent total solids values for each sample.
• Averages and standard deviations of IF concentrations and IFCM concentrations
were calculated for both sampling events.
• Pooled averages and standard deviations of EF concentrations using both tubes were calculated for both sampling events.
• Residual samples taken on October 3, were used to calculate pooled averages and
standard deviations using concentrations from both tubes.
• Percent reductions for each week were calculated using the following equation: o {(IFavg-EFavg)/(IFavg)}*100
Where IFavg and EFavg are average concentrations of analytes in influent and effluent, respectively and calculated from all IF and EF composite samples analyzed for tubes 1 and 2.
Fig. 4. Location of Residual Samples (RS) and Depth Measurements for
Tubes 1 and 2
1
2
3
4
Depth measurement and sampling location
Depth measurement location only

9
Fig. 5. Influent Being Sampled
Fig. 6. Effluent Being Sampled from a Dewatering Geotube®

10
Results Tables 2, 3, and 4 show average concentrations and percent reductions (%RD) of solids, nutrients, and metals, respectively for data collected from the sampling events of March 30, April 6 and October 3, 2005. Concentrations of all analytes in the influent (IF) were similar for the two sampling events of March 30 and April 6 with small variations between events. This indicated that the chopper pump effectively mixed the effluent in the lagoon as it was pumped into the system for both events. However, average concentrations of solids, nutrients and metals in EF varied substantially from one sampling event to the other. Therefore, it is possible that amounts of these analytes in EF fluctuated as the tubes continued to dewater for 6 months after the second pumping event in April 6. Hence, the results should be considered a snapshot of the performance of this system at the time of the sampling events. Despite the fact that average concentrations of analytes were not corrected for their respective amounts in IF, EF or RS (Tables 2-4), it was observed that all of the analytes, with the exception of SRP and sodium, had large increases in concentration from the levels in IF to the levels in RS. This indicates the Geotubes® were effectively functioning as filters, retaining much of the solids, nutrients, and metals as the liquid dewatered from the tubes. The data in Tables 2-4 show concentrations of analytes averaged across samples collected and composited from both Geotubes®. Solids and pH As shown in Table 2, TFS and TVS generally comprised the majority of the solids in IF. The IF had a TS content of about 6% for both tubes at either sampling event. The TVS concentrations in IF and IFCM contributed more than 50% of total solids but only a fraction of TVS was found in the dewatered liquid from both tubes. After 6 months of dewatering, TVS concentrations in the residual solids were lower than TFS. This was due to the loss of volatile solids in EF or emission of TVS as gas from the tubes to the atmosphere. A small increase in the concentrations was seen from IF to IFCM for only TS and TFS. This increase was expected due to the addition of solids from chemical pre-treatment. The concentration of TVS did not increase after the addition of the pre-treatment because none of the solids being added from alum and polymer were volatile. The high percent reduction for all solids on both sampling events (March 30 and April 6) and large percent increases in all residual solids (October 3) indicated that Geotubes® were effective as filters for the dairy lagoon effluent (IF). TVS had the highest percent reductions of all solids. Overall, there was a slight change in the pH of lagoon effluent treated with alum and a polymer and pumped into the tubes. The lagoon effluent became slightly more neutral

11
from IF to EF and a decrease in pH was seen from IF to RS. These reductions in the pH were due to addition of alum (acidic) to the IF. Additionally, lower TS content in EF samples may have provided more accurate (less buffering) pH probe readings as compared to IF and RS samples with much higher TS. Nutrients SRP in IF was less than 15% of TP from both sampling events. Total P and K concentrations in IF were substantially lower than the TKN concentrations for both sampling events. The reduction of SRP from IF to IFCM as well as its reduced concentration from IF to RS was attributed to the addition of the positively charged aluminum in alum (added in the chemical pre-treatment) binding to the negatively charged OPO4-P (SRP) rendering most of it insoluble. Table 3 shows that the system effectively removed very high percentages of SRP, TP, and TKN; however, K being highly soluble, remained in the tubes and less than 50% was removed in IF on both sampling events. The high percent reductions indicated that this system was effective in reducing SRP, TP, and TKN from the dairy lagoon effluent. Metals Although concentrations of Ca in the influent appear to be very large in comparison with the other analytes, its concentration is not atypical in the slurry of an average dairy lagoon (Barker et al. 2001). Very high percent reductions were seen for Ca, Mn, Fe, and Cu. For some of the EF samples, concentrations of Cu in the effluent were below the laboratory instrumentation detection limits. It is apparent from the low percent reductions that this system was not effective in reducing Na from the dairy lagoon effluent (IF). For all other metals, the Geotubes® functioned as an effective filter. Conductivity Average values of conductivity found in EF of both tubes were 5347 µS/cm (±140) and 6300 µS/cm (±806) for March 30 and April 6 sampling events, respectively. According to Barker et al. (2001), the average conductivity for anaerobic dairy lagoon liquid (supernatant) in North Carolina was 3738 µS/cm (± 939). Dairy lagoon slurry samples (composite samples from top of the liquid level to top of the dense sludge at the bottom) in Texas by Mukhtar et al. (2004) showed that average conductivity was 7324 µS/cm (± 2931). The EF concentrations of most metals (minerals) from both tubes were lower than IF or RS concentrations resulting in lower conductivity than the average from lagoon supernatant (Barker et al., 2001) or slurry (Mukhtar et al., 2004).

12
Mass Balance The mass of dairy lagoon effluent pumped into the tubes for both sampling events was determined by first calculating the volume of the effluent from the flow meter measurements taken at each event. The average specific gravity (found from the samples sent to the lab) of the influent samples was used to find the density of influent (948 kg/m3). From the density and volumes found, the mass of dairy lagoon effluent pumped into the system for both tubes on both sampling events were found. The mass of residual solids was determined by estimating the volume of the solids remaining in the tubes from length, width and height measurements taken on the October 3 sampling event (Fig 4). The RS samples were not analyzed for specific gravity, so density could not be found empirically. In the Worley et al. (2004) study, it was found that the density of the influent and the density of the residual solids in the Geotube® only differed by 4 kg/m3, so for our analysis we used the influent density (948 kg/m3) to calculate the mass of the solids remaining in the tubes. The mass of the effluent from each tube was found by subtracting the mass of the residuals from the mass of the influent pumped into each tube. The total (tube 1 + tube 2) masses of IF, RS and EF were subsequently used to determine the masses of each analyte they contained (Table 6). Separation efficiencies (eq. 1), mass balance (eq. 2) and mass balance error (eq. 3) were then calculated (Table 6): Eq. 1: S.E. = [(IFm - EFm) / IFm]*100 Eq. 2: M.B. = IFm – EFm – RSm Eq. 3: M.B.E. = (M.B. / IF) * 100 Where IFm = (IFm t1+t2, March 30 + IFm t1+t2, April 6 ) EFm = (EFm t1+t2, March 30 + EFm t1+t2, April 6 ) RSm = (RST1m + RST2m, October 3 ) The data for average mass of all solids, nutrients and metals in IF, EF, and RS of Tubes 1 and 2 and S.E., M.B., and M.B.E are presented in Table 6.

13
Table 2: Average Concentration (s.d.) and Percent Reductions (% Rd) of Solids and pH
30-Mar (mg/L) 6-Apr (mg/L) 3-Oct (mg/kg as-is) TS TVS TFS pH TS TVS TFS pH TS TVS TFS pH
IF (s.d.) 6.01 ± 0.03 3.45 ± 0.21 2.71 ± 0.03 7.85 ± 0.13 6.08 ± 0.05 3.23 ± 0.06 2.86 ± 0.01 7.52 ± 0.01 IFCM (s.d.) 6.87 ± 0.30 3.38 ± 0.12 3.34 ± 0.21 7.65 ± 0.04 6.64 ± 0.63 3.23 ± 0.01 2.91 ± 0.07 7.38 ± 0.30
EF (s.d.) 0.36 ± 0.36 0.08 ± 0.08 0.28 ± 0.28 7.18 ± 0.18 0.45 ± 0.10 0.10 ± 0.02 0.34 ± 0.09 7.39 ± 0.17 RS (s.d.) 26.7 ± 1.4 11.8 ± 0.6 14.9 ± 0.9 7.3 ± 0.3
% Rd 94 98 90 8 93 97 88 2
Table 3: Average Concentrations and Percent Reductions (% Rd) of Nutrients
30-Mar (mg/L as-is) 6-Apr (mg/L as-is) 3-Oct (mg/kg as-is) SRP TP TKN K SRP TP TKN K SRP TP TKN K
IF (s.d.) 41.7 ± 4.2 337 ± 4.8 2031 ± 9.6 560 ± 31 43.4 ± 3.7 333 ± 13 1992 ± 130 603 ± 2.0 RS 4.1 ± 1.1 2469 ± 109 5232 ± 356 1219 ±
135 IFCM (s.d.) 18.3 ± 2.7 326 ± 11 2094 ± 102 592 ± 17 23.2 ± 27.7 317 ± 0.98 1899 ± 11 557 ± 23
EF (s.d.) 4.9 ± 1.6 10 ± 4.7 308 ± 16 295 ± 5.6 8.4 ± 3.0 14 ± 5.0 337 ± 7.8 372 ± 64
% Rd 88 97 85 47 81 96 83 38

14
Table 4: Average Concentrations and Percent Reduction (% Rd) of Metals 30-Mar (mg/L as-is) 6-Apr (mg/L as-is) Ca Mg Na Mn Fe Cu Ca Mg Na Mn Fe Cu
IF (s.d.) 3261 ± 88 384 ± 7.1 200 ± 2.5 21 ± 0.52 184 ± 8.5 6.03 ± 0.11 3466 ± 15 410 ± 1.2 210 ± 8.2 22 ± 0.17 217 ± 9.5 5.73 ± 0.10 IFCM (s.d.) 3754 ± 98 430 ± 2.8 197 ± 11 23 ± 0.32 246 ± 18 6.29 ± 0.49 3304 ± 107 382 ± 13 206 ± 2.2 20 ± 0.69 179 ± 7.9 5.42 ± 0.26
EF (s.d.) 301 ± 49 132 ± 2.0 143 ± 6.8 1.40 ± 0.32 1.9 ± 1.7 0.03 ± 0.06 282 ± 34 191 ± 48 222 ± 53 0.99 ± 0.21 0.66 ± 0.23 0.01 ± 0.01
% Rd 91 66 29 93 99 99 92 54 -5 95 99 99
3-Oct (mg/kg as-is) Ca Mg Na Mn Fe Cu
RS (s.d.) 16532 ± 1986 1346 ± 123 298 ± 31 81 ± 8.9 1118 ± 122 33 ± 3.1 Table 5: Average Conductivity
30-Mar (µS/cm)
6-Apr (µS/cm)
Cond. Cond. EF (s.d.) 5347 ±140 6300 ±806

15
Table 6: Average Mass of Solids, Nutrients and Metals from IF, EF and RS of Tubes 1 and 2, and Separation Efficiencies (S.E), Mass Balance (M.B.), and Mass Balance Error (M.B.E.).
Solids (kg) Nutrients (kg)
Parameter TS TFS SRP TP TKN K 3-Mar IF (s.d.) 13737 ± 64 6194 ± 16 9.5 ± 0.96 77.1 ± 1.1 464 ± 2.2 128 ± 7.1
6-Apr IF (s.d.) 2845 ± 23 1337 ± 3.3 2.03 ± 0.17 15.6 ± 0.6 93 ± 6.1 28.2 ± 0.09
3-Oct RST1 (s.d.) 5003 ± 82 2784 ± 93 0.075 ± 0.02 23.67 ± 1.3 96.46 ± 2.2 21.58 ± 1.1
3-Oct RST2 (s.d.) 4870 ± 193 2726 ± 106 0.077 ± 0.03 23.62 ± 1.8 96.90 ± 4.1 23.37 ± 1.2
EFT1 (s.d.) 475.5 ± 149 379.7 ± 115 0.56 ± 0.23 1.14 ± 0.23 41.64 ± 2.2 42.26 ± 9.96 EFT2 (s.d.) 399.9 ± 48 302.7 ± 33 0.81 ± 0.44 1.76 ± 0.68 41.52 ± 2.6 39.26 ± 2.1
S.E. (%) 94.7 90.9 88.2 96.9 85.1 47.8 M.B. 5833 1338 10.1 42.5 281.1 29.8 M.B.E. 35.2 17.8 86.9 45.9 50.4 19.1
Table 6: Continued
Metals (kg) Parameter Ca Mg Na Mn Fe Cu
3-Mar IF (s.d.) 745 ± 20.0 87.7 ± 1.6 45.6 ± 0.56 4.71 ± 0.12 42.0 ± 1.9 1.38 ± 0.02
6-Apr IF (s.d.) 162 ± 0.71 19.2 ± 0.06 9.9 ± 0.38 1.02 ± 0.01 10.2 ± 0.44 0.27 ± 0.004
3-Oct RST1 (s.d.) 309.65 ± 53.8 24.61 ± 2.0 5.29 ± 0.4 1.46 ± 0.2 19.94 ±1.4 0.60 ± 0.04
3-Oct RST2 (s.d.) 301.80 ± 11.2 25.11 ± 1.3 5.69 ± 0.06 1.52 ± 0.09 21.31 ± 1.2 0.63 ± 0.01
EFT1 (s.d.) 36.84 ± 3.2 19.51 ± 7.1 21.09 ± 9.1 0.165 ± 0.03 0.10 ± 0.03 0.0004 ± 0.0 EFT2 (s.d.) 42.98 ± 6.6 18.07 ± 0.85 19.81 ± 2.1 0.20 ± 0.05 0.30 ± 0.19 0.006 ± 0.01
S.E. (%) 91.2 64.9 26.3 93.7 99.2 99.6 M.B. 216.3 19.6 3.6 2.4 10.5 0.4 M.B.E. 23.8 18.4 6.5 41.8 20.2 25.3

16
Separation efficiencies found for all of the analytes are similar to the values for percent reductions shown in Tables 2-4 and Fig. 9. Separation efficiency for the solids was very high; this in conjunction with the high percent reductions observed for these solids indicates that the Geotube® dewatering system was effective in separating solids from the dairy lagoon effluent (IF). Overall, high separation efficiencies indicate that the Geotubes® were successful in reducing most nutrients and metals in EF. The M.B.E.s were generally reasonable considering this system was observed under field conditions. The analytes large M.B.E.s were those which could change form such as SRP (and other nutrients) and TS which includes volatile solids that would be lost between IF and either EF or RS. M.B.E.s were generally lower for stable analytes such as metals and TFS.
Separation Efficiencies and Percent Reductions
-10
10
30
50
70
90
TS TFS Sol P TP TKN K Ca Mg Na Mn Fe Cu
Analyte
%
S.E.% Rd 30-Mar% Rd 6-Apr
Fig. 9. Comparison of Separation Efficiencies and the Percent Reductions for Each
Sampling Event.
17
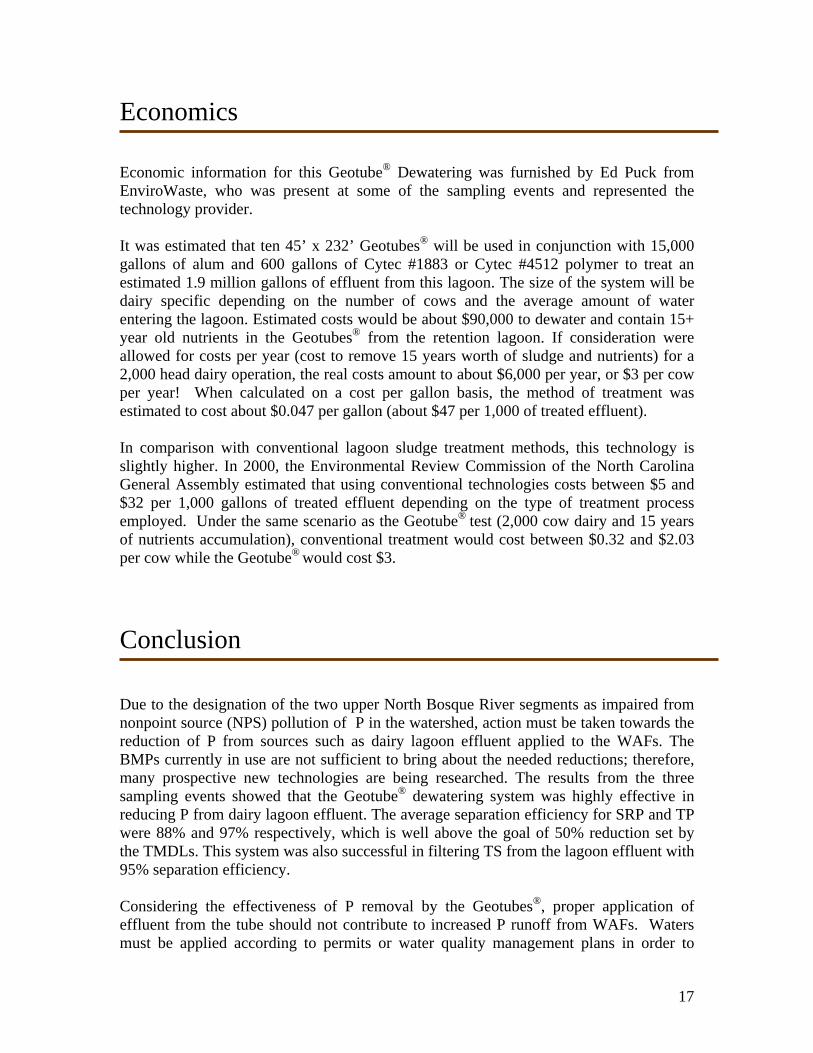
Economics Economic information for this Geotube® Dewatering was furnished by Ed Puck from EnviroWaste, who was present at some of the sampling events and represented the technology provider. It was estimated that ten 45’ x 232’ Geotubes® will be used in conjunction with 15,000 gallons of alum and 600 gallons of Cytec #1883 or Cytec #4512 polymer to treat an estimated 1.9 million gallons of effluent from this lagoon. The size of the system will be dairy specific depending on the number of cows and the average amount of water entering the lagoon. Estimated costs would be about $90,000 to dewater and contain 15+ year old nutrients in the Geotubes® from the retention lagoon. If consideration were allowed for costs per year (cost to remove 15 years worth of sludge and nutrients) for a 2,000 head dairy operation, the real costs amount to about $6,000 per year, or $3 per cow per year! When calculated on a cost per gallon basis, the method of treatment was estimated to cost about $0.047 per gallon (about $47 per 1,000 of treated effluent). In comparison with conventional lagoon sludge treatment methods, this technology is slightly higher. In 2000, the Environmental Review Commission of the North Carolina General Assembly estimated that using conventional technologies costs between $5 and $32 per 1,000 gallons of treated effluent depending on the type of treatment process employed. Under the same scenario as the Geotube® test (2,000 cow dairy and 15 years of nutrients accumulation), conventional treatment would cost between $0.32 and $2.03 per cow while the Geotube® would cost $3.
Conclusion
Due to the designation of the two upper North Bosque River segments as impaired from nonpoint source (NPS) pollution of P in the watershed, action must be taken towards the reduction of P from sources such as dairy lagoon effluent applied to the WAFs. The BMPs currently in use are not sufficient to bring about the needed reductions; therefore, many prospective new technologies are being researched. The results from the three sampling events showed that the Geotube® dewatering system was highly effective in reducing P from dairy lagoon effluent. The average separation efficiency for SRP and TP were 88% and 97% respectively, which is well above the goal of 50% reduction set by the TMDLs. This system was also successful in filtering TS from the lagoon effluent with 95% separation efficiency. Considering the effectiveness of P removal by the Geotubes®, proper application of effluent from the tube should not contribute to increased P runoff from WAFs. Waters must be applied according to permits or water quality management plans in order to

18
reduce P runoff. If irrigation occurs on un-permitted fields or is applied higher than the recommended rate, increases in P runoff could occur. Although this system was successful with respect to the removal of P, solids, and other constituents in the raw lagoon effluent, this was not an optimized system. This system was not considered optimized because the technology provider had difficulty in determining the appropriate quantities of alum and polymer for pretreatment of raw effluent. Maintaining a constant flow rate was also an issue because gate valves were used to control flow. Solids in the lagoon clogged the valves over time, steadily reducing the flow of effluent to the tubes. As a result, the valves had to be frequently opened completely, and then readjusted for the desired flow rate. This system was effective in removing P and other constituents from the dairy lagoon effluent; however, it must be optimized to be implemented as a best management practice for animal waste pollution control. Findings from this study will be condensed into fact sheets that highlight information about how the system operates, installation and operation economics, and its effectiveness to remove P and other materials. The final report and fact sheets will be presented to dairy producers, County Extension agents, the advisory committee, and anyone else interested in the projects in an effort to educate them so they can make an informed decision about using this technology.

19
References Barker, J.C., J.P. Zublena, and F.R. Walls. 2001. Animal and poultry manure production
and characterization. North Carolina Cooperative Extension Service. Available at: http://www.bae.ncsu.edu/programs/extension/manure/awm/program/barker/a&pmp&c/cover_page_apmp&c.html. (Accessed February 21, 2006.)
Mukhtar, S., J. L. Ullman, B. W. Auvermann, S. E. Feagley, and T. A. Carpenter. 2004. Impact of Anaerobic Lagoon Management on Sludge Accumulation and Nutrient Content for Dairies. TRANSACTIONS of the ASAE 47 (1) 250-257.
Texas Natural Resource Conservation Commission (TNRCC). 2001. Two Total Maximum Daily Loads for Phosphorus in the North Bosque River. The Strategic Assessment Division, TNRCC (Now TCEQ).
Worley, J.W., T.M. Bass, and P.F. Vendrell. 2004. Field test of geotextile tube for dewatering dairy lagoon sludge. ASAE Paper No. 044078. St. Joseph, Mich.: ASABE.
Acknowledgements This demonstration was conducted with funds from a USEPA CWA §319 (h) NPS grant (Project No. 03-10) administered by the Texas State Soil and Water Conservation Board. Thanks to Mr. Wayne Moerman, Owner, Triple X Dairy, Comanche, TX for his cooperation and for providing facilities to conduct this demonstration. The Miratech Division of Ten Cate Nicolon, Commerce, Georgia is acknowledged for their assistance and support with this demonstration.

20
Appendix I Raw Data: Concentrations of analytes for samples treated as liquid
Table I.1: Concentrations of Nutrients, Solids, and pH for the Sampling Event on 3/30/05
Table I.2: Conductivity and Concentrations of Metals for the Sampling Event on 3/30/05
Site ID Date Spec. Cond Umoh/cm K mg/L Ca mg/L Mg mg/L Na mg/L Mn mg/L Fe mg/L Cu mg/L
EF1T1 3/30/2005 5280 292 est 284 133 est 130 1.38 1.09 <0.003 EF2T1 3/30/2005 5510 295 est 298 132 est 141 1.42 0.617 <0.003 EF3T1 3/30/2005 5250 302 est 238 130 est 148 1.01 0.73 <0.003 EF1T2 3/30/2005 5540 279 est 357 138 est 136 1.83 1.34 <0.003 EF1T2 3/30/2005 5280 289 est 378 134 est 144 1.87 5 0.141 EF3T2 3/30/2005 5220 301 est 272 129 est 149 1.1 1.26 <0.003
Site ID Date OPO4P
mg/L NO23N mg/L TP mg/L TKN mg/L TSS mg/L
Total Solids mg/L
Total Vol. Solids mg/L
mg/L Fixed Solids TDS mg/L pH
EF1T1 3/30/2005 2.33 0.05 8.46 306 450 3420 700 2720 2970 7.2 EF2T1 3/30/2005 4.46 <0.04 6.67 304 80 3270 531 2740 3190 7.18 EF3T1 3/30/2005 4.6 0.055 9.24 315 208 3130 718 2410 2920 7.16 EF1T2 3/30/2005 1.84 <0.04 4.62 281 184 3740 618 3120 3560 6.87 EF1T2 3/30/2005 5.71 0.084 17.5 329 1520 4490 1340 3150 2960 7.27 EF3T2 3/30/2005 7.31 0.081 13.5 310 427 3310 783 2530 2880 7.42
21
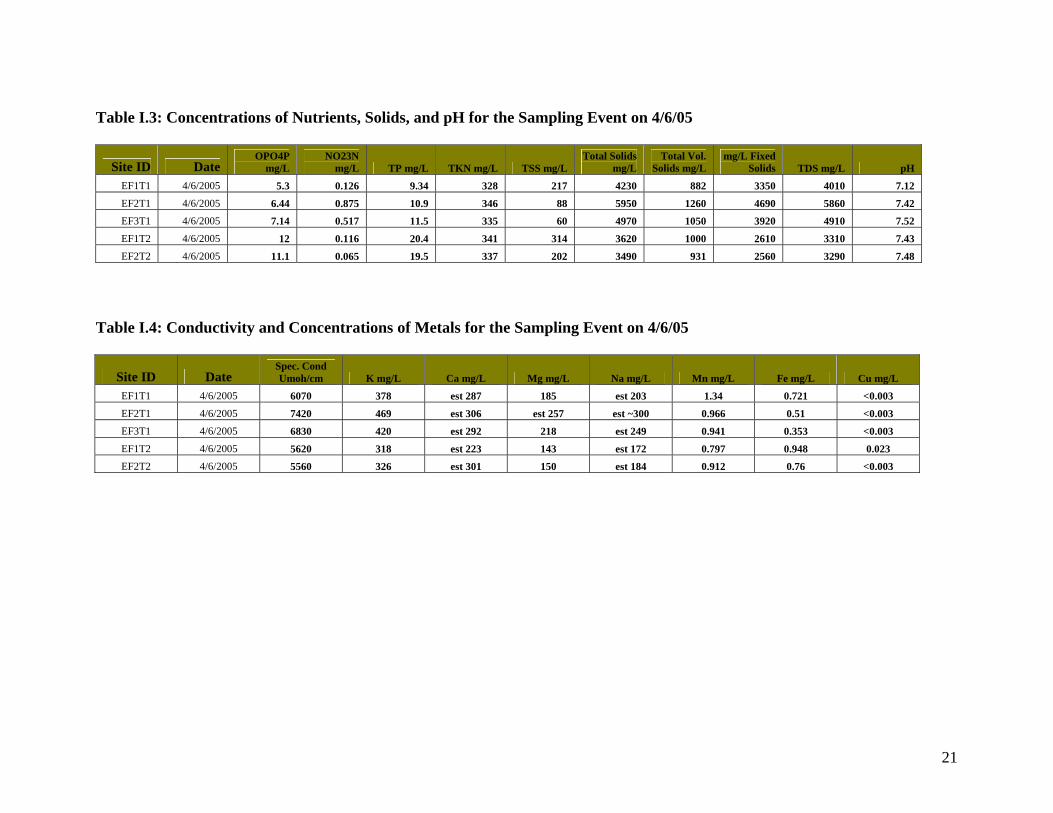
Table I.3: Concentrations of Nutrients, Solids, and pH for the Sampling Event on 4/6/05
Site ID Date OPO4P
mg/L NO23N
mg/L TP mg/L TKN mg/L TSS mg/L Total Solids
mg/L Total Vol.
Solids mg/L mg/L Fixed
Solids TDS mg/L pH EF1T1 4/6/2005 5.3 0.126 9.34 328 217 4230 882 3350 4010 7.12 EF2T1 4/6/2005 6.44 0.875 10.9 346 88 5950 1260 4690 5860 7.42 EF3T1 4/6/2005 7.14 0.517 11.5 335 60 4970 1050 3920 4910 7.52 EF1T2 4/6/2005 12 0.116 20.4 341 314 3620 1000 2610 3310 7.43 EF2T2 4/6/2005 11.1 0.065 19.5 337 202 3490 931 2560 3290 7.48
Table I.4: Conductivity and Concentrations of Metals for the Sampling Event on 4/6/05
Site ID Date Spec. Cond Umoh/cm K mg/L Ca mg/L Mg mg/L Na mg/L Mn mg/L Fe mg/L Cu mg/L
EF1T1 4/6/2005 6070 378 est 287 185 est 203 1.34 0.721 <0.003 EF2T1 4/6/2005 7420 469 est 306 est 257 est ~300 0.966 0.51 <0.003 EF3T1 4/6/2005 6830 420 est 292 218 est 249 0.941 0.353 <0.003 EF1T2 4/6/2005 5620 318 est 223 143 est 172 0.797 0.948 0.023 EF2T2 4/6/2005 5560 326 est 301 150 est 184 0.912 0.76 <0.003

22
Appendix II Raw Data: Residual solids
Table II.1: Concentrations of Nutrients, Solids, and pH for the Sampling Event on 10/3/05
Sample ID Site
Extractable NO2+3N SSSA 38-1148 mg/L
Soluble Phosphorus SSSA 32-891
mg/L
Total Phosphorus
EPA 365.4 mod
mg/L
Total Kjeldahl Nitrogen
EPA 351.2 mod mg/L
Total Volatile Solids (%) SM2540E
mg/L
Total Fixed Solids (%) SM2540E
mg/L
Percent Solids
SM2540B mg/L
pH EPA 9045C
mg/L RS1T1 10/3/2005 729 18.0 4660 18900 11.6 14.0 25.6 7.12
RS2T1 10/3/2005 426 17.1 4520 20200 11.3 13.7 25.0 7.91
RS3T1 10/3/2005 717 10.6 4750 19300 11.4 14.6 26.0 7.24
RS4T1 10/3/2005 1620 14.7 5000 18800 11.1 14.7 25.8 7.13
RS1T2 10/3/2005 716 15.5 5190 20000 12.9 15.9 28.8 7.01
RS2T2 10/3/2005 977 8.64 4830 20300 11.6 14.9 26.5 7.12
RS3T2 10/3/2005 679 19.4 4720 19900 12.4 16.2 28.6 7.13
RS4T2 10/3/2005 537 19.2 4650 19400 12.0 15.2 27.2 7.63
Table II.2: Concentrations of Metals for the Sampling Event on 10/3/05
Sample ID Site
Potassium EPA200.7
6010B mg/L
Calcium EPA200.7
6010B mg/L
Magnesium EPA200.7
6010B mg/L
Sodium EPA200.7
6010B mg/L
Manganese EPA200.7
6010B mg/L
Iron EPA200.7
6010B mg/L
Copper EPA200.7
6010B mg/L
Aluminum EPA200.7
6010B mg/L RS1T1 10/3/2005 4390 56500 4720 1040 317 4260 126 6500
RS2T1 10/3/2005 4620 54700 4840 1190 291 3940 117 5870
RS3T1 10/3/2005 4300 59400 4640 1030 309 4100 126 6470
RS4T1 10/3/2005 3970 76900 5490 977 249 3650 109 5810
RS1T2 10/3/2005 4880 59700 5110 1130 320 4520 125 7860
RS2T2 10/3/2005 4960 61900 5130 1220 302 4490 132 8330
RS3T2 10/3/2005 4780 62800 5290 1150 298 4320 127 6720
RS4T2 10/3/2005 4580 63600 5090 1180 328 4170 131 5590

23