Embed Size (px)
Citation preview

VOL. 8, NO. 5 WATER RESOURCES RESEARCH OCTOBER 1972
Field Determination of the Hydraulic Properties of Leaky Multiple Aquifer Systems
SHLOMO P . NEUMAN
Agrict~ltural Research Organisation, P. 0. Box G Bet Dagan, Israel
PAUL A. WITHERSPOON
Department of Civil Engineering, University of California Berkeley, California 94720
Abstract. A new field method is proposed for determining the hydraulic properties of aquifers and aquitards in leaky systems. Conventional methods of analyzing leaky aquifers usually rely on drawdown data from the pumped aquifer alone. Such an approach is not sufficient to characterize a leaky system; our new method requires observation wells to be placed not only in the aquifer being pumped but also in the confining layers (aquitards) above and/or below. The ratio of the drawdown in the aquitard to that measured in the aquifer a t the same time and the same radial distance from the pumping well can be used to evaluate the hydraulic properties of the aquitard. The new method is supported by theory and has been applied to the coastal groundwater basin of Oxnard, California. The field results are in good agreement with laboratory measurements.
Traditionally, groundwater hydrologists have tended to focus their attention on the more permeable aquifer layers of a groundwater basin in developing water supplies. However, sedi- mentary groundwater basins usually consist of a series of aquifers separated by confining lay- ers of relatively low permeability, which may act as conduits for the vertical migration of water from one aquifer to another. Since fine- grained sediments often tend to be much more compressible than associated coarse-grained aquifer materials, they also can release large quantities of water from storage and thereby increase t,he supply. available t o the aquifer. The combined effects of these phenomena are known as leakage.
Usually, when the effects of leakage can be detected by observing drawdown in the aquifer being pumped, the confining beds are called 'aquitards,' and the aquifer is referred t o as being 'leaky.' When such effects cannot be easily detected in the aquifer, the confining beds are called 'aquicludes,' and the aquifer is termed 'slightly leaky' [Neuman and Witherspoon, 19681.
Aquitards play an important role in the
hydrology of multiple aquifer systems, and we shall mention here only a few examples. Al- though groundwater recharge is often believed to occur in areas of aquifer outcrops, Gill [I9691 has recently reported that substantial amounts of water produced from the Potomac-Raritan- Magothy aquifer system are coming through the aquitards. Earlier, Wdton [I9651 had shown how the Maquoketa formation in Illinois, which is essentially a shale bed, serves as an effective transmitter of water between aquifers. Land subsidence in the San Joaquin Valley and other areas in California has been shown to be asso- ciated with water withdrawal from multiple aquifer systems and is generally attributed to the resulting compaction of fine-grained aqui- tard sediments [Poland and Davis, 19691. Sim- ilar situations exist in Venice, Japan, and other parts of the world.
For the past 20 years, aquifers at depths below 500 feet have been used for storing nat- ural gas in the United States and Europe. Where the properties of the aquitards were not prop- erly investigated, the gas industry has on oc- casion witnessed the spectacular and dangerous effects of gas leakage. The storage of other fluids.

Groundwatei r Modeling 1285
as well as the disposal of waste products under- ground, requires the role of aquitards t o be thoroughly understood if the degradation of groundwater supplies and the pollution of the surface environment are t o be avoided. The role of aquitards may also be important in de- termining the rate a t which the seawater from a degraded aquifer may migrate vertically t o a n uninvaded zone. An interesting situation in which the effectiveness of aquitards in prevent- ing seawater intrusion is largely unknown occurs where the construction of shallow harbors and marinas requires the removal of a part of the ~quitard that normally provides a natural bar- r~er between the ocean and the freshwater aqui- fer beneath [California Depmtment of Water Resources, 1971, p. 101.
Although the importance of aquitards is be- ing recognized more and more, there is no re- liable method for their investigation, aild very little is known about their hydraulic properties. This report describes a n improved field method for evaluating the hydraulic properties of aqui- fers and aquitards in leaky multiple aquifer sys- tems. The new approach is simple to use and applicable t o a wide range of hydrogeological situations. We shall describe in detail one par- ticular investigation performed in the coastal groundwater basin of Oxnard, California.
PROBLEMS I N ANALYZING PUMPING TESTS
WITH CURRENT METHODS
In analyzing results of water pumping trests the well-known Tha's [I9351 solution is often used to determine the permeabi1it)y and the spe- cific storage of the aquifer under investigation. As long as the aquitards do not leak significant amounts of water into the aquifer, this method of analysis produces reliable results.
However, groundwater hydrologists noted many years ago that deviations from the aquifer behavior, as predict,ed by the Theis solution, are not uncommon. These deviations are often caused by water leaking out of the confining beds, and this led to the 'leaky aquifer' theory of Hantush and Jacob [1955]. This theory and its later modifications [Hantush, 19601 relied only on an examination of aquifer behavior and attempted to relate such behavior to the proper- ties of the adjacent aquitards.
Unfortunately, this approach has not been entirely satisfactory. As has recently been
pointed out by Nez~man and Witherspoon [1969b], field methods based on the leaky aquifer theory of Hantush and Jacob [I9551 may often lead to significant errors. These errors are such that one tends to overestimate the permeability of the aquifer and underestimate the permeabil- i ty of the confining beds. Under some circum- stances, one may also get the false impression that the aquifer is inhomogeneous. Further- more, the method does not provide a means of distinguishing whether the leaking beds lie above or below the aquifer being pumped.
A new theory of flow in multiple aquifer sys- tems has recently been developed by Neuman and Witherspoon [1969a; California Depart- ment of Water Resources, 1971, pp. 24-38]. This theory shows that the behavior of draw- down in each layer is a function of several dimensionless parameters Pi , and r/B,,, which depend on t,he hydraulic characteristics of the aquitards as well as t,hose of the aquifers. The new theory clearly indicates that t,he observa- tion of drawdown in the pumped aquifer alone is not always sufficient t o determine uniquely the values of ,f3 and r /B . For example, Han- tush's [I9601 modified theory of leaky aquifers provides a n analytical solution in terms of P that we know is applicable a t silfficiently small values of time. Nevertheless, since this solution relates only to drawdown in the aquifer being pumped, its usefulness in determining uniquely the properties of each aquitard or even in determining a unique value of /3 is very limited [California Department of Water Resources, 1971, p. 327; Riley and McClelland, 19701. Our theory indicates that one should be able t o de- velop improved methods of analysis by installing observation wells not only in the aquifer being pumped but also in the confining layers enclos- ing it. Indeed, as will be shown later, a series of observation wells in more than one layer is a prerequisite for any reliable evaluation of aqui- tard characteristics.
The idea of placing observation wells in a low permeability layer (aquiclude) overlying a slightly leaky aquifer was originally proposed by Witherspoon et al. [I9621 in connection with the underground storage of natural gas in aqui- fers. Their purpose was to det,ermine how effec- tive a given aquiclude would be in preventing gas leakage from the intended underground storage reservoir. Using results obtained from a

1286 NEUMAN AND WITHERSPOON
finite difference simulation model, Witherspoon et a1. were able to suggest a method for evalnat- ing the hydraulic diffusivity of an aquiclude by means of a pumping test.
Later, a theoretical analysis of flow in aqui- clutles adjacent to slightly leaky aquifers was developed by Neuman and TVitherspoon [1068]. This theory led to an improved method for determining the hydraulic diff~~sivity of aqui- cll~des under slightly leaky conditions [Wither- spoon and Neuman, 1967; Witherspoon et al., 1967, pp. 72-92]. Since the method relies on the ratio between dralvdown in the aquiclude and drawdomn 111 the pumped aqulfer, ~t will hence- forth be refrrred to as the 'ratlo method.'
A metliod for evaluating the hydraulic diffn- sivity of an aquitard under arbitrary conditions of leakage, which also uses observation wells completed in the confining layer itself, was rec~nt ly described by Tf701ff [1970]. In his analysis Wolff assumed that, a t any given radial distance from the pumping well and at a suffi- ciently large value of time, one can represent dra~vdown in the pumped aquifer by a step function. Assuming also that drawdown in the unpnmped aquifer remains 0, Wolff arrived at a set of type cnrves that he recommended for aquitard evaluation.
Althot~gh this method gave satisfactory re- sults for the par t i c~~la r site investigated by Wolff, we thinlc that the step function approach may lead to difficulties when it is applied to arbitrary multiple aquifer systems. Fundamen- tally, drawdown in the pumped aquifer cannot be reliably represented by a single step function unless a quasi-steady state is reached within a snfficiently short period of time. The quasi- steady state will be reached onl!, if tlie trans- missibility of the aquifer is large and if the observation wells are situated at relatively small radial distances from the pumping well. T o minimize the effect of early drawdowns, Wolff's method further requires that the dura- tion of the pumping test be sufficiently long and that the vertical distance between the pumped aquifer and tlie aquitard observation wells not be too small.
From our new theory of flow in multiple aqui- fer systems, we now Itnow that a t large values of time the results in the aquitard may be affected significantly by the influence of an adjacent unpumped aquifer, especially where t,he aquitard
observation well has been perforated close to such an aquifer. T l n ~ s , although the single step function approach renders the method inappli- cable a t small values of time, the assumption of zero drawdown in the unpumped aqnifer introduces a n additional restriction a t large values of time.
I n tlie special case where the thickness of the aquitnrd is known, one can determine its diffu- sivity directly from the step function type curves without t,he need for graphical curve matching. Quite often, however, the effective thickness of the aquitard is unknown. For es- ample, the aquitard may contain unidentified or poorly defined layers of highly permeable material tha t act as a buffer to the nressnre transient and also as a source of leakage. Another possibility is that the aquitard is situated belo~v the pumped aquifer and that its lower limit has never been adequately defined. Then the step function approach requires tlie graphical match- ing of aquitard dramdown data with Wol fs [I9701 type curves.
However, the intermediate parts of these type curves are essentially parallel, and therefore they cannot be matched uniquely with firld results. On the other hand, neither the early nor the late parts of the type curves can he used with confidence. Thus tliere may be a significant element of uncertainty when Wolf's [I9701 mcthod is applied to real field situations.
Since the currently available direct field methods appear to be limited in their applica- tion, there is an obvious need for a new approach that would enable one to determine the characteristics of mnltiple aquifer systems under a wide variety of field conditions. Wc shall attempt to demonstrate that a rational basis for such an approach is provided by our
's enis new theory of flow in multiple aquifer s1.t [Neuman and TVitherspoon, 1969aI. We ~ v l l l
s tart by showing that the ratio method, \vhicli we originally thought was limited in apl~lication only to aquicludes under slightly leaky contll- tions, can in fact also he used to evall~atc t h ~ properties of aquitards under very leaky condi- tions.
APPLICABILITY O F THE RATIO METHOD
TO LEAKY CONDITIONS
T o develop a method for determining the hydraulic properties of aquitards, we shall first,

Modeling 128
consider a two-aquifer system (Figure I). A complete solution for the distribution of draw- down in such a system has been developed by .Yeurnan and Witherspoon [1969a]. I n each aquifer the solutions depend on five dimensionless parameters Pll, r/Bll, 821, r/BZ1, and t ~ , . I n the aquitard the solution involves one additional parameter z/blf. This large number of dimension-
I less parameters makes i t practically impossible 1 to construct a sufficient number of type curves to
cover the entire range of values necessary for field application. For a set of type curves to be useful, they are normally expressed in terms of not more than two independent dimensionless parameters.
One way to significantly reduce the number of , parameters is to restrict the analysis of field
data to small values of time. I n particular, we 1 rant to focus our attention on those early effects that occur prior to the time 'when a discernible pressure transient reaches the un- pumped aquifer. A t such early times the un- pumped aquifer does not exert any influence on the rest of the system, and therefore drawdowns are independent of the parameters Pzl and r/Bzl. Furthermore, the aquitard behaves as if its thickness were infinite, which simply means tha t the parameters r/Bll and z/blf also have no influence on the drawdown. Thus the resulting equation will depend only on PI1, tD,, and a n additional parameter tD, '.
In the pumped aquifer, drawdown is then given by Hantush's [I9601 asymptotic equation [Areurnan and Witherspoon, 1969~1.
erf c ([v(4tDZ:" I)]
In the aquitard the solution is
. erf c 811 + Y ( ~ D , / ~ D , ' ) " ~ [ Y ( ~ ~ D X Y - 1)11/2
Theoret,ically, (1) and (2) are limited t o those small values of time that satisfy the criterion
In terms of real time this criterion may also be
AOUITARD I
, L r
I I I I AQUIFER I I I
Fig. 1 . A schematic diagram of a two-aquifer system.
expressed by
t 5 ~ . l s , , ~ b , ~ " / ~ l (4)
indicating that the limiting value of time is independent of the radial distance from the pumping well.
From a practical standpoint the criterion given by (3) or (4) is overly conservative. For example, Figures 2-8 in Neuman and Wither- spoon [1969a] reveal that the effect of the unpumped aquifer is felt in the rest of the sys- tem a t times that are always greater than those predicted by (3). Note further that in these figures the effects of /3, and rJB, are negligible as long as the log-log curve of drawdown versus time for the unpumped aquifer does not depart from its initial steep slope.
This effect of the unpumped aquifer provides a useful criterion for determining the time limit beyond which the asymptotic solutions may no longer be applicable. If an observation well can be provided in the unpumped aquifer, a log-log plot of drawdown versus time should enable the hydrologist to identify this time limit.
Note that there may be field situations in which the procedure above is not applicable. For example, when the transmissibility of the unpumped aquifer is large in comparison t o that of the aquifer being pumped, drawdowns in the unpumped aquifer will be too small to measure, and one would not be able to determine the time limit as outlined above. This procedure may also fail when the water levels in the unpumped aquifer are fluctuating during the pumping test owing to some uncontrolled local or regional effect. Then a more conservative estimate of the time limit can be established from drawdown data observed in one of the

1288 NEUMAN AND WITHERSPOON
iquitard wells. I n general, the smaller the verti- cal distance between the perforated interval in the aquitard well and the boundary of the pumped aquifer is, the more conservative the time indicated by the procedure above is.
Having established a practical method for estimating the time within which (1) and (2) are valid, we can now proceed to show how these equations lead to the ratio method for evaluating aquitards. Remember tha t Hantush's equation does not by itself lead to a reliable nethod for determining a unique value of PI, rom field results. The same can be said of (2), )ecause i t involves three independent parameters Ill, t ~ , , and tD,'. However, the usefulness of
these two equations becomes immediately evi- dent when one considers slr/sl, i.e., the ratio of drawdown in the aquitard to tha t in the pumped aquifer a t the same elapsed time and the same radial distance from the pumping well.
I n the discussion that follows we shall be dealing with only one aquifer and one aquitard,
d for the sake of simplicity we shall omit all xcripts. Figire 2 shows the variation of s'/s rsus tDJ for a practical range of tD and /3 lues. Note that a t tD = 0.2 changing the
?ig. 2. The variation of s'/s with to' for p 0.0 (solid lines), j3 = 0.01 (squares), and
= 1.0 (circles).
value of ,8 from 0.01 to 1.0 has practically no effect on the ratio sf/s. The same is true as t, increases, and this relationship is shown by the additional results for tD = lo4.
If we now use our theory for slightly leaky situations [Neuman and Witherspoon, 19681 where s' is given by
(5) and s is obtained from the Theis solution, we have in effect the special case where /3 = 0. This is represented by the two solid lines in Figure 2.
We also examined the case where /3 = 10.0 and found that t,he values of sf/s deviate signifi- cantly from those shown in Figure 2. Thus onr may conclude that for all practical values of t, the ratio s'/s is independent of ,8 as long as ,O is of order 1.0 or less. Since ,8 is directly proportional to the radial distance from tlie pumping well, its magnitude can be kept within any prescribed bounds simply by placing the observation wells close enough to the pumping well. A quick calculation will show that distances of the order of a few hundred feet will be satisfactory for most field situations.
Thus we arrive a t the very important con- clusion that the ratio method, which we origi- nally thought was restricted t o only slightly leaky situations, can in effect be used to deter- mine the hydraulic diffusivities of aquitards under arbitrary leaky conditions. We therefore decided t o adopt the ratio method as a standard tool for evaluating the properties of aquitards.
USE O F THE RATIO METHOD IN
AQUITARD EVALUATION
The ratio method can be applied to an!. aquifer and its adjacent aquitards, above ant1 below, in a multiple aquifer system (see sketch in Figure 3). The method relies on a family of curves of s'/s versus tDJ, each curve correspond- ing to a different value of tD as obtained from (5) and the Theis equation. The curves in Figure 3 have been prepared from tables oi values published previously by Witherspoon d al. [1967, Appendix GI.

Modeling 1289
In tlie rat,io method, one first calculates the \aloe of s'/s at a, given radial distance from the pumping well r and a t a given instant of ti~nc t. The next step is to determine the mn,nnitudc of t D for the particular values of r :rnd t at which s'/s has been measured. When tn < 100, the curves in Figure 3 are sensitive to minor changes in the magnitude of this param- rtrr, and therefore a good estimate of t D is tlrsirable. When t D > 100, these curves are so close to each other that they can be assumed to hc practically independent of t D . Then even n cn~cle estimate of t , will be s~~fficient for the ratio method t o yield satisfactory results. A procedure for determining the value of t D from drawdown dat,a in the aquifer will be discussed Inter in connection with methods dealing with aquifer characteristics.
Having determined which one of the curves in Figure 3 should be used in a given cafc'ulation, one can now read off a value of tD' corre- sponding to the computed ratio of s'/s. Finally, the diffusivity of the aquitard is determined from the simple formula
a' = (z2/ t ) tn ' (6)
Note in Figure 3 that, when s'/s < 0.1, the value of tD' obtained by the ratio method is not very sensitive to the magnitude of s'/s. As a result the value of d calculated from (6) depends very little on the actual magnitude of tlie drawdown in the aquitard. Instead, the critical quantity determining the value of d a t a given elevation z is the time lag t between the start of the test and the time when the aquitard observation well begins t o respond. The time Ing is very important because in using the ratio method one need not worry about having ex- tremely sensitive measurements of drawdown in the aquitard observation wells. A conventional p~ezometer with a standing water column will r~sually give sufficiently accurate information for most field situations. The time lag between a change in pressure and the corresponding change in water level in the column is usually so small in comparison t o the time lag between the start of the test and this change in pressure that its influence can be safely ignored.
To evaluate the permeability and specific storage of an aquitard from its hydraulic diffu- sivity, one of these quantities must first be determined by means other than the ratio
0- I@ ICt "0. s;;l
Fig. 3. The variation of s'js with t ~ ' for a semi- infinite aquitard.
method. Experience indicates that permeability may vary by several orders of magnitude from one aquitard to another and even from one elevation to another in tlie same aquitard. A much more stable range of values is usually encountered when one is dealing with specific storage.
Recent field measurements in areas of land subsidence (F. S. Riley, personal communication, 1971) have shown that the specific storage of fine-grained sediments depends on the relation- ship between the load generated by pumping and the past history of loading. When this rela- tionship is such that the sediments react elasti- cally, the value of S,' is relatively small. When the sediments are undergoing irreversible con- solidation, the value of S,' may be larger by 1 or 2 orders of magnitude. Presently, the most reliable measurements of S,' are performed in the field by using borehole extensometers. Another way to determine approximate values of S,' is to perform standard consolidation tests on core samples in the laboratory. I n the total absence of field and laboratory measurements, S,' can be estimated by correlating published results on similar sediments. Once the value of

1290 NEUMAN AND WITHERSPOON
S,' has been determined, K' is easily calculated from K' = dS.'.
We also studied the effects of aquitard hetero- geneity and anisotropy on the value of K' ob- tained by the ratio method a t a given elevation a. I n our investigation me used the finite element method to examine the behavior of a two-aquifer system when: (1 ) the aquitard was a homogene- ous anisotropic layer with a horizontal permea- bility as much as 250 times greater t,han the vertical and (2) the aquitard consisted of three different layers, each of which was homogeneous and anisotropic. The results of this study indi- cated that for homogeneous anisotropic aqui- tards tlle ratio method will always give a value of K' that. corresponds to the vertical permeabil- ity of the aquitard. For a lleterogeneous aqui- tard, K' is simply the weighted average vertical permeability over tlie thickness 2. If there are N layers of thickness bn and vertical permeability Ii," inside this interval, K' represents the aver- age value
Bodton [I9631 and Neuman [I9721 have shown that, a t early values of time, drawdown in an unconfined aquifer can safely be approxi- mated by the Theis solution. At later values of time, drawdown is affected by the delayed re- sponse of the water table, and tlie effect is similar t o that of leakage in a confined aquifer. Thus, if the ratio method is applicable to aqui- tards adjacent to confined leaky aquifers, i t should also be applicable to situations in which tlie pumped aquifer is unconfined. This conclu- sion is further supported by the fact that the ratio method depends less on the actual values of drawdown in the aquifer than on the time lag observed in the aquitard. To test this applicability of the ratio method to an uncon- fined aquifer, we took data from Wolf7 [I9701 for a pumping test in which observation wells were placed in a confining layer underneath a water table aquifer. We analyzed these data by using the ratio method, and the results are in excellent agreement ~iritll those obtained by Wolff.
When we showed that our slightly leaky theory was applicable t o the so-called leaky aquifer, our previous discussion was restricted to a two-aquifer system. B y now, however, the
reader will recognize that such a restriction is not necessary and that the ratio method is actually applicable t o arbitrary multiple aquifer systems. The only requirement is that the sum of tlie p,, values with respect to the overly~ng and underlying aquitards be of order 1 or less.
I n summary, note once again the following features of the ratio method.
1. The method applies to arbitrary, leaky multiple aquifer situations.
2. The pumped aquifer can be either con- fined or unconfined.
3. The confining layers can be heterogeneous and anisotropic. Then the ratio method gives t,he average vertical permeability over the thick- ness z of the aquitard being tested.
4. The method relies only on early drawdown data, and therefore the pumping test can be of relatively short duration.
5. The drawdown data in the unpumped aquifer or in the aquitard provide an in situ indication of the time limit a t which the ratio method ceases to give reliable results.
6. Since the method is more sensitive to time lag than to the actual magnitude of us, the accuracy with which drawdowns are measured in the aquitard is not overly critical.
7. The method does not require prior Itno\vl- edge of the aquitard thickness.
8. The ratio method is simple to use and does not involve any graphical curve-matching pro- cedures. This lack of curve-matching procedur~z is a n advantage because curve matching is often prone to errors due to individual judgment and because a more reliable result can be obtained by taking the arithmetic average of results from several values of the ratio s'/s.
METHOD FOR EVALUATING AQUIFERS I When the pumped aquifer is slightly leaky, I
one can evaluate its transmissibility and storag coefficient by the usual procedures based on t h p
Theis equation. When leakage is appreeiahl~, I
these procedures will not always yield satisfnr- tory result,^. Alternative methods for analyzinr I
the results of pumping tests in leaky aq~~ifcr; I
were proposed by Jacob [I9461 and Hantmh I
[1956, 19601. Still another method based on thc r/B solution has recently been proposed hy ' Narasimhan [1968]. All these methods rely on '.
drawdoan data from the pumped aquifer a l o n ~ I

Modeling 1201
Thcir purpose is to determine not only the :~rnltcrties of the aquifer but also the so-called .!~aknge factors' r/B and ,8 that depend on the ~l~;~riicteristics of the confining layers as well as on those of the aquifer. We have shown earlier .Int tllesc methods have a limited application .'nil rl lnt they can often lead to erroneous results.
Since me l i ~ v e introduced the ratio method .I. 3 means for evaluating aquitards, the only rr~nnining unkno\vns to be determined are the aquifer transmissibility T and the storage coeffi- rient S. When the aquifer is leaky, the use of nletliods based on the Theis solution will lead t o rrrors whose magnitudes are a function of ,8 and 1,'B. A look a t Neuman and Witherspoon [196!k1] mill reveal that the smaller the values
I, nip and r/B are, the less the drawdowns in the ~)r~tnl,ed aquifer deviate from the Theis solution, anil therefore the smaller the errors introduced by such methods are. At this point .we must rceognize that ,8 and r / B do not necessarily reflect the amount of water that leaks into the :~qoifer. In fact, both these parameters are tlirectly proportional to r, which simply means i l l n t their magnitude in a g i v e aquifer varies from nearly 0 a t the pumping ~vell to relatively lnrge values further away from this mell. Thus tllc estent to ~vhich leakage can affect the be- havior of the dra~vclo\vn in any given aquifer i: a function of the radial distance from the pumping well. Thus the closer one is to this well, the smaller the deviations of drawdown from tile Theis curve are. On the other hand, the rate of leakage is obviously greatest near the pump- ing well where the vertical gradients in the aquitard are largest and diminishes as the radial distance from this well increases. Therefore, in a given system, ,8 and r/B increase with radial distance, whereas the actual rate of leakage decreases.
At first glance, we seem to be faced with a paradox: The greater the leakage is, the less the deviations from the nonleaky Theis solution are. However, a closer examination of the flow syPtem mill show that there is a simple physical esplanation for this phenomenon. The reader will recognize that, although vertical gradients in the aquitard do not vary appreciably with radial distance from the pumping mell, the same cannot be said about drawclo~vn in a pumped aquifer. As a result the rate of leakage per unit area relative to this drawdown is negligibly
small in the immediate vicinity of the pumping n,ell but becomes increasingly important a t larger values of 1.. I n addition, the water that leaks into the aquifer a t smaller values of r tends to act as a buffer to the pressure transient. This transient cannot propagate as f a ~ t as it other- wise might. have had there been no increase in aquifer storage. The effect. is to reduce further the clra\vdown at points farther away from the pumping well. The net result is a situation in which larger values of 1% are associated with less leakage but also with greater deviations from the Theis curve.
Thus we arrive at the important conclusion that one can evaluate the transmissibility and storage coefficient of a leaky aquifer by using conventional methods of analysis based on the Theis solution. The errors introduced by these methods mill be small i f the data are collected close to the pumping well, but they may become significant when the observation n-ell is placed too far anray. Therefore a distance drawclown analysis based on the Theis curve is not gen- erally applicable to leaky aquifers and should be avoided whenever possible.
Ideally, the d u e s of T and S should be evaluated by using dramdown or buildup data from the pumping mell itself because here the effect of leakage is always the smallest. We recommend this approach whenever the effective radius of the pumping ~vell is known (e.g., wells in hard rock formations). However, when a well derivcs its water from unconsolidated materials, its effective radius usually remains unltnown owing to the presence of a gravel pack. I n these situations the approach above can still be used to evaluate T but cannot be used to determine S.
As a. general rule, early dramdo~vn data are affected by leakage to a lesser degree than data talten a t a later time are. Therefore we feel that, in performing the analysis most of the weight, shoulcl be given to the earliest data available, if, of course, there is confidence in their reliability.
Once S and T have been determined, one can calcul;ltc the dilnensionless time a t any given radial distance from the pumping well by
Equation 8 can then be used with the ratio method as we cliscusscd earlier.

1292 NEUMAN AND WITHERSPOON
123E21
( 2 2 H S I
PIEZOMETER
PIEZOMETER I.~A*~$/
Fig. 4. The locations of the piezometers used in field pumping tests.
FIELD PUMPING TESTS IN THE OXNARD, CALIFORNIA, BASIN
The California Department of Water Re- sources had previously investigated the Oxnard basin in connection with seawater intrusion problems and constructed several wells a t various locations in the basin. For our field studies we selected a particular location in the city of Oxnard where a large capacity pumping well (Figure 4, 2255) was available to produce water from the Oxnard aquifer. Four additional pie- zometers (22H2, 22H5, 22K2, and 2332) were available to monitor water levels in the Oxnard aquifer a t radial distances of 502-1060 feet.
I n addition, seven new piezometers were installed a t various elevations relative to that of the Osnard aquifer. Table 1 summarizes the vertical distances above or below the Oxnard for each piezometer and also gives the radial dis- tances from pumping well 2255. Ideally, the
seven piezometers should have been arranged along a circular arc with its center a t the pumping well so that responses would be given a t various elevat,ions but a t only one unique value of r. However, this arrangement was not, possible under the local conditions, and me therefore had to design the well field according to the scheme shown in Figure 4. For details of the construction, the completion, and t,lie development methods, the reader is referred to California Department of Water Resources [1971, pp. 63-68].
The following is a brief description of t,he lithology in t>he vicinity of the test area. The semiperched zone is composed of fine- to me- dium-grained sand with interbedded silty clay lenses. The upper aquitard is made up of pre- dominantly silty and sandy clays, mainly mont- morillonite. The Oxnard aquifer, which is the most important water producer in the Oxnard basin, is composed of fine- to coarse-grained sand and gravel. Silty clay with some interbedded sandy clay lenses makes u p the lower aquitard. The material that forms the Mugu aquifer is fine- to coarse-grained sand and gravel with some interbedded silty clay. Figure 5 shows an electric log through this series of sediments.
ANALYSIS OF PUMPING TEST RESULTS
Two pumping tests were performed in the field. Their purpose was t o determine t,he hy- draulic characteristics of the Oxnard aquifer ant1 the confining layers above and below it and to confirm our theoret,ical concepts [Neumn and Withempom, 1969al regarding the response of multiple aquifer systems to pumping.
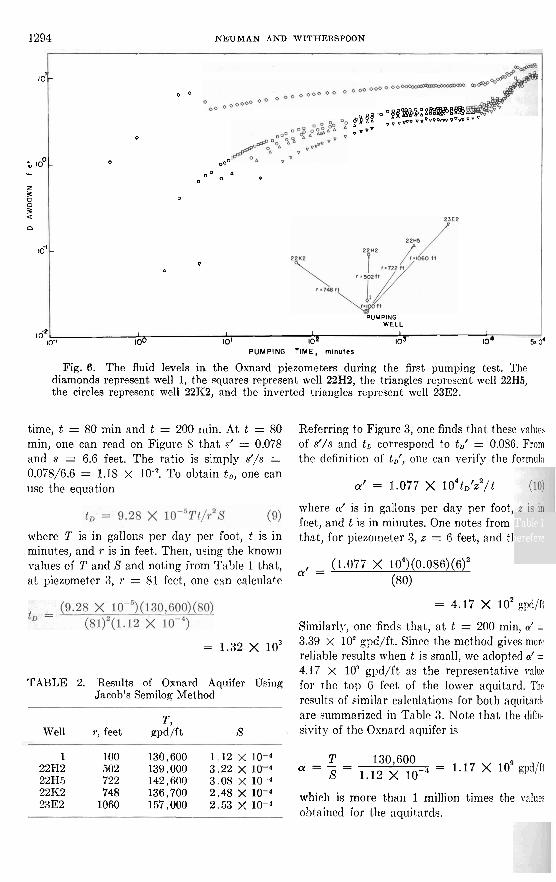
The first pumping test 1ast)ed 31 days. Figurr 6 shows the response in the Oxnard aquifer at
TABLE 1. Location of Piezometers
Distance from Vertical Distance*, Piezometer 2255, feet Depth, feet feet Layer
... Oxnard aquifer . . . Mugu aquifer - 26 lower aquitard -6 lower aquitard
+ll upper aquitard . 5 t-50 semiperched aquifer
+22 upper aquitard
* The vertical distance is the distance above the top of the Oxnard aquifer a t a depth of 105 feet or belox the bottom a t a depth of 198 feet.
t Failed to operate satisfactorily.

Groundtocater Modeling 1293
ous radial distances from the pumping well. ( Piexometer 1, which is nearest to the pumping
yell, demonstrated an anomalous behavior dur- ~ n q the first 6 min of pumping. This was appar- ently due to a surging effect in the pumping well.
W .\t ahout 6000 min the entire basin started c~pcricncing a general drop in water levels probably due to the beginning of intermittent pr~mping for irrigation a t this time of the year. Tnhle 2 gives the values of T and S as calculated from these data by using Jacob's [I9501 semi- logarithmic approach.
Table 2 shows that in general the values of T hecome progressively larger a s r increases. This
the C .' draw
the 'I , 77.
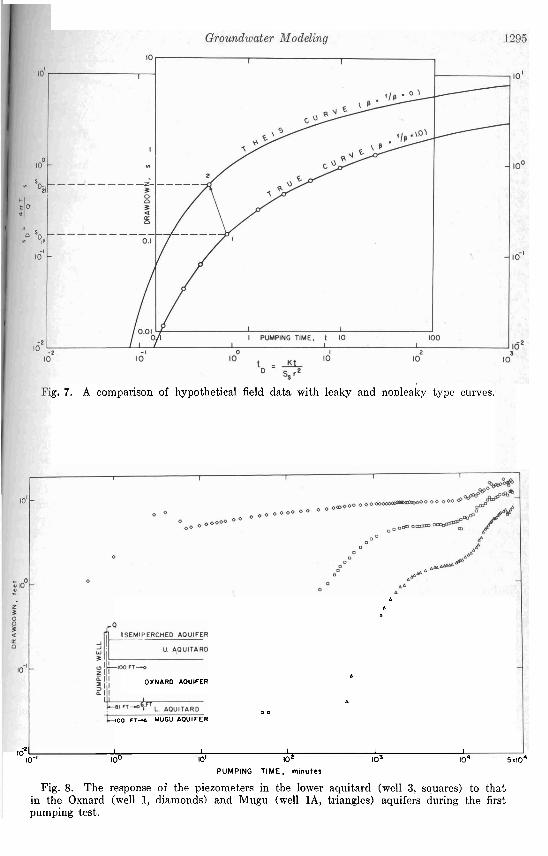
relationship can be explained as follows. Since )xnard aquifer is obviously leaky, the actual down curve a t any given well will lie below 'heis solution, as is shown diagrammatically
in r l
shall that If wl curvc obtai
I-Ic ? ,
gure 7. To demonstrate this positioning, we choose a particular point on the data curve corresponds to some given value of s and t. e could match the data to the true type : where /3 and r /B are not 0, we would n the true value of sDl for the point chosen. Iwever, such type curves were not available
tor r'his investigation, and we used a method "..-,
that is field da data a,] positior an app:
Fron
- essentially equivalent t o matching the
ta to the Theis curve. Therefore the field ,e being shifted upward from their true 1, and our chosen point will now indicate trent value of sD, > sD,. I the definition of s, it is clear that since
s remalns unchanged the value of T is increased. The greater the radial distance r, the larger ,L? and r/B become, and therefore the larger the difference between the true type curve and the Theis curve is. I n other words, as r increases, the magnitude of T should become more and more exaggerated, which is clearly evident in Tahle 2.
With regard to errors in S, the shifting of field data as indicated on Figure 7 may be either to the left or to the right. Thus the effect on the calculated values of S is not predictable (Table 2) . With this unpredictability in mind, me decided to select the results from piezometer 1 of T = 130,600 gpd/ft and S = 1.12 x lo-' as being most representative of the Oxnard aquifer, a t least in the area of the pumping test.
Having estimated tjhe properties of the pumped aquifer, we shall now consider t,he results from other parts of this three-aquifer
SPONTaNEOUS POTENTIAL
4 0 0
Fig. 5. The electric log from the first exploratory hole.
subsystem. Figure 8 shows the response a t one particular point in the lower aquitard (well 3) as well as the responses in the Oxnard above (well 1 ) and the Mugu below (well 1A). Figure 9 shows the response a t two different elevations in the upper nquitard (wells 4 and 5) as well as the response in the overlying semiperched aqui- fer (well 4A). Since piezometer 1 is located farthest from the pumping well, we do not have the response in the pumped aquifer directly below the piezometers where drawdourns in the upper aquitard were measured. However, from distance-drawdown curves in the Oxnard aquifer and from t,he behavior of piezometer 4, we concluded that the aquifer response was approxi- mately as shown by the dashed curve in Figure 9. Remember that the ratio method for evaluat- ing aquitards is more sensitive to the time lag than to the actual magnitude of drawdown in the aquifer. Therefore the dashed curve in Figure 9 can be considered sufficiently accurate for our purposes. Note that the shapes of the curves in Figures 8 and 9 are quite similar t o those of our theoretical curves [Neumaa and Witherspoon, 1969al.
T o evaluate the lower aquitard, we shall determine the ratio s'/s a t two early values of
1294 NEUMAN AND WITHERSPOON
time, t = 80 min and t = 200 min. At t = SO min, one can read on Figure 8 that s' = 0.078 and s = 6.6 feet. The ratio is simply s'/s = 0.078/6.G = 1.18 X lo-'. T o obtain tD j one can use the equat,ion
10'-
t lo0- - z g a
2 a
16'
I 6'
where T is in gallons per day per foot, t is in minutes, and 1. is in feet. Then, using the known values of T and S and noting froin Table 1 that, a t piezometer 3, 1. = 81 feet, one can calculate
0 0
o@B%B:x@@!~ ?15!5! v v .,mr) s v ~ ~ ~ ~ ~ ~ ~ ~ v v
0 v v v v
0 noo
0 I
o n v
0
- P *
PUMPING WELL
I I I I I
10-1 100 to1 102 103 lo4 5110'
Referring to Figure 3, one finds that these \ d u e s of s'/s and to correspond to f,' = 0.086. From the definition of t,', one can verify the formmlla
a' = 1.077 X 10~tD'z~/t
where a' is in gallons per day per foot, feet, and t is in minutes. One notes from that, for piezometer 3, z = G feet, and tl
a' = (1.077 X 10~)(0.086)(6)~ (80)
PUMPING TIME, minutes
Fig. 6. The fluid levels in the Oxnard piezometers during the first pumping test. The diamonds represent well 1, the squares represent well 22H2, the triangles represent well 22H5, the circles represent well 221C2, and the inverted triangles represent well 2332.
Table 1 ierefore
= 4.17 X lo2 gpd/ft
Similarly, one finds t>hat, a t t = 200 mill, d =
= 1.32 X lo3 3.39 x 10' gpd/ft,. Since t,he method gives n~orc reliable results when t is small, we adopted d = 4.17 x 10' gpdJft as t,he representat,ive vslrlr
TABLE 2. Results of Oxllard Aqllifer Using for the top 6 feet of the lower aquitard. Thr Jacob's Semilog Method results of similar calculations for both aquitartl,
T, are summarized in Table 3. Note that the dife- Well T, feet gpd/ft S sivity of the Osnard aquifer is
1 100 130,600 1.12 X T 22H2 502 139,000 3.22 X ff = - = 130'600 1.17 X 10\~d/ft 22H5 722 142,600 3.08 X lo-' 8 1 . 1 2 X 1 0 - ~ = 22K2 2332
748 136t700 2.48 which is more than 1 million times the VRIUF 1060 157,000 2.53 X
obtained for the aquitards.

1294 NEUMAN AND TVITHERSPOON - I I I I I
time, t = 80 min and t = 200 min. At t = SO min, one can read on Figure 8 that sf = 0.078 and s = 6.6 feet. The ratio is simply s'/s = 0.07S/G.G = 1.18 X T o obtain t,, one can use the equation
tD = 9.28 X 10-?t/r2s (9) where T is in gallons per day per foot, t is in minutes, and r is in feet. Then, using the known values of T and S and noting from Table 1 that, a t piezometer 3, r = 51 feet, one can calculate
tD = (9.28 X 10⁻⁵)(130,6~~)(80)
(sI)~(I.I~ x
10'-
; lo0 - z 3 '2 3
n n
1 0 '
1 02
TABLE 2. Result,~ of Oxnard Aquifer Using Jacob's Semilog Met'hod
0 0
OOO OOOoO O O
9, U@%%B",@@~@ o O O m O o . v v ~ - . ~ ~ ~ v v
0
- 0
0 A
n o v
0
-
6
PUMPING WELL
I I I I I
10-1 100 10' 102 lo3 lo4 5x10'
T, Well Y, feet gpd/ft S
PUMPING TIME, rnlnutcs
Fig. 6. The fluid levels in the Oxnard piezometers during the first pumping test. The diamonds represent well 1, the squares represent well 22H2, the triangles represent well 22H5. the circles represent well 22K2, and the inverted triangles represent well 2332.
Referring to Figure 3, one finds that these value, of s'/s and t, correspond to t,' = 0.086. From the definition of tDf, one can verify the forllll~la
where a' is in gallons per day per foot, z is III 8
feet, and t is in minutes. One notes from Table 1 ,
that, for piezometcr 3, z = G feet, and therefore
Similarly, one finds that, a t t = 200 min, d = 3.39 x 10' gpd/ft. Since the method gives nlorc reliable results when t is small, we adopted d = 4.17 x 10' gpd/ft as the representative valr~r for the top 6 feet of the lower aquitard. Tilr results of similar calculations for both aquitartlt . are summarized in Table 3. Note that the d~fin- sivity of thc Oxnard aquifer is
1 100 130,600 1.12 X T 22H2 502 139,000 3.22 X a = - = 130'600 1.17 X lo9 gpd/ft 22H5 722 142,600 3.08 X S 1.12 X lo-" 22K2 2332
748 1361700 2.48 which is more than 1 million times the valucc r 1060 157,000 2.53 X
obtained for the aquitards.
g. 7. A comparison of hypothetical field data with leaky and nonleaky type curves.
A
&
d,
A O X N A R D AOUIFER
A
m m
100 F T - ~ MUGU AOUIFER
ld2 I I I I I 10-1 lo0 o1 lo2 lo3 lo4 5x10'
PUMPING TIME. minutes
Fig. 8. The response of the piezometers in the lower aquitard (well 3, squares) to that in the Oxnard (well 1, diamonds) and ' Mugu (well l A , triangles) aquifers during the first pumping test.

1296 NEUMAN AND WITHERSPOON
SEMIPERCHED AQUIFER 72 F T - 4
w 62 FT-0 U. AQUITARD
3 7 2 R - 0
zI' 72FT-v :;?- 5 1 I OXNARD AQUIFER
a lil
! L. AOUITARD
I MUGU AQUIFER
PUMPING TIME,, minutes
Fig. 9. The response of the pieeometers in the upper aquitard (well 4, circles, and well 5 squares) and the semiperched aquifer (well 4A, triangles) during the first pumping test. Thc broken line indicates the probable response of the Oxnard aquifer a t r = 72 feet.
The results of the second pumping test, were tests performed in the laboratory [Calijoi~~ll essentially the same as those of the first test and Department of W a t e r Resources, 1971, pp. 10'. will therefore not be presented here. 1101 by using the formula
DETERMINATION O F AQUITARD PROPERTIES
USING FIELD AND LABORATORY RESULTS
Having determined the liydraulic diffusivities, we can evaluate the permeability K' of each aquitard if the storage factor is known. The T ' O ~ ~ ~ P S of S8' were calculated from consolidation v ' , L L , b L
TABL ,E 3. IZesults for Hydraulic niffusivit,y of Aquitards from First Pumping Test
Section I<'/Sel, I<'/S8', ayer Test,ed gpd/ft. cm2/sec
,,,,er bottom 1.02 X 10² 1.47 X 10-' aquitard 22 feet
Upper bottom 2.44 X 10² 3.51 X 10-I aqaitard 11 feet
Lower top 4 . 1 7 X 1 0 2 5 . 9 9 X 1 0 - I aquit'ard 6 feet
These values were then used to calculate i(' according to
and the results are summarized in Table 4. Direct measurements performed on untli-
turbed samples in t,he laboratory indicated III?., the aquitard permeabilities vary within a rang
of a t least 3 orders of magnitude. The rt~111~. in Table 4 fall on the high side of this range a!:.! thus are xn indication that t,he average penno. bilit,y in the field cannot always be reliahly e~t~imated from laboratory measurements.
I t is interesting to compare t,he specific sfora~p and permeability of the aquitard mit,l~ tho:r of the Osnard aquifer. Using an aquifer tliicknr ,

Groundwater Modeling 1297
1 TABLE 4. Hydraulic Properties of Aquitard Layers
I Specific Storage S,' Permeability K' 1 Section
Layer Tested cm-I ft-1 cm/sec gpd/ft2
) Upper aquitard bottom 7 . 8 8 X 1 0 - = 2 . 4 X 1 0 - ' 1 . 1 1 X 1 0 - 6 2.45X10⁻²
21 feet , Upper aqaitard bottom 7.88 X 2.4 X lo-* 2.66 X low6 5.85 X 11 feet
! Lower aquitard top 3.28 X 1 . 0 X 1.89 X 1 0 - V . 17 X lo-2 6 feet
1 of 93 feet, one has
and I
Thus the permeability of the aquifer exceeds that of the aquitards by more than 4 orders of magnitude. However, note that the specific stor- age of the aquifer is less than S,' in the aqui- tards above and below by 2 orders of magnitude. In other words, for the same change in head a unit volume of aquitard material can contribute about 100 times more water from storage than a similar volume of the aquifer can. This statistic confirms our belief that storage in the aquitards must be considered when one deals with leaky aquifer systems.
NOTATION
a,, coefficient of compressibility, equal to - Ae/Ap, LT2M-I;
bi, thickness of i th aquifer, L; bi', thickness of jth aquitard, L;
e, void ratio; Ki, permeability of ith aquifer, LT-1;
Kit , permeability of jth aquitard, LT-1; p, pressure, ML- lP2;
Qi, pumping rate from ith aquifer, L3T-1; r, radial distance from pumping well, L;
r/Bii, dimensionless leakage parameter, equal, to r(Ki'/Kibibit)"2;
SD, dimensionless drawdown, equal to 4 ~ T , s / Qi ;
si, drawdown in i th aquifer, L; sit, drawdown in jth aquitard, L; Si, storage coefficient of i th aquifer, equal to
Sa;bi ; S,,, specific storage of i th aquifer, L-1; S,,', specific storage of j th aquitard, L-l;
t, pumping time, T ;
LD,,
t ~ i ' ,
Ti,
2,
ai,
ai',
Bii,
Yt",
dimensionless time for pumped ith aquifer, equal to K,t/S.,r2; dimensionless time for jth aquitard, equal to Kitt/S, !'z2; transmissibility of i th aquifer, equal to ICibi, L2T-'; vertical coordinate, L; hydraulic diffusivity of i th aquifer, equal to Ki/S,,, L2T-l; hydraulic diffusivity of jth aquit,ard, equal to Ki'/Sai', L2T-l; dimensionless leakage parameter, equal to r/4bi (ICi'Ssi'/K,S.i)1/2; specific weight of water, ML-2T-2.
Acknowledgments. The work was supported. in part by Matching Grant research funds provided by the Office of Water Resources Research, U.S. Department of the Interior, under Public Law 88- 379 and by the University of California, Water Resources Center. I t is the Office of Water Re- sources Research project B-123-CAL (Water Re- sources Center Project W279). We would also like to acknowledge research funds provided by the California Department of Water Resources bhat supported field and laboratory investigations that provided data for the present study.
REFERENCES
Boulton, N. S., Analysis of data from nonequilib- rium pumping tests allowing for delayed yield from storage, Proc. Inst. Civil Eng., 26, 429, 1963.
California Department of Water Resources, Sea- water intrusion: Aquitards in the coastal ground- water basin of Oxnard Plain, Ventura County, Calif. Dep. Water Resour. Bull. 63-4, 1971.
Gill, H. E., Hydrologic significance of confining layers in the artesian Potomac-Raritan-Magothy aquifer system in New Jersey (abstract), Geol. Soc. A m r . Annu. Meet., p. 78, 1969.
Hantush, M. S., Analysis of data from pumping tests in leaky aquifers, Eos Tram. AGU, 37(6), 702-714, 1956.
Hantush, M. S., Modification of the theory of leaky aquifers, J. Geophys. Res., 66(11), 3713- 3726, 1960.
Hantush, M. S., and C. E. Jacob, Nonsteady radial

1298 NEUMAN AND
flow in an infinite leaky aquifer, Eos Trans. AGU, 36(1), 95-100, 1955.
Jacob, C. E., Radial flow in a leaky artesian aquifer, Eos Trans. AGU, 27(2), 198-208, 1946.
Jacob, C. E., Flow of groundwater, in Engineer- ing Hydraulics, edited by H . Rouse, p. 346, John Wiley, New York, 1950.
Narasimhan, T. N., Ratio method for determining characteristics of ideal, leaky and bounded aqui- fers, Bull. Int. Ass. Sci. Hydrol., 13(1), 70, 1968.
Neuman, S. P., Theory of flow in unconfined aqui- fers considering delayed response of the water table, T4'aler Resour. Res., 8(4), 1031-1045, 1972.
Neuman, S. P., and P. A. Witherspoon, Theory of flow in aquicludes adjacent to slightly leaky aquifers, Water Resour. Res., 4(1), 103-112, 1968.
Neuman, S. .P., and P. A. Witherspoon, Theory of flow in a confined two-aquifer system, Wakr Resour. Res., 5(4), 803-816, 1969a.
Neuman, S. P., and P. A. Witherspoon, Applica- bility of current theories of flow in leaky aqui- fers, 14"ater Resour. Res., .5(4), 817-829, 1969b.
Poland, J. F., and G. H. Davis, Land subsidence due to withdrawal of fluids, in Reviews in En- gineering Geolo.gy II, edited by David J. Varnes and George Kiersch, p. 187, Geological Society of America, Boulder, Colo., 1969.
Riley, F. S., and E. J. McClelland, Application of the modified theory of leaky aquifers to a
WITHERSPOON
compressible multiple-aquifer system, open file report, 132 pp., U.S. Geol. Surv., 1970.
Theis, C. V., The relation between the lowering of the piezometric surface and the rate and duration of discharge of a well using gro water storage. Eos Trans. AGU, 16, 519 1935.
Walton, W. C., Ground-water recharge and off in Illinois, State Water Surv. Rep. I ~ U C A L 48, 3-6, 1965.
Witherspoon, P. A., and S. P. Neuman, Evaluat- ing a slightly permeable caprock in aquifer gas storage, 1, Caprock of infinite thickness, Trans Amer. Inst. Mining Eng., 240, 949, 1967.
Witherspoon. P. A,, T. D. Mueller, and R. 17' Donovan, Evaluation of underground gas-stor- age conditions in aquifers through investigations of ground water hydrology, Trans. Amer. Insl. / Mining Eng., 225, 555, 1962.
Witherspoon, P. A., I. Javandel, S. P. Neuman, and R. A. Freeze, Interpretation of Aquijer Gas Storage Conditions from Water Pumping Tesb, , American Gas Association, New York, 1967.
Wolff. R. G., Field and laboratory determination 1 of the hydraulic diffusivitjr of a confining bed. Water Resour. Res., 6(1), 194-203, 1970.
und- -524,
b
(Manuscript received April 20, 1972; revised May 5, 1972.)