Embed Size (px)
Citation preview
1
Field Experiments on Voter Mobilization: An Overview of a Burgeoning Literature
Alan S. Gerber Yale University
Donald P. Green
Columbia University
February 12, 2016
In recent years the focus of empirical work in political science has begun to shift from
description to an increasing emphasis on the credible estimation of causal effects. A key feature
of this change has been the increasing prominence of experimental methods, and especially field
experiments.
In this chapter we review the use of field experiments to study political participation.
Although several important experiments address political phenomena other than voter
participation (Bergan 2009; Butler and Broockman 2015; Butler and Nickerson 2011;
Broockman 2013, 2014; Grose 2014), the literature measuring the effect of various interventions
on voter turnout is the largest and most fully developed, and it provides a good illustration of
how the use of field experiments in political science has proceeded. From an initial focus on the
relative effects of different modes of communication, scholars began to explore how theoretical
insights from social psychology and behavioral economics might be used to craft messages and
how voter mobilization experiments could be employed to test the real world effects of
theoretical claims. The existence of a large number of experimental turnout studies was essential,
because it provided the background against which unusual and important results could be easily
discerned.
We begin by describing the intellectual context of the modern emergence of field
experiments to study voter turnout. We discuss the state of the literature on campaign effects
and voter mobilization around the time of the re-introduction of field experimentation to study
political behavior. We discuss some of the methodological reasons why this change represents an
important advance over previous work. Our literature reviews focus on two broad areas of
research: the effects of different modes of communication (face-to-face conversations, phone
calls, and mail) and the effects of different messages. In the final section we discuss some open
2
questions and new directions for applications of field experiments to the application of field
experiments to voter turnout and the study of political behavior more generally.
1. Intellectual Context for Emergence of Field Experiments in Political Science
The Development of Field Experimentation in Political Science
The first political science field experiments were conducted by Harold Gosnell in the
1920s. Gosnell, one of the foremost empirical political scientists of the first half of the 20th
century, showed an early appreciation for the challenge of identifying the effects of voter
mobilization efforts. He notes that the fall of 1924 featured a great deal of get-out-the-vote
(GOTV) activity, including a National League of Women Voters’ door to door canvassing effort
and a campaign by two million Boy Scouts to remind citizens of their duty to vote. However, he
recognized that any correlation between turnout and mobilization activity cannot be taken to
demonstrate that a causal relationship. Foreshadowing the concerns about causal identification
that now suffuse work on voter turnout, Gosnell writes:
What was the net effect of all this publicity regarding the election? Did a higher
proportion of the eligible voters take part in the electoral process? The only candid
answer to these questions is that we do not know… It is true that in some states a larger
portion of the adult citizens voted in 1924 than in 1920, but what part of this increase, if
any, can be traced to a single factor like the get-out-the-vote movement? Gosnell (1927,
p. 2)
Gosnell took up this challenge and conducted the earliest field studies of voter
mobilization. He investigated the effects of get-out-the-vote mailings on turnout in the
presidential election of 1924 and the 1925 Chicago mayoral election (Gosnell 1927). Although it
remains unclear whether Gosnell employed random assignment of the GOTV treatment in his
study, other aspects of his research protocol, such measurement of outcomes using the
administrative voter records, have become familiar features in the modern experimental
3
literature.1 Three decades after Gosnell, Eldersveld (1956) conducted a series of randomized field
experiments to measure the effects of different modes of campaign contact on voter turnout.
Eldersveld assigned treatments at the household level and, using post-election administrative
records, measured the effect of mail, phone, and canvassing on voter turnout in Ann Arbor,
Michigan. While these early experiments have many features of contemporary work, the studies
were seldom cited and had little effect on the trajectory of subsequent research. In the decades
after Eldersveld, field experimentation was treated as an unusual curio and, when the method
was considered at all, it was dismissed as impractical or of limited application. Although lab and
survey experiments gained popularity during the 1980s and 1990s, experiments in naturalistic
settings remained rare; no field experiment on any subject was published in a major political
science journal during the 1990s.
The modern tradition of political science field experimentation began with a series of
experimental studies of campaign activity (Gerber and Green 2000; Gerber, Green, and
Nickerson 2001). The turn to field experiments can be understood in part as a response to
persistent methodological concerns regarding the then dominant approaches employed in
important political behavior literatures. To provide an appreciation for the context in which field
experimentation developed in political science, we briefly review the state of the literature on
campaign effects at the time of the authors’ 1998 field experiment on voter turnout in New
Haven. Although this literature includes some of the very best empirical studies of their time, the
work suffered from important methodological weaknesses and often produced sharply
conflicting results. The appeal of field experiments stems in part from its ability to address many
of the deficiencies in the prior literature.
At the time of the New Haven field experiments, the literature that attempted to measure
the effect of campaign spending on election outcomes included perhaps a dozen major studies
using a variety of empirical strategies. With few exceptions, one common feature of this
literature was that the studies did not examine the effect of particular campaign activities but
rather explored the correlation between reported campaign spending (as compiled by the Federal
1 Gosnell canvassed some Chicago neighborhoods and assembled a collection of matched pairs of streets. He selected one of the pair to get the treatment, but it is not clear what method Gosnell used to decide which of the pair was to be treated.
4
Election Commission) and candidate vote shares.2 The pioneering work employing the newly
available FEC data was conducted by Jacobson, who estimated spending effects by regressing
election outcomes on incumbent and challenger spending levels (Jacobson 1978, 1985, 1990,
1998). A key assumption of this approach is that spending levels do not adjust to unmeasured
aspects of the political context. Intuition, however, suggests that incumbents tend to increase
their spending when facing a tough race. This concern was heightened by the major finding of
this line of work, that incumbent spending frequently had a negative relationship with incumbent
vote share. There were two major responses to the threat of bias. First, some studies proposed
instrumental variables for candidate spending levels (Green and Krasno 1998; Gerber 1998).
Second, it was proposed that omitted variables regarding election conditions could be eliminated
through a panel approach. Levitt (1994) examined the subset of races that involved the same
candidates facing each other in the same district on more than one occasion. Using the subset of
races involving repeat-pairs, Levitt measured the relationship between the change in vote share
and the change in spending levels, producing estimates that were unrelated to differences in
candidate or district attributes that might be lurking in the error term of a cross sectional
regression.
Using the results from several of the leading studies, we can calculate the implied cost
per vote.3 Table 1 shows that the results produced by alternative estimation strategies are
dramatically different. The estimated cost of moving the vote margin by a single vote ranges
from as little as 20 dollars to as much as 500 (Gerber 2004). This range seems to span all
plausible estimates. Further, it is not clear which study ought to be believed, as each relies on
assumptions that, while plausible, are far from airtight. The dramatically inconsistent results, and
the sensitivity of the estimates to modeling assumptions, suggest the usefulness of attempting a
fresh approach to measuring campaign effects.
The turn to experiments represents one such attempt. The campaign spending literature
attempts to draw conclusions about the effectiveness of spending using overall campaign
spending as the independent variable. However, overall spending is the sum of spending on a
variety of different activities. Thus, it might be possible to gain insight into the effect of spending
2 There were some exceptions, e.g., Ansolabehere and Gerber (1994). 3 The cost-per-vote in this context refers to the cost of reducing the vote margin by one vote. In the context of the turnout literature described below, cost-per-vote refers to the cost of mobilizing one additional voter.
5
overall by measuring the effectiveness of spending on particular components of campaigns, such
as voter mobilization efforts. This suggests the usefulness of obtaining a ballpark estimate of the
cost of inducing a supporter to cast a ballot. As the literature on campaign spending effects
developed, a parallel literature examining the effects of campaign mobilization was developing
as well. This literature progressed on an independent track and, despite its relevance, no
connection was drawn to the aggregate spending literature. What did the observational and
experimental work on voter mobilization say about the votes that could be produced through
voter mobilization efforts?
Prior to the 1998 New Haven experiments, a small field experimental literature addressed
the effects of campaign activity on voter turnout. Table 2 lists and summarizes the results of
these studies. Gosnell’s study in the 1920s was by far the largest. Gosnell measured the effect of
a non-partisan mail campaign in Chicago’s 1924 and 1925 elections. Eldersveld followed three
decades later with studies of the effect of different modes of contact on turnout levels. He
examined the effect of voter mobilization in a pair of local elections in Ann Arbor. Greenwald
and colleagues (1987) investigated the psychological hypothesis that predicting one’s behavior
had a causal effect on future action. They constructed a brief series of questions that had the
effect of inducing treated subjects, a random subset of 32 treated subjects drawn from a
collection 60 Ohio State undergraduates, to state that they intended to vote in the next day’s 1984
presidential election. They measured the effect of this treatment on their subsequent turnout and
found the intervention produced more than a 20 percentage point boost in turnout. In 1980,
Adams and Smith measured the effect of a 30 second phone call on turnout and vote choice in a
District of Columbia special election. In the same year, Miller, Baer and Bositis (1981) measured
the turnout effects of door-to-door canvassing, phone calls, and direct mail on randomly targeted
voters in a Carbondale, Illinois primary election.
Summarizing the early experiment literature, prior to 1998 there were a few studies
conducted over many decades and across a range of political contexts. Nevertheless, when the
small literature is viewed as a whole, a few conclusions emerge. First, it appears that campaign
interventions are highly effective. Short phone calls produce turnout increases of 10 or even 20
percentage points. According to these studies, visits from canvassers or even a single letter also
tend to produce effects of this same magnitude. These are very large estimated effects; to put this
treatment effect into context, the falloff in turnout between a presidential election and a midterm
6
election is about 10 percentage points. Second, these large treatment effects are observed in both
general elections, such as the 1984 presidential election, and less high profile contests. Third,
treatment effects show no tendency to decrease over time.
Another important and related line of research employed laboratory experiments to assess
the effect of campaign activity. A leading example of this work is the influential study by
Ansolabehere and Iyengar (1996), who brought subjects into a laboratory setting designed to
mimic a typical living room and measured the effect of political advertisements inserted into
mock newscasts. They found that advertisements that attacked the opposing candidate reduced
the likelihood that subjects, when interviewed later, said they would vote, an effect was
especially strong among independent voters. Like field experiments, these studies use random
assignment to estimate the causal effect of campaign communications. However, it is hard to
translate the results from the laboratory experiments into quantitative estimates of the impact of
actual campaign activity on actual voter turnout. Despite the researchers’ best effort to simulate
the typical viewer experience and measure outcomes reliably, the context in which subjects
receive the treatment and express outcomes (intention to vote) differs from natural settings in so
many ways, both obvious and subtle, that it is unclear how the lab result indicates either the
magnitude or even the direction of the campaign effects being studied.4
In contrast to the occasional experimental study, the vast majority of work on campaigns
and turnout was (and is) observational. During the 1990s, the most influential scholarship on the
causes of turnout were studies that measured the relationship between voter turnout and voter
demographics, attitudes, and reported campaign contacts using survey data. Work by Rosenstone
and Hansen (1993) is an exemplar of this line of work. Their book was extremely influential and
remains a standard reference (its Google scholar citation count exceeded 3,700 as of the start of
2016). The book is cited by all turnout scholars, and the research design they employ is still
common in current research. The American National Election Study is a federally funded
4 As Gerber (2010) notes, it is not necessarily the case that estimates obtained in the lab indicate the direction of effects in field settings. There are often plausible arguments for why a lab effect might go in the opposite direction from the real world effect. One major difference between the lab and field is that in the real world individuals have additional choices and exposures. Applying this to laboratory studies of negative campaigning, outside the lab individuals may be inspired by a negative advertisement to seek additional information about the claim or to pay more attention to campaign related stimuli, leading to greater interest and higher participation levels.
7
biennial survey research project that began in 1952 and continues to this day. Questions about
voter turnout and campaign contact have been asked since the earliest surveys, and Rosenstone
and Hansen use the American National Election Studies (ANES) to measure the effect of
reported campaign contacts on various measures of participation. Using estimates from a pooled
cross-sectional analysis of ANES data, they calculate the incremental contribution of many
different factors, including campaign contacts, on reported participation in presidential and
midterm years (see Tables 5.1 and 5.2 in Rosenstone and Hansen 1993). They find that the
estimated effect of campaign contact on reported voter turnout is approximately a 10 percentage
point increase in turnout probability.
The 10 percentage point turnout boost from campaign contact found by Rosenstone and
Hansen is similar in magnitude to the effects estimated by many of the early field experiments.
However, despite this agreement, there are grounds for skepticism. As we point out in the next
section, respondents’ exposure to campaign contact is neither randomly assigned nor accurately
measured. The move to field experiments in the late 1990s was motivated in part by concern
about the potential bias in the dominant survey-based research tradition.
2. How do experiments address the problems in the prior voter turnout research?
In this section we present a basic framework for defining causal effects and apply the
framework to explain how field experiments eliminate some of the key sources of bias in
observational studies. To fix ideas, we will use the classic Rosenstone and Hansen (1993) survey
analysis as a running example. In Rosenstone and Hansen, some respondents report that they are
“treated” (contacted by a campaign) and some report that they are “untreated” (not contacted by
the campaign). The key challenge in estimating the treatment effect of campaign contact on those
who are truly contacted is that the analyst must use available data to construct an estimate of a
counterfactual quantity, the turnout rate of the contacted in the event they had not been treated.
We express this challenge using potential outcomes notation (Rubin 1978). For each individual i
let Yi0 be the outcome if i does not receive the treatment (in this example, contact by the
mobilization effort), and Yi1 be the outcome if i receives the treatment. The treatment effect for
individual i is defined as:
8
(1) τi = Yi1 – Yi0.
We define the treatment effect for individual i as the difference between the outcome for i
in the two possible, but mutually exclusive, states of the world: one in which i is treated, and
another in which i is not. Moving from a single individual, the average treatment effect for the
treated (ATT) is defined as:
(2) ATT = E(τi|Ti=1)= E(Yi1|Ti=1) - E(Yi0|Ti=1) ,
where the E[] operator stands for a group average and Ti=1 when a person is treated. The
quantity Yi1|Ti=1 is the post-treatment outcome for those who are actually treated, and Yi0|Ti=1 is
the outcome that would have been observed for the treated had they, in fact, not been treated.
In Rosenstone and Hansen, as in the rest of the non-experimental literature, the
comparison group for the treated are subjects who are untreated. When covariate adjustment is
used, the comparison group is the set of subjects who are untreated but resemble the treated with
respect to their background attributes. This approach is susceptible to selection bias when the
potential outcomes among the untreated are systematically different from those of the treated.
Stated formally, in expectation the observational comparison of the treated and the untreated
estimates yields:
(3) E(Yi1|Ti=1) - E(Yi0|Ti=0) =
[E(Yi1|Ti=1) - E(Yi0|Ti=1)] + [E(Yi0|Ti=1) - E(Yi0|Ti=0)] = ATT + Selection Bias.
Under what conditions does the selection bias term disappear? The critical assumption
for identification of the average treatment on treated in observational work is that, controlling for
covariates (whether through regression or through matching), E(Yi0|Ti=1) = E(Yi0|Ti=0) – i.e.,
apart from their exposure to the treatment, the treated and untreated group outcomes are on
average the same in the untreated state. In the absence of some unusual as-if random
circumstance by which some units came to be treated and other remained untreated, this
assumption is not credible. Consider the case at hand, estimating the effect of campaigning on
voter turnout. Campaigns typically have extensive information available about a jurisdiction’s
9
voters based on both administrative records of voter turnout and demographics along with insider
information about individuals and neighborhoods. This information, which may not be fully
available to the data analyst, is typically used in campaign targeting strategies. Campaigns
commonly target those who have shown a tendency to participate, and this characteristic is, from
the standpoint of the analyst, an omitted variable. The ANES, for example, does not record
respondents’ vote history, although voter files available to campaigns do contain this
information. Second, previous turnout records are highly predictive of the outcome variable,
turnout. Therefore, E(Yi0|Ti=1) may be substantially higher than E(Yi0|Ti=0). Although in this
case it is possible to guess the direction of the bias, analysts rarely have a firm basis to speculate
about the magnitude of the bias, and so it is not possible to correct the estimates.5
Beyond selection bias, field experiments mitigate a variety of other common
methodological concerns regarding observational studies of political behavior. In observational
studies the researcher controls neither the treatment assignment nor the design of the treatment.
At the most basic level, a key feature of field experimentation is that the researcher controls the
assignment to treatment and therefore knows which subjects are assigned to treatment and
control conditions. Observational studies often attempt to measure whether an individual is
treated or not, but survey measures may be unreliable. Commonly, whether a subject is treated or
not relies on the subject’s self-report (of campaign contact, of advertising exposure, of media
usage, etc.). Consider again the example of attempts to measure the effects of campaign
mobilization on voter turnout. In this literature contact is self-reported, and misreporting leads to
a treatment group that is a mixture of the treated and untreated. If this misreporting is random
misclassification, the estimated average treatment effects will be attenuated, but if those who
misreport campaign contact tend to be the more politically engaged, this non-random
measurement error may exaggerate the effects of campaign contacts. This bias will be heightened
when, as is often the case, the subject’s turnout is itself based on self-report. There is empirical
evidence of both substantial misreporting and a positive correlation between misreporting
campaign exposure and misreporting having voted (Vavreck 2007; Gerber and Doherty 2009). It
should be noted that although from time to time previous observational work has employed
5 Further, when “correcting” for bias this uncertainty about the size of bias is not contained in the reported standard errors and, unlike sampling variability, it remains undiminished as the sample size increases (Gerber, Green, and Kaplan 2004). The conventional measures of coefficient uncertainty in observational research thereby underestimate the true level of uncertainty, especially in cases where the sample size is large.
10
validated vote (the ANES used public voting records to add this variable into the survey datasets
for the years 1964, 1972, 1974, 1976, 1978, 1980, 1984, 1986, 1988, and 19906), one of the
important innovations brought about by the advent of field experimentation in this area is that it
has become common for studies of political behavior to use administrative data rather than self-
reports.
A further problem that is avoided by field experiments is ambiguity about what
intervention is being assessed. Turning again to the case of the voter mobilization research, the
ANES item used for campaign contact in the Rosenstone and Hansen study asks respondents:
“Did anyone from one of the political parties call you up or come around and talk to you about
the campaign?” Taken literally, this question asks the respondents about partisan phone or face-
to-face contact leading to a conversation about the campaign, which omits all campaign contact
through mail, all contact about political issues outside the campaign, and possibly all manner of
nonpartisan contact urging turnout. It is unclear whether survey respondents attend to these
nuances when answering the question, which only deepens the ambiguity surrounding the
treatment effect that survey-based regressions are estimating.7
In experimental analysis it is now standard to account for non-compliance. In the context
of voter mobilization non-compliance most commonly occurs when individuals who were
assigned to the treatment group remain untreated. The rate at which failure to treat occurs varies
across modes of contact, the intensity of the effort to contact, the difficulty of contact, and
attributes of the subjects and context. Non-compliance arises for a variety of reasons, such as the
subject relocating, not answering the door or phone when the campaign attempts contact, or the
campaign running out of resources before attempting to contact all subjects assigned to be
treated. The failure to treat is immediately apparent in field experiments, and the observed
difference in average outcomes for the treatment and control groups is adjusted for the
proportion of the treatment group contacted to estimate the average treatment effect among
compliers (Angrist, Imbens, and Rubin 1996), which is the same as the average effect of the
treatment on the treated when experiments encounter one-sided noncompliance.
Properly accounting for non-compliance in voter mobilization experiments is an
innovation of recent work, as experimental studies prior to 1998 either dropped the untreated
6 See http://www.electionstudies.org/overview/dataqual.htm 7 Perhaps a footnote on lab versus field for voter mobilization?
11
subjects in the treatment group from the analysis or reclassified them as control group
observations (Adams and Smith 1980; Eldersveld 1956) or made no mention of the issue (Miller
et al. 1981). Such approaches produce biased estimates of the effect of the treatment on the
treated if those who cannot be contacted in the treatment group have a different average
untreated potential outcomes than the entire pool of subjects. Because failure to treat may stem
from factors related to propensity to turnout, such as recently relocating, being out of town
around election day, being busy or anti-social, or any of a number of other possibilities,
noncompliance is unlikely to be ignorable. In studies of GOTV phone calls, those who are hard
to contact often prove to be much less likely to vote than the average subject (Gerber and Green
2005). In observational studies, those whom the campaign cannot reach will tend to report that
they were untreated and will therefore be grouped with those the campaign did not attempt to
reach. Thus, in addition to selection bias due to the campaign targeting, there is also bias due to
the campaign’s failure to treat some of its targets.
In sum, field experiments have at least three important advantages over survey-based
observational studies of voter turnout. Random assignment of the treatment eliminates the threat
of selection bias. Direct manipulation of the treatment also allows researchers to have more
control over what the treatment is and to more accurately ascertain whether subjects received it.
The use of administrative data to measure outcomes helps ensure symmetry between those
assigned to the treatment and control groups. A commonly noted limitation of field experiments
is that they seldom encompass a random sample of a national electorate (but see Fieldhouse,
Cutts, Widdop, and John 2013), which raises the question of whether experimental results
generalize across subjects, treatments, and contexts. One way to address this concern is through
extensive replication of experiments, a practice that has become common in voter mobilization
research. Indeed, one of the distinctive features of the experimental literature on voter
mobilization is the large and ever growing number of studies that replicate and extend existing
research. The next section describes the evolution of the experimental literature, which now
encompasses studies conducted in Europe, Asia, and Latin America.8
3. An Overview of the Experimental Literature on Voter Mobilization
8 This section is adapted from Green and Gerber (2015).
12
The modern voter mobilization literature can be divided into two main classes of studies.
The early work focused on the relative effectiveness of different modes of contact. This focus
was in part inspired by a concern that the shift from the more personal campaigning of a previous
era to modern campaigns conducted through mailings and television were contributing to a
decline in turnout. Although some studies introduced experimental variation in message content,
this was not the major focus of the research. A second line of research aimed to measure the
effect of alternative messages employed in the communications. Often inspired by psychological
theories or political folk wisdom, these studies examined how the impact of the communication
changed according to the words and images used in the campaign material. For some influential
theories in social psychology, this literature, although published largely in political science
journals, provides some of the most telling empirical evidence.
A. Modes of contact
The New Haven 1998 study examined the relative effectiveness of three common
campaign tactics: door-to-door canvassing, calls from commercial phone banks, and direct mail.
The study found that face to face canvassing produced an 8 percentage point increase in turnout
among those contacted, each piece of mail raised turnout by half a percentage point in
households receiving the mail (the number of mailings varied from 0 to 3), and a phone call
produced no increase in turnout. A substantial follow up literature measured the effect of each of
these three modes of communication across a range of contexts and extended this line of research
to include GOTV appeals communicated via television, radio, and social media.
a. Canvassing Studies
After the New Haven Study, basic questions of generalizability abounded. Would canvassing
work elsewhere? Would it work in competitive as well as uncompetitive municipal races? We
first summarize studies that, like the New Haven Study, canvassed using nonpartisan GOTV
appeals. In 2001 a multi-site evaluation was carried out in six cities: Bridgeport, Columbus,
Detroit, Minneapolis, Raleigh, and St. Paul. Baseline turnout rates in the control groups varied
considerably across sites, from 8.2% to 43.3%. Despite the varying electoral and demographic
13
contexts, results were no more variable than one would expect by chance. In all six sites, turnout
was higher in the assigned treatment group than the control group, although the increase was
negligible in one site. Analyzing the data for the six sites with a single regression model yielded
an effect of 7.1 percentage points with a standard error of 2.2 percentage points (Green, Gerber,
and Nickerson 2003).
Another mobilization experiment conducted in 2001 extended previous work in three
important directions (Michelson 2003). First, the canvassing effort achieved a remarkable 75
percent contact rate. Second, it showed how mobilization works in a rural setting. The study took
place in a low-turnout municipal election in a largely Latino California farming community.
Third, it varied the campaign message between appeals that stressed either civic duty, ethnic
solidarity (for Latino voters), or community solidarity (for non-Latino voters). Regardless of the
message used, the team of Latino canvassers proved highly effective at mobilizing Latino voters.
For all Latinos, turnout increased from 13.8 percent (N = 298) to 18.5 percent (N = 466). For
non-Latinos, turnout increased from 25.7 percent (N = 758) to 28.2 percent (N = 1,243).
Canvassers contacted 73 percent of Latinos and 78 percent of non-Latinos. The scripts were not
significantly different in terms of the effectiveness with which they mobilized voters.
Again examining the effects of alternative messages in addition to the effects of Latino and non-
Latino canvassers, Melissa Michelson and Herbert Villa focused on a sample of voters under the age
of twenty-six, encouraging them to vote in the 2002 state and federal elections (Villa and Michelson
2005). Turnout among Latino subjects rose from 7.2 percent (N = 1,384) to 9.3 percent (N = 1,507),
and among non-Latino subjects it rose from 8.9 percent (N = 1,438) to 10.0 percent (N = 1,455). The
contact rates were 51 and 39 percent, respectively. Again, Michelson and Villa found no evidence
that the content of the canvassing script made an appreciable difference. Michelson returned to
Fresno in 2003, using students from her classes to conduct an experiment on the differential
effects of partisan and nonpartisan appeals. Like the Bennion study of the 2002 midterm election,
which also used students canvassing as part of a course assignment, this study found weak treatment
effects (Bennion 2005). Overall, the control group (N = 2,672) turned out at a rate of 15.2 percent,
compared to 14.9 percent in the treatment group (N = 3,371), which was contacted at a rate of 34
percent.
Unlike other studies of door-to-door canvassing, Nickerson (2008) used a placebo control design.
Half of those contacted were urged to recycle; the other half, to vote in the 2002 primary elections
14
held in Denver and Minneapolis. Turnout increased from 47.7 percent (N = 279) to 56.3 percent (N =
283) among those urged to vote. Since by design the contact rate was 100 percent, the study had
reasonable statistical power despite the small sample size. Perhaps the most interesting aspect of
this experiment was Nickerson’s demonstration that turnout among housemates of persons in the
treatment group was significantly higher than turnout among housemates of those in the control
group, suggesting that the mobilizing effects of a face-to-face conversation with canvassers may
have been transmitted to other members of the household.
In 2004 Carrie LeVan organized a nonpartisan canvassing campaign aimed at mobilizing
voters in low-turnout, low-income, and largely Latino precincts in Bakersfield, California.16 The
study comprised 727 voters, 423 of whom lived in households that were assigned to the
treatment group. The contact rate among those assigned to the treatment group was 50 percent.
The study found strong canvassing effects. Among voters living in one-person households, for
example, turnout was 41.0 percent in the control group and 54.5 percent in the treatment group.
Gregg Murray and Richard Matland also conducted a canvassing study in a largely Latino area,
Brownsville, Texas.17 Turnout among the 3,844 individuals assigned to the control group was
33.3 percent, compared to 34.9 percent among the 7,580 assigned to the canvassing group, of
whom 22 percent were actually contacted.
Lisa García Bedolla and Melissa Michelson (2012) collaborated with several nonpartisan
groups participating in the California Votes Initiative, which sought to mobilize low-propensity
voters in a series of elections from 2006 through 2008. The effort is noteworthy because of the
number of organizations that conducted door-to-door outreach, the range of ethnic groups that
were targeted, and the range of electoral contexts during which canvassing took place. In all,
117 distinct experiments were conducted. Although the authors note that many of the
participating organizations contacted voters primarily to spread the word about the
organization’s activities or administer issue surveys rather than to engage in voter mobilization
(p.127), the treatment voted at a higher rate than the control group in 77 of these experiments,
which would occur by chance with p < 0.001.
By comparison to partisan canvassing, which tends to occur on a vast scale in closely
contested states in presidential elections, nonpartisan canvassing is relatively rare. However,
since partisan campaigns always have the option of using nonpartisan appeals to mobilize their
partisan supporters, experimental evaluations of nonpartisan canvassing are potentially
15
informative even to campaigns that seek to advocate on behalf of a candidate or ballot measure.
Nevertheless, the question arises as to whether the results would differ if canvassers attempted to
urge voters to support a particular candidate or cause. Although no experiments have attempted
a head-to-head comparison between nonpartisan and advocacy appeals, a series of advocacy
experiments suggest that such canvassing may produce widely varying effects.
Two experiments conducted in 2003 gave early indications that advocacy campaigns could be
quite effective in mobilizing voters. In Kansas City, the ACORN organization canvassed
extensively in predominantly African American precincts. Its aim was to identify and mobilize
those supportive of a ballot measure designed to preserve local bus service. Unlike most other
canvassing experiments, this one was randomized at the level of the precinct, with fourteen
assigned to the treatment group and fourteen to the control group. Among voters assigned to
control precincts (N = 4,779), turnout was 29.1 percent, compared to 33.5 percent in the
treatment group, 62.7 percent of whom were contacted (Arceneaux 2005). At roughly the same
time, ACORN canvassed in Phoenix on behalf of a ballot measure to determine the future of the
county hospital (Villa and Michelson 2005). ACORN conducted two rounds of canvassing, the
first to identify voters sympathetic to the ballot measure and a second to urge supportive voters
to vote. The canvassing effort targeted voters with Latino surnames who had voted in at least one
of the previous four elections. ACORN made multiple attempts to contact voters (including
making a small number of phone calls), the result being that 71 percent of those living in one-
voter households were contacted at least once. This figure rose to 80 percent among two-voter
households. This mobilization campaign had a powerful effect on turnout. Among one-person
households, turnout rose from 7.4 percent in the control group (N = 473) to 15.9 percent in the
treatment group (N = 2,666). Among two-person households, turnout rose from 6.9 percent in
the control group (N = 72) to 21.0 percent in the treatment group (N = 2,550).
On the other hand, advocacy campaigns have been known to produce disappointing results.
Strategic Concepts in Organizing and Policy Education (SCOPE) in Los Angeles, canvassed in
opposition to the “three strikes” statewide ballot measure but generated no apparent turnout
effect (Arceneaux and Nickerson 2009). Potter and Gray (2007) found weak mobilization effects
in a small canvassing experiment on behalf of a candidate for local magistrate. In their study of
canvassing on behalf of a local candidate, Barton et al. (2012) find an unexpectedly negative
16
effect on turnout. Larger candidate advocacy experiments show positive effects, although the
treatment-on-treated estimates are smaller than those obtained in the ACORN studies. A sizable
experiment on behalf of a Democratic gubernatorial candidate in 2005 generated a treatment-on-
treated estimate of 3.5 (SE = 2.4), and a series of experiments on behalf of state legislative
candidates in Republican primary runoff elections generated a treatment-on-treated estimate of
3.1 (SE = 1.8).
b. Commercial Phone Banks
In 1998 the authors conducted two nonpartisan campaigns using a single commercial phone
bank (Gerber and Green 2000, 2001). The smaller of the two campaigns was conducted in New
Haven; a larger study was conducted in neighboring West Haven. In both cities, the elections were
rather quiet affairs, with relatively little campaign activity. In both experiments, the group
receiving phone calls voted at rates that were no greater than the rates of the control group
receiving no calls. None of the three scripts—one stressing civic duty, another, neighborhood
solidarity, and a third, the possibility of deciding a close election—had any appreciable impact.
In order to assess whether these results were specific to the context or the calling house, we
replicated the 1998 experiments on a grand scale in 2002.10 Congressional districts in Iowa and
Michigan were divided into two categories, depending on whether they featured competitive or
uncompetitive races. Within each category, 15,000 randomly selected individuals at distinct
addresses were called by one of two commercial phone banks, each delivering the same
nonpartisan message. Thus, 60,000 people in all were called in the treatment group, and more than
1 million names were placed in the control group. In the 2002 study, the treatment effects were
just barely on the positive side of zero, implying that these phone banks mobilized one additional
voter for every 280 people they spoke with. Another massive study in Illinois, which called voters
before the 2004 November election using a similar nonpartisan script, found somewhat larger
effects.11 This time one vote was generated per fifty-five completed calls. However, this study is
counterbalanced by a pair of large nonpartisan experiments in North Carolina and Missouri, which
found conventional calls to have meager effects, just one vote generated per 500 contacts (Ha and
Karlan 2009).
Calls that advocate on behalf of a candidate or ballot measure have been found to produce
17
similarly weak average treatment effects among compliers. Close to 30,000 calls (about half
resulting in successful contact) were made by a commercial phone center on behalf of a ballot
measure in a San Francisco municipal election. Consistent with other findings concerning the
delivery of brief scripts by commercial phone banks, one vote was produced for every 200
successful contacts (McNulty 2005). Similar results were found in a relatively small study of a
2002 gubernatorial primary (Cardy 2005). A much larger experiment conducted by the 2006
general elections also found weak effects, regardless of whether these calls were made using
nonpartisan messages or messages advocating support for a minimum wage measure (Mann 2008).
A head-to-head experimental comparison between partisan and nonpartisan scripts indicated that
neither had an appreciable effect on turnout (Panagopoulos 2008).
Several scholars have investigated the hypothesis that the effectiveness of these calls hinges on
the manner in which the scripts are delivered. Commercial vendors are paid according to the
number of targets they reach, not the number of votes they generate. The callers, who can forge
through fifty or so completed calls per hour, behave much as one would expect given the incentives
of piecework and the eagerness of supervisors to move on to the next calling campaign.
In 2002 David Nickerson evaluated a youth-oriented voter mobilization campaign in which a
commercial phone bank was paid top dollar to deliver its GOTV appeal in a chatty and unhurried
manner. The script required the reader to pause for questions and to invite respondents to visit a
website in order to learn more about their polling location. A good deal of coaching ensured that
this appeal was read at the proper speed. Between one and four calls were made to randomly
selected subgroups of young people over the four-week period leading up to Election Day. The
phone bank kept records of each person they contacted, so that when respondents were contacted
a second time, the script took notice of the fact that the previous conversation was being resumed.
The calls produced a substantial and statistically significant increase in voter turnout in the target
group, but only among those called during the final week of the campaign. In other words, calls
made during the first three weeks of a month-long GOTV campaign had no apparent effect on
voter turnout. Calls made during the last week produced one vote for every twenty contacts
(Nickerson 2007). This finding set in motion a series of experiments designed to sort out whether
the strong effects reflect timing, the use of repeated calls, or the conversational style in which the
scripts were delivered.
As to the timing and sequencing of calls from commercial phone banks, a large study conducted
18
across battleground and non-battleground states in the weeks leading up to the 2008 presidential
election found that neither first round nor second round calls by themselves boosted turnout but
that turnout rose significantly when voters who in round 1 said they planned to vote were later
called back and asked whether they could still be counted on to vote. This finding echoes the
unusually strong effects found in four follow-up call experiments conducted by volunteer phone
banks (Michelson, Bedolla, and McConnell 2009). However, this effect did not replicate in another
large commercial phone bank experiment in 2010, which found no effect of first round, second
round, or follow-up calls (Gerber, Green, and Ha 2011).
These results tentatively suggest that the active ingredients in a successful call are the scripts
and the manner in which they are delivered. This scripts hypothesis was tested in prior to the
presidential election of 2004 with calls directed at residents of a battleground and non-battleground
state (Ha and Karlan 2007). A large phone bank deployed three kinds of nonpartisan scripts: a
standard script akin to the ones used above; a longer, chattier script in which people were asked
whether they knew their polling location, which was provided on request; and a still longer script
in which people were encouraged both to vote and to mobilize their friends and neighbors to vote.
The results are suggestive, if a bit puzzling. As expected, the standard script had weak effects,
raising turnout by just 1.2 percentage points among those contacted. Also as expected, the medium
script had a fairly large effect, producing a CACE estimate of 3.4 percentage points. This
statistically significant increase implies that one vote was generated for every thirty completed
calls. The puzzling result is the fact that the chatty recruit-your-friends script had an unexpectedly
weak effect, one vote per sixty-nine completed calls.
The call quality hypothesis was tested in 2010 in a head-to-head competition among
different phone banks (Mann and Klofstad 2015). On the high side of the quality spectrum were
phone banks that specialized in fundraising or political calls; on the low side were phone banks
whose business consisted of a wide array of non-political as well as political clients. Mann and
Klofstad reason that firms on the low end of the quality spectrum are incentivized to push
through a high volume of calls in a mechanical fashion, whereas the focus and reputation of the
high quality firms required them to recruit and retain callers with a knack for political
persuasion. Each of the four phone banks called more than 100,000 voters across several states.
All the phone banks used the same “chatty” script, which blended several of the ideas discussed
in Section 4: gratitude, implementation intentions, and positive descriptive norms. Consistent
19
with the quality hypothesis, the two low-quality phone banks generated weak results, raising
turnout among those they spoke with by just 0.2 percentage points. By contrast, the two high-
quality phone banks raised turnout among those they reached by 0.9 and 1.4 percentage points.
Although the high-quality phone banks proved far less effective than the average volunteer
phone bank or the vaunted high-quality phone bank in the Nickerson study, they were
significantly more effective than the low-quality phone banks. (Ironically, the lower-quality
phone banks also reported a higher rate of contacts, which meant that they ended up being more
expensive on a cost-per-vote basis.) Given the immense size of this experiment and the tight
controls that the authors imposed on the scripts used by the different phone banks, this study
offers the most convincing evidence to date about the importance of that intangible ingredient,
quality.
c. Mailings
We begin our summary of the direct mail literature by focusing on “standard” nonpartisan
appeals, deferring the discussion of mailings that exert social pressure and other psychological
tactics until Section 4. During the four weeks leading up to the 1998 election, we conducted an
experiment in which registered voters in New Haven received one, two, or three pieces of
nonpartisan direct mail. Each batch of mail reflected one of three themes: the need to do one’s
civic duty, the responsibility to stand up for one’s neighborhood so that politicians will take an
interest in its problems, or the importance of voting in a close election. Turnout in the control
group, which received no mail, phone calls, or door-to-door canvassing, was 42.2 percent (N =
11,596). Turnout was 42.6 percent (N = 2,550) among those receiving one mailer, 43.3 percent
(N = 2,699) among those receiving two, and 44.6 percent (N = 2,527) among those receiving
three. For the sample as a whole (N = 31,098), regression estimates that controlled for the effects
of phone and door-to-door canvassing put the effects of each additional mailer at 0.5 percentage
point (SE = 0.3), which was narrowly significant at the 0.05 level using a one-tailed test. No
significant differences were found among the three messages.
In New Haven’s 1999 mayoral election, nonpartisan mailings patterned after the civic duty
and close election mailings used in the 1998 earlier study were sent to a random sample of the
1998 voter list. The innovation of this study was to send up to eight mailings in order to assess
diminishing returns. The close election message had no effect (the election was not remotely

20
close), but the civic duty message performed on par with the 1998 results. The results suggest
that returns from mailings begin to diminish after six mailings per household.
Given these encouraging initial results, a series of subsequent experiments tested the effectiveness
of nonpartisan mailings as a means of encouraging turnout among ethnic minorities. In a field
experiment conducted before the 2002 election, Janelle Wong (2005) classified Los Angeles County
voters by last name into one of several Asian American groups: Chinese, Filipino, Indian, Japanese,
and Korean. Chinese Americans were sent one piece of bilingual nonpartisan direct mail encouraging
them to vote. Other ethnic groups were sent one piece of direct mail in English. Among Chinese
Americans, turnout in the control group was 29.0 percent (2,924); the treatment group turned out at a
rate of 31.7 percent (1,137). Among other Asian groups, the control group voted at a rate of 38.5
percent (N = 5,802), compared with the treatment group rate of 39.4 percent (N = 2,095). Also in the
2002 election, a much larger multisite experiment sought to mobilize Latino voters in Los Angeles
County, Orange County (California), Houston, New Mexico, and Colorado (Ramírez 2005). The
content of the bilingual mailers was developed in collaboration with consultants using focus
groups. The number of mailers varied across sites from two to four. Despite the high quality of
the printing and graphics, they were found to have weak turnout effects.
Several other scholars have attempted to gauge whether ethnic communities can be mobilized
using direct mail in 2004. Trivedi (2005) tested alternative nonpartisan messages and graphic
themes designed to mobilize Indian American voters living in New York City. Her postcards
conveyed ethnic, pan-ethnic, or civic duty appeals, but no message stood out as particularly
effective. Richard Matland and Gregg Murray conducted a nonpartisan mail campaign in largely
Latino Brownsville, Texas.14 Households were randomly assigned a postcard with one of two
messages. One emphasized greater power for Latinos if they became more politically active and
voted. The other emphasized civic duty and the closeness of the election as the reasons recipients
should go to the polls and vote in the upcoming presidential election. Both found weak effects.
Bedolla and Michelson (2012) conducted 38 direct mail experiments in California from 2006
through 2008 in an effort to mobilize minority voters using a combination of generic and ethnic
appeals. They found weak effects overall, with 19 of the 38 experiments producing positive
estimates. Neither voter guides nor hand-written postcards seemed to boost turnout.
Two further strands of the nonpartisan mail literature deserve mention. The first is the
simple reminder that an election is imminent. This tactic has repeatedly been shown to have
21
negligible effects and has come to be used as a placebo condition in several experiments
(Matland and Murray forthcoming; Panagopoulos 2014, 2013, 2011). Another tactic is to pique
voters’ interest in an election by calling attention to certain ballot measures. One such experiment
sent a single mailing to registered voters both across Florida and specifically in Leon County
(Barabas, Barrilleaux, and Scheller 2010). Each mailing alerted voters to the importance of one ballot
measure. The authors compared the mobilization effects of these mailings to those of a generic GOTV
mailing and found small differences in effects across different issues or appeals.
The literature gauging the turnout effects of advocacy mailings is essentially a string of
null findings. The first large-scale experiments were conducted in 1999 in state legislative and
municipal elections on behalf of Democratic candidates (Gerber, Green, and Green 2003). The
state legislative experiments divided the target population into “prime” Democrats (those with a
high propensity to vote), “nonprime” Democrats and Independents, and a random sample of the
list of registered voters. The mailings boosted turnout among prime Democrats, but not among
other Democrats. Turnout in the random sample rose with the number of mailings, but the effects
were small given the number of mailings sent to each household. Combining all of the New
Jersey samples suggests that mail did not significantly increase voter turnout. Some slight
evidence for demobilization may be found in the negatively toned mayoral campaign, which sent
nine mailings to each household.
Another early study evaluated the mobilizing effects of advocacy mail from an abortion-
rights interest group, which backed a pro-choice candidate in a gubernatorial primary campaign
(Cardy 2005). The group targeted strongly pro-choice voters who stances had been previously
identified by phone interviews. The treatment group (N=1,974) received five mailings that were
printed in full color on glossy paper and mailed between nineteen and six days before the
election. Turnout in the control group (N=2,008) was slightly higher than in the treatment group.
Other small studies produced results that, on average, suggest little effect on turnout (Cho et al.
2005; Gray and Potter 2007; Niven 2006). This conclusion was bolstered by a massive study
that sent up to nine pieces of mail on behalf of a Democratic gubernatorial candidate in 2005, as
well as a large test on behalf of Republican state legislative districts in 2014 that sent up to
twelve mailers (Cubbison 2015). The lack of effect is not altogether surprising given that the
mailers focused on issues and candidates rather than turnout. Nevertheless, the findings drive
22
home the point that advocacy communications per se do little to stimulate voter turnout.9
d. Other Modes of Communication
Compared to the extensive experimental literatures on canvassing, phone banks, and direct mail,
the literature on other modes of communication looks relatively thin. Some of the most robust
findings concern the weak effects of some widely used tactics. For example, David Nickerson
(2007) reports the results of thirteen experiments in which almost a quarter of a million people –
college students, registered voters who did not opt out of email communication, or visitors to
websites who agreed to be reminded to vote – were urged to vote in an upcoming election. These
nonpartisan appeals produced negligible effects, even when 20% or more of the recipients opened
the GOTV email on an HTML-compatible browser. Malhotra, Michelson, and Valenzuela (2012)
found small but statistically significant effects were found when emails were sent out by the
registrar of voters, but identical emails sent by a nonpartisan group has no effect. Alissa Stollwerk
collaborated with the Democratic National Committee to assess the effects of three e-mails
encouraging voter turnout in support of the Democratic mayoral candidate in the 2005 New York
City general election. The e-mails were sent in the late afternoon on election eve, on the morning
of Election Day, and during the mid-afternoon of Election Day. The subject lines referred to voting,
and the text of the e-mail itself implored Democrats to “vote to ensure that our representatives
protect the values and beliefs that we all treasure.” Of the 41,900 people in the treatment group,
13 percent opened at least one of the e-mails. The partisan reminders, however, had no effect on voter
turnout. Among the 41,900 people in the treatment group, the turnout rate was 58.7 percent. Among the 10,513 in
the control group, turnout was 59.7 percent. When Stollwerk replicated this study in the days leading
up to the 2013 mayoral election, she found positive but insignificant effects (Stollwerk 2015).
Overall, it appears that GOTV email does little to raise turnout.
Another growing literature evaluates the effects of messages conveyed via social media,
9 Somewhere between nonpartisan mail and advocacy mail are mailers from advocacy groups that target ideologically allied voters but appeal to them using nonpartisan language. See, for example, Mann (2008). These studies tend to produce effects that are somewhere between the non-effects of partisan mail and the weak effects of nonpartisan mail.
23
such as Facebook. The most well-known study was conducted by a team of academics and
Facebook researchers. Prior to the 2010 midterm election, Bond et al. (2012) randomly assigned
millions of Facebook users to one of three conditions. The first was a control group that received no
encouragement to vote. The second group received an information treatment that consisted of several
elements: users were shown a banner at the top of their news feed announcing that “Today is Election
Day,” encouraged to indicate whether they voted by clicking an “I Voted” graphic, provided a link to
locate their polling place, and presented with a counter tabulating the cumulative vote count among
Facebook users. The third group received a social treatment: they received the same encouragement as
the information group and were also shown the faces of up to six friends who had voted along with a
count of friends who had voted. Data gleaned from Facebook users’ personal profiles allowed the
research team to assess actual turnout for about one in ten subjects, which nevertheless left
approximately 60,000 subjects in the control and information conditions and millions in the social
condition. Two key findings emerged. The first is that the information treatment had precisely zero
effect on turnout. This finding reaffirms the finding from direct mail experiments suggesting that
reminders to vote have little effect on turnout. The second is that the social treatment increased turnout
by 0.39 percentage points, which is small but statistically significant. Turnout in the social group is
significantly higher than in the control condition or the information condition. Evidently, the active
ingredient in social condition is the presentation of friends’ turnout, a theme that foreshadows, our later
discussion of social norms on turnout.
The idea of putting an “I voted” widget on Facebook user’s news feeds is a creative one, but
this intervention is not something that those outside Facebook are at liberty to do, even for a fee. The
fallback position is to buy ads on Facebook. In a pair of large-scale experiments, Kevin Collins, Laura
Keane, and Josh Kalla tested whether Rock The Vote ads placed in the news feed in fact raised turnout.10
In 2012, they assigned approximately 365,000 people to an untreated control group and another 365,000
to a treatment group that received encouragements to vote via sidebar ads and in their news feeds (the
latter were actually delivered to 41 percent of the assigned treatment group). These encouragements
showed, for example, the number of days left before the election and a display of friends who “liked”
this countdown. Because Rock The Vote enjoyed a positive image among the subjects who received
10Collins,Kevin,LauraKeane,andJoshKalla.2014.YouthVoterMobilizationThroughOnlineAdvertising:EvidenceFromTwoGOTVFieldExperiments.PaperpresentedattheAnnualMeetingoftheAmericanPoliticalScienceAssociation,Washington,DC.
24
its message, having helped many of them register to vote, it was a credible source of information and
encouragement. However, voter turnout records later revealed that the treatment and control groups
voted at identical rates, 56.5 percent. The following year, a follow-up experiment using the same design
was conducted in 14 states where November elections were being held. Roughly 46,500 voters were
assigned to an untreated control and a like number to the treatment group exposed to Rock The Vote
advertising. This time, a slightly higher proportion of the assigned treatment group, 54 percent, received
ads embedded in their news feeds. Turnout, however, was 14.6 percent in the control group and 14.0
percent in the treatment group. In both elections, Facebook ads proved ineffective at increasing turnout.
The experimental literature on email and social media, while disappointing to those who hoped
that votes could be mobilized on a grand scale at low marginal cost, is theoretically informative.
Evidently, a stream of reminders to vote are ineffective, even when they come from credible sources
(e.g., a civic group on whose website one registered to vote or opted in for voting reminders). There is
some evidence that more personalized peer-to-peer interaction via social media may foster an interest
in politics and increase turnout (Teresi and Michelson 2015). Further testing is needed to assess whether
new media stimulate turnout to the extent that they mimic direct personal interaction.
e. Conclusion
We conclude this section by taking note of one of the striking features of the experimental
literature on voter turnout, the sheer volume of similar studies employing each of the modes of
contact. To illustrate this, consider the example of get-out-the-vote mailings. Table 3, which is adapted
from our recent book reviewing the experimental literature (Green and Gerber, 2015), collects the
results of 85 distinct studies conducted between 1998 and 2014.11 The table reports the average
treatment effect for each study, and includes information about the political context (e.g. general
election, primary election, etc), date, location, and content of the mailing (e.g. mail that supported a
candidate or a cause, mail that employed strategies to exert social pressure).
These studies can be used to explore how treatment effects vary with differences in subject
pools, election contexts, messages scripts, and other details of the experiment. Table 4 shows the
results of several meta-analyses performed using the Table 3 data and presents the results for the
11 These 85 table entries are produced from an analysis of 220 distinct treatment and control comparisons. See Green and Gerber 2015, table B1 for details of how study results were condensed for this table.
25
overall effect of mailings and for some subsets of studies formed by partitioning the studies by the
message scripts that appeared on the mailing. Pooling all mail studies together shows that sending a
piece of mail to a voter increases the subject’s turnout rate by about ¾ of a percentage point. Further,
there is some evidence that the content of the mailings influences the size of the treatment effect.
Messages that exert social pressure are substantially more effective than the typical non-partisan
GOTV message, for example, and pooling across the social pressure studies shown in Table 3
produces a treatment effect estimate of a 2.3 percentage point increase in voting rates. Two things
should be kept in mind when interpreting the results from these meta-analyses. First, there is
substantial heterogeneity in both the estimated treatment effects and the experimental conditions
within the groupings used to form the sets of studies included in each of the rows of Table 4. Second,
because there are relatively few studies that conduct a “horserace” between messages in which scripts
vary but the other experimental conditions are held constant, it is possible that some of the observed
differences in message effectiveness are due to variation in conditions other than the message, a
possibility highlighted by the variability of the treatment effects across studies that use similar
messaging approaches.
4. The Effect of Messaging
We next review studies that assess the effectiveness of alternative messages. The New
Haven study varied message as well as mode of contact. The study tested the effect of including
three different messages based on the calculus of voting and folk theories about campaign
messaging: pictures and text that urged voting on the grounds that it is a civic duty, that one’s
vote might be pivotal in deciding a close race, and that one’s neighborhood benefits from higher
turnout and the attention that attracts among elected officials. There were some differences in the
estimated effects, but these fell short of statistical significance, and it appeared that messaging
effects were, if present, relatively modest. A large number of subsequent field experiments
investigated message effects and some approaches, especially those that employ a treatment that
is designed to induce social pressure to participate, have shown large and reproducible increases
in turnout.
26
Here we focus on studies in which the messaging is closely related to or explicitly
inspired by leading social psychological theories and for which there is a sufficiently large
literature to get a sense for the robustness of the findings.12 It is useful to compare the
mechanisms that might be at work in these psychological approaches to the more standard
elements emphasized in the classic accounts of rational participation.
When voting is analyzed from the standpoint of rational decision theory, an individual votes
if pB > C, where p is the probability the vote changes the outcome (one vote makes or breaks a
tie), B is the private benefit to the individual from the preferred candidate winning, and C is the
cost of voting. This is the decision theoretic account, since in this account the “pivot
probability” is a belief and there is no effort to justify it as the endogenous outcome of game
among voters. Because the empirical probability of being pivotal in a large election is miniscule,
elections that attract tens of millions of voters represent an anomaly. As long as there is even a
modest amount of noise regarding turnout, for any symmetric rule mapping voter costs and
benefits into voting, as a theoretical matter the chances that the election in a large electorate will
be an exact tie (or within one vote) is essentially zero, which leads to a zero expected return for
participation. To account for substantial turnout rates, the basic theory was expanded to include
an explicit term for the benefits from voting: pB + D > C, where D stands for a sense of civic
duty (Riker and Ordeshook 1968). Some of the messaging strategies can be relatively easily
incorporated into the standard decision theoretic framework for rational participation or modest
extensions of it. Messages employed might affect citizens’ beliefs about the components of the
formula or the weight should be placed on them.
An alternative source of theoretical inspiration is social psychology, which emphasizes the
ways in which behavior may be induced by raising the salience of certain ideas and norms. For
example, it has been argued that behaviors such as obtaining an immunization become more
likely when people think about how where and when they would be immunized (Milkman et al.
2011). As described below, similar approaches have been used to mobilize voters. One might
express this hypothesis using the language of pB + D > C by arguing that rehearsing the steps by
which one will cast a ballot reduces the cognitive costs encompassed by C. Similarly, it may be
12 Rogers, Fox, and Gerber (2013) provide an argument for why voter mobilization field experiments are an excellent environment to test social psychology theories and provide a description of some early findings.
27
argued that one of the benefits of voting (D) is that it raises one’s esteem in the eyes of others,
who look down on those who do not perform this civic obligation. We next consider
experimental tests of these propositions.
A. Self-Prophecy and Implementation Intentions
Both the theory of “self-prophecy” (Greenwald et al. 1987) and the theory of
“implementation intentions” (Gollwitzer 1999) hypothesize that the trajectory of an individual’s
behavior can be altered by inducing the individual to state that he or she will take a certain
action. We will discuss each of these theories and their application to voter turnout.
The notion of self-prophecy is inspired by the idea that some kinds of prediction errors
may be self-correcting (Sherman 1980). There are many things that a person feels he or she
ought to do but, for some reason, the individual’s actions do not match his or her putative goals.
Contributing something to charity, getting more exercise in the coming year, and voting in the
next election would be examples of such aspirations. When asked to predict whether they expect
undertake the desirable action, people frequently say they will. According to Sherman (1980)
and subsequent authors, inducing individuals to predict their behavior produces “self-erasing
error” or an example of “self-prophecy,” as the prediction itself induces a sense of obligation to
follow through, which then leads to a higher level of adherence to the predicted course of action.
Applying this argument to voter mobilization suggests that merely by asking individuals if they
expected to vote, a question that is overwhelmingly answered in the affirmative, one can raise
turnout.13
The “self-prophecy effect” was first applied to voting behavior by Greenwald and
colleagues. Prior to the 1984 presidential election, several dozen college students were phoned
and asked some questions about the upcoming election. They found that the incremental effect
adding an item that asked subjects to predict their participation was a stunning 23 percentage
point increase in the voting rate (Greenwald et al 1987).14 Subsequent studies were much less
13 It is possible that such a question could also serve as a reminder to vote, but, as noted in our earlier discussion of reminder phone calls and email, there is ample evidence that reminding people that an election is coming has negligible effects turnout. Simple reminders are often used as the placebo condition in messaging studies involving direct mail. 14 There are some studies of self-prophecy in other domains. For example, Morwitz, Johnson, and Schmittlein (1993) detect an effect of asking people about their plans to buy a car on subsequent car purchases.

28
supportive. When the same setup was repeated by the original authors in a 1986 senate election
and a 1987 state primary, they found no effect. Studies of self-prophecy by other scholars have
found treatment effects similar to those produced by a typical commercial turnout phone call (on
the order of a 1% turnout increase). In a replication study approximately 10 times the size of the
original Greenwald study, Smith, Gerber and Orlich (2003) organized a phone bank to call
registered voters in advance of the 2000 presidential primary. They compared the turnout of
subjects asked if they knew where and when to vote with those asked these questions and
whether they expected to vote on Tuesday; the incremental effect of the self-prophecy treatment
was -0.1 percentage points. Dustin Cho (2008) replicated this experiment at a larger scale during
the 2008 presidential primary and found a 2.2 percentage point turnout increase from the self-
prophecy treatment. A large study by Nickerson and Rogers (2010), also conducted during the
2008 presidential primary, found a 2 percentage point effect. Although the effect of self-
prophecy each of these three follow up studies was not significant, pooling these findings
together suggests that self-prophecy might produce a small boost in turnout, although nothing
close to the finding reported in the sentinel study.
In addition to the studies that directly test self-prophecy, several studies provide indirect
evidence about self-prophecy’s effectiveness. In some studies the question about vote prediction
is just one component of the treatment. Christopher Mann (2005) studied the effect of being
administered a multi-question pre-election that included questions about turnout intention. He
found that those registered voters assigned to be asked about their vote intentions and other
political attitudes by major news media pollsters voted at the same rate as the randomly selected
control group who were not called for the survey. A recent study by Green, Zelizer, and Kirby
(2015) found that canvassing door to door with a script that merely asked residents how they
intend to vote produced no increase in turnout. Commercial phone banks often conclude their
GOTV appeals with the query “can I count on you to vote?” As noted above, the overall turnout
effect of these calls is small, typically finding less than a 1 percentage point increase in turnout.
A theory closely related to self-prophecy is the “implementation intentions” hypothesis,
which posits that there is a weak but consequential cognitive barrier between an individual’s
goals and taking the actions needed to accomplish those goals. According to this theory, getting a
person to state the goal and then elaborate the steps necessary to achieve the goal makes
accomplishing the goal more likely. The exercise of elaboration makes the steps required more
29
salient and illuminates the path for successful goal-oriented action. A messaging strategy based
on this theory has been applied to voter turnout by supplementing the self-prophecy item (do you
expect to vote?) with follow up questions about what subjects need to do to achieve their (now
stated) intention to vote.
An early effort to test implementation intentions in a field setting was Nickerson and
Rogers (2010). Their study asked subjects if they intended to vote and then, for a subset of those
subjects, proceeded to a series of questions about actions related to casting a ballot. Those who
stated they planned to vote were asked: Around what time do you expect you will head to the
polls on Tuesday? Where do you expect to be coming from when you head to the polls on
Tuesday? What do you think you will be doing before you head out to the polls?15 Nickerson
and Rogers report that the implementation intentions script (which combines a standard GOTV
message, an inquiry about intention to vote, and the implementation intentions questions)
boosted turnout by 4.1 percentage points, and that the incremental effect of the three questions
implementation battery was 2.1 percentage points.16
Several other studies have investigated the effect of elaborating a voting plan. These
include Dustin Cho (2008) and Gerber, Hill, and Huber (2015), who found an implementation
intentions phone call script to have negligible effects, and Rogers and Ternovski (2015), who
tested a version of implementation intentions using a mailing and found a statistically significant
0.5 percentage-point effect from a single mailer.17 Overall, it appears that scripts that evoke
self-prophecy and implementation intentions may nudge turnout upwards, but the effects tend to
be much smaller than suggested by the sentinel studies.
Social Pressure, Pride, and Shame
15 Slightly over 85% of subjects said that they planned to vote in the upcoming election. 16 Further exploration of treatment effect by Nickerson and Rogers revealed that, unexpectedly, the effect of implementation was concentrated among those who resided in households with one eligible voter, for whom the overall effect of the implementation script was 9.1 percentage points and the incremental effect of the implementation questions in particular was 8 percentage points. The authors speculated that this finding was consistent with the idea that implementation planning was unnecessary for those living in multiple voter households because, due to the relative centrality of politics in these households and other aspects of the multi-resident social context, these individuals were more likely to already have a voting plan. 17 The Rogers and Ternovski mailing also included a “gratitude treatment,” a message strategy described below.
30
If we restrict ourselves to a theoretical model that focuses exclusively on the pivot
probability, the benefits from being decisive, and the costs of participation, it is impossible to
produce a robust explanation for the observed high levels of turnout in mass elections.
One response to this gap between prediction and model is to extend the set of
considerations used by the voter to evaluate whether to vote. An example of this approach is
Coate and Conlin (2004), in which two groups of strategic voters incorporate a group identity
and then adhere (for unmodeled psychological or social reasons) to a behavioral rule that
maximizes group welfare. The particular voting rule (the cut point for the cost of voting that
separates voters from nonvoters) that is considered normatively desirable for each group emerges
as an equilibrium outcome. How these implied norms of proper voter behavior for members of
each group -- rules that make sense for the group but are not rational for the individual -- are
enforced is either a psychological or social matter.
A complementary but alternative strategy has been to examine the norms that support
voting directly and study how these norms are enforced. Survey evidence indicates that voting
behavior appears to be embedded in a set of social norms that support voting. Simple reflection
suggests that there is some social dimension to voting, but how important is this consideration? It
may be that people merely pay lip service to ideas of voting and civic duty, but perhaps the
norms regarding voting are more deeply rooted. If individuals are susceptible to feelings of pride
and shame regarding their voting behavior, interventions that heighten these feelings may affect
turnout. Conversely, if heightening social pressure leads to a large change in turnout, this lends
plausibility to social pressure as a mechanism that is working to produce the observed levels of
mass participation.
Experiments have explored the effectiveness of “social pressure,” that is, strategies
crafted to tap into the basic human drive to win praise or avoid scolding. Social pressure is
exerted by praising those who uphold a social norm or by chastising those who violate them. The
level of social pressure exerted can be varied through variation in the intensity of the message or
through disclosure of the individual’s level of compliance with the norm. In the voter
mobilization literature, social pressure messages typically involve three components: exhorting
the receiver to comply with the social norm, stating that the receiver’s behavior will be
monitored, and warning that the receiver’s compliance may be disclosed to others.
31
In a large experiment conducted in a primary election in Michigan in 2006, researchers
employed a set of four mailers that conveyed varying doses of social pressure. The first mailer
employed a hectoring tone to encourage citizens to do their civic duty and vote. The second
mailer added to this message an element of surveillance by telling people that they were part of
an academic study and that their turnout in the upcoming election would be monitored. The third
mailing, labeled the “Self” mailer, included information from the voter files listing the voting
behavior of household members in recent elections and contained a promise to send an updated
mailing after the election reporting whether the listed individuals voted or not. Finally, the
“Neighbors” mailing increased the social pressure by including the turnout history of the
household as well as that of the neighbors on the recipient’s block. Thus, the four mailings
represented a (steep) gradation in social pressure.
The results show a very strong effect of social pressure on voter turnout. Bear in mind
that a typical non-partisan GOTV mailing raises turnout by less than half a percentage point. The
first mailing, a forceful civic duty appeal, raised turnout by 1.8 percentage points, while the
“self” mailing raised turnout by 4.9 percentage points. The “neighbors” mailing produced a
remarkable 8.1 percentage point boost in turnout. These quantities are all distinguishable from
zero and each other, since the treatment groups each comprised 20,000 households and the
control group comprised 100,000 households.
Follow up studies have confirmed the basic contours of these results.18 The main effort
has been to replicate and extend the “Self” mailing. The social pressure mailings, especially
those that confronted voters with their voting record and those of their neighbors (the highly
effective “Neighbors” mailing), provoked outrage among some recipients (Matland and Murray
2014), prompting a search for messaging strategies that produced the turnout effect without as
much agitation. These efforts led to a few different approaches. First, there was an attempt to
build on the “Self” treatment, a strong message that produced an outsized increase in vote but
only a modest level of resistance. Table 5 shows the results of several studies testing messages
employing the “Self” approach. Pooling the results of these studies, which were conducted
18 Although the Neighbors mailing has been used from time to time in campaigns, to date there is only one academic follow up to the Michigan neighbors mailing. In the very high turnout Wisconsin governor election, a Neighbors mailing produced a one percentage point increase overall and a 3 percentage point increase among those whose base turnout rate was 30 percent, a subgroup with participation levels more similar to the Michigan subjects than the overall Wisconsin subject pool.
32
across a variety of political contexts, shows that the “Self” mailing is a powerful treatment, with
especially strong effects in low to medium salience elections. The results across these studies are
similar to the 16% boost (+4.9 from a base of 29.7 in the control group) observed in the 2006
Michigan primary election study. In addition to the higher base rate of voting in a general
election, the cases in which the mailing had weaker effects may also be related to the mechanism
of the social pressure treatment; the Texas and Wisconsin studies by Matland and Murray used a
version of the mailer that did not scold voters for failing to vote.19
A second strategy is to employ social norms to praise rather than scold. Panagopoulos
(2013) used this approach and encouraged subjects to join an “honor roll” of perfect voters. A
collection of voters identified as African American, Hispanic, and unmarried women were
randomly assigned to receive a mailing that presented the perfect voting history of 10 neighbors.
The text included this language:
There is no action more important to our democracy than going to the polls to vote. That’s why Our Community Votes, a non-profit organization that encourages voting, is recognizing citizens in your neighborhood who have perfect voting records in general elections over the past four years. These neighbors deserve our recognition and congratulations for doing their civic duty and making their voices heard. And with New Jersey’s election for governor taking place on November 3rd, we hope that you will go to the polls and join your neighborhood’s Civic Honor Roll of perfect voters. Voting records show that you voted in the presidential election of 2008 but not in the 2005 election for governor. Voting records are public information, so people know when you voted, but never how you voted. By voting on November 3rd, you will join the following voters as perfect voters. (Panagopoulos 2013, p.275)
This approach, an extensive modification of the Self message, raised turnout
significantly, albeit less than the original Self mailer; turnout rose by 2.3 percentage points
among African American and Hispanic subjects and by 1.3 percentage points among women.
A third variation includes language that hints at the possibility that the subject might be
contacted after the election and asked to explain their participation or failure to participate. An
19 No turnout gains were produced by a partisan version of the Self mailing, in which subjects were presented with their turnout record and told that it was important for Democrats and Independents to vote because of the negative effects of having Republicans in power (Schwenzfeier 2014). This may be related to the mechanism thought to be at work. A partisan message is typical in politics and does not cause the subject to reflect on civic duty and the social implications of participation. Nonpartisan mailers that threaten to shame/praise nonvoters/voters by putting their names in a local newspaper seem to produce large effects, although these experiments are somewhat underpowered (Panagopoulos 2010).
33
example of this approach is Rogers and Ternovski’s (2015) large-scale study of turnout on the
2010 midterm election, which included a box in the corner stating that “You may be called after
the election to discuss your experience at the polls.” They find that the incremental effect of
adding this to the mailing was a statistically significant quarter percentage point increase in
turnout.20
Gratitude
Gratitude is thought by some to have evolutionary roots and to have developed in a
manner to facilitate social exchange and reciprocity (Trivers 1971). Drawing on the extensive
and growing literature on the power of gratitude and the reciprocity caused by expressions of
gratitude (McCullough, Kimeldorf, and Cohen 2008, Bernstein and Simmons 1974, Clark,
Northrop, and Barkshire 1988, Rind and Bordia (1995), Panagopolous (2011) proposed a voter
mobilization message in which the subject is thanked for prior participation. Part of the
motivation for the gratitude mailing was to explore a method of making the Self mailing, which
has the subject’s vote history as a centerpiece, more palatable. Thanking the voter provides an
explanation for why the subject’s vote history has been looked up and presented.
Panagopolous tested the gratitude mailing in three very different elections: a 2009 special
election in Staten Island, New York, the November 2009 Governor’s Election in New Jersey,
and a 2010 Georgia Primary. He found sizeable effects for the gratitude mailings, with a turnout
boost of 2.4 percentage points in Staten Island, a 2.5 percentage point increase in New Jersey,
and a 2.4 percent increase in Georgia. The effects of the gratitude mailing were approximately
two-thirds as large as the Self mailer. An unexpected feature of this trio of studies emerged in the
Georgia study, where Panagopolous included two additional treatment arms: (1) a mailing in
which the vote history was discussed but there was no mention of official records of voter
turnout and (2) a mailing that included just a generic expression of gratitude for the subjects
attention to politics, but did not mention anything about the individual or their voting record. The
key portion of the basic gratitude message was:
20 Another field experiment that reports the results of an intervention that includes a similar message (“researchers will contact you within three weeks of the Election to conduct a survey on your voter participation”) is DellaVigna, List, Malmendier and Rao (2014).
34
THANK YOU FOR VOTING! We realize voting takes time and effort. Official voter records indicate that you voted in the last midterm election in November 2006, and we just wanted to say “thank you.” Our democracy depends on people like you exercising their right to vote. We appreciate the fact that you made it a priority to cast a ballot. We also remind you that the primary elections in Georgia will take place on Tuesday, July 20, 2010. You are eligible to vote.
The version that makes no mention of official records is identical except the sentence about official records is excluded. The text for the generic gratitude treatment is: THANK YOU! Our democracy depends on people like you paying attention to politics and getting involved in the political process. We appreciate the fact that you make this a priority. We also remind you that the primary elections in Georgia will take place on Tuesday, July 20, 2010. You are eligible to vote.
These three arms fielded in Georgia were approximately equally effective, producing
turnout increases of over 2 percentage points. Remarkably, the point estimate for the generic
expression of gratitude was a 3.1 percentage point turnout increase, implying that the gratitude
mailer is not simply a veiled Self mailer but rather taps into a distinct set of psychological
mechanisms. More research is needed to verify this potentially important discovery and to
assess whether GOTV messages delivered in person or by phone are enhanced by expressions of
gratitude.
Descriptive Norms
In contrast to prescriptive norms, which assert that people ought to vote, descriptive
norms center on what others do, with the implication you should do likewise. For example, the
35
statement “Everyone else is voting, and you should, too” suggests that you should conform to
others’ example, either because others know best or because there are personal advantages to
going along with the crowd. Conversely, a statement of the form “Turnout is low, so we hope
that you will vote” sends a mixed message; voting is encouraged, but the descriptive norm seems
to militate in favor of not voting.
In comparison to the literature on prescriptive norms, the literature on descriptive norms
rests on fewer studies, and the experiments tend to be smaller in size. An early study by Gerber
and Rogers (2009) showed that voting intentions are affected by information about whether
turnout is likely to be high or low. Subsequent studies have gauged the effects of such
information on subjects’ actual turnout. Panagopoulos, Larimer, and Condon (2014) presented
voters in a 2011 municipal election with either a standard mailer or a Self mailer. Each type of
mailer was distributed with different variants. In the high turnout condition, the mailer included
the wording ‘‘THE MAJORITY OF YOUR NEIGHBORS DO
THEIR CIVIC DUTY. DO YOURS TOO.’’ Following this statement, individuals
were told ‘‘TURNOUT IN YOUR COMMUNITY: 70%” in reference to turnout in the 2008
general election. In the low turnout condition, the wording was reversed: ‘‘THE MAJORITY
OF YOUR NEIGHBORS DO NOT DO THEIR CIVIC DUTY. BUT YOU SHOULD DO
YOURS.’’ Following this statement, individuals were told ‘‘TURNOUT IN YOUR
COMMUNITY: 35%” in reference to turnout in the 2006 election. In the Self condition,
wording with either the high or low norm boosted turnout slightly but not significantly; estimated
effects were essentially zero in the standard condition. Another study by Murray and Matland
(2014) presented parallel experiments conducted in Lubbock, Texas and Kenosha, Wisconsin.
Standard or Self mailers sent to subjects in the low descriptive norm condition included the
following passage:
In the Lubbock city elections earlier this year, voter turnout was around 10%, among the
lowest levels recorded in the past twenty years. While there are many opportunities to
participate, millions of people in Texas never take advantage of these opportunities.
Many experts are discouraged by how few voters they expect for the upcoming election.
We encourage you to buck this trend among your fellow Lubbock citizens and vote on
Tuesday, November 2nd.
36
By contrast, the high descriptive norm language expressed optimism:
In the General Election in Lubbock in 2008, voter turnout was over 70% of registered
voters and among the highest levels recorded in the past twenty years. Throughout the
country there has been a surge in voter participation. Many experts are encouraged by
this trend and are expecting another large turnout in the upcoming election. We
encourage you to join your fellow Lubbock citizens and vote on Tuesday, November 2nd.
Again, the results were ambiguous. In Lubbock, the mailers were equally effective regardless of
whether they conveyed high or low norms or none at all. In Kenosha, the high norm language
boosted turnout significantly, whereas the low norm language had no effect. Although larger
replication studies are needed in order to estimate these effects with more precision, it appears
that descriptive norms exert weaker effects than prescriptive norms.
Discussion
Our summary of the literature has highlighted a number of empirical regularities. One is
that encouragements to vote tend to be more effective when delivered in person than via direct
mail or email. Another is that advocacy messages that give voters reasons to support or oppose a
given candidate or cause tend not to increase turnout. Yet another is that messages that
forcefully assert the social norm of civic participation are often highly effective at stimulating
turnout, especially in low salience elections.
A. Voter Mobilization Outside the U.S.
Although these conclusions emerge from a robust experimental literature, the studies
described above were all conducted in the context of American elections, which leaves open the
question of whether the results hold outside the United States. The last decade has seen a steady
increase in the number of GOTV experiments conducted in other countries. One of the earliest
large-scale experiments assessed the effects of nonpartisan phone calls and canvassing in the
37
United Kingdom (John and Brannan 2008), and several follow-up studies have extended this
experimental work to nationally representative samples (Fieldhouse et al. 2013) and to partisan
campaigns (John and Foos 2015). Within the domain of nonpartisan campaigns, these studies
confirm the effectiveness of personal GOTV tactics and, if anything, suggest that volunteer
phone banks work especially well in the UK, where landlines are less overburdened by
telemarketing calls. On the other hand, impersonal tactics such as direct mail have been found to
be effective, too, both in the UK (Fieldhouse et al. 2013) and Ireland (Regan 2013), again
perhaps due to the lower volume of commercial junk mail in those countries. Interestingly,
partisan canvassing and phone calls have produced mixed results, with studies in the UK, France,
and Spain finding no increase in turnout (John and Foos 2015; Pons 2014, Ramiro, Morales, and
Buedo 2013) or heterogeneous effects that are positive only among supporters (Foos and de
Rooij 2013).
Although studies conducted outside the United States have the potential to shed light on
the interaction between interventions and electoral context, the lack of individual-level
administrative data on voter turnout often presents an impediment to field experimental research.
One response has been to conduct an experiment in a single precinct, stationing poll workers to
observe who votes in that location, as Guan and Green (2006) did when studying door-to-door
canvassing among students in a Chinese university. Occasionally, research collaboration with
government agencies gives scholars access to extraordinarily rich data on both turnout outcomes
and the social attributes of the study participants. For example, in their study of voter
mobilization in Denmark, Bhatti and Hansen (2015) had access to detailed family data linking
parents and offspring, enabling the research team to assess whether the text messages they sent to
young voters affected turnout among family members and housemates. Another approach is to
randomize at the polling station or city level, a research strategy that has been used in Brazil
(Figueiredo, Hidalgo, and Kasahara 2011), Italy (Kendall, Nannicini, and Trebbi 2015), and
Mexico (Chong et al. 2015). Although this type of experimental design tends to be less powerful
than one based on individual assignment, it allows the researcher to estimate treatment effects on
both turnout and vote share. Some of the most interesting studies are those that show how
persuasive campaign messages affect vote share even when they do not affect turnout (Pons and
38
Liegey 2013), a finding reminiscent of analogous experiments in high-salience U.S. elections
(Rogers and Middleton forthcoming).
B. Downstream effects
One of the most interesting findings to emerge from GOTV research in the U.S. and U.K. is that
voter mobilization campaigns have enduring effects. The New Haven residents who were
randomly assigned to receive direct mail or face-to-face canvassing in 1998 were more likely to
vote in both the election held in November 1998 and the mayoral election held in November 1999.
This type of persistent effect has since been replicated repeatedly (Coppock and Green 2015). For
example, voters assigned to receive mailings in the Michigan social pressure experiment not only
voted at higher rates in the 2006 August primary; they were also significantly more likely to vote
in August primaries in 2008, 2010, and 2012. The Self mailing generated approximately 1,850
votes in August 2006, plus an additional 900 votes over the next three August primaries. This
pattern of over time persistence holds for other large social pressure studies (Davenport et al. 2010;
Rogers and Ternovski 2015), for nonpartisan efforts to mobilize ethnic minority voters in
California (Bedolla and Michelson 2012), and for GOTV efforts in Britain (Cutts, Fieldhouse, and
John 2009).
The enduring impact of voter mobilization is subject to multiple interpretations. One
interpretation is that voting is a habit-forming activity. Someone who votes in this election is more
likely to vote in the next election. Someone who skips an election is less likely to vote in the future.
America’s low turnout rates may reflect the fact that we have the most frequent elections on earth.
One might liken sleepy municipal elections to gateway drugs; by enticing so many people to
abstain from voting, they weaken voting habits. Another interpretation is that voting in the initial
election attracts the attention of political campaigns, which direct extra attention to recent voters,
thereby promoting their continuing participation. The one study to track campaign activity – using
contact records from the campaigns themselves – found that those assigned to the treatment group
prior to a spring election were more likely to receive mail but no more likely to receive phone calls
or personal visits prior to the fall general election (Rogers and Ternovski 2015). Still another
interpretation is that mobilization effects endure because subjects continue to remember the
39
communication that mobilized them initially, a hypothesis that has some plausibility when the
initial mobilization takes the form of strongly worded social pressure mailers.
C. Future directions
Much of the existing experimental work on stimulating voter turnout is inspired by theoretical
accounts of why people vote, or general theories of how individuals might be persuaded to take
an action. These frameworks make directional predictions about the effects of interventions, but
there is rarely any effort to estimate parameters of the subjects’ utility function. An important
avenue for future research is to use field experiments to estimate parameters in explicit structural
models. An example of this work is Della Vigna, List, Malendier, and Rao (2014), which
incorporates a “social-image” motivation for voting into the subject’s utility function and designs
a set of experiments that identifies the monetary value of voting in order to avoid having to say
you failed to vote (lying is costly). Based on their experimental results and some assumptions
(including an evidence-based assumed cost to subjects of lying), Della Vigna and co-authors
estimate that the monetary cost of admitting failure to vote is between $5 and $15 for the 2010
congressional election, a plausible estimate given the observed level of turnout and the modest
time and effort cost of voting.
A noteworthy feature of Della Vigna et al is that, as a side benefit to their search for
interventions designed to estimate model parameters, the authors conduct novel experiments that
are interesting in their own right. Misreporting of voting is a common source of measurement
error in surveys. Della Vigna et al examine the effect of providing the subject an incentive to tell
the interviewer she did not vote; a random subset of survey respondents are told after 2 minutes
of a 10 minute survey that if they answer that they did not vote in the recent congressional
election the survey will end rather than continue for 8 more minutes. Della Vigna et al find that
providing the incentive to say you did not vote has a small, statistically insignificant effect on
reported voting by respondents who had voted, but non-voters are substantially more likely to
admit (that is, report truthfully) having not voted. Thus, very little misreporting of turnout is
induced by the incentive, while the net degree of misreporting is substantially reduced in the
incentive condition.
40
Another path for further research is to explicitly consider the implications of the
accumulating corpus of academic work on voter mobilization for the “applied work” done by
campaigns and elections. Most directly, there is the question of how campaign activity might be
optimized given the experimental evidence on the relative effectiveness of alternative
communications strategies or the differences in treatment response across individuals. Imai and
Strauss (2011), continuing a line of work pioneered by Kramer (1966), consider the question of
crafting the optimal GOTV campaign. They use data from existing experiments to estimate
treatment effect heterogeneity and then compare the relative effectiveness of strategies that begin
by targeting the individuals who are expected to have the largest turnout response versus a
strategy that assumes zero treatment effect heterogeneity. They find that there are often large
expected gains from incorporating treatment effect heterogeneity into the prioritization of
mobilization targets.
A second question (perhaps better labelled a puzzle) regarding the relationship between
the experimental work and real world campaign activity is to understand how accumulating
experimental evidence affects industry practice. What accounts for the continued reliance by
candidates and parties on methods with little evidence to support their use, despite the fact that
elections have important stakes and are often sharply competitive? Some scholars have argued
that the continued ubiquity of techniques experimentally demonstrated to produce small returns
for large expenditures (early TV advertising, for example) stems from the financial windfalls the
spending produces for campaign consultants (Sheingate 2016). This explanation, while
somewhat persuasive, seems at best incomplete, because all marketers, political or otherwise,
would be interested in selling worthless things at a high price, but this is probably not often a
sustainable business model.
References
Abrajano, Marisa, and Costas Panagopoulos. 2011. Does Language Matter? The Impact of Spanish versus English-language GOTV Efforts on Latino Turnout. American Politics Research 39 (July): 643-663.
Adams, William C., and Dennis J. Smith. 1980. “Effects of Telephone Canvassing on Turnout and Preferences: A Field Experiment.” Public Opinion Quarterly 44: 389–395.
41
Angrist, Joshua D., Guido Imbens, and Donald B. Rubin. 1996. “Identification of Causal Effects Using Instrumental Variables.” Journal of the American Statistical Association 91: 444-472.
Ansolabehere, Stephen D., and Alan S. Gerber. 1994. “The Mismeasure of Campaign Spending: Evidence from the 1990 U.S. House Elections.” Journal of Politics 56: 1106-1118.
Ansolabehere, Stephen D., and Shanto Iyengar. 1996. Going Negative: How Political Advertising Divides and Shrinks the American Electorate. New York: The Free Press.
Arceneaux, Kevin. 2005. "Using cluster randomized field experiments to study voting behavior." The Annals of the American Academy of Political and Social Science 601, no. 1: 169-179.
Arceneaux, Kevin, and David Nickerson. 2009. “Who is Mobilized to Vote? A Re-Analysis of Eleven Randomized Field Experiments.” American Journal of Political Science 53: 1-16.
Barabas, Jason, Charles Barrilleaux, and Daniel Scheller. Unpublished manuscript 2010. "Ballot Initiative Knowledge and Voter Turnout: Evidence From Field Experiments and National Surveys." Florida State University.
Barton, Jared, Marco Castillo, and Ragan Petrie. Unpublised manuscript 2012. Going Negative: The Persuasive Effect of Tone and Information on Campaign Fundraising and Voter Turnout. No. 1037. 2012.
Bedolla, Lisa Garcia, and Melissa R. Michelson. Mobilizing inclusion: Transforming the electorate through get-out-the-vote campaigns. Yale University Press, 2012.
Bennion, Elizabeth A. "Caught in the ground wars: Mobilizing voters during a competitive congressional campaign." The Annals of the American Academy of Political and Social Science 601, no. 1 (2005): 123-141.
Bergan, Daniel E. 2009. “Does Grassroots Lobbying Work?: A Field Experiment Measuring the Effects of an e-Mail Lobbying Campaign on Legislative Behavior.” American Politics Research 37: 327-352.
Bernstein, Dorothy M., and Roberta G. Simmons. 1974. "The adolescent kidney donor: The right to give." The American journal of psychiatry.
Bhatti, Yosef, and Kasper M. Hansen. 2015. "The Effect of Residential Concentration on Voter Turnout among Ethnic Minorities." International Migration Review.
Bond, Robert M., Christopher J. Fariss, Jason J. Jones, Adam DI Kramer, Cameron Marlow, Jaime E. Settle, and James H. Fowler. 2012. "A 61-million-person experiment in social influence and political mobilization." Nature 489, no. 7415: 295-298.
Broockman, David E. 2013. “Black Politicians Are More Intrinsically Motivated To Advance Blacks’ Interests: A Field Experiment Manipulating Political Incentives.” American Journal of Political Science, 57 (3): 521-536.
Broockman, David E. 2014. “Mobilizing Candidates: Political Actors Strategically Shape the Candidate Pool with Personal Appeals.” Journal of Experimental Political Science, 1 (2): 104-119.
Broockman, David E. and Daniel M. Butler.2015. “The Causal Effects of Elite Position-Taking on Voter Attitudes: Field Experiments with Elite Communication”. American Journal of Political Science. Early View online published December 15, 2015. Accessed: http://onlinelibrary.wiley.com/doi/10.1111/ajps.12243/epdf
Butler, Daniel M. and David W. Nickerson. 2011. "Can Learning Constituency Opinion Affect How Legislators Vote? Results from a Field Experiment", Quarterly Journal of Political Science 6 (1): 55-83. http://dx.doi.org/10.1561/100.00011019
42
Cardy, Emily Arthur. 2005. "An experimental field study of the GOTV and persuasion effects of partisan direct mail and phone calls." The Annals of the American Academy of Political and Social Science 601, no. 1: 28-40.
Cho, Dustin. Unpublished manuscript 2008. "Acting on the intent to vote: a voter turnout experiment." Available at SSRN 1402025. Yale University
Cho, Wendy K. Tam, James G. Gimpel, and Joshua J. Dyck. 2006. "Residential concentration, political socialization, and voter turnout." Journal of Politics 68, no. 1: 156-167.
Chong, Alberto, L. Ana, Dean Karlan, and Leonard Wantchekon. 2015. "Does corruption information inspire the fight or quash the hope? A field experiment in Mexico on voter turnout, choice, and party identification." The Journal of Politics 77, no. 1: 55-71.
Clark, Hewitt B., James T. Northrop, and Charles T. Barkshire. 1988. "THE EFFECTS OF CONTINGENT THANK-YOU NOTES ON CASE MANAGERS' VISITING RESIDENTIAL CLIENTS." Education and Treatment of Children: 45-51.
Coate, Stephen, and Michael Conlin. 2004. “A Group Rule-Utilitarian Approach to Voter Turnout: Theory and Evidence.” American Economic Review 94 (5): 1476-1504.
Collins, Kevin, Laura Keane, and Josh Kalla. Unpublished manuscript 2014. “Youth Voter Mobilization Through Online Advertising: Evidence From Two GOTV Field Experiments.” Paper presented at the Annual Meeting of the American Political Science Association, Washington, DC.
Cubbison, William. Unpublished manuscript 2015. “The marginal effects of direct mail on vote choice.” Paper presented at the Annual Meeting of the Midwest Political Science Association, Chicago, IL.
Cutts, David, Edward Fieldhouse, and Peter John. 2009. "Is voting habit forming? The longitudinal impact of a GOTV campaign in the UK." Journal of Elections, Public Opinion and Parties 19, no. 3: 251-263.
Davenport, Tiffany C., Alan S. Gerber, and Donald P. Green. 2010. “Field Experiments and the Study of Political Behavior.” In The Oxford Handbook of American Elections and Political Behavior, ed. Jan E. Leighley. New York: Oxford University Press.
De Figueiredo, Miguel FP, F. Daniel Hidalgo, and Yuri Kasahara. Unpublished manuscript 2011. "When do voters punish corrupt politicians? Experimental evidence from Brazil." University of California Berkeley.
Della Vigna, Stephano, List, John A., Malmendier, Ulrike, and Gautam Rao. Unpublished manuscript 2014. “Voting to Tell Others.” NBER Working Paper No. 19832.
Eldersveld, Samuel J. 1956. “Experimental Propaganda Techniques and Voting Behavior.” American Political Science Review 50: 154-165.
Eldersveld, Samuel J., and Dodge, R. W. 1954. “Personal Contact or Mail Propaganda? An Experiment in Voting Turnout and Attitude Change.” In Public Opinion and Propaganda, ed. D. Katz. New York: Holt, Rinehart and Winston.
Erikson, Robert S., and Thomas R. Palfrey. 2000. “Equilibria in Campaign Spending Games: Theory and Data.” American Political Science Review 94: 595-609.
Fieldhouse, Edward, David Cutts, Paul Widdop, and Peter John. 2013. "Do impersonal mobilisation methods work? Evidence from a nationwide Get-Out-the-Vote experiment in England." Electoral Studies 32, no. 1: 113-123.
Foos, Florian, and Eline de Rooij. Unpublished Manuscript 2013. "DOES CANDIDATE PARTY AFFILIATION AFFECT TURNOUT?." University of Zurich.
Gerber, Alan S. 1998. “Estimating the Effect of Campaign Spending on Senate Election
43
Outcomes Using Instrumental Variables.” American Political Science Review 92: 401-411.
Gerber, Alan S. 2004. “Does Campaign Spending Work?: Field Experiments Provide Evidence and Suggest New Theory.” American Behavioral Scientist 47: 541-574.
Gerber, Alan S. 2011. “New Directions in the Study of Voter Mobilization: Combining Psychology and Field Experimentation.”. In Race, Reform, ed. Heather K. Gerken, Guy-Uriel E. Charles, and Michael S. Kang, Cambridge University Press
Gerber, Alan S., and David Doherty. Unpublished manuscript 2009. “Can Campaign Effects Be Accurately Measured Using Surveys?: Evidence From a Field Experiment.” Yale University.
Gerber, Alan S., and Donald P. Green. 2000. “The Effects of Canvassing, Direct Mail, and Telephone Contact on Voter Turnout: A Field Experiment.” American Political Science Review 94: 653-63.
Gerber, Alan S. and Donald P. Green. 2005. “Do Phone Calls Increase Voter Turnout? An Update” (with Green). The Annals of the Academy of Political and Social Science (September).
Gerber, Alan S., Donald P. Green, and Matthew Green. 2003. "Partisan mail and voter turnout: Results from randomized field experiments." Electoral Studies 22, no. 4: 563-579.
Gerber, Alan S., Donald P. Green, and Edward H. Kaplan. 2004. “The Illusion of Learning from Observational Research.” In Problems and Methods in the Study of Politics, eds. Ian Shapiro, Rogers Smith, and Tarek Massoud. New York: Cambridge University Press.
Gerber, Alan S., and Donald P. Green, and Christopher W. Larimer. 2008. “Social Pressure and Voter Turnout: Evidence from a Large-Scale Field Experiment.” American Political Science Review 102: 33-48.
Gerber, Alan S., and Donald P. Green, and Christopher W. Larimer. 2010. An Experiment Testing the Relative Effectiveness of Encouraging Voter Participation by Inducing Feelings of Pride or Shame. Political Behavior 32:409-422.
Gerber, Alan S., Donald P. Green, and David W. Nickerson. 2001. “Testing for Publication Bias in Political Science.” Political Analysis 9: 385-392.
Gerber, Alan S., and Todd Rogers. 2009. "Descriptive social norms and motivation to vote: Everybody's voting and so should you." The Journal of Politics 71, no. 01: 178-191.
Gollwitzer, Peter M. 1999. "Implementation intentions: strong effects of simple plans." American psychologist 54, no. 7: 493.
Gosnell, Harold F. 1927. Getting-out-the-vote: An Experiment in the Stimulation of Voting. Chicago: University of Chicago Press.
Gray, Julia and Philip Potter. Unpublished Manuscript 2007. “Does Singaling Matter in Elections? Evidence from a Field Experiment”. Paper presented at the Annual Meeting of the American Political Science Association.
Green, Donald P., and Alan S. Gerber. 2015 Get Out The Vote: How to Increase Voter Turnout. Washington, D.C.: Brookings Institution Press.
Green, Donald P., Alan S. Gerber, and David W. Nickerson. 2003. "Getting out the vote in local elections: results from six door-to-door canvassing experiments." Journal of Politics 65, no. 4: 1083-1096.
Gerber, Alan S., Seth J. Hill, and Gregory A. Huber. Unpublished manuscript 2015. “Small Cues and Large Effect: The Results from a Collection of Simultaneous Field Experiments.”
44
Paper presented at the Annual Meeting of the Midwest Political Science Association, Chicago, IL.
Green Donald P., and Jonathan S. Krasno. 1988. “Salvation for the Spendthrift Incumbent: Reestimating the Effects of Campaign Spending in House Elections.” American Journal of Political Science 32: 884–907.
Green, Donald P., Adam Zelizer, and David Kirby. Unpublished manuscript 2015. “Testing the Effecst of Mail, Phone, and Canvassing Treatments in Partisan Primary Runoff Elections.” Columbia University.
Greenwald, Anthony G., Catherine G. Carnot, Rebecca Beach, and Barbara Young. 1987. "Increasing voting behavior by asking people if they expect to vote." Journal of Applied Psychology 72, no. 2: 315.
Grose, Christian R. 2014. "Field Experimental Work on Political Institutions." Annual Review of Political Science 17.
Guan, Mei, and Donald P. Green. 2006. “Non-Coercive Mobilization in State-Controlled Elections: An Experimental Study in Beijing.” Comparative Political Studies 39: 1175-1193.
Ha, Shang E., and Dean S. Karlan. 2009. "Get-Out-The-Vote Phone Calls Does Quality Matter?." American Politics Research 37, no. 2: 353-369.
Imai, Kosuke and Aaron Strauss. 2011. “Estimation of Heterogeneous Treatment Effects from Randomized Experiments, with Application to the Optimal Planning of the Get-Out-The-Vote Campaign.” Political Analysis 19:1-19.
Jacobson, Gary C. 1978. “The Effects of Campaign Spending in Congressional Elections.” American Political Science Review 72: 469-491.
Jacobson, Gary C. 1985. “Money and Votes Reconsidered: Congressional Elections, 1972- 1982.” Public Choice 47: 7-62.
Jacobson, Gary C. 1990. “The Effects of Campaign Spending in House Elections: New Evidence for Old Arguments.” American Journal of Political Science 34: 334-362.
Jacobson, Gary C. 1998. The Politics of Congressional Elections. New York: Longman. John, Peter, and Tessa Brannan. 2008. “How Different Are Telephoning and Canvassing?
Results from a ‘Get Out the Vote’ Field Experiment in the British 2005 General Election.” British Journal of Political Science 38: 565-574.
John, Peter, and Florian Foos. 2015. "Parties Are No Civic Charities: Campaigns, Demobilization, and the Changing Composition of the Electorate." Demobilization, and the Changing Composition of the Electorate (May 11, 2015).
Kendall, Chad, Tommaso Nannicini, and Francesco Trebbi. Unpublished manuscript 2013. “How do voters respond to information? Evidence from a randomized campaign.” No. w18986 at National Bureau of Economic Research.
Kramer, Gerald, H. 1966. “A decision theoretic analysis of a problem in political campaigning.” Mathematical Applications in Political Science. Vol 2: 137-160. J.L Bernd, editor. Dallas, Texas: Southern Methodist University Press.
LeVan, Carrie. Unpublished manuscript 2016. “The Neighbor Effect: Spillover Effects of an Experimental Intervention to Increase Turnout Amongst Voters in Low-Income Neighborhoods.” University of California, Los Angeles.
Levitt, Steven D. 1994. “Using Repeat Challengers to Estimate the Effect of Campaign Spending on Election Outcomes in the U.S. House.” Journal of Political Economy 102: 777-798.
Loudon, Irvine. 2000. The Tragedy of Childbed Fever. Oxford: Oxford University Press.
45
Malhotra, Neil, Melissa R. Michelson, and Ali Adam Valenzuela. 2012. "Emails from official sources can increase turnout." Quarterly Journal of Political Science 7, no. 3: 321-332.
Mann, Christopher B. 2005. "Unintentional voter mobilization: Does participation in preelection surveys increase voter turnout?." The ANNALS of the American Academy of Political and Social Science 601, no. 1: 155-168.
Mann, Christopher B. 2010. "Is there backlash to social pressure? A large-scale field experiment on voter mobilization." Political Behavior 32, no. 3: 387-407.
Mann, Christopher B., and Casey A. Klofstad. 2015. "The role of call quality in voter mobilization: Implications for electoral outcomes and experimental design." Political Behavior 37, no. 1: 135-154.
Matland, Richard E., and Gregg R. Murray. 2010. "An experimental test of mobilization effects in a Latino community." Political Research Quarterly: 1065912910388192.
McCullough, Michael E., Marcia B. Kimeldorf, and Adam D. Cohen. 2008. "An adaptation for altruism the social causes, social effects, and social evolution of gratitude." Current directions in psychological science 17, no. 4: 281-285.
McNulty, John E. 2005. "Phone-based GOTV—What’s on the line? Field experiments with varied partisan components, 2002-2003." The Annals of the American Academy of Political and Social Science 601, no. 1: 41-65.
Michelson, Melissa R. 2003. “Getting Out the Latino Vote: How Door-to-door Canvassing Influences Voter Turnout in Rural Central California.” Political Behavior 25: 247-263.
Michelson, Melissa R., Lisa García Bedolla, and Margaret A. McConnell. 2009. “Heeding the Call: The Effect of Targeted Two-Round Phonebanks on Voter Turnout.” Journal of Politics 71: 1549-1563.
Miller, Roy E., David A. Bositis, and Denise L. Baer. 1981. “Stimulating Voter Turnout in a Primary: Field Experiment with a Precinct Committeeman.” International Political Science Review 2: 445-460.
Milkman, Katherine L., John Beshears, James J. Choi, David Laibson, and Brigitte C. Madrian. 2011. "Using implementation intentions prompts to enhance influenza vaccination rates." Proceedings of the National Academy of Sciences 108, no. 26: 10415-10420.
Morwitz, Vicki G., Eric Johnson, and David Schmittlein. 1993. “Does measuring intent change behavior?” Journal of consumer research: 46-61.
Murray, Gregg R., and Richard E. Matland. 2014. "Mobilization Effects Using Mail Social Pressure, Descriptive Norms, and Timing." Political Research Quarterly 67, no. 2: 304-319.
Nickerson, David W. 2007. “Quality is Job One: Volunteer and Professional Phone Calls,” American Journal of Political Science 51(2): 269-282.
Nickerson, David W. 2008. “Is Voting Contagious? Evidence from Two Field Experiments.” American Political Science Review 102: 49-57.
Nickerson, David W., and Todd Rogers. 2010. "Do you have a voting plan? Implementation intentions, voter turnout, and organic plan making." Psychological Science 21, no. 2: 194-199.
Niven, David. 2006. "A field experiment on the effects of negative campaign mail on voter turnout in a municipal election." Political Research Quarterly 59, no. 2: 203-210.
Panagopoulos, Costas. 2008. "Partisan and nonpartisan message content and voter mobilization: Field experimental evidence." Political Research Quarterly.
46
Panagopoulos, Costas. 2010. "Affect, social pressure and prosocial motivation: Field experimental evidence of the mobilizing effects of pride, shame and publicizing voting behavior." Political Behavior 32, no. 3: 369-386.
Panagopoulos, Costas. 2011. “Social Pressure, Surveillance and Community Size: Evidence from Field Experiments on Voter Turnout.” Electoral Studies 30 (2): 353-357.
Panagopoulos, Costas. 2013. “Positive Social Pressure and Prosocial Motivation: Evidence from a Large-Scale Field Experiment on Voter Mobilization.” Political Psychology 34 (2): 265-275.
Panagopoulos, Costas. 2014. “Raising Hope: Hope Inducement and Voter Turnout.” Basic and Applied Social Psychology 36 (6): 494-501.
Panagopoulos, Costas, Christopher W. Larimer, and Meghan Condon. 2014. "Social Pressure, Descriptive Norms, and Voter Mobilization." Political Behavior 36, no. 2: 451-469.
Pons, Vincent. Unpublished manuscript 2014. "Does Door-to-door Canvassing Affect Vote Shares? Evidence from a Countrywide Field Experiment in France". Harvard University.
Pons, Vincent, and Guillaume Liegey. Unpublished manuscript 2013. "Increasing the Electoral Participation of Immigrants. Experimental Evidence from France." Massachusetts Institute of Technology.
Ramirez, Ricardo. 2005. "Giving voice to Latino voters: A field experiment on the effectiveness of a national nonpartisan mobilization effort." The Annals of the American Academy of Political and Social Science 601, no. 1: 66-84.
Riker, William H., and Peter C. Ordeshook. 1968. "A Theory of the Calculus of Voting." American political science review 62, no. 01: 25-42.
Rind, Bruce, and Prashant Bordia. 1995. "Effect of Server's “Thank You” and Personalization on Restaurant Tipping1." Journal of Applied Social Psychology 25, no. 9: 745-751.
Rogers, Todd, C. R. Fow, and Alan S. Gerber. 2013. "Rethinking why people vote." The behavioral foundations of public policy: 91.
Rogers, Todd, and Joel Middleton. 2015. “Are Ballot Initiative Outcomes Influenced by the Campaigns of Independent Groups? A Precinct-Randomized Field Experiment Showing That They Are.” Political Behavior, 37 (3), 567-593.
Rogers, Todd and John Ternovski. Unpublished manuscript 2015. “’We May Ask if Your Voted’: Accountability and a Behavior’s Importance to the Self”
Rosenstone, Steven J., and John Mark Hansen. 1993. Mobilization, Participation, and Democracy in America. New York: MacMillan.
Rubin, Donald B. 1978. “Bayesian Inference for Causal Effects: The Role of Randomization.” The Annals of Statistics 6: 34-58.
Schwenzfeier, Margaret. Unpublished manuscript 2014. “When Social Pressure Fails: Evidence from Two Direct Mail Experiments.” College of William & Mary Undergraduate Honors Theses. Paper 69.
Sheingate, Adam. 2016. The Rise of Political Consulting and the Transformation of American Democracy. Oxford University Press.
Sherman, Steven J. 1980. On the self-erasing nature of errors of prediction. Journal of Personality and Social Psychology, 39 (2): 211.
Smith, Jennifer K., Alan S. Gerber, and Anton Orlich. 2003. “Self-Prophecy Effects and Voter Turnout: An Experimental Replication.” Political Psychology 24, no. 3: 593-604.
Teresi, Holly, and Melissa R. Michelson. 2015. "Wired to mobilize: The effect of social networking messages on voter turnout." The Social Science Journal 52, no. 2: 195-204.
47
Trivers, Robert L. 1971. "The evolution of reciprocal altruism." Quarterly review of biology: 35-57.
Trivedi, Neema. 2005. "The effect of identity-based GOTV direct mail appeals on the turnout of Indian Americans." The Annals of the American Academy of Political and Social Science 601, no. 1: 115-122.
Vavreck, Lynn. 2007. “The Exaggerated Effects of Advertising on Turnout: The Dangers of Self-Reports.” Quarterly Journal of Political Science 2: 287-305.
Villa Jr, Herbert, and Melissa Michelson. 2003. “Mobilizing the latino youth vote.” The Field Experiments website, No 00311.
Wong, Janelle S. 2005. "Mobilizing Asian American voters: A field experiment." The Annals of the American Academy of Political and Social Science 601, no. 1: 102-114.
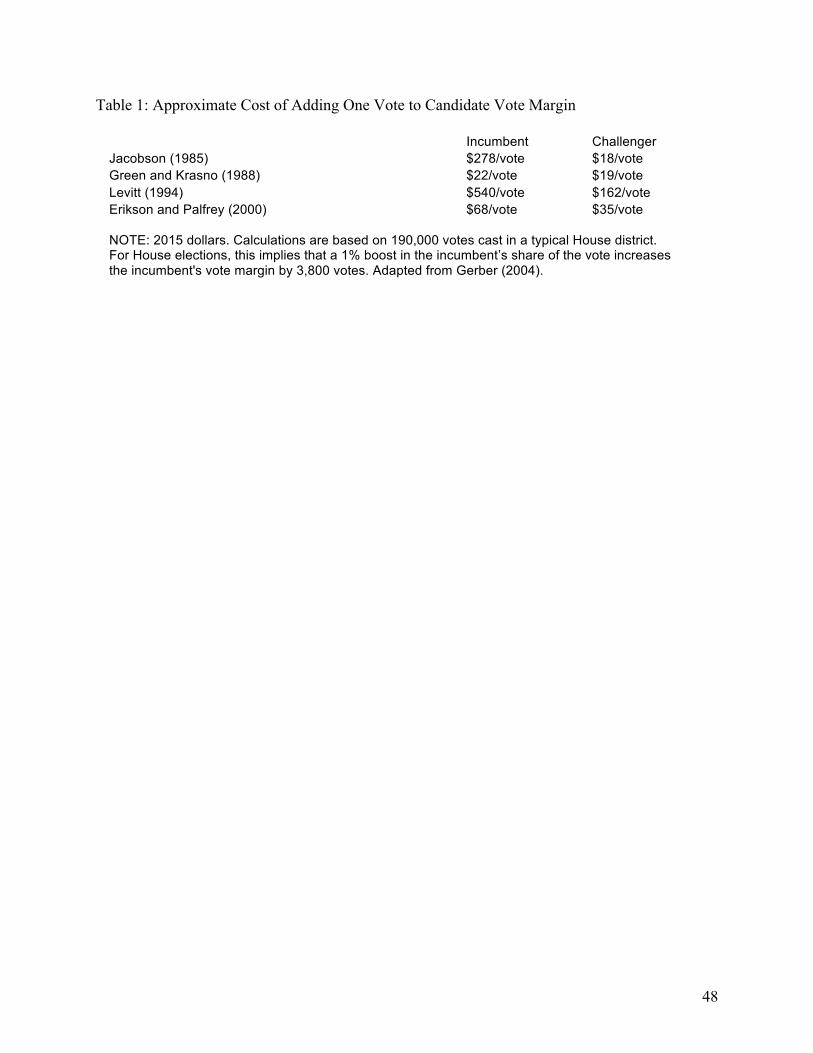
48
Table 1: Approximate Cost of Adding One Vote to Candidate Vote Margin
Incumbent Challenger Jacobson (1985) $278/vote $18/vote Green and Krasno (1988) $22/vote $19/vote Levitt (1994) $540/vote $162/vote Erikson and Palfrey (2000) $68/vote $35/vote NOTE: 2015 dollars. Calculations are based on 190,000 votes cast in a typical House district. For House elections, this implies that a 1% boost in the incumbent’s share of the vote increases the incumbent's vote margin by 3,800 votes. Adapted from Gerber (2004).
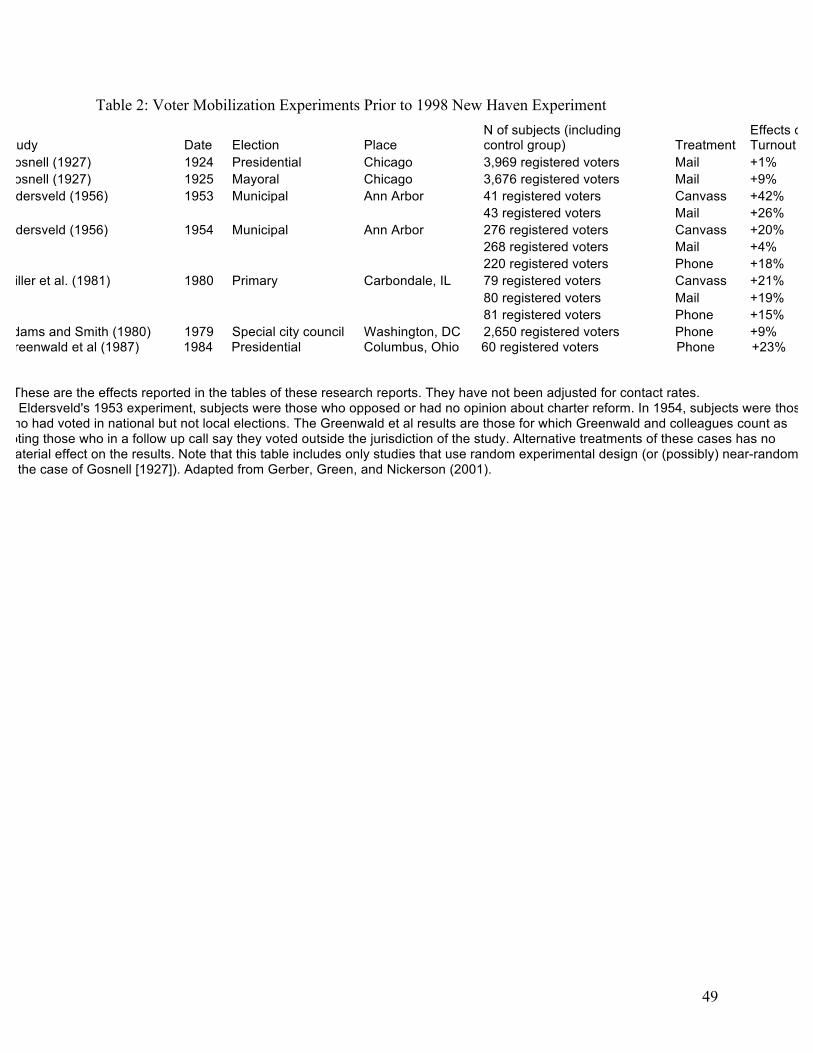
49
Table 2: Voter Mobilization Experiments Prior to 1998 New Haven Experiment
Study Date Election Place N of subjects (including control group) Treatment
Effects on Turnout *
Gosnell (1927) 1924 Presidential Chicago 3,969 registered voters Mail +1% Gosnell (1927) 1925 Mayoral Chicago 3,676 registered voters Mail +9% Eldersveld (1956) 1953 Municipal Ann Arbor 41 registered voters Canvass +42% 43 registered voters Mail +26% Eldersveld (1956) 1954 Municipal Ann Arbor 276 registered voters Canvass +20% 268 registered voters Mail +4% 220 registered voters Phone +18% Miller et al. (1981) 1980 Primary Carbondale, IL 79 registered voters Canvass +21% 80 registered voters Mail +19% 81 registered voters Phone +15% Adams and Smith (1980) 1979 Special city council Washington, DC 2,650 registered voters Phone +9% Greenwald et al (1987) 1984 Presidential Columbus, Ohio 60 registered voters Phone +23% * These are the effects reported in the tables of these research reports. They have not been adjusted for contact rates. In Eldersveld's 1953 experiment, subjects were those who opposed or had no opinion about charter reform. In 1954, subjects were those who had voted in national but not local elections. The Greenwald et al results are those for which Greenwald and colleagues count as voting those who in a follow up call say they voted outside the jurisdiction of the study. Alternative treatments of these cases has no material effect on the results. Note that this table includes only studies that use random experimental design (or (possibly) near-random, in the case of Gosnell [1927]). Adapted from Gerber, Green, and Nickerson (2001).
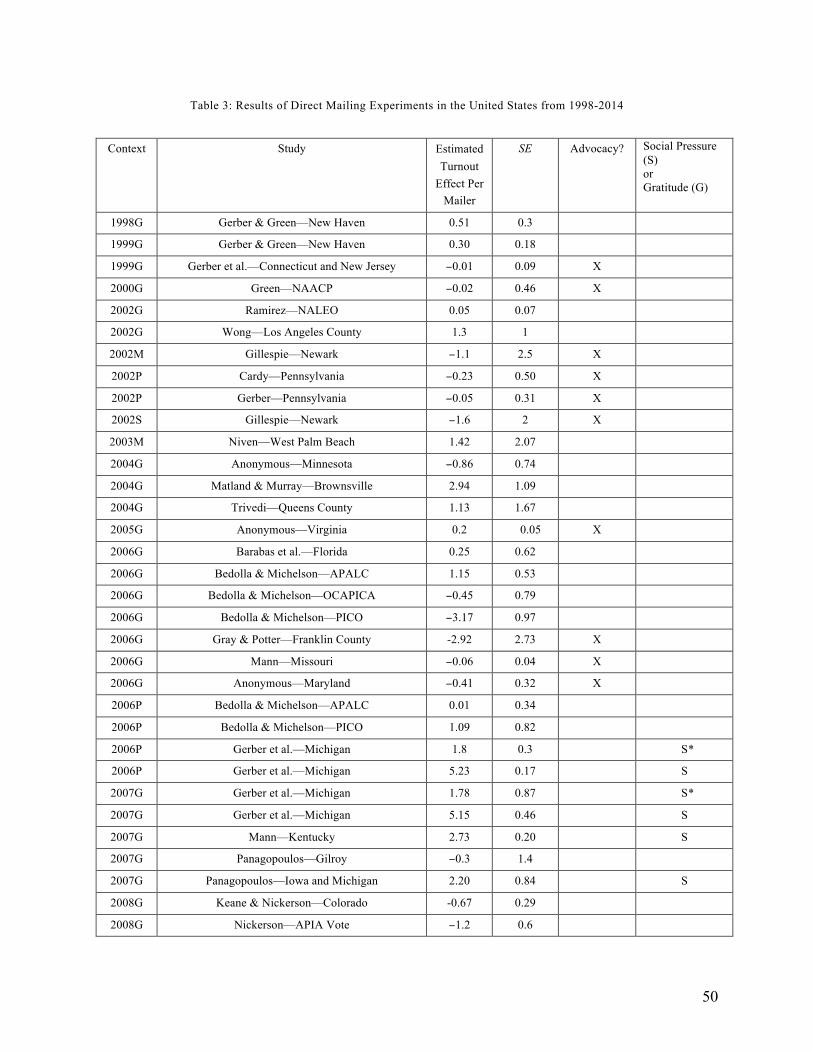
50
Table 3: Results of Direct Mailing Experiments in the United States from 1998-2014
Context Study Estimated Turnout
Effect Per Mailer
SE Advocacy? Social Pressure (S) or Gratitude (G)
1998G Gerber & Green—New Haven 0.51 0.3
1999G Gerber & Green—New Haven 0.30 0.18
1999G Gerber et al.—Connecticut and New Jersey −0.01 0.09 X
2000G Green—NAACP −0.02 0.46 X
2002G Ramirez—NALEO 0.05 0.07
2002G Wong—Los Angeles County 1.3 1
2002M Gillespie—Newark −1.1 2.5 X
2002P Cardy—Pennsylvania −0.23 0.50 X
2002P Gerber—Pennsylvania −0.05 0.31 X
2002S Gillespie—Newark −1.6 2 X
2003M Niven—West Palm Beach 1.42 2.07
2004G Anonymous—Minnesota −0.86 0.74
2004G Matland & Murray—Brownsville 2.94 1.09
2004G Trivedi—Queens County 1.13 1.67
2005G Anonymous—Virginia 0.2 0.05 X
2006G Barabas et al.—Florida 0.25 0.62
2006G Bedolla & Michelson—APALC 1.15 0.53
2006G Bedolla & Michelson—OCAPICA −0.45 0.79
2006G Bedolla & Michelson—PICO −3.17 0.97
2006G Gray & Potter—Franklin County -2.92 2.73 X
2006G Mann—Missouri −0.06 0.04 X
2006G Anonymous—Maryland −0.41 0.32 X
2006P Bedolla & Michelson—APALC 0.01 0.34
2006P Bedolla & Michelson—PICO 1.09 0.82
2006P Gerber et al.—Michigan 1.8 0.3 S*
2006P Gerber et al.—Michigan 5.23 0.17 S
2007G Gerber et al.—Michigan 1.78 0.87 S*
2007G Gerber et al.—Michigan 5.15 0.46 S
2007G Mann—Kentucky 2.73 0.20 S
2007G Panagopoulos—Gilroy −0.3 1.4
2007G Panagopoulos—Iowa and Michigan 2.20 0.84 S
2008G Keane & Nickerson—Colorado -0.67 0.29
2008G Nickerson—APIA Vote −1.2 0.6
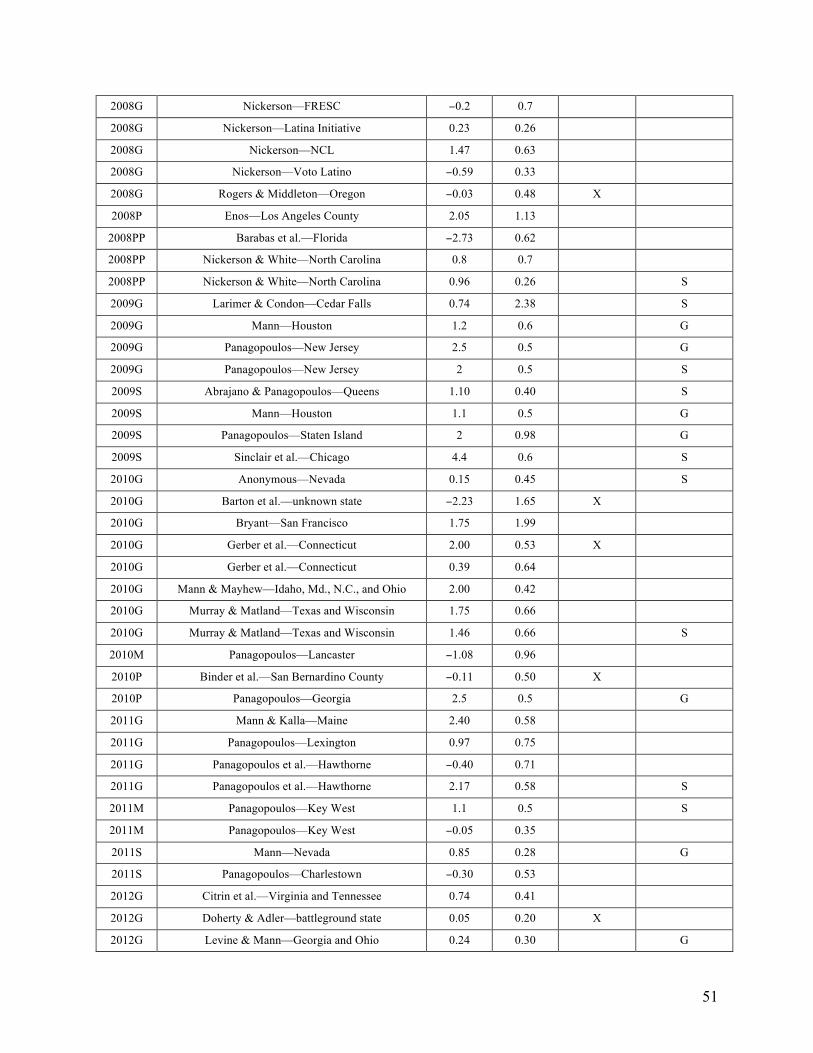
51
2008G Nickerson—FRESC −0.2 0.7
2008G Nickerson—Latina Initiative 0.23 0.26
2008G Nickerson—NCL 1.47 0.63
2008G Nickerson—Voto Latino −0.59 0.33
2008G Rogers & Middleton—Oregon −0.03 0.48 X
2008P Enos—Los Angeles County 2.05 1.13
2008PP Barabas et al.—Florida −2.73 0.62
2008PP Nickerson & White—North Carolina 0.8 0.7
2008PP Nickerson & White—North Carolina 0.96 0.26 S
2009G Larimer & Condon—Cedar Falls 0.74 2.38 S
2009G Mann—Houston 1.2 0.6 G
2009G Panagopoulos—New Jersey 2.5 0.5 G
2009G Panagopoulos—New Jersey 2 0.5 S
2009S Abrajano & Panagopoulos—Queens 1.10 0.40 S
2009S Mann—Houston 1.1 0.5 G
2009S Panagopoulos—Staten Island 2 0.98 G
2009S Sinclair et al.—Chicago 4.4 0.6 S
2010G Anonymous—Nevada 0.15 0.45 S
2010G Barton et al.—unknown state −2.23 1.65 X
2010G Bryant—San Francisco 1.75 1.99
2010G Gerber et al.—Connecticut 2.00 0.53 X
2010G Gerber et al.—Connecticut 0.39 0.64
2010G Mann & Mayhew—Idaho, Md., N.C., and Ohio 2.00 0.42
2010G Murray & Matland—Texas and Wisconsin 1.75 0.66
2010G Murray & Matland—Texas and Wisconsin 1.46 0.66 S
2010M Panagopoulos—Lancaster −1.08 0.96
2010P Binder et al.—San Bernardino County −0.11 0.50 X
2010P Panagopoulos—Georgia 2.5 0.5 G
2011G Mann & Kalla—Maine 2.40 0.58
2011G Panagopoulos—Lexington 0.97 0.75
2011G Panagopoulos et al.—Hawthorne −0.40 0.71
2011G Panagopoulos et al.—Hawthorne 2.17 0.58 S
2011M Panagopoulos—Key West 1.1 0.5 S
2011M Panagopoulos—Key West −0.05 0.35
2011S Mann—Nevada 0.85 0.28 G
2011S Panagopoulos—Charlestown −0.30 0.53
2012G Citrin et al.—Virginia and Tennessee 0.74 0.41
2012G Doherty & Adler—battleground state 0.05 0.20 X
2012G Levine & Mann—Georgia and Ohio 0.24 0.30 G
52
2012M Panagopoulos—Virginia 0.03 0.62
2012P Condon et al.—Iowa 2.85 0.64 S
2012P Condon et al.—Iowa 0.4 0.9 X
2012P Condon et al.—Iowa 2.7 0.9
2012R Gerber et al.—Wisconsin 1.1 0.7
2012R Rogers et al.—Wisconsin 1.05 0.27 S
2013G Biggers—Virginia 0.11 0.18
2013G Matland and Murray—Minn., Ohio, Tex., and Va. 0.41 0.32
2013M Matland & Murray—El Paso 0.12 0.39
2014G Broockman & Green—California 0.35 0.13 X
2014G Cubbison—North Carolina −0.12 0.07 X
2014P Green et al.—Texas 0.12 0.53 X
2014P Hill & Kousser—California 0.49 0.08
Notes: Context refers to the election year and type, where G = general; M = municipal; P = primary; PP = presidential primary; R = runoff; S = special election. SE = standard error. Advocacy refers to appeals that urge support for candidates or causes. Social pressure refers to appeals that emphasize compliance with the social norm of civic participation. Social pressure entries marked with an asterisk forcefully assert the norm of voting but do not tell recipients that whether they vote is a matter of public record. Gratitude mailers thank recipients for voting in a prior election or for their past involvement in elections. When a given study involved multiple pieces of mail or varying quantities of mail, regression was used to estimate the per-mailer turnout effect. The number of significant digits in the table may vary depending on how the studies’ authors reported their results. When a given author or authors report multiple mail tests by the same organization in the same election, we calculated the overall estimated effect and standard error by taking the precision-weighted average, which is equivalent to a fixed effects meta analysis. Abbreviations for organizations: APALC = Asian Pacific American Legal Center; APIA = Asian and Pacific Islander American Vote; FRESC = Front Range Economic Strategy Center; NAACP = National Association for the Advancement of Colored People; NALEO = National Association of Latino Elected Officials; NCL = National Council of La Raza; OCAPICA = Orange County Asian and Pacific Islander Community Alliance; PICO = People Improving Communities through Organizing.
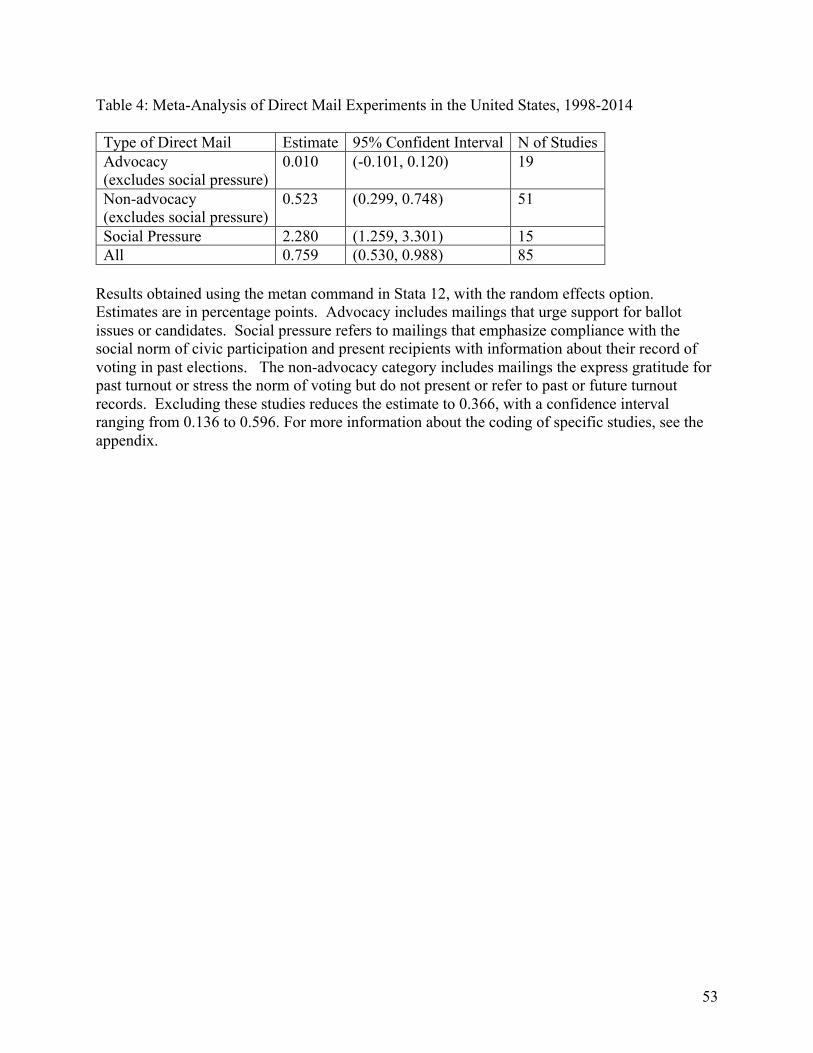
53
Table 4: Meta-Analysis of Direct Mail Experiments in the United States, 1998-2014 Type of Direct Mail Estimate 95% Confident Interval N of Studies Advocacy (excludes social pressure)
0.010 (-0.101, 0.120) 19
Non-advocacy (excludes social pressure)
0.523 (0.299, 0.748) 51
Social Pressure 2.280 (1.259, 3.301) 15 All 0.759 (0.530, 0.988) 85 Results obtained using the metan command in Stata 12, with the random effects option. Estimates are in percentage points. Advocacy includes mailings that urge support for ballot issues or candidates. Social pressure refers to mailings that emphasize compliance with the social norm of civic participation and present recipients with information about their record of voting in past elections. The non-advocacy category includes mailings the express gratitude for past turnout or stress the norm of voting but do not present or refer to past or future turnout records. Excluding these studies reduces the estimate to 0.366, with a confidence interval ranging from 0.136 to 0.596. For more information about the coding of specific studies, see the appendix.
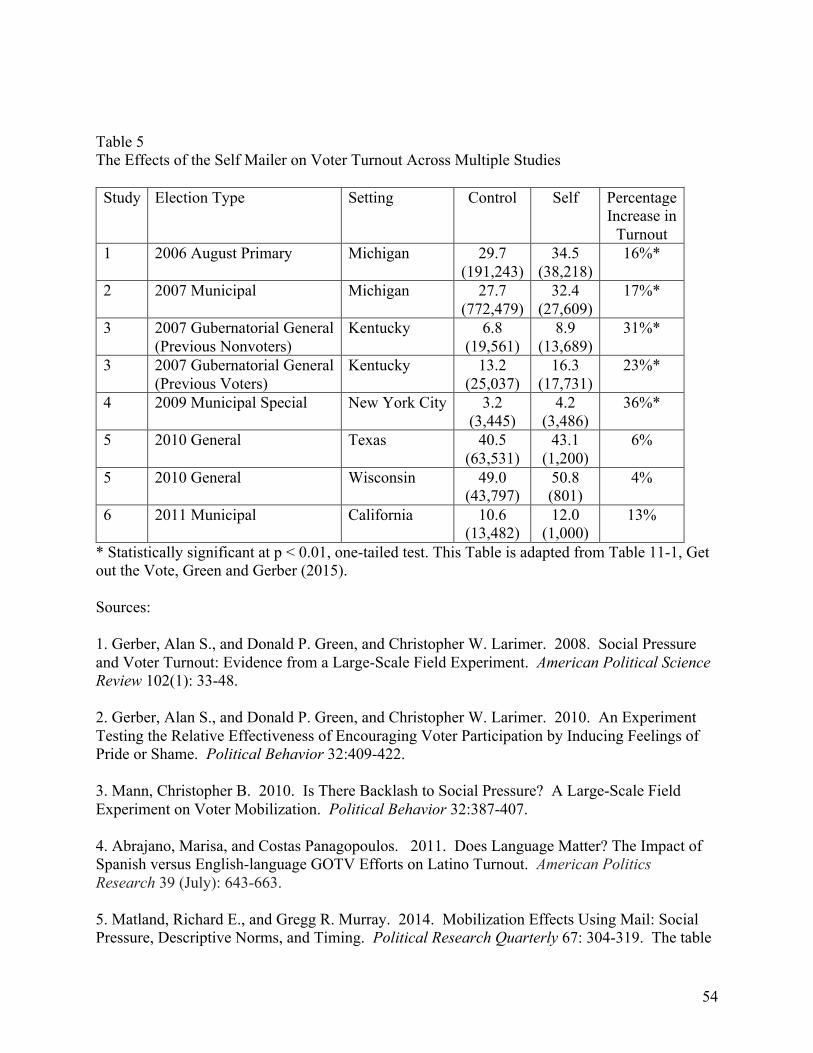
54
Table 5 The Effects of the Self Mailer on Voter Turnout Across Multiple Studies Study Election Type Setting Control Self Percentage
Increase in Turnout
1 2006 August Primary Michigan 29.7 (191,243)
34.5 (38,218)
16%*
2 2007 Municipal Michigan 27.7 (772,479)
32.4 (27,609)
17%*
3 2007 Gubernatorial General (Previous Nonvoters)
Kentucky 6.8 (19,561)
8.9 (13,689)
31%*
3 2007 Gubernatorial General (Previous Voters)
Kentucky 13.2 (25,037)
16.3 (17,731)
23%*
4 2009 Municipal Special New York City 3.2 (3,445)
4.2 (3,486)
36%*
5 2010 General Texas 40.5 (63,531)
43.1 (1,200)
6%
5 2010 General Wisconsin 49.0 (43,797)
50.8 (801)
4%
6 2011 Municipal California 10.6 (13,482)
12.0 (1,000)
13%
* Statistically significant at p < 0.01, one-tailed test. This Table is adapted from Table 11-1, Get out the Vote, Green and Gerber (2015). Sources: 1. Gerber, Alan S., and Donald P. Green, and Christopher W. Larimer. 2008. Social Pressure and Voter Turnout: Evidence from a Large-Scale Field Experiment. American Political Science Review 102(1): 33-48. 2. Gerber, Alan S., and Donald P. Green, and Christopher W. Larimer. 2010. An Experiment Testing the Relative Effectiveness of Encouraging Voter Participation by Inducing Feelings of Pride or Shame. Political Behavior 32:409-422. 3. Mann, Christopher B. 2010. Is There Backlash to Social Pressure? A Large-Scale Field Experiment on Voter Mobilization. Political Behavior 32:387-407. 4. Abrajano, Marisa, and Costas Panagopoulos. 2011. Does Language Matter? The Impact of Spanish versus English-language GOTV Efforts on Latino Turnout. American Politics Research 39 (July): 643-663. 5. Matland, Richard E., and Gregg R. Murray. 2014. Mobilization Effects Using Mail: Social Pressure, Descriptive Norms, and Timing. Political Research Quarterly 67: 304-319. The table
55
reports only the results of the Self mailer with no additional information about the voting rate of the community. 6. Panagopoulos, Costas, Christopher W. Larimer, and Meghan Condon. 2014. Social Pressure, Descriptive Norms, and Voter Mobilization. Political Behavior 36:451–469.